national weather service - vos.noaa.gov · weather charts are sent back as an attachment to the...
TRANSCRIPT
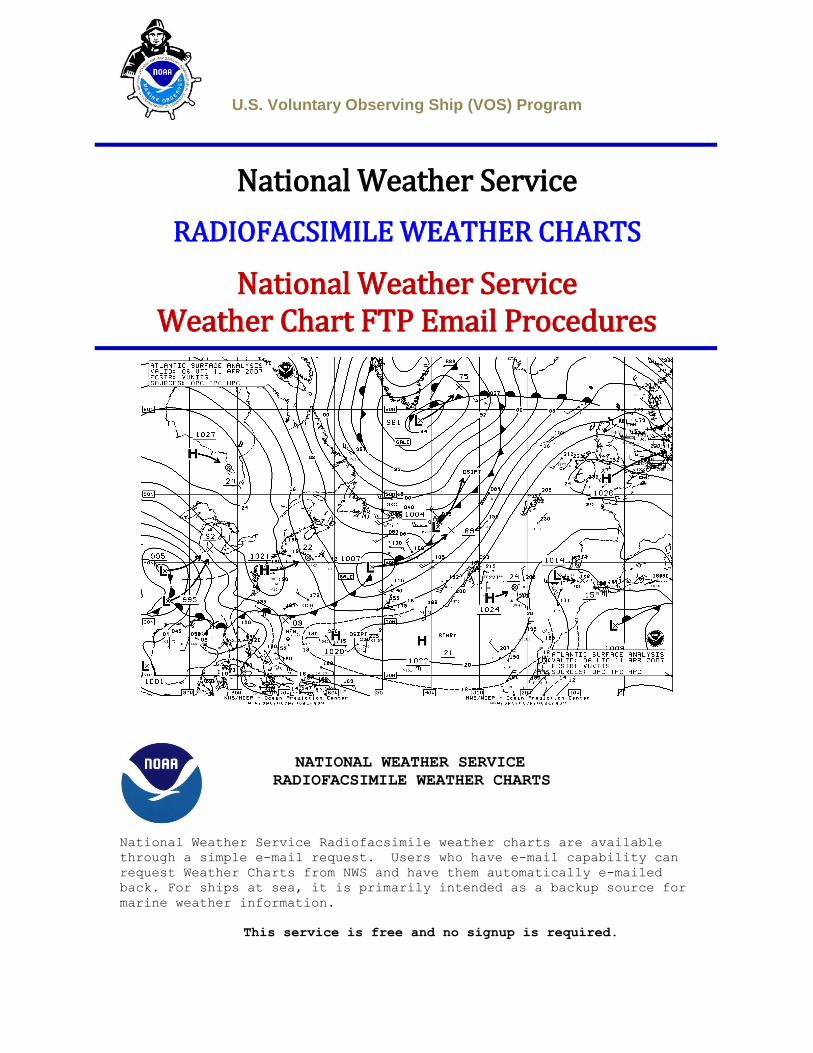
U.S. Voluntary Observing Ship (VOS) Program
National Weather Service
RADIOFACSIMILE WEATHER CHARTS
National Weather Service Weather Chart FTP Email Procedures
NATIONAL WEATHER SERVICE
RADIOFACSIMILE WEATHER CHARTS
National Weather Service Radiofacsimile weather charts are available
through a simple e-mail request. Users who have e-mail capability can
request Weather Charts from NWS and have them automatically e-mailed
back. For ships at sea, it is primarily intended as a backup source for
marine weather information.
This service is free and no signup is required.

Weather charts are sent back as an attachment to the e-mail address of
the requestor. You will receive an e-mail for each individual chart you
request. Responses are sent from the following NWS e-mail server:
Turnaround time is generally under 5 minutes, but performance may vary
depending on your e-mail provider, and receipt cannot be guaranteed.
This is an automated system - Correct capitalization for commands,
directory and file names are critical. The system is case sensitive.
Commands are lower case, while most (not all) Chart Id’s are upper
case.
You can request a single chart, or request multiple charts within a
single e-mail request.
File size for most weather charts average 35KB but can be as much as
110KB. Satellite imagery is much larger, usually between 150KB to over
250KB.
These chart files are in a compressed TIFF format, which can be viewed,
by a number of software programs including Microsoft Internet Explorer.
Suggestions for TIFF viewers may be found in the Worldwide Marine
Radiofacsimile Broadcast Schedule Manual.
Attachments are received in UUencoded form. The majority of modern e-
mail systems handle the conversion automatically, other users will need
to run the UUdecode program for their particular system. See your
system administrator if you have any questions on this topic.
To request charts, send a small script file via e-mail to NWS
requesting the desired file(s).
Send an e-mail to: [email protected]
Put anything you like on the subject line
Enter a script in the body of the message
open
cd fax
get (Map ID)
quit
Example: To obtain the 96HR Wind/Wave Forecast VT00Z 10E-95W (Map ID
PJAM98.TIF), the e-mail script would contain the following:
open
cd fax
get PJAM98.TIF
quit

Several charts can be requested within a single e-mail. Each map
requested will be sent back as an individual e-mail. Example:
open
cd fax
get PYEB86.TIF
get PYEA86.TIF
get PWEK11.TIF
get evst99.jpg
quit
Some e-mail systems used by ships do not allow e-mail to be sent
directly back to the ship (reply to) unless the sender has an account
with the e-mail provider. In addition many ships are set up so they
can only receive or download e-mail from a single controlled point,
usually at the company or agents office. To have the weather charts
sent back to a different e-mail address, in the first line of the
script put reply-to (e-mail address) where you want the charts to be
sent).
Example: To obtain the 96HR Wind/Wave Forecast VT00Z 10E-95W (Map ID
PJAM98.TIF), and have it sent to another e-mail address
([email protected]), the script file would contain the following:
reply-to [email protected]
open
cd fax
get PJAM98.TIF
quit

NATIONAL WEATHER SERVICE
ATLANTIC Product/Chart Chart ID
WIND/SEAS
Sea State Analysis VT12Z 10E-95W PJAA99.TIF
Sea State Analysis 45W-85W PWAA90.TIF
24HR Wind/Wave Forecast 45W-85W PWAE10.TIF
48HR Wind/Wave Forecast 10E-95W PJAI10.TIF
48HR Wave Period Forecast 10E-95W PJAI20.TIF
96HR Wind/Wave Forecast VT00Z 10E-95W PJAM98.TIF
96HR Wave Period Forecast VT00Z 10E-95W PJAM88.TIF
WIND/SEAS (United Kingdom Met Office)
Sea/Swell/Wind Direction Analysis North Atlantic PJGA93.TIF
24HR Sea/Swell/Wind Direction North Atlantic PJGE93.TIF
36HR Sea/Swell/Wind Direction North Atlantic PJLG98.TIF
48HR Sea/Swell/Wind Direction North Atlantic PJGI93.TIF
SURFACE
Preliminary Surface Analysis 45W-85W PYAD10.TIF
Surface Analysis (Part 1) 10E-45W PYAA11.TIF
Surface Analysis (Part 2) 40W-95W PYAA12.TIF
24HR Surface Forecast 45W-85W PPAE10.TIF
48HR Surface Forecast 10E-95W QDTM10.TIF
96HR Surface Forecast VT00Z 10E-95W PWAM99.TIF
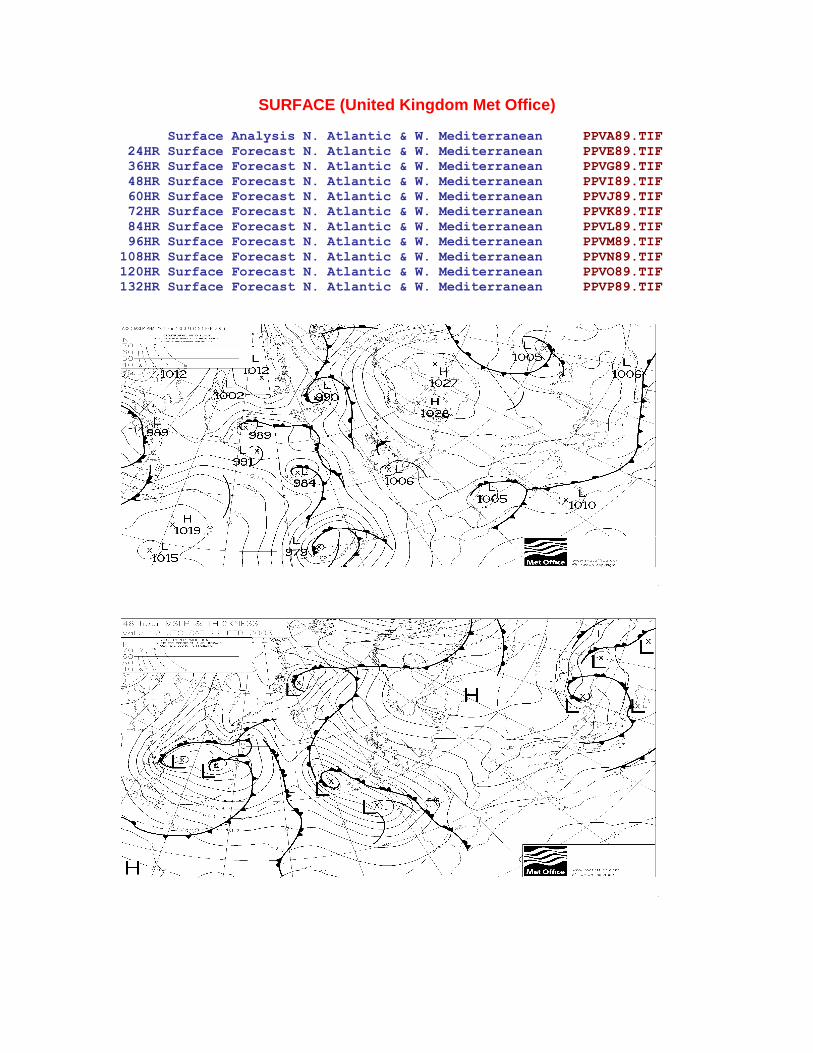
SURFACE (United Kingdom Met Office)
Surface Analysis N. Atlantic & W. Mediterranean PPVA89.TIF
24HR Surface Forecast N. Atlantic & W. Mediterranean PPVE89.TIF
36HR Surface Forecast N. Atlantic & W. Mediterranean PPVG89.TIF
48HR Surface Forecast N. Atlantic & W. Mediterranean PPVI89.TIF
60HR Surface Forecast N. Atlantic & W. Mediterranean PPVJ89.TIF
72HR Surface Forecast N. Atlantic & W. Mediterranean PPVK89.TIF
84HR Surface Forecast N. Atlantic & W. Mediterranean PPVL89.TIF
96HR Surface Forecast N. Atlantic & W. Mediterranean PPVM89.TIF
108HR Surface Forecast N. Atlantic & W. Mediterranean PPVN89.TIF
120HR Surface Forecast N. Atlantic & W. Mediterranean PPVO89.TIF
132HR Surface Forecast N. Atlantic & W. Mediterranean PPVP89.TIF
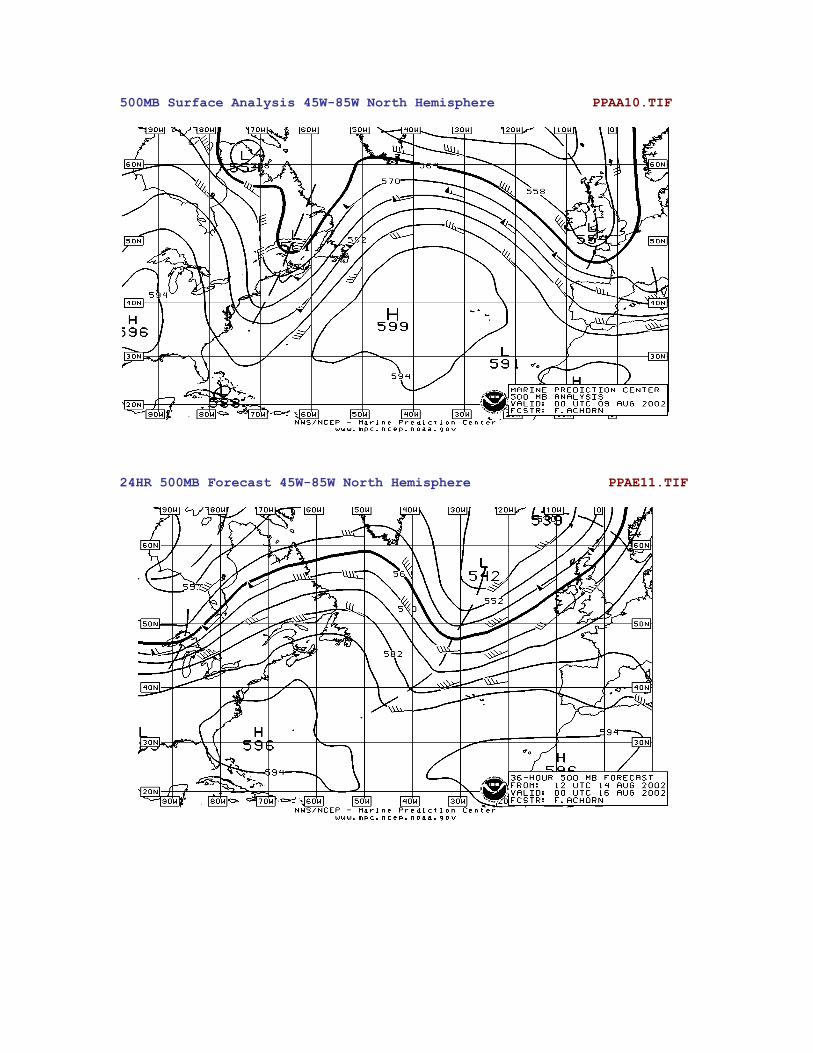
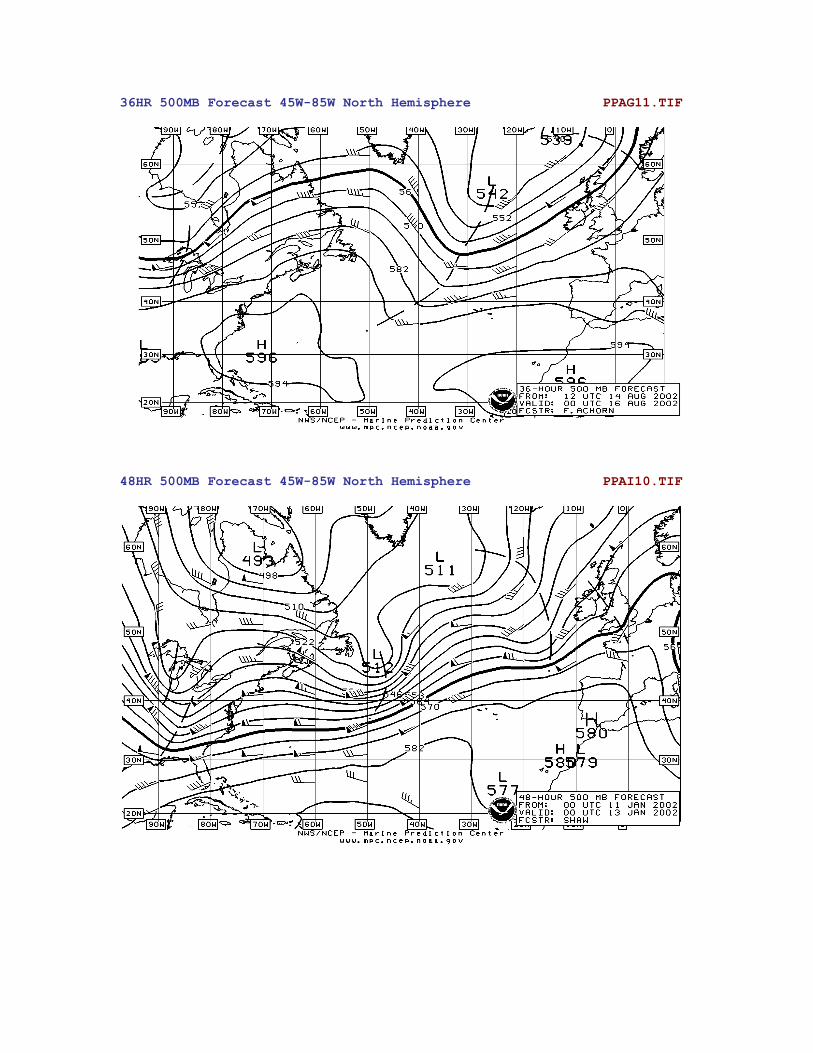
UPPER AIR CHARTS
500MB Surface Analysis 45W-85W PPAA10.TIF
24HR 500MB Forecast 45W-85W PPAE11.TIF
36HR 500MB Forecast 45W-85W PPAG11.TIF
48HR 500MB Forecast 45W-85W PPAI10.TIF
96HR 500MB Forecast VT00Z 45W-85W PPAM50.TIF
SATELLITE IMAGERY
GOES IR Satellite Image North Atlantic evnt99.jpg
ICE CHARTS
Ice Analysis NW Atlantic (When Available) PIEA88.TIF
SEA SURFACE TEMPERATURE
SST Analysis North Atlantic (UK MET) PTUK21.TIF
SCHEDULE INFORMATION
Radiofax Schedule Boston MA (Part 1) PLAZ01.TIF
Radiofax Schedule Boston MA (Part 2) PLAZ02.TIF
Product Notice Bulletin Boston MA PLAZ04.TIF
Radiofax Schedule Boston MA (Text Version) hfmarsh.txt
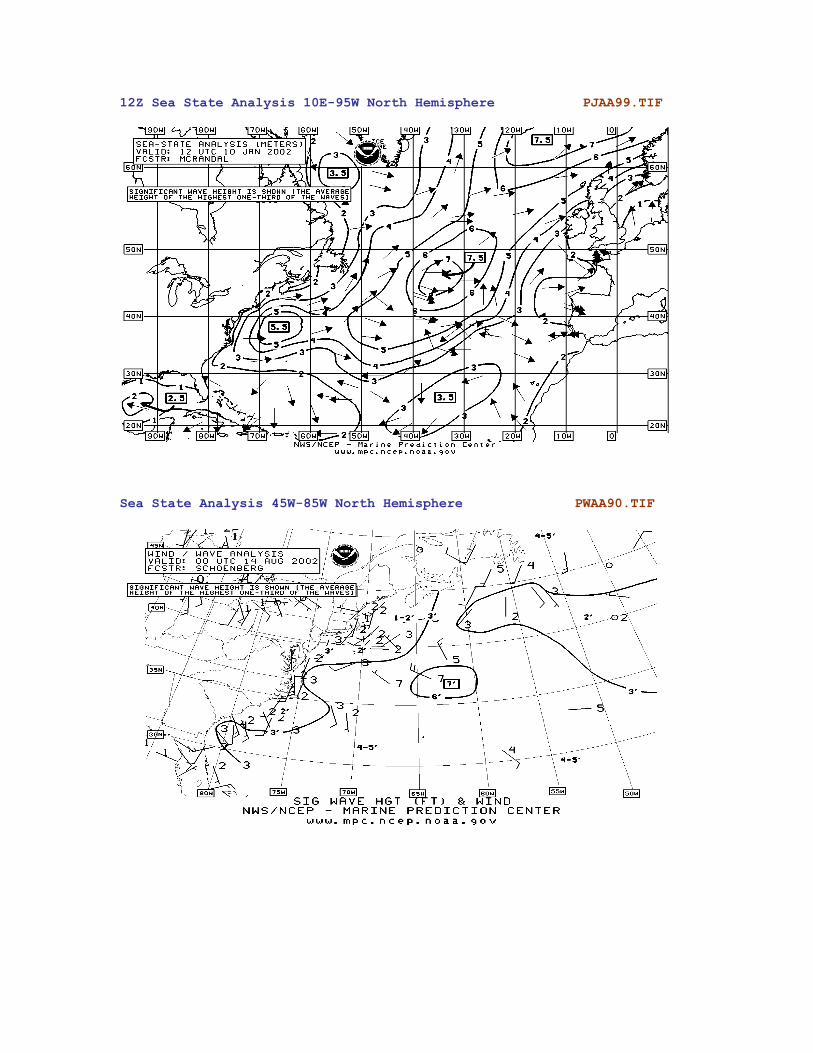
12Z Sea State Analysis 10E-95W North Hemisphere PJAA99.TIF
Sea State Analysis 45W-85W North Hemisphere PWAA90.TIF

24HR Wind/Wave Forecast 45W-85W North Hemisphere PWAE10.TIF
48HR Wind/Wave Forecast 10E-95W North Hemisphere PJAI10.TIF

48HR Wave Period Forecast 10E-95W North Hemisphere PJAI20.TIF
96HR Wind/Wave VT00Z Forecast 10E-95W North Hemisphere PJAM98.TIF

96HR Wave Period VT00Z Forecast 10E-95W North Hemisphere PJAM88.TIF
WIND/SEAS (United Kingdom Met Office)
Sea/Swell/Wind Direction Analysis North Atlantic PJGA93.TIF
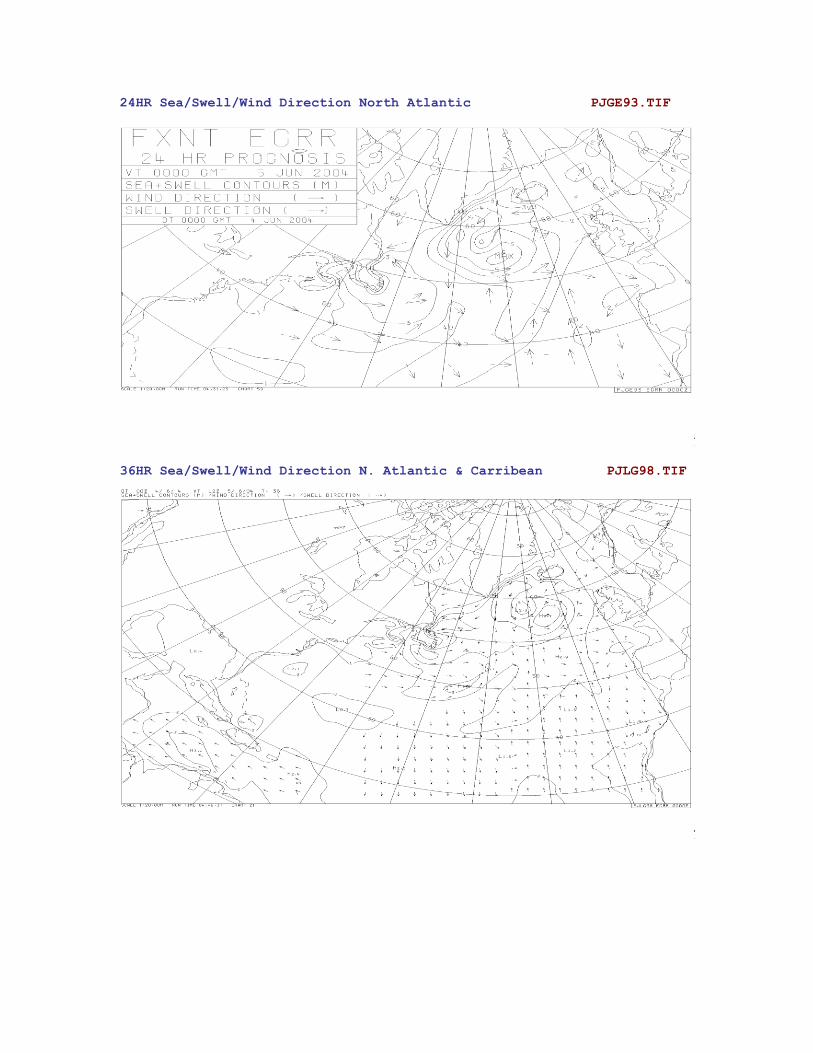
24HR Sea/Swell/Wind Direction North Atlantic PJGE93.TIF
36HR Sea/Swell/Wind Direction N. Atlantic & Carribean PJLG98.TIF

48HR Sea/Swell/Wind Direction North Atlantic PJGI93.TIF
Preliminary Surface Analysis 45W-85W North Hemisphere PYAD10.TIF
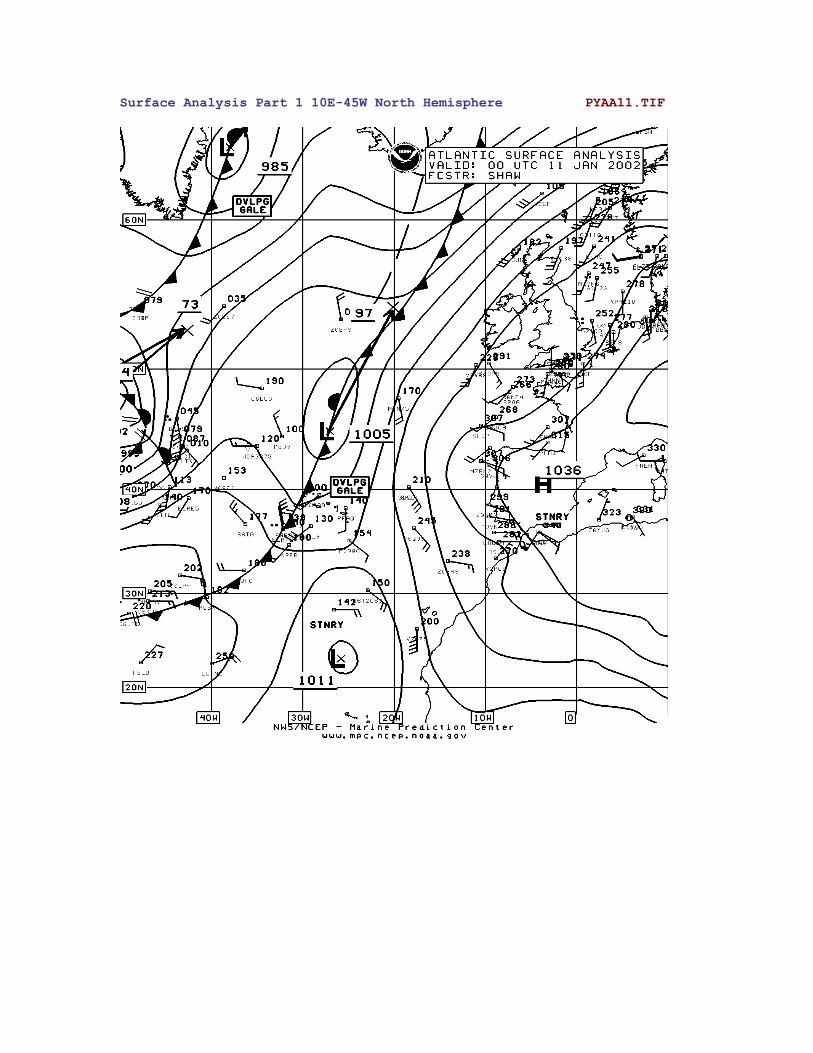
Surface Analysis Part 1 10E-45W North Hemisphere PYAA11.TIF

Surface Analysis Part 2 40W-95W North Hemisphere PYAA12.TIF

24HR Surface Forecast 45W-85W North Hemisphere PPAE10.TIF
48HR Surface Forecast 10E-95W North Hemisphere QDTM10.TIF

96HR Surface VT00Z Forecast 10E-95W North Hemisphere PWAM99.TIF
SURFACE (United Kingdom Met Office)
Surface Analysis N. Atlantic & W. Mediterranean PPVA89.TIF
24HR Surface Forecast N. Atlantic & W. Mediterranean PPVE89.TIF
36HR Surface Forecast N. Atlantic & W. Mediterranean PPVG89.TIF
48HR Surface Forecast N. Atlantic & W. Mediterranean PPVI89.TIF
60HR Surface Forecast N. Atlantic & W. Mediterranean PPVJ89.TIF
72HR Surface Forecast N. Atlantic & W. Mediterranean PPVK89.TIF
84HR Surface Forecast N. Atlantic & W. Mediterranean PPVL89.TIF
96HR Surface Forecast N. Atlantic & W. Mediterranean PPVM89.TIF
108HR Surface Forecast N. Atlantic & W. Mediterranean PPVN89.TIF
120HR Surface Forecast N. Atlantic & W. Mediterranean PPVO89.TIF
132HR Surface Forecast N. Atlantic & W. Mediterranean PPVP89.TIF
500MB Surface Analysis 45W-85W North Hemisphere PPAA10.TIF
24HR 500MB Forecast 45W-85W North Hemisphere PPAE11.TIF
36HR 500MB Forecast 45W-85W North Hemisphere PPAG11.TIF
48HR 500MB Forecast 45W-85W North Hemisphere PPAI10.TIF

96HR 500MB VT00Z Forecast 45W-85W North Hemisphere PPAM50.TIF
GOES Infrared Atlantic evnt99.jpg

Ice Chart (When Available) PIEA88.TIF
SST (UK MET) North Atlantic PTUK21.TIF
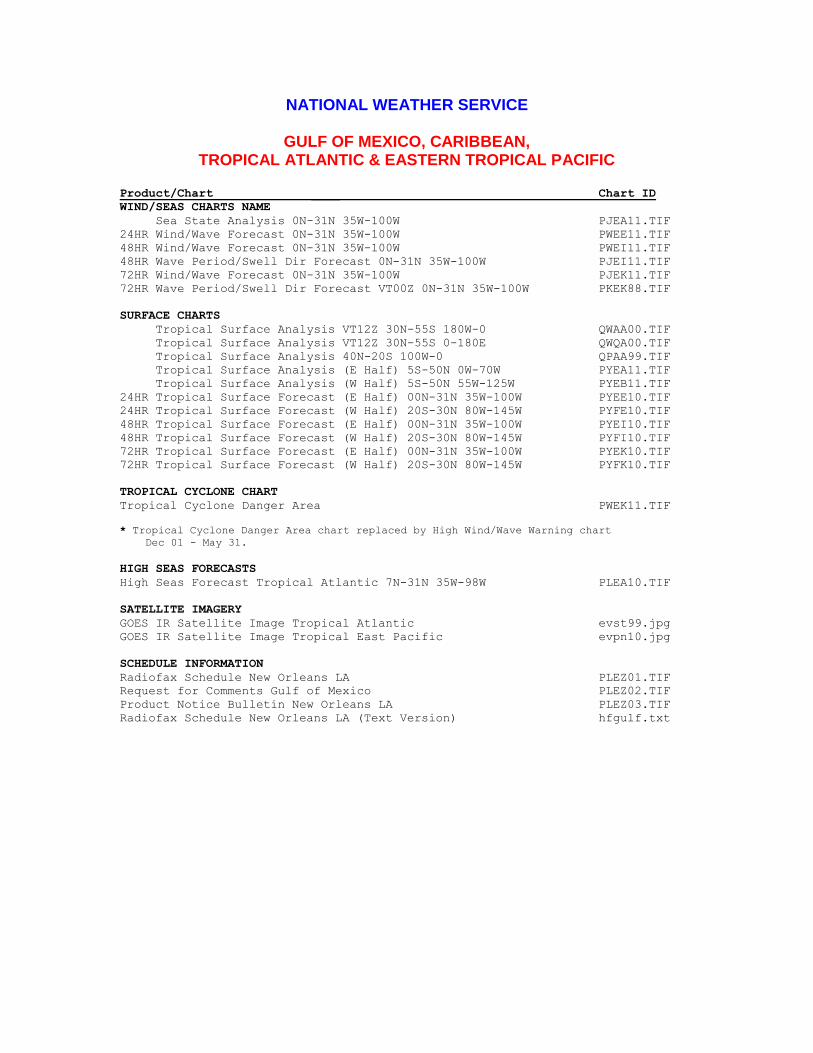
NATIONAL WEATHER SERVICE
GULF OF MEXICO, CARIBBEAN, TROPICAL ATLANTIC & EASTERN TROPICAL PACIFIC
Product/Chart ____ Chart ID
WIND/SEAS CHARTS NAME
Sea State Analysis 0N-31N 35W-100W PJEA11.TIF
24HR Wind/Wave Forecast 0N-31N 35W-100W PWEE11.TIF
48HR Wind/Wave Forecast 0N-31N 35W-100W PWEI11.TIF
48HR Wave Period/Swell Dir Forecast 0N-31N 35W-100W PJEI11.TIF
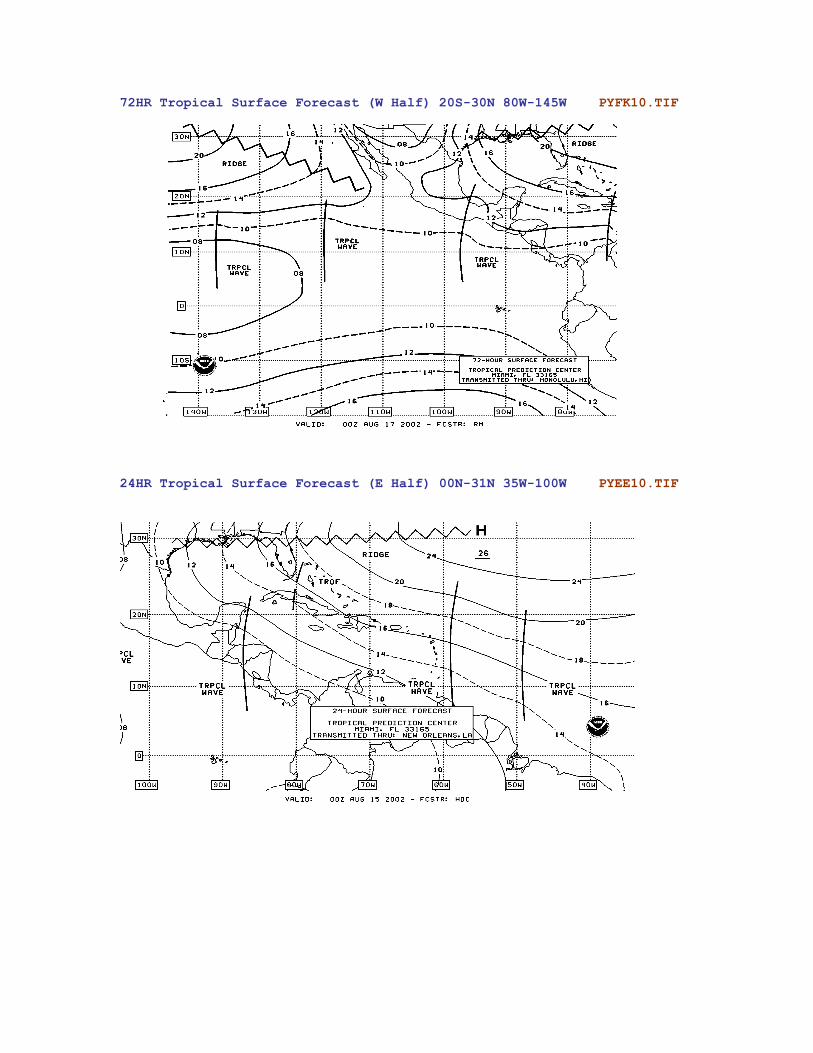
72HR Wind/Wave Forecast 0N-31N 35W-100W PJEK11.TIF
72HR Wave Period/Swell Dir Forecast VT00Z 0N-31N 35W-100W PKEK88.TIF
SURFACE CHARTS
Tropical Surface Analysis VT12Z 30N-55S 180W-0 QWAA00.TIF
Tropical Surface Analysis VT12Z 30N-55S 0-180E QWQA00.TIF
Tropical Surface Analysis 40N-20S 100W-0 QPAA99.TIF
Tropical Surface Analysis (E Half) 5S-50N 0W-70W PYEA11.TIF
Tropical Surface Analysis (W Half) 5S-50N 55W-125W PYEB11.TIF
24HR Tropical Surface Forecast (E Half) 00N-31N 35W-100W PYEE10.TIF
24HR Tropical Surface Forecast (W Half) 20S-30N 80W-145W PYFE10.TIF
48HR Tropical Surface Forecast (E Half) 00N-31N 35W-100W PYEI10.TIF
48HR Tropical Surface Forecast (W Half) 20S-30N 80W-145W PYFI10.TIF
72HR Tropical Surface Forecast (E Half) 00N-31N 35W-100W PYEK10.TIF
72HR Tropical Surface Forecast (W Half) 20S-30N 80W-145W PYFK10.TIF
TROPICAL CYCLONE CHART
Tropical Cyclone Danger Area PWEK11.TIF
* Tropical Cyclone Danger Area chart replaced by High Wind/Wave Warning chart
Dec 01 - May 31.
HIGH SEAS FORECASTS
High Seas Forecast Tropical Atlantic 7N-31N 35W-98W PLEA10.TIF
SATELLITE IMAGERY
GOES IR Satellite Image Tropical Atlantic evst99.jpg
GOES IR Satellite Image Tropical East Pacific evpn10.jpg
SCHEDULE INFORMATION
Radiofax Schedule New Orleans LA PLEZ01.TIF
Request for Comments Gulf of Mexico PLEZ02.TIF
Product Notice Bulletin New Orleans LA PLEZ03.TIF
Radiofax Schedule New Orleans LA (Text Version) hfgulf.txt

Sea State Analysis 0N-31N 35W-100W PJEA11.TIF
24HR Wind/Wave Forecast 0N-31N 35W-100W PWEE11.TIF

48HR Wind/Wave Forecast 0N-31N 35W-100W PWEI11.TIF
48HR Wave Period/Swell Direction Forecast 0N-31N, 35W-100W PJEI11.TIF

72HR Wind/Wave Forecast 0N-31N 35W-100W PJEK11.TIF
72HR Wave Period/Swell Dir Forecast VT00Z 0N-31N 35W-100W PKEK88.TIF
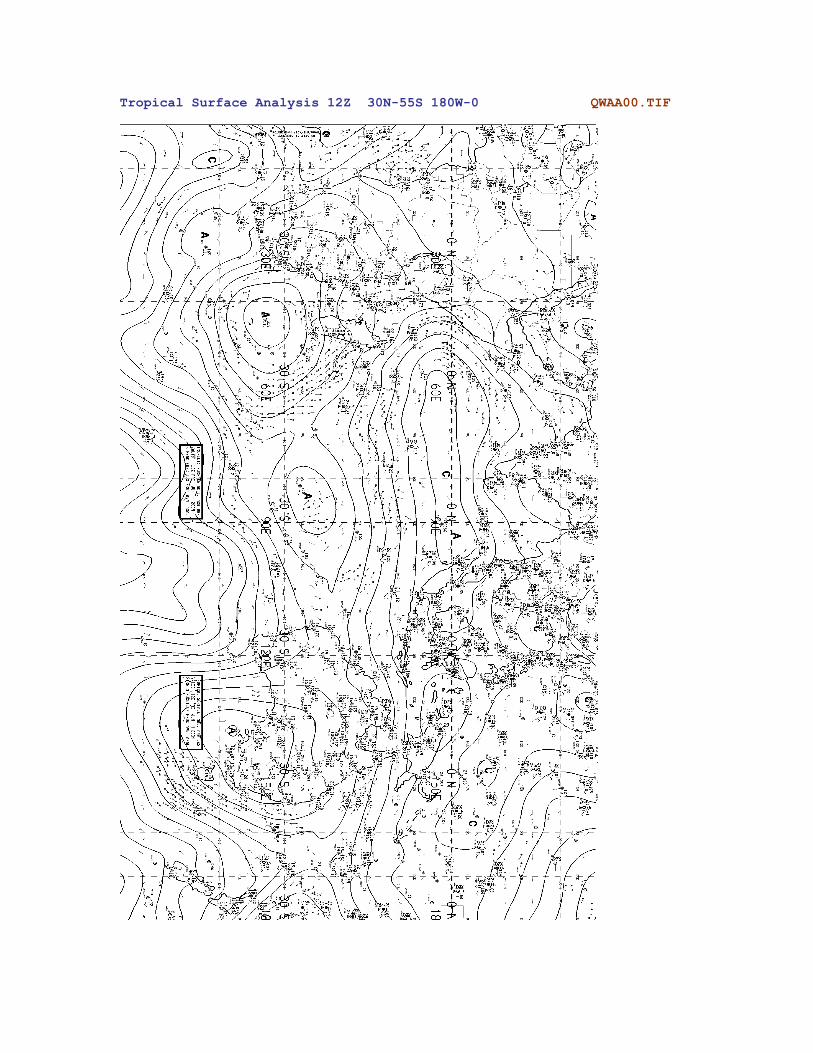
Tropical Surface Analysis 12Z 30N-55S 180W-0 QWAA00.TIF
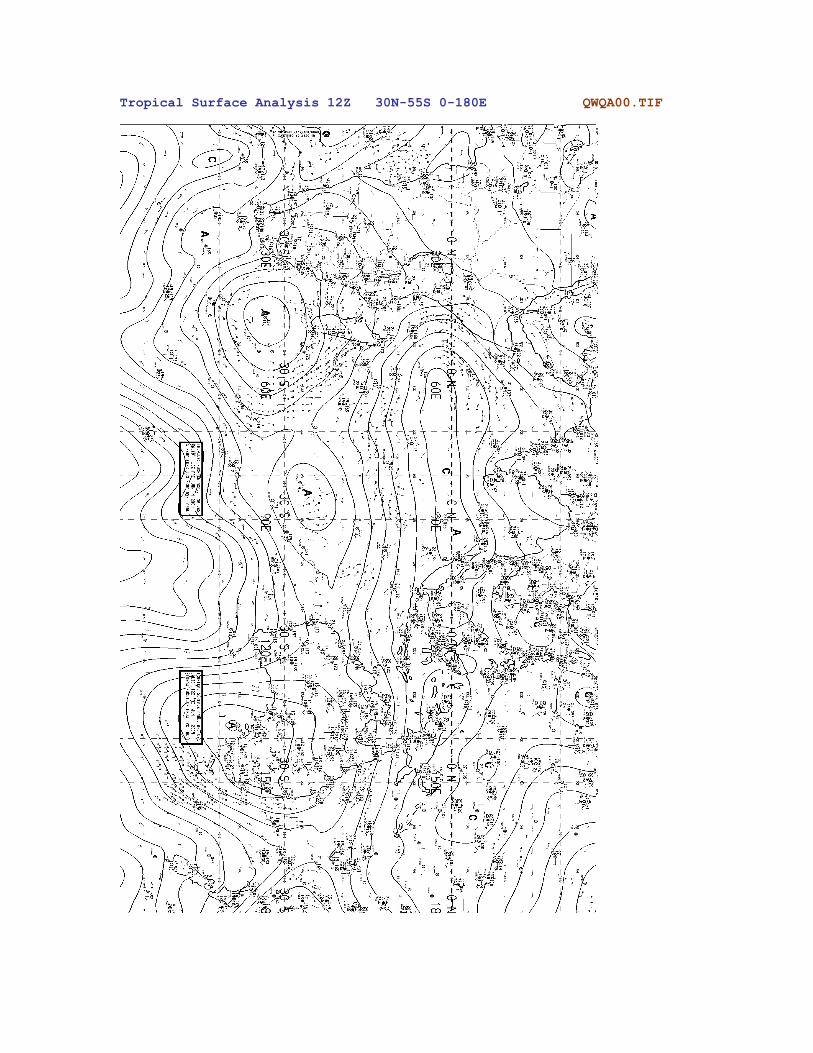
Tropical Surface Analysis 12Z 30N-55S 0-180E QWQA00.TIF
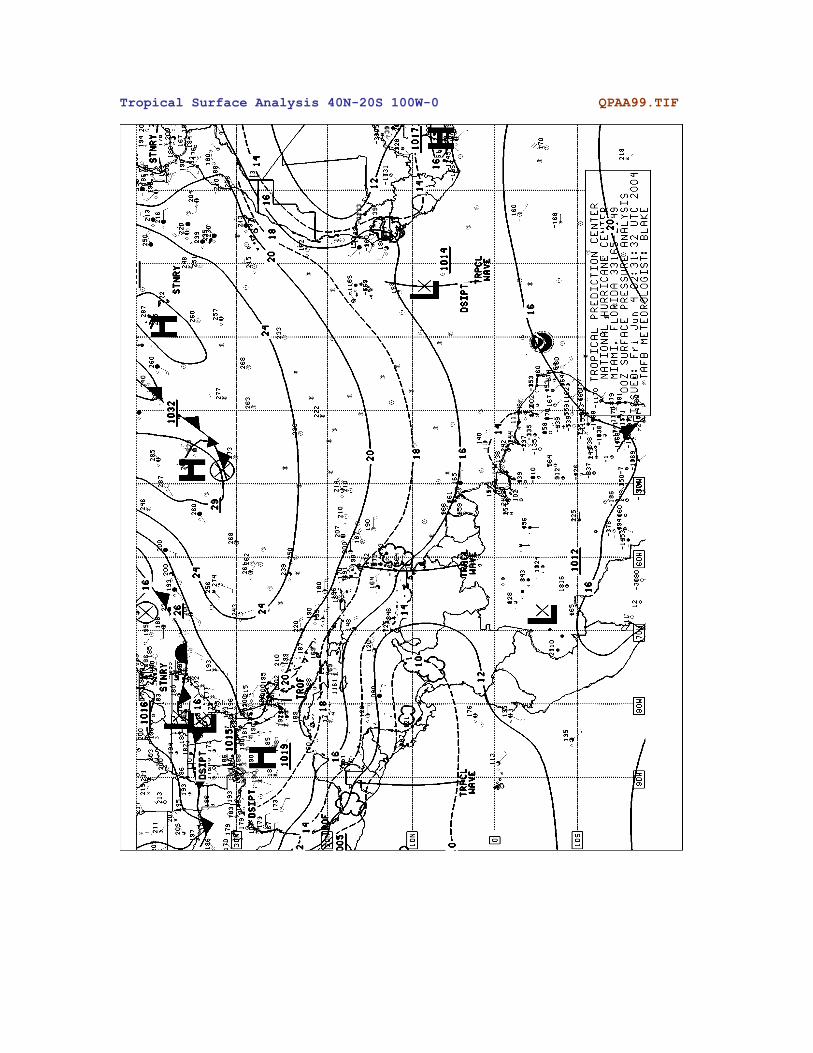
Tropical Surface Analysis 40N-20S 100W-0 QPAA99.TIF
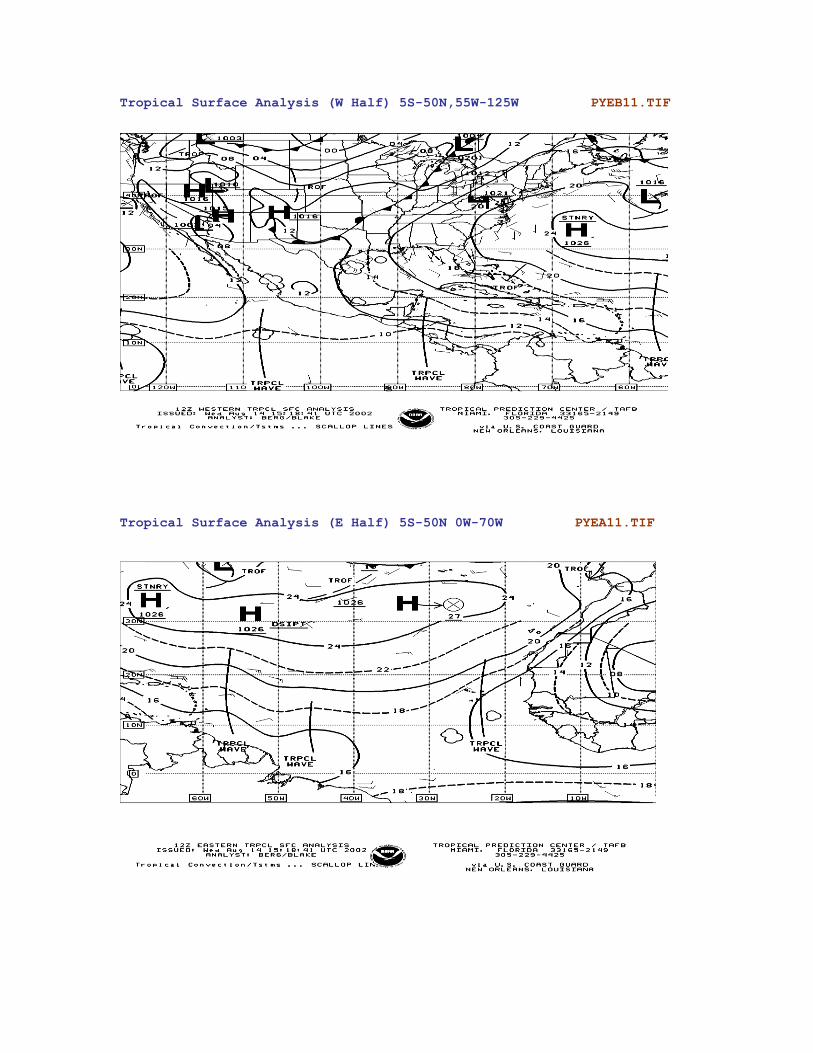
Tropical Surface Analysis (W Half) 5S-50N,55W-125W PYEB11.TIF
Tropical Surface Analysis (E Half) 5S-50N 0W-70W PYEA11.TIF

24HR Tropical Surface Forecast (W Half) 20S-30N 80W-145W PYFE10.TIF
48HR Tropical Surface Forecast (W Half) 20S-30N 80W-145W PYFI10.TIF
72HR Tropical Surface Forecast (W Half) 20S-30N 80W-145W PYFK10.TIF
24HR Tropical Surface Forecast (E Half) 00N-31N 35W-100W PYEE10.TIF

48HR Tropical Surface Forecast (E Half) 00N-31N 35W-100W PYEI10.TIF
72HR Tropical Surface Forecast (E Half) 00N-31N 35W-100W PYEK10.TIF

Tropical Cyclone Danger Area 05N-60N, 00W-100W PWEK11.TIF
High Seas Forecast 7N-31N 35W-98W PLEA10.TIF

GOES IR Satellite Image evst99.jpg

NATIONAL WEATHER SERVICE
EASTERN PACIFIC OCEAN Product/Chart ____ _ Chart ID
WIND/WAVE CHARTS
Sea State Analysis 25N-60N E OF 155W PWBA90.TIF
00Z Sea State Analysis 20N-70N 115W-135E PJBA99.TIF
24HR Wind/Wave Forecast 25N-60N E of 155W PWBE10.TIF
48HR Wind Wave Forecast 20N-70N 115W-135E PJBI10.TIF
48HR Wave Period/Swell Direction 20N-70N 115W-135E PJBI20.TIF
96HR Wind/Wave Forecast VT00Z 20N-70N 115W-135E PJBM98.TIF
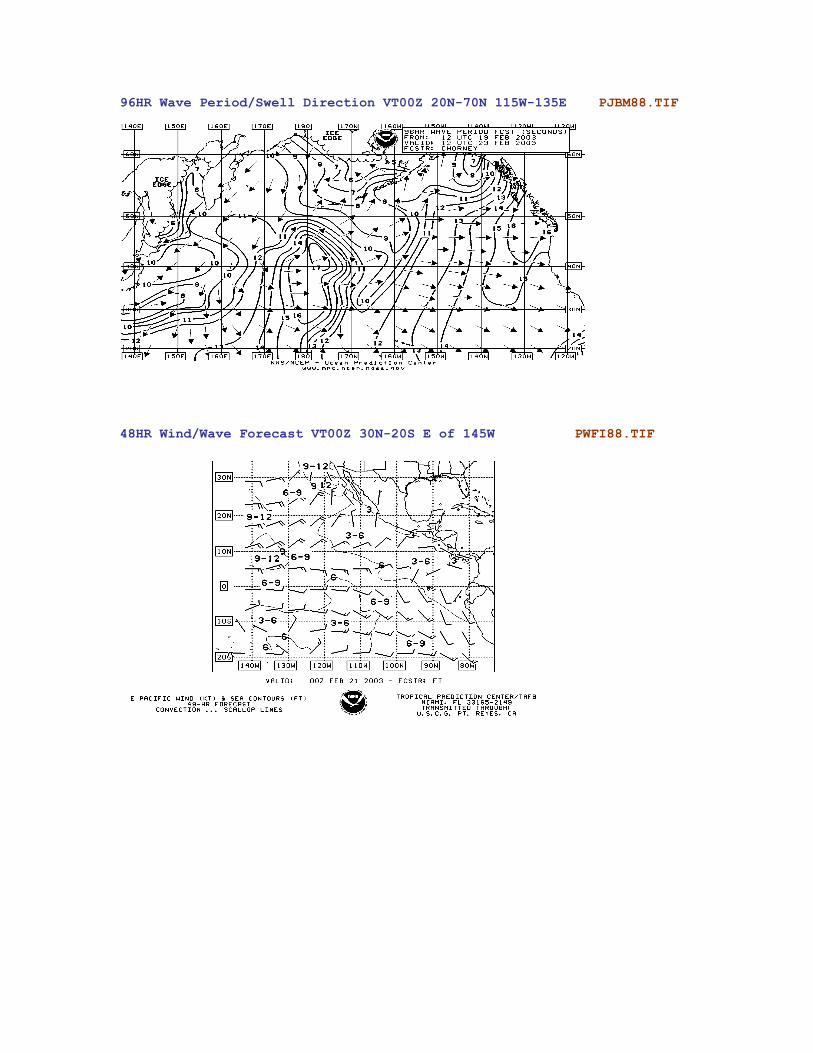
96HR Wave Period/Swell Direction VT00Z 20N-70N 115W-135E PJBM88.TIF
TROPICAL WIND/WAVE CHARTS
Analysis & 24HR Wind/Wave Forecast 30N-20S E of 145W PJBA90.TIF
48HR Wind/Wave Forecast VT00Z 30N-20S E of 145W PWFI88.TIF
48HR Wave Period/Swell Direction VT12Z 30N-20S E of 145W PJFI88.TIF
48HR & 72HR Wave Period/Swell Direction VT00Z 30N-20S E of 145W PJFK88.TIF
48HR & 72HR Wind/Wave Forecast VT12Z 30N-20S E of 145W PWFI89.TIF
SURFACE CHARTS
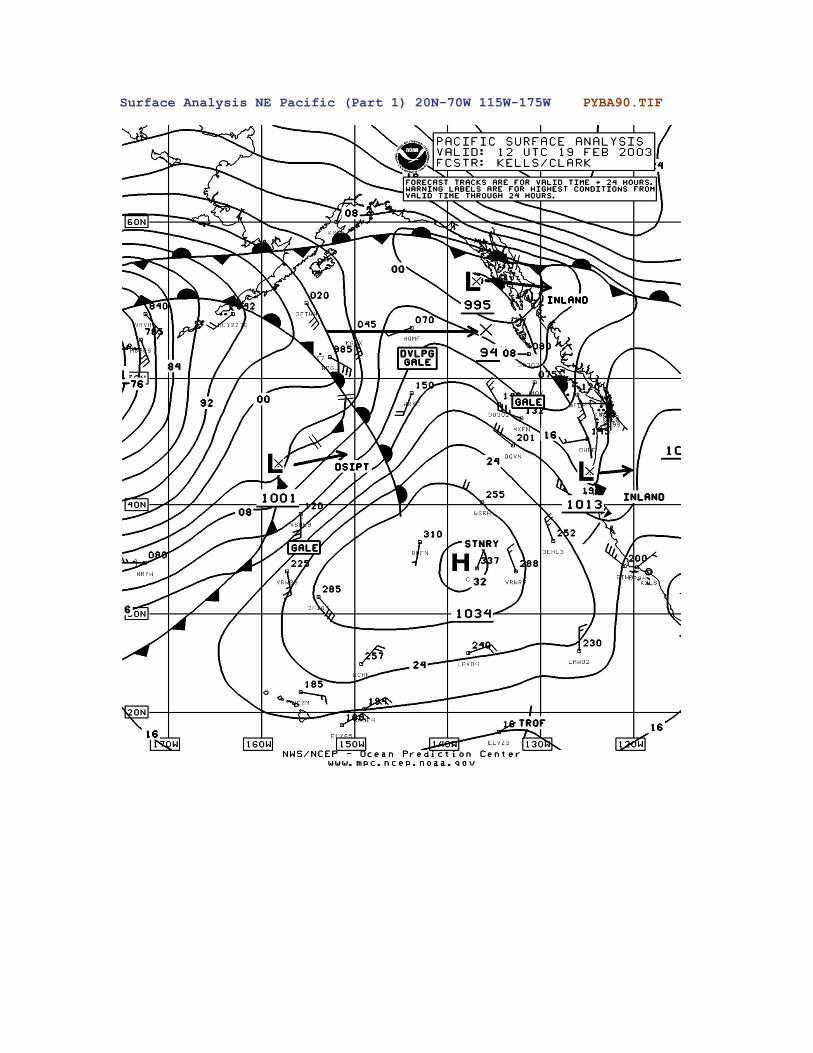
Surface Analysis NE Pacific (Part 1) 20N-70W 115W-175W PYBA90.TIF
Surface Analysis NW Pacific (Part 2) 20N-70W 175W-135E PYBA91.TIF
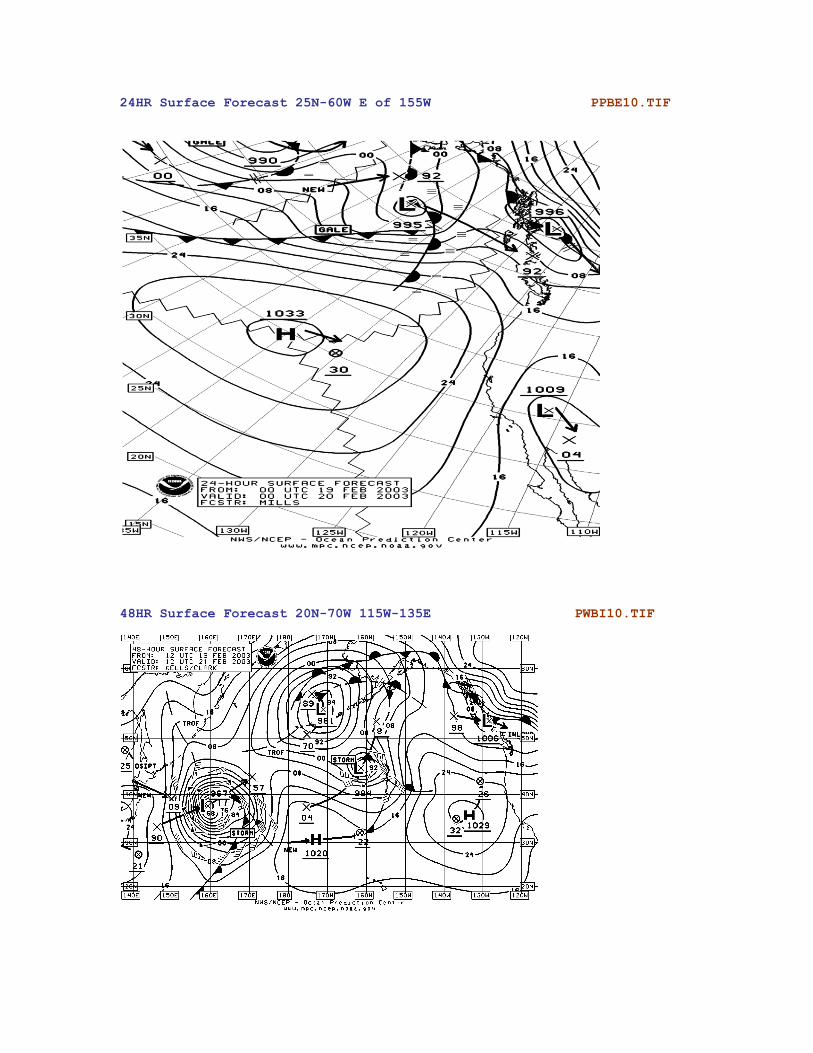
24HR Surface Forecast 25N-60W E of 155W PPBE10.TIF
48HR Surface Forecast 20N-70W 115W-135E PWBI10.TIF
96HR Surface Forecast VT00Z 20N-70W 115W-135E PWBM99.TIF
UPPER AIR CHARTS
500MB Analysis 20N-70N 115W-135E PPBA10.TIF
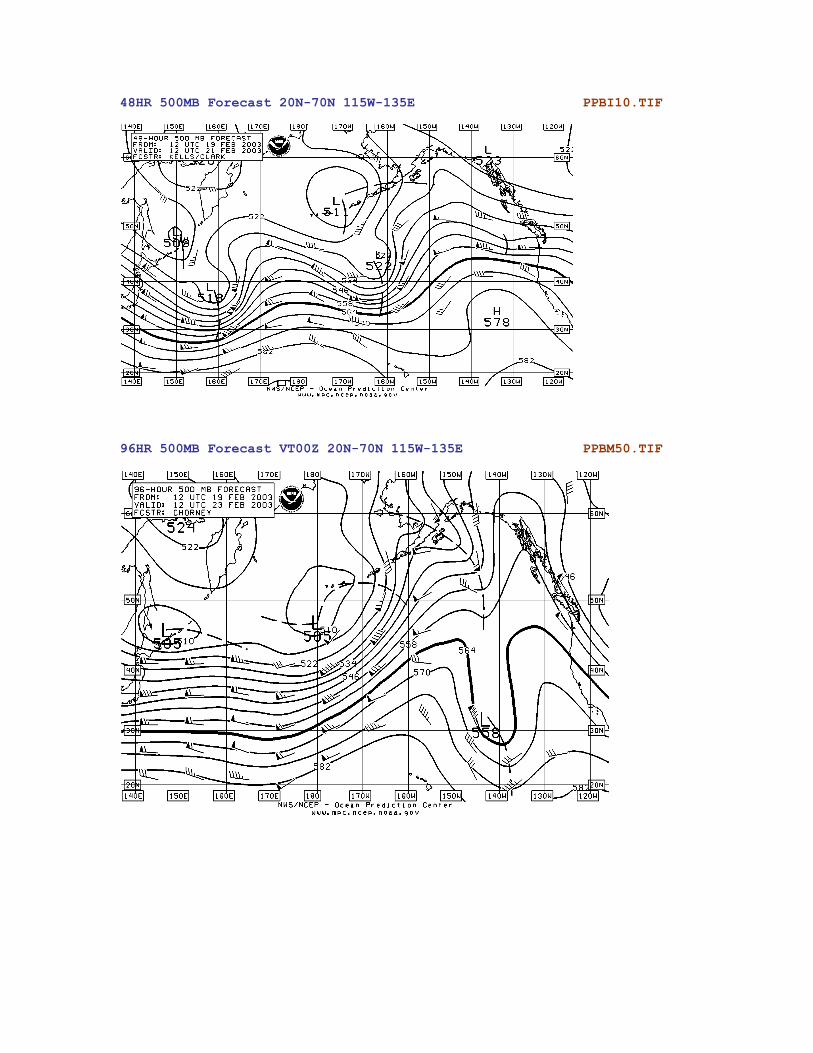
48HR 500MB Forecast 20N-70N 115W-135E PPBI10.TIF
96HR 500MB Forecast VT00Z 20N-70N 115W-135E PPBM50.TIF
TROPICAL SURFACE CHARTS
Tropical Surface Analysis 30N-20S E of 145W PYFA90.TIF
U.S./Tropical Surface Analysis 5S-50N 55W-125W PYEB11.TIF
24HR Tropical Surface Forecast 20S-30N 80W-145W PYFE10.TIF
48HR Tropical Surface Forecast 20S-30N 80W-145W PYFI10.TIF
72HR Tropical Surface Forecast 20S-30N 80W-145W PYFK10.TIF
TROPICAL CYCLONE CHARTS
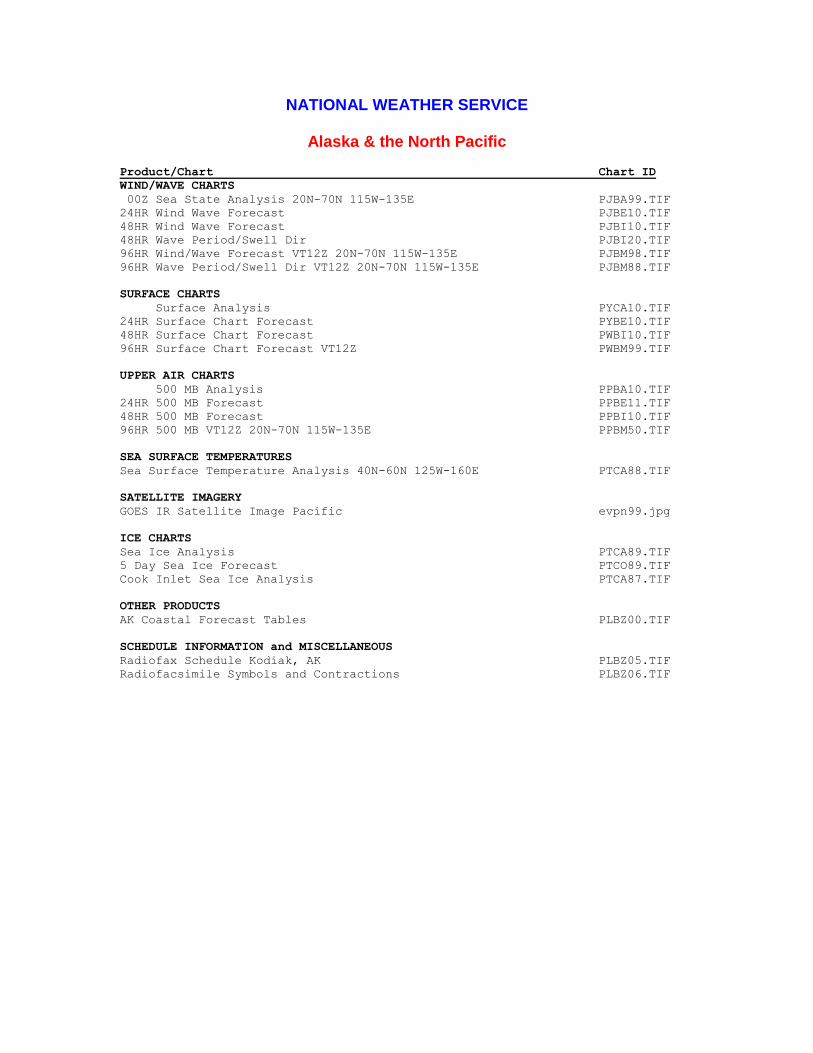
Tropical Cyclone Danger Area 0N-40N 80W-180W PWFK11.TIF
* Tropical Cyclone Danger Area chart replaced by High Wind/Wave Warning chart
Dec 01 - May 14.
SEA SURFACE TEMPERATURES
Pacific SST Chart 40N-53N E of 136W PTBA88.TIF
Pacific SST Chart 23N-42N E of 136W PTBA89.TIF
SATELLITE IMAGERY
GOES IR Satellite Image East Pacific evpn98.jpg
GOES IR Satellite Image Pacific evpn99.jpg
SCHEDULE INFORMATION
Radiofax Schedule Part 1 (Point Reyes, CA) PLBZ01.TIF
Radiofax Schedule Part 2 (Point Reyes, CA) PLBZ02.TIF
Radiofax Schedule (DOS Text Format) hfreyes.txt
Product Notice Bulletin PLBZ04.TIF
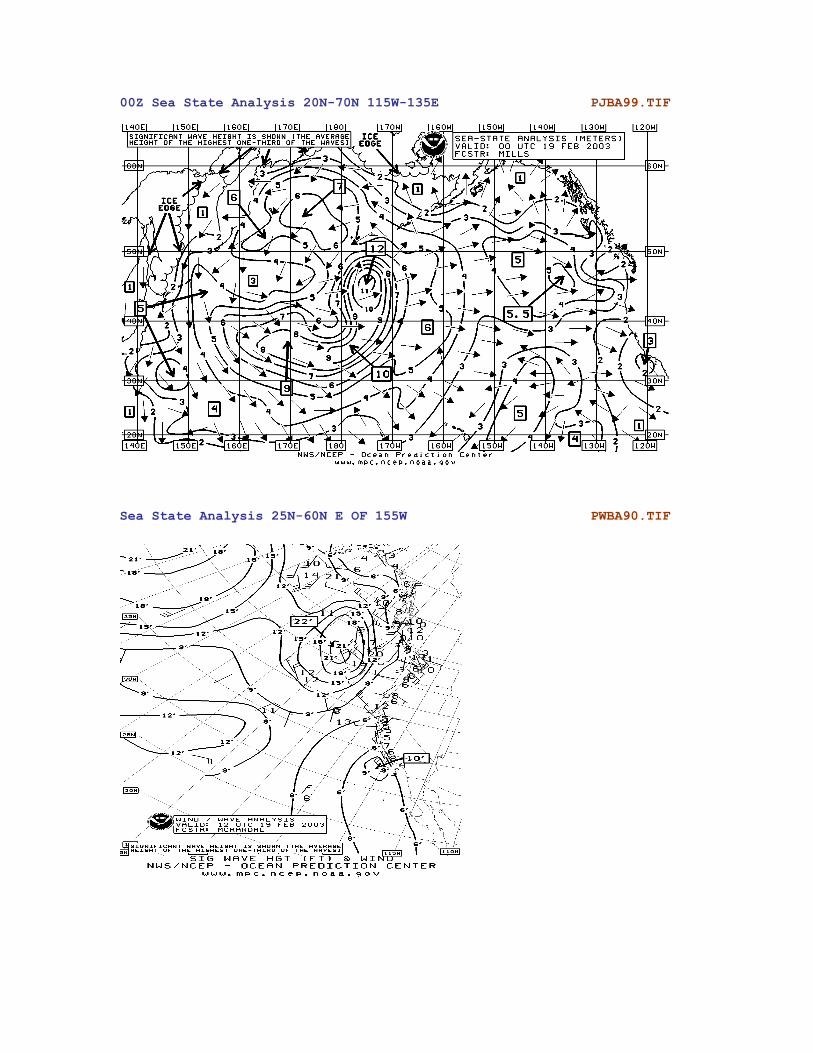
00Z Sea State Analysis 20N-70N 115W-135E PJBA99.TIF
Sea State Analysis 25N-60N E OF 155W PWBA90.TIF
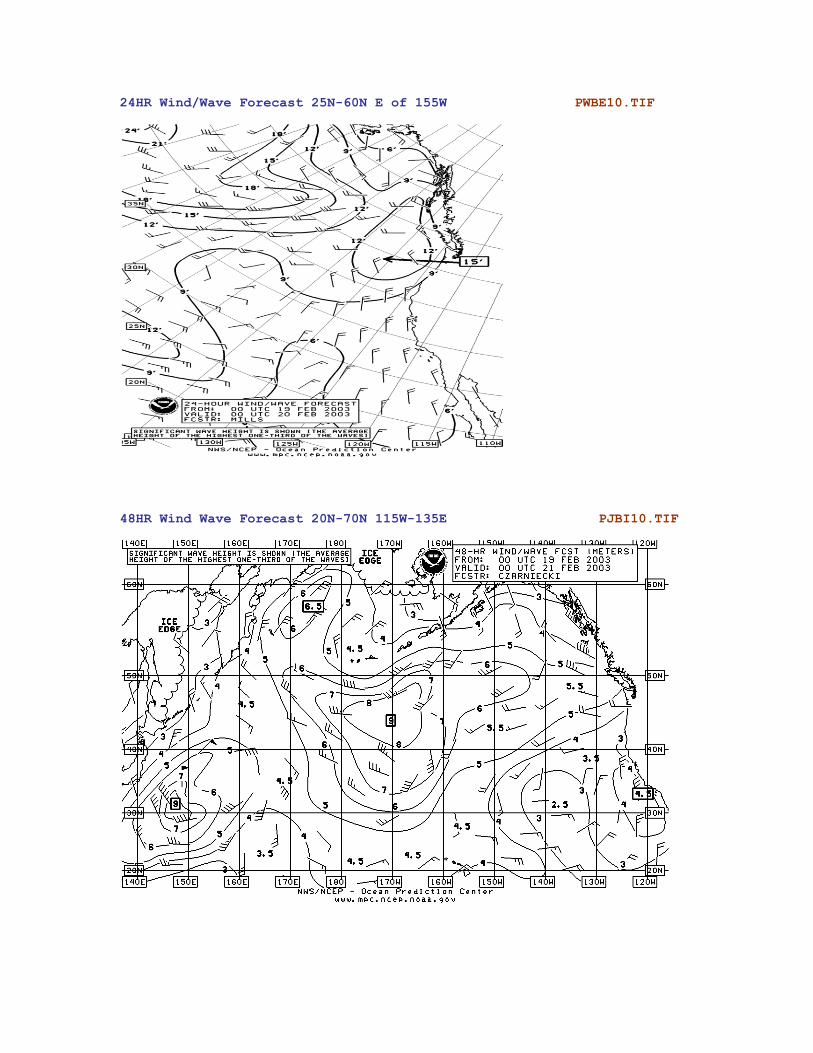
24HR Wind/Wave Forecast 25N-60N E of 155W PWBE10.TIF
48HR Wind Wave Forecast 20N-70N 115W-135E PJBI10.TIF
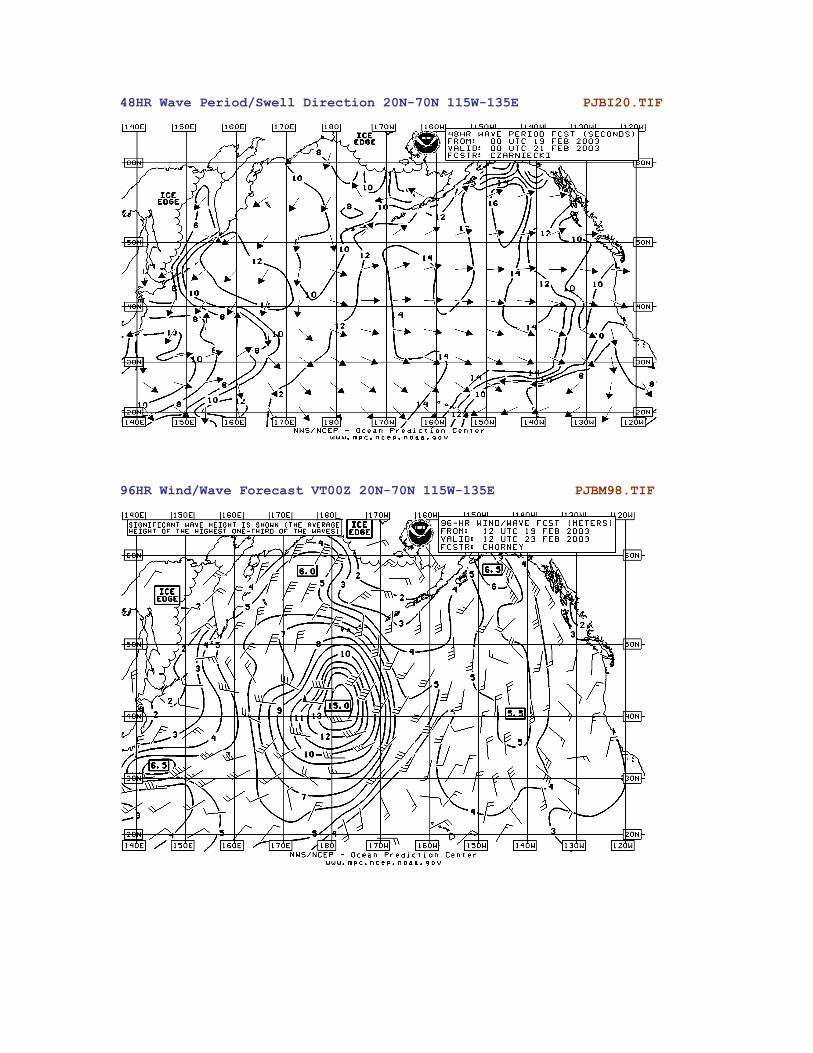
48HR Wave Period/Swell Direction 20N-70N 115W-135E PJBI20.TIF
96HR Wind/Wave Forecast VT00Z 20N-70N 115W-135E PJBM98.TIF
96HR Wave Period/Swell Direction VT00Z 20N-70N 115W-135E PJBM88.TIF
48HR Wind/Wave Forecast VT00Z 30N-20S E of 145W PWFI88.TIF

48HR Wave Period/Swell Direction VT12Z 30N-20S E of 145W PJFI88.TIF
48HR & 72HR Wave Period/Swell Dir VT00Z 30N-20S E of 145W PJFK88.TIF

48HR & 72HR Wind/Wave Forecast VT12Z 30N-20S E of 145W PWFI89.TIF
Surface Analysis NE Pacific (Part 1) 20N-70W 115W-175W PYBA90.TIF

Surface Analysis NW Pacific (Part 2) 20N-70W 175W-135E PYBA91.TIF
24HR Surface Forecast 25N-60W E of 155W PPBE10.TIF
48HR Surface Forecast 20N-70W 115W-135E PWBI10.TIF

96HR Surface Forecast VT00Z 20N-70W 115W-135E PWBM99.TIF
500MB Analysis 20N-70N 115W-135E PPBA10.TIF
48HR 500MB Forecast 20N-70N 115W-135E PPBI10.TIF
96HR 500MB Forecast VT00Z 20N-70N 115W-135E PPBM50.TIF

Tropical Surface Analysis 30N-20S, E of 145W PYFA90.TIF
U.S./Tropical Surface Analysis (W Half) 5S-50N 55W-125W PYEB11.TIF
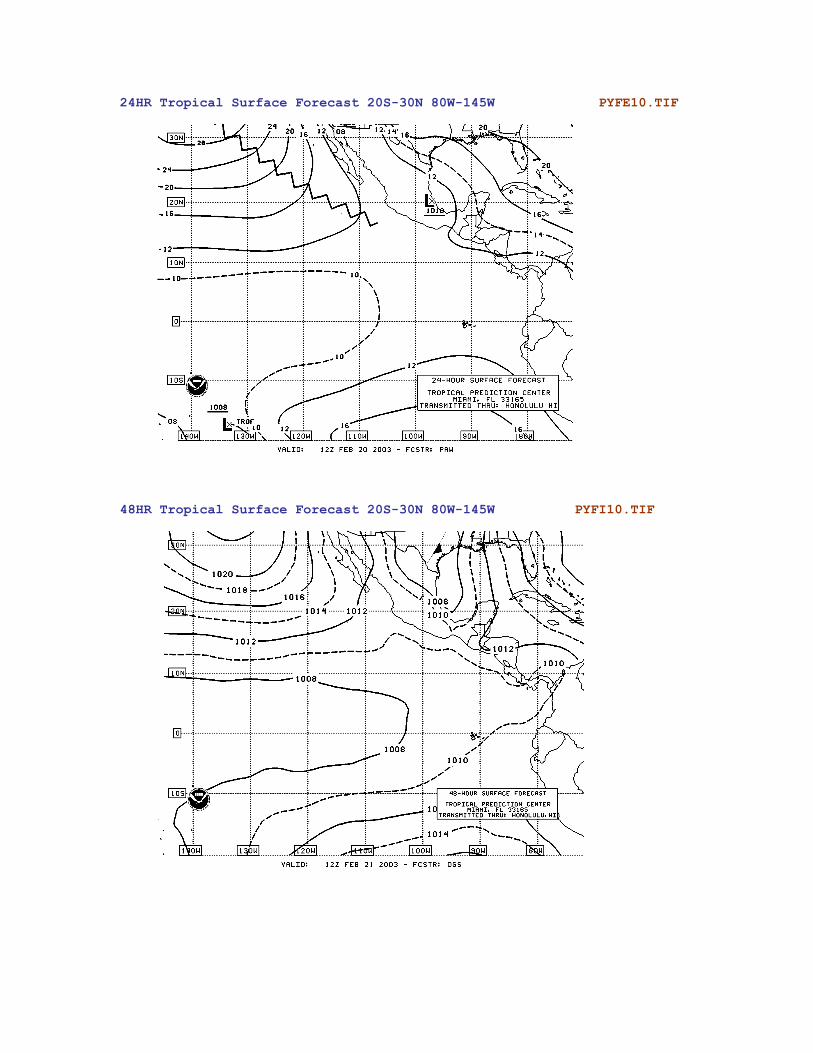
24HR Tropical Surface Forecast 20S-30N 80W-145W PYFE10.TIF
48HR Tropical Surface Forecast 20S-30N 80W-145W PYFI10.TIF

72HR Tropical Surface Forecast 20S-30N 80W-145W PYFK10.TIF
72 HR Tropical Cyclone Danger Area 0N-40N 80W-180W PWFK11.TIF Note: Tropical Cyclone Danger Area chart replaced by
High Wind/Wave Warning chart Dec 01 - May 14.

Pacific SST Chart 40N-53N E of 136W PTBA88.TIF
Pacific SST Chart 23N-42N E of 136W PTBA89.TIF

GOES IR Satellite Image East Pacific evpn98.jpg

GOES IR Satellite Image North East Pacific evpn99.jpg

NATIONAL WEATHER SERVICE
CENTRAL PACIFIC OCEAN Product/Chart ____ Chart ID
WIND/SEAS CHARTS
Analysis & 24HR Wind/Wave Forecast (2 Charts) 30N-20S 145W-80W PJBA90.TIF
24HR Wind/Wave Forecast VT00Z 60N-35S 110W-130E QWBI99.TIF
48HR Wind/Wave Forecast VT00Z 60N-35S 110W-130E QWBQ99.TIF
48HR Tropical Wind/Wave Forecast VT00Z 30N-20S 145W-80W PWFI88.TIF
48HR Tropical Wave Period/Swell Dir VT12Z 30N-20S 145W-80W PJFI88.TIF
48 & 72HR Tropical Wave Period/Swell Dir VT00Z 30N-20S 145W-80W PJFK88.TIF
48 & 72HR Tropical Wind/Wave Forecast VT12Z 30N-20S 145W-80W PWFI89.TIF
SURFACE CHARTS
Surface Analysis (Part 1) 20N-70W 115W-175W PYBA90.TIF
Surface Analysis (Part 2) 20N-70W 175W-135E PYBA91.TIF
48HR Surface Forecast 20N-70W 115W-135E PWBI10.TIF
96HR Surface Forecast VT00Z 20N-70W 115W-135E PWBM99.TIF
TROPICAL SURFACE CHARTS
Tropical Surface Analysis QYFA99.TIF
24HR Wind/Stream Forecast VT00Z 50N-30S 100W-120E QWFI99.TIF
48HR Wind/Stream Forecast VT00Z 50N-30S 100W-120E QWFQ99.TIF
48HR Surface Forecast 60N-55S 55W-70E QDEQ99.TIF
24HR Tropical Surface Forecast 20S-30N 80W-145W PYFE10.TIF
48HR Tropical Surface Forecast 20S-30N 80W-145W PYFI10.TIF
72HR Tropical Surface Forecast 20S-30N 80W-145W PYFK10.TIF
72HR Tropical Cyclone Danger Area 0N-40N 80W-180W (Most Current) PWFK11.TIF
Note: Tropical Cyclone Danger Area chart replaced by
High Wind/Wave Warning chart Dec 01 - May 14
SATELLITE IMAGERY
Eastern Pacific Satellite Image (Most Current) evpn99.jpg
SCHEDULE INFORMATION
Radiofax Schedule (DOS Text Version) hfhi.txt

Analysis & 24HR Wind/Wave Forecast 30N-20S 145W-80W PJBA90.TIF
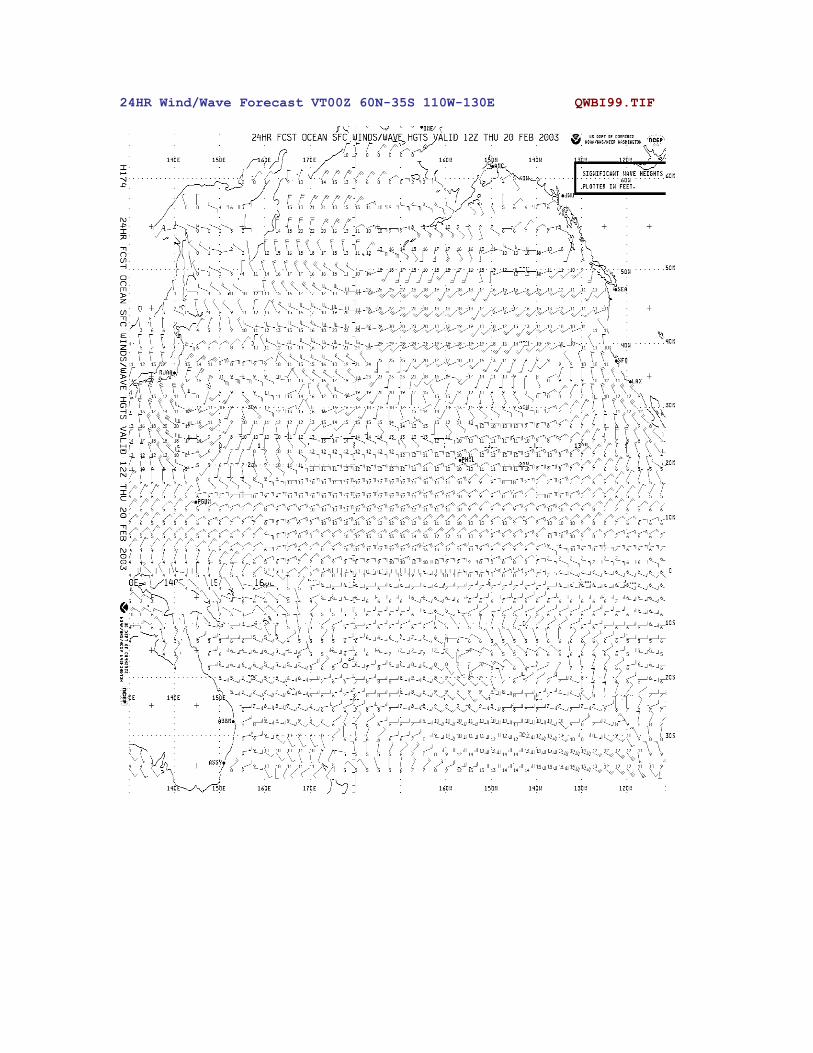
24HR Wind/Wave Forecast VT00Z 60N-35S 110W-130E QWBI99.TIF

48HR Wind/Wave Forecast VT00Z 60N-35S 110W-130E QWBQ99.TIF

48HR Tropical Wind/Wave Forecast VT00Z 30N-20S 145W-80W PWFI88.TIF
48HR Tropical Wave Period/Swell Dir VT12Z 30N-20S 145W-80W PJFI88.TIF

48 & 72HR Trop Wave Period/Swell Dir VT00Z 30N-20S 145W-80W PJFK88.TIF
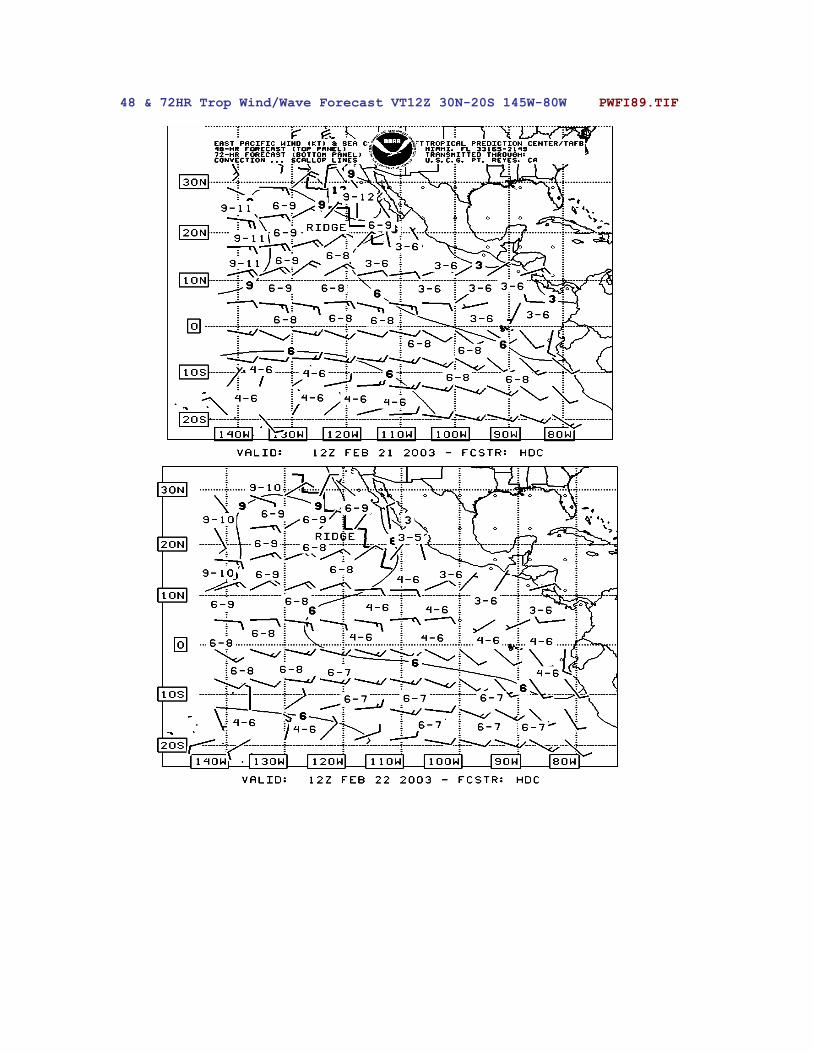
48 & 72HR Trop Wind/Wave Forecast VT12Z 30N-20S 145W-80W PWFI89.TIF
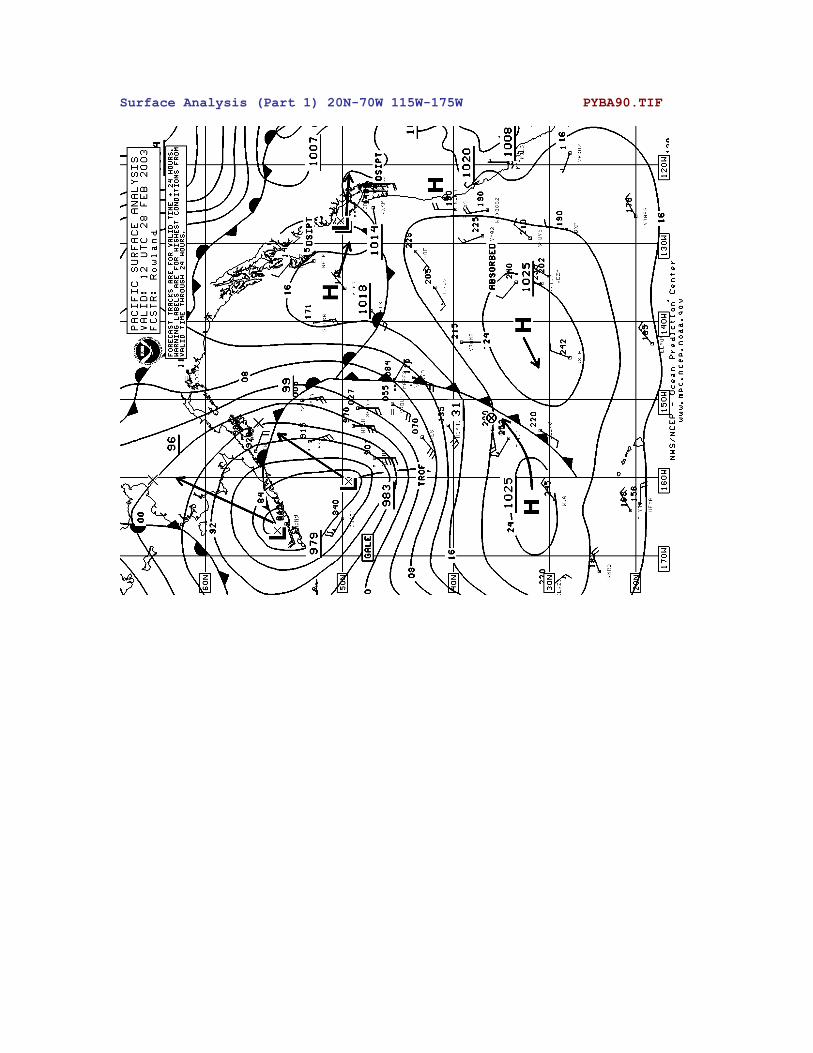
Surface Analysis (Part 1) 20N-70W 115W-175W PYBA90.TIF

Surface Analysis (Part 2) 20N-70W 175W-135E PYBA91.TIF
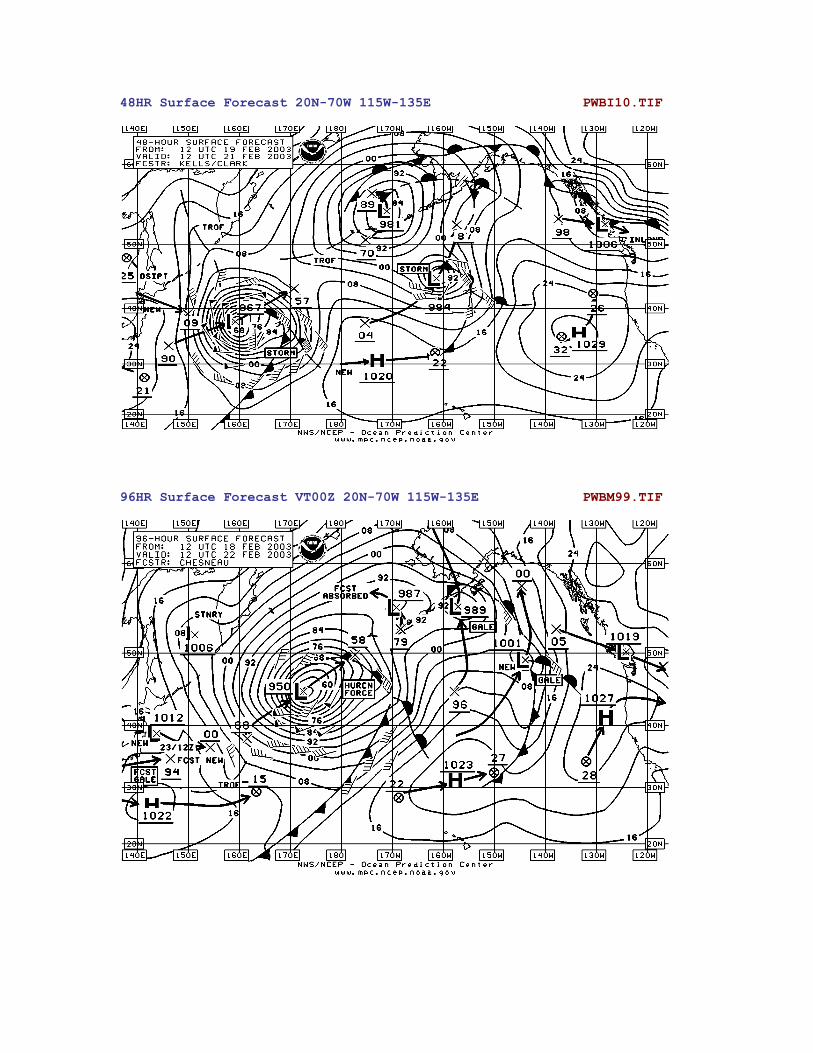
48HR Surface Forecast 20N-70W 115W-135E PWBI10.TIF
96HR Surface Forecast VT00Z 20N-70W 115W-135E PWBM99.TIF
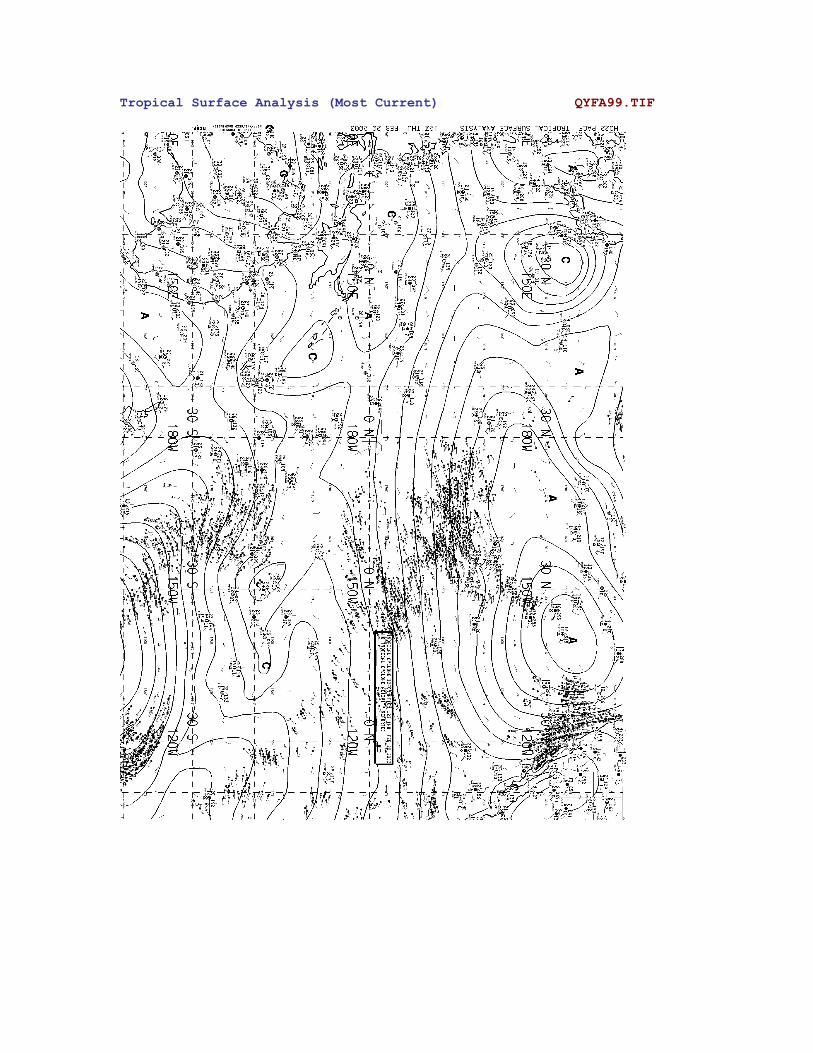
Tropical Surface Analysis (Most Current) QYFA99.TIF

24HR Wind/Stream Forecast VT00Z 50N-30S 100W-120E QWFI99.TIF

48HR Wind/Stream Forecast VT00Z 50N-30S 100W-120E QWFQ99.TIF
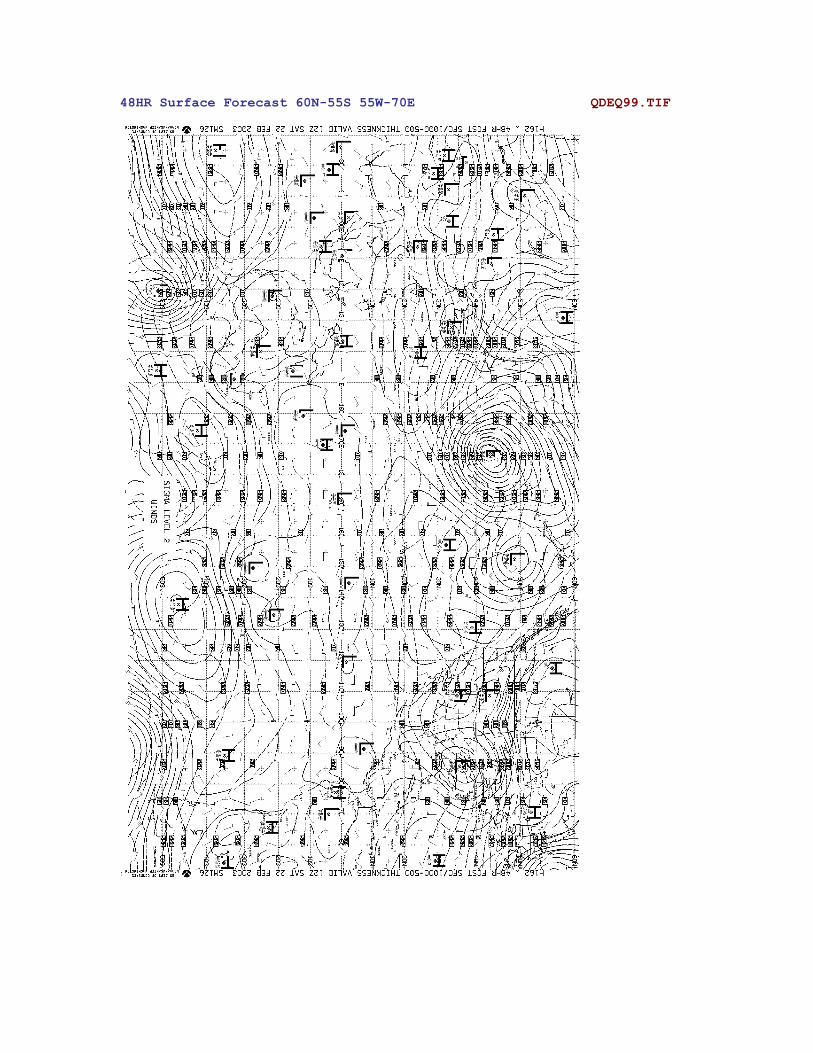
48HR Surface Forecast 60N-55S 55W-70E QDEQ99.TIF
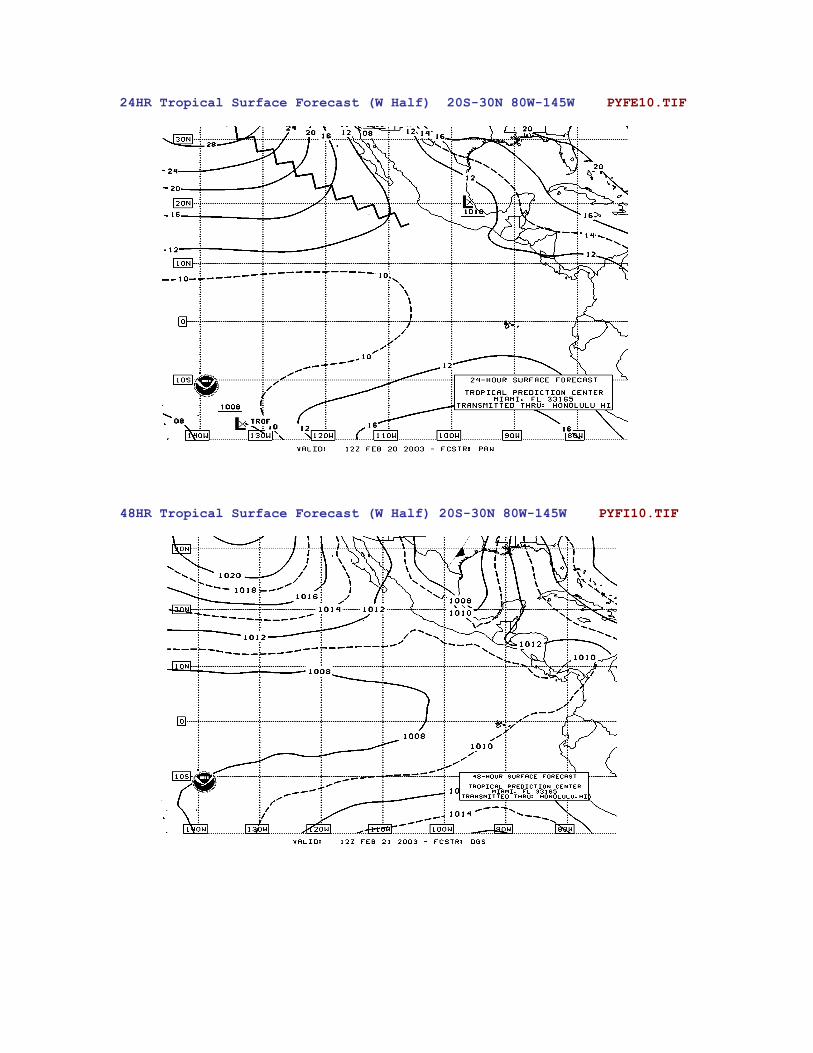
24HR Tropical Surface Forecast (W Half) 20S-30N 80W-145W PYFE10.TIF
48HR Tropical Surface Forecast (W Half) 20S-30N 80W-145W PYFI10.TIF
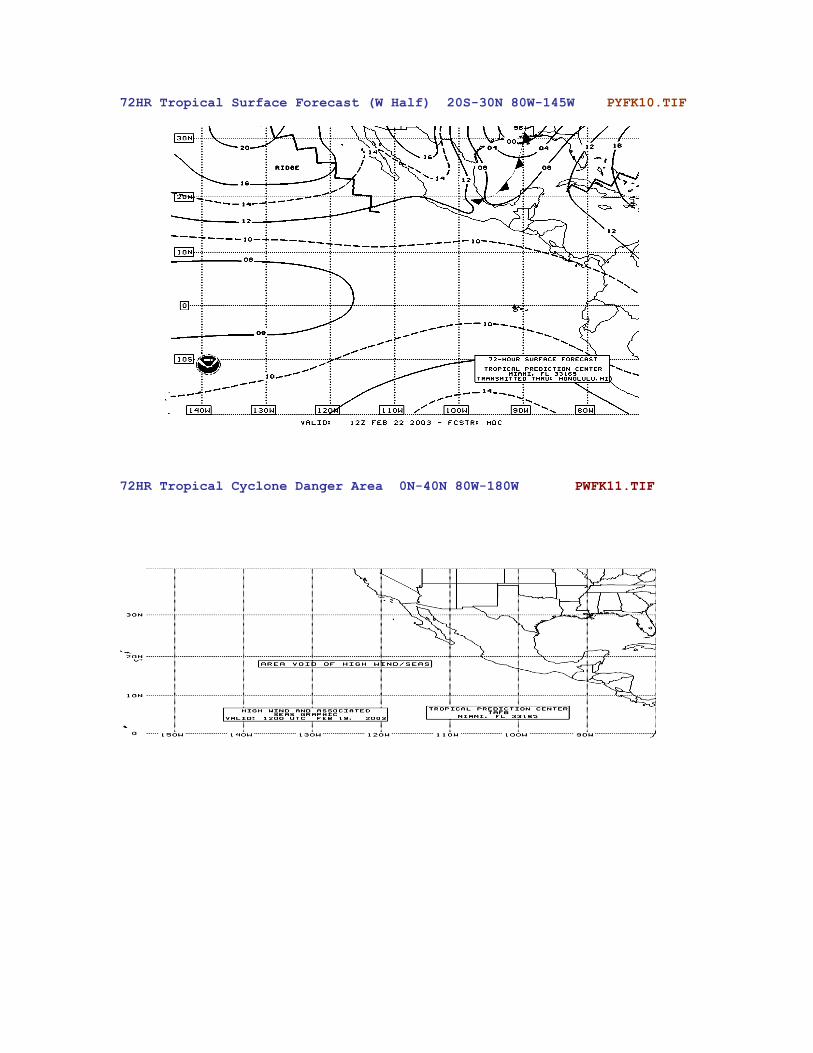
72HR Tropical Surface Forecast (W Half) 20S-30N 80W-145W PYFK10.TIF
72HR Tropical Cyclone Danger Area 0N-40N 80W-180W PWFK11.TIF

Eastern Pacific Satellite Image (Most Current) evpn99.jpg
NATIONAL WEATHER SERVICE
Alaska & the North Pacific
Product/Chart Chart ID
WIND/WAVE CHARTS
00Z Sea State Analysis 20N-70N 115W-135E PJBA99.TIF
24HR Wind Wave Forecast PJBE10.TIF
48HR Wind Wave Forecast PJBI10.TIF
48HR Wave Period/Swell Dir PJBI20.TIF
96HR Wind/Wave Forecast VT12Z 20N-70N 115W-135E PJBM98.TIF
96HR Wave Period/Swell Dir VT12Z 20N-70N 115W-135E PJBM88.TIF
SURFACE CHARTS
Surface Analysis PYCA10.TIF
24HR Surface Chart Forecast PYBE10.TIF
48HR Surface Chart Forecast PWBI10.TIF
96HR Surface Chart Forecast VT12Z PWBM99.TIF
UPPER AIR CHARTS
500 MB Analysis PPBA10.TIF
24HR 500 MB Forecast PPBE11.TIF
48HR 500 MB Forecast PPBI10.TIF
96HR 500 MB VT12Z 20N-70N 115W-135E PPBM50.TIF
SEA SURFACE TEMPERATURES
Sea Surface Temperature Analysis 40N-60N 125W-160E PTCA88.TIF
SATELLITE IMAGERY
GOES IR Satellite Image Pacific evpn99.jpg
ICE CHARTS
Sea Ice Analysis PTCA89.TIF
5 Day Sea Ice Forecast PTCO89.TIF
Cook Inlet Sea Ice Analysis PTCA87.TIF
OTHER PRODUCTS
AK Coastal Forecast Tables PLBZ00.TIF
SCHEDULE INFORMATION and MISCELLANEOUS
Radiofax Schedule Kodiak, AK PLBZ05.TIF
Radiofacsimile Symbols and Contractions PLBZ06.TIF

00Z Sea State Analysis 20N-70N 115W-135E PJBA99.TIF
24HR Wind Wave Forecast PJBE10.TIF

48HR Wind Wave Forecast 20N-70N 115W-135E PJBI10.TIF
48HR Wave Period/Swell Direction 20N-70N 115W-135E PJBI20.TIF

96HR Wind/Wave Forecast VT12Z 20N-70N 115W-135E PJBM98.TIF
96HR Wave Period/Swell Dir VT12Z 20N-70N 115W-135E PJBM88.TIF

Surface Analysis PYCA10.TIF
24HR Surface Forecast 40N-70N 115W-170E PYBE10.TIF

48HR Surface Forecast 20N-70N 115W-135E PWBI10.TIF
96HR Surface Forecast VT12Z 40N-70N 115W-170E PWBM99.TIF

500MB Analysis 20N-70N 115W-135E PPBA10.TIF
24HR 500 MB Forecast PPBE11.TIF
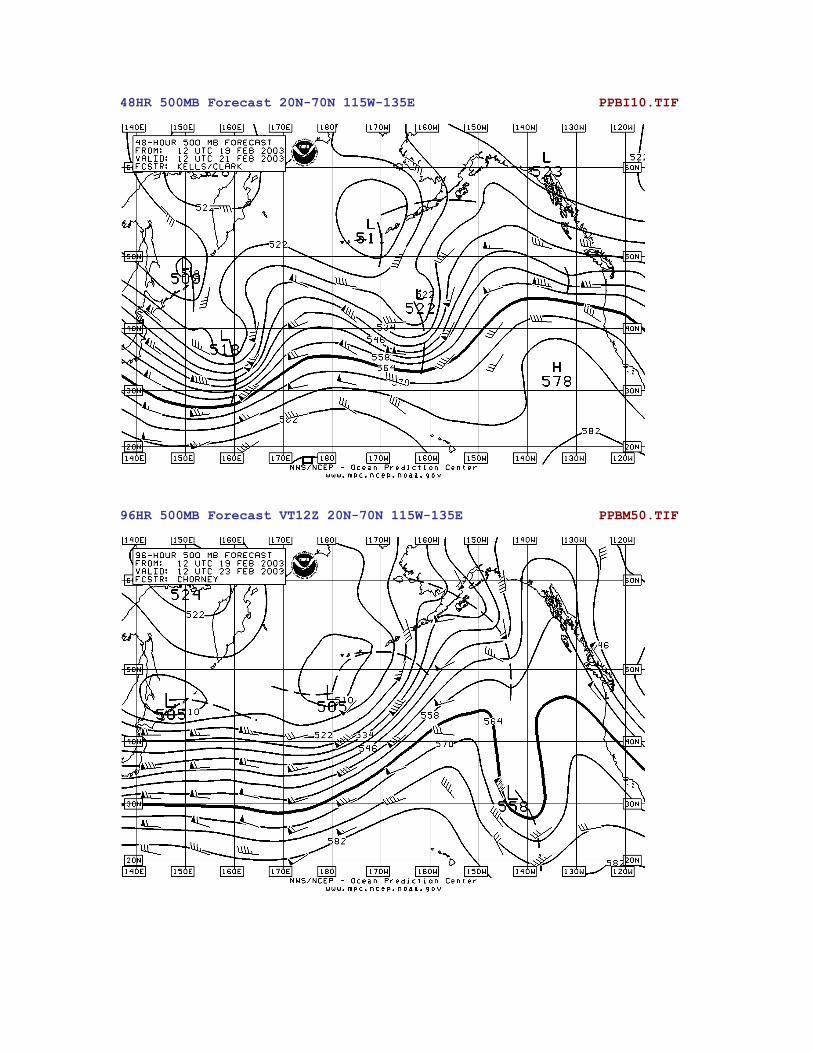
48HR 500MB Forecast 20N-70N 115W-135E PPBI10.TIF
96HR 500MB Forecast VT12Z 20N-70N 115W-135E PPBM50.TIF

Sea Surface Temperature Analysis 40N-60N 125W - 160E PTCA88.TIF
GOES IR Satellite Image Pacific evpn99.jpg
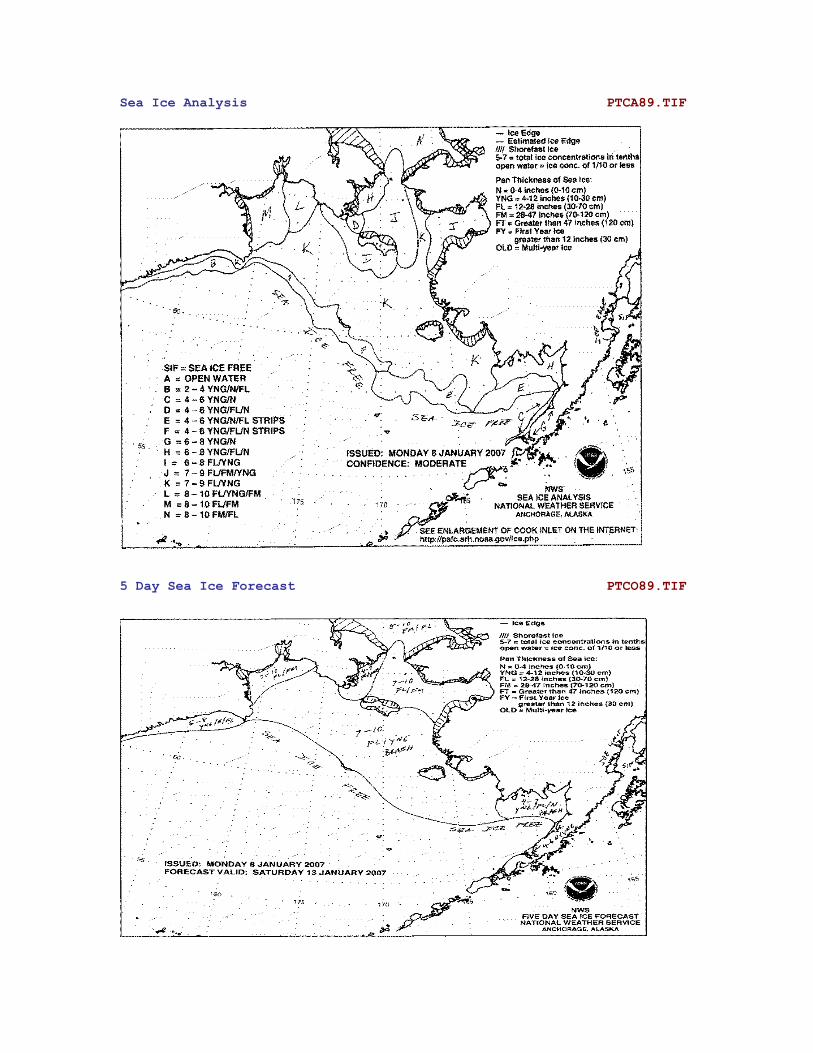
Sea Ice Analysis PTCA89.TIF
5 Day Sea Ice Forecast PTCO89.TIF
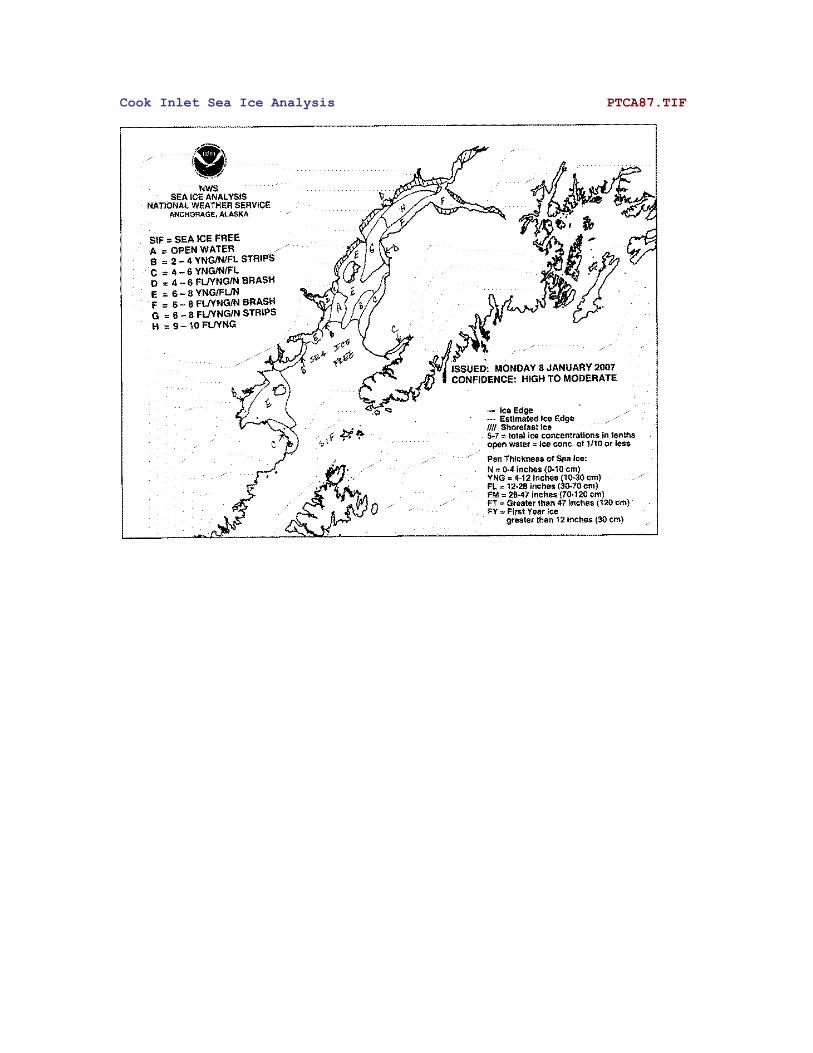
Cook Inlet Sea Ice Analysis PTCA87.TIF

AK Coastal Forecast Tables PLBZ00.TIF

Radiofax Schedule Kodiak, AK PLBZ05.TIF

Radiofacsimile Symbols and Contractions PLBZ06.TIF
