nationwide building society/media/mainsite/documents/...nationwide building society – interim...
TRANSCRIPT

Nationwide Building Society
Interim Results For the period ended 30 September 2014

Nationwide Building Society – Interim Results
2
CONTENTS
Page
Key highlights 4
Financial summary 5
Chief Executive’s review 6
Financial review 10
Business and risk report 18
Interim financial statements 72
Notes to the interim financial information 78
Responsibility statement 104
Independent review report 105
Other information and glossary 107
Contacts 108
Underlying profit and pre provision underlying profit Profit before tax shown on a statutory and underlying basis is set out on page 10. Statutory profit before tax of £598 million has been adjusted for a number of items, consistent with prior years, to derive an underlying profit before tax of £606 million. The purpose of this measure is to reflect management’s view of the Group’s underlying performance and to assist with like for like comparisons of performance across years. Underlying profit is not designed to measure sustainable levels of profitability as that potentially requires exclusion of non-recurring items even though they are closely related to (or even a direct consequence of) the Group’s core business activities. Pre provision underlying profit of £779 million relates to underlying profit before impairment losses and provisions for liabilities and charges. The purpose of this measure is to demonstrate net income generation capacity and the ability of the business to absorb losses in a challenging economic climate. Comparatives have been restated in accordance with IFRIC 21. Refer to note 2 to the Interim Financial Statements for further details. Forward looking statements Statements in this document are forward looking with respect to plans, goals and expectations relating to the future financial position, business performance and results of Nationwide. Although Nationwide believes that the expectations reflected in these forward looking statements are reasonable, we can give no assurance that these expectations will prove to be an accurate reflection of actual results. By their nature, all forward looking statements involve risk and uncertainty because they relate to future events and circumstances that are beyond the control of Nationwide including, amongst other things, UK domestic and global economic and business conditions, market related risks such as fluctuation in interest rates and exchange rates, inflation/deflation, the impact of competition, changes in customer preferences, risks concerning borrower credit quality, delays in implementing proposals, the timing, impact and other uncertainties of future acquisitions or other combinations within relevant industries, the policies and actions of regulatory authorities, the impact of tax or other legislation and other regulations in the jurisdictions in which Nationwide operates. As a result, Nationwide’s actual future financial condition, business performance and results may differ materially from the plans, goals and expectations expressed or implied in these forward looking statements. Due to such risks and uncertainties Nationwide cautions readers not to place undue reliance on such forward looking statements. We undertake no obligation to update any forward looking statements whether as a result of new information, future events or otherwise. This document does not constitute or form part of an offer of securities for sale in the United States. Securities may not be offered or sold in the United States absent registration or an exemption from registration. Any public offering to be made in the United States will be made by means of a prospectus that may be obtained from the Society and will contain detailed information about the Society and management as well as financial statements.

Nationwide Building Society – Interim Results
3
NATIONWIDE BUILDING SOCIETY
INTERIM RESULTS FOR THE PERIOD ENDED 30 SEPTEMBER 2014
Graham Beale, Nationwide’s Chief Executive, said: “The first six months of this financial year reflect the growing strength of the Society and our ability to deliver better service than our banking peers. Consistent with our mutual heritage, we offer an attractive range of products designed to be transparent, fair and good value. This is reinforced by a culture which is focused entirely on the needs of our membership and is in contrast to the traditional shareholder model of the banks. “We have developed new products, invested in technologies which give our members greater choice in the way they manage their financial affairs, and have rewarded loyal members with some market-leading product offers. Alongside this, we have delivered a strong financial performance with underlying profit increasing by 83% to £606 million, underpinning our already strong capital position. As a result, our Common Equity Tier 1 ratio has risen to 17.6%, which underlines our position as a safe and secure financial services provider for our members. “As a mutual, we pride ourselves on the quality of our service; we strive to be the best and our record is testament to this ambition. We have been ranked number one for customer satisfaction amongst our high street peer group for three consecutive years1, and our lead over our nearest competitor has grown by two percentage points to 6.2%1 compared with the lead we reported at the year end (March 2014: 4.2%1). In addition, Which? magazine’s recent survey of banking customer service rated Nationwide as the highest ranked high street provider of retail financial services. Most recently, in Nunwood’s 2014 UK Customer Experience Excellence study Nationwide was the number one financial services high street brand and ranked eighth overall out of 263 brands. This contrasts with our established high street banking peers, none of whom made the top 50.”
1 Source: GfK NOP’s Financial Research Survey (FRS) measure, as defined in the Glossary on page 107.

Nationwide Building Society – Interim Results
4
KEY HIGHLIGHTS
Focus on customer service Independently ranked number one for customer satisfaction amongst our high street peer group for
three consecutive years2 with our lead over our nearest competitor growing to 6.2%2 (March 2014: 4.2%2)
Only high street financial service provider to be ranked a top ten 2014 Customer Champion by Nunwood
Nationwide accounts for only 2.9% of all industry complaints and the Financial Ombudsman Service (FOS) agrees with the decisions we make in 88% of cases, compared with an industry average of only 43%
Delivering a digital Society for our members
Enhanced mobile banking app with introduction of ‘in app’ savings account opening facility, award winning Impulse Saver and Quick Balance
Transactions carried out via our mobile app now exceed transactions via our internet bank The first UK financial services provider to deliver access to real time account balances on Android
Wear smartwatches Rated number one by Which? magazine for online bank security
Support for the housing market
Gross mortgage lending of £13.1 billion (H1 2013/14: £14.0 billion), a market share of 12.2% Net lending of £3.6 billion (H1 2013/14: £5.6 billion), a market share of 24.8% Helped support 23,800 first time buyers and launched our Loyalty Rate Mortgages initiative Supported members’ increased desire for certainty by launching a 10 year fixed rate mortgage
Rewarding savers in a low interest rate environment
£3.5 billion increase in member deposit balances, a market share of 13.8% Loyalty Saver continuing to pay higher rates in recognition of duration of membership 20.7% share of the market change in ISA balances
A current account range designed to support our members’ needs
Market share of main standard and packaged accounts increased to 6.6% External recognition of our product range, with Your Money rating Nationwide as Best Online Current
Account Provider and Which? magazine assessed FlexPlus as the best packaged current account on the market
Launch of FlexOne, a current account designed specifically for the youth market, offering contactless and mobile app functionality, together with educational material on how to use a current account
Strong financial performance Total underlying income up 12.7% at £1.6 billion Underlying cost income ratio down to 50.2% (H1 2013/14: 52.8%) 83% increase in underlying profit to £606 million 113% increase in statutory profit to £598 million
Increased capital strength, securing the future of mutuality
Common Equity Tier 1 ratio 17.6% (4 April 2014: 14.5%) Leverage ratio (end state) 3.8% (4 April 2014: 3.4%)3
2 Source: GfK NOP’s Financial Research Survey (FRS) measure, as defined in the Glossary on page 107. 3 The leverage ratio comparative has been restated from 3.3% to reflect the revised BCBS definition.
Nationwide Building Society – Interim Results
5
FINANCIAL SUMMARY
Half year to 30 September
2014
Half year to 30 September 2013 (note i)
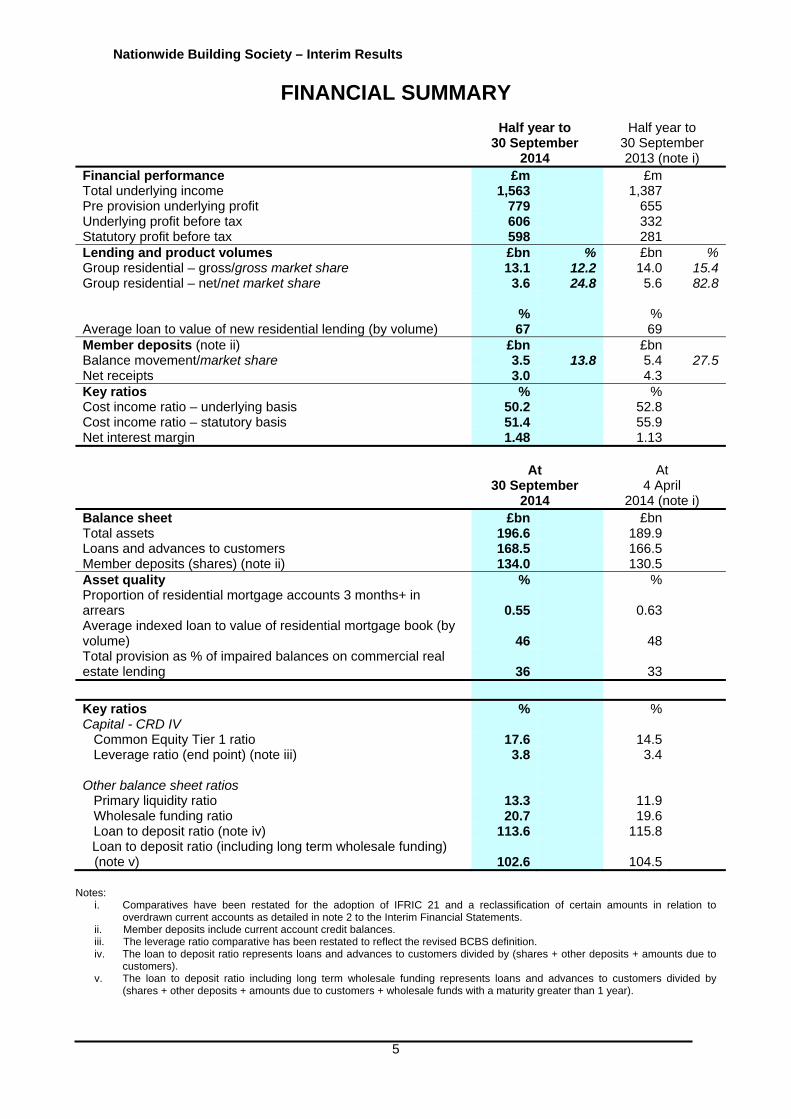
Financial performance £m £mTotal underlying income 1,563 1,387Pre provision underlying profit 779 655Underlying profit before tax 606 332Statutory profit before tax 598 281Lending and product volumes £bn % £bn % Group residential – gross/gross market share 13.1 12.2 14.0 15.4 Group residential – net/net market share 3.6 24.8 5.6 82.8 % % Average loan to value of new residential lending (by volume) 67 69 Member deposits (note ii) £bn £bnBalance movement/market share 3.5 13.8 5.4 27.5 Net receipts 3.0 4.3Key ratios % %Cost income ratio – underlying basis 50.2 52.8Cost income ratio – statutory basis 51.4 55.9Net interest margin 1.48 1.13 At
30 September 2014
At 4 April
2014 (note i) Balance sheet £bn £bnTotal assets 196.6 189.9Loans and advances to customers 168.5 166.5Member deposits (shares) (note ii) 134.0 130.5Asset quality % %Proportion of residential mortgage accounts 3 months+ in arrears 0.55 0.63Average indexed loan to value of residential mortgage book (by volume) 46 48Total provision as % of impaired balances on commercial real estate lending 36 33 Key ratios % %Capital - CRD IV Common Equity Tier 1 ratio 17.6 14.5 Leverage ratio (end point) (note iii) 3.8 3.4 Other balance sheet ratios Primary liquidity ratio 13.3 11.9 Wholesale funding ratio 20.7 19.6 Loan to deposit ratio (note iv) 113.6 115.8 Loan to deposit ratio (including long term wholesale funding)
(note v) 102.6 104.5
Notes: i. Comparatives have been restated for the adoption of IFRIC 21 and a reclassification of certain amounts in relation to
overdrawn current accounts as detailed in note 2 to the Interim Financial Statements. ii. Member deposits include current account credit balances. iii. The leverage ratio comparative has been restated to reflect the revised BCBS definition. iv. The loan to deposit ratio represents loans and advances to customers divided by (shares + other deposits + amounts due to
customers). v. The loan to deposit ratio including long term wholesale funding represents loans and advances to customers divided by
(shares + other deposits + amounts due to customers + wholesale funds with a maturity greater than 1 year).

Nationwide Building Society – Interim Results
6
CHIEF EXECUTIVE’S REVIEW
The first six months of this financial year reflect the growing strength of the Society and our ability to deliver better service than our banking peers. Consistent with our mutual heritage, we offer an attractive range of products designed to be transparent, fair and good value. This is reinforced by a culture which is focused entirely on the needs of our membership and is in contrast to the traditional shareholder model of the banks. We have developed new products, invested in technologies which give our members greater choice in the way they manage their financial affairs, and have rewarded loyal members with some market-leading product offers. Alongside this, we have delivered a strong financial performance and improved our capital position. As a result, our Common Equity Tier 1 ratio has risen to 17.6% which underlines our position as a safe and secure financial services provider for our members. Maintaining our focus on customer service As a mutual, we pride ourselves on the quality of our service; we strive to be the best and our record is testament to this ambition. We have been ranked number one for customer satisfaction amongst our high street peer group for three consecutive years4, and our lead over our nearest competitor has grown by two percentage points to 6.2%4 compared with the lead we reported at the year end (March 2014: 4.2%4). In addition, Which? magazine’s recent survey of banking customer service rated Nationwide as the highest ranked high street provider of retail financial services. Most recently, in Nunwood’s 2014 UK Customer Experience Excellence study Nationwide was the number one financial services high street brand and ranked eighth overall out of 263 brands. This contrasts with our established high street banking peers, none of whom made the top 50. Our success in service delivery is demonstrated by the fact that we account for only 2.9% of industry complaints despite our size, scale and volume of transactions. Moreover, when we do receive complaints we deal with them in a fair and open manner; of all cases referred to the Financial Ombudsman Service (FOS), 88% of our decisions are upheld, compared with an industry average of only 43%. Our commitment to service is mirrored by our focus on being a good corporate citizen. In April we were the first major high street brand to become a principal partner of the Living Wage Foundation, and we are proud to play our part in encouraging other organisations to raise the level of minimum pay across the economy. We also take our impact on the environment seriously and were the first financial services provider to be awarded the Carbon Trust Triple Standard. Delivering a digital Society for our members The financial services sector is evolving rapidly as customers demand more from providers in an increasingly digital and mobile age. The speed of change is evident - in July, just 20 months after its launch, we serviced more transactions on our mobile app than on our internet bank, which has been around since 1997. In June we added two innovative features to the app: Impulse Saver and Quick Balance. Impulse Saver encourages customers into the habit of saving small amounts in a fuss-free way and complements the ability to open new savings accounts via the app. Quick Balance allows members to check their account balances at the tap of a button, and to date this facility has been used over 17 million times. This year, we have commenced the roll out of contactless cards across our entire current account range. We have a range of developments planned for the next year, including a person to person mobile payments facility through Paym. Even more recently, in November we became the first UK financial services provider to bring real time balance access to Android Wear smartwatches. As the use of digital services grows, it becomes increasingly important that members have confidence in the security of our systems. I am pleased that our unceasing efforts in this area have led to Which? magazine rating us number one in their most recent test of online bank security.
4 Source: GfK NOP's Financial Research Survey (FRS) measure, as defined in the Glossary on page 107.
Nationwide Building Society – Interim Results
7
Our aim is to meet the needs of all members regardless of how they wish to interact with us especially those who are content with, or prefer, a more conventional ‘face to face’ approach in a branch. We remain committed to a high street branch presence, to the need to provide help and advice for our members and aim to create a consistent and seamless experience between telephone, branch, internet and mobile bank, under a single brand – Nationwide. We will continue to innovate and invest in our branches to improve the quality of service and create the right environment for our members as well as introduce new technology such as Nationwide Now, which allows real time person to person access via a high quality video link to mortgage and financial consultants. This increases our overall capacity and allows us to provide a level of service not previously available in our smaller branches. Market conditions We have seen an increase in competitive activity in the first half of this year across most products and services, especially in the mortgage, savings and current account markets. This reflects an element of repositioning within the banking community, with more emphasis being placed on retail banking activities. We remain confident in our ability to meet this competition ‘head on’ and to maintain our market share positioning as a top three savings and mortgage provider in the UK and, in the case of personal current accounts, growing our market share to match the levels we hold for mortgages and savings. As at 30 September 2014, our market share of mortgages and savings stock was 11.9% and 10.6% respectively. A major change within the savings market has been the much needed and welcome introduction of the new ISA regime, with an increase in individual limits to £15,000 from 1 July and the ability to transfer from equity ISAs into a cash ISA. With prevailing market interest rates continuing to drift downwards, savers have sought to take advantage of the new tax-free limits, with a significant flow of existing balances from non-ISA to ISA accounts. We expect the ‘pensioner bonds’ to be provided by National Savings and Investment, as announced by the Chancellor in this year’s budget statement, to affect our savings flows when they become available in January next year but we recognise their importance for hard pressed savers. The Competition and Market Authority has recently confirmed that it will conduct an investigation into the personal current account and SME banking markets. We will engage constructively with the CMA as part of its investigation and we welcome any initiative which improves competition and customer choice. This is particularly important given our strategic desire to grow our market share of personal current accounts and position ourselves as an alternative to the established banks. Supporting the housing market During the first half of the year we have continued to support the mortgage market, with gross lending of £13.1 billion (H1 2013/14: £14.0 billion) and net lending of £3.6 billion (H1 2013/14: £5.6 billion). We accounted for 12.2% of all gross lending and 24.8% of all net lending, both ahead of our par market shares. We have continued to offer significant support to first time buyers, helping 23,800 people to take their first step on the housing ladder. We have been a strong supporter of the Government’s Help to Buy shared equity scheme, accounting for around a third of all cases. Our own Save to Buy product also continues to be popular; over the six months we lent over £178 million to borrowers using this innovative product. We recognise that a growing number of customers are seeking certainty over the level of their mortgage payments and the security of access to long term credit; in response, we launched a market-leading ten year fixed rate mortgage in October. In addition, we continue to reward our existing mortgage members; in early October we introduced our Loyalty Rate Mortgages initiative, guaranteeing that for any of our existing mortgage members coming to the end of their existing deal and looking for a new one, we will have a product for them that will be the best available on the high street from our peer group lenders.
Nationwide Building Society – Interim Results
8
Rewarding savers in a low interest rate environment We are very aware of the difficulties that savers have been facing in recent years, with rates across the market dropping to unprecedented lows. Despite this backdrop, we have increased our member deposit balances by £3.5 billion in the first six months of the year by offering competitive propositions to our members. Our Loyalty Saver account, which rewards members with higher interest rates depending on their length of membership, has grown to be our most popular proposition, and over 970,000 members benefit from this exclusive product. We have also seen significant new savings flows and transfers into our ISA range, as customers have taken the opportunity to maximise the tax advantages offered through the recent increase in ISA limits, for which we long campaigned. Over the six month period, we accounted for 20.7% of the market change in ISA balances. A current account range designed to support our members’ needs We have a strategic target of gaining a 10% market share of the personal current account market, and over the first half of the year we have taken our market share to 6.6% (H1 2013/14: 6.0%). We have been a keen supporter and beneficiary of the drive to make account switching quicker and easier, averaging a 9.0% share of all account switching in the period, compared with 8.7% in the six months to March 2014. The quality of our product range has been recognised by Your Money, which rated Nationwide as the Best Online Current Account Provider, and by Which? magazine, which assessed FlexPlus as the best packaged current account on the market. To broaden our current account offering we have recently added FlexOne, an account designed specifically for the youth market. FlexOne offers a contactless debit card, is supported by our mobile app, provides access to an exclusive regular savings account and offers a discount card for use at selected cinemas. FlexOne is also supported by educational material to help young people come to terms with using a current account for the first time. There are no fees or charges attaching to this account. The launch of FlexOne is a further example of the benefit we are deriving from our recent investment in upgrading our banking infrastructure, and the quality of the product is clear; within a month of launch, it came top in the Which? best children’s bank account table. It is our aim to help our customers with their financial needs throughout the different stages of their lives. Our unsecured borrowing products, personal loans and credit cards, help to service those needs and we have continued to expand our presence in these areas. During the past six months we opened over 100,000 new credit card accounts and our personal loan gross lending was over £400 million. A strong financial performance We have delivered a financial performance which demonstrates the strength of our business. Our underlying profits are up 83% at £606 million (H1 2013/14: £332 million), while statutory profit has risen by 113% to £598 million (H1 2013/14: £281 million). Underlying cost income ratio has fallen to 50.2%, down from 52.8% in the first half of last year. It is important that the Society remains financially sound, secure and sustainable. This level of profitability allows us to meet regulatory prudential requirements, especially relating to levels of capital and liquidity, as well as an ongoing programme of investment in our products and service. Since the start of the financial year our Common Equity Tier 1 (CET1) and leverage ratios have risen by 310bps and 40bps to 17.6% and 3.8% respectively, with the strength of our balance sheet supported by the improving profitability and the sale of legacy treasury assets and commercial property assets. We maintain a ‘low risk’ approach to our lending activities ensuring the overall quality of our balance sheet. The incidence of arrears in our residential loan portfolios is very low, with accounts more than three months in arrears being only 0.55% and considerably better than the industry average of 1.42% (CML, 30 September 2014).

Nationwide Building Society – Interim Results
9
Regulation Nationwide supports good regulation and consumer rights and seeks to be an exemplar organisation for the good. Indeed, we were the first to introduce free banking in 1987, we campaigned in the mid-1990s for the free use of ATMs and, in recent years, we led the industry’s call for reform of the ISA system. We believe that regulation should be proportionate and should seek to balance the need to deliver financial stability and customer protection, with ensuring that firms are able to invest sufficiently to deliver innovative systems, products and services for their customers. On 31 October the Financial Policy Committee announced its recommendations for the role of the leverage ratio within the regulatory capital framework for UK banks and building societies. We believe that the proposals are the basis for a sensible approach and are confident that the Group will comfortably meet the requirements as they are introduced. We were pleased that in his letter to the Governor of the Bank of England, the Chancellor urged that the capital regulation should consider levels of lending to the real economy, maintain a diversity of business models in financial services and, most importantly, take into account the impact on low risk lenders such as building societies. Outlook As we look ahead to the remainder of the year, we do so against a background which has seen unemployment falling sharply and the economy growing at an annual rate of around 3%. However, with few signs that inflationary pressures are building, and renewed concerns about a slowdown in the Eurozone, we do not expect the Bank of England base rate to rise before the start of our next financial year, with future rises being gradual in nature and settling below pre-crisis levels. The UK housing market staged a strong recovery in the latter half of 2013 and into 2014 and, at a national level, house prices are above their pre-recession peak. It appears likely that the pace of annual price increases peaked in the summer, with recent housing market indicators suggesting that things have begun to slow down. Indeed, the latest Nationwide House Price Index showed that in October the annual rate of growth slowed from 9.4% to 9%. However, the market continues to be supported by a strong labour market, low mortgage rates and a demand for housing, which should maintain mortgage quality and prevent any dramatic slowdown in the housing market. Over the past two years the improvement in our financial performance reflects a combination of lower impairment costs and the realignment of net interest margins; the latter is due to a downward shift in funding costs as competition for retail savings balances has subsided, and the ongoing process of asset repricing to reflect new market norms. This market realignment is largely complete and we do not expect to see further material changes in our interest margins over the remainder of the financial year. Our mutual heritage, scale of operation and quality of service position Nationwide to be a real and meaningful alternative to the established banks. We remain confident that we can sustain our strong business performance and maintain our capital strength in line with our commitment to safeguard the interests of our members.
Nationwide Building Society – Interim Results
10
FINANCIAL REVIEW
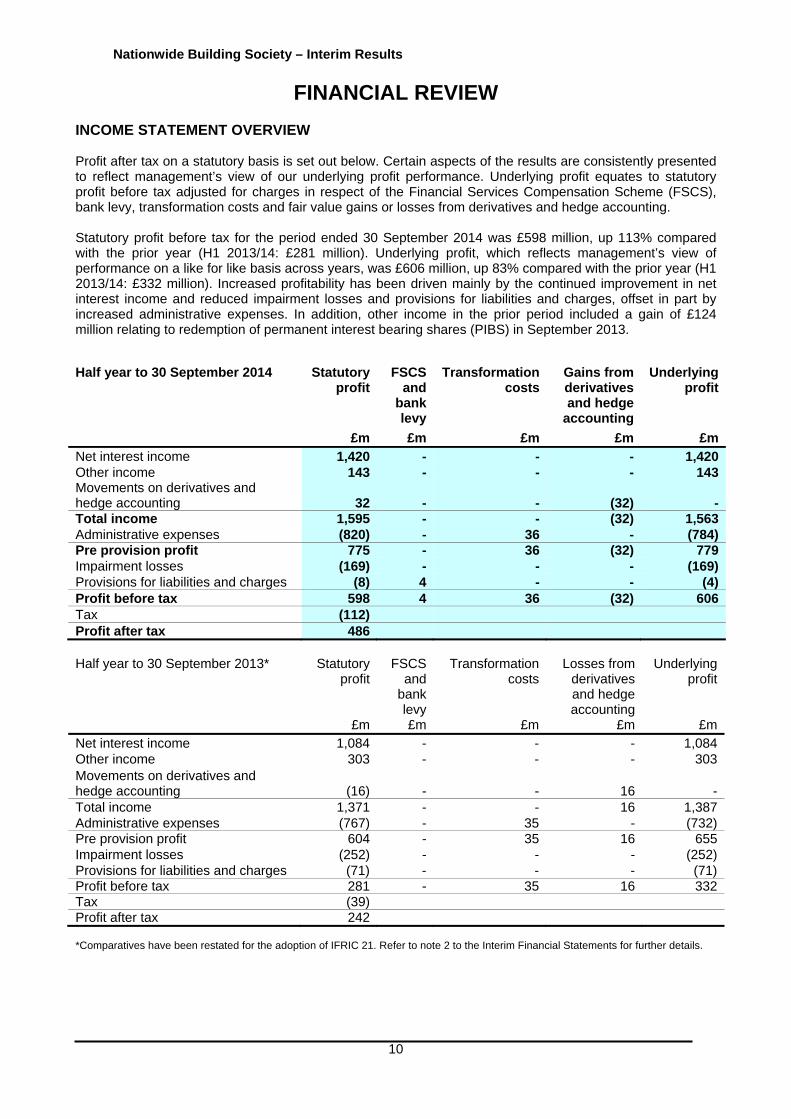
INCOME STATEMENT OVERVIEW Profit after tax on a statutory basis is set out below. Certain aspects of the results are consistently presented to reflect management’s view of our underlying profit performance. Underlying profit equates to statutory profit before tax adjusted for charges in respect of the Financial Services Compensation Scheme (FSCS), bank levy, transformation costs and fair value gains or losses from derivatives and hedge accounting. Statutory profit before tax for the period ended 30 September 2014 was £598 million, up 113% compared with the prior year (H1 2013/14: £281 million). Underlying profit, which reflects management’s view of performance on a like for like basis across years, was £606 million, up 83% compared with the prior year (H1 2013/14: £332 million). Increased profitability has been driven mainly by the continued improvement in net interest income and reduced impairment losses and provisions for liabilities and charges, offset in part by increased administrative expenses. In addition, other income in the prior period included a gain of £124 million relating to redemption of permanent interest bearing shares (PIBS) in September 2013. Half year to 30 September 2014 Statutory
profitFSCS
and bank levy
Transformationcosts
Gains from derivatives and hedge
accounting
Underlying profit
£m £m £m £m £mNet interest income 1,420 - - - 1,420Other income 143 - - - 143Movements on derivatives and hedge accounting 32 - - (32) -Total income 1,595 - - (32) 1,563Administrative expenses (820) - 36 - (784)Pre provision profit 775 - 36 (32) 779Impairment losses (169) - - - (169)Provisions for liabilities and charges (8) 4 - - (4)Profit before tax 598 4 36 (32) 606Tax (112) Profit after tax 486 Half year to 30 September 2013*
Statutory profit
FSCS and
bank levy
Transformation costs
Losses from derivatives and hedge accounting
Underlying profit
£m £m £m £m £mNet interest income 1,084 - - - 1,084Other income 303 - - - 303Movements on derivatives and hedge accounting (16)
-
-
16 -
Total income 1,371 - - 16 1,387Administrative expenses (767) - 35 - (732)Pre provision profit 604 - 35 16 655Impairment losses (252) - - - (252)Provisions for liabilities and charges (71) - - - (71)Profit before tax 281 - 35 16 332Tax (39) Profit after tax 242 *Comparatives have been restated for the adoption of IFRIC 21. Refer to note 2 to the Interim Financial Statements for further details.
Nationwide Building Society – Interim Results
11
Net interest income Half year to 30 September
2014 £m
Half year to 30 September
2013 £m
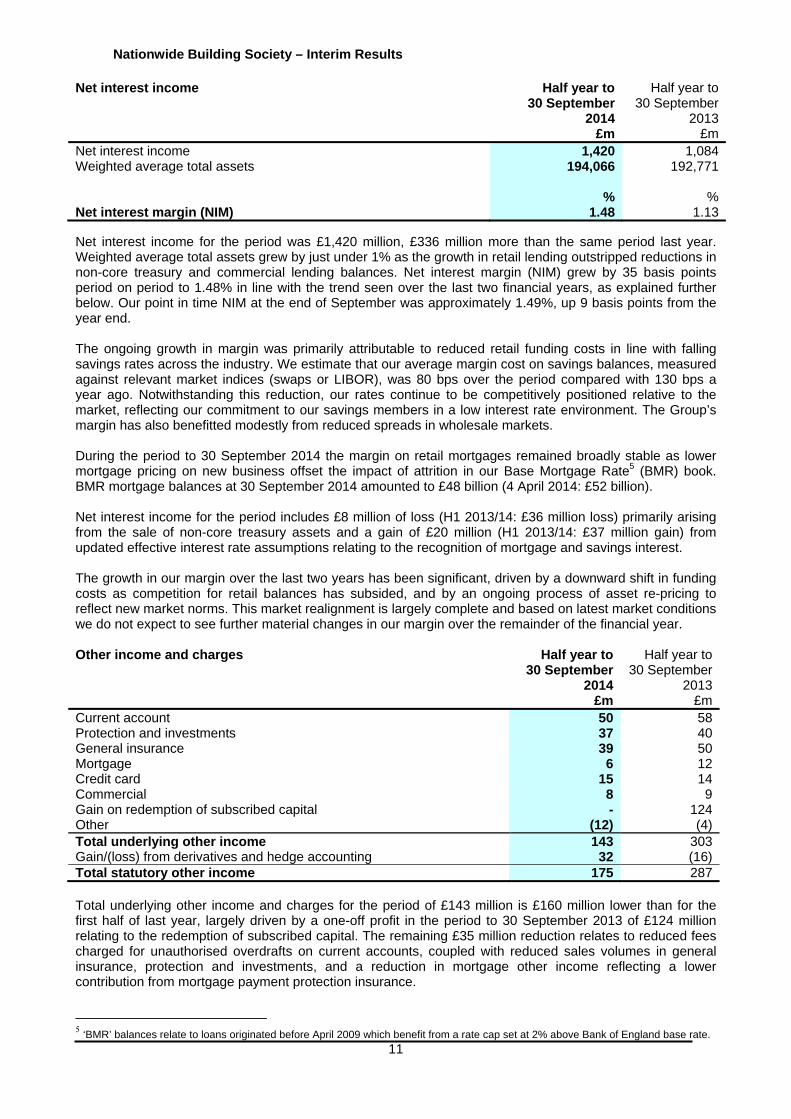
Net interest income 1,420 1,084Weighted average total assets 194,066 192,771 % %Net interest margin (NIM) 1.48 1.13 Net interest income for the period was £1,420 million, £336 million more than the same period last year. Weighted average total assets grew by just under 1% as the growth in retail lending outstripped reductions in non-core treasury and commercial lending balances. Net interest margin (NIM) grew by 35 basis points period on period to 1.48% in line with the trend seen over the last two financial years, as explained further below. Our point in time NIM at the end of September was approximately 1.49%, up 9 basis points from the year end. The ongoing growth in margin was primarily attributable to reduced retail funding costs in line with falling savings rates across the industry. We estimate that our average margin cost on savings balances, measured against relevant market indices (swaps or LIBOR), was 80 bps over the period compared with 130 bps a year ago. Notwithstanding this reduction, our rates continue to be competitively positioned relative to the market, reflecting our commitment to our savings members in a low interest rate environment. The Group’s margin has also benefitted modestly from reduced spreads in wholesale markets. During the period to 30 September 2014 the margin on retail mortgages remained broadly stable as lower mortgage pricing on new business offset the impact of attrition in our Base Mortgage Rate5 (BMR) book. BMR mortgage balances at 30 September 2014 amounted to £48 billion (4 April 2014: £52 billion). Net interest income for the period includes £8 million of loss (H1 2013/14: £36 million loss) primarily arising from the sale of non-core treasury assets and a gain of £20 million (H1 2013/14: £37 million gain) from updated effective interest rate assumptions relating to the recognition of mortgage and savings interest. The growth in our margin over the last two years has been significant, driven by a downward shift in funding costs as competition for retail balances has subsided, and by an ongoing process of asset re-pricing to reflect new market norms. This market realignment is largely complete and based on latest market conditions we do not expect to see further material changes in our margin over the remainder of the financial year. Other income and charges
Half year to 30 September
2014 £m
Half year to 30 September
2013 £m
Current account 50 58Protection and investments 37 40General insurance 39 50Mortgage 6 12Credit card 15 14Commercial 8 9Gain on redemption of subscribed capital - 124Other (12) (4)Total underlying other income 143 303Gain/(loss) from derivatives and hedge accounting 32 (16)Total statutory other income 175 287 Total underlying other income and charges for the period of £143 million is £160 million lower than for the first half of last year, largely driven by a one-off profit in the period to 30 September 2013 of £124 million relating to the redemption of subscribed capital. The remaining £35 million reduction relates to reduced fees charged for unauthorised overdrafts on current accounts, coupled with reduced sales volumes in general insurance, protection and investments, and a reduction in mortgage other income reflecting a lower contribution from mortgage payment protection insurance.
5 ‘BMR’ balances relate to loans originated before April 2009 which benefit from a rate cap set at 2% above Bank of England base rate.
Nationwide Building Society – Interim Results
12
Details of fair value losses relating to derivatives and hedge accounting are provided in note 6 of the Interim Financial Statements. Administrative expenses
Half year to 30 September
2014
Half year to 30 September
2013 (note i) £m £mEmployee costs 327 308Other administrative expenses 316 295Depreciation and amortisation 141 129Total underlying administrative expenses 784 732Transformation costs (note ii) 36 35Total statutory administrative expenses 820 767 % %Cost income ratio – underlying basis 50.2 52.8Cost income ratio – statutory basis 51.4 55.9
Notes:
i. Comparatives have been restated for the adoption of IFRIC 21. Refer to note 2 to the Interim Financial Statements for further details.
ii. Transformation costs include elements of employee costs, other administrative expenses and depreciation.
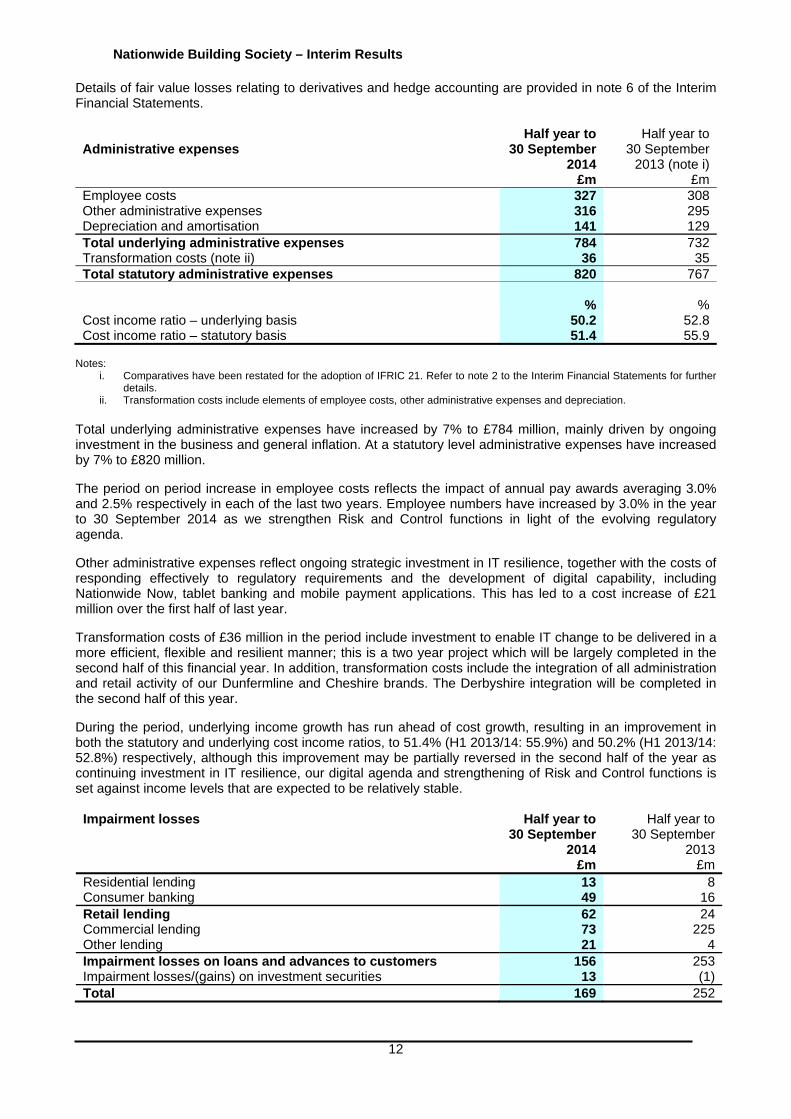
Total underlying administrative expenses have increased by 7% to £784 million, mainly driven by ongoing investment in the business and general inflation. At a statutory level administrative expenses have increased by 7% to £820 million.
The period on period increase in employee costs reflects the impact of annual pay awards averaging 3.0% and 2.5% respectively in each of the last two years. Employee numbers have increased by 3.0% in the year to 30 September 2014 as we strengthen Risk and Control functions in light of the evolving regulatory agenda.
Other administrative expenses reflect ongoing strategic investment in IT resilience, together with the costs of responding effectively to regulatory requirements and the development of digital capability, including Nationwide Now, tablet banking and mobile payment applications. This has led to a cost increase of £21 million over the first half of last year.
Transformation costs of £36 million in the period include investment to enable IT change to be delivered in a more efficient, flexible and resilient manner; this is a two year project which will be largely completed in the second half of this financial year. In addition, transformation costs include the integration of all administration and retail activity of our Dunfermline and Cheshire brands. The Derbyshire integration will be completed in the second half of this year.
During the period, underlying income growth has run ahead of cost growth, resulting in an improvement in both the statutory and underlying cost income ratios, to 51.4% (H1 2013/14: 55.9%) and 50.2% (H1 2013/14: 52.8%) respectively, although this improvement may be partially reversed in the second half of the year as continuing investment in IT resilience, our digital agenda and strengthening of Risk and Control functions is set against income levels that are expected to be relatively stable.
Impairment losses Half year to 30 September
2014 £m
Half year to 30 September
2013 £m
Residential lending 13 8Consumer banking 49 16Retail lending 62 24Commercial lending 73 225Other lending 21 4Impairment losses on loans and advances to customers 156 253Impairment losses/(gains) on investment securities 13 (1)Total 169 252
Nationwide Building Society – Interim Results
13
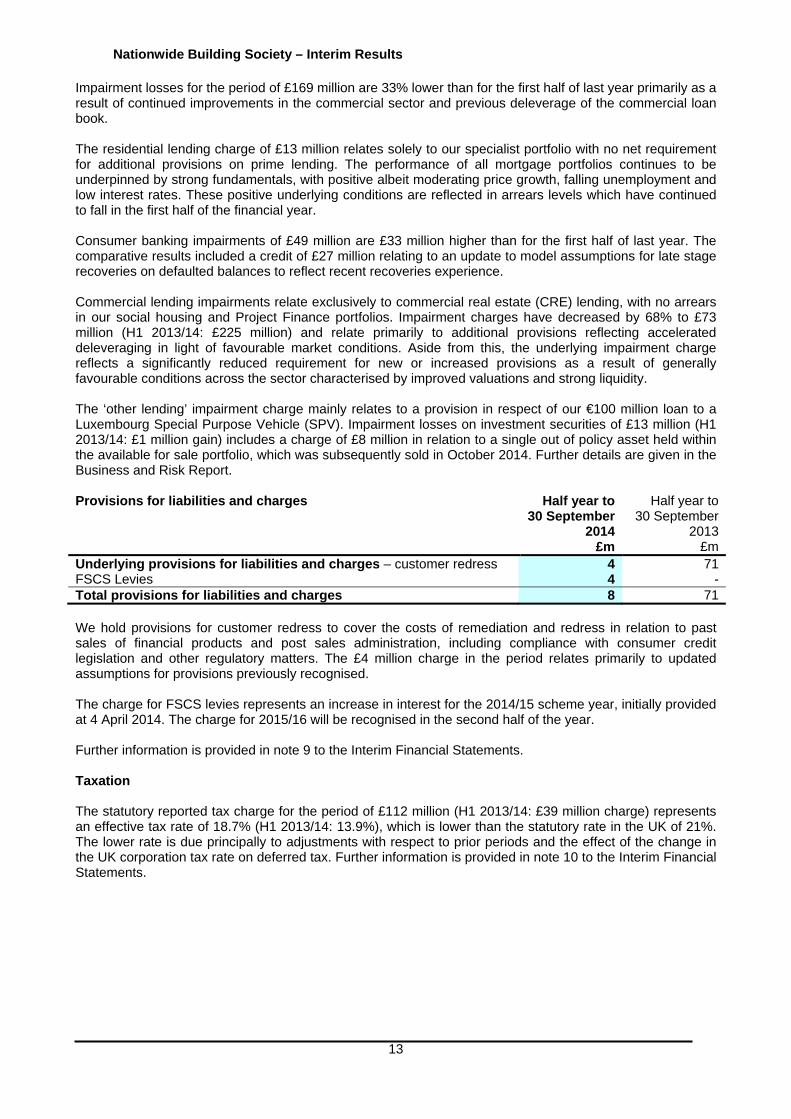
Impairment losses for the period of £169 million are 33% lower than for the first half of last year primarily as a result of continued improvements in the commercial sector and previous deleverage of the commercial loan book. The residential lending charge of £13 million relates solely to our specialist portfolio with no net requirement for additional provisions on prime lending. The performance of all mortgage portfolios continues to be underpinned by strong fundamentals, with positive albeit moderating price growth, falling unemployment and low interest rates. These positive underlying conditions are reflected in arrears levels which have continued to fall in the first half of the financial year. Consumer banking impairments of £49 million are £33 million higher than for the first half of last year. The comparative results included a credit of £27 million relating to an update to model assumptions for late stage recoveries on defaulted balances to reflect recent recoveries experience. Commercial lending impairments relate exclusively to commercial real estate (CRE) lending, with no arrears in our social housing and Project Finance portfolios. Impairment charges have decreased by 68% to £73 million (H1 2013/14: £225 million) and relate primarily to additional provisions reflecting accelerated deleveraging in light of favourable market conditions. Aside from this, the underlying impairment charge reflects a significantly reduced requirement for new or increased provisions as a result of generally favourable conditions across the sector characterised by improved valuations and strong liquidity. The ‘other lending’ impairment charge mainly relates to a provision in respect of our €100 million loan to a Luxembourg Special Purpose Vehicle (SPV). Impairment losses on investment securities of £13 million (H1 2013/14: £1 million gain) includes a charge of £8 million in relation to a single out of policy asset held within the available for sale portfolio, which was subsequently sold in October 2014. Further details are given in the Business and Risk Report.
Provisions for liabilities and charges
Half year to 30 September
2014 £m
Half year to 30 September
2013 £m
Underlying provisions for liabilities and charges – customer redress 4 71FSCS Levies 4 -Total provisions for liabilities and charges 8 71 We hold provisions for customer redress to cover the costs of remediation and redress in relation to past sales of financial products and post sales administration, including compliance with consumer credit legislation and other regulatory matters. The £4 million charge in the period relates primarily to updated assumptions for provisions previously recognised. The charge for FSCS levies represents an increase in interest for the 2014/15 scheme year, initially provided at 4 April 2014. The charge for 2015/16 will be recognised in the second half of the year. Further information is provided in note 9 to the Interim Financial Statements. Taxation The statutory reported tax charge for the period of £112 million (H1 2013/14: £39 million charge) represents an effective tax rate of 18.7% (H1 2013/14: 13.9%), which is lower than the statutory rate in the UK of 21%. The lower rate is due principally to adjustments with respect to prior periods and the effect of the change in the UK corporation tax rate on deferred tax. Further information is provided in note 10 to the Interim Financial Statements.

Nationwide Building Society – Interim Results
14
BALANCE SHEET ASSETS 30 September
2014 £m %
4 April 2014*
£m % Residential mortgages 149,302 88 145,660 87Commercial lending 16,407 10 18,164 11Consumer banking and other lending 3,961 2 4,005 2 169,670 100 167,829 100Impairment provision (1,123) (1,288)Loans and advances to customers 168,547 166,541Other financial assets 25,824 21,285Other non-financial assets 2,251 2,067Total assets 196,622 189,893 Asset quality Residential mortgages: % % Proportion of residential mortgage accounts 3 months+ in arrears 0.55 0.63 Average indexed loan to value (LTV) of residential mortgage book
(by volume) 46 48 Commercial property finance: £m £m Total CRE gross balances 5,872 7,764 Impaired balances 2,187 3,065 Total provision as a % of impaired balances 36% 33% *Comparative balances have been restated for the reclassification of certain amounts in relation to overdrawn current accounts as detailed in note 2 to the interim financial statements. Residential mortgages Residential mortgages include prime and specialist loans, with the specialist portfolio primarily comprising buy to let (BTL) lending. Gross mortgage lending in the period was £13.1 billion (H1 2013/14: £14.0 billion), representing a market share of 12.2% (H1 2013/14: 15.4%). Total lending in the period reflected a recent flattening of the housing market, actions taken to moderate new mortgage applications during the implementation of the Mortgage Market Review to ensure customer service experience was maintained, and a more aggressive competitive environment. At 12.2% our market share of new business is slightly ahead of our market share of stock of 11.9% (4 April 2014: 11.7%). Mortgage balances grew by £3.6 billion, of which £2.8 billion was prime lending and £0.8 billion related to BTL. The loan to value (LTV) profile of new lending, weighted by volume, reduced to 67% (H1 2013/14: 69%). The rise in house prices has continued in the period, reducing the average LTV of the portfolio at 30 September 2014 to 46% (4 April 2014: 48%). Our residential mortgage arrears were 0.55% at 30 September 2014 (4 April 2014: 0.63%) and continue to be significantly lower than the Council of Mortgage Lenders (CML) industry average. The level of impaired balances fell by £141 million to £1,014 million (4 April 2014: £1,155 million) reflecting these lower arrears. Impairment provisions have fallen by £14 million to £88 million (4 April 2014: £102 million) reflecting both higher house prices and lower arrears and represent 8.7% of impaired balances (4 April 2014: 8.8%). Commercial lending Commercial lending includes commercial real estate (CRE) loans of £5.9 billion (4 April 2014: £7.8 billion), loans to housing associations of £8.1 billion (4 April 2014: £8.1 billion) and a portfolio of loans made under the Government’s Project Finance initiative amounting to £1.4 billion (4 April 2014: £1.4 billion). The balance sheet total for commercial lending quoted above includes £1.0 billion (4 April 2014: £0.9 billion) of fair value adjustments relating to loans where we have hedged associated financial risks, typically interest rate risk.

Nationwide Building Society – Interim Results
15
We have undertaken minimal amounts of new lending during the period, with activity being concentrated on ongoing management of the existing portfolio with particular focus on the managed work out of weak and distressed CRE exposures, and the acceleration of deleverage plans where market conditions allow. During the period we have sold over £0.7 billion of non-UK CRE loans, which has reduced our outstanding exposure to total non-UK CRE loans to £13 million. In addition, we have reduced other CRE exposures by a further £1.2 billion through repayment and managed workout. The level of impaired balances as a proportion of our total CRE exposure has fallen from 39% to 37%, reflecting deleveraging of impaired assets. Total provision coverage against impaired balances has increased from 33% to 36% reflecting the disposal of the impaired German loan book and a decision to accelerate further deleveraging of non-performing CRE assets in the current favourable market. Consumer banking and other lending Consumer banking comprises retail balances relating to personal loans of £1.8 billion (4 April 2014: £1.9 billion), credit cards of £1.8 billion (4 April 2014: £1.7 billion) and current account overdrafts of £0.2 billion (4 April 2014: £0.3 billion). Other lending of £0.1 billion relates to two portfolios of European business loans originated and managed by our Treasury Division (4 April 2014: £0.2 billion). Unsecured lending through personal loans has been lower in the period following a tightening of our lending criteria and increased competition in the market. Credit card lending continues to grow reflecting increased growth in consumer borrowing over the period. Delinquency within unsecured portfolios remains stable. Further details of our lending and lending risks are provided in the Business and Risk Report. Other financial assets Other financial assets total £25.8 billion (4 April 2014: £21.3 billion) and comprise liquidity and investment assets held by our Treasury Division amounting to £22.3 billion (4 April 2014: £18.0 billion), derivatives with positive fair values of £3.3 billion (4 April 2014: £3.0 billion) and fair value adjustments and other assets of £0.2 billion (4 April 2014: £0.3 billion). The increase in liquidity and investment assets reflects pre-funding of certain short dated maturities and our commitment to maintain a Liquidity Coverage Ratio (LCR) in excess of 100% in advance of the regulatory requirement to do so from October 2015. As at 30 September 2014 our LCR has increased to 102.3% (4 April 2014: 90.7%). Further details of our treasury portfolios are included in the Business and Risk Report, which discusses treasury assets, liquidity and financial risks. LIABILITIES 30 September
2014 £m
4 April 2014*
£mMember deposits 133,978 130,468Debt securities in issue 29,506 28,557Other financial liabilities 22,283 20,621Other liabilities 1,487 1,341Total liabilities 187,254 180,987Members’ interests and equity 9,368 8,906Total members’ interests, equity and liabilities 196,622 189,893 Key ratios % %Primary liquidity ratio 13.3 11.9Wholesale funding ratio 20.7 19.6 *Comparative balances have been restated for the reclassification of certain amounts in relation to overdrawn current accounts as detailed in note 2 to the Interim Financial Statements.
Nationwide Building Society – Interim Results
16
Member deposits Member deposits increased by £3.5 billion to £134.0 billion due to retail inflows and capitalised interest of £0.9 billion on member accounts. In the period to 30 September 2014 we attracted total retail inflows, including non-member balances (categorised within other financial liabilities above), of £3.0 billion (full year 2013/14: £2.9 billion). Our market share of deposit balance movements was 13.8% (full year 2013/14: 12.1%). Debt securities in issue Debt securities in issue of £29.5 billion (4 April 2014: £28.6 billion) are used to raise funding in wholesale markets to finance core activities. The increase in outstanding amounts at 30 September 2014 reflects increased issuance activity in the wholesale markets in the first half of the year to pre-fund wholesale funding maturities in the second half of the year, consistent with our target of maintaining a strong liquidity position ahead of regulatory requirements. The wholesale funding ratio has increased to 20.7% (4 April 2014: 19.6%), reflecting the wholesale issuance activity described above. Off-balance sheet Funding for Lending Scheme (FLS) drawings totalling £8.5 billion are unchanged from the year end and are excluded from the calculation of the wholesale funding ratio. Further details on funding and liquidity are included in the Business and Risk Report. Other financial liabilities Other financial liabilities include customer and bank deposits of £16.7 billion (4 April 2014: £15.3 billion), PIBS of £0.6 billion (4 April 2014: £0.6 billion), subordinated debt of £2.2 billion (4 April 2014: £2.3 billion) and derivatives and fair value adjustments of £2.8 billion (4 April 2014: £2.4 billion). Derivatives and fair value adjustments largely comprise interest rate and other derivatives taken out to hedge our core lending and funding activities. More details are given in the Business and Risk Report.
Nationwide Building Society – Interim Results
17
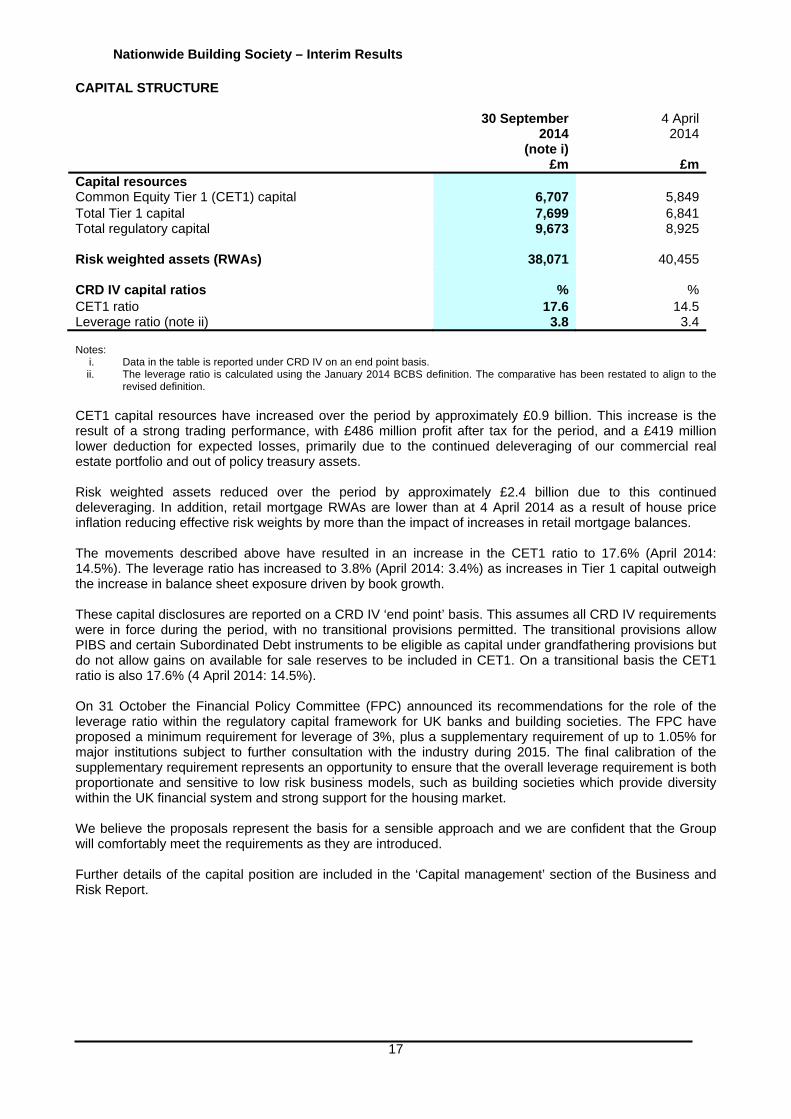
CAPITAL STRUCTURE 30 September
2014 (note i)
£m
4 April 2014
£mCapital resources Common Equity Tier 1 (CET1) capital 6,707 5,849Total Tier 1 capital 7,699 6,841Total regulatory capital 9,673 8,925 Risk weighted assets (RWAs)
38,071
40,455
CRD IV capital ratios % %CET1 ratio Leverage ratio (note ii)
17.6 3.8
14.5 3.4
Notes:
i. Data in the table is reported under CRD IV on an end point basis. ii. The leverage ratio is calculated using the January 2014 BCBS definition. The comparative has been restated to align to the
revised definition. CET1 capital resources have increased over the period by approximately £0.9 billion. This increase is the result of a strong trading performance, with £486 million profit after tax for the period, and a £419 million lower deduction for expected losses, primarily due to the continued deleveraging of our commercial real estate portfolio and out of policy treasury assets. Risk weighted assets reduced over the period by approximately £2.4 billion due to this continued deleveraging. In addition, retail mortgage RWAs are lower than at 4 April 2014 as a result of house price inflation reducing effective risk weights by more than the impact of increases in retail mortgage balances. The movements described above have resulted in an increase in the CET1 ratio to 17.6% (April 2014: 14.5%). The leverage ratio has increased to 3.8% (April 2014: 3.4%) as increases in Tier 1 capital outweigh the increase in balance sheet exposure driven by book growth. These capital disclosures are reported on a CRD IV ‘end point’ basis. This assumes all CRD IV requirements were in force during the period, with no transitional provisions permitted. The transitional provisions allow PIBS and certain Subordinated Debt instruments to be eligible as capital under grandfathering provisions but do not allow gains on available for sale reserves to be included in CET1. On a transitional basis the CET1 ratio is also 17.6% (4 April 2014: 14.5%). On 31 October the Financial Policy Committee (FPC) announced its recommendations for the role of the leverage ratio within the regulatory capital framework for UK banks and building societies. The FPC have proposed a minimum requirement for leverage of 3%, plus a supplementary requirement of up to 1.05% for major institutions subject to further consultation with the industry during 2015. The final calibration of the supplementary requirement represents an opportunity to ensure that the overall leverage requirement is both proportionate and sensitive to low risk business models, such as building societies which provide diversity within the UK financial system and strong support for the housing market. We believe the proposals represent the basis for a sensible approach and we are confident that the Group will comfortably meet the requirements as they are introduced. Further details of the capital position are included in the ‘Capital management’ section of the Business and Risk Report.

Nationwide Building Society – Interim Results
18
BUSINESS AND RISK REPORT
All disclosures in this section (pages 18 to 71) are unaudited except tables marked as audited.
Introduction Overview This Business and Risk Report explains the Group’s business, the risks it is exposed to and how it manages those risks. Where there has been no change to Nationwide’s approach to managing its risks, or there has been no material change to the relevant risk environment from that disclosed at year end, then this information has not been repeated in the 2014/15 Interim Results and can be found in the Business and Risk Report in the Annual Report and Accounts 2014. The Group is organised into three business streams: Retail, Commercial and Head Office functions. The Group is predominantly a retail focused operation which trades almost exclusively within the UK, with the exception of wholesale funding and liquidity management activities. Wholesale funding is accessed by the Group from both UK and overseas markets. The Group's liquidity position is actively managed from the UK.
Retail Commercial Head office (including Treasury)
Prime residential lending
Specialist residential lending
Consumer banking
Savings products Insurance Investments
Commercial real estate lending
Social housing lending
Project Finance lending
Treasury including funding, liquidity and market risk management
Head office functions
Central support functions
Nationwide Group
£m Credit risk 21,239 Operational risk 3,542 Market risk -
£m Credit risk 8,284 Operational risk 111 Market risk -
£m Credit risk 4,749 Operational risk 109 Market risk 37
Operating segment
Activities
Regulatory risk weighted assets as at 30 September 2014

Nationwide Building Society – Interim Results
19
Introduction (continued)
Principal risks Whilst the Group accepts that all business activities involve risk, it seeks to protect members by actively managing the risks that arise from business activities. The principal risks inherent within the business are:
Risk category
Definition
Lending The risk that a borrower or counterparty fails to pay interest or to repay principal on a loan or other financial instrument (e.g. a bond) on time. Lending risk also encompasses extension risk and concentration risk.
Financial
The risk of the Group having inadequate earnings, cash flow or capital to meet current or future requirements and expectations. It includes loss or damage to the earnings capacity, market value or liquidity of the Group, arising from mismatches between the Group’s assets, funding and other commitments, which may be exposed by changes in market rates, market conditions or the Group’s own credit profile.
Operational The risk of loss resulting from inadequate or failed internal processes, people and systems or from external events.
Customer and compliance
The risk that the organisation fails to design and implement operational arrangements, systems and controls such that it can maintain legal and regulatory compliance, deliver fair customer outcomes and achieve a positive experience for customers.
Strategic The risk of significant loss or damage arising from business decisions that impact the long-term interests of the membership, or from an inability to adapt to external developments.
Current top and emerging risks Within the above inherent principal risk categories, the Group’s top and emerging risks are identified through the process outlined in the ‘Risk governance’ section of the Annual Report and Accounts 2014 and are closely tracked within the governance structure. The top and emerging risks remain as outlined in the Annual Report and Accounts 2014 except for the changes set out below:
IT resilience The implementation of new systems, alongside the maintenance of legacy systems, introduces operational complexity. At the same time, the financial services sector is seeing increased expectations of an ‘always on’ 24/7 service, and lower tolerance of system unavailability. We are also seeing rapid increases in activity through digital channels as customers increasingly take advantage of the convenience offered by these services. Taken together, these factors along with experiences of resilience issues in the wider sector mean that IT resilience is acknowledged as a current top risk. The Group has planned activities and investments to improve resilience. These include enhancements to infrastructure and the development of stand in processes that can operate whilst systems are unavailable, enabling the Group to minimise the impact to customers of incidents or planned changes.
Cyber threats
The Group recognises the increased threat of cyber attacks being faced across the financial sector in general. The Group continues to ensure it has an appropriate capability to detect and respond to cyber security issues effectively, safeguarding the organisation and its customers.

Nationwide Building Society – Interim Results
20
Current top and emerging risks (continued)
Housing market
Despite positive overall movement in asset values over the last six months, some recent signs of slowing momentum in the housing market have added a note of caution to our view of the market. If confidence and momentum in the housing market should weaken, property values may be adversely affected which could, in turn, affect Group performance.
Lack of growth in the Eurozone overshadows UK economy Confidence in the Eurozone remains fragile, as evidenced by financial market volatility in mid-October. Whilst it has lower direct exposure to Europe due to deleveraging such exposures in recent years, the Group remains indirectly exposed in the event that Eurozone stagnation results in lower interest rates in the UK for longer.
Business and risk review The following sections contain more detailed analysis of the Group’s business, with particular focus on balance sheet items, and provide further information regarding the management and mitigation of the principal and current top and emerging risks. This review covers:
loans and advances and lending risks financial risk management capital management operational risk management customer and compliance risk management
Details relating to strategic risk management and risk governance are provided in the Annual Report and Accounts 2014.
Nationwide Building Society – Interim Results
21
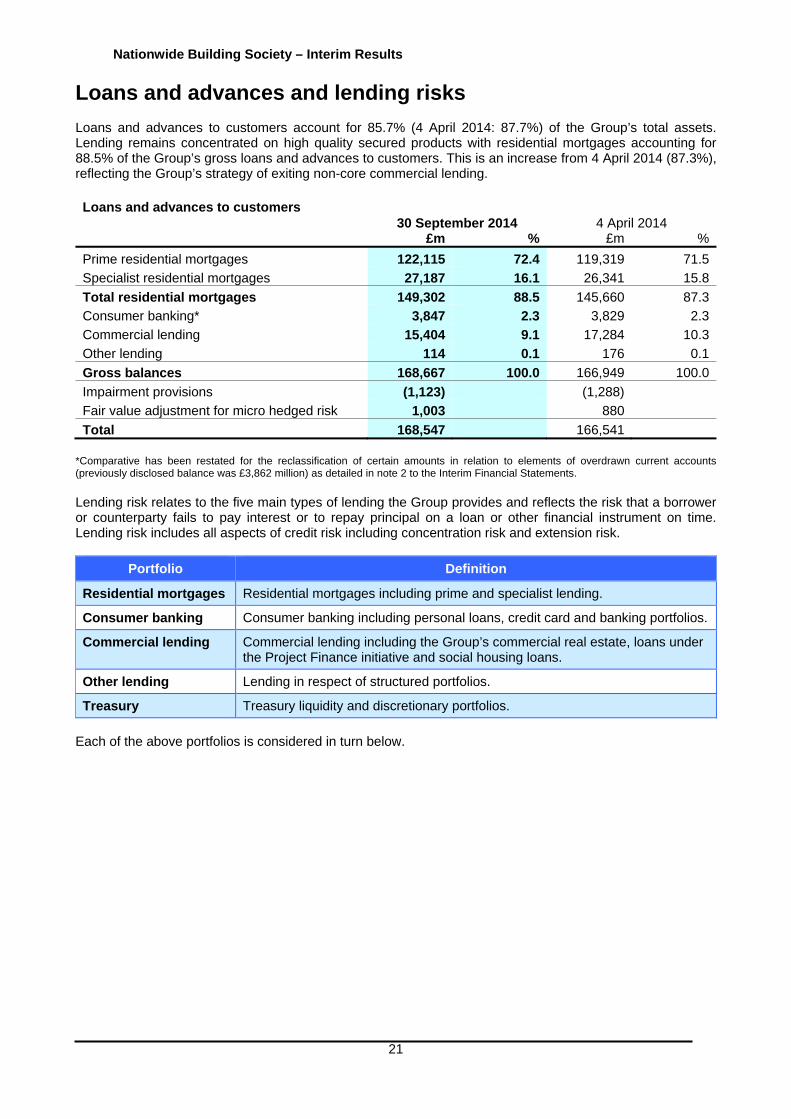
Loans and advances and lending risks Loans and advances to customers account for 85.7% (4 April 2014: 87.7%) of the Group’s total assets. Lending remains concentrated on high quality secured products with residential mortgages accounting for 88.5% of the Group’s gross loans and advances to customers. This is an increase from 4 April 2014 (87.3%), reflecting the Group’s strategy of exiting non-core commercial lending. Loans and advances to customers 30 September 2014 4 April 2014 £m % £m %
Prime residential mortgages 122,115 72.4 119,319 71.5
Specialist residential mortgages 27,187 16.1 26,341 15.8
Total residential mortgages 149,302 88.5 145,660 87.3
Consumer banking* 3,847 2.3 3,829 2.3
Commercial lending 15,404 9.1 17,284 10.3
Other lending 114 0.1 176 0.1
Gross balances 168,667 100.0 166,949 100.0
Impairment provisions (1,123) (1,288)
Fair value adjustment for micro hedged risk 1,003 880
Total 168,547 166,541 *Comparative has been restated for the reclassification of certain amounts in relation to elements of overdrawn current accounts (previously disclosed balance was £3,862 million) as detailed in note 2 to the Interim Financial Statements. Lending risk relates to the five main types of lending the Group provides and reflects the risk that a borrower or counterparty fails to pay interest or to repay principal on a loan or other financial instrument on time. Lending risk includes all aspects of credit risk including concentration risk and extension risk.
Portfolio Definition
Residential mortgages Residential mortgages including prime and specialist lending.
Consumer banking Consumer banking including personal loans, credit card and banking portfolios.
Commercial lending Commercial lending including the Group’s commercial real estate, loans under the Project Finance initiative and social housing loans.
Other lending Lending in respect of structured portfolios.
Treasury Treasury liquidity and discretionary portfolios.
Each of the above portfolios is considered in turn below.
Nationwide Building Society – Interim Results
22
Residential mortgages
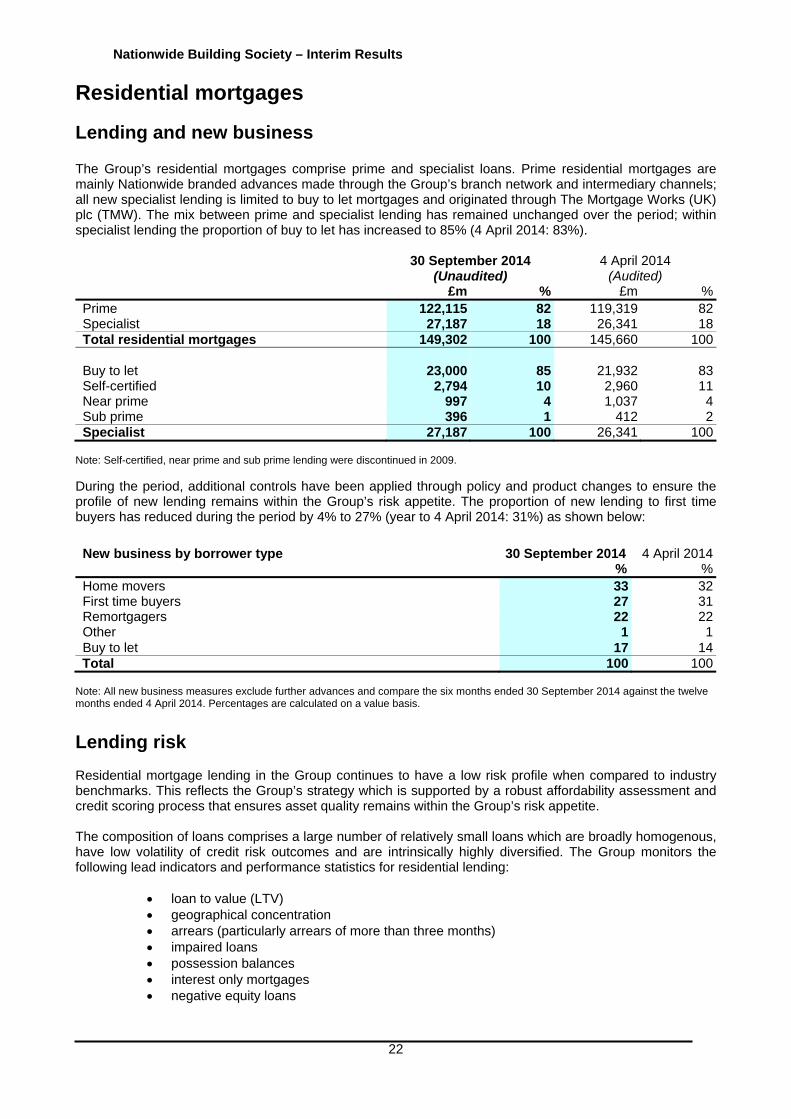
Lending and new business The Group’s residential mortgages comprise prime and specialist loans. Prime residential mortgages are mainly Nationwide branded advances made through the Group’s branch network and intermediary channels; all new specialist lending is limited to buy to let mortgages and originated through The Mortgage Works (UK) plc (TMW). The mix between prime and specialist lending has remained unchanged over the period; within specialist lending the proportion of buy to let has increased to 85% (4 April 2014: 83%). 30 September 2014
(Unaudited) 4 April 2014
(Audited) £m % £m %Prime 122,115 82 119,319 82Specialist 27,187 18 26,341 18Total residential mortgages 149,302 100 145,660 100 Buy to let 23,000 85 21,932 83Self-certified 2,794 10 2,960 11Near prime 997 4 1,037 4Sub prime 396 1 412 2Specialist 27,187 100 26,341 100
Note: Self-certified, near prime and sub prime lending were discontinued in 2009.
During the period, additional controls have been applied through policy and product changes to ensure the profile of new lending remains within the Group’s risk appetite. The proportion of new lending to first time buyers has reduced during the period by 4% to 27% (year to 4 April 2014: 31%) as shown below:
New business by borrower type
30 September 2014 %
4 April 2014%
Home movers 33 32First time buyers 27 31Remortgagers 22 22Other 1 1Buy to let 17 14
Total 100 100 Note: All new business measures exclude further advances and compare the six months ended 30 September 2014 against the twelve months ended 4 April 2014. Percentages are calculated on a value basis.
Lending risk Residential mortgage lending in the Group continues to have a low risk profile when compared to industry benchmarks. This reflects the Group’s strategy which is supported by a robust affordability assessment and credit scoring process that ensures asset quality remains within the Group’s risk appetite. The composition of loans comprises a large number of relatively small loans which are broadly homogenous, have low volatility of credit risk outcomes and are intrinsically highly diversified. The Group monitors the following lead indicators and performance statistics for residential lending:
loan to value (LTV) geographical concentration arrears (particularly arrears of more than three months) impaired loans possession balances interest only mortgages negative equity loans
Nationwide Building Society – Interim Results
23
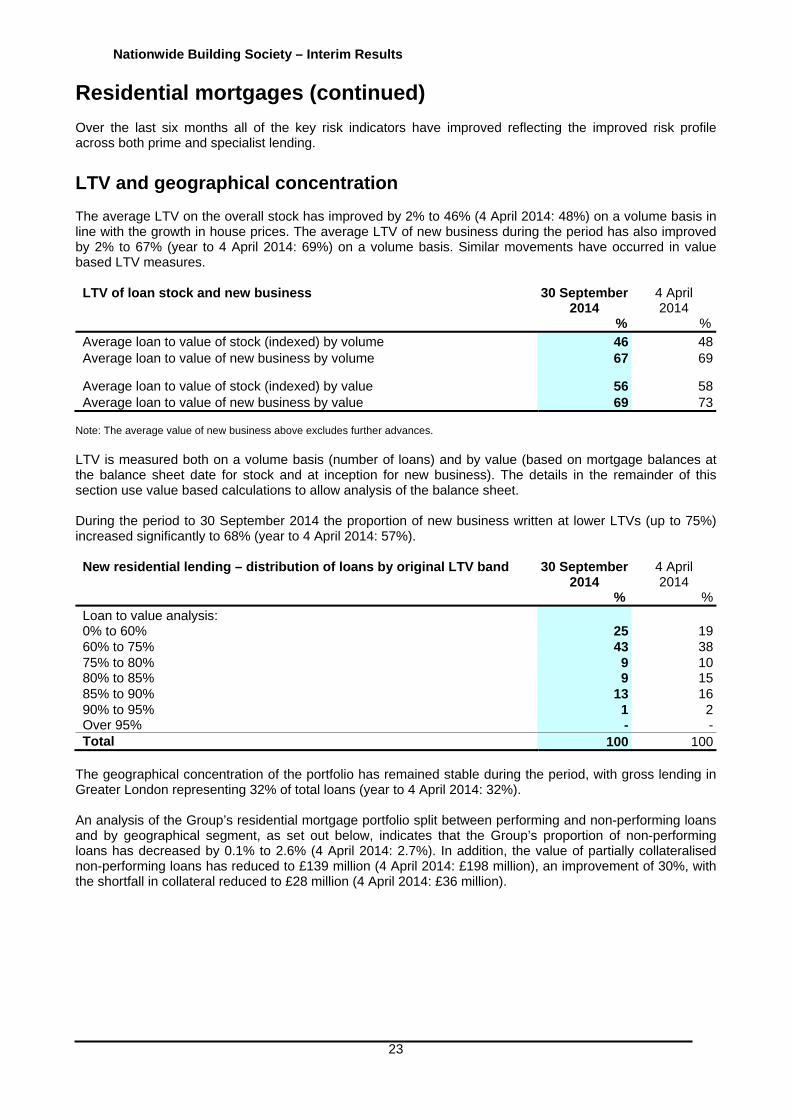
Residential mortgages (continued) Over the last six months all of the key risk indicators have improved reflecting the improved risk profile across both prime and specialist lending. LTV and geographical concentration The average LTV on the overall stock has improved by 2% to 46% (4 April 2014: 48%) on a volume basis in line with the growth in house prices. The average LTV of new business during the period has also improved by 2% to 67% (year to 4 April 2014: 69%) on a volume basis. Similar movements have occurred in value based LTV measures. LTV of loan stock and new business
30 September 2014
%
4 April 2014
%Average loan to value of stock (indexed) by volume 46 48Average loan to value of new business by volume 67 69
Average loan to value of stock (indexed) by value 56 58Average loan to value of new business by value 69 73
Note: The average value of new business above excludes further advances. LTV is measured both on a volume basis (number of loans) and by value (based on mortgage balances at the balance sheet date for stock and at inception for new business). The details in the remainder of this section use value based calculations to allow analysis of the balance sheet. During the period to 30 September 2014 the proportion of new business written at lower LTVs (up to 75%) increased significantly to 68% (year to 4 April 2014: 57%). New residential lending – distribution of loans by original LTV band
30 September 2014
%
4 April 2014
%Loan to value analysis: 0% to 60% 25 1960% to 75% 43 3875% to 80% 9 1080% to 85% 9 1585% to 90% 13 1690% to 95% 1 2Over 95% - -Total 100 100
The geographical concentration of the portfolio has remained stable during the period, with gross lending in Greater London representing 32% of total loans (year to 4 April 2014: 32%). An analysis of the Group’s residential mortgage portfolio split between performing and non-performing loans and by geographical segment, as set out below, indicates that the Group’s proportion of non-performing loans has decreased by 0.1% to 2.6% (4 April 2014: 2.7%). In addition, the value of partially collateralised non-performing loans has reduced to £139 million (4 April 2014: £198 million), an improvement of 30%, with the shortfall in collateral reduced to £28 million (4 April 2014: £36 million).

Nationwide Building Society – Interim Results
24
Residential mortgages (continued) Residential mortgage balances by LTV and region (Unaudited)
Greater London
Central England
Northern England
South East England
(excluding London)
South West
England
Scotland Wales & Northern
Ireland
Total
30 September 2014 £m £m £m £m £m £m £m £m %
Performing loans Fully collateralised LTV ratio: Up to 50% 20,766 8,291 5,947 6,756 4,565 2,805 2,003 51,13350% to 60% 11,345 4,357 3,204 3,420 2,218 1,487 938 26,96960% to 70% 9,781 6,559 4,972 4,614 3,164 2,158 1,283 32,53170% to 80% 4,088 5,245 5,822 2,672 2,506 2,585 1,508 24,42680% to 90% 868 1,796 2,711 578 793 997 751 8,49490% to 100% 81 121 673 19 31 170 255 1,350 46,929 26,369 23,329 18,059 13,277 10,202 6,738 144,903 97.1 Partially collateralised – Over 100% LTV (A) 9 12 84 4 5 33 412 559 0.3– Collateral value on A 6 11 77 3 4 31 339 471 Total performing loans 46,938 26,381 23,413 18,063 13,282 10,235 7,150 145,462 97.4 Non-performing loans Fully collateralised LTV ratio: Up to 50% 452 167 122 125 70 50 55 1,04150% to 60% 310 104 73 73 44 29 28 66160% to 70% 246 154 129 99 72 50 39 78970% to 80% 98 150 163 77 59 58 44 64980% to 90% 13 101 135 28 38 31 36 38290% to 100% 2 27 97 2 5 13 33 179 1,121 703 719 404 288 231 235 3,701 2.5 Partially collateralised – Over 100% LTV (B) 1 6 27 2 1 6 96 139 0.1– Collateral value on B 1 5 24 2 1 6 72 111
Total non-performing loans 1,122 709 746 406 289 237 331 3,840 2.6 Total residential mortgages 48,060 27,090 24,159 18,469 13,571 10,472 7,481 149,302 100 Geographical concentration 32% 18% 16% 13% 9% 7% 5% 100%

Nationwide Building Society – Interim Results
25
Residential mortgages (continued) Residential mortgage balances by LTV and region (Audited)
Greater London
Central England
Northern England
South East England
(excluding London)
South West
England
Scotland Wales & Northern
Ireland
Total
4 April 2014 £m £m £m £m £m £m £m £m % Performing loans Fully collateralised LTV ratio: Up to 50% 16,771 7,405 5,587 5,916 4,165 2,664 1,899 44,40750% to 60% 8,889 3,576 2,758 2,764 1,839 1,305 832 21,96360% to 70% 10,703 5,097 4,240 3,712 2,615 1,915 1,155 29,43770% to 80% 6,418 6,196 5,860 3,721 2,917 2,456 1,492 29,06080% to 90% 1,972 3,213 3,401 1,488 1,359 1,352 915 13,70090% to 100% 38 424 1,102 72 108 244 331 2,319 44,791 25,911 22,948 17,673 13,003 9,936 6,624 140,886 96.7 Partially collateralised – Over 100% LTV (A) 7 31 188 4 8 56 510 804 0.6– Collateral value on A 5 29 177 3 6 53 414 687 Total performing loans 44,798 25,942 23,136 17,677 13,011 9,992 7,134 141,690 97.3 Non-performing loans Fully collateralised LTV ratio: Up to 50% 366 149 110 104 62 50 50 89150% to 60% 229 85 69 59 34 26 25 52760% to 70% 292 139 114 87 58 40 37 76770% to 80% 187 162 157 95 70 61 42 77480% to 90% 55 134 146 63 53 38 37 52690% to 100% 5 67 127 14 16 20 38 287 1,134 736 723 422 293 235 229 3,772 2.6 Partially collateralised – Over 100% LTV (B) 2 14 52 3 3 10 114 198 0.1– Collateral value on B 2 13 47 2 2 10 86 162
Total non-performing loans 1,136 750 775 425 296 245 343 3,970 2.7 Total residential mortgages 45,934 26,692 23,911 18,102 13,307 10,237 7,477 145,660 100 Geographical concentration 32% 19% 16% 12% 9% 7% 5% 100% Note: Non-performing loans include impaired loans and loans with arrears of less than three months which are not impaired. Impaired loans include those balances which are more than 3 months in arrears, or have an individual provision against them.
Arrears Performance of the mortgage portfolios continues to improve with the number of residential mortgages more than three months in arrears reducing in both the prime and specialist mortgage books. The Group’s ‘more than three months in arrears’ percentage of 0.55% compares favourably with the Council of Mortgage Lenders (CML) industry average of 1.42%.
Nationwide Building Society – Interim Results
26
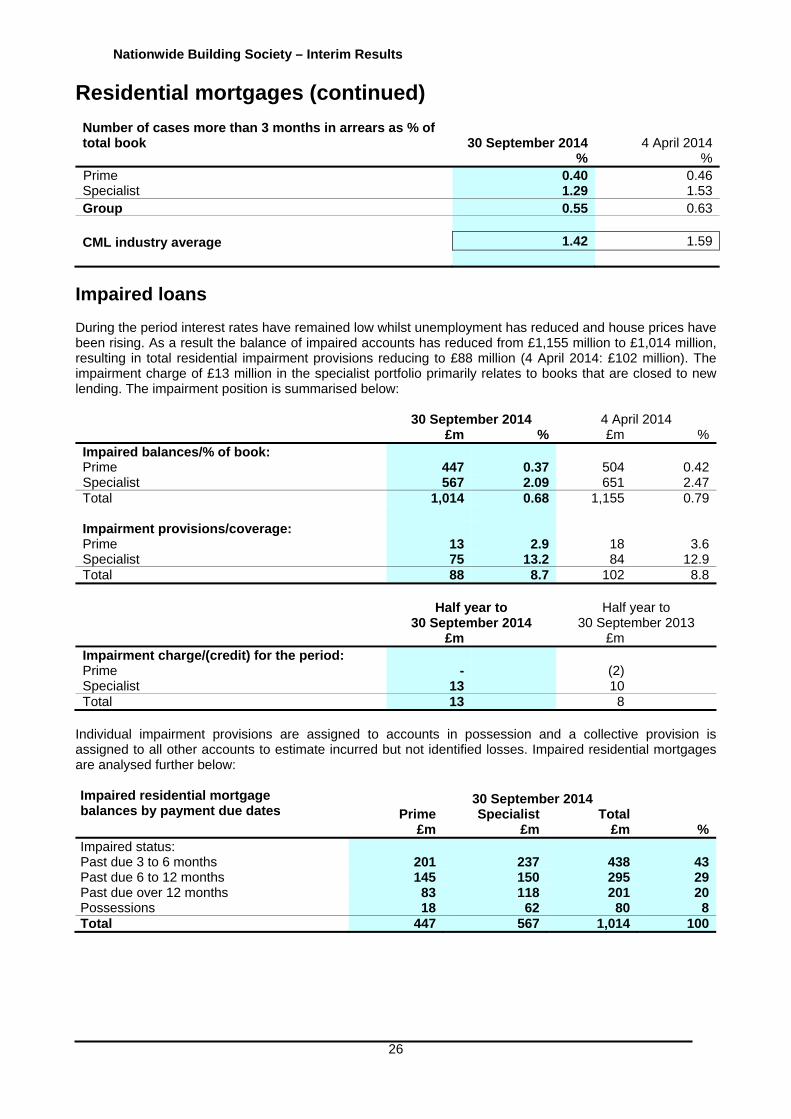
Residential mortgages (continued) Number of cases more than 3 months in arrears as % of total book 30 September 2014 4 April 2014 % % Prime 0.40 0.46Specialist 1.29 1.53Group 0.55 0.63 CML industry average 1.42 1.59
Impaired loans During the period interest rates have remained low whilst unemployment has reduced and house prices have been rising. As a result the balance of impaired accounts has reduced from £1,155 million to £1,014 million, resulting in total residential impairment provisions reducing to £88 million (4 April 2014: £102 million). The impairment charge of £13 million in the specialist portfolio primarily relates to books that are closed to new lending. The impairment position is summarised below: 30 September 2014 4 April 2014 £m % £m %Impaired balances/% of book: Prime 447 0.37 504 0.42Specialist 567 2.09 651 2.47Total 1,014 0.68 1,155 0.79 Impairment provisions/coverage: Prime 13 2.9 18 3.6Specialist 75 13.2 84 12.9Total 88 8.7 102 8.8 Half year to
30 September 2014 Half year to
30 September 2013 £m £m Impairment charge/(credit) for the period: Prime - (2) Specialist 13 10 Total 13 8
Individual impairment provisions are assigned to accounts in possession and a collective provision is assigned to all other accounts to estimate incurred but not identified losses. Impaired residential mortgages are analysed further below: Impaired residential mortgage balances by payment due dates
30 September 2014 Prime Specialist Total
£m £m £m %Impaired status: Past due 3 to 6 months 201 237 438 43Past due 6 to 12 months 145 150 295 29Past due over 12 months 83 118 201 20Possessions 18 62 80 8Total 447 567 1,014 100
Nationwide Building Society – Interim Results
27
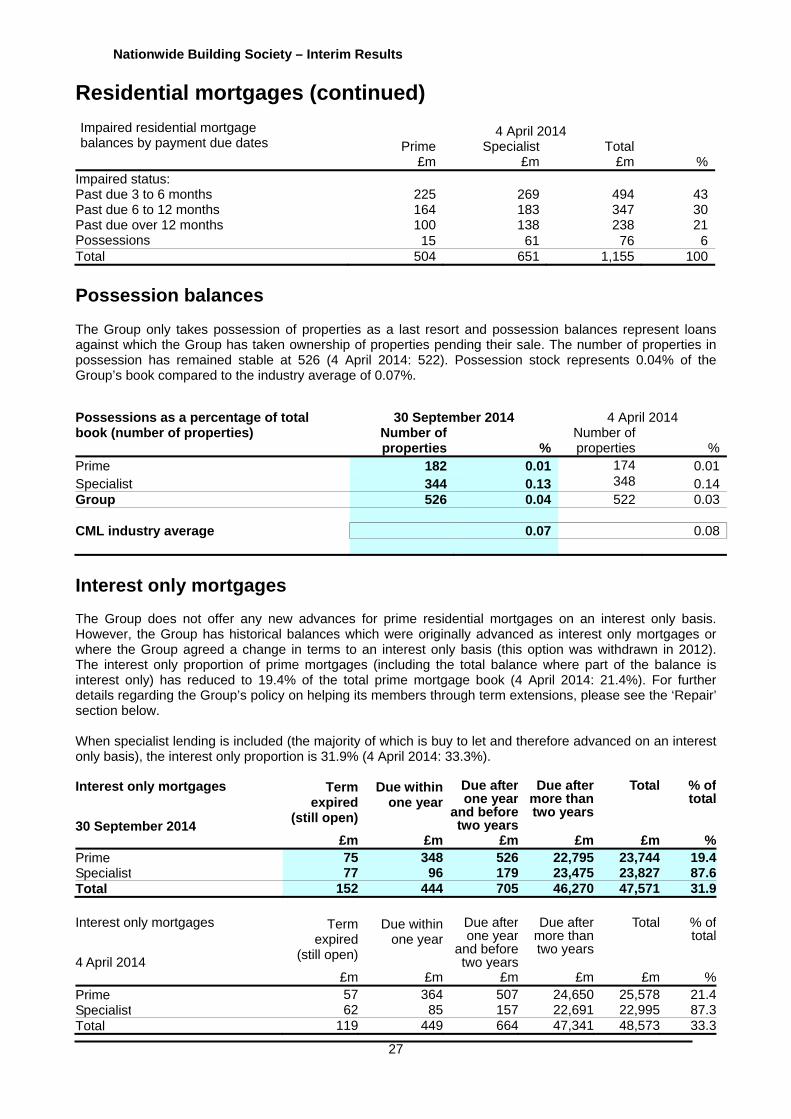
Residential mortgages (continued) Impaired residential mortgage balances by payment due dates
4 April 2014 Prime Specialist Total
£m £m £m %Impaired status: Past due 3 to 6 months 225 269 494 43Past due 6 to 12 months 164 183 347 30Past due over 12 months 100 138 238 21Possessions 15 61 76 6Total 504 651 1,155 100
Possession balances
The Group only takes possession of properties as a last resort and possession balances represent loans against which the Group has taken ownership of properties pending their sale. The number of properties in possession has remained stable at 526 (4 April 2014: 522). Possession stock represents 0.04% of the Group’s book compared to the industry average of 0.07%.
Possessions as a percentage of total 30 September 2014
4 April 2014 book (number of properties) Number of
properties %Number of properties %
Prime 182 0.01 174 0.01Specialist 344 0.13 348 0.14Group 526 0.04 522 0.03
CML industry average 0.07 0.08
Interest only mortgages The Group does not offer any new advances for prime residential mortgages on an interest only basis. However, the Group has historical balances which were originally advanced as interest only mortgages or where the Group agreed a change in terms to an interest only basis (this option was withdrawn in 2012). The interest only proportion of prime mortgages (including the total balance where part of the balance is interest only) has reduced to 19.4% of the total prime mortgage book (4 April 2014: 21.4%). For further details regarding the Group’s policy on helping its members through term extensions, please see the ‘Repair’ section below. When specialist lending is included (the majority of which is buy to let and therefore advanced on an interest only basis), the interest only proportion is 31.9% (4 April 2014: 33.3%). Interest only mortgages 30 September 2014
Termexpired
(still open)
Due within one year
Due after one year
and before two years
Due after more than two years
Total % of total
£m £m £m £m £m %Prime 75 348 526 22,795 23,744 19.4Specialist 77 96 179 23,475 23,827 87.6Total 152 444 705 46,270 47,571 31.9
Interest only mortgages 4 April 2014
Term expired
(still open)
Due within one year
Due after one year
and before two years
Due after more than two years
Total % of total
£m £m £m £m £m %Prime 57 364 507 24,650 25,578 21.4Specialist 62 85 157 22,691 22,995 87.3Total 119 449 664 47,341 48,573 33.3
Nationwide Building Society – Interim Results
28
Residential mortgages (continued)
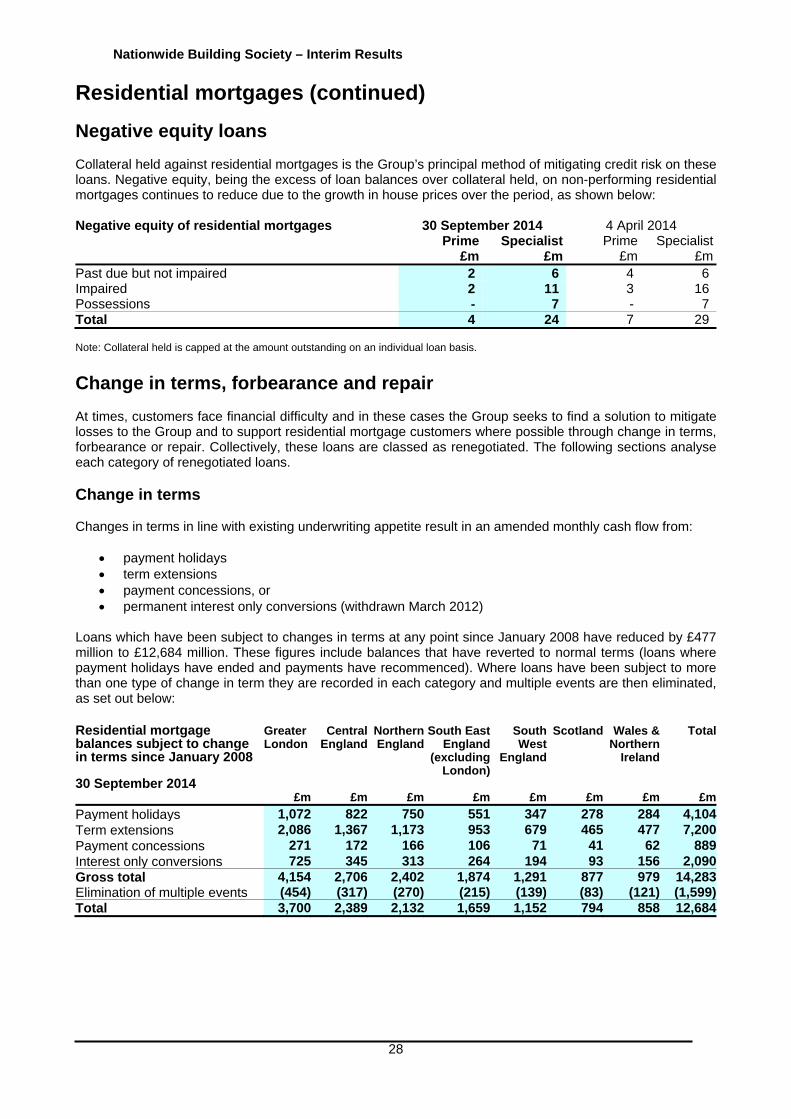
Negative equity loans Collateral held against residential mortgages is the Group’s principal method of mitigating credit risk on these loans. Negative equity, being the excess of loan balances over collateral held, on non-performing residential mortgages continues to reduce due to the growth in house prices over the period, as shown below: Negative equity of residential mortgages
30 September 2014 4 April 2014 Prime Specialist Prime Specialist
£m £m £m £mPast due but not impaired 2 6 4 6Impaired 2 11 3 16Possessions - 7 - 7Total 4 24 7 29 Note: Collateral held is capped at the amount outstanding on an individual loan basis.
Change in terms, forbearance and repair At times, customers face financial difficulty and in these cases the Group seeks to find a solution to mitigate losses to the Group and to support residential mortgage customers where possible through change in terms, forbearance or repair. Collectively, these loans are classed as renegotiated. The following sections analyse each category of renegotiated loans. Change in terms Changes in terms in line with existing underwriting appetite result in an amended monthly cash flow from:
payment holidays term extensions payment concessions, or permanent interest only conversions (withdrawn March 2012)
Loans which have been subject to changes in terms at any point since January 2008 have reduced by £477 million to £12,684 million. These figures include balances that have reverted to normal terms (loans where payment holidays have ended and payments have recommenced). Where loans have been subject to more than one type of change in term they are recorded in each category and multiple events are then eliminated, as set out below: Residential mortgage balances subject to change in terms since January 2008
Greater London
CentralEngland
Northern England
South East England
(excluding London)
South West
England
Scotland Wales & Northern
Ireland
Total
30 September 2014 £m £m £m £m £m £m £m £m
Payment holidays 1,072 822 750 551 347 278 284 4,104Term extensions 2,086 1,367 1,173 953 679 465 477 7,200Payment concessions 271 172 166 106 71 41 62 889Interest only conversions 725 345 313 264 194 93 156 2,090Gross total 4,154 2,706 2,402 1,874 1,291 877 979 14,283Elimination of multiple events (454) (317) (270) (215) (139) (83) (121) (1,599)Total 3,700 2,389 2,132 1,659 1,152 794 858 12,684

Nationwide Building Society – Interim Results
29
Residential mortgages (continued) Residential mortgage balances subject to change in terms since January 2008
Greater London
Central England
Northern England
South East England
(excluding London)
South West
England
Scotland Wales & Northern
Ireland
Total
4 April 2014 £m £m £m £m £m £m £m £m
Payment holidays 1,140 877 796 585 370 295 297 4,360Term extensions* 2,114 1,421 1,203 986 691 474 487 7,376Payment concessions 272 174 166 105 71 41 61 890Interest only conversions 769 361 328 286 204 100 161 2,209Gross total 4,295 2,833 2,493 1,962 1,336 910 1,006 14,835Elimination of multiple events (471) (332) (283) (229) (149) (86) (124) (1,674)Total 3,824 2,501 2,210 1,733 1,187 824 882 13,161 *Total term extensions have been restated by £27 million following a review of the classifications used. The previously disclosed total of £7,403 million included items which had never been subject to a term extension.
Payment holidays Performing customers with loans on standard terms and conditions effective before March 2010, who are not experiencing financial difficulty and meet required criteria (including credit score), are permitted to apply for a payment holiday and make reduced or nil payments for an agreed period of time of up to twelve months. £4,104 million of loans have been subject to payment holidays at any point since January 2008 and are still on the books at 30 September 2014 (4 April 2014: £4,360 million); of these only £102 million remain on a payment holiday as at 30 September 2014 (4 April 2014: £98 million). Term extensions The Group allows performing customers to apply to extend the term of their mortgage. £7,200 million of loans have been subject to term extensions at any point since January 2008 and are still on the books at 30 September 2014 (4 April 2014: £7,376 million). During the period, £402 million of loans (six months ended 30 September 2013: £1,077 million) had terms extended. Performance of term extensions is in line with that of the wider portfolio and therefore no adjustment is made to the Group’s provisioning methodology for these loans. Payment concessions Customers in arrears may be offered a temporary payment concession allowing them to make reduced or nil payments for an agreed period of time. £889 million of loans have been subject to payment concessions at any point since January 2008 and are still on the books at 30 September 2014 (4 April 2014: £890 million); of these only £18 million remain subject to payment concessions as at 30 September 2014 (4 April 2014: £21 million). Permanent interest only conversions Historically, performing customers who meet specific criteria could apply for a permanent interest only conversion, normally reducing their monthly commitment. Following tightening of the Group’s policy, this facility was completely withdrawn in March 2012, although a temporary interest only arrangement may be available under forbearance as described below. £2,090 million of loans have been subject to interest only conversions at any point since January 2008 and are still on the books at 30 September 2014 (4 April 2014: £2,209 million). The performance of interest only conversions is in line with that of the wider portfolio.
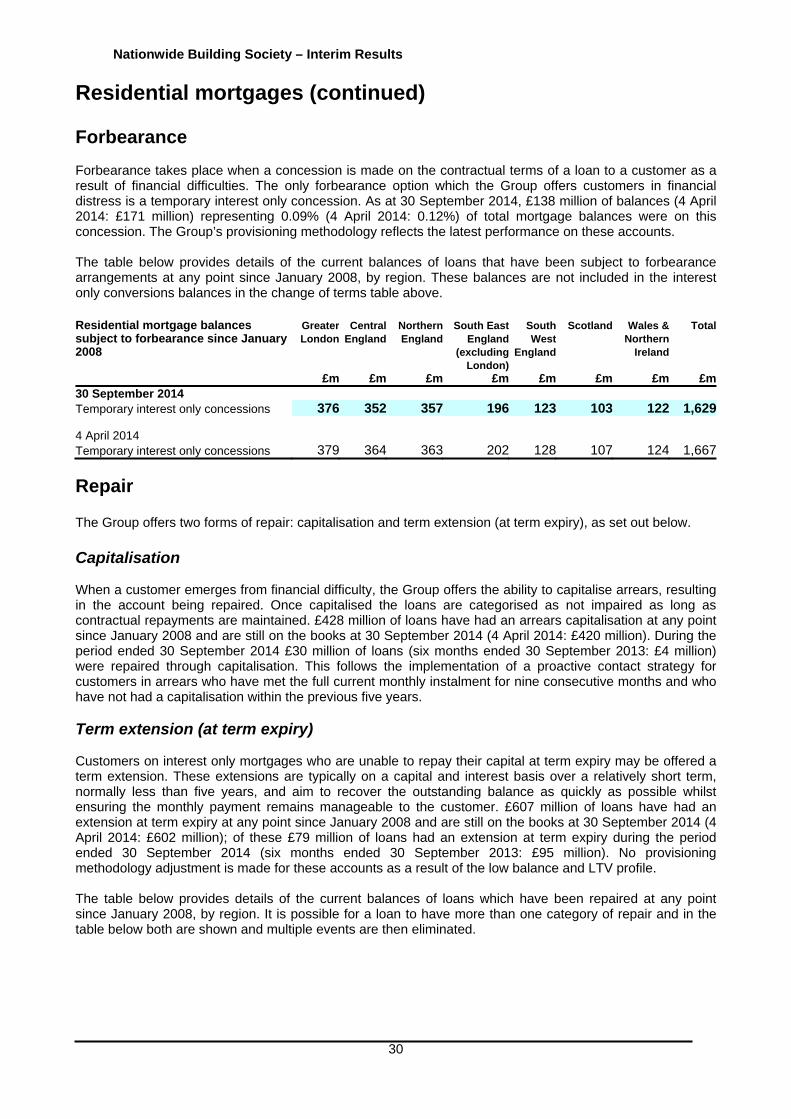
Nationwide Building Society – Interim Results
30
Residential mortgages (continued)
Forbearance Forbearance takes place when a concession is made on the contractual terms of a loan to a customer as a result of financial difficulties. The only forbearance option which the Group offers customers in financial distress is a temporary interest only concession. As at 30 September 2014, £138 million of balances (4 April 2014: £171 million) representing 0.09% (4 April 2014: 0.12%) of total mortgage balances were on this concession. The Group’s provisioning methodology reflects the latest performance on these accounts. The table below provides details of the current balances of loans that have been subject to forbearance arrangements at any point since January 2008, by region. These balances are not included in the interest only conversions balances in the change of terms table above. Residential mortgage balances subject to forbearance since January 2008
GreaterLondon
CentralEngland
Northern England
South East England
(excluding London)
South West
England
Scotland Wales & Northern
Ireland
Total
£m £m £m £m £m £m £m £m30 September 2014 Temporary interest only concessions 376 352 357 196 123 103 122 1,629 4 April 2014 Temporary interest only concessions 379 364 363 202 128 107 124 1,667
Repair The Group offers two forms of repair: capitalisation and term extension (at term expiry), as set out below. Capitalisation When a customer emerges from financial difficulty, the Group offers the ability to capitalise arrears, resulting in the account being repaired. Once capitalised the loans are categorised as not impaired as long as contractual repayments are maintained. £428 million of loans have had an arrears capitalisation at any point since January 2008 and are still on the books at 30 September 2014 (4 April 2014: £420 million). During the period ended 30 September 2014 £30 million of loans (six months ended 30 September 2013: £4 million) were repaired through capitalisation. This follows the implementation of a proactive contact strategy for customers in arrears who have met the full current monthly instalment for nine consecutive months and who have not had a capitalisation within the previous five years. Term extension (at term expiry) Customers on interest only mortgages who are unable to repay their capital at term expiry may be offered a term extension. These extensions are typically on a capital and interest basis over a relatively short term, normally less than five years, and aim to recover the outstanding balance as quickly as possible whilst ensuring the monthly payment remains manageable to the customer. £607 million of loans have had an extension at term expiry at any point since January 2008 and are still on the books at 30 September 2014 (4 April 2014: £602 million); of these £79 million of loans had an extension at term expiry during the period ended 30 September 2014 (six months ended 30 September 2013: £95 million). No provisioning methodology adjustment is made for these accounts as a result of the low balance and LTV profile. The table below provides details of the current balances of loans which have been repaired at any point since January 2008, by region. It is possible for a loan to have more than one category of repair and in the table below both are shown and multiple events are then eliminated.
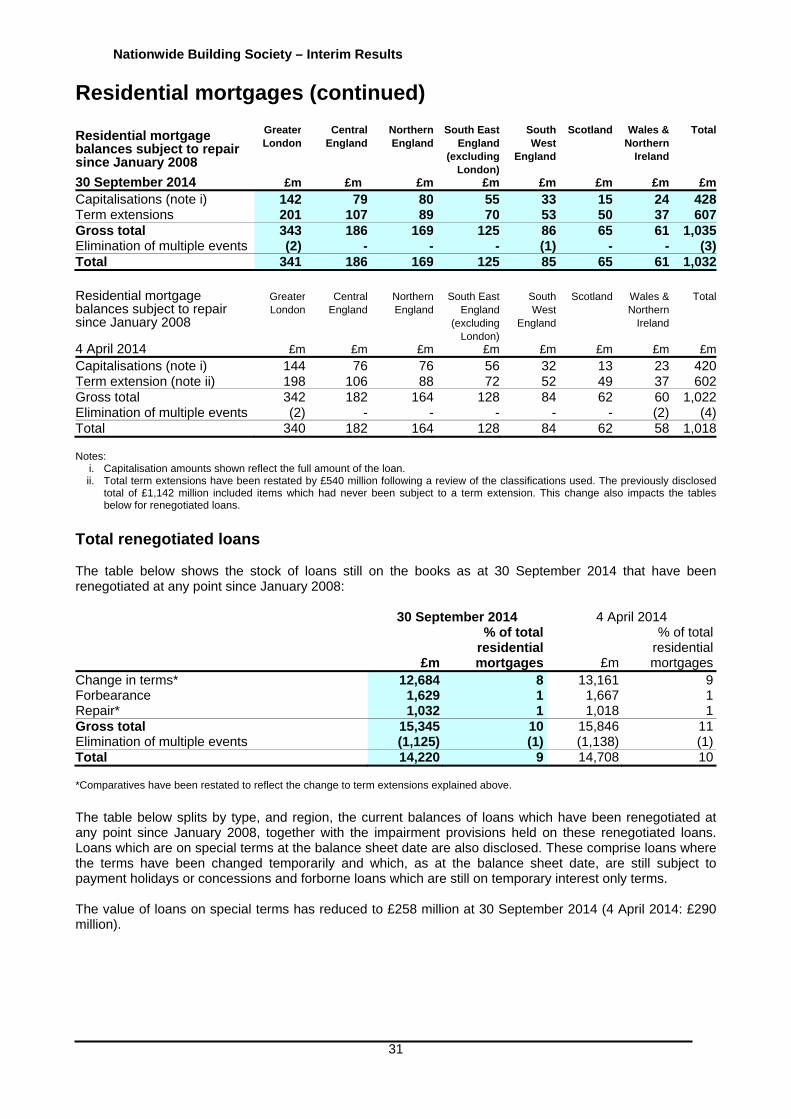
Nationwide Building Society – Interim Results
31
Residential mortgages (continued)
Residential mortgage balances subject to repair since January 2008
Greater London
Central England
Northern England
South East England
(excluding London)
South West
England
Scotland Wales & Northern
Ireland
Total
30 September 2014 £m £m £m £m £m £m £m £m
Capitalisations (note i) 142 79 80 55 33 15 24 428Term extensions 201 107 89 70 53 50 37 607Gross total 343 186 169 125 86 65 61 1,035Elimination of multiple events (2) - - - (1) - - (3)Total 341 186 169 125 85 65 61 1,032
Residential mortgage balances subject to repair since January 2008
GreaterLondon
Central England
Northern England
South East England
(excluding London)
South West
England
Scotland Wales & Northern
Ireland
Total
4 April 2014 £m £m £m £m £m £m £m £m
Capitalisations (note i) 144 76 76 56 32 13 23 420Term extension (note ii) 198 106 88 72 52 49 37 602Gross total 342 182 164 128 84 62 60 1,022Elimination of multiple events (2) - - - - - (2) (4)Total 340 182 164 128 84 62 58 1,018 Notes:
i. Capitalisation amounts shown reflect the full amount of the loan. ii. Total term extensions have been restated by £540 million following a review of the classifications used. The previously disclosed
total of £1,142 million included items which had never been subject to a term extension. This change also impacts the tables below for renegotiated loans.
Total renegotiated loans The table below shows the stock of loans still on the books as at 30 September 2014 that have been renegotiated at any point since January 2008: 30 September 2014 4 April 2014
£m
% of total residential mortgages
£m
% of total residential mortgages
Change in terms* 12,684 8 13,161 9Forbearance 1,629 1 1,667 1Repair* 1,032 1 1,018 1Gross total 15,345 10 15,846 11Elimination of multiple events (1,125) (1) (1,138) (1)Total 14,220 9 14,708 10 *Comparatives have been restated to reflect the change to term extensions explained above.
The table below splits by type, and region, the current balances of loans which have been renegotiated at any point since January 2008, together with the impairment provisions held on these renegotiated loans. Loans which are on special terms at the balance sheet date are also disclosed. These comprise loans where the terms have been changed temporarily and which, as at the balance sheet date, are still subject to payment holidays or concessions and forborne loans which are still on temporary interest only terms. The value of loans on special terms has reduced to £258 million at 30 September 2014 (4 April 2014: £290 million).
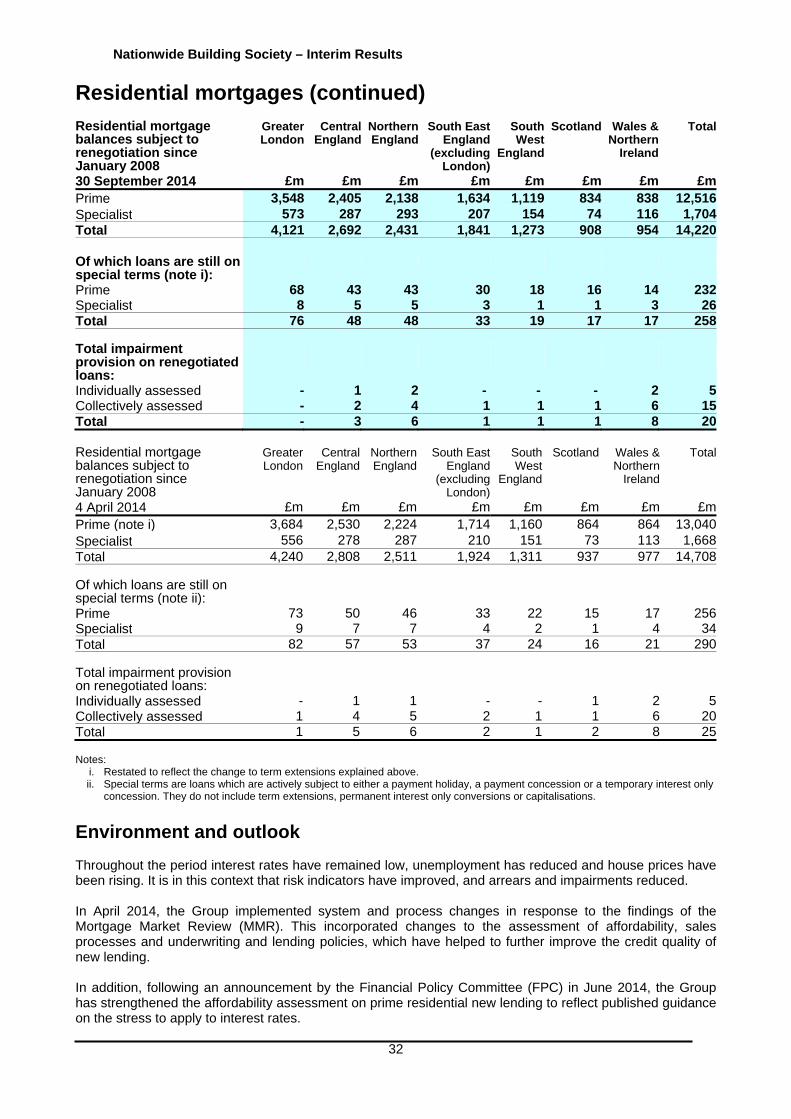
Nationwide Building Society – Interim Results
32
Residential mortgages (continued) Residential mortgage balances subject to renegotiation since January 2008
Greater London
CentralEngland
Northern England
South East England
(excluding London)
South West
England
Scotland Wales & Northern
Ireland
Total
30 September 2014 £m £m £m £m £m £m £m £mPrime 3,548 2,405 2,138 1,634 1,119 834 838 12,516Specialist 573 287 293 207 154 74 116 1,704Total 4,121 2,692 2,431 1,841 1,273 908 954 14,220
Of which loans are still on special terms (note i): Prime 68 43 43 30 18 16 14 232Specialist 8 5 5 3 1 1 3 26Total 76 48 48 33 19 17 17 258
Total impairment provision on renegotiated loans: Individually assessed - 1 2 - - - 2 5Collectively assessed - 2 4 1 1 1 6 15Total - 3 6 1 1 1 8 20 Residential mortgage balances subject to renegotiation since January 2008
Greater London
Central England
Northern England
South East England
(excluding London)
South West
England
Scotland Wales & Northern
Ireland
Total
4 April 2014 £m £m £m £m £m £m £m £mPrime (note i) 3,684 2,530 2,224 1,714 1,160 864 864 13,040Specialist 556 278 287 210 151 73 113 1,668Total 4,240 2,808 2,511 1,924 1,311 937 977 14,708 Of which loans are still on special terms (note ii): Prime 73 50 46 33 22 15 17 256Specialist 9 7 7 4 2 1 4 34Total 82 57 53 37 24 16 21 290 Total impairment provision on renegotiated loans: Individually assessed - 1 1 - - 1 2 5Collectively assessed 1 4 5 2 1 1 6 20Total 1 5 6 2 1 2 8 25 Notes:
i. Restated to reflect the change to term extensions explained above. ii. Special terms are loans which are actively subject to either a payment holiday, a payment concession or a temporary interest only
concession. They do not include term extensions, permanent interest only conversions or capitalisations.
Environment and outlook Throughout the period interest rates have remained low, unemployment has reduced and house prices have been rising. It is in this context that risk indicators have improved, and arrears and impairments reduced. In April 2014, the Group implemented system and process changes in response to the findings of the Mortgage Market Review (MMR). This incorporated changes to the assessment of affordability, sales processes and underwriting and lending policies, which have helped to further improve the credit quality of new lending. In addition, following an announcement by the Financial Policy Committee (FPC) in June 2014, the Group has strengthened the affordability assessment on prime residential new lending to reflect published guidance on the stress to apply to interest rates.
Nationwide Building Society – Interim Results
33
Residential mortgages (continued) The healthy pace of economic growth and continued steady declines in unemployment suggest that the economy is becoming more tolerant to an increase in interest rates. However, while the timing is uncertain, and the pace of rate increases is expected to be modest, arrears rates are expected to increase for both prime and specialist mortgages as the base rate increases. The robust credit assessment and affordability controls that are in place have ensured low arrears rates historically, and should ensure the Group’s portfolio quality remains resilient to the expected increases in base rate. The Group actively monitors the performance of the mortgage portfolios to ensure lending criteria and decision strategies are adjusted as appropriate. Long term low interest rates, access to higher LTV lending and improved consumer confidence have combined to put upwards pressure on house prices, which increases the risk of a correction in house prices within some geographical regions that have experienced strong growth. During September, activity in the housing market has moderated, with a slowdown in demand and house price growth. However, with continuing low interest rates and a strong labour market, underlying demand is expected to remain robust.
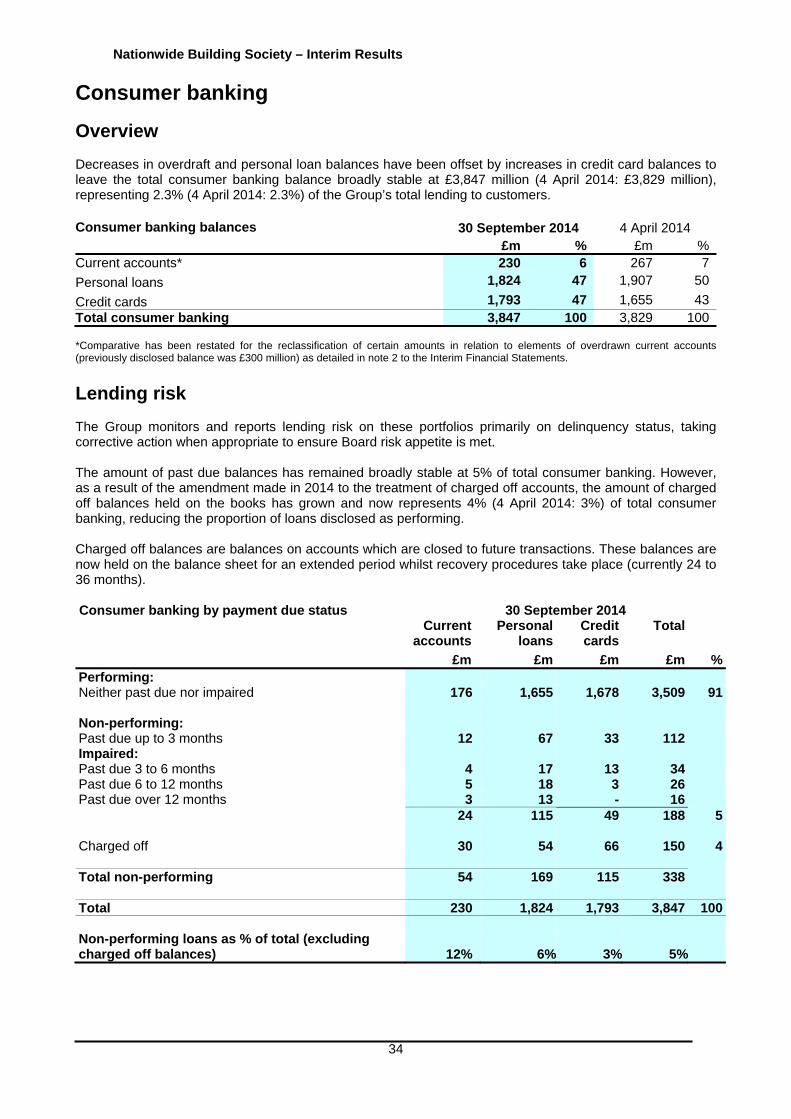
Nationwide Building Society – Interim Results
34
Consumer banking
Overview Decreases in overdraft and personal loan balances have been offset by increases in credit card balances to leave the total consumer banking balance broadly stable at £3,847 million (4 April 2014: £3,829 million), representing 2.3% (4 April 2014: 2.3%) of the Group’s total lending to customers. Consumer banking balances
30 September 2014 4 April 2014 £m % £m %
Current accounts* 230 6 267 7
Personal loans 1,824 47 1,907 50
Credit cards 1,793 47 1,655 43Total consumer banking 3,847 100 3,829 100 *Comparative has been restated for the reclassification of certain amounts in relation to elements of overdrawn current accounts (previously disclosed balance was £300 million) as detailed in note 2 to the Interim Financial Statements.
Lending risk The Group monitors and reports lending risk on these portfolios primarily on delinquency status, taking corrective action when appropriate to ensure Board risk appetite is met. The amount of past due balances has remained broadly stable at 5% of total consumer banking. However, as a result of the amendment made in 2014 to the treatment of charged off accounts, the amount of charged off balances held on the books has grown and now represents 4% (4 April 2014: 3%) of total consumer banking, reducing the proportion of loans disclosed as performing. Charged off balances are balances on accounts which are closed to future transactions. These balances are now held on the balance sheet for an extended period whilst recovery procedures take place (currently 24 to 36 months). Consumer banking by payment due status 30 September 2014
Current accounts
Personal loans
Credit cards
Total
£m £m £m £m %Performing: Neither past due nor impaired 176 1,655 1,678 3,509 91 Non-performing: Past due up to 3 months 12 67 33 112Impaired: Past due 3 to 6 months 4 17 13 34Past due 6 to 12 months 5 18 3 26Past due over 12 months 3 13 - 16 24 115 49 188 5 Charged off 30 54 66 150 4 Total non-performing 54 169 115 338 Total 230 1,824 1,793 3,847 100 Non-performing loans as % of total (excluding charged off balances) 12% 6% 3% 5%
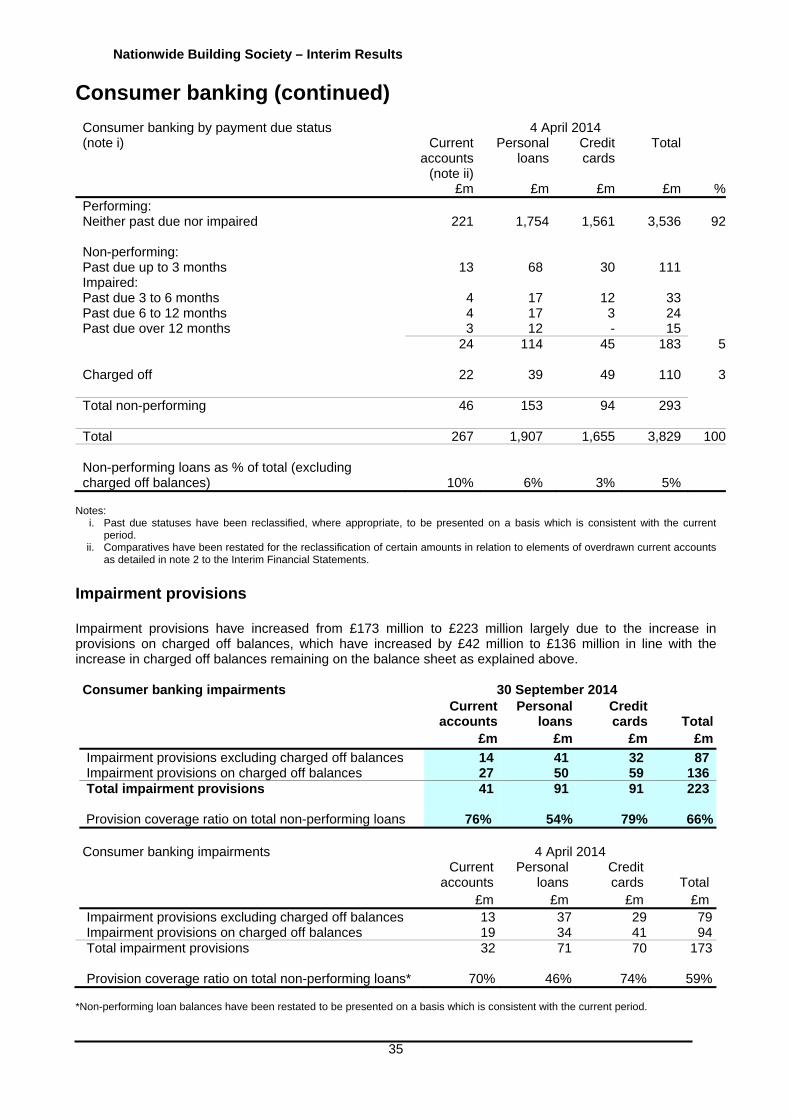
Nationwide Building Society – Interim Results
35
Consumer banking (continued) Consumer banking by payment due status 4 April 2014 (note i) Current
accounts (note ii)
Personal loans
Credit cards
Total
£m £m £m £m %Performing: Neither past due nor impaired 221 1,754 1,561 3,536 92 Non-performing: Past due up to 3 months 13 68 30 111 Impaired: Past due 3 to 6 months 4 17 12 33 Past due 6 to 12 months 4 17 3 24 Past due over 12 months 3 12 - 15 24 114 45 183 5 Charged off 22 39 49 110 3
Total non-performing 46 153 94 293
Total 267 1,907 1,655 3,829 100
Non-performing loans as % of total (excluding charged off balances) 10% 6% 3% 5%
Notes:
i. Past due statuses have been reclassified, where appropriate, to be presented on a basis which is consistent with the current period.
ii. Comparatives have been restated for the reclassification of certain amounts in relation to elements of overdrawn current accounts as detailed in note 2 to the Interim Financial Statements.
Impairment provisions Impairment provisions have increased from £173 million to £223 million largely due to the increase in provisions on charged off balances, which have increased by £42 million to £136 million in line with the increase in charged off balances remaining on the balance sheet as explained above. Consumer banking impairments
30 September 2014 Current
accountsPersonal
loans Credit cards Total
£m £m £m £m
Impairment provisions excluding charged off balances 14 41 32 87Impairment provisions on charged off balances 27 50 59 136Total impairment provisions 41 91 91 223
Provision coverage ratio on total non-performing loans 76% 54% 79% 66% Consumer banking impairments 4 April 2014 Current
accountsPersonal
loans Credit cards Total
£m £m £m £mImpairment provisions excluding charged off balances 13 37 29 79Impairment provisions on charged off balances 19 34 41 94Total impairment provisions 32 71 70 173 Provision coverage ratio on total non-performing loans* 70% 46% 74% 59%
*Non-performing loan balances have been restated to be presented on a basis which is consistent with the current period.
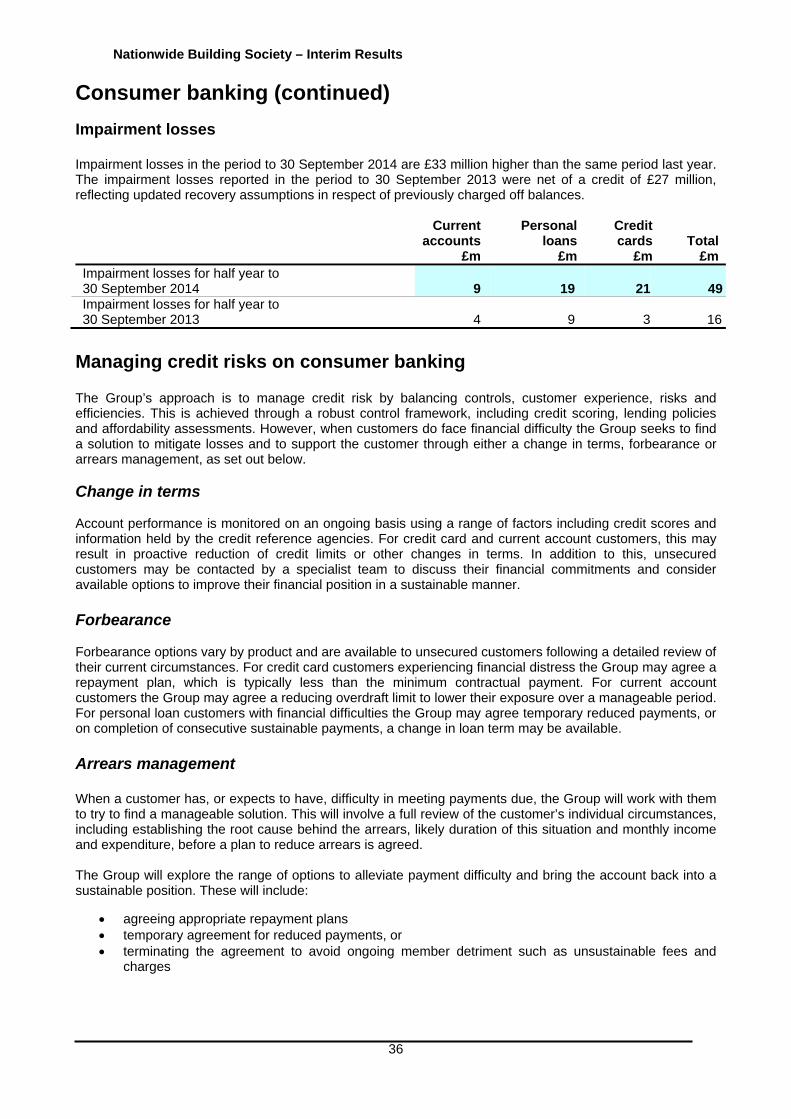
Nationwide Building Society – Interim Results
36
Consumer banking (continued) Impairment losses Impairment losses in the period to 30 September 2014 are £33 million higher than the same period last year. The impairment losses reported in the period to 30 September 2013 were net of a credit of £27 million, reflecting updated recovery assumptions in respect of previously charged off balances.
Current
accounts Personal
loans Credit cards Total
£m £m £m £mImpairment losses for half year to 30 September 2014 9 19 21 49Impairment losses for half year to 30 September 2013 4 9 3 16
Managing credit risks on consumer banking The Group’s approach is to manage credit risk by balancing controls, customer experience, risks and efficiencies. This is achieved through a robust control framework, including credit scoring, lending policies and affordability assessments. However, when customers do face financial difficulty the Group seeks to find a solution to mitigate losses and to support the customer through either a change in terms, forbearance or arrears management, as set out below. Change in terms Account performance is monitored on an ongoing basis using a range of factors including credit scores and information held by the credit reference agencies. For credit card and current account customers, this may result in proactive reduction of credit limits or other changes in terms. In addition to this, unsecured customers may be contacted by a specialist team to discuss their financial commitments and consider available options to improve their financial position in a sustainable manner. Forbearance Forbearance options vary by product and are available to unsecured customers following a detailed review of their current circumstances. For credit card customers experiencing financial distress the Group may agree a repayment plan, which is typically less than the minimum contractual payment. For current account customers the Group may agree a reducing overdraft limit to lower their exposure over a manageable period. For personal loan customers with financial difficulties the Group may agree temporary reduced payments, or on completion of consecutive sustainable payments, a change in loan term may be available. Arrears management When a customer has, or expects to have, difficulty in meeting payments due, the Group will work with them to try to find a manageable solution. This will involve a full review of the customer’s individual circumstances, including establishing the root cause behind the arrears, likely duration of this situation and monthly income and expenditure, before a plan to reduce arrears is agreed. The Group will explore the range of options to alleviate payment difficulty and bring the account back into a sustainable position. These will include:
agreeing appropriate repayment plans temporary agreement for reduced payments, or terminating the agreement to avoid ongoing member detriment such as unsustainable fees and
charges

Nationwide Building Society – Interim Results
37
Consumer banking (continued) Environment and outlook The Group has strengthened its lending policy and has introduced a more robust affordability assessment across all unsecured lending products in line with the Group’s position as a responsible lender and its commitment to operating within the responsible lending regulations of the Financial Conduct Authority. This action is designed to keep the lending risk of the consumer banking portfolio within appetite. The change in treatment of charged off balances made twelve months ago will mean that the amount of charged off balances will grow until the policy has been in place for a full recovery cycle (currently 24 to 36 months).
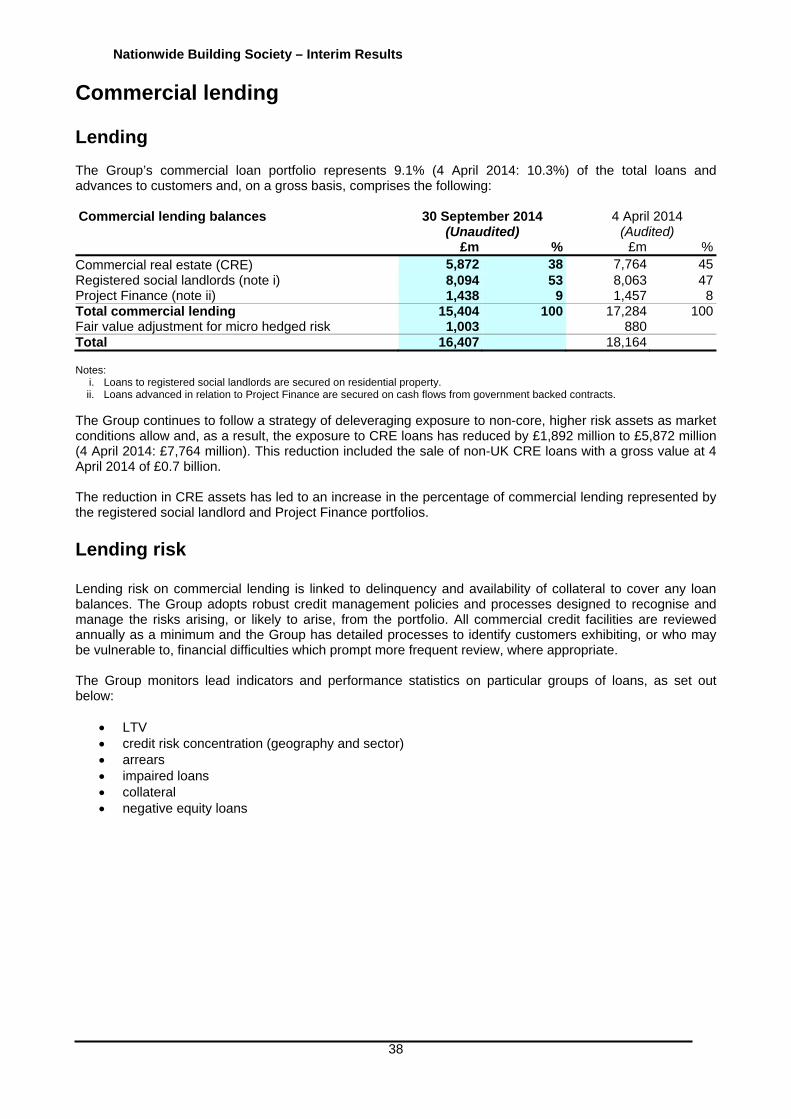
Nationwide Building Society – Interim Results
38
Commercial lending Lending The Group’s commercial loan portfolio represents 9.1% (4 April 2014: 10.3%) of the total loans and advances to customers and, on a gross basis, comprises the following: Commercial lending balances 30 September 2014
(Unaudited)4 April 2014
(Audited) £m % £m %
Commercial real estate (CRE) 5,872 38 7,764 45Registered social landlords (note i) 8,094 53 8,063 47Project Finance (note ii) 1,438 9 1,457 8Total commercial lending 15,404 100 17,284 100Fair value adjustment for micro hedged risk 1,003 880 Total 16,407 18,164 Notes:
i. Loans to registered social landlords are secured on residential property. ii. Loans advanced in relation to Project Finance are secured on cash flows from government backed contracts.
The Group continues to follow a strategy of deleveraging exposure to non-core, higher risk assets as market conditions allow and, as a result, the exposure to CRE loans has reduced by £1,892 million to £5,872 million (4 April 2014: £7,764 million). This reduction included the sale of non-UK CRE loans with a gross value at 4 April 2014 of £0.7 billion. The reduction in CRE assets has led to an increase in the percentage of commercial lending represented by the registered social landlord and Project Finance portfolios. Lending risk Lending risk on commercial lending is linked to delinquency and availability of collateral to cover any loan balances. The Group adopts robust credit management policies and processes designed to recognise and manage the risks arising, or likely to arise, from the portfolio. All commercial credit facilities are reviewed annually as a minimum and the Group has detailed processes to identify customers exhibiting, or who may be vulnerable to, financial difficulties which prompt more frequent review, where appropriate. The Group monitors lead indicators and performance statistics on particular groups of loans, as set out below:
LTV credit risk concentration (geography and sector) arrears impaired loans collateral negative equity loans
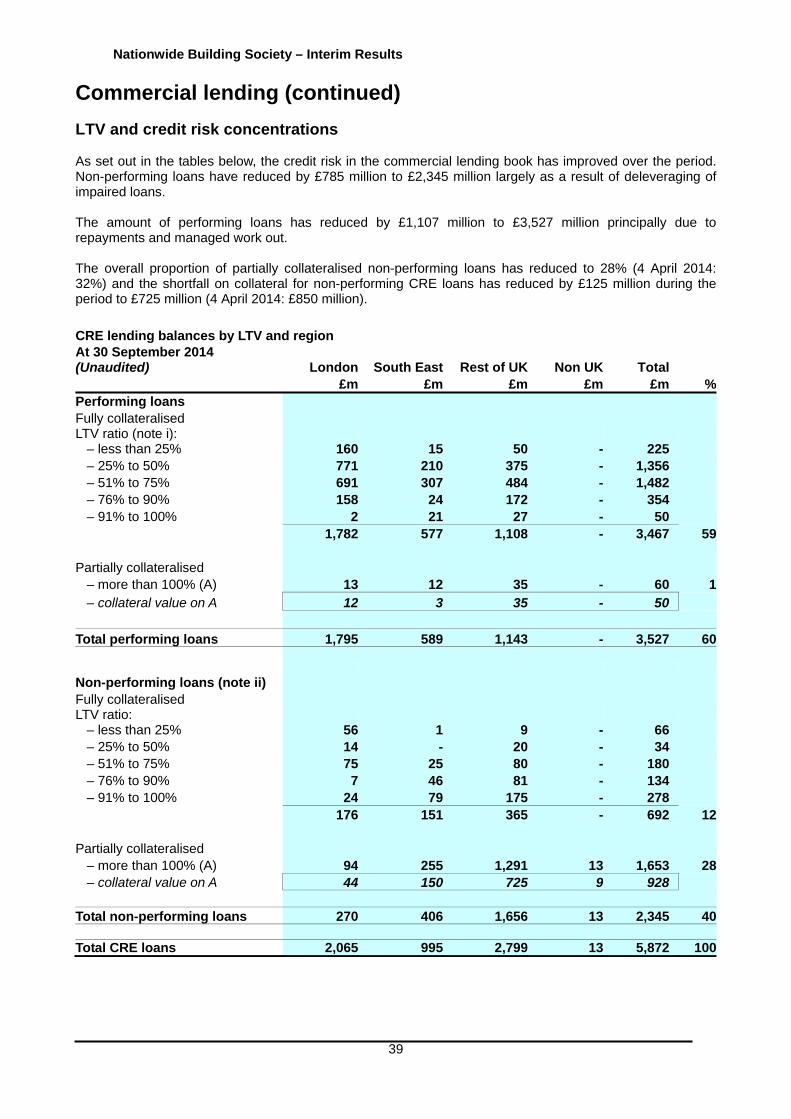
Nationwide Building Society – Interim Results
39
Commercial lending (continued) LTV and credit risk concentrations As set out in the tables below, the credit risk in the commercial lending book has improved over the period. Non-performing loans have reduced by £785 million to £2,345 million largely as a result of deleveraging of impaired loans. The amount of performing loans has reduced by £1,107 million to £3,527 million principally due to repayments and managed work out. The overall proportion of partially collateralised non-performing loans has reduced to 28% (4 April 2014: 32%) and the shortfall on collateral for non-performing CRE loans has reduced by £125 million during the period to £725 million (4 April 2014: £850 million).
CRE lending balances by LTV and region At 30 September 2014 (Unaudited) London South East Rest of UK Non UK Total £m £m £m £m £m %Performing loans Fully collateralised LTV ratio (note i):
– less than 25% 160 15 50 - 225– 25% to 50% 771 210 375 - 1,356– 51% to 75% 691 307 484 - 1,482– 76% to 90% 158 24 172 - 354– 91% to 100% 2 21 27 - 50 1,782 577 1,108 - 3,467 59
Partially collateralised – more than 100% (A) 13 12 35 - 60 1– collateral value on A 12 3 35 - 50
Total performing loans 1,795 589 1,143 - 3,527 60
Non-performing loans (note ii) Fully collateralised LTV ratio:
– less than 25% 56 1 9 - 66– 25% to 50% 14 - 20 - 34– 51% to 75% 75 25 80 - 180– 76% to 90% 7 46 81 - 134– 91% to 100% 24 79 175 - 278 176 151 365 - 692 12
Partially collateralised – more than 100% (A) 94 255 1,291 13 1,653 28– collateral value on A 44 150 725 9 928
Total non-performing loans 270 406 1,656 13 2,345 40 Total CRE loans 2,065 995 2,799 13 5,872 100
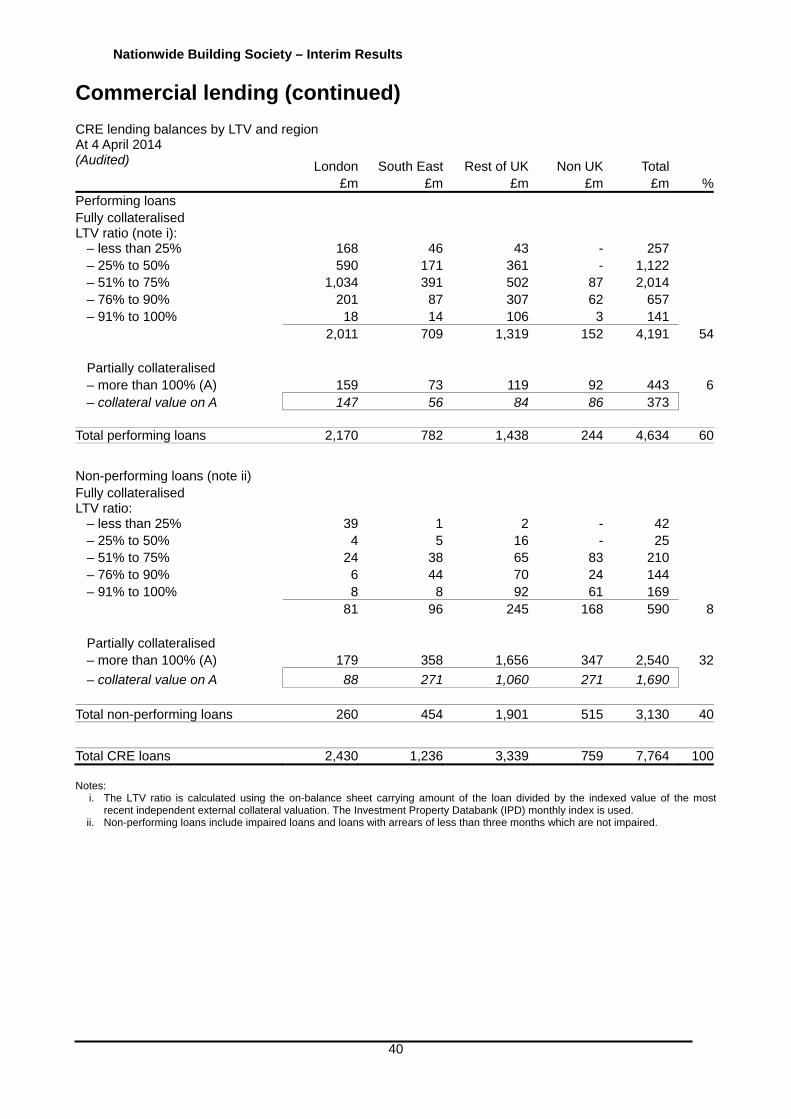
Nationwide Building Society – Interim Results
40
Commercial lending (continued)
CRE lending balances by LTV and region At 4 April 2014 (Audited) London South East Rest of UK Non UK Total £m £m £m £m £m %Performing loans Fully collateralised LTV ratio (note i):
– less than 25% 168 46 43 - 257 – 25% to 50% 590 171 361 - 1,122 – 51% to 75% 1,034 391 502 87 2,014 – 76% to 90% 201 87 307 62 657 – 91% to 100% 18 14 106 3 141 2,011 709 1,319 152 4,191 54 Partially collateralised – more than 100% (A) 159 73 119 92 443 6– collateral value on A 147 56 84 86 373
Total performing loans 2,170 782 1,438 244 4,634 60
Non-performing loans (note ii) Fully collateralised LTV ratio:
– less than 25% 39 1 2 - 42 – 25% to 50% 4 5 16 - 25 – 51% to 75% 24 38 65 83 210 – 76% to 90% 6 44 70 24 144 – 91% to 100% 8 8 92 61 169 81 96 245 168 590 8 Partially collateralised – more than 100% (A) 179 358 1,656 347 2,540 32
– collateral value on A 88 271 1,060 271 1,690 Total non-performing loans 260 454 1,901 515 3,130 40
Total CRE loans 2,430 1,236 3,339 759 7,764 100 Notes:
i. The LTV ratio is calculated using the on-balance sheet carrying amount of the loan divided by the indexed value of the most recent independent external collateral valuation. The Investment Property Databank (IPD) monthly index is used.
ii. Non-performing loans include impaired loans and loans with arrears of less than three months which are not impaired.

Nationwide Building Society – Interim Results
41
Commercial lending (continued)
The disposal of non-UK loans has impacted the geographic and sectoral concentrations of the overall portfolio, as set out on the following tables. Excluding this impact, the concentrations have remained fairly stable and there is no significant exposure at customer level. The largest single commercial customer, including undrawn commitments, represents only 2.0% (4 April 2014: 1.7%) of the total book. CRE lending balances and impairment by type and regionAt 30 September 2014 London South East Rest of UK Non UK Total £m £m £m £m £m %Retail 756 365 1,024 5 2,150 37%Office 375 180 508 2 1,065 18%Residential 395 190 535 3 1,123 19%Industrial & warehouse 331 160 449 2 942 16%Leisure & hotel 181 87 246 1 515 9%Other 27 13 37 - 77 1%Total CRE lending 2,065 995 2,799 13 5,872 100%% 35% 17% 48% 0% 100% Impairment provision: Retail 24 65 196 4 289Office - 47 131 - 178Residential 4 2 33 - 39Industrial & warehouse 1 12 168 - 181Leisure & hotel 43 10 41 - 94Other - 1 - - 1Total impairment provision 72 137 569 4 782 Provision coverage ratio 3.5% 13.8% 20.3% 30.8% 13.3%
CRE lending balances and impairment by type and regionAt 4 April 2014 London South East Rest of UK Non UK Total £m £m £m £m £m %Retail 884 450 1,215 277 2,826 36%Office 475 242 653 149 1,519 20%Residential 390 198 536 122 1,246 16%Industrial & warehouse 405 206 557 127 1,295 17%Leisure & hotel 248 126 341 78 793 10%Other 28 14 37 6 85 1%Total CRE lending 2,430 1,236 3,339 759 7,764 100%% 31% 16% 43% 10% 100% Impairment provision: Retail 32 42 186 113 373Office 48 24 146 14 232Residential 9 5 36 8 58Industrial & warehouse 4 10 159 26 199Leisure & hotel 42 21 73 3 139Other - - - - -Total impairment provision 135 102 600 164 1,001 Provision coverage ratio 5.6% 8.3% 18.0% 21.6% 12.9%

Nationwide Building Society – Interim Results
42
Commercial lending (continued) Funding liquidity in the lending market has improved, enabling steady refinancing of good quality assets. There are good signs of improvement in CRE capital values and rental prospects for prime assets in London and the surrounding regions, albeit this recovery has not yet been seen at the same levels in weaker secondary and tertiary assets. The overall provision coverage ratio has increased slightly from 12.9% to 13.3% reflecting the disposal of impaired balances and increases in provisions on certain non-core loans for which the Group is adopting shorter term exit strategies as early deleverage opportunities become available in the current favourable CRE market. The reduction in London provision coverage is a reflection of the London asset values, which in some instances have recovered and increased beyond the levels seen in the rest of the UK. Arrears The table below provides information on the Group’s CRE lending by payment due status: CRE lending balances by payment status 30 September 2014
(Unaudited) 4 April 2014
(Audited) £m % £m %Performing: Neither past due nor impaired 3,527 60 4,634 60
Non-performing: Past due up to 3 months but not impaired* 158 3 65 1Impaired 2,187 37 3,065 39Total non-performing 2,345 40 3,130 40
Total 5,872 100 7,764 100 *The status past due up to three months but not impaired includes any asset where a payment due under strict contractual terms is received late or missed. The amount included is the entire financial asset rather than just the payment overdue. Loans in the analysis above which are not impaired have collective impairment provisions set aside to cover credit losses. Impaired loans No losses have been experienced on the registered social landlord or Project Finance portfolios and there is no non-performance within these portfolios. As a result, impairment provisions are only needed against the CRE portfolio, for which impairment provisions and impairment losses are set out in the table below. Both impaired balances and impairment provisions have fallen as a result of the disposal of the impaired German loan portfolio, partially offset by further impairments principally on loans where an early deleverage strategy has been adopted.
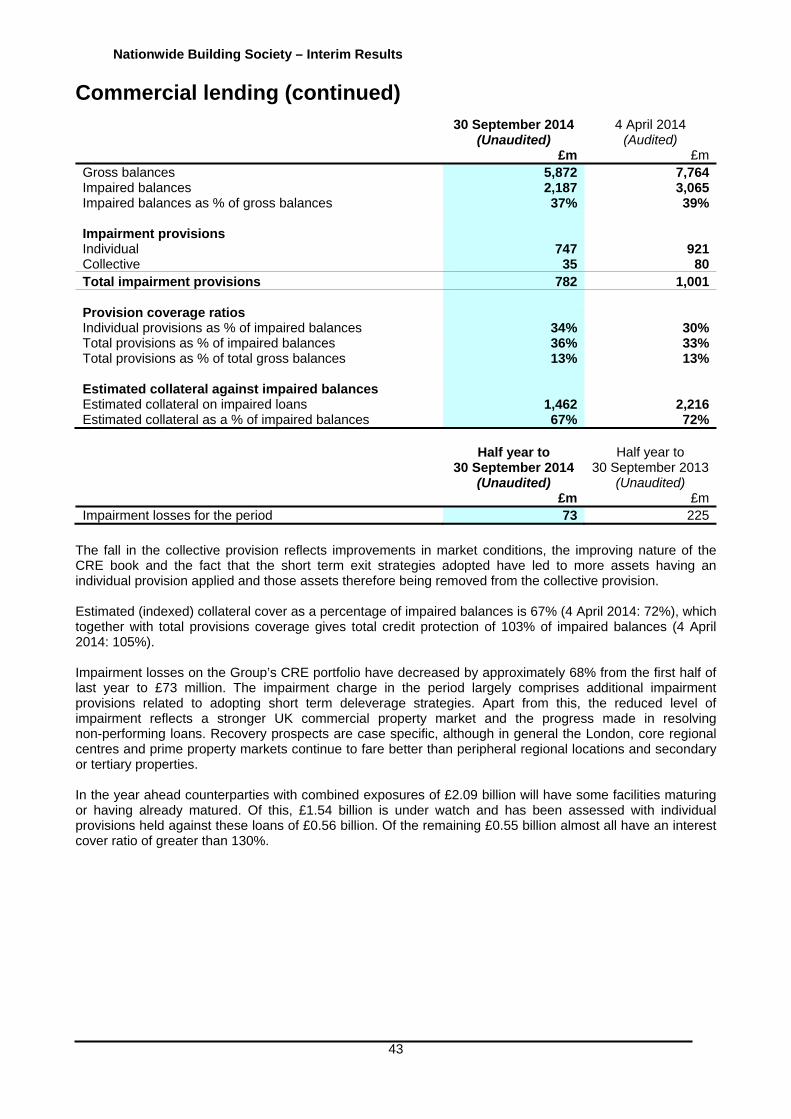
Nationwide Building Society – Interim Results
43
Commercial lending (continued)
30 September 2014
(Unaudited) 4 April 2014
(Audited) £m £mGross balances 5,872 7,764Impaired balances 2,187 3,065Impaired balances as % of gross balances 37% 39% Impairment provisions Individual 747 921Collective 35 80Total impairment provisions 782 1,001 Provision coverage ratios Individual provisions as % of impaired balances 34% 30%Total provisions as % of impaired balances 36% 33%Total provisions as % of total gross balances 13% 13% Estimated collateral against impaired balances Estimated collateral on impaired loans 1,462 2,216Estimated collateral as a % of impaired balances 67% 72%
Half year to 30 September 2014
(Unaudited)
Half year to 30 September 2013
(Unaudited) £m £mImpairment losses for the period 73 225
The fall in the collective provision reflects improvements in market conditions, the improving nature of the CRE book and the fact that the short term exit strategies adopted have led to more assets having an individual provision applied and those assets therefore being removed from the collective provision. Estimated (indexed) collateral cover as a percentage of impaired balances is 67% (4 April 2014: 72%), which together with total provisions coverage gives total credit protection of 103% of impaired balances (4 April 2014: 105%). Impairment losses on the Group’s CRE portfolio have decreased by approximately 68% from the first half of last year to £73 million. The impairment charge in the period largely comprises additional impairment provisions related to adopting short term deleverage strategies. Apart from this, the reduced level of impairment reflects a stronger UK commercial property market and the progress made in resolving non-performing loans. Recovery prospects are case specific, although in general the London, core regional centres and prime property markets continue to fare better than peripheral regional locations and secondary or tertiary properties. In the year ahead counterparties with combined exposures of £2.09 billion will have some facilities maturing or having already matured. Of this, £1.54 billion is under watch and has been assessed with individual provisions held against these loans of £0.56 billion. Of the remaining £0.55 billion almost all have an interest cover ratio of greater than 130%.
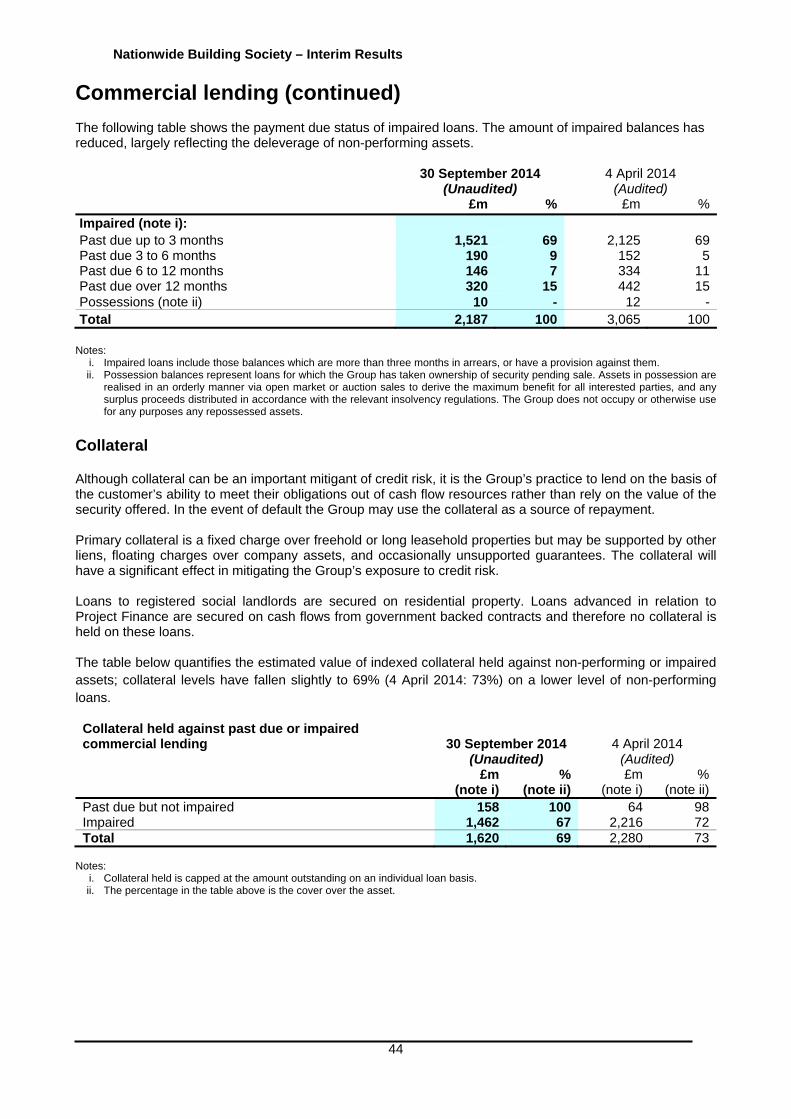
Nationwide Building Society – Interim Results
44
Commercial lending (continued) The following table shows the payment due status of impaired loans. The amount of impaired balances has reduced, largely reflecting the deleverage of non-performing assets.
30 September 2014 (Unaudited)
4 April 2014 (Audited)
£m % £m %
Impaired (note i): Past due up to 3 months 1,521 69 2,125 69Past due 3 to 6 months 190 9 152 5Past due 6 to 12 months 146 7 334 11Past due over 12 months 320 15 442 15Possessions (note ii) 10 - 12 -Total 2,187 100 3,065 100
Notes:
i. Impaired loans include those balances which are more than three months in arrears, or have a provision against them. ii. Possession balances represent loans for which the Group has taken ownership of security pending sale. Assets in possession are
realised in an orderly manner via open market or auction sales to derive the maximum benefit for all interested parties, and any surplus proceeds distributed in accordance with the relevant insolvency regulations. The Group does not occupy or otherwise use for any purposes any repossessed assets.
Collateral Although collateral can be an important mitigant of credit risk, it is the Group’s practice to lend on the basis of the customer’s ability to meet their obligations out of cash flow resources rather than rely on the value of the security offered. In the event of default the Group may use the collateral as a source of repayment. Primary collateral is a fixed charge over freehold or long leasehold properties but may be supported by other liens, floating charges over company assets, and occasionally unsupported guarantees. The collateral will have a significant effect in mitigating the Group’s exposure to credit risk. Loans to registered social landlords are secured on residential property. Loans advanced in relation to Project Finance are secured on cash flows from government backed contracts and therefore no collateral is held on these loans. The table below quantifies the estimated value of indexed collateral held against non-performing or impaired assets; collateral levels have fallen slightly to 69% (4 April 2014: 73%) on a lower level of non-performing loans.
Collateral held against past due or impaired commercial lending
30 September 2014 (Unaudited)
4 April 2014 (Audited)
£m(note i)
% (note ii)
£m (note i)
% (note ii)
Past due but not impaired 158 100 64 98Impaired 1,462 67 2,216 72Total 1,620 69 2,280 73
Notes:
i. Collateral held is capped at the amount outstanding on an individual loan basis. ii. The percentage in the table above is the cover over the asset.
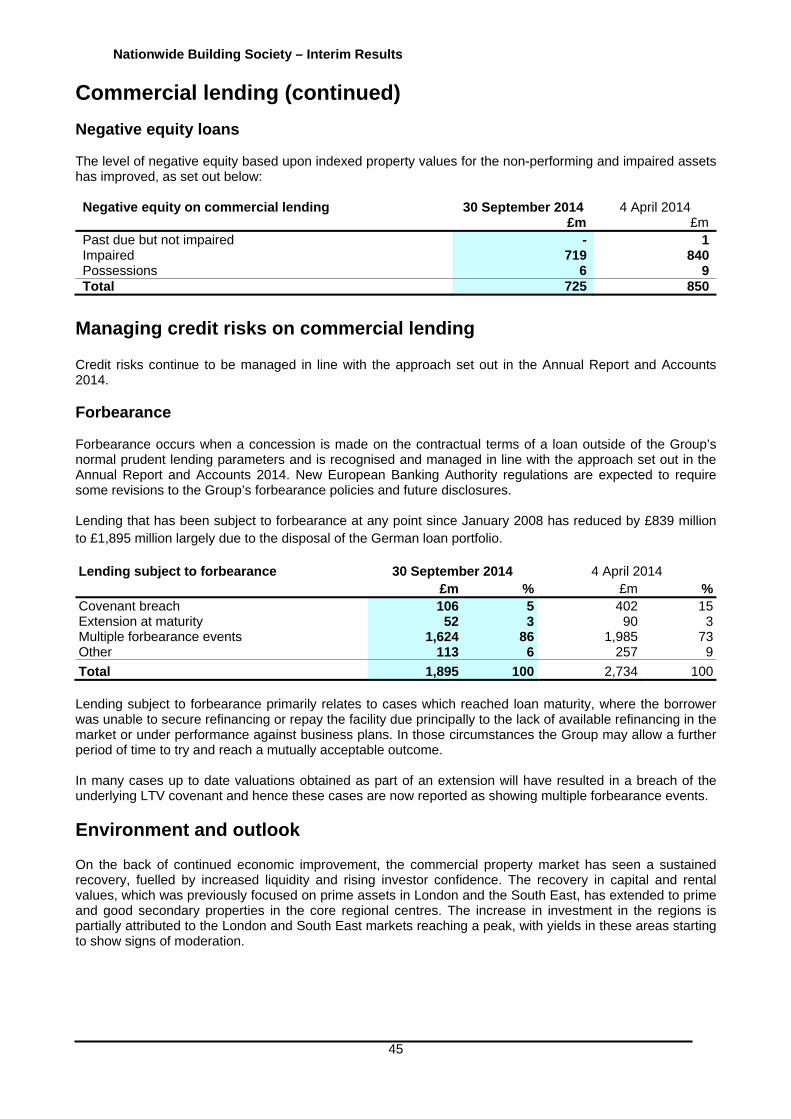
Nationwide Building Society – Interim Results
45
Commercial lending (continued) Negative equity loans The level of negative equity based upon indexed property values for the non-performing and impaired assets has improved, as set out below: Negative equity on commercial lending
30 September 2014 £m
4 April 2014 £m
Past due but not impaired - 1Impaired 719 840Possessions 6 9Total 725 850
Managing credit risks on commercial lending Credit risks continue to be managed in line with the approach set out in the Annual Report and Accounts 2014. Forbearance Forbearance occurs when a concession is made on the contractual terms of a loan outside of the Group’s normal prudent lending parameters and is recognised and managed in line with the approach set out in the Annual Report and Accounts 2014. New European Banking Authority regulations are expected to require some revisions to the Group’s forbearance policies and future disclosures. Lending that has been subject to forbearance at any point since January 2008 has reduced by £839 million to £1,895 million largely due to the disposal of the German loan portfolio. Lending subject to forbearance
30 September 2014 4 April 2014 £m % £m %
Covenant breach 106 5 402 15Extension at maturity 52 3 90 3Multiple forbearance events 1,624 86 1,985 73Other 113 6 257 9
Total 1,895 100 2,734 100 Lending subject to forbearance primarily relates to cases which reached loan maturity, where the borrower was unable to secure refinancing or repay the facility due principally to the lack of available refinancing in the market or under performance against business plans. In those circumstances the Group may allow a further period of time to try and reach a mutually acceptable outcome. In many cases up to date valuations obtained as part of an extension will have resulted in a breach of the underlying LTV covenant and hence these cases are now reported as showing multiple forbearance events.
Environment and outlook On the back of continued economic improvement, the commercial property market has seen a sustained recovery, fuelled by increased liquidity and rising investor confidence. The recovery in capital and rental values, which was previously focused on prime assets in London and the South East, has extended to prime and good secondary properties in the core regional centres. The increase in investment in the regions is partially attributed to the London and South East markets reaching a peak, with yields in these areas starting to show signs of moderation.

Nationwide Building Society – Interim Results
46
Commercial lending (continued) In the absence of new development, both the prime and secondary office markets remain buoyant, and in the industrial sector good demand is no longer limited to prime properties and is now evident across most regions. The retail sector continues to be affected by structural changes brought about by factors such as increased internet shopping and the decline of many high streets. As a result, whilst returns on prime retail properties are largely back to their pre-recession levels, the secondary retail market remains subdued. The outlook for commercial credit risk remains stable. Following a steadily improving first half, commercial property activity in 2015 is currently anticipated to be on a par with that seen in 2014, with capital and rental values for prime and good secondary properties in both London and the core regional centres being sustained where there is strong occupier demand. The General Election and wider global events may introduce some temporary market uncertainty in the first half of 2015. The Group will continue its strategy of reducing exposures which are outside of its current risk appetite or do not align to its existing lending strategy as opportunities to do so arise.

Nationwide Building Society – Interim Results
47
Other lending The total other lending portfolio of £114 million (4 April 2014: £176 million) represents a small and reducing percentage of the overall portfolio, being 0.07% (4 April 2014: 0.11%) of the Group’s loans and advances to customers, as set out in the table below. The reduction in other lending of £62 million to £114 million reflects both foreign exchange movements and, more significantly, deleveraging of out of policy loans relating to a European commercial loan facility, Cromarty CLO Ltd (Cromarty). Included within this portfolio are also amounts relating to a €100 million loan to a Luxembourg SPV that has first loss exposure to a €1.3 billion portfolio (4 April 2014: €1.5 billion) of senior ranking European ABS assets, of which 27% relates to peripheral European assets (4 April 2014: 27%).
30 September 2014 (Unaudited)
4 April 2014 (Audited)
£m % £m % Performing:
Neither past due nor impaired 20 18 69 40
Non-performing: Impaired 94 82 107 60
Total 114 100 176 100 Impairment provisions 30 12 Provision coverage ratio on total non-performing loans 32% 11%
Half year to 30 September 2014
(Unaudited)
Half year to 30 September 2013
(Unaudited) £m £m
Impairment losses for the period 21 4 The £94 million (4 April 2014: £107 million) of impaired balances in other lending primarily includes £78 million (4 April 2014: £82 million) relating to the Luxembourg SPV and £11 million (4 April 2014: £25 million) relating to Cromarty. The other lending impairment charge for the period of £21 million (30 September 2013: £4 million) includes £19 million in relation to a single, ring-fenced reference asset with a specific risk profile within the Luxembourg SPV facility.
Environment and outlook Other lending consists of a small pool of out of policy legacy assets which no longer conform to the Group’s credit risk appetite. These legacy assets continue to be closely monitored and are being run off.

Nationwide Building Society – Interim Results
48
Treasury assets and treasury credit risks
The Group’s treasury portfolio is held for liquidity management purposes and, in the case of derivatives, for market risk management. During the period the total treasury portfolio has increased by £4.6 billion principally as a result of pre-funding short dated maturities and in line with the Group’s commitment to achieve a liquidity coverage ratio of at least 100% in the short term. This increase in treasury assets, which is net of deleveraging £0.3 billion of out of policy assets, comprises growth in cash, gilts and highly rated covered bonds. Total treasury assets represent 13.0% (4 April 2014: 11.1%) of Group assets. Treasury asset balances 30 September 2014
(Unaudited) 4 April 2014
(Audited) £bn £bnCash 8.5 5.3Loans and advances to banks 2.5 2.1Investment securities 11.3 10.6Treasury liquidity and investment portfolio 22.3 18.0Derivative assets* 3.3 3.0Total treasury portfolio 25.6 21.0 *Derivatives are classified as assets where their fair value is positive and liabilities where their fair value is negative. As at 30 September 2014 the Group had derivative liabilities of £2.8 billion (4 April 2014: £2.4 billion).
Managing treasury credit risks Credit risk within the Treasury Division arises primarily from the instruments held by Treasury for liquidity and investment purposes. Credit risk is managed by the Treasury Credit Risk function which sets and monitors compliance with policy and limits, approves all new facilities and monitors existing exposures including:
liquidity and investment assets counterparty credit quality deleveraging and impairment country exposures derivatives and capital
Liquidity and investment assets The Group treasury assets held on the balance sheet at 30 September 2014 were £22.3 billion (4 April 2014: £18.0 billion). These are categorised into three separate portfolios: primary liquidity, other central bank eligible assets and other securities, to better reflect the management of the portfolios and bring the analysis in line with PRA definitions in BIPRU 12. Primary liquidity comprises cash and highly rated debt securities issued by governments or multi-lateral development banks. The remaining two portfolios comprise available for sale assets held for investment purposes and loans and advances to banks. The increase in the primary liquidity portfolio is mostly related to an increase in cash balances and a net investment in gilts in the period. The increase in the other central bank eligible portfolio largely relates to increases in highly rated covered bond holdings.

Nationwide Building Society – Interim Results
49
Treasury assets and treasury credit risks (continued) Counterparty credit quality The analysis of the on-balance sheet liquidity and investment portfolios by credit rating and geographical location of the issuers, set out in the tables below, indicates that counterparty credit quality has improved, with 76% of investments rated at AAA (4 April 2014: 71%).
30 September 2014 (Unaudited) £bn
AAA %
AA %
A%
Other%
UK%
US%
Europe%
Other%
Primary liquidity: Cash 8.5 100 - - - 100 - - -Gilts 4.9 100 - - - 100 - - -Non-domestic government bonds 1.8 38 62 - - - 22 78 -Supranational bonds 0.6 96 4 - - - - - 100Primary liquidity total 15.8 93 7 - - 85 2 9 4
Other Central Bank eligible: Residential mortgage backed securities (RMBS) 0.9 55 22 18 5 23 - 77 -Covered bonds 0.9 59 14 15 12 40 3 57 -Other (secondary liquidity) 0.1 57 - - 43 - - 100 -Other Central Bank eligible total 1.9 57 17 16 10 30 1 69 -
Other securities: Loans and advances to banks 2.5 13 14 61 12 53 14 20 13RMBS 0.7 31 4 59 6 82 3 10 5Commercial mortgage backed securities (CMBS) 0.1 - 13 46 41 42 50 8 -Collateralised loan obligations 0.5 66 29 - 5 56 44 - -Covered bonds 0.1 100 - - - - - 100 -Financial institution bonds - - - - - - - - - Student loans 0.4 28 50 19 3 - 100 - -Other 0.3 52 16 4 28 38 25 37 -Other securities total 4.6 27 17 45 11 50 24 17 9Total 22.3 76 10 11 3 73 7 15 5
4 April 2014 (Audited) £bn
AAA %
AA %
A %
Other %
UK %
US %
Europe %
Other %
Primary liquidity: Cash 5.3 100 - - - 100 - - - Gilts 4.5 100 - - - 100 - - - Non-domestic government bonds 1.8 35 65 - - - 22 78 - Supranational bonds 0.7 100 - - - - - - 100 Primary liquidity total 12.3 91 9 - - 80 4 11 5
Other Central Bank eligible: RMBS 0.8 42 29 17 12 12 - 88 - Covered bonds 0.5 29 17 34 20 29 5 66 - Other (secondary liquidity) 0.1 54 - - 46 - - 100 - Other Central Bank eligible total 1.4 38 22 23 17 18 2 80 - Other securities: Loans and advances to banks 2.1 15 10 75 - 53 17 23 7 RMBS 0.7 28 4 57 11 70 8 16 6 CMBS 0.2 - 24 38 38 40 29 31 - Collateralised loan obligations 0.6 50 44 - 6 52 48 - - Financial institution bonds 0.1 - - 100 - - - - 100 Student loans 0.4 29 51 17 3 3 97 - - Other 0.2 - 29 6 65 26 48 26 - Other securities total 4.3 23 19 51 7 49 29 17 5 Total 18.0 71 12 14 3 68 9 18 5
Note: Ratings used above are obtained from Standard & Poor’s in the majority of cases, from Moody’s if there is no Standard & Poor’s rating available, and internal ratings are used if neither is available.

Nationwide Building Society – Interim Results
50
Treasury assets and treasury credit risks (continued) Deleveraging and impairment During the period there was continued deleveraging of legacy treasury assets that are outside of current credit policy, reducing the total balance of out of policy assets from £1.8 billion to £1.5 billion, through targeted sales, maturities and amortisation. The Group considers out of policy assets to be legacy assets (bought prior to the financial crisis) that are no longer approved within the Group’s Treasury Credit Policy. These assets continue to be actively managed and, when market conditions provide opportunities to do so, the Group will seek to reduce this exposure through deleveraging. In assessing impairment the Group evaluates, among other factors, normal volatility in valuation, evidence of deterioration in the financial health of the obligor, industry and sector performance, and operational and financing cash flows. An impairment loss of £13 million (30 September 2014: write back of £1 million) has been recognised in the income statement in respect of assets held in ‘Other securities’, £8 million of which relates to out of policy available for sale (AFS) assets that were subsequently disposed of in October 2014, at a price broadly in line with carrying value. Country exposures As set out in the table below, the Group holds £712 million (4 April 2014: £782 million) of legacy out of policy securities which are domiciled in the ‘peripheral’ Eurozone countries. These amounts reflect the Group’s direct exposure to institutions, corporates and other issued securities. The Group has no direct sovereign exposure to these countries. Of the £712 million, 79% is rated A or above and 43% is rated AA or above (4 April 2014: 72% rated A or above, 39% rated AA or above). This legacy exposure has reduced by 9% in the period to 30 September 2014 due to disposals as part of the ongoing deleveraging exercise as well as scheduled pay downs and maturities. The Group continues to actively monitor this portfolio for opportunities to reduce the exposure further. 30 September 2014 (Unaudited)
Ireland£m
Italy£m
Portugal£m
Spain £m
Total£m
Mortgage backed securities - 56 49 278 383Covered bonds 36 - 21 269 326Other corporate - 3 - - 3Total 36 59 70 547 712
4 April 2014 (Audited)
Ireland £m
Italy £m
Portugal£m
Spain £m
Total £m
Mortgage backed securities 14 75 49 299 437Covered bonds 39 - 22 281 342Other corporate - 3 - - 3Total 53 78 71 580 782
Note: None of the Group’s exposures to the peripheral Eurozone countries detailed in the table above are in default, and the Group has not incurred any impairment on these assets in the period.
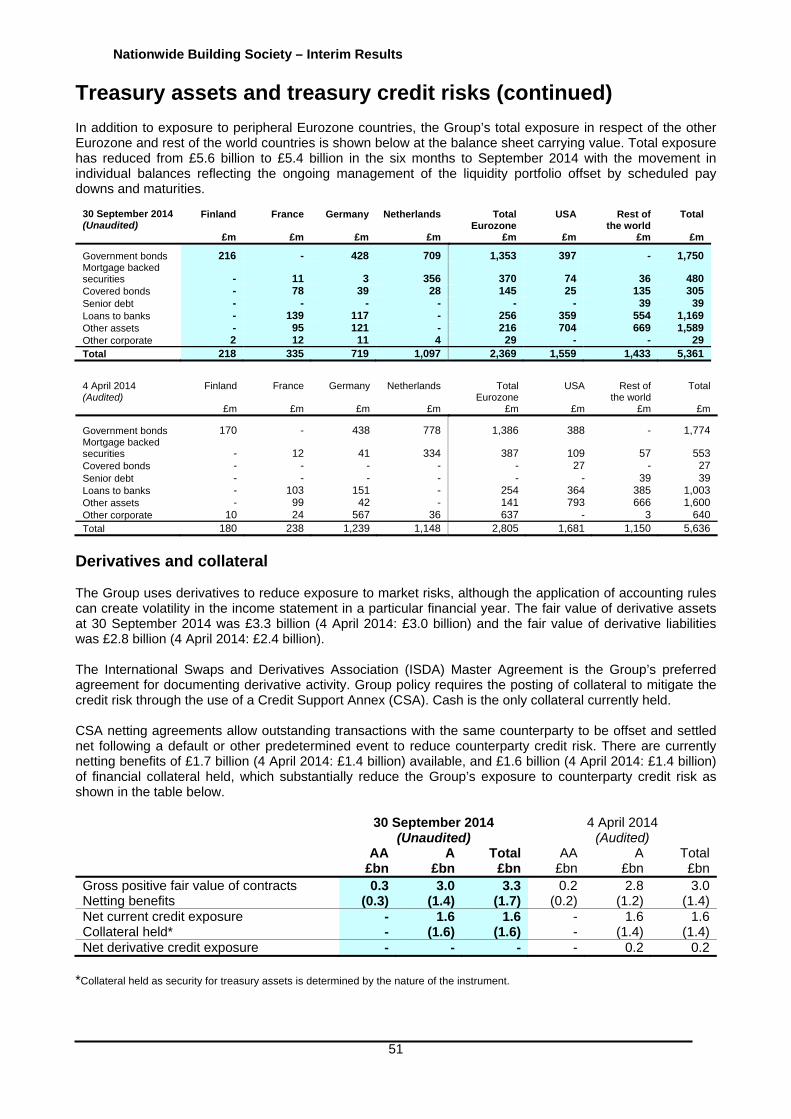
Nationwide Building Society – Interim Results
51
Treasury assets and treasury credit risks (continued) In addition to exposure to peripheral Eurozone countries, the Group’s total exposure in respect of the other Eurozone and rest of the world countries is shown below at the balance sheet carrying value. Total exposure has reduced from £5.6 billion to £5.4 billion in the six months to September 2014 with the movement in individual balances reflecting the ongoing management of the liquidity portfolio offset by scheduled pay downs and maturities.
30 September 2014 (Unaudited)
Finland
£m
France
£m
Germany
£m
Netherlands
£m
Total Eurozone
£m
USA
£m
Rest of the world
£m
Total
£m
Government bonds 216 - 428 709 1,353 397 - 1,750Mortgage backed securities - 11 3 356 370 74 36 480Covered bonds - 78 39 28 145 25 135 305Senior debt - - - - - - 39 39Loans to banks - 139 117 - 256 359 554 1,169Other assets - 95 121 - 216 704 669 1,589Other corporate 2 12 11 4 29 - - 29Total 218 335 719 1,097 2,369 1,559 1,433 5,361
4 April 2014 (Audited)
Finland
£m
France
£m
Germany
£m
Netherlands
£m
Total Eurozone
£m
USA
£m
Rest of the world
£m
Total
£m
Government bonds 170 - 438 778 1,386 388 - 1,774 Mortgage backed securities - 12 41 334 387 109 57 553 Covered bonds - - - - - 27 - 27 Senior debt - - - - - - 39 39 Loans to banks - 103 151 - 254 364 385 1,003 Other assets - 99 42 - 141 793 666 1,600 Other corporate 10 24 567 36 637 - 3 640 Total 180 238 1,239 1,148 2,805 1,681 1,150 5,636
Derivatives and collateral The Group uses derivatives to reduce exposure to market risks, although the application of accounting rules can create volatility in the income statement in a particular financial year. The fair value of derivative assets at 30 September 2014 was £3.3 billion (4 April 2014: £3.0 billion) and the fair value of derivative liabilities was £2.8 billion (4 April 2014: £2.4 billion). The International Swaps and Derivatives Association (ISDA) Master Agreement is the Group’s preferred agreement for documenting derivative activity. Group policy requires the posting of collateral to mitigate the credit risk through the use of a Credit Support Annex (CSA). Cash is the only collateral currently held. CSA netting agreements allow outstanding transactions with the same counterparty to be offset and settled net following a default or other predetermined event to reduce counterparty credit risk. There are currently netting benefits of £1.7 billion (4 April 2014: £1.4 billion) available, and £1.6 billion (4 April 2014: £1.4 billion) of financial collateral held, which substantially reduce the Group’s exposure to counterparty credit risk as shown in the table below. 30 September 2014
(Unaudited) 4 April 2014
(Audited) AA A Total AA A Total £bn £bn £bn £bn £bn £bnGross positive fair value of contracts 0.3 3.0 3.3 0.2 2.8 3.0Netting benefits (0.3) (1.4) (1.7) (0.2) (1.2) (1.4)Net current credit exposure - 1.6 1.6 - 1.6 1.6Collateral held* - (1.6) (1.6) - (1.4) (1.4)Net derivative credit exposure - - - - 0.2 0.2
*Collateral held as security for treasury assets is determined by the nature of the instrument.

Nationwide Building Society – Interim Results
52
Treasury assets and treasury credit risks (continued) Environment and outlook Close management of the portfolio and market improvements mean that the Group’s treasury assets now carry a lower credit risk. Continued deleveraging activities have removed some of the more vulnerable assets from the portfolio and the Group continues to look for further suitable opportunities to reduce exposure. The treasury asset portfolios show a stable risk outlook. Few assets are showing signs of credit deterioration and these continue to reduce with ongoing deleveraging and performance monitoring underpinned by robust risk governance processes. New investment activity remains limited to a small number of high quality asset classes with the aim of supporting liquidity holdings.
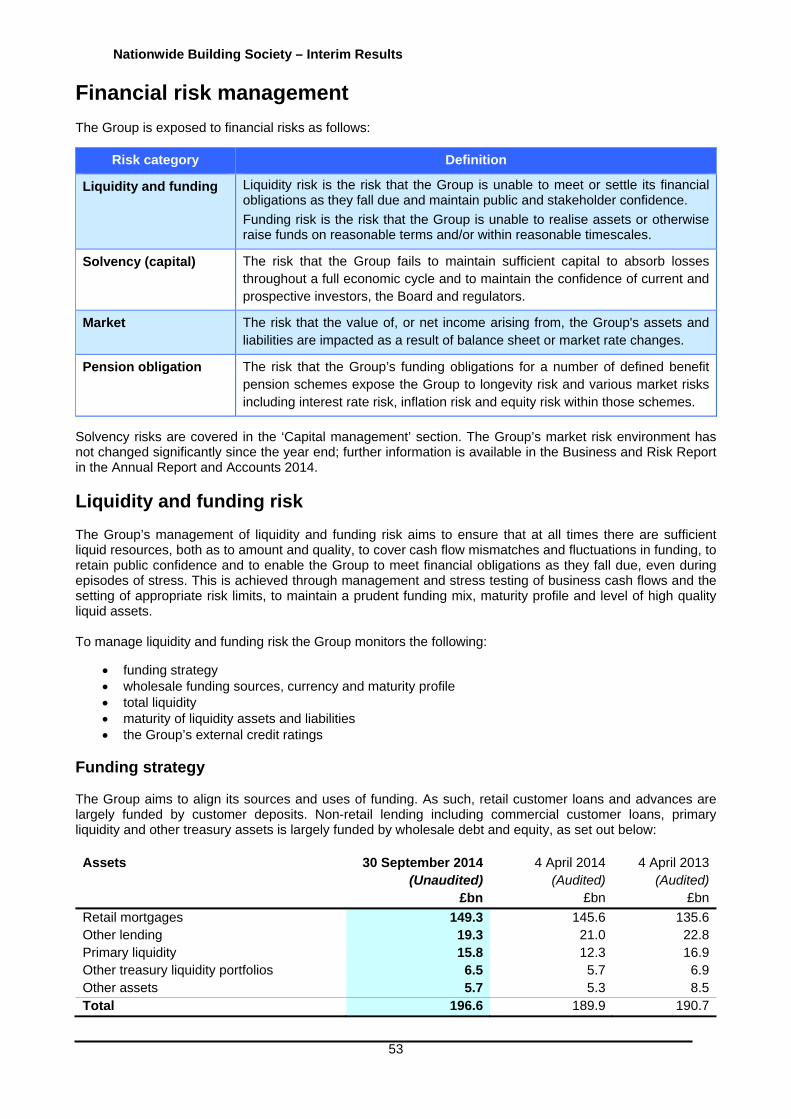
Nationwide Building Society – Interim Results
53
Financial risk management The Group is exposed to financial risks as follows:
Risk category Definition
Liquidity and funding Liquidity risk is the risk that the Group is unable to meet or settle its financial obligations as they fall due and maintain public and stakeholder confidence.
Funding risk is the risk that the Group is unable to realise assets or otherwise raise funds on reasonable terms and/or within reasonable timescales.
Solvency (capital) The risk that the Group fails to maintain sufficient capital to absorb losses throughout a full economic cycle and to maintain the confidence of current and prospective investors, the Board and regulators.
Market The risk that the value of, or net income arising from, the Group's assets and liabilities are impacted as a result of balance sheet or market rate changes.
Pension obligation The risk that the Group’s funding obligations for a number of defined benefit pension schemes expose the Group to longevity risk and various market risks including interest rate risk, inflation risk and equity risk within those schemes.
Solvency risks are covered in the ‘Capital management’ section. The Group’s market risk environment has not changed significantly since the year end; further information is available in the Business and Risk Report in the Annual Report and Accounts 2014.
Liquidity and funding risk The Group’s management of liquidity and funding risk aims to ensure that at all times there are sufficient liquid resources, both as to amount and quality, to cover cash flow mismatches and fluctuations in funding, to retain public confidence and to enable the Group to meet financial obligations as they fall due, even during episodes of stress. This is achieved through management and stress testing of business cash flows and the setting of appropriate risk limits, to maintain a prudent funding mix, maturity profile and level of high quality liquid assets. To manage liquidity and funding risk the Group monitors the following:
funding strategy wholesale funding sources, currency and maturity profile total liquidity maturity of liquidity assets and liabilities the Group’s external credit ratings
Funding strategy The Group aims to align its sources and uses of funding. As such, retail customer loans and advances are largely funded by customer deposits. Non-retail lending including commercial customer loans, primary liquidity and other treasury assets is largely funded by wholesale debt and equity, as set out below: Assets 30 September 2014
(Unaudited)4 April 2014
(Audited) 4 April 2013
(Audited)£bn £bn £bn
Retail mortgages 149.3 145.6 135.6Other lending 19.3 21.0 22.8Primary liquidity 15.8 12.3 16.9Other treasury liquidity portfolios 6.5 5.7 6.9Other assets 5.7 5.3 8.5Total 196.6 189.9 190.7
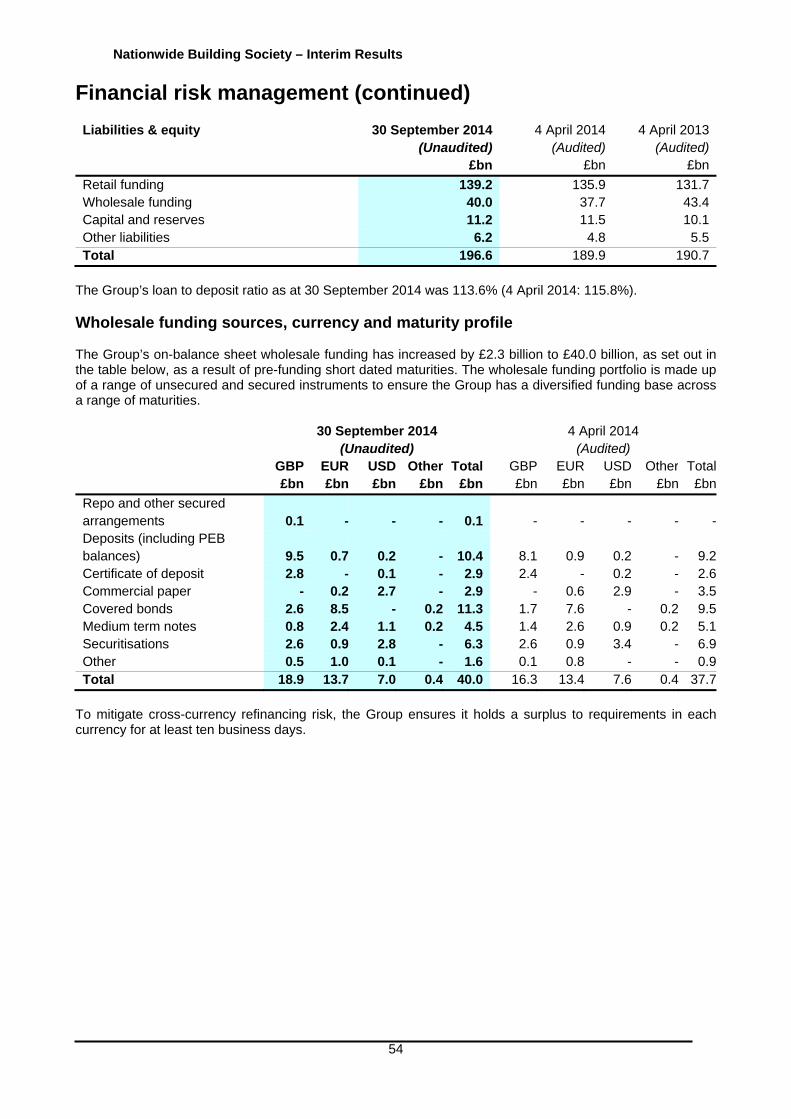
Nationwide Building Society – Interim Results
54
Financial risk management (continued) Liabilities & equity 30 September 2014
(Unaudited)4 April 2014
(Audited) 4 April 2013
(Audited)£bn £bn £bn
Retail funding 139.2 135.9 131.7Wholesale funding 40.0 37.7 43.4Capital and reserves 11.2 11.5 10.1Other liabilities 6.2 4.8 5.5Total 196.6 189.9 190.7
The Group’s loan to deposit ratio as at 30 September 2014 was 113.6% (4 April 2014: 115.8%). Wholesale funding sources, currency and maturity profile The Group’s on-balance sheet wholesale funding has increased by £2.3 billion to £40.0 billion, as set out in the table below, as a result of pre-funding short dated maturities. The wholesale funding portfolio is made up of a range of unsecured and secured instruments to ensure the Group has a diversified funding base across a range of maturities. 30 September 2014
(Unaudited) 4 April 2014
(Audited) GBP
£bn EUR£bn
USD£bn
Other£bn
Total£bn
GBP£bn
EUR£bn
USD£bn
Other £bn
Total£bn
Repo and other secured arrangements 0.1 - - - 0.1 - - - - -Deposits (including PEB balances) 9.5 0.7 0.2 - 10.4 8.1 0.9 0.2 - 9.2Certificate of deposit 2.8 - 0.1 - 2.9 2.4 - 0.2 - 2.6Commercial paper - 0.2 2.7 - 2.9 - 0.6 2.9 - 3.5Covered bonds 2.6 8.5 - 0.2 11.3 1.7 7.6 - 0.2 9.5Medium term notes 0.8 2.4 1.1 0.2 4.5 1.4 2.6 0.9 0.2 5.1Securitisations 2.6 0.9 2.8 - 6.3 2.6 0.9 3.4 - 6.9Other 0.5 1.0 0.1 - 1.6 0.1 0.8 - - 0.9Total 18.9 13.7 7.0 0.4 40.0 16.3 13.4 7.6 0.4 37.7
To mitigate cross-currency refinancing risk, the Group ensures it holds a surplus to requirements in each currency for at least ten business days.
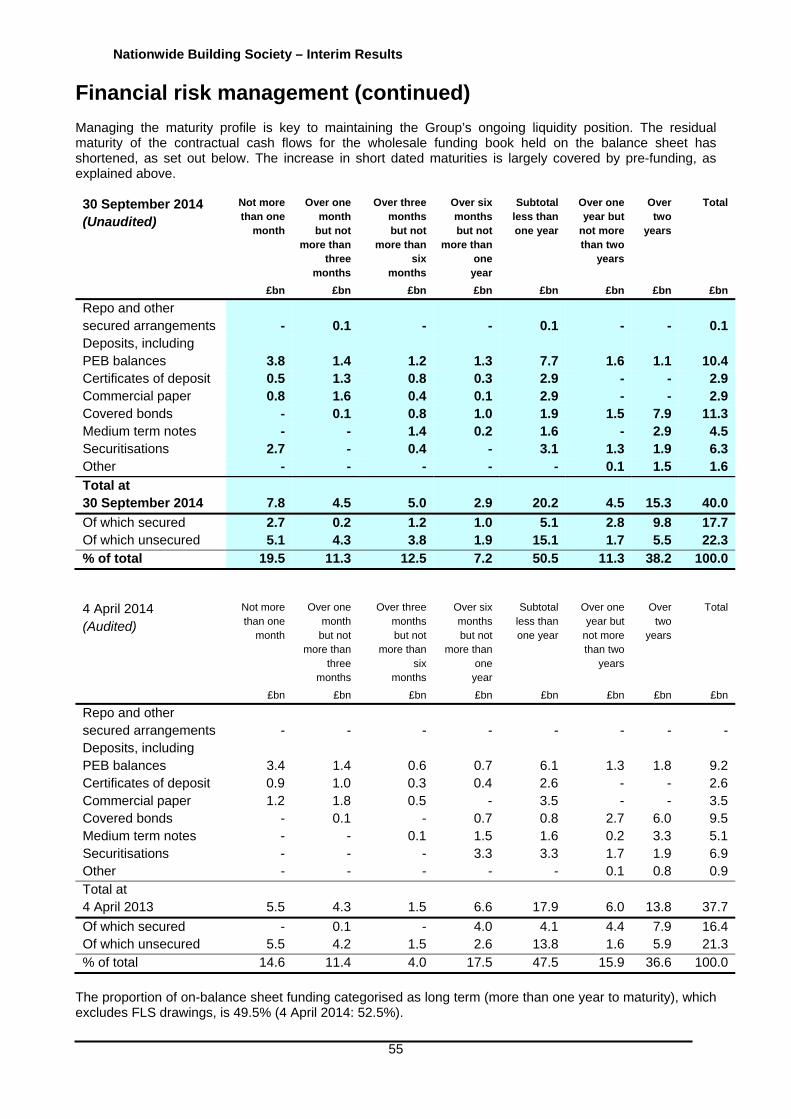
Nationwide Building Society – Interim Results
55
Financial risk management (continued) Managing the maturity profile is key to maintaining the Group’s ongoing liquidity position. The residual maturity of the contractual cash flows for the wholesale funding book held on the balance sheet has shortened, as set out below. The increase in short dated maturities is largely covered by pre-funding, as explained above. 30 September 2014 (Unaudited)
Not more than one
month
Over one month
but not more than
three months
Over three months but not
more than six
months
Over six months but not
more than one
year
Subtotal less than one year
Over one year but
not more than two
years
Over two
years
Total
£bn £bn £bn £bn £bn £bn £bn £bn
Repo and other secured arrangements -
0.1 -
-
0.1
-
-
0.1
Deposits, including PEB balances
3.8
1.4
1.2
1.3
7.7
1.6
1.1
10.4
Certificates of deposit 0.5 1.3 0.8 0.3 2.9 - - 2.9 Commercial paper 0.8 1.6 0.4 0.1 2.9 - - 2.9 Covered bonds - 0.1 0.8 1.0 1.9 1.5 7.9 11.3 Medium term notes - - 1.4 0.2 1.6 - 2.9 4.5 Securitisations 2.7 - 0.4 - 3.1 1.3 1.9 6.3 Other - - - - - 0.1 1.5 1.6
Total at 30 September 2014
7.8
4.5
5.0
2.9
20.2
4.5
15.3
40.0
Of which secured 2.7 0.2 1.2 1.0 5.1 2.8 9.8 17.7 Of which unsecured 5.1 4.3 3.8 1.9 15.1 1.7 5.5 22.3 % of total 19.5 11.3 12.5 7.2 50.5 11.3 38.2 100.0
4 April 2014 (Audited)
Not more than one
month
Over one month
but not more than
three months
Over three months but not
more than six
months
Over six months but not
more than one
year
Subtotal less than one year
Over one year but
not more than two
years
Over two
years
Total
£bn £bn £bn £bn £bn £bn £bn £bn
Repo and other secured arrangements - - - - - - - -Deposits, including PEB balances 3.4 1.4 0.6 0.7 6.1 1.3 1.8 9.2Certificates of deposit 0.9 1.0 0.3 0.4 2.6 - - 2.6Commercial paper 1.2 1.8 0.5 - 3.5 - - 3.5Covered bonds - 0.1 - 0.7 0.8 2.7 6.0 9.5Medium term notes - - 0.1 1.5 1.6 0.2 3.3 5.1Securitisations - - - 3.3 3.3 1.7 1.9 6.9Other - - - - - 0.1 0.8 0.9Total at 4 April 2013 5.5 4.3 1.5 6.6 17.9 6.0 13.8 37.7
Of which secured - 0.1 - 4.0 4.1 4.4 7.9 16.4Of which unsecured 5.5 4.2 1.5 2.6 13.8 1.6 5.9 21.3% of total 14.6 11.4 4.0 17.5 47.5 15.9 36.6 100.0
The proportion of on-balance sheet funding categorised as long term (more than one year to maturity), which excludes FLS drawings, is 49.5% (4 April 2014: 52.5%).
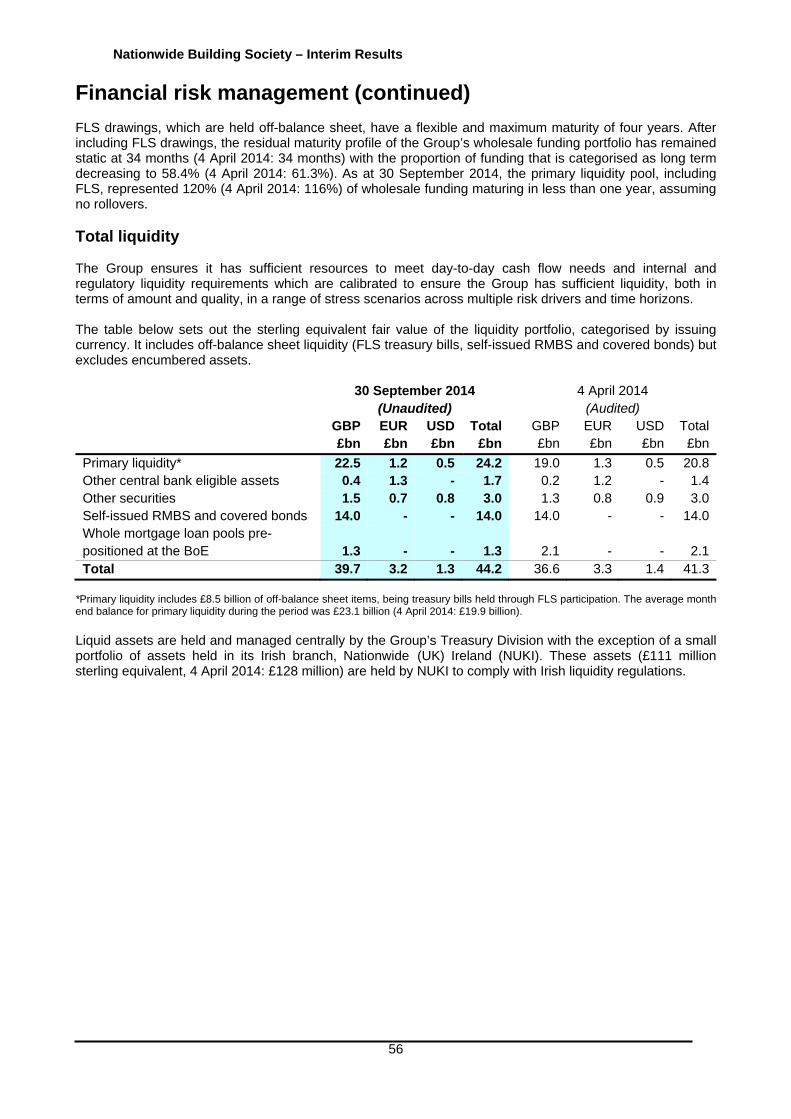
Nationwide Building Society – Interim Results
56
Financial risk management (continued) FLS drawings, which are held off-balance sheet, have a flexible and maximum maturity of four years. After including FLS drawings, the residual maturity profile of the Group’s wholesale funding portfolio has remained static at 34 months (4 April 2014: 34 months) with the proportion of funding that is categorised as long term decreasing to 58.4% (4 April 2014: 61.3%). As at 30 September 2014, the primary liquidity pool, including FLS, represented 120% (4 April 2014: 116%) of wholesale funding maturing in less than one year, assuming no rollovers. Total liquidity The Group ensures it has sufficient resources to meet day-to-day cash flow needs and internal and regulatory liquidity requirements which are calibrated to ensure the Group has sufficient liquidity, both in terms of amount and quality, in a range of stress scenarios across multiple risk drivers and time horizons. The table below sets out the sterling equivalent fair value of the liquidity portfolio, categorised by issuing currency. It includes off-balance sheet liquidity (FLS treasury bills, self-issued RMBS and covered bonds) but excludes encumbered assets. 30 September 2014
(Unaudited) 4 April 2014
(Audited) GBP
£bnEUR£bn
USD£bn
Total£bn
GBP £bn
EUR £bn
USD £bn
Total £bn
Primary liquidity* 22.5 1.2 0.5 24.2 19.0 1.3 0.5 20.8Other central bank eligible assets 0.4 1.3 - 1.7 0.2 1.2 - 1.4Other securities 1.5 0.7 0.8 3.0 1.3 0.8 0.9 3.0Self-issued RMBS and covered bonds 14.0 - - 14.0 14.0 - - 14.0Whole mortgage loan pools pre-positioned at the BoE 1.3 - - 1.3 2.1 - - 2.1Total 39.7 3.2 1.3 44.2 36.6 3.3 1.4 41.3
*Primary liquidity includes £8.5 billion of off-balance sheet items, being treasury bills held through FLS participation. The average month end balance for primary liquidity during the period was £23.1 billion (4 April 2014: £19.9 billion). Liquid assets are held and managed centrally by the Group’s Treasury Division with the exception of a small portfolio of assets held in its Irish branch, Nationwide (UK) Ireland (NUKI). These assets (£111 million sterling equivalent, 4 April 2014: £128 million) are held by NUKI to comply with Irish liquidity regulations.
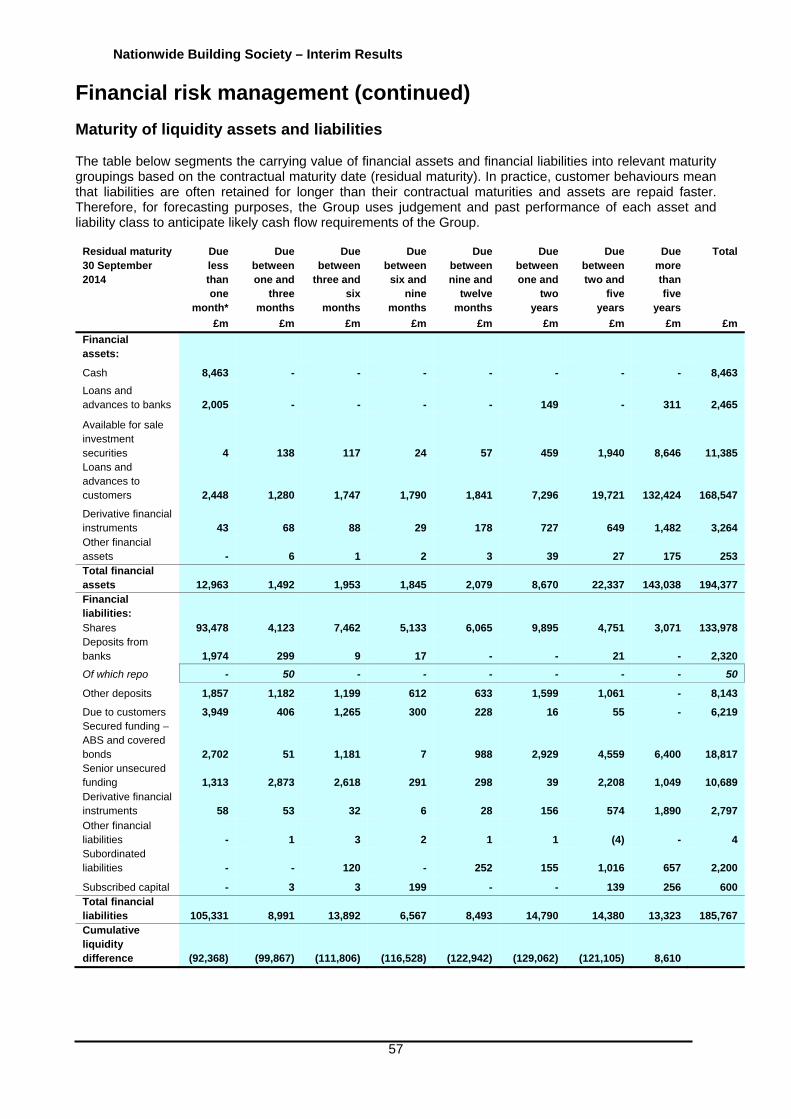
Nationwide Building Society – Interim Results
57
Financial risk management (continued) Maturity of liquidity assets and liabilities The table below segments the carrying value of financial assets and financial liabilities into relevant maturity groupings based on the contractual maturity date (residual maturity). In practice, customer behaviours mean that liabilities are often retained for longer than their contractual maturities and assets are repaid faster. Therefore, for forecasting purposes, the Group uses judgement and past performance of each asset and liability class to anticipate likely cash flow requirements of the Group.
Residual maturity 30 September 2014
Due less than one
month*
Due between one and
three months
Due between
three and six
months
Due between
six and nine
months
Due between nine and
twelve months
Due between one and
two years
Due between two and
five years
Due more than five
years
Total
£m £m £m £m £m £m £m £m £m
Financial assets:
Cash 8,463 - - - - - - - 8,463
Loans and advances to banks
2,005 - - - - 149 -
311
2,465
Available for sale investment securities
4 138 117 24 57 459 1,940
8,646
11,385
Loans and advances to customers
2,448 1,280 1,747 1,790 1,841 7,296 19,721
132,424
168,547
Derivative financial instruments 43 68 88 29 178 727 649 1,482 3,264 Other financial assets
- 6 1 2 3 39 27
175
253
Total financial assets
12,963 1,492 1,953 1,845 2,079 8,670 22,337
143,038
194,377
Financial liabilities: Shares 93,478 4,123 7,462 5,133 6,065 9,895 4,751 3,071 133,978 Deposits from banks 1,974 299 9 17 - - 21 - 2,320
Of which repo - 50 - - - - - - 50
Other deposits 1,857 1,182 1,199 612 633 1,599 1,061 - 8,143
Due to customers 3,949 406 1,265 300 228 16 55 - 6,219 Secured funding – ABS and covered bonds
2,702 51 1,181 7 988 2,929 4,559
6,400
18,817
Senior unsecured funding 1,313 2,873 2,618 291 298 39 2,208 1,049 10,689 Derivative financial instruments 58 53 32 6 28 156 574 1,890 2,797
Other financial liabilities - 1 3 2 1 1 (4) - 4 Subordinated liabilities
- - 120 - 252 155 1,016
657
2,200
Subscribed capital - 3 3 199 - - 139 256 600 Total financial liabilities
105,331 8,991 13,892 6,567 8,493 14,790 14,380
13,323
185,767
Cumulative liquidity difference (92,368) (99,867) (111,806) (116,528) (122,942) (129,062) (121,105)
8,610
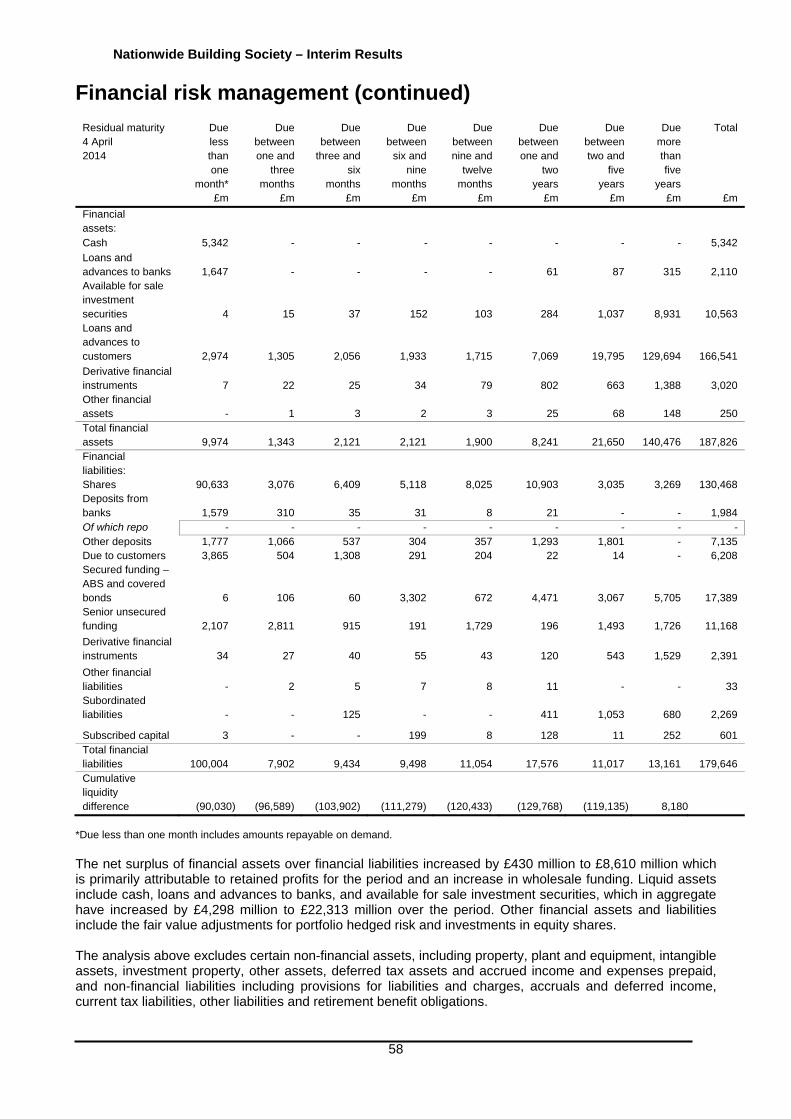
Nationwide Building Society – Interim Results
58
Financial risk management (continued)
Residual maturity 4 April 2014
Due less than one
month*
Due between one and
three months
Due between
three and six
months
Due between
six and nine
months
Due between nine and
twelve months
Due between one and
two years
Due between two and
five years
Due more than five
years
Total
£m £m £m £m £m £m £m £m £m
Financial assets: Cash 5,342 - - - - - - - 5,342
Loans and advances to banks 1,647 - - - - 61 87 315 2,110 Available for sale investment securities 4 15 37 152 103 284 1,037 8,931 10,563 Loans and advances to customers 2,974 1,305 2,056 1,933 1,715 7,069 19,795 129,694 166,541
Derivative financial instruments 7 22 25 34 79 802 663 1,388 3,020 Other financial assets - 1 3 2 3 25 68 148 250 Total financial assets 9,974 1,343 2,121 2,121 1,900 8,241 21,650 140,476 187,826 Financial liabilities: Shares 90,633 3,076 6,409 5,118 8,025 10,903 3,035 3,269 130,468 Deposits from banks 1,579 310 35 31 8 21 - - 1,984 Of which repo - - - - - - - - - Other deposits 1,777 1,066 537 304 357 1,293 1,801 - 7,135 Due to customers 3,865 504 1,308 291 204 22 14 - 6,208 Secured funding – ABS and covered bonds 6 106 60 3,302 672 4,471 3,067 5,705 17,389 Senior unsecured funding 2,107 2,811 915 191 1,729 196 1,493 1,726 11,168
Derivative financial instruments 34 27 40 55 43 120 543 1,529 2,391
Other financial liabilities - 2 5 7 8 11 - - 33 Subordinated liabilities - - 125 - - 411 1,053 680 2,269
Subscribed capital 3 - - 199 8 128 11 252 601 Total financial liabilities 100,004 7,902 9,434 9,498 11,054 17,576 11,017 13,161 179,646 Cumulative liquidity difference (90,030) (96,589) (103,902) (111,279) (120,433) (129,768) (119,135)
8,180
*Due less than one month includes amounts repayable on demand. The net surplus of financial assets over financial liabilities increased by £430 million to £8,610 million which is primarily attributable to retained profits for the period and an increase in wholesale funding. Liquid assets include cash, loans and advances to banks, and available for sale investment securities, which in aggregate have increased by £4,298 million to £22,313 million over the period. Other financial assets and liabilities include the fair value adjustments for portfolio hedged risk and investments in equity shares. The analysis above excludes certain non-financial assets, including property, plant and equipment, intangible assets, investment property, other assets, deferred tax assets and accrued income and expenses prepaid, and non-financial liabilities including provisions for liabilities and charges, accruals and deferred income, current tax liabilities, other liabilities and retirement benefit obligations.
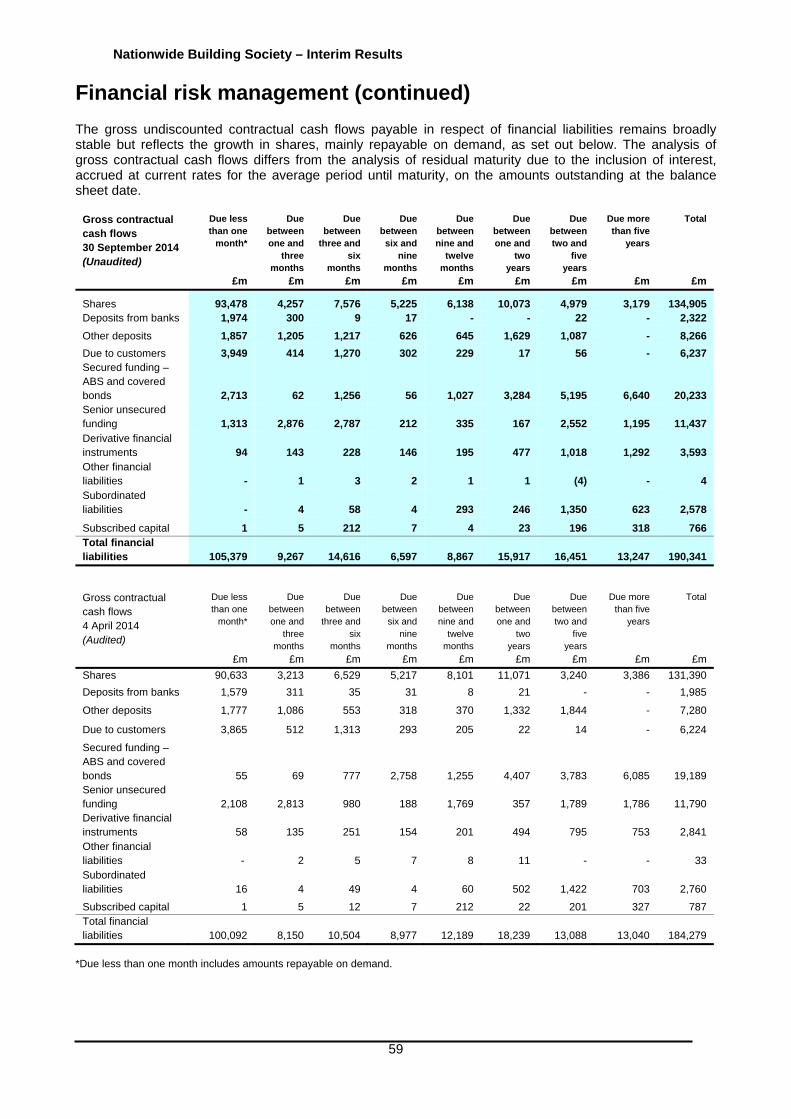
Nationwide Building Society – Interim Results
59
Financial risk management (continued)
The gross undiscounted contractual cash flows payable in respect of financial liabilities remains broadly stable but reflects the growth in shares, mainly repayable on demand, as set out below. The analysis of gross contractual cash flows differs from the analysis of residual maturity due to the inclusion of interest, accrued at current rates for the average period until maturity, on the amounts outstanding at the balance sheet date.
Gross contractual cash flows 30 September 2014 (Unaudited)
Due less than one
month*
Due between one and
three months
Due between
three and six
months
Due between six and
nine months
Due between nine and
twelve months
Due between one and
two years
Due between two and
five years
Due more than five
years
Total
£m £m £m £m £m £m £m £m £m
Shares 93,478 4,257 7,576 5,225 6,138 10,073 4,979 3,179 134,905 Deposits from banks 1,974 300 9 17 - - 22 - 2,322
Other deposits 1,857 1,205 1,217 626 645 1,629 1,087 - 8,266
Due to customers 3,949 414 1,270 302 229 17 56 - 6,237 Secured funding – ABS and covered bonds
2,713 62 1,256 56 1,027 3,284 5,195 6,640 20,233
Senior unsecured funding 1,313 2,876 2,787 212 335 167 2,552 1,195 11,437 Derivative financial instruments
94
143
228
146
195
477
1,018
1,292
3,593
Other financial liabilities - 1
3 2
1
1 (4) -
4
Subordinated liabilities - 4
58 4
293
246
1,350 623
2,578
Subscribed capital 1 5 212 7 4 23 196 318 766 Total financial liabilities
105,379
9,267
14,616
6,597
8,867
15,917
16,451
13,247
190,341
Gross contractual cash flows 4 April 2014 (Audited)
Due less than one
month*
Due between one and
three months
Due between
three and six
months
Due between
six and nine
months
Due between nine and
twelve months
Due between one and
two years
Due between two and
five years
Due more than five
years
Total
£m £m £m £m £m £m £m £m £m
Shares 90,633 3,213 6,529 5,217 8,101 11,071 3,240 3,386 131,390
Deposits from banks 1,579 311 35 31 8 21 - - 1,985
Other deposits 1,777 1,086 553 318 370 1,332 1,844 - 7,280
Due to customers 3,865 512 1,313 293 205 22 14 - 6,224
Secured funding – ABS and covered bonds 55 69 777 2,758 1,255 4,407 3,783 6,085 19,189 Senior unsecured funding 2,108 2,813 980 188 1,769 357 1,789 1,786 11,790 Derivative financial instruments 58 135 251 154 201 494 795 753 2,841 Other financial liabilities - 2 5 7 8 11 - - 33 Subordinated liabilities 16 4 49 4 60 502 1,422 703 2,760
Subscribed capital 1 5 12 7 212 22 201 327 787 Total financial liabilities 100,092 8,150 10,504 8,977 12,189 18,239 13,088 13,040 184,279
*Due less than one month includes amounts repayable on demand.
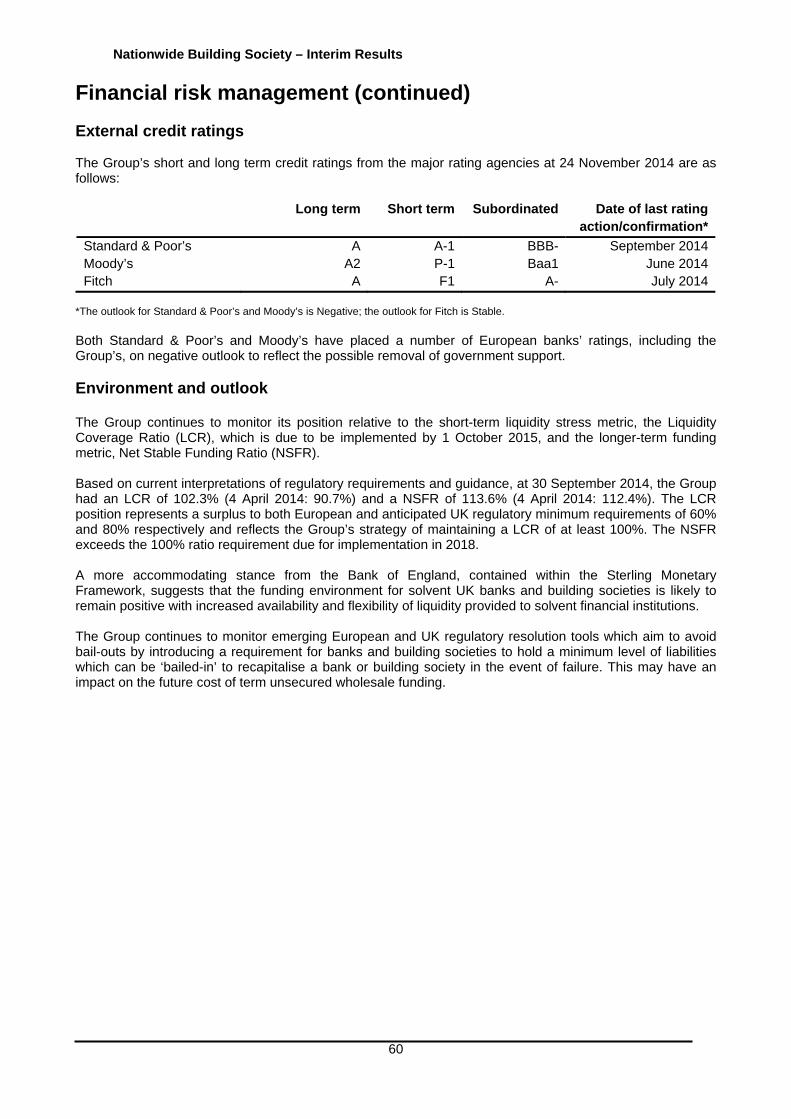
Nationwide Building Society – Interim Results
60
Financial risk management (continued)
External credit ratings The Group’s short and long term credit ratings from the major rating agencies at 24 November 2014 are as follows:
Long term Short term Subordinated Date of last rating action/confirmation*
Standard & Poor’s A A-1 BBB- September 2014Moody’s A2 P-1 Baa1 June 2014Fitch A F1 A- July 2014
*The outlook for Standard & Poor’s and Moody’s is Negative; the outlook for Fitch is Stable. Both Standard & Poor’s and Moody’s have placed a number of European banks’ ratings, including the Group’s, on negative outlook to reflect the possible removal of government support. Environment and outlook The Group continues to monitor its position relative to the short-term liquidity stress metric, the Liquidity Coverage Ratio (LCR), which is due to be implemented by 1 October 2015, and the longer-term funding metric, Net Stable Funding Ratio (NSFR). Based on current interpretations of regulatory requirements and guidance, at 30 September 2014, the Group had an LCR of 102.3% (4 April 2014: 90.7%) and a NSFR of 113.6% (4 April 2014: 112.4%). The LCR position represents a surplus to both European and anticipated UK regulatory minimum requirements of 60% and 80% respectively and reflects the Group’s strategy of maintaining a LCR of at least 100%. The NSFR exceeds the 100% ratio requirement due for implementation in 2018. A more accommodating stance from the Bank of England, contained within the Sterling Monetary Framework, suggests that the funding environment for solvent UK banks and building societies is likely to remain positive with increased availability and flexibility of liquidity provided to solvent financial institutions. The Group continues to monitor emerging European and UK regulatory resolution tools which aim to avoid bail-outs by introducing a requirement for banks and building societies to hold a minimum level of liabilities which can be ‘bailed-in’ to recapitalise a bank or building society in the event of failure. This may have an impact on the future cost of term unsecured wholesale funding.
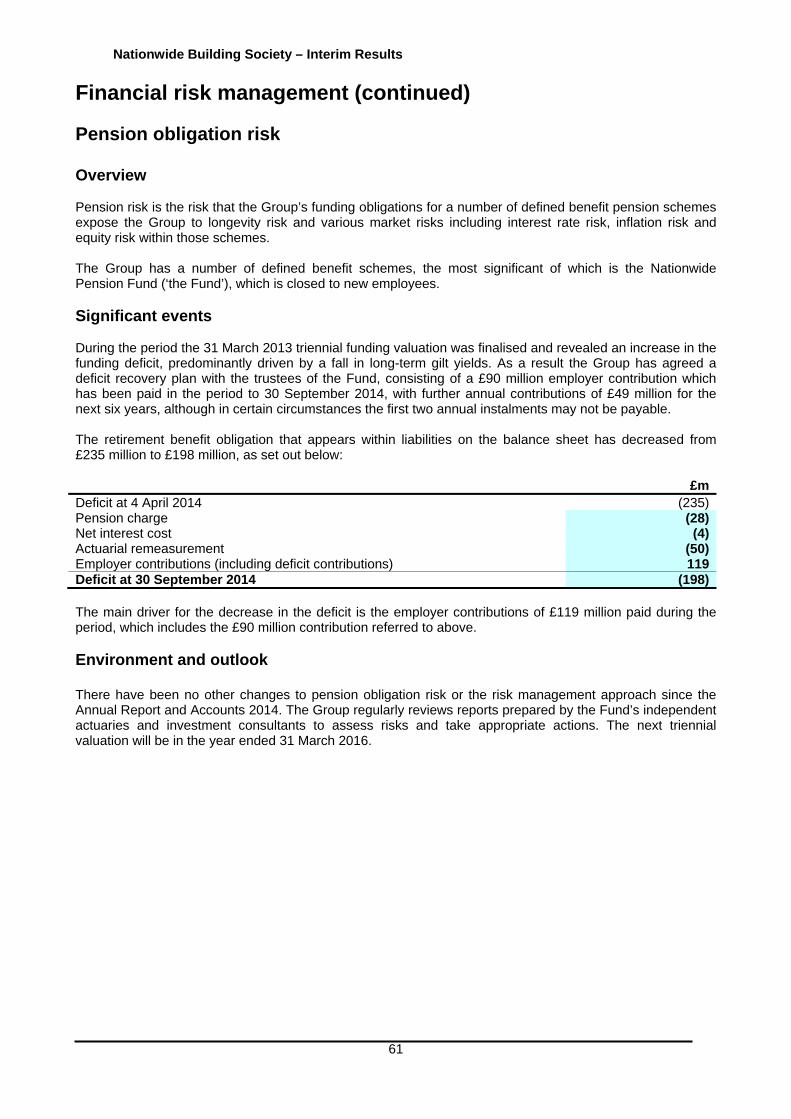
Nationwide Building Society – Interim Results
61
Financial risk management (continued) Pension obligation risk Overview Pension risk is the risk that the Group’s funding obligations for a number of defined benefit pension schemes expose the Group to longevity risk and various market risks including interest rate risk, inflation risk and equity risk within those schemes. The Group has a number of defined benefit schemes, the most significant of which is the Nationwide Pension Fund (‘the Fund’), which is closed to new employees. Significant events During the period the 31 March 2013 triennial funding valuation was finalised and revealed an increase in the funding deficit, predominantly driven by a fall in long-term gilt yields. As a result the Group has agreed a deficit recovery plan with the trustees of the Fund, consisting of a £90 million employer contribution which has been paid in the period to 30 September 2014, with further annual contributions of £49 million for the next six years, although in certain circumstances the first two annual instalments may not be payable. The retirement benefit obligation that appears within liabilities on the balance sheet has decreased from £235 million to £198 million, as set out below: £mDeficit at 4 April 2014 (235)Pension charge (28)Net interest cost (4)Actuarial remeasurement (50)Employer contributions (including deficit contributions) 119Deficit at 30 September 2014 (198) The main driver for the decrease in the deficit is the employer contributions of £119 million paid during the period, which includes the £90 million contribution referred to above. Environment and outlook There have been no other changes to pension obligation risk or the risk management approach since the Annual Report and Accounts 2014. The Group regularly reviews reports prepared by the Fund’s independent actuaries and investment consultants to assess risks and take appropriate actions. The next triennial valuation will be in the year ended 31 March 2016.

Nationwide Building Society – Interim Results
62
Capital management
Overview Capital is held by the Group to protect its depositors, cover its inherent risks, provide a cushion for stress events and support its business strategy. In assessing the adequacy of its capital resources, Nationwide considers its risk appetite in the context of the material risks to which it is exposed and the appropriate strategies required to manage those risks. The Group manages its capital structure to ensure it continues to meet minimum regulatory requirements, as well as meeting the expectations of other key stakeholders. As part of the risk appetite framework, the Group targets a Common Equity Tier 1 (CET1) ratio amongst the best in the market compared to major banking peers. The Group’s strategy is to meet this through retained earnings, supplemented by external capital where appropriate, as well as the strategic management of credit risk.
Capital position The Group’s capital and leverage ratios have increased since 4 April 2014 as a result of a strong trading performance and deleveraging of the commercial real estate portfolio and out of policy treasury assets. In addition, increasing house prices have resulted in lower risk weighted assets attributable to retail mortgages, despite growth in the mortgage book. The Group’s key capital measures at 30 September 2014 are summarised in the table below: Key capital ratios
30 September 2014
4 April 2014
% %Common Equity Tier 1 (CET1) ratio (end point) 17.6 14.5Leverage ratio* 3.8 3.4
*The leverage ratio is calculated using the January 2014 BCBS definition. The comparative has been restated to align to the revised definition (previously reported as 3.3% under the Basel III definition). The capital disclosures included in this report are reported on a CRD IV ‘end point’ basis unless otherwise stated. This assumes that all CRD IV requirements were in force during the period, with no transitional provisions permitted. The transitional provisions allow PIBS and certain subordinated debt instruments to be eligible as capital under grandfathering provisions but do not allow gains on the available for sale reserve to be included in CET1. On a transitional basis the CET1 ratio is also 17.6% (4 April 2014: 14.5%). In addition, the capital disclosures included in this report are on a Group (consolidated) basis, including all subsidiary entities, unless otherwise stated. The CET1 on an Individual (solo) consolidated basis at 30 September 2014 is 17.5%. More detail on the Group’s capital position measured on an Individual consolidated basis can be found in the Group’s 2014 Pillar 3 disclosures. The Group previously disclosed PRA adjusted ratios, which applied across the industry following the PRA’s capital shortfall exercise in June 2013. In June 2014, the PRA announced that the adjustments would no longer apply from 1 July 2014, and therefore adjusted ratios have not been disclosed in this report. CET1 capital has increased from £5,849 million to £6,707 million over the period due to profit for the six months and a reduction in the excess of expected losses over impairment, primarily as a result of continued deleveraging of the commercial real estate portfolio. The increases in Total Tier 1 capital (from £6,841 million to £7,699 million) and Total regulatory capital (from £8,925 million to £9,673 million) reflect the increase in CET1 resources and, in the case of Total regulatory capital, some offset relating to the fair value adjustment and amortisation of issue costs on dated subordinated debt.
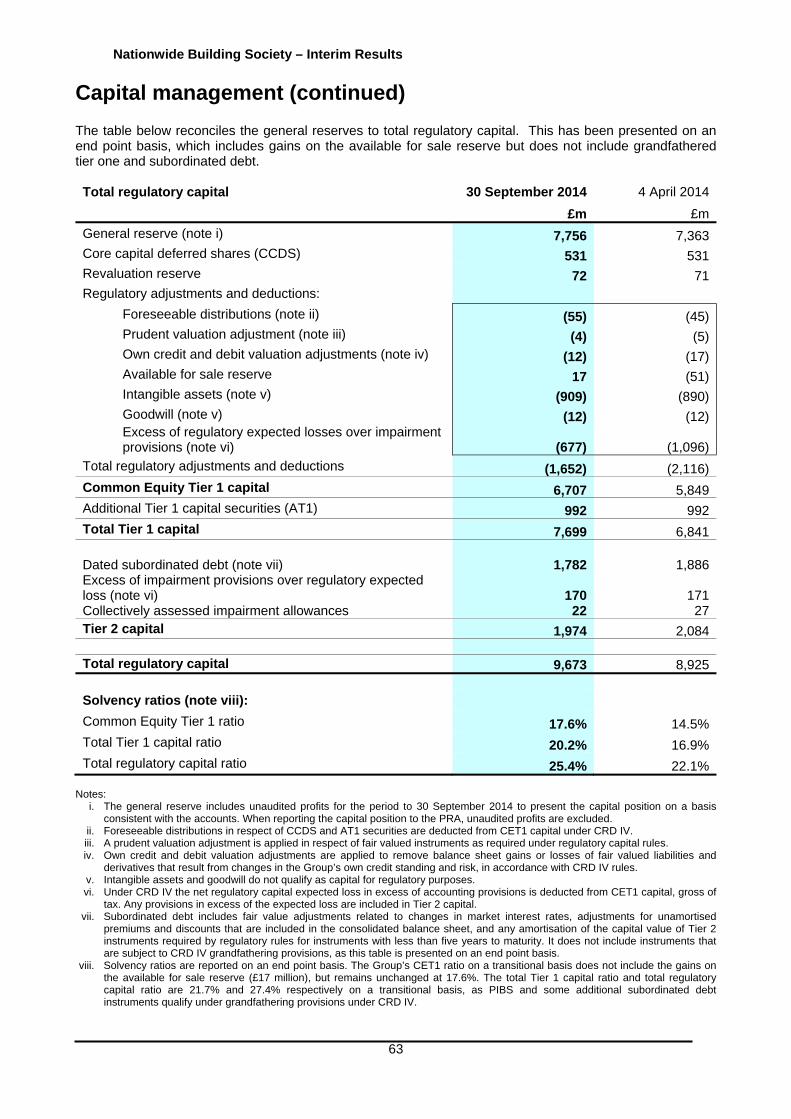
Nationwide Building Society – Interim Results
63
Capital management (continued) The table below reconciles the general reserves to total regulatory capital. This has been presented on an end point basis, which includes gains on the available for sale reserve but does not include grandfathered tier one and subordinated debt. Total regulatory capital
30 September 2014 4 April 2014
£m £m
General reserve (note i) 7,756 7,363Core capital deferred shares (CCDS) 531 531Revaluation reserve 72 71Regulatory adjustments and deductions:
Foreseeable distributions (note ii) (55) (45)Prudent valuation adjustment (note iii) (4) (5)Own credit and debit valuation adjustments (note iv) (12) (17)Available for sale reserve 17 (51)Intangible assets (note v) (909) (890)Goodwill (note v) (12) (12)Excess of regulatory expected losses over impairment provisions (note vi) (677) (1,096)
Total regulatory adjustments and deductions (1,652) (2,116)
Common Equity Tier 1 capital 6,707 5,849Additional Tier 1 capital securities (AT1) 992 992Total Tier 1 capital 7,699 6,841 Dated subordinated debt (note vii) 1,782 1,886Excess of impairment provisions over regulatory expected loss (note vi) 170 171Collectively assessed impairment allowances 22 27Tier 2 capital 1,974 2,084 Total regulatory capital 9,673 8,925 Solvency ratios (note viii): Common Equity Tier 1 ratio 17.6% 14.5%Total Tier 1 capital ratio 20.2% 16.9%Total regulatory capital ratio 25.4% 22.1%
Notes:
i. The general reserve includes unaudited profits for the period to 30 September 2014 to present the capital position on a basis consistent with the accounts. When reporting the capital position to the PRA, unaudited profits are excluded.
ii. Foreseeable distributions in respect of CCDS and AT1 securities are deducted from CET1 capital under CRD IV. iii. A prudent valuation adjustment is applied in respect of fair valued instruments as required under regulatory capital rules. iv. Own credit and debit valuation adjustments are applied to remove balance sheet gains or losses of fair valued liabilities and
derivatives that result from changes in the Group’s own credit standing and risk, in accordance with CRD IV rules. v. Intangible assets and goodwill do not qualify as capital for regulatory purposes. vi. Under CRD IV the net regulatory capital expected loss in excess of accounting provisions is deducted from CET1 capital, gross of
tax. Any provisions in excess of the expected loss are included in Tier 2 capital. vii. Subordinated debt includes fair value adjustments related to changes in market interest rates, adjustments for unamortised
premiums and discounts that are included in the consolidated balance sheet, and any amortisation of the capital value of Tier 2 instruments required by regulatory rules for instruments with less than five years to maturity. It does not include instruments that are subject to CRD IV grandfathering provisions, as this table is presented on an end point basis.
viii. Solvency ratios are reported on an end point basis. The Group’s CET1 ratio on a transitional basis does not include the gains on the available for sale reserve (£17 million), but remains unchanged at 17.6%. The total Tier 1 capital ratio and total regulatory capital ratio are 21.7% and 27.4% respectively on a transitional basis, as PIBS and some additional subordinated debt instruments qualify under grandfathering provisions under CRD IV.

Nationwide Building Society – Interim Results
64
Capital management (continued) The key movements in the Group’s capital position on an end point basis are further analysed in the table below:
Group£m
Common Equity Tier 1 capital at 5 April 2014 5,849 Profit for the period 486 Other movement in general reserves (note i) (48) Foreseeable distributions due (note ii) (55)
Decrease/(increase) in:
Available for sale reserve 68 Revaluation reserves 1 Prudent valuation adjustment 1 Own credit risk adjustment 5 Intangible assets and goodwill (19) Excess of regulatory expected loss over impairment provisions 419Common Equity Tier 1 capital at 30 September 2014 6,707
Other Tier 1 capital at 5 April 2014 992
Other Tier 1 capital at 30 September 2014 992
Total Tier 1 capital at 5 April 2014 6,841
Total Tier 1 capital at 30 September 2014 7,699 Tier 2 capital at 5 April 2014 2,084 Amortisation on dated subordinated debt (37) Fair value adjustments on dated subordinated debt (67) Decrease/(increase) in: Collectively assessed impairment allowances (5) Excess of impairment provisions over regulatory expected loss (1)
Tier 2 capital at 30 September 2014 1,974
Total regulatory capital at 5 April 2014 8,925
Total regulatory capital at 30 September 2014 9,673 Notes:
i. Includes all movements in general reserves, other than profit for the period and distributions paid in June 2014. ii. Foreseeable distributions due represents the next distribution expected to be paid in December 2014 for CCDS and AT1.
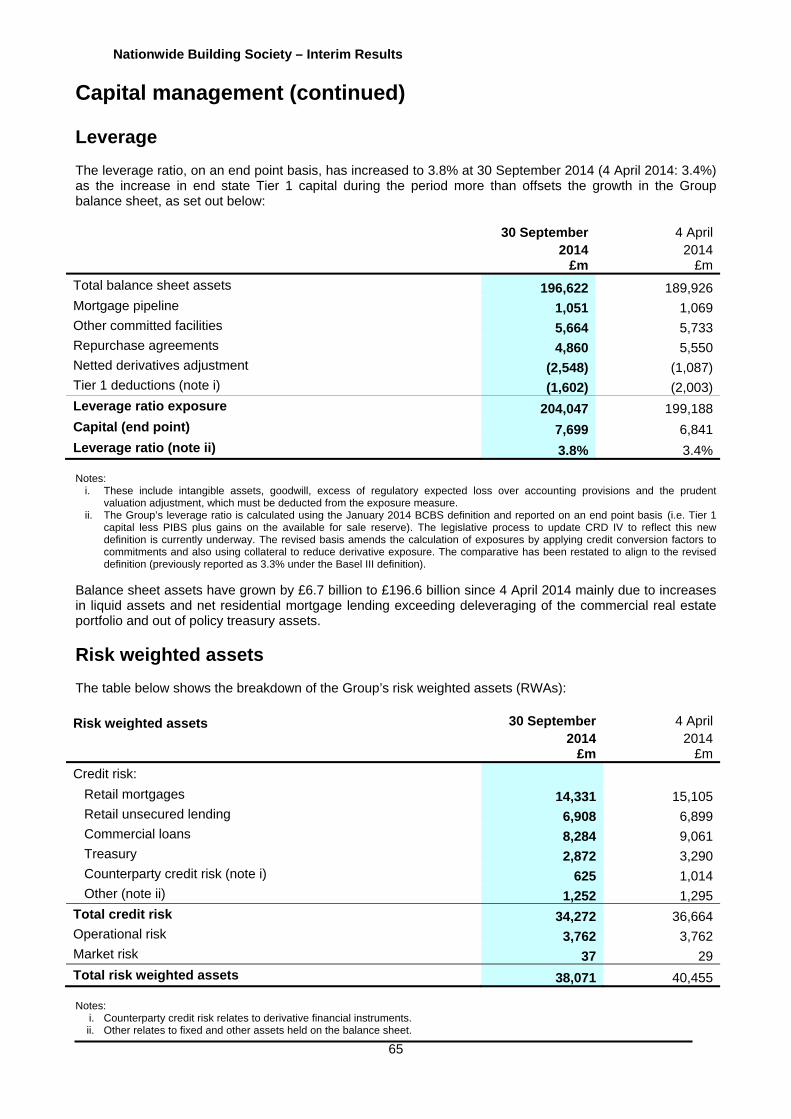
Nationwide Building Society – Interim Results
65
Capital management (continued) Leverage The leverage ratio, on an end point basis, has increased to 3.8% at 30 September 2014 (4 April 2014: 3.4%) as the increase in end state Tier 1 capital during the period more than offsets the growth in the Group balance sheet, as set out below:
30 September 4 April 2014 2014 £m £m
Total balance sheet assets 196,622 189,926Mortgage pipeline 1,051 1,069Other committed facilities 5,664 5,733Repurchase agreements 4,860 5,550Netted derivatives adjustment (2,548) (1,087)Tier 1 deductions (note i) (1,602) (2,003)Leverage ratio exposure 204,047 199,188Capital (end point) 7,699 6,841Leverage ratio (note ii) 3.8% 3.4% Notes:
i. These include intangible assets, goodwill, excess of regulatory expected loss over accounting provisions and the prudent valuation adjustment, which must be deducted from the exposure measure.
ii. The Group’s leverage ratio is calculated using the January 2014 BCBS definition and reported on an end point basis (i.e. Tier 1 capital less PIBS plus gains on the available for sale reserve). The legislative process to update CRD IV to reflect this new definition is currently underway. The revised basis amends the calculation of exposures by applying credit conversion factors to commitments and also using collateral to reduce derivative exposure. The comparative has been restated to align to the revised definition (previously reported as 3.3% under the Basel III definition).
Balance sheet assets have grown by £6.7 billion to £196.6 billion since 4 April 2014 mainly due to increases in liquid assets and net residential mortgage lending exceeding deleveraging of the commercial real estate portfolio and out of policy treasury assets.
Risk weighted assets The table below shows the breakdown of the Group’s risk weighted assets (RWAs):
Risk weighted assets 30 September 4 April 2014 2014 £m £m
Credit risk:
Retail mortgages 14,331 15,105 Retail unsecured lending 6,908 6,899 Commercial loans 8,284 9,061 Treasury 2,872 3,290 Counterparty credit risk (note i) 625 1,014 Other (note ii) 1,252 1,295Total credit risk 34,272 36,664Operational risk 3,762 3,762Market risk 37 29
Total risk weighted assets 38,071 40,455 Notes:
i. Counterparty credit risk relates to derivative financial instruments. ii. Other relates to fixed and other assets held on the balance sheet.
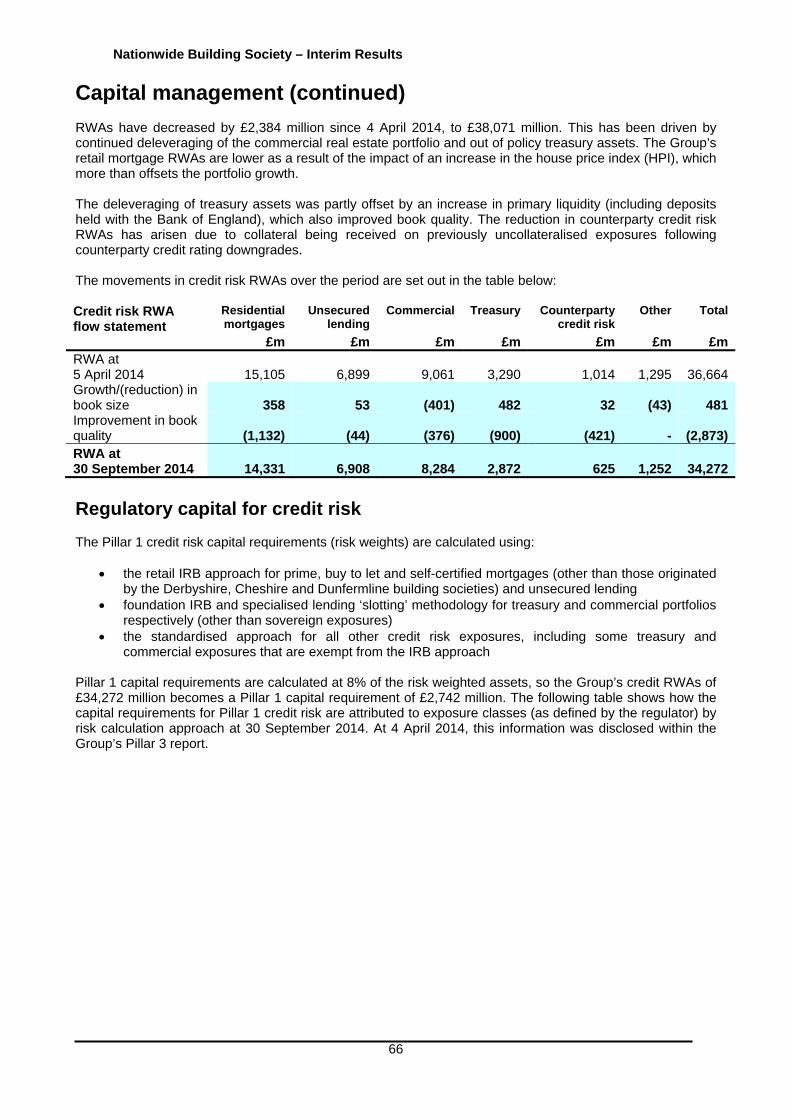
Nationwide Building Society – Interim Results
66
Capital management (continued) RWAs have decreased by £2,384 million since 4 April 2014, to £38,071 million. This has been driven by continued deleveraging of the commercial real estate portfolio and out of policy treasury assets. The Group’s retail mortgage RWAs are lower as a result of the impact of an increase in the house price index (HPI), which more than offsets the portfolio growth. The deleveraging of treasury assets was partly offset by an increase in primary liquidity (including deposits held with the Bank of England), which also improved book quality. The reduction in counterparty credit risk RWAs has arisen due to collateral being received on previously uncollateralised exposures following counterparty credit rating downgrades. The movements in credit risk RWAs over the period are set out in the table below: Credit risk RWA flow statement
Residentialmortgages
Unsecured lending
Commercial Treasury Counterparty credit risk
Other Total
£m £m £m £m £m £m £mRWA at 5 April 2014 15,105 6,899 9,061 3,290 1,014 1,295 36,664Growth/(reduction) in book size 358 53 (401) 482 32 (43) 481Improvement in book quality (1,132) (44) (376) (900) (421) - (2,873)RWA at 30 September 2014 14,331 6,908 8,284 2,872 625 1,252 34,272
Regulatory capital for credit risk The Pillar 1 credit risk capital requirements (risk weights) are calculated using:
the retail IRB approach for prime, buy to let and self-certified mortgages (other than those originated by the Derbyshire, Cheshire and Dunfermline building societies) and unsecured lending
foundation IRB and specialised lending ‘slotting’ methodology for treasury and commercial portfolios respectively (other than sovereign exposures)
the standardised approach for all other credit risk exposures, including some treasury and commercial exposures that are exempt from the IRB approach
Pillar 1 capital requirements are calculated at 8% of the risk weighted assets, so the Group’s credit RWAs of £34,272 million becomes a Pillar 1 capital requirement of £2,742 million. The following table shows how the capital requirements for Pillar 1 credit risk are attributed to exposure classes (as defined by the regulator) by risk calculation approach at 30 September 2014. At 4 April 2014, this information was disclosed within the Group’s Pillar 3 report.
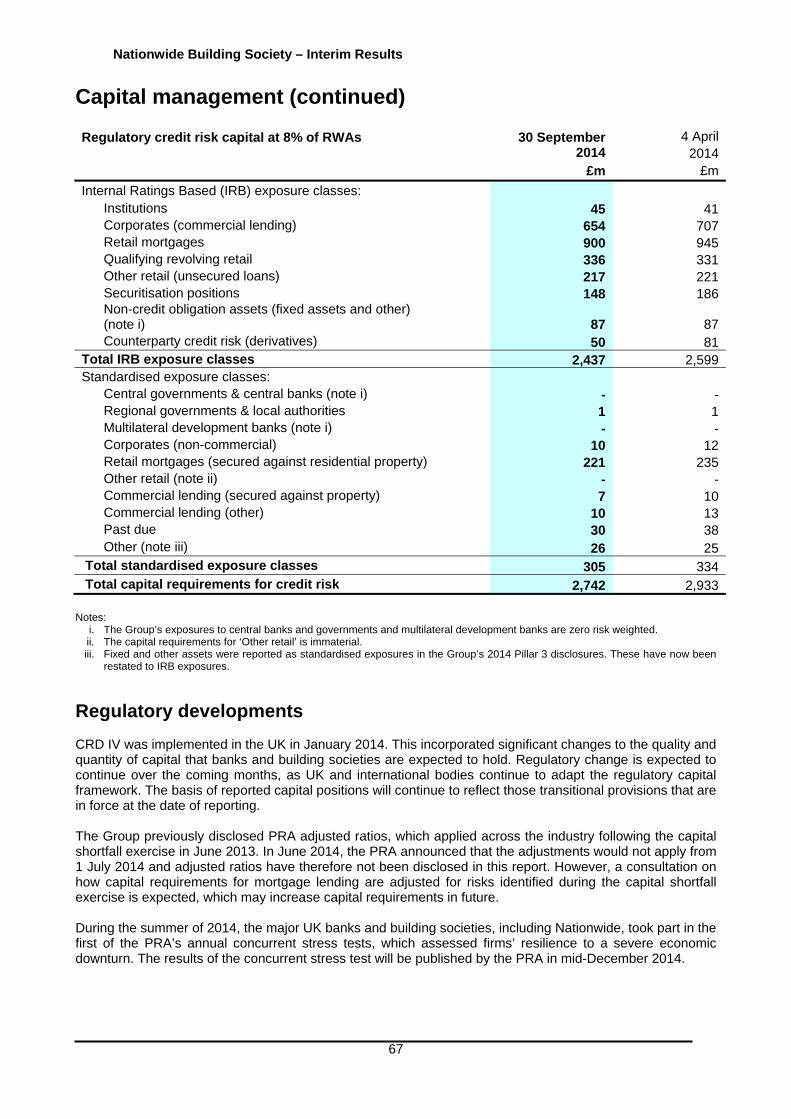
Nationwide Building Society – Interim Results
67
Capital management (continued) Regulatory credit risk capital at 8% of RWAs
30 September 2014
4 April2014
£m £m
Internal Ratings Based (IRB) exposure classes: Institutions 45 41 Corporates (commercial lending) 654 707 Retail mortgages 900 945 Qualifying revolving retail 336 331 Other retail (unsecured loans) 217 221 Securitisation positions 148 186 Non-credit obligation assets (fixed assets and other) (note i) 87 87 Counterparty credit risk (derivatives) 50 81
Total IRB exposure classes 2,437 2,599 Standardised exposure classes:
Central governments & central banks (note i) - -Regional governments & local authorities 1 1 Multilateral development banks (note i) - -Corporates (non-commercial) 10 12 Retail mortgages (secured against residential property) 221 235 Other retail (note ii) - -Commercial lending (secured against property) 7 10 Commercial lending (other) 10 13 Past due 30 38 Other (note iii) 26 25
Total standardised exposure classes 305 334 Total capital requirements for credit risk 2,742 2,933
Notes: i. The Group’s exposures to central banks and governments and multilateral development banks are zero risk weighted. ii. The capital requirements for ‘Other retail’ is immaterial. iii. Fixed and other assets were reported as standardised exposures in the Group’s 2014 Pillar 3 disclosures. These have now been
restated to IRB exposures.
Regulatory developments CRD IV was implemented in the UK in January 2014. This incorporated significant changes to the quality and quantity of capital that banks and building societies are expected to hold. Regulatory change is expected to continue over the coming months, as UK and international bodies continue to adapt the regulatory capital framework. The basis of reported capital positions will continue to reflect those transitional provisions that are in force at the date of reporting. The Group previously disclosed PRA adjusted ratios, which applied across the industry following the capital shortfall exercise in June 2013. In June 2014, the PRA announced that the adjustments would not apply from 1 July 2014 and adjusted ratios have therefore not been disclosed in this report. However, a consultation on how capital requirements for mortgage lending are adjusted for risks identified during the capital shortfall exercise is expected, which may increase capital requirements in future. During the summer of 2014, the major UK banks and building societies, including Nationwide, took part in the first of the PRA’s annual concurrent stress tests, which assessed firms’ resilience to a severe economic downturn. The results of the concurrent stress test will be published by the PRA in mid-December 2014.
Nationwide Building Society – Interim Results
68
Capital management (continued) At the request of the Chancellor, the Financial Policy Committee (FPC) has undertaken a review into the leverage ratio framework. The conclusion of this review, published in October 2014, stated that firms should hold a minimum 3% leverage ratio at all times. Further to this, the FPC is proposing the introduction of two buffers, a supplementary leverage ratio buffer (which, for Nationwide, will not be introduced before 2019) and a countercyclical leverage ratio buffer. The final calibration of the supplementary leverage ratio buffer is subject to industry consultation during 2015, but based on the FPC review will not exceed 1.05%. The Chancellor responded to the FPC’s publication, confirming that the necessary legislation to implement these changes will be presented to the current Parliament. The letter also highlighted the importance of a thorough consultation prior to calibrating the supplementary leverage ratio buffer, considering the impact this could have upon business models with low average risk weighted levels of lending to the real economy and the degree of competition in retail banking. In our view, the proposals announced by the FPC form the basis of a sensible regulatory approach to leverage and we concur with the view that calibration of the supplementary requirement should be carefully considered to ensure that the final framework is proportionate for low risk institutions thus preserving diversity within the sector. The PRA is currently reviewing the Pillar 2 framework and we expect greater clarity on bail-in requirements over the next twelve months. A Bank of England discussion paper on a Minimum Requirement for Eligible Liabilities (MREL) is expected in 2015 explaining the framework for how the firm-by-firm basis will be set. We would expect the framework to be implemented on a transitional basis with full compliance by January 2019. There are also ongoing international discussions regarding the level of total loss-absorbing capacity (TLAC) that firms are required to hold. Whilst we would currently not expect this to apply to the Group we will keep this position under review.

Nationwide Building Society – Interim Results
69
Operational risk management
Overview Operational risk is the risk of loss resulting from inadequate or failed internal processes, people and systems, or from external events. The supporting risk and control policy areas have remained substantially unchanged since those reported in the Annual Report and Accounts 2014.
Operational Risk Profile Consistent with the position at the year end the majority of the Group’s operational risk experience continues to be recorded against two of the Basel II categories: ‘External Fraud’ and ‘Clients, Products and Business Practices’. In addition, as the use of digital services grows, member expectations for both the availability and security of systems increases. As a result the Group continues to strengthen its systems and controls to ensure a minimum level of serious disruption to its customers, brand and reputation. Current key areas of focus are outlined below. The Group continues to make significant investment in transforming its products and delivery channels to embrace advances in digital banking technology. There are operational and technical risks involved in this transition including the application of traditional conduct and compliance processes to a digital environment. The implementation of new systems, alongside the maintenance of legacy systems, introduces operational complexity. At the same time, the financial services sector is seeing increased expectations of an ‘always on’ 24/7 service, and lower tolerance of system unavailability. IT resilience is acknowledged as a key component of the Group’s Corporate Plan with planned activities and investments to improve resilience. These include enhancements to infrastructure and application support and the development of stand in processes and systems that can operate whilst core systems are unavailable. This will enable the Group to continue to reduce the likelihood of incidents arising and minimise the impact to members of planned systems changes or any systems incidents. The publicity surrounding cyber attacks and the increase in use of digital banking services has raised member expectations concerning the security of banking systems and there is a greater threat of cyber attacks being faced across the financial services sector. Reflecting both of these issues, the Group continues to invest in system security and its detection capabilities, to ensure it has an appropriate capability to detect and respond to cyber security issues effectively, safeguarding the organisation and its customers. Where the Group employs third parties to provide services to its customers it expects those third parties to adhere to Nationwide’s conduct standards such that good customer outcomes and a superior customer service experience are delivered. As a result, the Group has made enhancements to the control framework for managing third party suppliers including the elevation of sourcing and contracting risks within the risk hierarchy, and the implementation of a Third Party Risk Management Framework. During the period the Group has further embedded operational risk frameworks and processes to ensure that risks are more comprehensively identified and understood.
Environment and outlook Consistent with the environment in which it operates, the Group expects its priority areas through the rest of the financial year to remain as IT resilience, cyber security, effective third party management and addressing the operational challenges of increasing digitalisation of banking services. The Group will continue the process of further embedding the Operational Risk Framework, including the roll-out of a new risk management system to hold risk, control, incident and loss data which will better inform decision making across the business and provide a platform for further control improvements.

Nationwide Building Society – Interim Results
70
Customer and compliance risk management
Overview Customer and compliance risk is the risk that the organisation fails to design and implement operational arrangements, or systems and controls, to maintain legal and regulatory compliance, deliver fair customer outcomes or achieve a positive experience for its customers. The mutual status of the Group and its focus on delivering good customer outcomes means that its business strategy is fundamentally aligned with reducing these risks and that it is well positioned to respond to the evolving legal and regulatory environment.
Customer and compliance risk profile The Group has not been subject to the same level of regulatory censure as other high street banks. This is in part a reflection of its historical commitment to members, and the Group continues to enhance its approach to delivering fair customer outcomes to build on this. Over the last six months the financial services industry has seen an increase in the proportion of customer complaints upheld by the Financial Ombudsman Service (FOS) from 51% to 57% driven by an increase in the industry’s PPI complaint uphold rates from 56% to 64%. Nationwide has seen a much smaller change to its already low FOS uphold rates from 10% to 12% overall, as a result of the Group’s commitment to resolving complaints fairly. The modest increase in PPI upholds from 5% to 8% has been offset by lower PPI claims experienced than expected. As a result, the Group has made no additional provision this period for PPI, unlike other high street providers. The Group has also reviewed its compliance with various regulatory matters, including consumer credit legislation, and during the period made a provision of £4 million in respect of potential customer redress to reflect its latest estimate of exposure. Following the implementation of the Mortgage Market Review there has been continued focus on the application of processes to ensure that customer needs are clearly identified, explored and understood. In addition there has been continued investment in Anti Money Laundering capabilities to safeguard members through having highly controlled processes and procedures. The Group continues to invest in training programmes, first line quality assurance and second line oversight to mitigate this, and other sales process risks, with a focus on ensuring good customer outcomes. The Group’s investment in digital banking, and the associated operational and technical complexities, create further customer and compliance risk, including the risk of payment service failure, and in particular where the relevant regulation is not digitally based. An important focus is ensuring that the appropriate controls are in place to mitigate these risks. Where the Group employs third parties to provide services to its customers it is responsible for ensuring that those third parties adhere to Nationwide’s conduct standards as part of the Third Party Risk Management Framework. The Group is developing control frameworks to ensure that it can satisfy itself that this requirement is addressed. In order to ensure that the above challenges are met, a new first line Compliance Committee has been added to the Group’s risk governance structure. The Compliance Committee is chaired by the Chief Compliance Officer, and has responsibility to co-ordinate adherence to all relevant legislation, regulation and codes of conduct, on a Group-wide basis.
Environment and outlook During this period there has been significant regulatory change, including:
Accountability in Banking: a new framework for approving and holding individuals within firms to account
Accountability in Reward: to address weaknesses in the alignment between risk and reward which were highlighted in the final report of the Parliamentary Commission on Banking Standards, published in June 2013, and
A number of outputs from the Basel Committee on Banking Supervision

Nationwide Building Society – Interim Results
71
Customer and compliance risk management (continued) There continues to be significant growth in the extent of regulatory requirements, including Consumer Credit requirements, applying to the design, distribution and administration of the Group’s main products whilst the FCA continues to develop the regulatory regime around culture and conduct risk. For the foreseeable future the Group is expected to focus on continuing to provide fully compliant products, putting good customer outcomes at the heart of decision making and delivering a superior customer service experience. The Group will continue to engage with the regulators and respond to all developments. As part of this, it expects to develop further its controls and processes. Areas of focus will include:
further enhancing and simplifying the customer and compliance risk framework and the Group’s approach to conduct risk
building Group-wide awareness of conduct risks developing and introducing a proactive approach to conduct risk identification and management continuing to monitor and review the Group’s product and service offerings, ensuring they meet the
needs of members and emerging regulatory requirements, including any services provided by third parties to its customers
keeping pace with the volume of legal and regulatory change, including those relevant to digital products and services
The pace of regulatory change is expected to continue over the coming months, along with the impacts of the recent transfer of Consumer Credit Regulation to the FCA. The Group’s main activities currently in progress include:
assessing the impact of the Mortgage Credit Directive which takes effect in March 2016 embedding actions to ensure compliance with the Senior Managers and Certification Regimes (which
will replace the Approved Persons Regime) working with the regulators on Project Innovate (which considers areas where innovation may be
stifled by regulation and ways to address it) As well as conduct risk, compliance risk also includes responsibility for prudential risk. Work continues to meet the heightened prudential requirements being placed on the business, including new regulation from both the UK and Europe, such as revised reporting requirements associated with the Capital Requirements Directive IV and the new Common Reporting Standard.

Nationwide Building Society – Interim Results
72
Interim financial information Contents
Page Consolidated income statement 73 Consolidated statement of comprehensive income 74Consolidated balance sheet 75Consolidated statement of movements in members’ interests and equity 76Consolidated cash flow statement 77Notes to the interim financial information 78
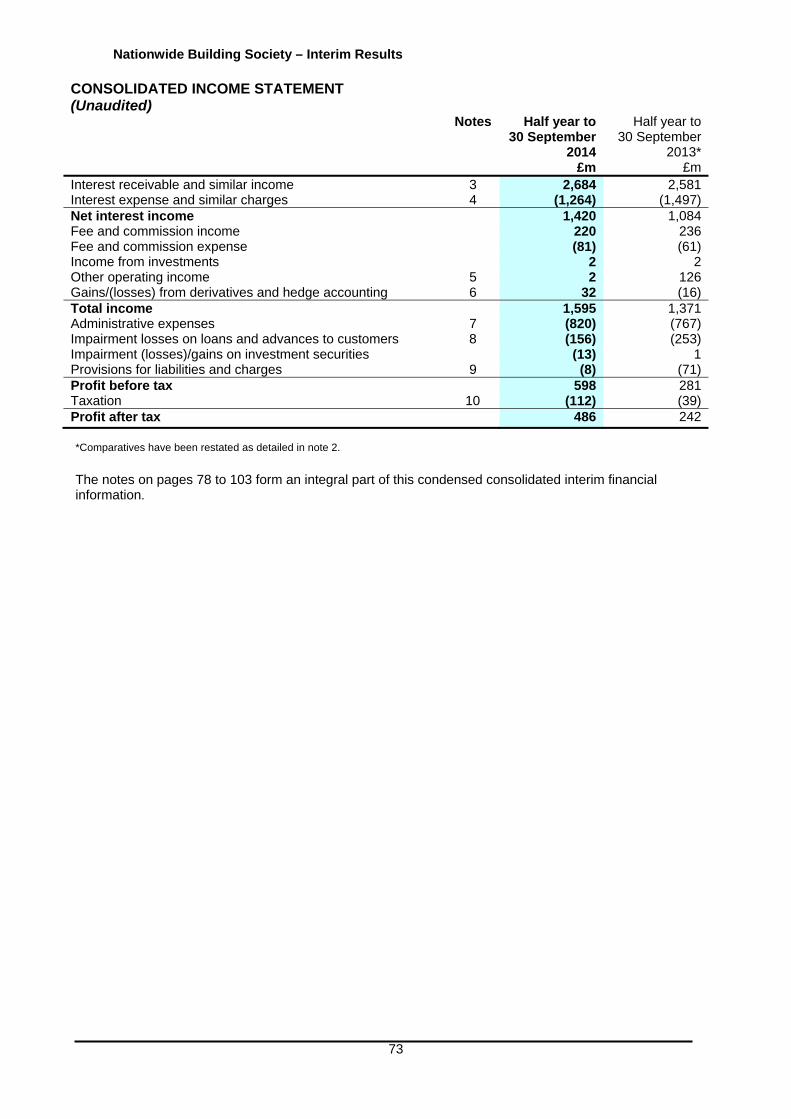
Nationwide Building Society – Interim Results
73
CONSOLIDATED INCOME STATEMENT (Unaudited) Notes Half year to
30 September 2014
Half year to 30 September
2013* £m £mInterest receivable and similar income 3 2,684 2,581Interest expense and similar charges 4 (1,264) (1,497)Net interest income 1,420 1,084Fee and commission income 220 236Fee and commission expense (81) (61)Income from investments 2 2Other operating income 5 2 126Gains/(losses) from derivatives and hedge accounting 6 32 (16)Total income 1,595 1,371Administrative expenses 7 (820) (767)Impairment losses on loans and advances to customers 8 (156) (253)Impairment (losses)/gains on investment securities (13) 1Provisions for liabilities and charges 9 (8) (71)Profit before tax 598 281Taxation 10 (112) (39)Profit after tax 486 242 *Comparatives have been restated as detailed in note 2.
The notes on pages 78 to 103 form an integral part of this condensed consolidated interim financial information.

Nationwide Building Society – Interim Results
74
*Comparatives have been restated as detailed in note 2. The notes on pages 78 to 103 form an integral part of this condensed consolidated interim financial information.
CONSOLIDATED STATEMENT OF COMPREHENSIVE INCOME (Unaudited) Half year to
30 September 2014
Half year to 30 September
2013* £m £m
Profit after tax 486 242Other comprehensive income/(expense): Items that will not be reclassified to the income statement Re-measurements of retirement benefit obligations: Retirement benefit re-measurements before tax (50) (175) Taxation charge 4 20 (46) (155)Revaluation of property:
Effect of tax rate change on the revaluation reserve 1 1 Effect of tax rate change on non-pension items through the general reserve
(2) (2) (47) (156)Items that may subsequently be reclassified to the income statement
Available for sale investments: Fair value movements taken to members’ interests and equity 60 69 Amount transferred to income statement 27 50 Taxation (19) (30) 68 89 Other comprehensive income/(expense) 21 (67) Total comprehensive income 507 175

Nationwide Building Society – Interim Results
75
CONSOLIDATED BALANCE SHEET
Notes 30 September
2014 (Unaudited)
£m
4 April 2014*
(Audited) £m
Assets Cash 8,463 5,342Loans and advances to banks 2,465 2,110Available for sale investment securities 11,385 10,563Derivative financial instruments 3,264 3,020Fair value adjustment for portfolio hedged risk 218 221Loans and advances to customers 11 168,547 166,541Investments in equity shares 29 29Intangible assets 965 956Property, plant and equipment 858 852Investment properties 9 9Accrued income and expenses prepaid 375 185Deferred tax 25 33Other assets 19 32Total assets 196,622 189,893 Liabilities Shares 133,978 130,468Deposits from banks 2,320 1,984Other deposits 8,143 7,135Due to customers 6,219 6,208Fair value adjustment for portfolio hedged risk 4 33Debt securities in issue 29,506 28,557Derivative financial instruments 2,797 2,391Other liabilities 525 269Provisions for liabilities and charges 9 173 310Accruals and deferred income 433 428Subordinated liabilities 12 2,200 2,269Subscribed capital 12 600 601Deferred tax 26 25Current tax liabilities 132 74Retirement benefit obligations 198 235Total liabilities 187,254 180,987Members’ interests and equity Core capital deferred shares 13 531 531Other equity instruments 14 992 992General reserve 7,756 7,363Revaluation reserve 72 71Available for sale reserve 17 (51)Total members’ interests and equity 9,368 8,906Total members’ interests, equity and liabilities 196,622 189,893 *Comparatives have been restated as detailed in note 2. The notes on pages 78 to 103 form an integral part of this condensed consolidated interim financial information.
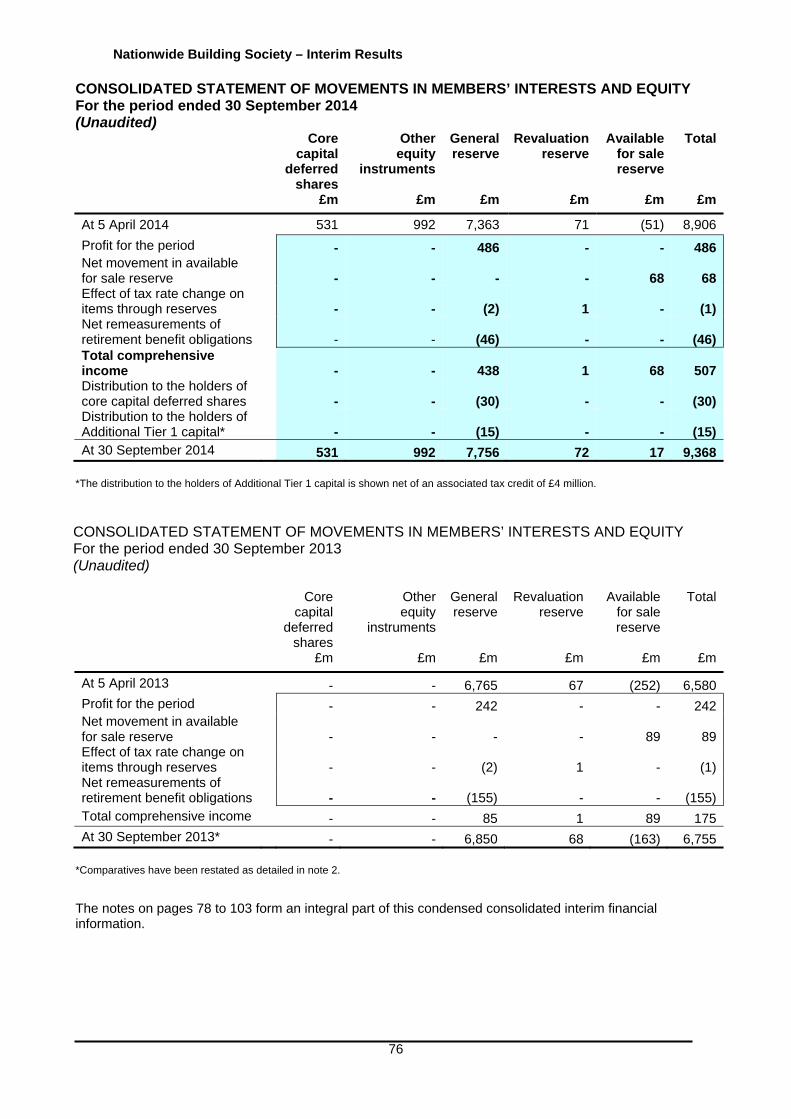
Nationwide Building Society – Interim Results
76
CONSOLIDATED STATEMENT OF MOVEMENTS IN MEMBERS’ INTERESTS AND EQUITY For the period ended 30 September 2014 (Unaudited) Core
capital deferred
shares
Otherequity
instruments
General reserve
Revaluation reserve
Available for sale reserve
Total
£m £m £m £m £m £m
At 5 April 2014 531 992 7,363 71 (51) 8,906
Profit for the period - - 486 - - 486Net movement in available for sale reserve
- - - - 68 68
Effect of tax rate change on items through reserves
- - (2) 1 - (1)
Net remeasurements of retirement benefit obligations
- - (46) - - (46)
Total comprehensive income
- - 438 1 68 507
Distribution to the holders of core capital deferred shares
- - (30) - - (30)
Distribution to the holders of Additional Tier 1 capital*
- - (15) - - (15)
At 30 September 2014 531 992 7,756 72 17 9,368
*The distribution to the holders of Additional Tier 1 capital is shown net of an associated tax credit of £4 million.
CONSOLIDATED STATEMENT OF MOVEMENTS IN MEMBERS’ INTERESTS AND EQUITY For the period ended 30 September 2013 (Unaudited) Core
capital deferred
shares
Other equity
instruments
General reserve
Revaluation reserve
Available for sale reserve
Total
£m £m £m £m £m £m
At 5 April 2013 - - 6,765 67 (252) 6,580Profit for the period - - 242 - - 242Net movement in available for sale reserve
- - - - 89 89
Effect of tax rate change on items through reserves
- - (2) 1 - (1)
Net remeasurements of retirement benefit obligations
- - (155) - - (155)
Total comprehensive income - - 85 1 89 175At 30 September 2013* - - 6,850 68 (163) 6,755
*Comparatives have been restated as detailed in note 2. The notes on pages 78 to 103 form an integral part of this condensed consolidated interim financial information.
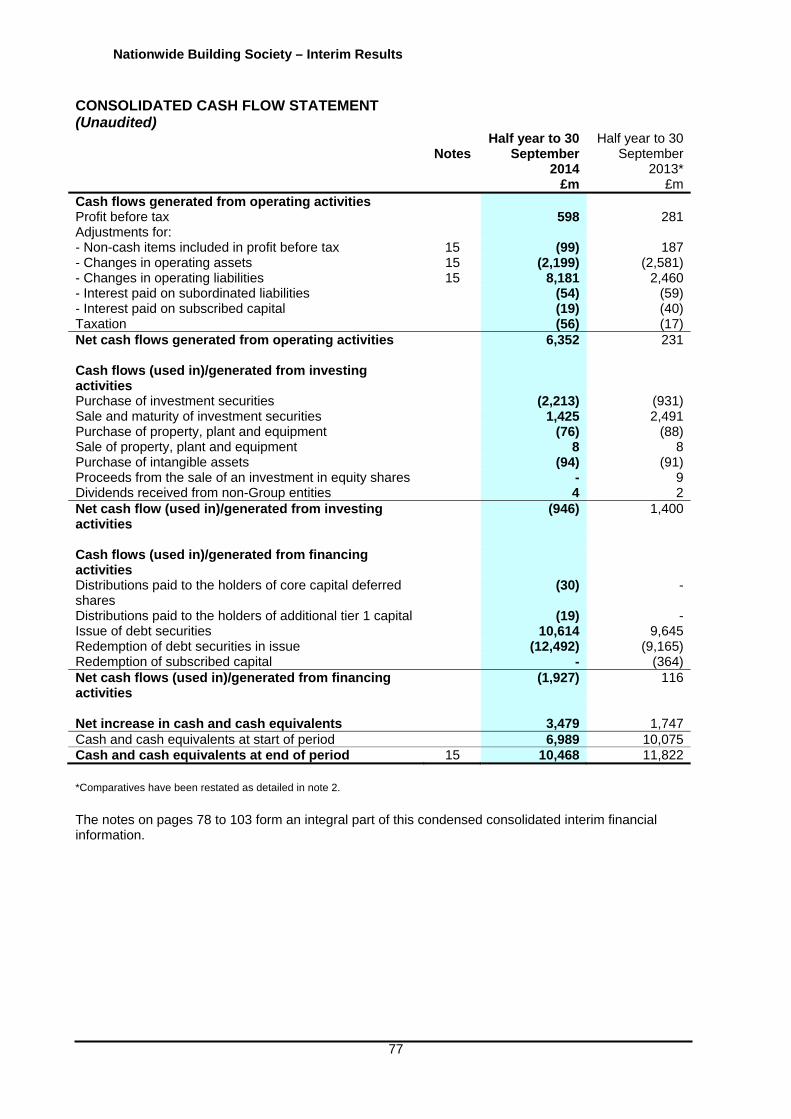
Nationwide Building Society – Interim Results
77
CONSOLIDATED CASH FLOW STATEMENT (Unaudited)
Notes Half year to 30
September 2014
£m
Half year to 30 September
2013* £m
Cash flows generated from operating activities Profit before tax 598 281Adjustments for: - Non-cash items included in profit before tax 15 (99) 187- Changes in operating assets 15 (2,199) (2,581)- Changes in operating liabilities 15 8,181 2,460- Interest paid on subordinated liabilities (54) (59)- Interest paid on subscribed capital (19) (40)Taxation (56) (17)Net cash flows generated from operating activities 6,352 231 Cash flows (used in)/generated from investing activities
Purchase of investment securities (2,213) (931)Sale and maturity of investment securities 1,425 2,491Purchase of property, plant and equipment (76) (88)Sale of property, plant and equipment 8 8Purchase of intangible assets (94) (91)Proceeds from the sale of an investment in equity shares - 9Dividends received from non-Group entities 4 2Net cash flow (used in)/generated from investing activities
(946) 1,400
Cash flows (used in)/generated from financing activities
Distributions paid to the holders of core capital deferred shares
(30) -
Distributions paid to the holders of additional tier 1 capital (19) -Issue of debt securities 10,614 9,645Redemption of debt securities in issue (12,492) (9,165)Redemption of subscribed capital - (364)Net cash flows (used in)/generated from financing activities
(1,927) 116
Net increase in cash and cash equivalents 3,479 1,747Cash and cash equivalents at start of period 6,989 10,075Cash and cash equivalents at end of period 15 10,468 11,822
*Comparatives have been restated as detailed in note 2.
The notes on pages 78 to 103 form an integral part of this condensed consolidated interim financial information.
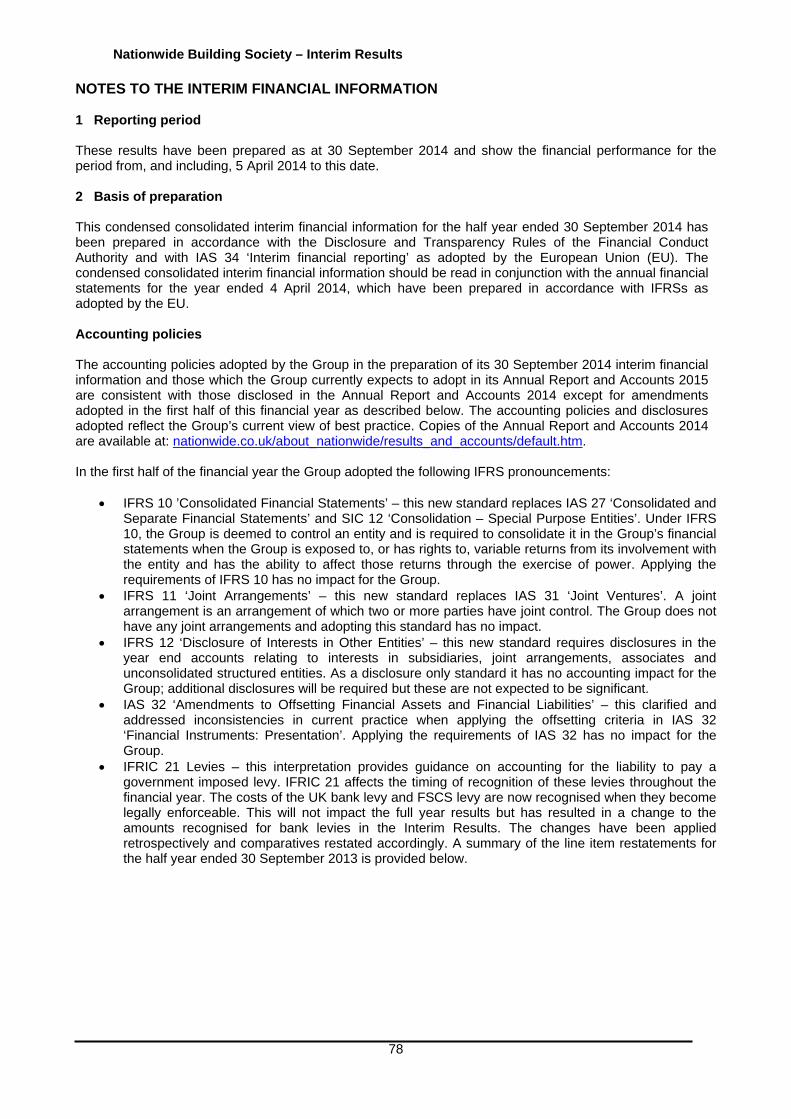
Nationwide Building Society – Interim Results
78
NOTES TO THE INTERIM FINANCIAL INFORMATION 1 Reporting period These results have been prepared as at 30 September 2014 and show the financial performance for the period from, and including, 5 April 2014 to this date. 2 Basis of preparation This condensed consolidated interim financial information for the half year ended 30 September 2014 has been prepared in accordance with the Disclosure and Transparency Rules of the Financial Conduct Authority and with IAS 34 ‘Interim financial reporting’ as adopted by the European Union (EU). The condensed consolidated interim financial information should be read in conjunction with the annual financial statements for the year ended 4 April 2014, which have been prepared in accordance with IFRSs as adopted by the EU. Accounting policies The accounting policies adopted by the Group in the preparation of its 30 September 2014 interim financial information and those which the Group currently expects to adopt in its Annual Report and Accounts 2015 are consistent with those disclosed in the Annual Report and Accounts 2014 except for amendments adopted in the first half of this financial year as described below. The accounting policies and disclosures adopted reflect the Group’s current view of best practice. Copies of the Annual Report and Accounts 2014 are available at: nationwide.co.uk/about_nationwide/results_and_accounts/default.htm. In the first half of the financial year the Group adopted the following IFRS pronouncements:
IFRS 10 ’Consolidated Financial Statements’ – this new standard replaces IAS 27 ‘Consolidated and Separate Financial Statements’ and SIC 12 ‘Consolidation – Special Purpose Entities’. Under IFRS 10, the Group is deemed to control an entity and is required to consolidate it in the Group’s financial statements when the Group is exposed to, or has rights to, variable returns from its involvement with the entity and has the ability to affect those returns through the exercise of power. Applying the requirements of IFRS 10 has no impact for the Group.
IFRS 11 ‘Joint Arrangements’ – this new standard replaces IAS 31 ‘Joint Ventures’. A joint arrangement is an arrangement of which two or more parties have joint control. The Group does not have any joint arrangements and adopting this standard has no impact.
IFRS 12 ‘Disclosure of Interests in Other Entities’ – this new standard requires disclosures in the year end accounts relating to interests in subsidiaries, joint arrangements, associates and unconsolidated structured entities. As a disclosure only standard it has no accounting impact for the Group; additional disclosures will be required but these are not expected to be significant.
IAS 32 ‘Amendments to Offsetting Financial Assets and Financial Liabilities’ – this clarified and addressed inconsistencies in current practice when applying the offsetting criteria in IAS 32 ‘Financial Instruments: Presentation’. Applying the requirements of IAS 32 has no impact for the Group.
IFRIC 21 Levies – this interpretation provides guidance on accounting for the liability to pay a government imposed levy. IFRIC 21 affects the timing of recognition of these levies throughout the financial year. The costs of the UK bank levy and FSCS levy are now recognised when they become legally enforceable. This will not impact the full year results but has resulted in a change to the amounts recognised for bank levies in the Interim Results. The changes have been applied retrospectively and comparatives restated accordingly. A summary of the line item restatements for the half year ended 30 September 2013 is provided below.

Nationwide Building Society – Interim Results
79
NOTES TO THE INTERIM FINANCIAL INFORMATION (continued) 2 Basis of preparation (continued) Adjustments to comparative information The implementation of IFRIC 21 has resulted in a restatement which impacted on the following line items for the period ended September 2013:
Notes
Previously published
£m
Adjustment
£m
Restated
£mConsolidated income statement extract for the period ended 30 September 2013 Administrative expenses 7 (778) 11 (767)
Profit before tax 270 11 281Taxation 10 (36) (3) (39)Profit after tax 234 8 242
Consolidated statement of movements in members’ interests and equity extract for the period ended 30 September 2013 Profit for the period 234 8 242Total comprehensive income 167 8 175
General reserve at 30 September 2013 6,842 8 6,850 There was no impact on the Group’s net assets or reserves at 4 April 2014 as a result of this restatement. In addition, comparative balances in relation to elements of overdrawn current accounts have been reclassified to provide a more meaningful presentation on a basis which is consistent with the current year. The reclassification, which has no impact on the Group’s net assets or profit before tax, is detailed below. Consolidated balance sheet extract at 4 April 2014
Notes
Previously published
£m
Adjustment
£m
Restated
£m
Loans and advances to customers 11 166,574 (33) 166,541Accruals and deferred income 461 (33) 428 Future accounting developments An overview of pronouncements that will be relevant to the Group in future periods was provided in the Annual Report and Accounts 2014. The IASB has subsequently issued further pronouncements on IFRS 9 and IFRS 15, as follows: IFRS 9 ‘Financial Instruments’ replaces IAS 39 and will lead to changes to the classification and measurement of the Group’s financial assets and liabilities, the recognition of impairment, and hedge accounting. A final version of the standard was issued in July 2014. The new standard will come into effect for annual periods beginning on or after 1 January 2018, subject to EU endorsement. The Group is currently assessing the impact that IFRS 9 will have on the financial statements. Due to the complexity of the new requirements, it is not possible at this stage to quantify the potential effects of implementing IFRS 9, although it is expected to have a significant impact for the Group, in line with the wider industry. IFRS 15 ‘Revenue from Contracts with Customers’ replaces IAS 18 ‘Revenue’ with a new model for revenue recognition. Financial instruments are outside the scope of IFRS 15. The new standard is effective for accounting periods beginning on or after 1 January 2017. The impact on the Group is currently being considered.

Nationwide Building Society – Interim Results
80
NOTES TO THE INTERIM FINANCIAL INFORMATION (continued) 2 Basis of preparation (continued) Judgements in applying accounting policies and critical accounting estimates The Group has to make judgements in applying its accounting policies which affect the amounts recognised in the accounts. In addition, estimates and assumptions are made that could affect the reported amounts of assets and liabilities during the reporting period. Details of the most significant areas where judgements and estimates are made are disclosed on page 193 of the Annual Report and Accounts 2014. In addition, further information on certain critical accounting estimates are disclosed in the following notes: Area of significant judgement and estimate Note Impairment provisions on loans and advances 8 Provisions for customer redress 9
Going concern The Group’s business activities and financial position, the factors likely to affect its future development and performance, its objectives and policies in managing the financial risks to which it is exposed, and its capital, funding and liquidity positions are discussed in the Business and Risk Report in this document. In the light of current and anticipated economic conditions, the Directors have assessed the Group’s ability to continue as a going concern. The Directors confirm they are satisfied that the Group has adequate resources to continue in business for the foreseeable future, and that therefore it is appropriate to adopt the going concern basis in preparing this interim financial information. 3 Interest receivable and similar income Half year to
30 September 2014
(Unaudited) £m
Half year to 30 September
2013(Unaudited)
£mOn residential mortgages 2,451 2,377On other loans 470 519On investment securities 175 200On other liquid assets 17 22Net expense on financial instruments hedging assets (429) (537) 2,684 2,581
Interest receivable on residential mortgages includes adjustments to reflect changes in the Group’s effective interest rate assumptions, including a credit of £1 million (H1 2013/14: charge of £17 million) in respect of an update of early redemption charges and a credit of £7 million (H1 2013/14: £21 million) which results from an update to assumptions applicable to the recognition of mortgage fee income.

Nationwide Building Society – Interim Results
81
NOTES TO THE INTERIM FINANCIAL INFORMATION (continued) 4 Interest expense and similar charges Half year to
30 September 2014
(Unaudited) £m
Half year to 30 September
2013(Unaudited)
£mOn shares held by individuals 947 1,181On subscribed capital 21 36On deposits and other borrowings:
Subordinated liabilities Other
57 65
6584
On debt securities in issue 370 417Foreign exchange differences 26 17Net income on financial instruments hedging liabilities (226) (311)Interest on net defined benefit pension liability 4 8 1,264 1,497 Interest expense is net of a £12 million credit (H1 2013/14: £33 million) which resulted from an update of the Group’s effective interest rate assumptions in relation to savings accounts which offer an initial bonus. 5 Other operating income Half year to
30 September 2014
(Unaudited) £m
Half year to 30 September
2013(Unaudited)
£mNet gain on redemption of subscribed capital - 124Rental income 2 2 2 126 6 Gains/(losses) from derivatives and hedge accounting Half year to
30 September 2014
(Unaudited) £m
Half year to 30 September
2013 (Unaudited)
£mGains/(losses) from fair value hedge accounting (note i) 4 (49)Fair value movement attributable to mortgage commitments (note ii) (4) - Fair value gains from other derivatives (note iii) 32 33 32 (16)
Notes:
i. Gains or losses from fair value hedges can arise where there is an IFRS hedge accounting relationship in place and either: the relationship passed all the monthly effectiveness tests but the fair value movement of the derivative was not exactly
offset by the change in fair value of the asset or liability being hedged (sometimes referred to as hedge ineffectiveness), or
the relationship failed a monthly effectiveness test which, for that month, disallows recognition of the change in fair value of the underlying asset or liability being hedged and in subsequent months leads to the amortisation of existing balance sheet positions over the remaining life of the hedge relationship.
ii. The Group elects to fair value its mortgage commitments in order to reduce the accounting mismatch that would otherwise arise when derivatives held at fair value are used to hedge mortgage commitments.
iii. Other derivatives are those used for economic hedging but which are not in an IAS 39 hedge accounting relationship because hedge accounting is not currently achievable. Fair value movements on these derivatives are reflected in the income statement with no offset for the fair value movement of the asset/liability being hedged.
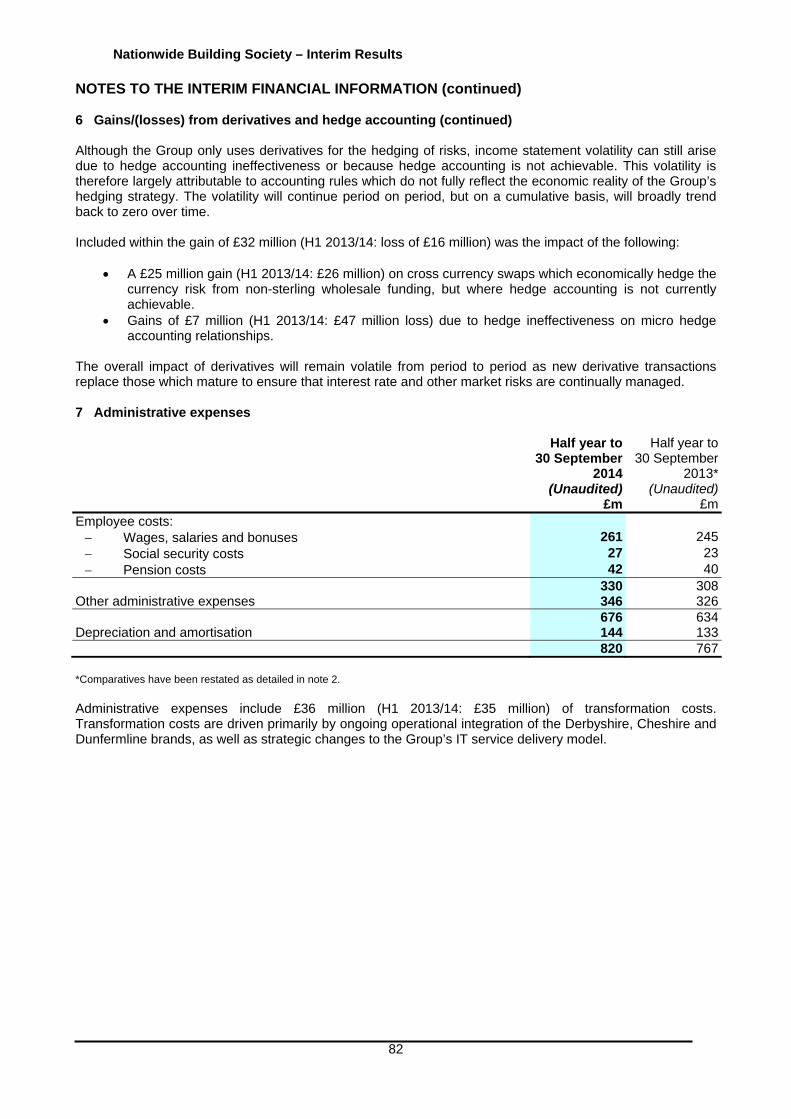
Nationwide Building Society – Interim Results
82
NOTES TO THE INTERIM FINANCIAL INFORMATION (continued) 6 Gains/(losses) from derivatives and hedge accounting (continued) Although the Group only uses derivatives for the hedging of risks, income statement volatility can still arise due to hedge accounting ineffectiveness or because hedge accounting is not achievable. This volatility is therefore largely attributable to accounting rules which do not fully reflect the economic reality of the Group’s hedging strategy. The volatility will continue period on period, but on a cumulative basis, will broadly trend back to zero over time. Included within the gain of £32 million (H1 2013/14: loss of £16 million) was the impact of the following:
A £25 million gain (H1 2013/14: £26 million) on cross currency swaps which economically hedge the currency risk from non-sterling wholesale funding, but where hedge accounting is not currently achievable.
Gains of £7 million (H1 2013/14: £47 million loss) due to hedge ineffectiveness on micro hedge accounting relationships.
The overall impact of derivatives will remain volatile from period to period as new derivative transactions replace those which mature to ensure that interest rate and other market risks are continually managed. 7 Administrative expenses Half year to
30 September 2014
(Unaudited) £m
Half year to 30 September
2013*(Unaudited)
£mEmployee costs: Wages, salaries and bonuses 261 245 Social security costs 27 23 Pension costs 42 40
330 308Other administrative expenses 346 326 676 634Depreciation and amortisation 144 133 820 767 *Comparatives have been restated as detailed in note 2. Administrative expenses include £36 million (H1 2013/14: £35 million) of transformation costs. Transformation costs are driven primarily by ongoing operational integration of the Derbyshire, Cheshire and Dunfermline brands, as well as strategic changes to the Group’s IT service delivery model.
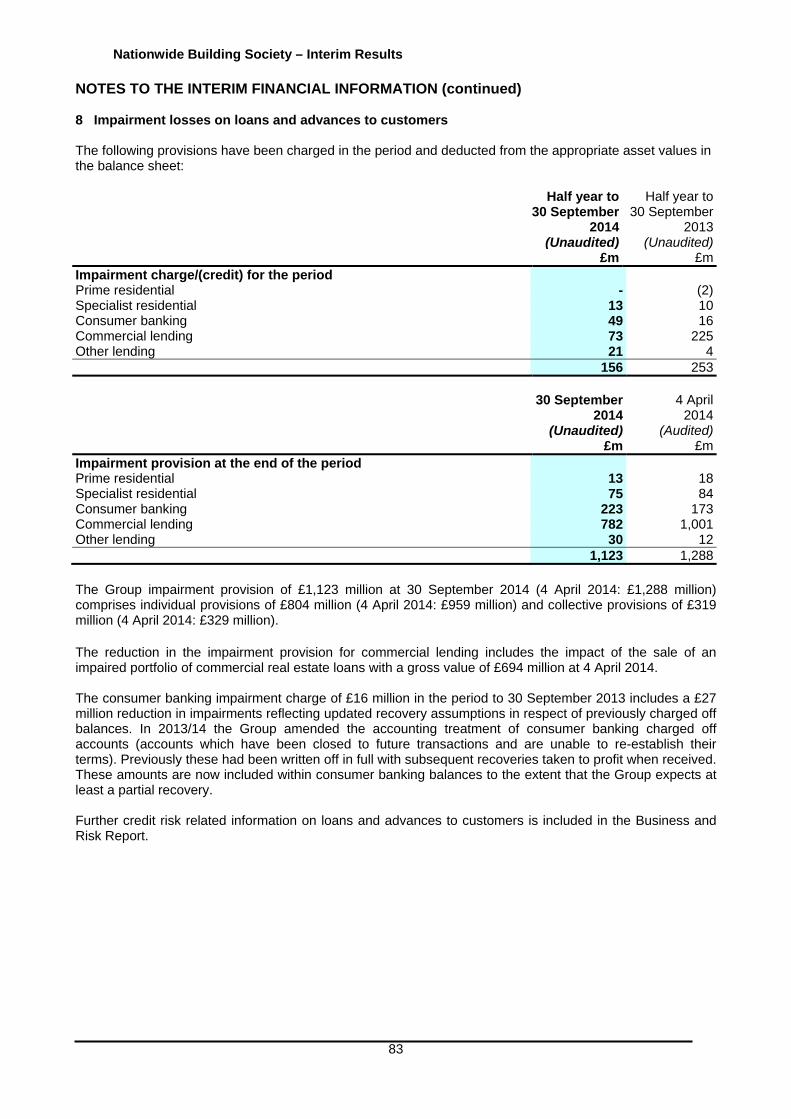
Nationwide Building Society – Interim Results
83
NOTES TO THE INTERIM FINANCIAL INFORMATION (continued) 8 Impairment losses on loans and advances to customers The following provisions have been charged in the period and deducted from the appropriate asset values in the balance sheet: Half year to
30 September 2014
(Unaudited) £m
Half year to 30 September
2013(Unaudited)
£mImpairment charge/(credit) for the period Prime residential - (2)Specialist residential 13 10Consumer banking 49 16Commercial lending 73 225Other lending 21 4 156 253
30 September
2014 (Unaudited)
£m
4 April 2014
(Audited)£m
Impairment provision at the end of the period Prime residential 13 18Specialist residential 75 84Consumer banking 223 173Commercial lending 782 1,001Other lending 30 12 1,123 1,288
The Group impairment provision of £1,123 million at 30 September 2014 (4 April 2014: £1,288 million) comprises individual provisions of £804 million (4 April 2014: £959 million) and collective provisions of £319 million (4 April 2014: £329 million). The reduction in the impairment provision for commercial lending includes the impact of the sale of an impaired portfolio of commercial real estate loans with a gross value of £694 million at 4 April 2014. The consumer banking impairment charge of £16 million in the period to 30 September 2013 includes a £27 million reduction in impairments reflecting updated recovery assumptions in respect of previously charged off balances. In 2013/14 the Group amended the accounting treatment of consumer banking charged off accounts (accounts which have been closed to future transactions and are unable to re-establish their terms). Previously these had been written off in full with subsequent recoveries taken to profit when received. These amounts are now included within consumer banking balances to the extent that the Group expects at least a partial recovery. Further credit risk related information on loans and advances to customers is included in the Business and Risk Report.
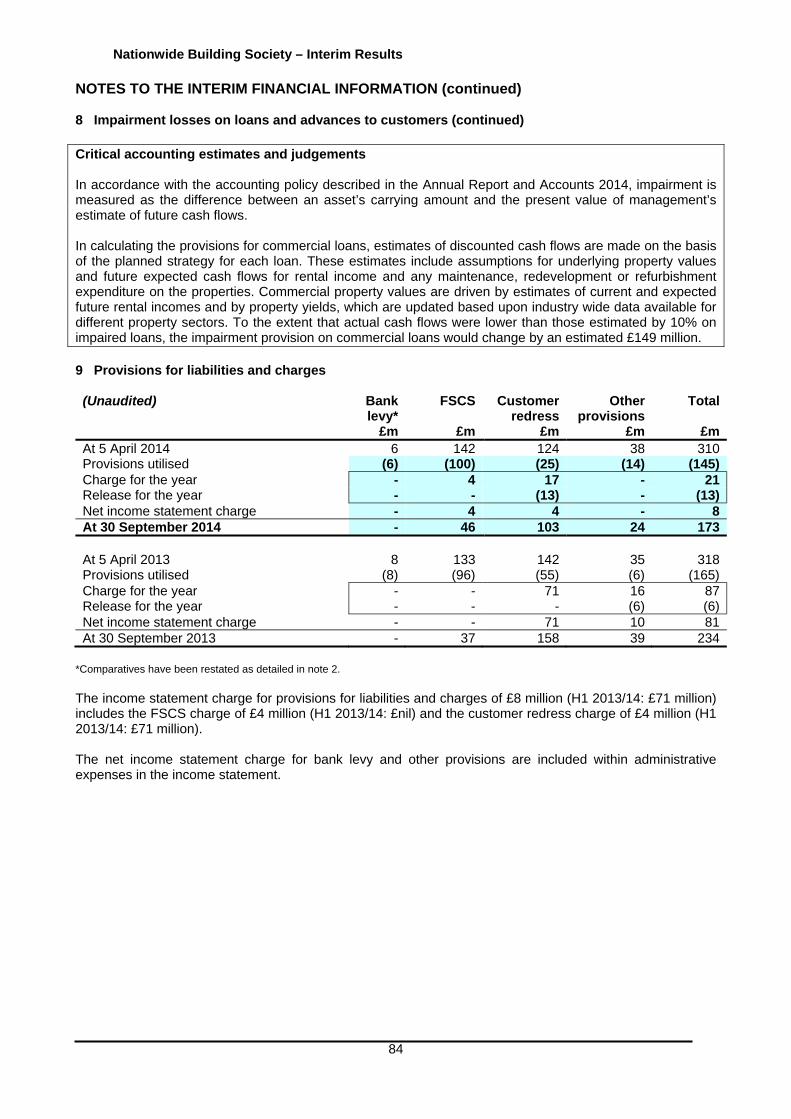
Nationwide Building Society – Interim Results
84
NOTES TO THE INTERIM FINANCIAL INFORMATION (continued) 8 Impairment losses on loans and advances to customers (continued) Critical accounting estimates and judgements In accordance with the accounting policy described in the Annual Report and Accounts 2014, impairment is measured as the difference between an asset’s carrying amount and the present value of management’s estimate of future cash flows. In calculating the provisions for commercial loans, estimates of discounted cash flows are made on the basis of the planned strategy for each loan. These estimates include assumptions for underlying property values and future expected cash flows for rental income and any maintenance, redevelopment or refurbishment expenditure on the properties. Commercial property values are driven by estimates of current and expected future rental incomes and by property yields, which are updated based upon industry wide data available for different property sectors. To the extent that actual cash flows were lower than those estimated by 10% on impaired loans, the impairment provision on commercial loans would change by an estimated £149 million. 9 Provisions for liabilities and charges (Unaudited) Bank
levy*FSCS Customer
redress Other
provisions Total
£m £m £m £m £mAt 5 April 2014 6 142 124 38 310Provisions utilised (6) (100) (25) (14) (145)Charge for the year - 4 17 - 21Release for the year - - (13) - (13)Net income statement charge - 4 4 - 8At 30 September 2014 - 46 103 24 173 At 5 April 2013 8 133 142 35 318Provisions utilised (8) (96) (55) (6) (165)Charge for the year - - 71 16 87Release for the year - - - (6) (6)Net income statement charge - - 71 10 81At 30 September 2013 - 37 158 39 234
*Comparatives have been restated as detailed in note 2. The income statement charge for provisions for liabilities and charges of £8 million (H1 2013/14: £71 million) includes the FSCS charge of £4 million (H1 2013/14: £nil) and the customer redress charge of £4 million (H1 2013/14: £71 million). The net income statement charge for bank levy and other provisions are included within administrative expenses in the income statement.
Nationwide Building Society – Interim Results
85
NOTES TO THE INTERIM FINANCIAL INFORMATION (continued) 9 Provisions for liabilities and charges (continued) Financial Services Compensation Scheme (FSCS) Following the default of a number of deposit takers during the financial crisis, the FSCS borrowed funds from HM Treasury, which currently total approximately £17 billion, to meet the compensation costs for customers. The FSCS recovers the related interest costs, ongoing management expenses and any shortfalls in recoveries from the defaulted institutions by way of an annual levy on member firms. The £46 million FSCS provision at 30 September 2014 represents the Group’s annual interest levy for the 2014/15 scheme year (30 September 2013: £37 million in respect of 2013/14 scheme year). The Group estimates that it will require a further provision of between £90 million and £120 million in respect of the 2015/16 scheme year, which, in line with IFRIC 21, will be recognised during the second half of this financial year. This includes £35 million relating to expected scheme shortfalls. Customer redress The Group holds provisions for customer redress to cover the costs of remediation and redress in relation to past sales of financial products and post sales administration, including compliance with consumer credit legislation and other regulatory matters. The £4 million charge in the period relates primarily to updated assumptions for provisions previously recognised. Other provisions Other provisions include provisions for severance costs and a number of property related provisions. Provisions are made for expected severance costs in relation to the Group’s restructuring activities where there is a present obligation and it is probable that the expenditure will be incurred. Critical accounting estimates and judgements Customer redress provisions The customer redress provision of £103 million at 30 September 2014 includes balances related to past sales of financial products, including PPI, together with an estimate of the potential costs of remediation in respect of a number of issues which are still under enquiry. The amount of the provision related to past sales of PPI is calculated based upon management’s best estimate of complaint volumes, referral rates to the Financial Ombudsman Service (FOS), uphold rates internally and with the FOS, response rates from customer contact activity relating to our previous sales, average redress payments and complaint handling costs. Other amounts that are provided as an estimate of the potential costs of remediation are subject to ongoing review of various regulatory matters, including consumer credit regulations. The estimate of customer redress is an area of significant judgement. If the total amount of customer redress that is payable increases by 10% from the current estimate, provisions would increase by £8 million. The ultimate amount of redress and related costs will depend upon potential future issues that may be identified across the industry and future customer behaviour. The total amount that could become payable could therefore differ materially from the amount currently provided, which represents management’s estimate in relation to all current known issues.

Nationwide Building Society – Interim Results
86
NOTES TO THE INTERIM FINANCIAL INFORMATION (continued) 10 Taxation The current period tax charge of £133 million (H1 2013/14: £67 million) has been offset by adjustments in relation to prior periods of £14 million (H1 2013/14: £14 million) and the impact of the change in the corporation tax rate on deferred tax of £7 million (H1 2013/14: £14 million) to result in the tax charge of £112 million (H1 2013/14: £39 million) as shown below: Half year to
30 September 2014
(Unaudited) £m
Half year to 30 September
2013* (Unaudited)
£mCurrent tax:
UK corporation tax Corporation tax – adjustment in respect of prior years
113 (14)
32-
Total current tax
99 32
Deferred tax: Current year Adjustment in respect of prior years Effect of corporation tax rate change
20
- (7)
35(14)(14)
Total deferred tax 13 7Tax charge 112 39
*Comparatives have been restated as detailed in note 2.
The actual tax charge differs from the theoretical amount that would arise using the standard rate of corporation tax in the UK as follows: Half year to
30 September 2014
(Unaudited) £m
Half year to 30 September
2013 (Unaudited)
£mProfit before tax 598 281 Tax calculated at a tax rate of 21% (2013: 23%) 126 65Adjustments in respect of prior years (14) (14)Effect of different tax rates in other countries - (2)Expenses not deductible for tax purposes 7 4 Effect of corporation tax rate change (7) (14) 112 39

Nationwide Building Society – Interim Results
87
NOTES TO THE INTERIM FINANCIAL INFORMATION (continued) 11 Loans and advances to customers Loans and advances to customers in the table below are shown net of impairment provisions held against them. 30 September
2014 (Unaudited)
£m
4 April 2014*
(Audited)£m
Prime residential mortgages 122,102 119,301Specialist residential mortgages 27,112 26,257Consumer banking 3,624 3,656Commercial lending 14,622 16,283Other lending 84 164
167,544 165,661Fair value adjustment for micro hedged risk (note i) 1,003 880 168,547 166,541 *Comparatives have been restated as detailed in note 2. Note:
i. The fair value adjustment for micro hedged risk relates to commercial lending.
Asset backed funding Certain prime residential mortgages have been pledged to the Group's asset backed funding programmes or utilised as whole mortgage loan pools for the Bank of England’s (BoE) Funding for Lending Scheme (FLS). The programmes have enabled the Group to obtain secured funding or to create additional collateral which could be used to source additional funding. The Society established the Nationwide Covered Bond programme in November 2005. Mortgages pledged provide security for issues of covered bonds made by the Society. During the period ended 30 September 2014 Swedish Krona 450 million and €80 million of notes matured (£115 million sterling equivalent). The issuances in the period ended 30 September 2014 were €1.856 billion (£1.487 billion sterling equivalent) and £0.75 billion. The Society established the Silverstone Master Trust securitisation programme in July 2008. Notes are issued under the programme and the issuance proceeds are used to purchase for the benefit of the note holders, a share of the beneficial interest in mortgages pledged by the Society. The remaining beneficial interest in the pledged mortgages of £7.7 billion (4 April 2014: £6.4 billion) stays with the Society and includes its required minimum seller share in accordance with the rules of the programme. The Group is under no obligation to support losses incurred by the programme or holders of the notes and does not intend to provide such further support. The entitlement of note holders is restricted to payment of principal and interest to the extent that the resources of the programme are sufficient to support such payment and the holders of the notes have agreed not to seek recourse in any other form. During the period ended 30 September 2014 $1.05 billion (£0.7 billion sterling equivalent) of notes matured. There were no new issuances in the period.
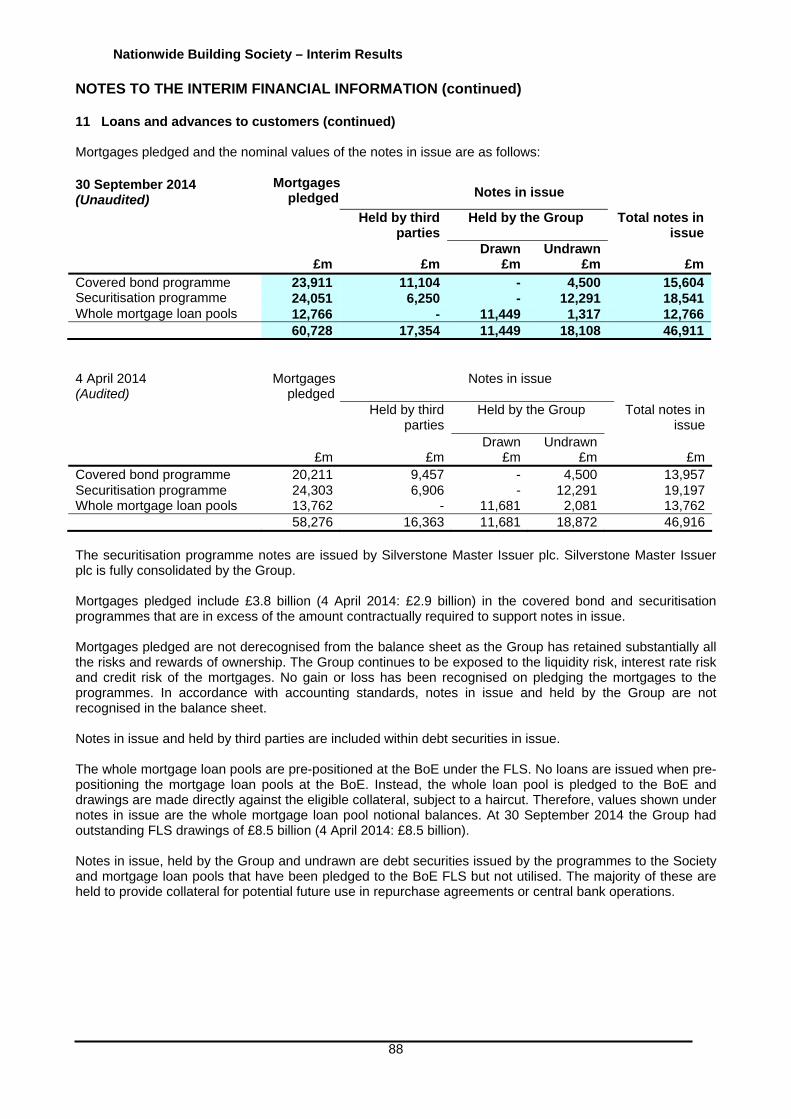
Nationwide Building Society – Interim Results
88
NOTES TO THE INTERIM FINANCIAL INFORMATION (continued) 11 Loans and advances to customers (continued) Mortgages pledged and the nominal values of the notes in issue are as follows: 30 September 2014 (Unaudited)
Mortgages pledged Notes in issue
Held by third parties
Held by the Group
Total notes in issue
£m
£m
Drawn£m
Undrawn £m £m
Covered bond programme 23,911 11,104 - 4,500 15,604Securitisation programme 24,051 6,250 - 12,291 18,541Whole mortgage loan pools 12,766 - 11,449 1,317 12,766 60,728 17,354 11,449 18,108 46,911 4 April 2014 (Audited)
Mortgages pledged
Notes in issue
Held by third parties
Held by the Group
Total notes in issue
£m
£m
Drawn £m
Undrawn £m
£m
Covered bond programme 20,211 9,457 - 4,500 13,957Securitisation programme 24,303 6,906 - 12,291 19,197Whole mortgage loan pools 13,762 - 11,681 2,081 13,762 58,276 16,363 11,681 18,872 46,916 The securitisation programme notes are issued by Silverstone Master Issuer plc. Silverstone Master Issuer plc is fully consolidated by the Group. Mortgages pledged include £3.8 billion (4 April 2014: £2.9 billion) in the covered bond and securitisation programmes that are in excess of the amount contractually required to support notes in issue. Mortgages pledged are not derecognised from the balance sheet as the Group has retained substantially all the risks and rewards of ownership. The Group continues to be exposed to the liquidity risk, interest rate risk and credit risk of the mortgages. No gain or loss has been recognised on pledging the mortgages to the programmes. In accordance with accounting standards, notes in issue and held by the Group are not recognised in the balance sheet. Notes in issue and held by third parties are included within debt securities in issue. The whole mortgage loan pools are pre-positioned at the BoE under the FLS. No loans are issued when pre-positioning the mortgage loan pools at the BoE. Instead, the whole loan pool is pledged to the BoE and drawings are made directly against the eligible collateral, subject to a haircut. Therefore, values shown under notes in issue are the whole mortgage loan pool notional balances. At 30 September 2014 the Group had outstanding FLS drawings of £8.5 billion (4 April 2014: £8.5 billion). Notes in issue, held by the Group and undrawn are debt securities issued by the programmes to the Society and mortgage loan pools that have been pledged to the BoE FLS but not utilised. The majority of these are held to provide collateral for potential future use in repurchase agreements or central bank operations.

Nationwide Building Society – Interim Results
89
NOTES TO THE INTERIM FINANCIAL INFORMATION (continued) 12 Subordinated liabilities and subscribed capital
30 September 2014
(Unaudited) £m
4 April 2014
(Audited)£m
Subordinated liabilities Subordinated notes 2,108 2,198Fair value adjustment for micro hedged risk 104 85Unamortised premiums and issue costs (12) (14) 2,200 2,269Subscribed capital Permanent interest bearing shares 562 562Fair value adjustment for micro hedged risk 61 64Unamortised premiums and issue costs (23) (25) 600 601
All of the Society’s subordinated notes and permanent interest bearing shares (PIBS) are unsecured. The Society may, with the prior consent of the Prudential Regulation Authority (PRA), redeem the PIBS and the subordinated notes early. The subordinated notes rank pari passu with each other and behind claims against the Society of all depositors, creditors and investing members, other than the holders of PIBS, Additional Tier 1 (AT1) capital and core capital deferred shares (CCDS). The PIBS rank pari passu with each other and the AT1 instruments, behind claims against the Society of the subordinated note holders but ahead of claims by the holders of CCDS.

Nationwide Building Society – Interim Results
90
NOTES TO THE INTERIM FINANCIAL INFORMATION (continued) 13 Core capital deferred shares (CCDS) (Unaudited) CCDS Share premium Total £m £m £mAt 5 April 2014 6 525 531At 30 September 2014 6 525 531
In December 2013, the Society issued 5,500,000 of £1 CCDS at £100 per share. The gross proceeds of the issuance were £550 million (£531 million net of issuance costs). CCDS are a form of Common Equity Tier 1 (CET1) capital which have been developed to enable the Group to raise capital from the capital markets. Previously issued Tier 1 capital instruments, PIBS, no longer meet the regulatory capital requirements of CRD IV and are being gradually phased out of the calculation of capital resources under transitional rules. CCDS are perpetual instruments. They rank pari passu to each other and are junior to claims against the Society of all depositors, creditors and investing members. Each holder of CCDS has one vote, regardless of the number of CCDS held. In the event of a winding up or dissolution of the Society and if there was surplus available, the amount that the investor would receive for each CCDS held is limited to the average principal amount in issue, which is currently £100 per share. There is a cap placed on the amount of distributions that can be paid to holders of CCDS in any financial year. The cap is currently set at £15.24 per CCDS and is adjusted annually in line with CPI. A final distribution of £5.50 per share in respect of the period ended 4 April 2014, amounting in aggregate to £30.25 million was paid on 20 June 2014. The distribution has been recognised in the consolidated statement of movements in members’ interests and equity. On 24 November the Board approved a distribution of £5.125 per CCDS, amounting in aggregate to £28.2 million in respect of the period to 30 September 2014. The distribution will be paid on 20 December and will be recognised through the consolidated statement of movements in members’ interests and equity by reference to the date at which it was approved. 14 Other equity instruments In March 2014, the Society issued £1,000 million (£992 million net of issuance costs) of Additional Tier 1 (AT1) capital. AT1 instruments rank pari passu to each other and to PIBS. They are junior to claims against the Society of all depositors, creditors and investing members, other than the holders of CCDS. AT1 instruments pay a fully discretionary, non-cumulative fixed coupon at an initial rate of 6.875% per annum. The rate will reset on 20 June 2019 and every five years thereafter to the five year mid swap rate plus 4.88%. Coupons are paid semi-annually in June and December. The first coupon payment of £19 million, covering the period to 19 June 2014, was paid on 20 June 2014 and has been recognised in the consolidated statement of movements in members’ interests and equity. AT1 instruments have no maturity date. They are repayable at the option of the Society on 20 June 2019 and on every fifth anniversary thereafter. AT1 is only repayable with the consent of the PRA. If the fully-loaded CET1 ratio for the Society, on either a consolidated or unconsolidated basis, falls below 7% the AT1 instruments convert to CCDS instruments at a rate of one CCDS share for every £80 of AT1 holding.
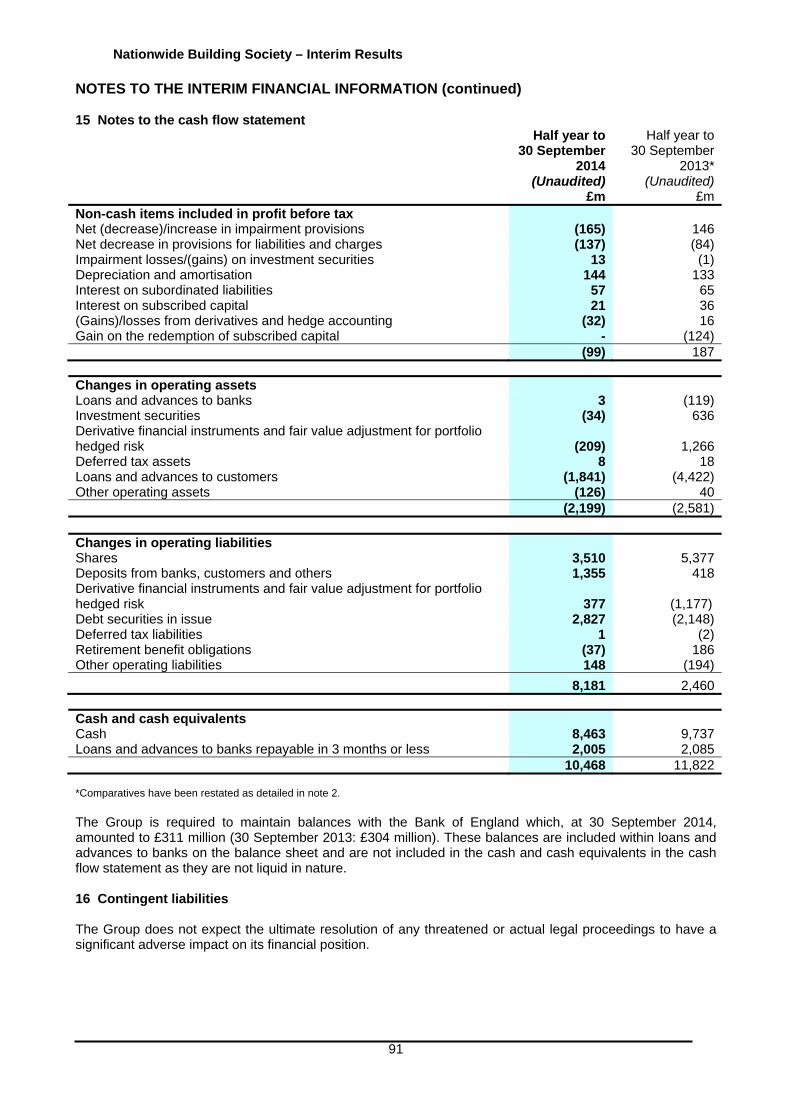
Nationwide Building Society – Interim Results
91
NOTES TO THE INTERIM FINANCIAL INFORMATION (continued) 15 Notes to the cash flow statement
Half year to 30 September
2014 (Unaudited)
£m
Half year to 30 September
2013* (Unaudited)
£mNon-cash items included in profit before tax Net (decrease)/increase in impairment provisions (165) 146Net decrease in provisions for liabilities and charges (137) (84)Impairment losses/(gains) on investment securities 13 (1)Depreciation and amortisation 144 133Interest on subordinated liabilities 57 65Interest on subscribed capital 21 36(Gains)/losses from derivatives and hedge accounting (32) 16Gain on the redemption of subscribed capital - (124) (99) 187
Changes in operating assets Loans and advances to banks 3 (119)Investment securities (34) 636Derivative financial instruments and fair value adjustment for portfolio hedged risk (209) 1,266Deferred tax assets 8 18Loans and advances to customers (1,841) (4,422)Other operating assets (126) 40 (2,199) (2,581) Changes in operating liabilities Shares 3,510 5,377Deposits from banks, customers and others 1,355 418Derivative financial instruments and fair value adjustment for portfolio hedged risk 377 (1,177) Debt securities in issue 2,827 (2,148)Deferred tax liabilities 1 (2)Retirement benefit obligations (37) 186Other operating liabilities 148 (194) 8,181 2,460
Cash and cash equivalents Cash 8,463 9,737Loans and advances to banks repayable in 3 months or less 2,005 2,085 10,468 11,822 *Comparatives have been restated as detailed in note 2. The Group is required to maintain balances with the Bank of England which, at 30 September 2014, amounted to £311 million (30 September 2013: £304 million). These balances are included within loans and advances to banks on the balance sheet and are not included in the cash and cash equivalents in the cash flow statement as they are not liquid in nature. 16 Contingent liabilities The Group does not expect the ultimate resolution of any threatened or actual legal proceedings to have a significant adverse impact on its financial position.
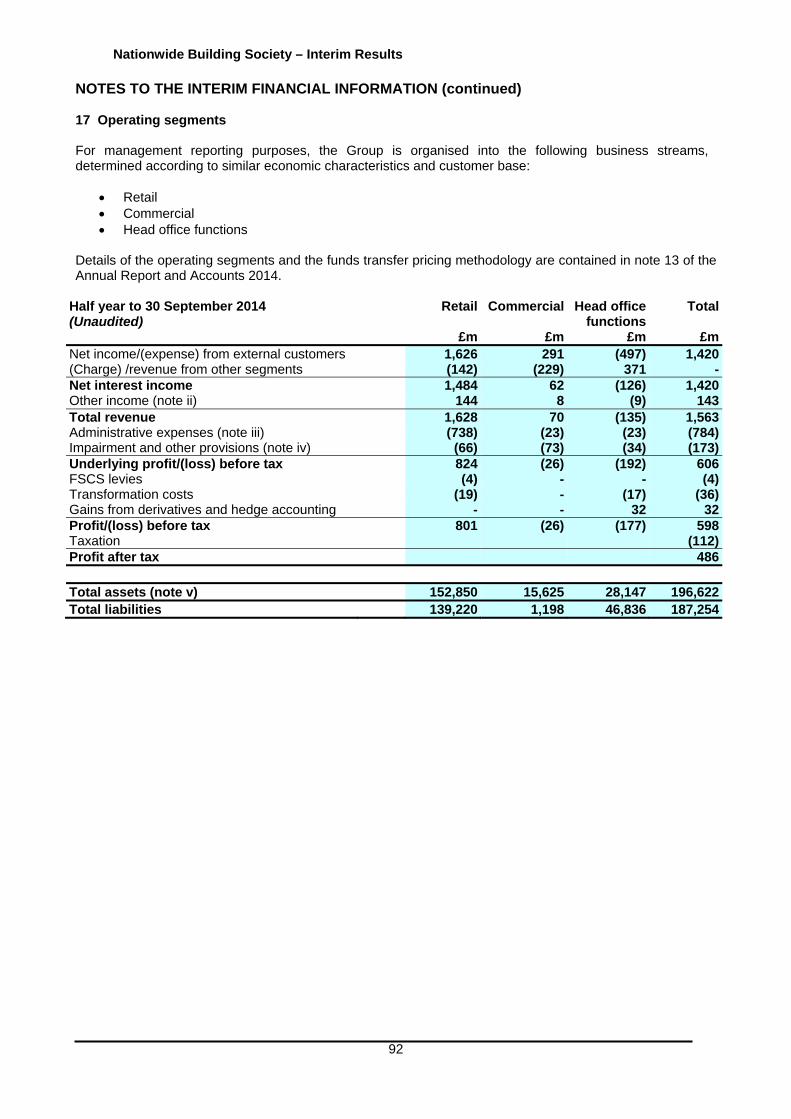
Nationwide Building Society – Interim Results
92
NOTES TO THE INTERIM FINANCIAL INFORMATION (continued) 17 Operating segments For management reporting purposes, the Group is organised into the following business streams, determined according to similar economic characteristics and customer base:
Retail Commercial Head office functions
Details of the operating segments and the funds transfer pricing methodology are contained in note 13 of the Annual Report and Accounts 2014.
Half year to 30 September 2014 (Unaudited)
Retail
£m
Commercial
£m
Head office functions
£m
Total
£mNet income/(expense) from external customers 1,626 291 (497) 1,420(Charge) /revenue from other segments (142) (229) 371 -Net interest income 1,484 62 (126) 1,420Other income (note ii) 144 8 (9) 143Total revenue 1,628 70 (135) 1,563Administrative expenses (note iii) (738) (23) (23) (784)Impairment and other provisions (note iv) (66) (73) (34) (173)Underlying profit/(loss) before tax 824 (26) (192) 606FSCS levies (4) - - (4)Transformation costs (19) - (17) (36)Gains from derivatives and hedge accounting - - 32 32Profit/(loss) before tax 801 (26) (177) 598Taxation (112)Profit after tax 486 Total assets (note v) 152,850 15,625 28,147 196,622Total liabilities 139,220 1,198 46,836 187,254

Nationwide Building Society – Interim Results
93
NOTES TO THE INTERIM FINANCIAL INFORMATION (continued) 17 Operating segments (continued)
Half year to 30 September 2013 (Unaudited)
Retail
£m
Commercial
£m
Head office functions
£m
Total(note i)
£mNet income/(expense) from external customers 1,315 348 (579) 1,084(Charge)/revenue from other segments (115) (287) 402 -Net interest income 1,200 61 (177) 1,084Other income (note ii) 170 9 124 303Total revenue 1,370 70 (53) 1,387Administrative expenses (note iii) (683) (27) (22) (732)Impairment and other provisions (note iv) (95) (225) (3) (323)Underlying profit/(loss) before tax 592 (182) (78) 332Transformation costs - - (35) (35)Losses from derivatives and hedge accounting - - (16) (16)Profit/(loss) before tax 592 (182) (129) 281Taxation (39)Profit after tax 242 Total assets (note v) 144,687 18,987 29,655 193,329Total liabilities 136,406 817 49,351 186,574 Notes:
i. Comparatives have been restated as detailed in note 2. ii. Other income excludes gains and losses from derivatives and hedge accounting which are shown separately. iii. Administrative expenses exclude transformation costs which are shown separately. iv. Impairment and other provisions includes impairment losses on loans and advances to customers, provisions for liabilities and
charges (excluding FSCS) and impairment losses on investment securities. v. Retail assets include £12 million of goodwill arising on the acquisition of The Mortgage Works (UK) plc.

Nationwide Building Society – Interim Results
94
NOTES TO THE INTERIM FINANCIAL INFORMATION (continued) 18 Fair value hierarchy of financial assets and liabilities held at fair value Fair value of financial assets and liabilities IFRS 13 requires an entity to classify financial instruments according to a hierarchy that reflects the significance of observable market inputs in calculating the fair value of the instrument. The three levels of the fair value hierarchy are defined below: Level 1 – Valuation using quoted market prices Financial instruments are classified as Level 1 if their value is observable in an active market. An active market is one in which transactions occur with sufficient volume and frequency to provide pricing information on an ongoing basis. Level 2 – Valuation technique using observable inputs Financial instruments classified as Level 2 have been valued using models whose inputs are observable in an active market. Level 3 – Valuation technique using significant unobservable inputs Financial instruments are classified as Level 3 if their valuation incorporates significant inputs that are not based on observable market data (unobservable inputs). A valuation input is considered observable if it can be directly observed from transactions in an active market, or if there is compelling external evidence demonstrating an executable exit price. The following tables show the Group's financial assets and liabilities that are held at fair value by fair value hierarchy, balance sheet classification and product type: 30 September 2014 Fair values based on (Unaudited) Level 1 Level 2 Level 3 Total
£m £m £m £m
Financial assets
Government and supranational investments 7,369 - - 7,369
Other debt investment securities - 3,959 57 4,016
Total AFS investment securities 7,369 3,959 57 11,385
Investments in AFS equity shares - - 28 28
Interest rate swaps - 1,979 - 1,979
Cross currency interest rate swaps - 440 - 440
Forward foreign exchange - 86 - 86
Equity index swaps - - 759 759
Total derivative financial instruments - 2,505 759 3,264
Other financial assets - 6 - 6
Total financial assets 7,369 6,470 844 14,683
Financial liabilities
Interest rate swaps - (2,129) - (2,129)
Cross currency interest rate swaps - (589) - (589)
Forward foreign exchange - (68) - (68)
Swaptions - (10) - (10)
Equity index swaps - - (1) (1)
Total derivative financial instruments - (2,796) (1) (2,797)Other deposits - PEBs - - (3,291) (3,291)Total financial liabilities - (2,796) (3,292) (6,088)

Nationwide Building Society – Interim Results
95
NOTES TO THE INTERIM FINANCIAL INFORMATION (continued) 18 Fair value hierarchy of financial assets and liabilities held at fair value (continued) 4 April 2014 (Audited)
Fair values based on
Level 1 Level 2 Level 3 Total
£m £m £m £m
Financial assets
Government and supranational investments 6,994 - - 6,994
Other debt investment securities - 3,498 71 3,569
Total AFS investment securities 6,994 3,498 71 10,563
Investments in AFS equity shares - - 28 28
Interest rate swaps - 1,718 - 1,718
Cross currency interest rate swaps - 619 - 619
Forward foreign exchange - 13 - 13
Equity index swaps - - 670 670
Total derivative financial instruments - 2,350 670 3,020
Total financial assets 6,994 5,848 769 13,611
Financial liabilities
Interest rate swaps - (1,985) - (1,985)
Cross currency interest rate swaps - (351) - (351)
Forward foreign exchange - (42) - (42)
Swaptions - (12) - (12)
Equity index swaps - - (1) (1)
Total derivative financial instruments - (2,390) (1) (2,391)
Other deposits - PEBs - - (3,222) (3,222)
Total financial liabilities - (2,390) (3,223) (5,613) The Group’s Level 1 portfolio comprises highly rated government securities for which traded prices are readily available. During the period ended 30 September 2014, the increase in this portfolio is largely related to net investments in gilts. Asset valuations for Level 2 AFS investment securities are sourced from consensus pricing or other observable market prices. None of the Level 2 AFS assets are valued from models. Level 2 derivative assets and liabilities are valued from discounted cash flow models using yield curves based on observable market data. Other financial assets represent fair value movements in mortgage commitments entered into where a loan has not yet been made. During the period, assets and liabilities in the Group’s Level 2 portfolio have increased, primarily due to increases in highly rated covered bond holdings, and an increase in net derivative liabilities. Transfers between fair value hierarchies Instruments move between fair value hierarchies primarily due to increases or decreases in market activity or changes to the significance of unobservable inputs to valuation. There were no significant transfers between Level 1 and Level 2 portfolios during the period.

Nationwide Building Society – Interim Results
96
NOTES TO THE INTERIM FINANCIAL INFORMATION (continued) 19 Fair value of financial assets and liabilities held at fair value – Level 3 portfolio The main constituents of the Level 3 portfolio are as follows: AFS investment securities The Group’s £57 million Level 3 AFS investment securities (4 April 2014: £71 million) comprise collateralised debt obligations (CDOs), including CDOs with a fair value of £10 million (4 April 2014: £13 million) that are subject to impairment. Substantially all of these securities are priced from internal models based on observable and unobservable performance assumptions. Investments in equity shares The Level 3 investments in equity shares of £28 million (4 April 2014: £28 million) consist primarily of an interest in a fund which is supported by zero coupon bonds of an A rated bank. External valuation models are used to obtain the fair value of the instrument. Derivative financial instruments The Level 3 assets and liabilities in this category are equity linked derivatives with external counterparties and predominantly they economically match the investment return payable by the Group to investors in the PEB product. The derivatives are linked to the performance of specified stock market indices and have been valued by an external third party. Other deposits – PEBs This category relates to deposit accounts with the potential for stock market correlated growth linked to the performance of specified stock market indices. The PEBs liability is valued at a discount to reflect the time value of money, overlaid by a fair value adjustment representing the expected return payable to the customer. The fair value adjustment has been derived from the valuation of the associated equity linked derivative as valued by an external third party. The tables below set out movements in the Level 3 portfolio, including transfers in and out of Level 3. Movements in level 3 portfolio (Unaudited)
AFS investment
securities
Investmentsin equity
shares
Net derivative
financial instruments
Otherdeposits
- PEBs
£m £m £m £m
At 5 April 2014 71 28 669 (3,222)(Losses)/gains recognised in the income statement:
Net interest expense - - (18) -Gains/(losses) from derivatives and hedge accounting - - 90 (99)Loss recognised in other comprehensive income
- fair value movement taken to members’ interests and equity (2) - - -
Settlements - - 18 30
Transfers out of Level 3 portfolio (12) - - -
At 30 September 2014 57 28 759 (3,291)
During the period one US CDO investment was transferred from Level 3 to Level 2 due to changes in the availability of observable market prices.
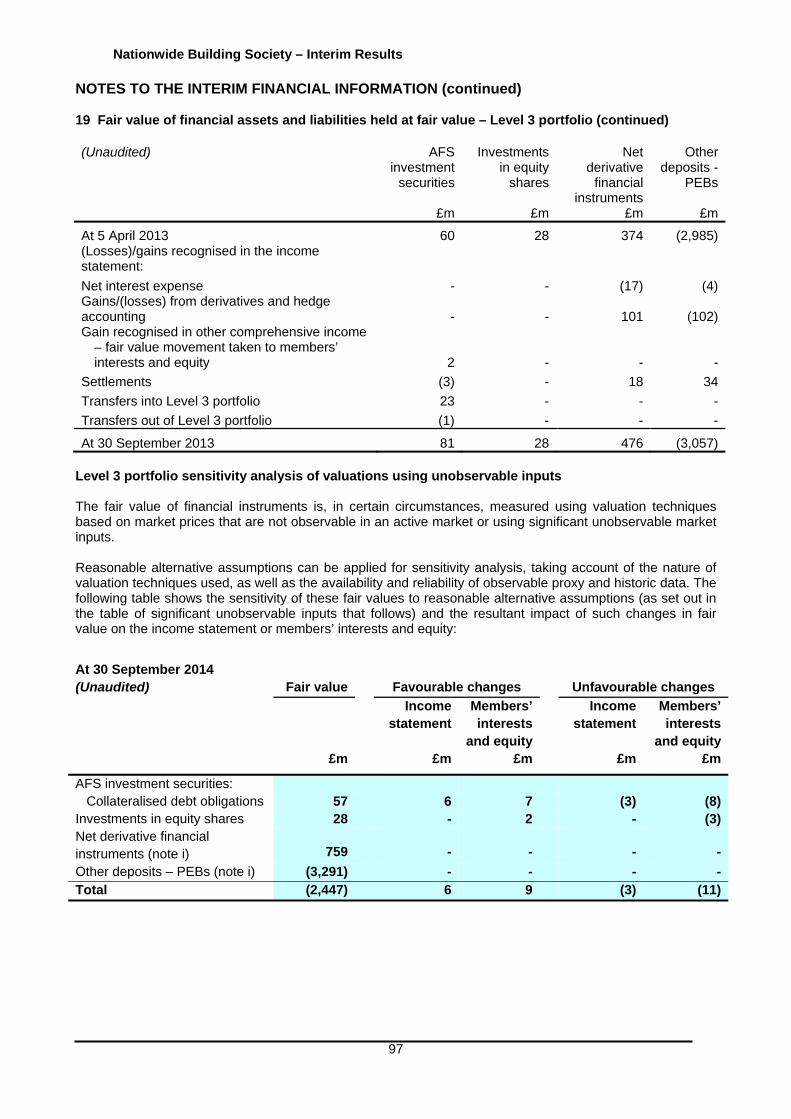
Nationwide Building Society – Interim Results
97
NOTES TO THE INTERIM FINANCIAL INFORMATION (continued) 19 Fair value of financial assets and liabilities held at fair value – Level 3 portfolio (continued) (Unaudited) AFS
investment securities
Investmentsin equity
shares
Net derivative financial
instruments
Otherdeposits -
PEBs
£m £m £m £m
At 5 April 2013 60 28 374 (2,985)(Losses)/gains recognised in the income statement:
Net interest expense - - (17) (4)Gains/(losses) from derivatives and hedge accounting - - 101 (102)Gain recognised in other comprehensive income
– fair value movement taken to members’ interests and equity 2 - - -
Settlements (3) - 18 34
Transfers into Level 3 portfolio 23 - - -
Transfers out of Level 3 portfolio (1) - - -
At 30 September 2013 81 28 476 (3,057) Level 3 portfolio sensitivity analysis of valuations using unobservable inputs The fair value of financial instruments is, in certain circumstances, measured using valuation techniques based on market prices that are not observable in an active market or using significant unobservable market inputs. Reasonable alternative assumptions can be applied for sensitivity analysis, taking account of the nature of valuation techniques used, as well as the availability and reliability of observable proxy and historic data. The following table shows the sensitivity of these fair values to reasonable alternative assumptions (as set out in the table of significant unobservable inputs that follows) and the resultant impact of such changes in fair value on the income statement or members’ interests and equity:
At 30 September 2014 (Unaudited) Fair value
Favourable changes Unfavourable changes
Income statement
Members’ interests
and equity
Income statement
Members’ interests
and equity
£m £m £m £m £m
AFS investment securities: Collateralised debt obligations 57 6 7 (3) (8)Investments in equity shares 28 - 2 - (3)Net derivative financial instruments (note i) 759 - -
- -
Other deposits – PEBs (note i) (3,291) - - - -Total (2,447) 6 9 (3) (11)

Nationwide Building Society – Interim Results
98
NOTES TO THE INTERIM FINANCIAL INFORMATION (continued) 19 Fair value of financial assets and liabilities held at fair value – Level 3 portfolio (continued)
*Changes in fair values of the equity index swaps included in net derivative financial instruments will be largely offset by the change in fair value of the PEBs deposits. Any resultant impact is deemed by the Group to be insignificant so these sensitivities have therefore been excluded from the table above. Alternative assumptions are considered for each product and varied according to the quality of the data and variability of the underlying market. Sensitivities on assets where there are no alternative pricing sources such as AFS investment securities, have been calculated by applying a range of probable scenarios against the current valuation process, resulting in a range of possible prices. Scenarios for investments in equity shares reflect prices seen in these holdings in the preceding twelve months. The following table discloses the significant unobservable inputs underlying the above alternative assumptions for assets and liabilities recognised at fair value and classified as Level 3 along with the range of values for those significant unobservable inputs. Where sensitivities are described the inverse relationship will also generally apply.
At 30 September 2014 (Unaudited)
Total assets
£m
Totalliabilities
£m
Valuationtechnique
Significantunobservable
inputs
Range Min Max Weighted
average (note i)
Units (note ii)
AFS investment securities : Collateralised debt obligations 57
Discounted cash flows
Conditional prepayment
rate 12.28 19.67 15.22 %
Loss given
default 48.17 56.38 51.93 %
Probability of
default 12.16 23.59 19.36 %
Credit spread 125 375 250 Bps
Investments in equity shares 28 Model
valuation
Price 97.00 122.50 114.00
Points
Net derivative financial Instruments (note iii) 759
Other deposits – PEBs (note iii) (3,291)
At 4 April 2014 (Audited) Fair value
Favourable changes Unfavourable changes
Income statement
Members’ interests
and equity
Income statement
Members’ interest and
equity £m £m £m £m £m
AFS investment securities: Collateralised debt obligations 71 4 7 (5) (9)Investments in equity shares 28 - 1 - (2)Net derivative financial instruments* 669 - - - -Other deposits – PEBs* (3,222) - - - -
Total (2,454) 4 8 (5) (11)

Nationwide Building Society – Interim Results
99
NOTES TO THE INTERIM FINANCIAL INFORMATION (continued) 19 Fair value of financial assets and liabilities held at fair value – Level 3 portfolio (continued)
At 4 April 2014 (Audited)
Total assets
£m
Totalliabilities
£m
Valuationtechnique
Significantunobservable
inputs
Range Min Max Weighted
average (note i)
Units (note ii)
AFS investment securities: Collateralised debt obligations 59
Discounted cash flows
Conditional prepayment
rate 13.11 21.45 16.94
%
Loss given
default 48.10 56.58 51.98 %
Probability of
default 12.07 20.00 14.81 %
Credit spread 125 375 250 Bps
12 Model
valuation
Price 65.00 80.00 75.00
Points
Investments in equity shares 28 Model
valuation
Price 97.00 110.50 106.00
Points
Net derivative financial Instruments (note iii) 669
Other deposits – PEBs (note iii) (3,222)
Notes:
i. Weighted average represents the input values used in calculating the fair values for the above financial instruments. ii. The units used to disclose ranges for significant unobservable inputs are percentages, points and basis points (bps). Points are a
percentage of par; for example 100 points equals 100% of par. One basis point (bps) equals 0.01%: for example, 125 basis points (bps) equals 1.25%.
iii. Changes in fair values of the equity index swaps included in net derivative financial instruments will be largely offset by the change in fair value of the PEBs deposits. Any resultant impact is deemed by the Group to be insignificant so these sensitivities have therefore been excluded from the table above.
Some of the significant unobservable inputs used in fair value measurement are interdependent. Where this is the case, a description of those interrelationships is included below. Conditional prepayment rate For asset backed securities where the borrower is able to prepay all or part of a loan before the contractual repayment date, the conditional prepayment rate will affect the fair value by altering the timing of future projected cash flows. The effect of a significant increase in conditional prepayment rate on fair value could be favourable or unfavourable, depending on the specific terms of the instrument. Conditional prepayment rates are typically inversely correlated to credit spread. For example, securities with high borrower credit spread typically experience lower prepayment rates, and also tend to experience higher default rates. Loss given default Loss given default represents the expected loss upon liquidation of the collateral as a percentage of the balance outstanding. In general, lower recovery and lower projected cash flows will translate to a significant increase in the loss given default, resulting in a reduction in fair value that is unfavourable for the holder of the securitised product. Probability of default The probability of default represents an annualised rate of default of the loan principal by the borrower. A significant increase in a probability of default in isolation will typically result in a movement in fair value that is unfavourable. Probability of default and conditional prepayment rates are typically inversely correlated; lower defaults on loans typically will mean higher credit quality and therefore more prepayments.

Nationwide Building Society – Interim Results
100
NOTES TO THE INTERIM FINANCIAL INFORMATION (continued) 19 Fair value of financial assets and liabilities held at fair value – Level 3 portfolio (continued) Credit spread The more perceived credit risk there is, the higher the yield that will be demanded for the instrument. This is reflected in the credit spread which typically represents the difference in yield between an instrument and a benchmark security or reference rate. The credit spread for an instrument forms part of the yield used in a discounted cash flow calculation. In general a significant increase in credit spread in isolation will result in a movement in fair value that is unfavourable for the holder of a cash instrument. Price Prices for securities that are marked to market, where the market is illiquid and supporting price information is scarce, are typically subject to significant uncertainty. An increase in the price will directly cause an increase in fair value and vice versa.

Nationwide Building Society – Interim Results
101
NOTES TO THE INTERIM FINANCIAL INFORMATION (continued) 20 Fair value of financial assets and liabilities measured at amortised cost The following table summarises the carrying value and fair value of financial assets and liabilities measured at amortised cost on the Group's balance sheet. 30 September 2014 (Unaudited)
Carrying value
Fair values based on Total fair value Level 1 Level 2 Level 3
£m £m £m £m £m
Financial assets
Loans and advances to banks 2,465 2,465 - - 2,465 Loans and advances to customers:
Residential mortgages 149,214 - - 145,845 145,845Consumer banking 3,624 - - 3,486 3,486 Commercial lending 15,625 - - 14,172 14,172 Other lending 84 - - 84 84
Investments in equity shares 1 - - 1 1
171,013 2,465 - 163,588 166,053
Financial liabilities
Shares 133,978 - 133,934 - 133,934 Deposits from banks 2,320 - 2,322 - 2,322Other deposits 4,852 - 4,854 - 4,854 Due to customers 6,219 - - 6,178 6,178Debt securities in issue 29,506 - 29,923 - 29,923Subordinated liabilities 2,200 - 2,357 - 2,357Subscribed capital 600 - 585 - 585
179,675 - 173,975 6,178 180,153
4 April 2014* (Audited)
Carrying value
Fair values based on Total fair Level 1 Level 2 Level 3 value
£m £m £m £m £m
Financial assets
Loans and advances to banks 2,110 2,110 - - 2,110 Loans and advances to customers:
Residential mortgages 145,558 - - 141,660 141,660 Consumer banking 3,656 - - 3,518 3,518 Commercial lending 17,163 - - 15,675 15,675 Other lending 164 - - 164 164
Investments in equity shares 1 - - 1 1
168,652 2,110 - 161,018 163,128
Financial liabilities
Shares 130,468 - 130,491 - 130,491 Deposits from banks 1,984 - 1,985 - 1,985 Other deposits 3,913 - 3,915 - 3,915 Due to customers 6,208 - - 6,210 6,210 Debt securities in issue 28,557 - 29,168 - 29,168 Subordinated liabilities 2,269 - 2,434 - 2,434 Subscribed capital 601 - 583 - 583
174,000 - 168,576 6,210 174,786
*Comparatives have been restated as detailed in note 2.

Nationwide Building Society – Interim Results
102
NOTES TO THE INTERIM FINANCIAL INFORMATION (continued) 20 Fair value of financial assets and liabilities measured at amortised cost (continued) Loans and advances to customers The Group estimates the fair value of loans and advances to customers using consistent modelling techniques across the different loan books. The estimates take into account expected future cash flows and future lifetime expected losses, based on historic trends and discount rates appropriate to the loans to reflect a hypothetical exit price valued on an asset by asset basis. Variable rate loans are modelled on estimated future cash flows, discounted at current market interest rates. Variable rate retail mortgages are discounted at the currently available market standard variable interest rate (SVR) which, for example, in the case of our residential BMR mortgage book generates a fair value lower than the amortised cost value as those mortgages are priced below the SVR. For variable rate commercial loans, separate market interest rates are utilised to discount the Group’s commercial real estate, registered social landlord and Project Finance lending portfolios. For fixed rate loans, discount rates have been based on the expected funding and capital cost applicable to the book. When calculating fair values on fixed rate loans, no adjustment has been made to reflect interest rate risk management through internal natural hedges or external hedging via derivatives. Shares, deposits and borrowings The estimated fair value of shares and deposits with no stated maturity (including non-interest bearing deposits) is the amount repayable on demand. The estimated fair value of fixed interest rate shares, deposits and other borrowings without quoted market prices represents the discounted amount of estimated future cash flows based on expectations of future interest rates, customer withdrawals and interest capitalisation. For these fixed rate items, the estimated future cash flows are discounted based on market offer rates currently available for equivalent deposits. For variable rate deposits, estimated future cash flows are discounted using current market interest rates for new debt with similar remaining maturity. Debt securities in issue The estimated fair values of longer dated liabilities are calculated based on quoted market prices where available or using similar instruments as a proxy for those liabilities that are not of sufficient size or liquidity to have an active market quote. For those notes where quoted market prices are not available, a discounted cash flow model is used based on a current yield curve appropriate for the remaining term to maturity. 21 Offsetting financial assets and financial liabilities The Group has financial assets and liabilities for which there is a legally enforceable right to set off the recognised amounts, and which may be settled net. However the netting arrangements do not result in an offset of balance sheet assets and liabilities for accounting purposes as the right to set off is not unconditional in all circumstances. Therefore, in accordance with IAS 32 Financial Instruments: Presentation, there are no financial assets or liabilities which are offset with the net amount presented on the balance sheet and hence all financial assets and liabilities are presented on a gross basis on the balance sheet. In accordance with IFRS 7 Financial Instruments: Disclosures, the following table shows the impact on derivative financial instruments, total return swaps and repurchase agreements relating to transactions where: there is an enforceable master netting arrangement or similar agreement in place but the offset criteria
are otherwise not satisfied, and financial collateral is paid and received. Master netting arrangements consist of agreements such as an ISDA Master Agreement, global master repurchase agreements and global master securities lending agreements, whereby outstanding transactions with the same counterparty can be offset and settled net following a default or other predetermined event.
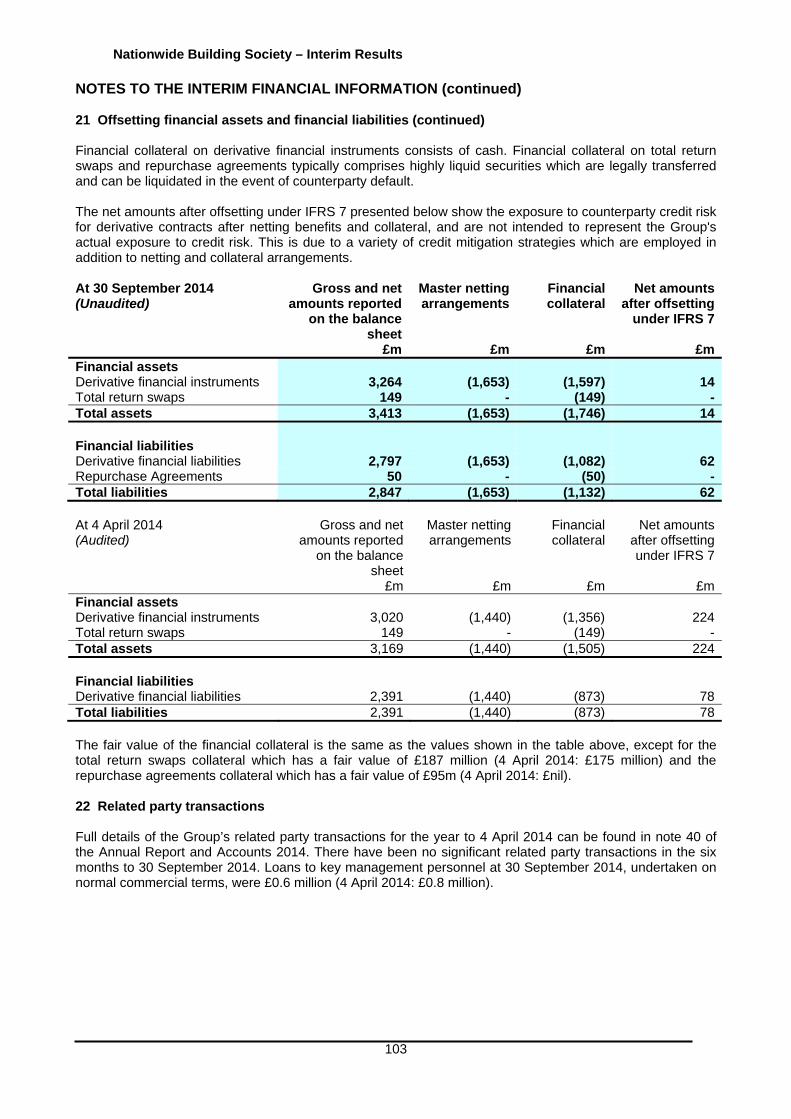
Nationwide Building Society – Interim Results
103
NOTES TO THE INTERIM FINANCIAL INFORMATION (continued) 21 Offsetting financial assets and financial liabilities (continued) Financial collateral on derivative financial instruments consists of cash. Financial collateral on total return swaps and repurchase agreements typically comprises highly liquid securities which are legally transferred and can be liquidated in the event of counterparty default. The net amounts after offsetting under IFRS 7 presented below show the exposure to counterparty credit risk for derivative contracts after netting benefits and collateral, and are not intended to represent the Group's actual exposure to credit risk. This is due to a variety of credit mitigation strategies which are employed in addition to netting and collateral arrangements. At 30 September 2014 (Unaudited)
Gross and net amounts reported
on the balance sheet
Master netting arrangements
Financial collateral
Net amounts after offsetting
under IFRS 7
£m £m £m £mFinancial assets Derivative financial instruments 3,264 (1,653) (1,597) 14Total return swaps 149 - (149) -Total assets 3,413 (1,653) (1,746) 14 Financial liabilities Derivative financial liabilities 2,797 (1,653) (1,082) 62Repurchase Agreements 50 - (50) -Total liabilities 2,847 (1,653) (1,132) 62 At 4 April 2014 (Audited)
Gross and net amounts reported
on the balance sheet
Master netting arrangements
Financial collateral
Net amounts after offsetting under IFRS 7
£m £m £m £mFinancial assets Derivative financial instruments 3,020 (1,440) (1,356) 224Total return swaps 149 - (149) -Total assets 3,169 (1,440) (1,505) 224 Financial liabilities Derivative financial liabilities 2,391 (1,440) (873) 78Total liabilities 2,391 (1,440) (873) 78 The fair value of the financial collateral is the same as the values shown in the table above, except for the total return swaps collateral which has a fair value of £187 million (4 April 2014: £175 million) and the repurchase agreements collateral which has a fair value of £95m (4 April 2014: £nil). 22 Related party transactions Full details of the Group’s related party transactions for the year to 4 April 2014 can be found in note 40 of the Annual Report and Accounts 2014. There have been no significant related party transactions in the six months to 30 September 2014. Loans to key management personnel at 30 September 2014, undertaken on normal commercial terms, were £0.6 million (4 April 2014: £0.8 million).

Nationwide Building Society – Interim Results
104
RESPONSIBILITY STATEMENT The directors confirm that, to the best of their knowledge, the condensed consolidated interim financial information has been prepared in accordance with IAS 34 as adopted by the European Union. The interim results include a fair review of the information required by DTR 4.2.7R and DTR 4.2.8R namely:
an indication of important events that have occurred in the first six months of the financial year and their impact on the condensed consolidated interim financial information and a description of the principal risks and uncertainties for the remaining six months of the financial year; and
material related party transactions in the first six months and any material changes in the related
party transactions described in the Annual Report and Accounts 2014. David Roberts was appointed as Non-Executive Director and Chairman-Elect on 1 September 2014. David Roberts will succeed the current Chairman, Geoffrey Howe, when he retires from Nationwide after the AGM in July 2015.
A full list of the Board of Directors is disclosed in the Annual Report and Accounts 2014.
Signed on behalf of the Board by Mark Rennison Group Finance Director 24 November 2014
Nationwide Building Society – Interim Results
105
Independent review report to Nationwide Building Society (‘the Society’)
Report on the condensed consolidated interim financial statements Our conclusion We have reviewed the condensed consolidated interim financial statements, defined below, in the interim results of Nationwide Building Society for the six months ended 30 September 2014. Based on our review, nothing has come to our attention that causes us to believe that the condensed consolidated interim financial statements are not prepared, in all material respects, in accordance with International Accounting Standard 34 as adopted by the European Union. This conclusion is to be read in the context of what we say in the remainder of this report. What we have reviewed The condensed consolidated interim financial statements, which are prepared by Nationwide Building Society, comprise:
● the consolidated balance sheet as at 30 September 2014;
● the consolidated income statement and statement of comprehensive income for the six months ended 30 September 2014;
● the consolidated cash flow statement for the six months ended 30 September 2014;
● the consolidated statement of movements in members’ interests and equity for the six months ended 30 September 2014; and
● the explanatory notes to the condensed consolidated interim financial statements.
As disclosed in note 2, the financial reporting framework that has been applied in the preparation of the full annual financial statements of the group is applicable law and International Financial Reporting Standards (IFRSs) as adopted by the European Union. The condensed consolidated interim financial statements included in the interim results have been prepared in accordance with International Accounting Standard 34, ‘Interim Financial Reporting’, as adopted by the European Union. What a review of condensed consolidated financial statements involves We conducted our review in accordance with International Standard on Review Engagements (UK and Ireland) 2410, ‘Review of Interim Financial Information Performed by the Independent Auditor of the Entity’ issued by the Auditing Practices Board for use in the United Kingdom. A review of interim financial information consists of making enquiries, primarily of persons responsible for financial and accounting matters, and applying analytical and other review procedures. A review is substantially less in scope than an audit conducted in accordance with International Standards on Auditing (UK and Ireland) and, consequently, does not enable us to obtain assurance that we would become aware of all significant matters that might be identified in an audit. Accordingly, we do not express an audit opinion. We have read the other information contained in the interim results and considered whether it contains any apparent misstatements or material inconsistencies with the information in the condensed consolidated interim financial statements.
Nationwide Building Society – Interim Results
106
Responsibilities for the condensed consolidated interim financial statements and the review Our responsibilities and those of the directors The interim results, including the condensed consolidated interim financial statements, are the responsibility of, and has been approved by, the directors. Our responsibility is to express to the Society a conclusion on the condensed consolidated interim financial statements in the interim results based on our review. This report, including the conclusion, has been prepared for and only for the Society and for no other purpose. We do not, in giving this conclusion, accept or assume responsibility for any other purpose or to any other person to whom this report is shown or into whose hands it may come save where expressly agreed by our prior consent in writing. PricewaterhouseCoopers LLP Chartered Accountants 24 November 2014 London Notes:
(a) The maintenance and integrity of the Nationwide Building Society website is the responsibility of the directors; the work carried out by the auditors does not involve consideration of these matters and, accordingly, the auditors accept no responsibility for any changes that may have occurred to the financial statements since they were initially presented on the website.
(b) Legislation in the United Kingdom governing the preparation and dissemination of financial statements may differ from legislation in other jurisdictions.
Nationwide Building Society – Interim Results
107
OTHER INFORMATION The interim results information set out in this announcement is unaudited and does not constitute accounts within the meaning of section 73 of the Building Societies Act 1986. The financial information for the year ended 4 April 2014 has been extracted from the Annual Report and Accounts 2014. The Annual Report and Accounts 2014 have been filed with the Financial Conduct Authority, the Prudential Regulation Authority and the Registrar of Companies. The Auditors’ Report on the Annual Report and Accounts 2014 was unqualified. Nationwide has adopted the British Bankers’ Association Code on Financial Reporting Disclosure (‘the BBA code’) in its Annual Report and Accounts 2014. The code sets out five disclosure principles together with supporting guidance. Full details of the principles are included in the Annual Reports and Accounts 2014. These principles have been applied, as appropriate, in the context of these interim results. A copy of the interim results is placed on the website of Nationwide Building Society. The directors are responsible for the maintenance and integrity of information on the Society’s website. Information published on the internet is accessible in many countries with different legal requirements. Legislation in the United Kingdom governing the preparation and dissemination of financial statements may differ from legislation in other jurisdictions. GLOSSARY Definitions used in the Interim Results for the period ended 30 September 2014 are in line with the glossary in the Annual Report and Accounts 2014. In addition, further items included in the Interim Results are defined below. Customer satisfaction measure Definition“We have been ranked number one for customer satisfaction1 amongst our high street peer group2 for three consecutive years3, and our lead over our nearest competitor has grown by two percentage points to 6.2%4 compared with the lead we reported at the year end (March 2014: 4.2%5).” (Page 3 and page 6)
1 Customer satisfaction in all instances is measured as the proportion of extremely/very satisfied customers minus proportion of extremely/very/fairly dissatisfied customers summed across current account, mortgage and savings.
2 The high street peer group is defined as Barclays, Halifax, HSBC, Lloyds Bank (inc Lloyds TSB, TSB and C&G), NatWest and Santander.
3 GfK NOP's Financial Research Survey (FRS), 12 months ending September 2014, September 2013, September 2012, c60,000 adults interviewed per year. 4 GfK NOP's Financial Research Survey (FRS), 3 months ending September 2014. 5 GfK NOP's Financial Research Survey (FRS), 3 months ending March 2014.
“Independently ranked number one for customer satisfaction1 amongst our high street peer group2 for three consecutive years3 with our lead over our nearest competitor growing to 6.2%4 (March 2014: 4.2%5).” (Page 4)

Nationwide Building Society – Interim Results
108
CONTACTS Media queries: Stuart Williamson Tel: 0207 261 6215 Mobile: 07545 740195 [email protected] Alan Oliver Tel: 0207 261 6201 Mobile: 07850 810 745 [email protected]
Investor queries: Sarah Hill Tel: 0845 602 9053 Mobile: 07720 426 180 [email protected]