nationwide diversion rate study - quantitative effects …infohouse.p2ric.org/ref/24/23793.pdf ·...
TRANSCRIPT

NA TION WIDE DIVERSION RA TE STUDY
QUANTITATIVE EFFECTS OF PROGRAM CHOICES ON RECYCLING AND GREEN WASTE DIVERSION:
BEYOND CASE STUDIES
Final Report
Prepared by:
Lisa A. Skumatz, Ph.D. Skumatz Economic Research Associates (SERA, Inc.)
Seattle, Washington 98101 Voice: (206) 624-8508
15 1 1 Third Avenue Suite 1000
FAX: (206) 624-2950
Co-sponsored by:
National Soft Drink Association (NSDAI Minnesota Office of Environmental Assistance
American Plastics Council (APC) EPA Region 5 EPA Region 9
Steel Recycling Institute (SRI) Skumatz Economic Research Associates, Inc. (SERA)
in-kind support from the Reason Foundation
July, 1996
. ~~.~ . ~~~~~~ .. . . ~~ ~ ~~~~ .
Consulting to Govermenl & Utilities. SERA, Inc. 151 1 Third Avenue, Sulte 1000. Seattle, WA 98101 Voice: (206) 624-8508 Fax: (206) 624-2950

NA TION WIDE DIVERSION RA TE STUDY
QUANTITA TIVE EFFECTS OF PROGRAM CHOICES ON RECYCLING AND
BEYOND GREEN WASTE DIVERSJON: CASE STUDIES
Final Report
Prepared by:
Lisa A. Skumatz, Ph.D. Skumatz Economic Research Associates (SERA, Inc.)
151 1 Third Avenue Suite 1000 Seattle, Washington 98 101
Voice: (206) 624-8508 FAX: (206) 624-2950
Co-sponsored by:
National Soft Drink Association (NSDA) Minnesota Office of Environmental Assistance
American Plastics Council (APC) EPA Region 5 EPA Region 9
Steel Recycling Institute (SRI) Skumatz Economic Research Associates, Inc. (SERA)
in-kind support from the Reason Foundation
July, 1996
@copyright 1996 SERA, Inc.: SRI: APC; NSDA: EPA Region 5: EPA Region 9; MnOEA: the Reason Foundation
Skumatz Economic Research Associates, lnc. 151 1 3rdAve. Suite 1000 Seattle, WA 98101 Voice: (206) 624-8508 FAX (206) 624-2950
"Nationwide Diversion Rate Study - Cluantitative Effects of Program Choices.. . ''
Final Report, July 1996
ORGANIZATION OF REPORT
1.
I I .
111.
IV.
V.
VI.
VII.
VIII.
EXECUTIVE SUMMARY A. Beyond Case Studies: Objective of the Study
1. Range of Communities 2. Results
BACKGROUND A. Introduction B. Beyond Case Studies C. Project Activities
1. Statistical Sample Design 2. Questionnaire Development 3. Data Collection and Validation 4. Multi-variate Statistical Analysis
REVIEW OF PROGRAM AND COMMUNITY DATA A. Program and Community Descriptions - What’s ”Out There”
1. Program and Collection issues 2. Demographics and Community Characteristics
ANALYSIS AND INTERPRETATION OF IMPACT RESULTS A. Introduction B. interpreting the Results
DISAGGREGATING OVERALL COMMUNITY DIVERSION RATES A. Introduction and Results
KEY FACTORS RELATED TO RECYCLING EFFECTIVENESS A. Introduction B. Results for Curbside Recycling Programs C. Dropoff Recycling Programs D. Joint Curbside and Dropoff Recycling Programs E. How Communities Tailor Recycling
YARDlGREEN WASTE PROGRAM DIVERSION FACTORS A. introduction B. How Communities Tailor Greedyard Waste Programs
IMPLICATIONS, CONCLUSIONS, AND NEXT STEPS A. Implications/Applying the Results B. Examples and Sample Calculations C. Summary and Conclusions
1 2 2 2
4 4 6 6 6 7 8 8
9 9 9
13
14 14 1 5
17 17
20 20 21 25 26 27
29 29 30
32 32 33 34
Skumatz Economic Research Associates, Inc. 151 13rdAve. Suite 1000 Seattle, WA 98101 Voice: (2061 624-8508 FAX I2061 624-2950
“Nationwide Diversion Rate Study. - i Quantitative Effects of Program Choices ... ”
Final Report, July 1996

ORGANIZATION OF REPORT
LIST OF TABLES AND FIGURES
TABLES
Table 1. Significant Factors Leading to Higher Recycling or Diversion Rates Table 2. Key Data Collected for the Study Table 3. Range of Data: What's "Out There" Table 4. Significant Impacts on Overall Community Diversion Rate Table 5. Significant Impacts from Recycling Program Features Table 6. Significant Impacts from Yard/Green Waste Program Features Table 7. Sample Calculations for Benefits and Costs of Diversion Program Changes
FIGURES
Figure 1. Diversion and Variable Rates Programs/Communities Figure 2. Analysis Tree for Overall Diversion Figure 3. Quantitative Estimates of Program Choices on Community's
Figure 4. Analysis Tree for Recycling Programs Figure 5. Quantitative Estimates of Program Choices on Recycling Diversion Figure 6. Quantitative Estimates of Program Choices on Green Waste Diversion
Overall Diversion Rate
(report copied on rec ycfed paper)
3 7
10 18 22 30 35
5 14
19 20 23 31
Skumatz Economic Reseerch Associates, Inc.
Voice: (2061 624-8508 FAX 12061 624-2950
"Netionwide Diversion Rete Study - - ii Quantitetive Effects of Program Choices... "
Final Report, July 1996

NATIONWIDE DIVERSION RATE STUDY - QUANTITATIVE EFFECTS OF PROGRAM CHOICES ON RECYCLING AND GREEN WASTE DIVERSION:
BEYOND CASE STUDIES
Lisa A. Skumatz, Ph.D. Skumatz Economic Research Associates (SERA, Inc.)
151 1 Third Avenue Suite 1000 Seattle, Washington 98101
I. EXECUTIVE SUMMARY
Even though there are 7,375 curbside' and over 9,000 dropoff recycling programs3 across the nation, thousands of yard waste programs (bringing materials to over 3,316 composting facilities)? and over 2,800 variable rates programs5, communities have very little quantitative information available to help them improve their waste management programs. A t conferences, when planners ask about the likely impacts of possible program improvements, the answers usually begin, "well, the City of /fi// in the blank] made that change and found. .. ". As planners know, answers like this are seldom transferable to other communities. The information that is available from manuals or the literature are generally case studies of single (or a small number of) communities. And unfortunately, the case study communities that receive publicity are usually those that were "special" in some way, making the information from their experience even less representative or transferable to other communities.
'This project was sponsored by a number of agencies and associations, including: National Soft Drink Association; American Plastics Council; the Steel Recycling Institute; EPA Region 5; EPA Region 9; Minnesota Office of Environmental Assistance; SERA, Inc.. and in-kind assistance was provided by the Reason Foundation.
'Steuteville, Robert, "The State of Garbage in America", Biocvcle. April 1996.
%ource: Steel Recycling Institute; personal communication with author, April, 1996. According to the Steel Recycling Institute. curbside recycling programs serve over 1,17 million U.S. residents; 91 % of programs and 94% of the covered population have access to steel can recycling.
4Steuteville, Robert, "The State of Garbage in America", Biocvcle. April 1996. Presumably, many facilities serve multiple programs. Surveys also note numerous composting programs 1e.g.. Johnson, H.L., "Backyard Composting Education Programs", Biocvcle. January 1995).
'Skumatz, Lisa A., Ph.D.. "Continued Growth for Variable Rates", Biocycle, November 1995, updated SERA, 1996.
Skumatz Economic Research Associates, Inc. 151 7 3rdAve. Suite 1000 Seattle, WA 98101 Voice: (206) 624-8508 FAX 1206) 624-2950
"Nationwide Diversion Rate Study - - 1 Qusntiiaiive Effects of Program Choices ... "
Final Report, July 1996

A. Beyond Case Studies: T h e Objective of the Study
Case studies are useful for some types of applications - specifically, for setting goals, providing outreach or implementation lessons, or "selling" programs to decisionmakers. However, case study information is inappropriate for more quantitative uses, and is particularly unsuitable for trying to estimate the impacts of program changes on other communities. This study attempts to resolve this deficiency by gathering real world program and performance data from hundreds of communities and statistically identifying which program features are most effective at increasing diversion.
We gathered data from more than 500 communities across North America, including small and large communities, with a wide variety of programs and approaches to waste management. The data were collected through an extensive phone survey, and included detailed information on programs, features, and materials; program age and changes; demographics; budgets and efficiencies; relevant legislation and goals; and tonnage information. Multiple callbacks were conducted to verify the data and clarify program issues; callbacks were often needed to speak with haulers or others with greater knowledge of particular program elements. The data were then analyzed using a statistical technique that provides defensible, generalizable information on the impacts of specific program features on diversion, controlling for differences in demographics and other program elements.
1. Range of Communities
Our data included communities ranging in population from 300 to over a million, and included both curbside and dropoff recycling and yard waste programs. Programs and collection were delivered by municipal, contract, franchise, and private arrangements. The communities included mandatory and voluntary programs; a variety of materials collected, collection methods, containers, collection frequencies, and processing methods; alternate disposal methods and costs; and included communities with and without rate incentives (variable rates).
2. Results
The analysis showed excellent results linking program features to differences in recycling and yard waste diversion between communities. The most important features explaining diversion for recycling and yard waste programs are shown in Table 1 below.
Detailed discussions of the quantitative results are provided in the body of the report. Using the specific numbers provided in the report, communities can estimate the impact of a variety of changes in their programs. In addition, several examples are provided demonstrating how to use the information to determine if changes in program designs are cost-effective for a community.
~~
~
~
Skumatz Economic Resesrch Associates, lnc. 1511 3rdAve. Suite lOOOSeattle, WA 98101 Voice: 12061 624-8508 FAX 12061 624-2950
"Nationwide Diversion Rate Study - - 2 Ouantilative Effects o f Program Choices ... "
Final Report, July 1996
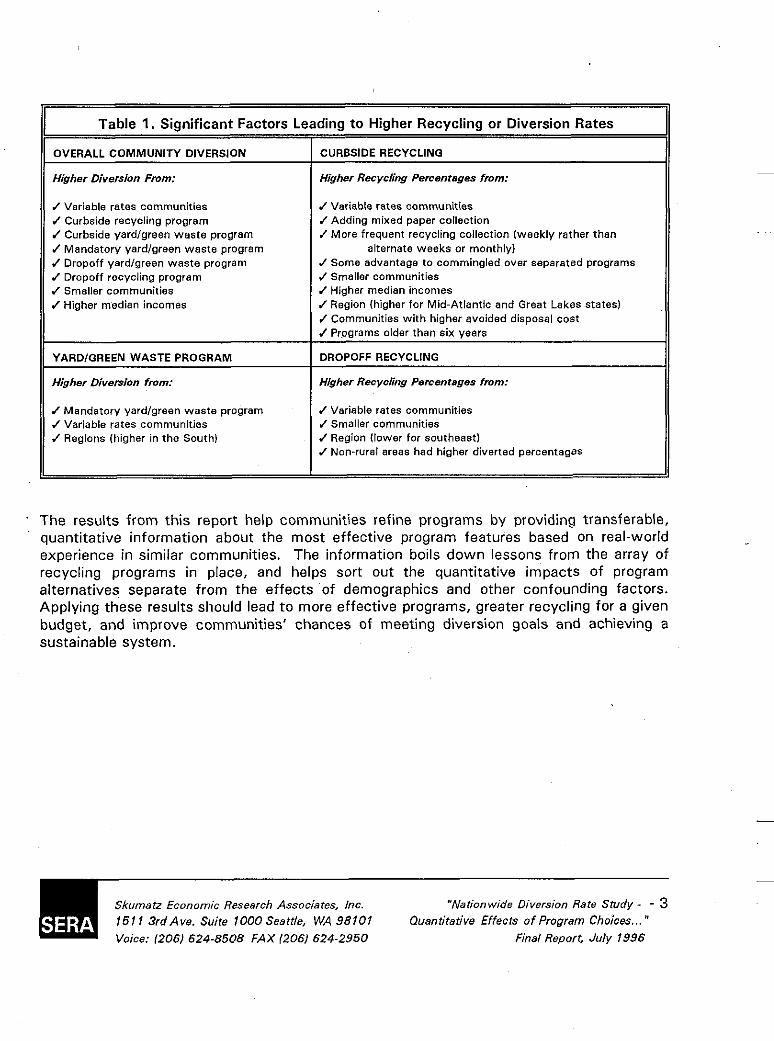
Table 1. Sianificant Factors Leadina t o Higher Recvclina or Diversion Rates - OVERALL COMMUNITY DIVERSION
Higher Diversion From:
J Variable rates communities J Curbside recycling program J Curbside yardlgreen waste program J Mandatory yardlgreen west8 program J Dropoff yardlgreen wests program J Drapoff recycling program J Smaller communities J Higher median incomes
YARDlGREEN WASTE PROGRAM
Higher Diversion from:
J Mandatory yardlgreen waste program J Variable rates communities J Regions (higher in the South)
- - - CURBSIDE RECYCLING
Higher Recycling Percentages from:
J Variahie rates communities /Adding mixed paper collection f More frequent recycling collection (weekly rather then
J Some advantage to commingled over separated programs J Smaller communities J Higher median incomes f Region (higher for Mid-Atlantic and Greet Lakes states) /Communities with higher avoided disposal cost /Programs older than six years
DROPOFF RECYCLING
Higher Recycling Percentages from:
J Variable rates communities f Smaller communities /Region (lower for southeast) J Nan-rural arees had higher diverted percentagas
alternate weeks or monthly)
' The results from this report help communities refine programs by providing transferable, quantitative information about the most effective program features based on real-world experience in similar communities. The information boils down lessons from the array of recycling programs in place, and helps sort out the quantitative impacts of program alternatives separate from the effects of demographics and other confounding factors. Applying these results should lead t o more effective programs, greater recycling for a given budget, and improve communities' chances of meeting diversion goals and achieving a sustainable system.
Skumatz Economic Research Associates, lnc. 151 1 3rdAve. Suite 1000 Seattle, WA 98101 Voice: 1206) 624-8508 FAX 12061 624-2950
"Nationwide Diversion Rate Study - - 3 Quantitadve Effects of Program Choices ... "
Final Report, July 1996

11. BACKGROUND
A. Introduction
There is widespread anecdotal and case study evidence on the effectiveness of recycling, yard waste, and incentive program designs on solid waste diversion levels. Traditional studies of cost-effectiveness of recycling programs have been conducted at the single community or case study level. These approaches do not allow results to be easily transferred, and provide virtually no program design guidance for other communities.
As a result, even though there are 7,375 curbside' and over 9,000 dropoff recycling programs' across the nation, thousands of yard waste programs (bringing materials to over 3,316 composting facilities),' and over 2,800 variable rates programsg (see Figure 11, there is little quantitative information that allows communities to understand how specific programmatic design features impact diversion. Further, programs that do get publicized are generally "special" in some way, making them less useful for communities with more "normal" circumstances. Communities have no guidance on how much extra diversion will result from changes to their programs.
B. Beyond Case Studies
This research avoided the case study approach." Rather, we used information from several hundred programs across the nation - using valid sampling approaches and statistical techniques - to derive specific estimates of the extra diversion percentages resulting from
'Steuteville. Robert, "The State of Garbage in America". Biocvcle. April 1996.
'Source: Steal Recycling Institute; personal communication wi th author, April, 1996. According to' the Steel Recycling Institute, curbside recycling programs serve over 117 million U.S. residents; 91 % of programs and 94% of the covered population have access to steel can recycling.
'Steuteville, Robert, "The State of Garbape in America". Biocvcle. April 1996. Presumably, many facilities serve multiple programs. Surveys also note numerous composting programs (e.~., Johnson, H.L., '"Backyard Composting Education Programs", Biocvcle. January 1995).
'Skumatz, Lisa A,, Ph.D., "Continued Growth for Variable Rates", Biocycle, November 1995, updated SERA, 1996.
'?his project was sponsored by a number of agencies and associations, including: National Soft Drink Association; EPA Region 5; EPA Region 9; American Plastics Council; Minnesota Office of Environmental Assistance; the Steel Recycling Institute: SERA, Inc., and in-kind assistance was provided by the Reason Foundation.
~
Skumatz Economic Research Associates, lnc.
Voice: 12061 624-8508 FAX 12061 624.2950
"Nationwide Diversion Rate Study - - 4 Quantitative Effects o f Program Choices ...I
Final Report, July 1996

Curbside recycling programs
Drop off recycling programs
Yard trimmings composling facilities
SOWCe,:
1 SleUteville. T h e Slate of Garbage in AmeriCr-B&qsk. August 19% 2 Stnl Resysling InstitUte. personal sommunisslim with Skumah. April 19% 3 Skumah Economic Research Arrocialer. 1°C.. verified variable rates communitle5. ucddated from
7.375
I > 9,000
3,316 '
Skumrh, '&lInued G r W h for Variable R & r . , ' ~ . November 1995
IERA, IN... 1996
specific program design choices. One of the most common types of questions that communities ask a t conferences and workshops is whether it makes sense for the community to introduce a new program or modify an existing program in a particular way. Virtually every time, the response is a citation from a particular community that made the change. Information from one specific community (or even a few communities) is seldom generalizable t o other communities - the case study cannot control for the vast number of differences between Eommunities and specific program factors that will affect appropriateness and performance.
Case studies are highly appropriate when used for setting goals, providing lessons in how t o implement selected program features, and provides a source for outreach materials and information that helps avoid "reinventing the wheel".
However, the bulk of research in the solid waste field attempts to use case studies in roles that they cannot support. Although they are commonly used for the following purposes, case studies (especially "model communities'' or high performers) are not very appropriate for:
m
D
estimating the performance of a set of programs or options in another community
deriving "average" diversion information for use in other communities,
determining the effect of a program change, or effects from introducing a particular program. in another community, or similar quantitative results.
Skumatz Economic Research Associates, lnc. 151 1 3rdAve. Suite 1000 Seattle, WA 98101 Voice: lZ06) 624-8508 FAX 12061 624-2950
"Nationwide Diversion Rate Study ~ - 5 Quantitative Effects of Program Choices ... "
Final Report, July 1996
Case study work, unless it is carefully designed, cannot give communities information about how much they can expect to achieve in diversion from alterative program designs. The qualitative and quasi-quantitative information supplied by a limited number of case studies has frequently been used in ways that are not supportable. No matter how good the data, with
of programs from the multitude of other differences between the communities (e.g., size, economic factors, program differences, etc.). This problem was avoided in this study because data from many hundreds of communities were used, and the communities were selected to represent the broad range of communities and programs in place across the nation - they do not represent "special" communities. Further, we applied a statistical analysis technique that allowed us to explicitly sort out the effects of program and community differences.
a limited number of communities (and limited variation), it is impossible to sort out the effects ~~
~
C. Project Activities
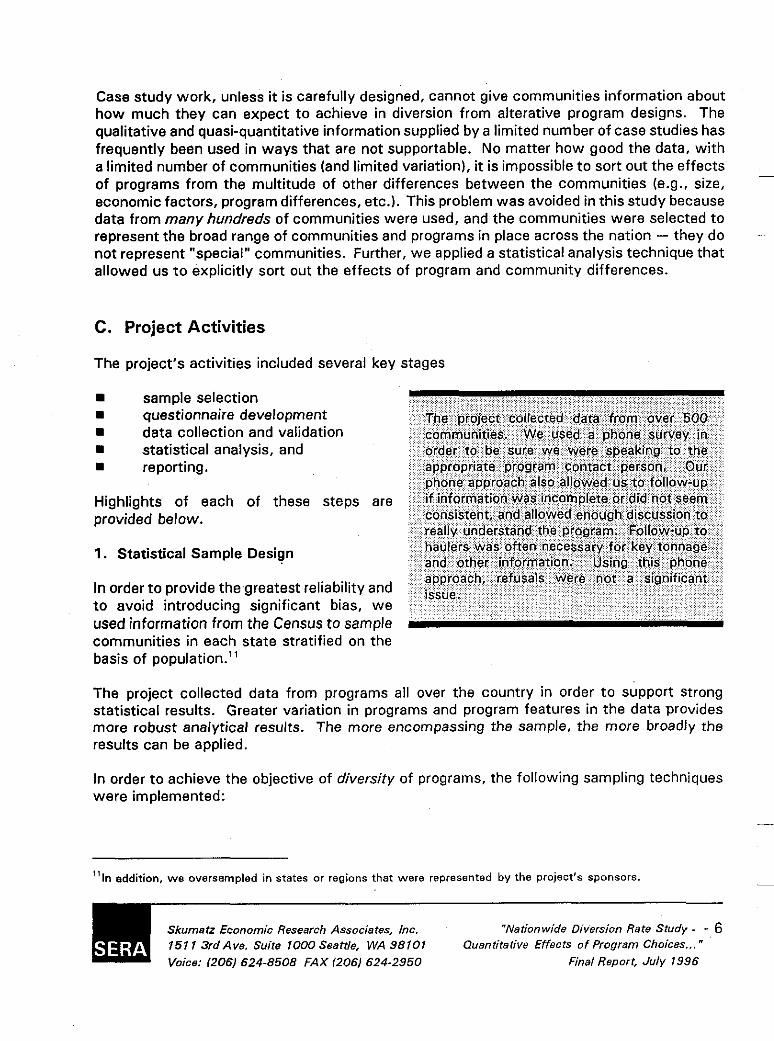
The project's activities included several key stages
sample selection questionnaire development data collection and validation statistical analysis, and reporting.
Highlights of each of these steps are provided below.
1. Statistical Sample Design
In order to provide the greatest reliability and :
to avoid introducing significant bias, we used information from the Census to sample communities in each state stratified on the basis of population."
The project collected data from programs all over the country in order to support strong statistical results. Greater variation in programs and program features in the data provides more robust analytical results. The more encompassing the sample, the more broadly the results can be applied.
In order to achieve the objective of diversify of programs, the following sampling techniques were implemented:
"In addition, w e oversampled in states or regions that were represented by the project's sponsors.
Skumatz Economic Research Associates, lnc. 151 13rdAve. Suite 1000 Seattle, WA 98101 Voice: 12061 624-8508 FAX (2061 624-2950
"Nationwide Diversion Rate Study - - 6 Quantitative Effects of Program Choices ... "
Final Report, July 1996
Random communities above and below 10,000 in population were targeted. The sample was stratified by population, with a larger percentage sampling from communities above 10,000 (because there are fewer communities above 10,000). Selecting randomly without stratifying by size would have resulted in a huge percentage of observations from small towns, because they are more numerous. Therefore, we "oversampled" from larger communities to better characterize the heterogeneity of communities and programs.
Programs were randomly selected from a sample of the largest five communities of each state (to help represent "very large" communities and to provide regional and state diversity).
Programs were sampled from a comprehensive SERA l ist of variable rates communities. If we had selected randomly from communities across the nation, we would not likely have selected enough variable rates communities by chance to separately identify effects from these programs.
2. Questionnaire development
We developed an initial phone questionnaire and a follow-up questionnaire with more complicated information and requests to clarify data that seemed suspect from our initial data collection round. The questionnaire was designed to collect data on as even a basis a5 possible. In addition, the instrument was designed to "pre-code" data where appropriate to facilitate data entry and to create a database that would be as close to "analysis-ready'' a5 possible. We worked with sponsors and reviewers to try to cover all key program design features and cover options used in different parts of the nation. The data collection instruments ask questions about community features; programmatic design and features; revenue sources; budgets, staffing, and efficiencies; and tonnage/diversion.
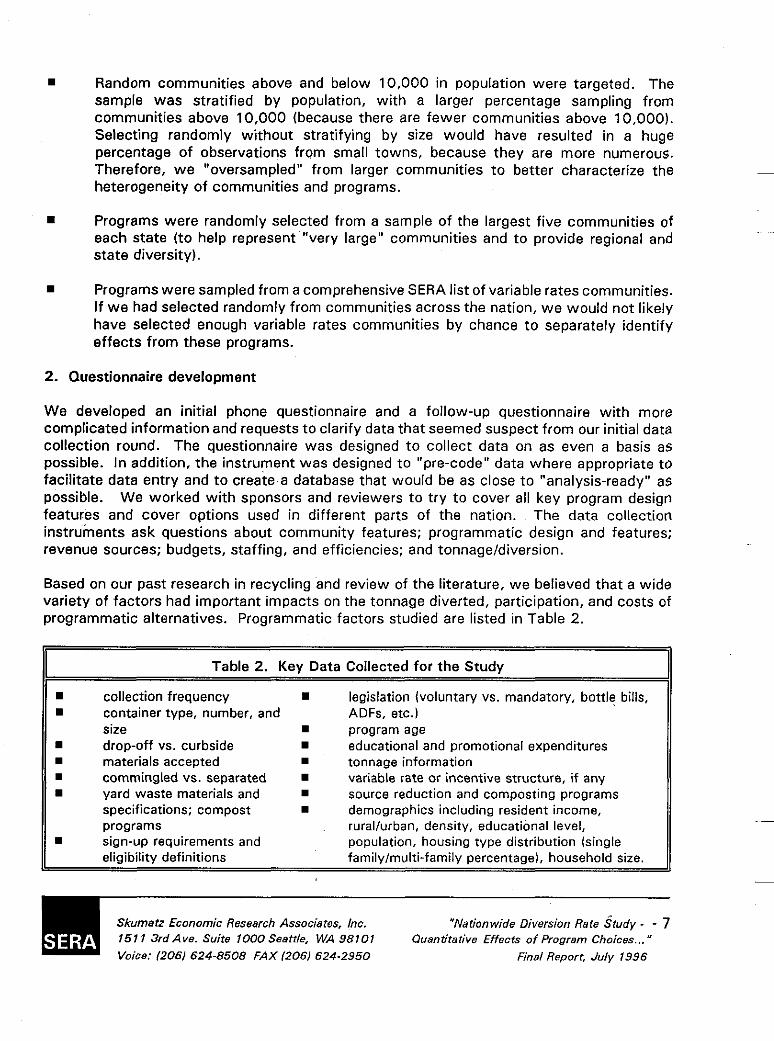
Based on our past research in recycling and review of the literature, we believed that a wide variety of factors had important impacts on the tonnage diverted, participation, and costs of programmatic alternatives. Programmatic factors studied are listed in Table 2
Table 2. Key Data Collected for the Study I! collection frequency legislation (voluntary vs. mandatory, bottle bills, container type, number, and ADFs, etc.)
drop-off vs. curbside educational and promotional expenditures materials accepted tonnage information
m commingled vs. separated variable rate or incentive structure, if any yard waste materials and source reduction and composting programs specifications; compost demographics including resident income, programs rurahban, density, educational level,
eligibility definitions
size program age
sign-up requirements and population, housing type distribution (single family/multi-family percentage), household size.
Skumatz Economic Research Associates, Inc. 151 1 3rdAve. Suite 1000 Seattle, WA 98101 Voice: 12061 624-8508 FAX 12061 624-2950
"Nationwide Diversion Rate Study - - 7 Quantitative Effects of Program Choices ... "
Final Report, July 1996
3. Data Collection and Validation
The phone surveys were conducted from the questionnaires. We found that obtaining the range of information we were after required multiple calls to numerous staff at the agency, and often calls to other agencies where tonnage or other information was maintained. Tonnage and other figures were often unavailable when collection was conducted by private haulers under franchise or contract arrangements. Reliable, consistent, or comparable cost data were very difficult to obtain. We made numerous call-backs to try to complete as much of the survey as the source(s) associated with the solid waste agency could locate.
4. Multi-variate statistical analysis
The project used statistical analysis incorporating quantitative information on diversion rates, program features, demographics, program maturity, level of efforts and efficiencies, and other factors to ident i fy the impacts of program modifications and alternatives based on community characteristics. Issues associated with the analysis technique are addressed in the results section of this paper.
~~
~
Skumatz Economic Research Associates, Inc. 151 1 3rdAve. Suite 1000 Seattle. WA 98101 Voice: (2061 624-8508 FAX (2061 624-2950
"Nationwide Diversion Rate Study - - 8 Quantitative Effects of Program Choices. .. ''
Final Report, July 1996
Ill. REVIEW OF PROGRAM AND COMMUNITY DATA
Again, a key objective of this project was to collect information from a broad range of programs, including randomly selected communities of different sizes and locations. Variation in program design and community characteristics improves the quality of the estimated results. Using data from hundreds of operating programs around the country allowed more reliable results, and allowed the results to represent actual fieldexperience. Case studies can only extrapolate data from a few potentially non-representative communities and draw casual inferences. This study concentrated on collecting sufficient data to control for the separate influences of community and program differences.
A. Program and Community Descriptions - What's "Out There" and the Range of Data Included
In order to give the reader an idea of the range of "coverage" of the sample, the following section provides highlights of the "raw" data collected for this study. Community and program characteristics are presented in Table 3, and summarized in the succeeding paragraphs.
1. Program and Collection Issues
The sampled communities have variations in:
who conducts garbage collection: Residential solid waste collection is most commonly conducted by municipal employees or by contracted private haulers (our sample included about 40% of each). Franchised collection is the next most frequently reported collection arrangement, with a smaller sample of licensed and competitive private haulers providing this service. However, it is important to note that the quality and completeness of data collected for these different arrangements varied: we were able to gather a broader range of data from communities with municipal collection, and certain types of data were missing more often when data from private haulers were requested.
Skumatz Economic Research Associates, Inc. "Nationwide Diversion Rate Study - - 9 Quantitative Effects of Program Choices... "
Final Report, July 1996 Voice: (2061 624-8508 FAX (2061 624-2950

Table 3. Range of Data: What's "Out There" 1 TOPIC
Collection and disposal Garbage collection Recyc. and YIW coll'n Disposallprocessing
Programs Curb vs. dropoff
Program age
Eligibility
Signup methods
Participation
Collection frequency
Collection days
Mandatorylvoluntary
Diversion and goals
Program modifications
Materiels
Containers
Demographics Populationlhouseholds
Income
State and regional coverage
. Based on unweightad raw sample data
(Source: 199516 SERA Survey)
FINDINGS
/ Municipal most common, followed by contract end franchise /Contract most common, followed by municipal for recyc.; reverse for YIW /Over 90% report landfills, fewer than half reported MRFs, 10% incinerators. varies by region
/ 76% reported curbside recyc. programs; half had dropoff (many had both; fewer than 10% reported none). Half of communities had curbside YIW, and one-third dropoff Y I W 26% reported no yard waste programs. / Sample programs ranged from pre-1970 through new installations; 1991 was the most common implementation year for recycling; similar, but e little later for Y/W / Half allowed multifamily buildings to participate in recycling program; four units was most common cutoff / Delivering containers to everyone was most common, followed by no sign-up procedures; only a small percentage required signup for containers and service /Many communities did not report recycling participation rates. Almost 10% gave 100% rate because of their mandatory program or mandatory container deliverv. Significant variations in definition of participation and set out. / Most reported weekly recyclables collection; virtually all the remainder collected every other week. More than half reported weekly YIW collection, but e quarter reported "irregular" or seasonal programs. / Half reported recycling and garbage collected on 8eme day; collected same day as yard waste less frequently; a quarter had YIW collected same days as others. / 113 of recycling programs weie reported as mandatory; 20% of YIW programs reported mandatory: 16% banned yard waste (YIW) a t the landfill. .'Of those reporting recycling or diversion goals; many stated "none". 25% was most common goal; 40% and 60% also common. Reported diversions ranged from 6% to over 60%. Because of measurement compatibility issues from reported diversion figures, calculated diversions from tonnage data were used in the model. / About 113 reported recycling program changes in the last 3 years, mostly changing materials (adding OCC or mixed paper, or eliminating colored glass). / The vast majority collected same core materials (Aluminum, clear and colored glass, newspaper, steel cans; additionally, 80% reported collecting PET or HDPEI. Mixed paper was collected by less than half of the sample, and additional plastics were collected by about 16%. Grass, brush, limbs, leaves in most Y/W programs; some grass only or leaves only. / Recycling containers provided included bins, stackables, toters, and bags '
/ 300 to over a million in population; 100+ to more than 700,000 households. Half classified themselves as urban, a quarter as rural, and 16% as suburban; e number elected not to answer. / Census median incomes for communities varied from under $15,000 to over $100,000 annually. /A l l but one state was represented; some communities from Canada were included; fairly similar percentages of the ssmpie were from each of the major regions of the country.
Skumatz Economic Research Associates, Inc.
Voice: 12061 624-8508 FAX 12061 624-2950
"Nationwide Diversion Rate Study - - 10 Quantitative Effects of Program Choices ... "
Final Report, July 1996

who conducts recycling collection: Contracted collection was more frequently reported for recycling; a third of those reporting used municipal staff, and about half reported collection via contracts.
who provides yard waste collection: Of those reporting, over half provide collection with municipal staff, and about a quarter provide service via contract.
program participation: Over three-quarters of communities did not have or report yard waste program participation. Over 10% of those reporting listed yard waste participation as loo%, given bans a t the landfill or community-wide eligibility. The median participation value given was 70%. About half the communities did not report recycling participation rates. Nearly 10% of those reporting gave 100% recycling participation, given that their programs were mandatory or they delivered containers to all customers. "Participation" was self-defined, with the majority implying the definition had to do with the number of customers setting out a t least once a month.
curbside vs. dropoff recycling programs: Both curbside and dropoff programs were surveyed; almost three-quarters of the communities we interviewed reported curbside recycling programs; about half had dropoff programs (there is some overlap). Fewer than 10% reported having no recycling program available. Of those reporting starting years for programs, the earliest reported in our sample was 1970. The programs started to grow in the late 198Os, with 1991 as the single greatest year for establishment of programs in the sample.
curbside vs. dropoff yard waste program: About one-quarter of the communities reported no yard waste programs. About half of communities reported curbside programs, and about one-third provided dropoff programs (there is some overlap). A large majority also reported some kind of composting program, including, most commonly a training program. A few leaf and other programs were started before 1970, but the majority of programs reported their start date in the 1990s.
program eligibility: Perhaps half of the communities in the sample reported that multi- family buildings were eligible for a local recycling program; the cutoff for building sizes was most frequently four-unit buildings. Many other communities le f t it up to the building owner and provided recycling for all buildings not using dumpster service.
program signup methods: About half of the communities in the sample reported delivering bins to all customers; about a third report either no signup procedures or containers or that they just make collection available to all eligible customers. Only a minority (about a tenth of the sample) had customers sign up to get bins or get collection.
H
Skumatz Economic Research Associates, lnc. 151 1 3rdAve. Suite 1000 Seattle, WA 98101 Voice: 12061 624-8508 FAX 12061 624-2950
"Nationwide Diversion Rate Study - - 1 1 Quantitative Effects of Program Choice s... "
final Report, July 1996
collection frequency: Of those reporting collection frequencies, most programs reported weekly collection for both recycling (about three-quarters) and yard waste (over half). Less than a quarter reported every other week recycling collection, and only a few reported monthly collection. However, almost a quarter of those reporting the frequency of their yard waste programs reported "other" frequencies - often irregular or seasonal schedules. A few communities collected recycling weekly, but collected different materials each week.
collection days: About half of the programs sampled reported that recycling and garbage were collected on the same day; yard waste was less frequently reported as collected on the same days as either recycling or garbage (about a quarter of the sample for each).
H
H mandatory programs: About a third of recycling programs were reported as "mandatory"; about a fifth of yard waste programs were reported as "mandatory".
bans: About 15% of the communities reported a ban on yard waste a t the disposal facility.
diversion goals: Diversion goals were reported by about 40% of respondents; a large number reported as "don't know" or "none". Goals of 25% were the most common figure reported, with 40% and 50% goals also commonly reported.
H
program changes: Almost a third of communities reported changes to their recycling program in the last few years, with the most frequent type of change reported as changing materials (most added mixed paper or cardboard, or discontinued colored glass). Very few green waste programs had been modified.
recycling materials collected: Nearly all curbside programs collected the same core materials: aluminum; brown, clear, and green glass; steel, and newspaper. Over 80% reported collecting PET and HDPE. Mixed paper was reported collected in about 40% of the programs reporting materials. Dropoff programs commonly collected aluminum, glass, and newspaper. Again, over 80% of the dropoff programs reporting materials collected PET and HDPE, as well as OCC and steel cans. Two thirds reported mixed paper collection. About 15% reported collecting other types of plastics (beyond numbers 1 and 2).
H containers: The most common container sizes reported were 14-1 8 gallons. The vast majority of programs reported providing some kind of standard container or containers.
yard waste program materials collected: Nearly all curbside programs reported Some reported leaf materials collected included grass, brush, limbs, and leaves.
programs only. ~
Skumat.? Economic Research Associates, lnc.
Voice: 12061 624-8508 FAX I2061 624-2950
"Nationwide Diversion Rate Study - - 1 2 Quantitative Effects of Program Choices... "
Final Report, July 1996
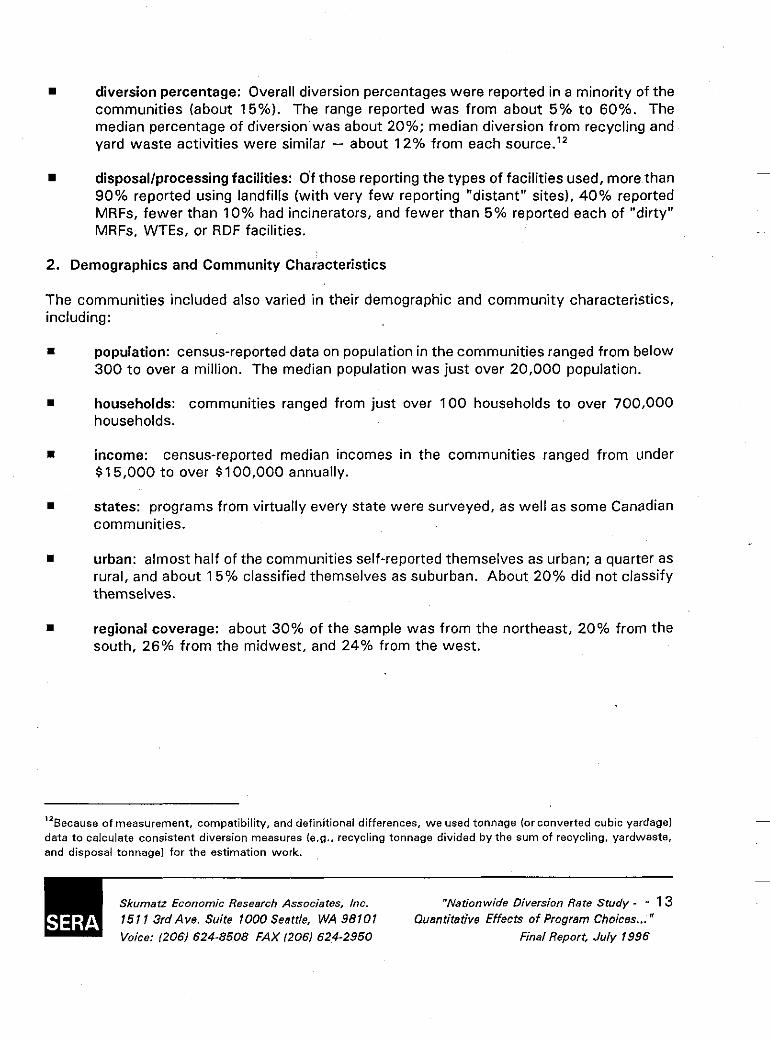
diversion percentage: Overall diversion percentages were reported in a minority of the communities (about 15%). The range reported was from about 5% to 60%. The median percentage of diversion was about 20%; median diversion from recycling and yard waste activities were similar - about 12% from each source.12
disposallprocessing facilities: Of those reporting the types of facilities used, more than 90% reported using landfills (with very few reporting "distant" sites), 40% reported MRFs, fewer than 10% had incinerators, and fewer than 5 % reported each of "dirty" MRFs, WTEs, or RDF facilities.
2. Demographics and Community Characteristics
The communities included also varied in their demographic and community characteristics. including:
population: census-reported data on population in the communities ranged from below 300 to over a million. The median population was just over 20,000 population.
households: communities ranged from just over 100 households to over 700,000 households.
income: census-reported median incomes in the communities ranged from under $15,000 t o over $100.000 annually.
states: programs from virtually every state were surveyed, as well as some Canadian communities.
urban: almost half of the communities self-reported themselves as urban; a quarter as rural, and about 15% classified themselves as suburban. About 20% did not classify themselves.
regional coverage: about 30% of the sample was from the northeast, 20% from the south, 26% from the midwest, and 24% from the west.
Because of measurement, compatibility, and definitional differences, we used tonnage (or converted cubic yardage1 data to calculate consistent diversion measures (e.g., recycling tonnage divided by the sum of recycling, yardwaste, and disposal tonnage1 for the estimation work.
12
Skumatz Economic Research Associafes, lnc. 151 13rdAve. Suite lOOOSeattle, WA 98101
"Narionwide Diversion Rate Srudy - - 13 Quantitative Effects of Program Choices ... " - - Voice: (2061 624-8508 FAX (2061 624-2950 Final Report, July 1996
/V, ANAL YSIS AND INTERPRETATION OF IMPACT RESUL TS
A. Introduction
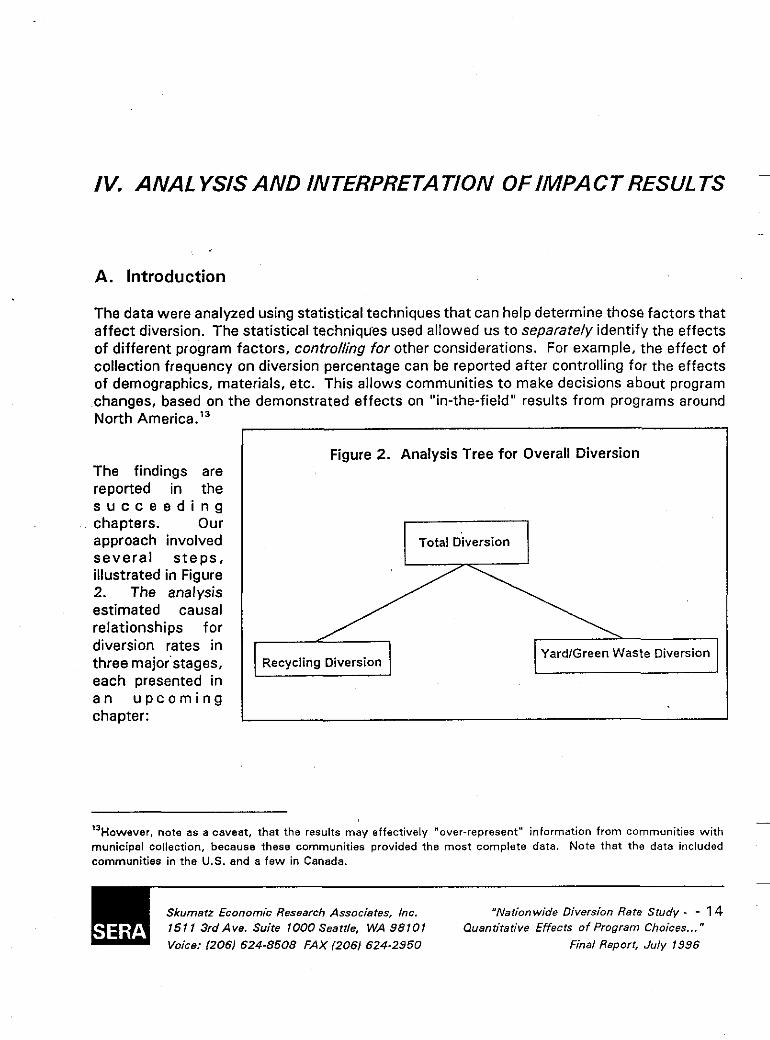
The data were analyzed using statistical techniques that can help determine those factors that affect diversion. The statistical techniques used allowed us to separately identify the effects of different program factors, controlling for other considerations. For example, the effect of collection frequency on diversion percentage can be reported after controlling for the effects of demographics, materials, etc. This allows communities to make decisions about program changes, based on the demonstrated effects on "in-the-field" results from programs around North Amer i~a . '~
The findings are reported in the s u c c e e d i n g chapters. Our approach involved severa l s teps, illustrated in Figure 2. The analysis estimated causal relationships for diversion rates in three major'stages, each presented in a n u p c o m i n g chapter:
Figure 2. Analysis Tree for Overall Diversion
Total Diversion
YardlGreen Waste Diversion Recycling Diversion
"However. note as a caveat, that the results may effectively "over-represent" information from communities with municipal collection, because these communities provided the most complete data. Note that the data included communities in the U S . and a few in Canada.
Skumatz Economic Research Associates, lnc. 15 1 1 3rd Ave. Suite 1000 Seattle, WA 98 10 1 Voice: 12061 624-8508 FAX (2061 624-2950
"Nation wide Diversion Rate Study - - 14 Quantitative Effects of Program Choices ... "
Final Report, July 1996
m overall diversion (yard waste and recycling) as a percent of solid waste tonnage diverted (through recycling and yard waste programs) and disposed.
diversion percent from curbside and dropoff recycling programs.
diversion percent from yard waste programs.
Note that in each case, we used diversion percentages that we calculated, based on reported data on community-provided information on recycling, yard waste, and disposal tonnage (the relevant diversion tonnage divided by the sum of reported diversion and disposal). The data we attempted to explain was the diversion rate from recycling and yard programs.
Source reduction information is excluded from the analysis because, unfortunately, virtually no information on this was available. We also tested the model's ability to explain differences in diversion in terms of pounds per household, or in pounds per capita, but the results were not as strong or stable. Missing data can present a significant problem. In some cases, a factor might be important, but information might be unavailable too often to provide a strong statistical relationship. Fortunately, between persistence in callbacks and our sample size, the data were sufficient to allow statistical work that explained a significant fraction of the variation in diversion.
B. Interpreting the Results
The analysis provided excellent results explaining differences between diversion rates between communities. Most importantly, it was able to link specific program features and demographics to differences in recycling and diversion between communities.
The statistical techniques we used allowed us to identify the effects of individual program factors, excluding the influence of other differences and considerations. For example, the effect of collection frequency on diversion can be reported after controlling for the effects of demographics, materials, etc. Program changes can be then be assessed based on the demonstrated effects on "in the field" performance from programs around the country. Program planners can augment their knowledge of their waste streams and local factors with this quantitative performance information in making their programmatic decisions.
Skumati Economic Research Associates, lnc.
Voice: (2061 624-8508 FAX 1206) 624-2950
"Nationwide Diversion Rate Study - - 15 Quantitative Effects of Program Choices ... "
Final Report, July 1996

Note that the results represent "marginal" changes only. That is, each impact number provides the impact from changing that feature. The estimates become less reliable as you look a t multiple changes or elaborate combinations of changes. For that, we would construct "packages" and derive tailored estimates t o analyze these issues.
Using specific estimates for the community type, we can estimate the impact of a variety of changes in a community's programs. These results help communities refine programs by providing transferable, quantitative information about the most effective program features based on real-world experience in similar communities. The information boils down lessons from the array of diversion programs in place, and helps sort out the quantitative impacts attributable t o each program alternative separate from the effects of demographics and other confounding factors. Applying these results should lead t o more effective programs, greater recycling and diversion for a given budget, and improved chances of meeting communities' diversion goals.
Skumatz Economic Research Associates, lnc. 151 1 3rdAve. Suite 1000 Seattle, WA 98101 Voice: 1206J 624-8508 FAX 12061 624-2950
"Nationwide Diversion Rate Study - - 1 6 Quantitative Effects of Program Choices ... "
Final Report, July 1996

V. DISAGGREGATING 0 VERALL COMMUNITY DIVERSION RA TES
A. Introduction and Results
The first step was the analysis of overall community diversion rates (combined recycling and yard waste). The most statistically significant features explaining overall community diversion rates (recycling and yard/green waste) are shown in Table 4. Quantitative estimates associated with the key program decision factors related to options for total diversion are presented in Figure 3 below. The results show that both demographic and programmatic factors are important to a community’s total diversion rate. Key factors include:
smaller communities: Diversion percentages in small communities (under 10,000) were significantly higher than those in larger communities with similarly-designed program offerings. This may relate t o i s s u e s o f c o m m u n i t y cohesiveness, outreach issues, mix o f housing types,14 was te composition issues, or other differences.
median income: Median income was an important explanatory variable related to diversion and program performance. Higher income communities saw higher diversion levels. This confirms the results from several previous studies.
variable rates: The presence of a variable rates programs was an extremely strong contributor to increases in diversion percentages from yard waste and recycling programs. Variable rates contributed, on average, 8-1 1 percentage points of diversion.
36 (although an indicator of multi-family percentage was not significant)
Skumatz Economic Research Associates, lnc.
Voice: 12061 624-8508 FAX (2061 624-2950
“Nationwide Diversion Rate Study - - 1 7 Quantitative Effects of Program Choices ... ”
Final Report, July 7996
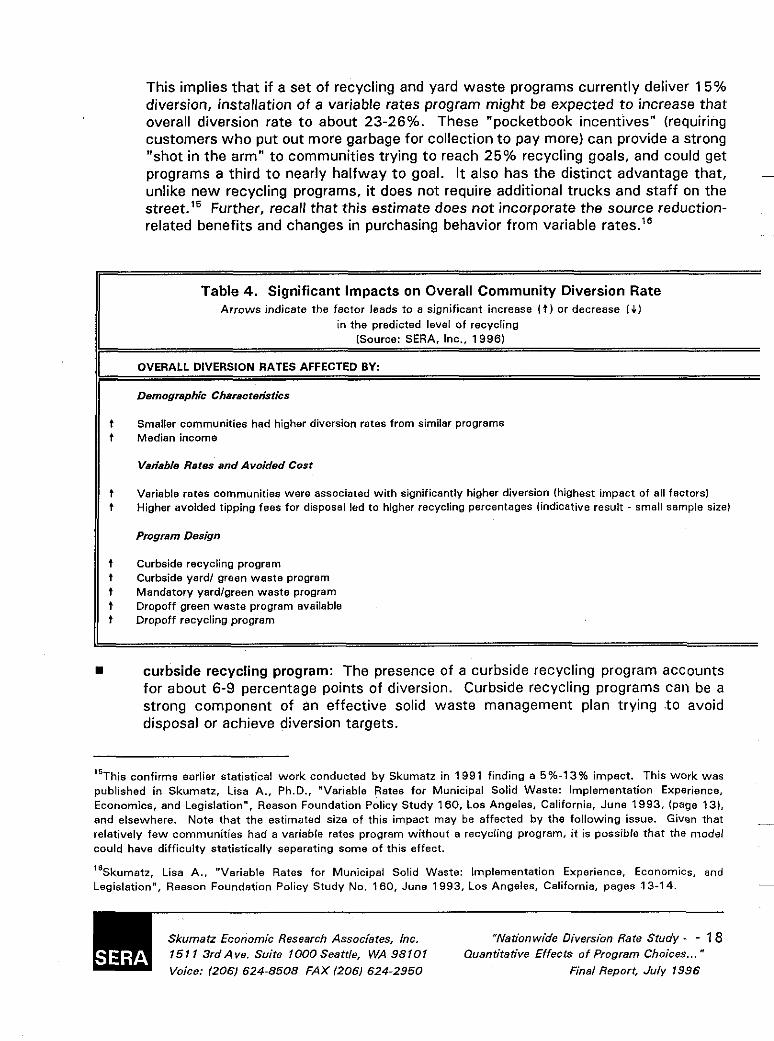
This implies that if a set of recycling and yard waste programs currently deliver 15% diversion, installation of a variable rates program might be expected to increase that overall diversion rate to about 23-26%. These "pocketbook incentives'' (requiring customers who put out more garbage for collection to pay more) can provide a strong "shot in the arm" to communities trying to reach 25% recycling goals, and could get programs a third to nearly halfway to goal. It also has the distinct advantage that, unlike new recycling programs, it does not require additional trucks and staff on the street.15 Further, recall that this estimate does not incorporate the source reduction- related benefits and changes in purchasing behavior from variable rates."
~
~
Table 4. Significant Impacts on Overall Community Diversion Rate Arrows indicate the factor leads to a significant increase It1 or decrease ( & I
in the predicted level of recycling (Source: SERA, Inc., 1996)
OVERALL DIVERSION RATES AFFECTED BY:
Demographic Characteristics
Smaller communities had higher diversion rates from similar programs Median Income
Variable Rates and Avoided Cost
Variable rates communities were associated with significantly higher diversion (highest impact of all factors) Higher avoided tipping fees for disposal led to higher recycling percentages (indicative result - small sample size)
Program Design
Curbside recycling program Curbside yard1 green waste program Mandatory yardlgreen waste program Dropoff green waste program available Dropoff recycling program
curbside recycling program: The presence of a curbside recycling program accounts for about 6-9 percentage points of diversion. Curbside recycling programs can be a strong component of an effective solid waste management plan trying t o avoid disposal or achieve diversion targets.
This confirms earlier statistical work conducted by Skumatz in 1991 finding a 5%-13% impact. This work was published in Skumatz, Lisa A,, Ph.D., "Variable Rates for Municipal Solid Waste: Implementation Experience, Economics, and Legislation", Reason Foundation Policy Study 160, Los Angeles, California, June 1993, (page 13). and elsewhere. Note that the estimated size of this impact may be affected by the following issue. Given that relatively few communities had a variabie rates program without a recycling program, if is possible that the model could have difficulty statistically separating some of this effect.
15
Skumatz, Lisa A,, "Variable Rates for Municipal Solid Waste: Implementation Experience, Economics, and 16
Legislation", Reason Foundation Policy Study No. 1 BO, June 1993, Los Angeles, California, pages 13-14.
Skumatz Economic Research Associates, Inc. 151 1 3rdAve. Suite lOOOSeattIe, WA 96101 Voice: (206) 624-6508 FAX f2061 624-2950
"Nationwide Diversion Rate Study. - 18 Quantitative Effects of Program Choices ... "
Final Report, July 1996
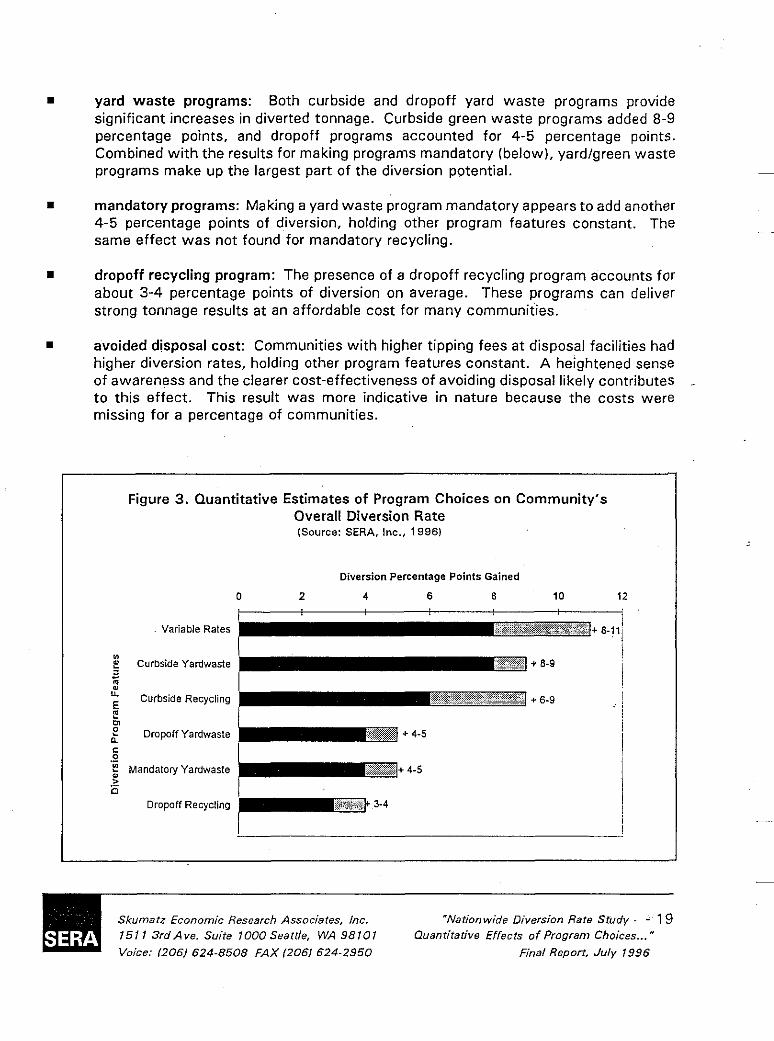
yard waste programs: Both curbside and dropoff yard waste programs provide significant increases in diverted tonnage. Curbside green waste programs added 8-9 percentage points, and dropoff programs accounted for 4-5 percentage points. Combined with the results for making programs mandatory (below), yard/green waste programs make up the largest part of the diversion potential.
mandatory programs: Making a yard waste program mandatory appears t o add another 4-5 percentage points of diversion, holding other program features constant. The same effect was not found for mandatory recycling.
dropoff recycling program: The presence of a dropoff recycling program accounts for about 3-4 percentage points of diversion on average. These programs can deliver strong tonnage results a t an affordable cost for many communities.
avoided disposal cost: Communities with higher tipping fees at disposal facilities had higher diversion rates, holding other program features constant. A heightened sense of awareness and the clearer cost-effectiveness of avoiding disposal likely contributes to this effect. This result was more indicative in nature because the costs were missing for a percentage of communities.
Figure 3. Quantitative Estimates of Program Choices on Community's Overall Diversion Rate (Source: SERA, Inc., 19961
Diversion Percentage Points Gained
0 2 4 6 8 10 12
Variable Rates + 8-1
Lo
3 m
i? Curbside Yardwaste
I;: Curbside Recycling
2 OropofiYardwaste n
E MandalorJ Yardwaste
n Oropoff Recycling
- m
c D .- > .-
Skumatz Economic Research Associates, lnc. 151 13rdAve. Suite 1000 Seattle, WA 98101 Voice: 12061 624-8508 FAX 12061 624-2950
"Nafionwide Diversion Rare Study - - 19 Quantitative Effects of Program Choices ... "
Final Report, July 1996

VI. KEY FACTORS RELATED TO RECYCLING EFFECTIVENESS
A. Introduction
In order t o derive results that could better guide decisionmaking, we conducted the analysis of recycling diversion in three parts, illustrated in Figure 4. The results explaining recycling rates, or the impacts of recycling program feature choices, are presented separately for:
m
This approach reduced data interactions and confusion; it also provides more program-specific
communities with curbside recycling programs only, communities with dropoff recycling programs only, and communities with joint programs (both curbside and dropoff programs).
guidance.
The results provide some indicative answers to some "burning" issues in program design. The decision about how to design the program to 'best take advantage of t h e s e f a c t o r s depends on local costs and local condi t ions and tradeoffs (e.g., avoided costs, " f i t " with operations, p o l i t i c a l a n d c u s t o m e r acceptability, etc.). That is, although a
Figure 4. Analysis Tree for Recycling Programs
Diversion (Recycling Rate)
Joint Curbside & Dropoff Program
Dropoff Program Only
Skumatz Economic Research Associates, lnc. 15 7 1 3rd A ve. Suite 7000 Searrle, WA 98 IO 1 Voice: 12061 624-8508 FAX 12061 624-2950
"Narionwide Diversion Rare Study. - 20 Quantitative Effects of Program Choices ... "
Final Report, July 1996
particular feature might deliver more diversion, that may not be the best program design for your community because it may cost too much to balance the savings, may not work well with the existing or planned collection system, or other issues. Local considerations are crucial to making an appropriate decision. This section provides estimates of the diversion rate impact of an array of possible recycling program choices, and facilitates thislocalprogram decisionmaking by communities.
A s mentioned before, note that the results represent "marginal" changes only. That is, each impact number provides the impact from changing that feature. The estimates become less reliable as you look a t multiple changes or elaborate combinations of changes. For that, tailored estimates of program feature "packages" would be more appropriate.
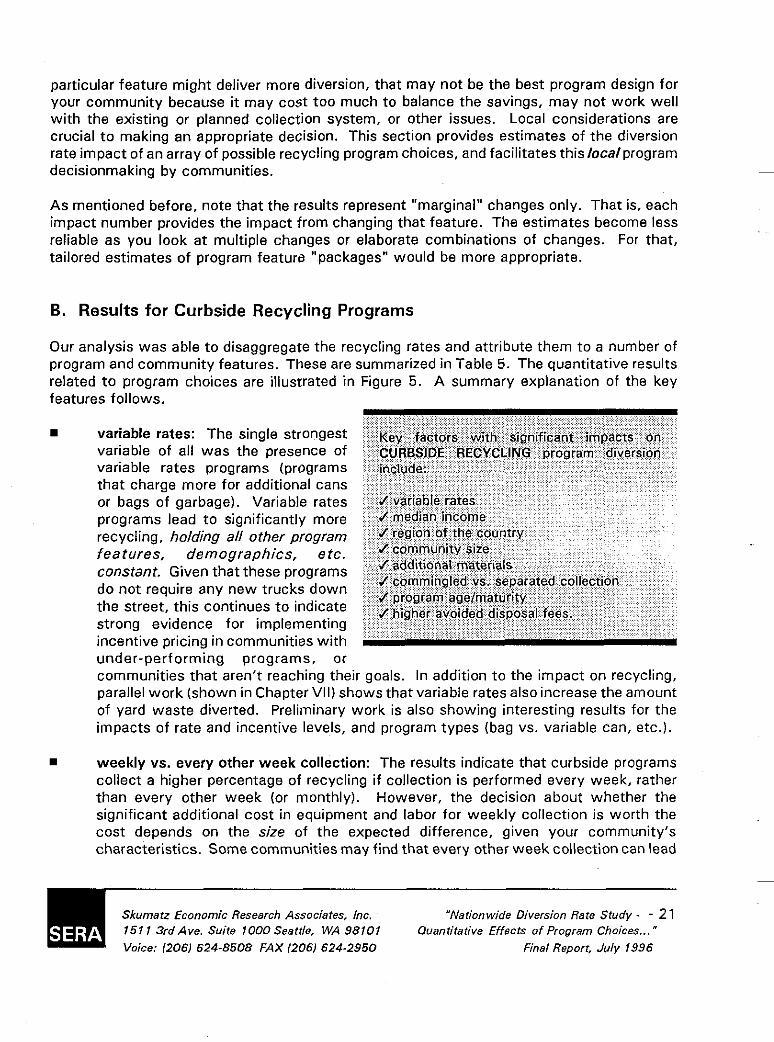
B. Results for Curbside Recycling Programs
Our analysis was able to disaggregate the recycling rates and attribute them to a number of program and community features. These are summarized in Table 5. The quantitative results related to program choices are illustrated in Figure 5. A summary explanation of the key features follows.
variable rates: The single strongest variable of all was the presence of variable rates programs (programs that charge more for additional cans or bags of garbage). Variable rates programs lead to significantly more recycling, holding all other program features, demographics, e tc. constant. Given that these programs do not require any new trucks down the street, this continues to indicate strong evidence for implementing incentive pricing in communities with under-performing programs, or communities that aren't reaching their goals. In addition to the impact on recycling, parallel work (shown in Chapter VII) shows that variable rates also increase the amount of yard waste diverted. Preliminary work is also showing interesting results for the impacts of rate and incentive levels, and program types (bag vs. variable can, etc.).
weekly vs. every other week collection: The results indicate that curbside programs collect a higher percentage of recycling if collection is performed every week, rather than every other week (or monthly). However, the decision about whether the significant additional cost in equipment and labor for weekly collection is worth the cost depends on the size of the expected difference, given your community's characteristics. Some communities may find that every other week collection can lead
Skumatz Economic Research Associates, lnc. 151 1 3rdAve. Suite 1OOOSeattIe. WA 98101 Voice: 12061 624-8508 FAX 12061 624-2950
"Nationwide Diversion Rate Study - - 21 Quantitative Effects of Program Choices ... "
Final Report, July 1996

t
Table 5. Significant Impacts from Recycling Program Features Arrows indicate the factor leads to a significant increese ( t I or decrease ( 1
in the predicted level of recycling (Source: SERA, Inc., 19961
~
CURBSIDE RECYCLING PROGRAMS
Demographic Characteristics
Community smaller than 10,000 population (*I Median income Region (higher for Mid-Atlantic and Great Lakes states)
Vatiabla Rates and Avoided Cost
Variable rates communities had significantly higher recycling lhighsst impact of all factors)(') Higher avoided tipping fees for disposal led to higher recycling percentages (indicative result)
~
~
Pmgram Design
Older program ( 6 years or morel Adding mixed waste paper ('I Commingled collection (slight advantageover separated by household, holding other factors constant) 1.1 More frequent collection (weekly collection has higher diversion than every other week or monthly collection)
Indicative Results (lower confidence level or more volatile in sbe of effect)
Containers: some indication that stackables or bags may be associated with lower diversion than bins or toters Charging a subscription or bag fee for recycling may lead to lower recycling percent No significant differences could be detected for population density, percent of adults speaking English, bottle biii legislation, or making programs mandatory.
DROPOFF RECYCLING PROGRAMS
Demographic Chanctaristlcs
Towns with smallar populations had higher recycling Ieveis ( * I Rural areas achieved lower diversion percentages Region: programs in the southeast had lower diversion
Variable Rates and Avoided Cost
Communities with variable rates programs had higher dropoff recycling ( * I
Indicative Results (lower confidence level or more volatile in size of effect)
Communities with dropoff garbage service only (no collection service) seem to be associated with higher dropoff recycling diversion
t 1 L
I
COMBINED DROPOFF AND CURBSIDE PROGRAMS "0: Effects that ware significant for the estimations with combined dropoff and curbside programs are indicated above with an asterisk(')
Skumatz Economic Research Associates, Inc. 151 1 3rdAve. Suite lOOOSeattle, WA 98101 Voice: t2061 624-8508 FAX 1206) 624-2950
"Nationwide Diversion Rate Study - - 22 Quantitative Effects of Program Choices ...
Final Report, July 1996

to a more cost-effective program (at little cost in tonnage), and/or may free up budget resources to allow purchase of containers, or upgrade processing capabilities, etc. An example of the tradeoffs for this issue is provided in Chapter VIII.
adding materials: Field experience in these communities demonstrates a significant addition to.recycling percentages when mixed paper is added to programs. In fact, our survey found that the most common changes in programs over the last three years were the addition of mixed paper and plastics. Financial tradeoffs include considering the revenue from the markets, the availability and capabilities of processing facilities, and the capabilities of containers or collection trucks to handle additional materials."
m
Figure 5. Quantitative Estimates of Program Choices on Recycling Diversion (Source: SERA, Inc., 19961
Diversion Percentage Points Gained
0 2 4 6 8 10 12 ~
CURBSIDE PROGRAMS Variable Rates
Weekly Collection +24
Mixed Paper + 2 4
E Not Separated a? m e DROPOFF ONLY P
0
(Y
Variable Rates
Variable Rates
Weekly Collection
Mixed Paper
Not Separated
- E JOINT CIS 6 DIO
commingled vs. separated collection: Holding other characteristics constant (income, other program features, etc.), the results showed slightly higher recycling rates for programs that allowed customers t o put out recycling in a combined fashion. ,This may be due to larger containers, simpler procedures, or other factors. However, the decision about which type of program to implement depends on the balance between higher diversion and differences in processing and collection costs, revenues, and other community-specific data. Note that this difference was significant even after
Statistical disaggregation of the diversion based on the data provided by communities indicated the foliowine approximate percentages associated with materials: news 7.8%; glass 5.9% (clear 5%. brown 3%. green I %); aluminum 5%; mixed waste paper 4.5%; steel cans 0.2%; and plastics < 1 %. The data were based on communities with only curbside programs, and are based on tonnage or weight, which lowers the plastics numbers (the percentages represent diverted percent of the total disposed and diverted waste stream).
I 7
Skumatz Economic Research Associates, lnc. 151 13rdAve. Suite 1000 Seattle, WA 98101 Voice: 1206) 624-8508 FAX 12061 524-2950
"Nationwide Diversion Rate Study - - 23 Quantitative Effects of Program Choices ... "
Final Report, July 1996
controlling for the collection of mixed waste paper (as well as demographic and other factors).
regions: Even after controlling for other program features (collection frequency, variable rates, and other features), significantly higher recycling rates were found in the Middle Atlantic and Great Lakes regions. This may reflect differences in waste composition, avoided disposal fees, attitudes, or other factors.
Other results: Several other topics were investigated to try to answer common questions regarding program design. The results that follow were indicative in nature.'* These in c I u d e d : ' '
containers: Programs using stackables and bags seemed to lead to lower diversion than programs using bins (but this result will be a target for further investigation). This result may be related t o the greater collection amounts derived from programs collecting mixed waste paper and commingled programs. It may also be related to larger sized containers, and the flexibility that larger containers (and commingled materials) can provide to communities in expanding their programs and materials. By far, the largest majority of communities surveyed used bins. This was followed, in order, by stackables, special bags, and toters.
primary language: No clear relationship was found between percentage of non-English speaking residents and higher or lower recycling rates. In addition, indicators of education did not seem to be significant, but are closely correlated with income (which was significant).
mandatory programs and deposit legislation: After controlling for other program features, materials, and demographics, we did not detect a significant addition to recycling diversion from making programs mandatory, or for states with bottle bills.
program fees: There is some indicative evidence that charging a subscription fee for participants or charging by the bag for recycling may lead to lower recycled percentages. However, this last result will be investigated further to better sort out the impacts of non-optional fees (line items on tax bills, etc.). The decision about whether a program fee makes sense may hinge on information that isn't currently available - the incentive that program fees can provide to source reduce in the first place." The revenues from separate program fees, the equity issue (who should pay
m
"because they did not meet strict tests of significance. However, the coefficients wera of a consistent sign, and were generally close on standard significance tests.
Given the extremely promising results, w e are continuing to analyze the data to try to sort out the effects from container sizes and types, the effects of outreach efforts, operational efficiancieslstaffing, and a host of other factors. Additional follow-up work on costs and efficiencies is also underway. The results are being incorporated into a modeling tool to better assist communities and provide easier scenario analysis.
IS
It might be argued, for instance, that "free" convenient yard waste or recycling programs may not encourage the 10
maximum composting or source reduction.
Skumatz Economic Research Associates, Inc. 151 13rdAve. Suite 1000 Seattle, WA 98101 Voice: 12061 624-8508 FAX 12061 624-2950
"Nationwide Diversion Rate Study - - 24 Quantitative Effects of Program Choices ..."
Final Report, July 1996

for programs), and concerns about diversifying the revenue base (and the "death spiral") may be strong issues in some communities. Some communities may feel that these considerations may be worth the "cost" in terms of recycled tonnage (particularly in the longer run).
m program age: More established programs result in higher recycling percentages (programs that are 6-10 years old result in higher recycling). Programs seem to take some time to "ramp up". However, the evidence seems t o indicate that programs older than 10 years may need an additional "shot in the arm" (new materials, outreach, etc.) to maintain the highest levels of effectiveness.
avoided disposal tipping fees: The results showed that communities facing higher disposal tipping fees (higher avoided costs) had significantly higher recycling percentages, holding other program factors and demographics constant. It appears that the feeling of a local crisis may lead to additional capture from local residents, or alternatively, given the avoided costs, the community may be able to provide better outreach or more "cadillac" versions of programs that help divert additional materials.*'
C. Dropoff Recycling Programs
Factors that affected the diversion rate from communities with recycling programs provided via dropoff only are shown in the bottom half of Table 5. Figure 5 shows the quantitative effects from program design features. Important factors related to differences in diversion rates from dropoff programs include:
variable rates: The strongest discret ionary factor af fect ing diversion from dropoff recycling programs was the presence of variable rates programs. We found significantly higher recycling rates f r o m d r o p o f f p rog rams i n communities with variable rates; most of those were traditional var iab le ra tes communi t ies .
The data could indicate the "presence" of a certain program feature, but could not easily indicate program "quality" I1
differences.
Skumatz Economic Research Associates, lnc. 1511 3rdAve. Suite lOOOSeaitIe, WA 98101 Voice: 12061 624-8508 FAX (2061 624-2950
"Nationwide Diversion Rate Siudy - - 25 Quantitative Effects of Program Choices ... "
Final Report, July 1996
However, we also found good results in (the smaller number of) rural settings when the dropoff recycling program was provided in conjunction with dropoff garbage (e.g., at a transfer station). I t seemed that since a trip was already required to drop off garbage (paid by the bag) the inconvenience of separating material is offset by the (clear and immediate) reduced garbage fee. Figure 5 shows the difference in dropoff program performance with and without variable rates.
urbanlrural: Similar dropoff programs in rural areas had lower diversion rates than programs in suburban or urban communities.
population: Smaller communities showed higher recycling diversion rates from similar program features.
income: Communities with higher median incomes showed higher recycling diversion from their dropoff programs.
regions: The southeast region showed lower diversion from dropoff recycling programs than other areas.
~
other variables: There was little deviation in materials collected by .different programs, so we were unable to attribute differences based on materials. The only exceptions were mixed paper and news, neither of which proved to explain significant amounts of differences in diversion. In addition, we examined the relationship between the amount of diversion and the number of dropoff sites per 1,000 population, but could find no significant explanatory power. The vast majority of communities had between 0.2 and 0.8 sites per 1,000 population.
D. Joint Curbside and Dropoff Recycling Programs
The results above show the impacts from changes from each program type. Similar results held when communities with both types of programs were examined (these are denoted by an asterisk in Table 5 and are presented on the bottom of Figure 5.). Note that in most cases, these impacts worked out to be similar to a weighted average of the effects from individual curbside and dropoff programs or were similar in size to the effects from curbside programs. Strong results followed through for:
m variable rates: Significantly higher recycling rates were found in communities with variable rates, holding other program and demographic factors constant. The overall impact was a combined 6-8 percentage points.
separate vs. commingled: Again, programs with separated collection led to lower diversion rates. Recall that these effects are aftercontrolling for the effects of adding mixed paper.
.
Skumat.? Economic Research Associates, Inc.
Voice: (2061 624-8508 FAX (2061 624-2950
“Nationwide Diversion Rate Study - - 26 Quantitative Effects of Program Choices ... “
Final Report, July 1996

adding mixed paper: On average, adding mixed paper to the program added significant percentage points of diversion to the program's impact.
collection frequency: Overall, in combined programs, weekly collection delivers additional diversion points above programs with less frequent collection of recyclables.
demographic factors: Population remained a strong effect, with lower diversion from larger communities (curbside results somewhat dominated dropoff results when programs were combined). Income factors also remained influential. However, regional differences were no longer significant.
E. How Communities Tailor Recycling Programs
While conducting this study, we encountered scores of creative and locally-tailored approaches to recycling used across the country. Although that is not the purpose of this study, we include a few interesting examples.
tying to bulky collection: Several communities with non-mandatory recycling programs suggested tying bulky collection privileges to recycling program participation. This can provide a strong incentive for customers to use (some also suggested pay for) the recycling program.
working with local industry: In one community, the local small electronics firm requested the community to accept small electronics a t the drop off center, which the firm then reconditions or salvages. Another community is working with the local pizza delivery parlors to use a disposable liner in boxes to reduce contamination and allow collection in the program.
coordinationlprivatization: A couple of communities are working in conjunction with the Salvation Army, designating alternate collections, or one collection a month as joint set outs. Residents are given a special bag to designate donations, which are set out the same day as trash or recycling collection. The Salvation Army truck collects the designated materials. This approach is much more convenient for customers and can increase reuse. Customers do not need to set up special appointments 'with the charity, and customers know there is regular collection available for these materials. Successful programs do not need to replace private efforts. Many communities that do not have city sponsored programs maintain a list of recycling opportunities available to residents. Some programs (especially dropoff programs) specifically exclude certain materials from their programs because a community group collects that item as a fund raiser (e.g., newspaper, aluminum cans).
Skumatz Economic Research Associates, lnc. 151 1 3rdAve. Suite lOOOSeattle, WA 98101 Voice: I2061 624-8508 FAX (206J 624-2950
"Nationwide Diversion Rate Study - . - 27 Quantitative Effects of ProQram Choices ... "
Final Report, July 1996
sharing facilities: Several communities also "share" facilities between recycling and household hazardous waste dropoff. Residents can drop recyclables off, but can also look there for small quantities of paint. Some communities also do the same for useable household items like books, furniture, etc.
~~
focus on children: Many communities concentrate education on children. We repeatedly heard them described as "sponges" who are "excited to learn". For high school students, training the environmental club to teach the message was believed t o worked best, because at that age, peer education seems to have the biggest impact.
separated vs. commingled: There were examples and devotees of both approaches. One city noted that its recycling program was started as a source separated program,
contract was renewed. They maintained it was easier to change the contract than to change the residents!
materials collected: beyond the standard materials, our surveys found communities collecting brown bags, books, milk/juice boxes, textiles, food scraps (composted or used as hog feed), paintlaerosol cans, and kitchen grease.
-
but "... from day one ..." they were getting commingled, so they changed when the ~
~
H
~
Skumatz Economic Research Associates, lnc. 1511 3rdAve. Suite lOOOSeatiIe, W A 9 8 1 0 1 Voice: 12061 624-8508 FAX 12061 624-2950
"Nationwide Diversion Rate Study - - 28 Quantitative Effects of Program Choices ... "
Final Report, July 1996
VII. YARD/GREEN WASTE PROGRAM DIVERSION FACTORS
A. Introduction
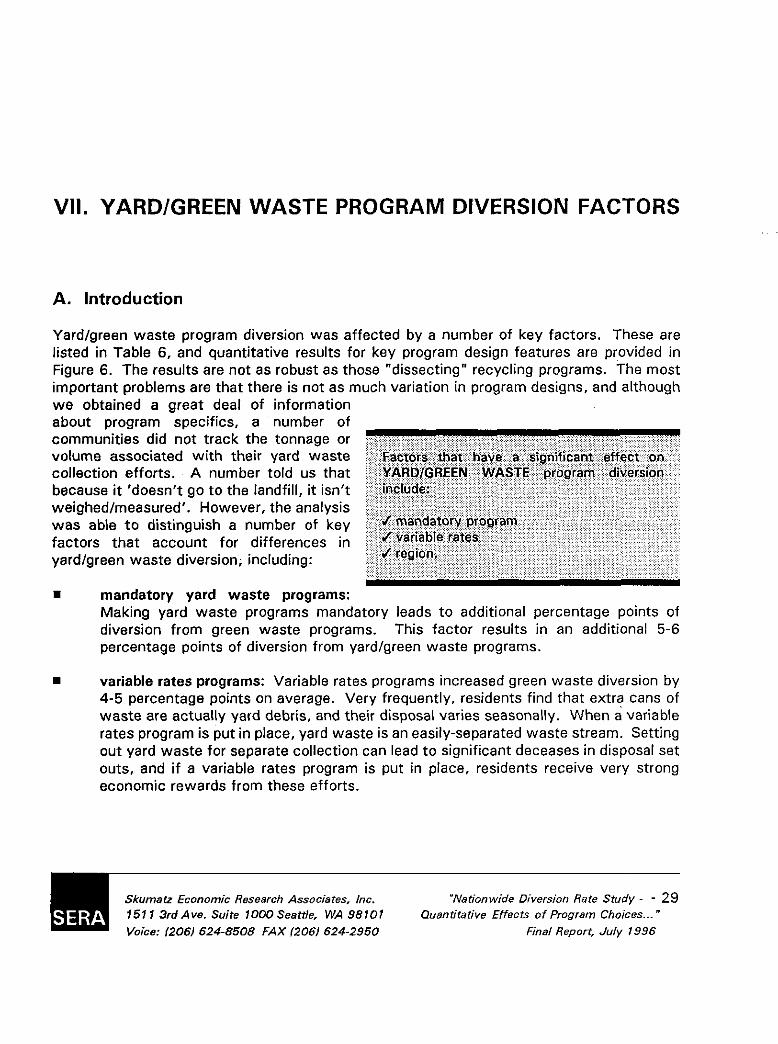
Yard/green waste program diversion was affected by a number of key factors. These are listed in Table 6 , and quantitative results for key program design features are provided in Figure 6 . The results are not as robust as those "dissecting" recycling programs. The most important problems are that there is not as much variation in program designs, and although we obtained a areat deal of information .. about program specifics, a number of communities did not track the tonnage or volume associated with their yard waste collection efforts. A number told us that because it 'doesn't go to the landfill, it isn't weighed/measured'. However, the analysis was able t o distinguish a number of key factors that account for differences in yard/green waste diversion, including:
Factors that have a significant effect on YARDIGREEN WASTE program diversion include:
J mandatory program J variable rates J region.
m mandatory yard waste programs: Making yard waste programs mandatory leads to additional percentage points of diversion from green waste programs. This factor results in an additional 5-6 percentage points of diversion from yard/green waste programs.
variable rates programs: Variable rates programs increased green waste diversion by 4-5 percentage points on average. Very frequently, residents find that extra cans of waste are actually yard debris, and their disposal varies seasonally. When a variable rates program is put in place, yard waste is an easily-separated waste stream. Setting out yard waste for separate collection can lead to significant deceases in disposal set outs, and if a variable rates program is put in place, residents receive very strong economic rewards from these efforts.
Skumatr Economic Research Associates, lnc. 15 1 1 3rd A ve. Suite 1000 Seattle, WA 98 10 1 Voice: (2061 624-8508 FAX (2061 624-2950
"Nationwide Diversion Rate Study - - 29 Quantilative Effects of Program Choices ... "
Final Report, July 1996
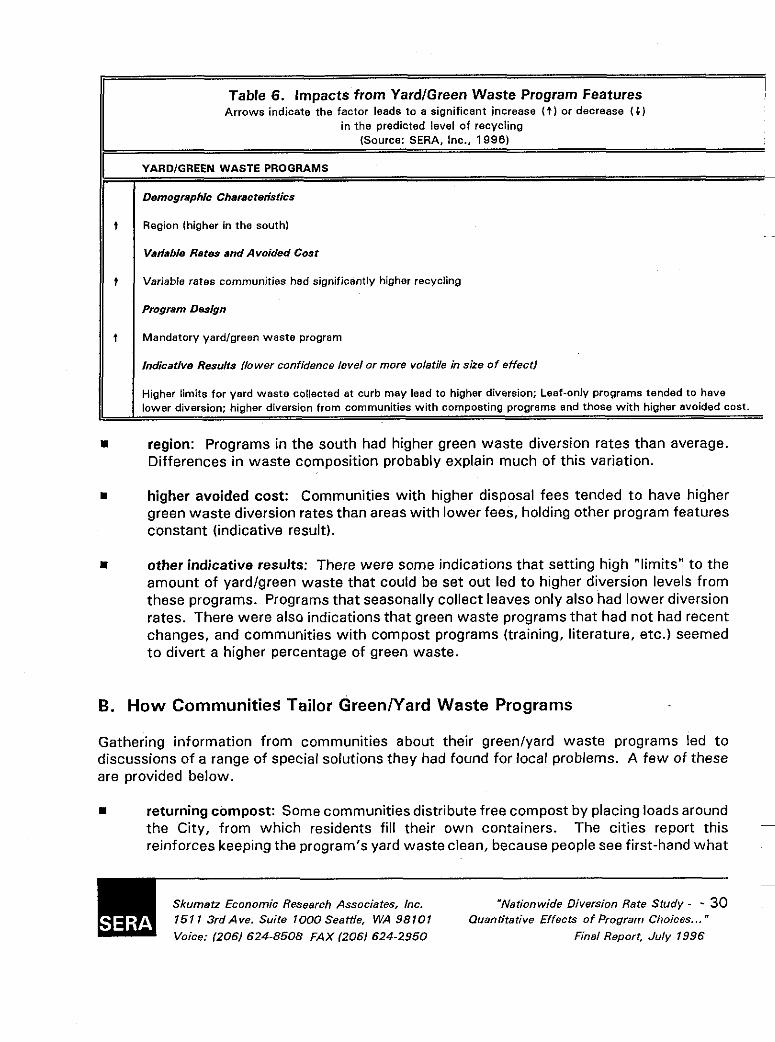
Table 6. Impacts from YardlGreen Waste Program Features Arrows indicate the factor leads to a significant increase (t) or decrease ( A )
in the Dredicted level of recvclino
t
, - (Source: SERA, Inc.. 1996)
Variable Rams and Avoided Cost
Variable rates communities had significantly higher recycling
YARDIGREEN WASTE PROGRAMS
Demographic Characteristics
t
Region (higher in the south) I I t I
Mandatory yardlgrean waste program
Indicative Results ilower confidence level or more volatile in sue o f effect1
Higher limits for yard waste collected at curb may lead to higher diversion; Leaf-only programs tended to have lower diversion; higher diversion from communities with composting programs end those with higher avoided cost.
Program D&gn II I
B. How CommunitieS Tailor GreenlYard Waste Programs
Gathering information from communities about their greenlyard waste programs led to discussions of a range of special solutions they had found far local problems. A few of these are provided below.
returning compost: Some communities distribute free compost by placing loads around the City, from which residents fill their own containers. The cities report this reinforces keeping the program's yard waste clean, because people see first-hand what
Skumati Economic Research Associates, Inc. 1511 3rdAve. Suite lOOOSeattle, WA 98101 Voice: 12061 624-8508 FAX (2061 624-2950
"Nationwide Diversion Rate Study - - 30 Quantitative Effects o f Program Choices ... "
Final Report, July 1996
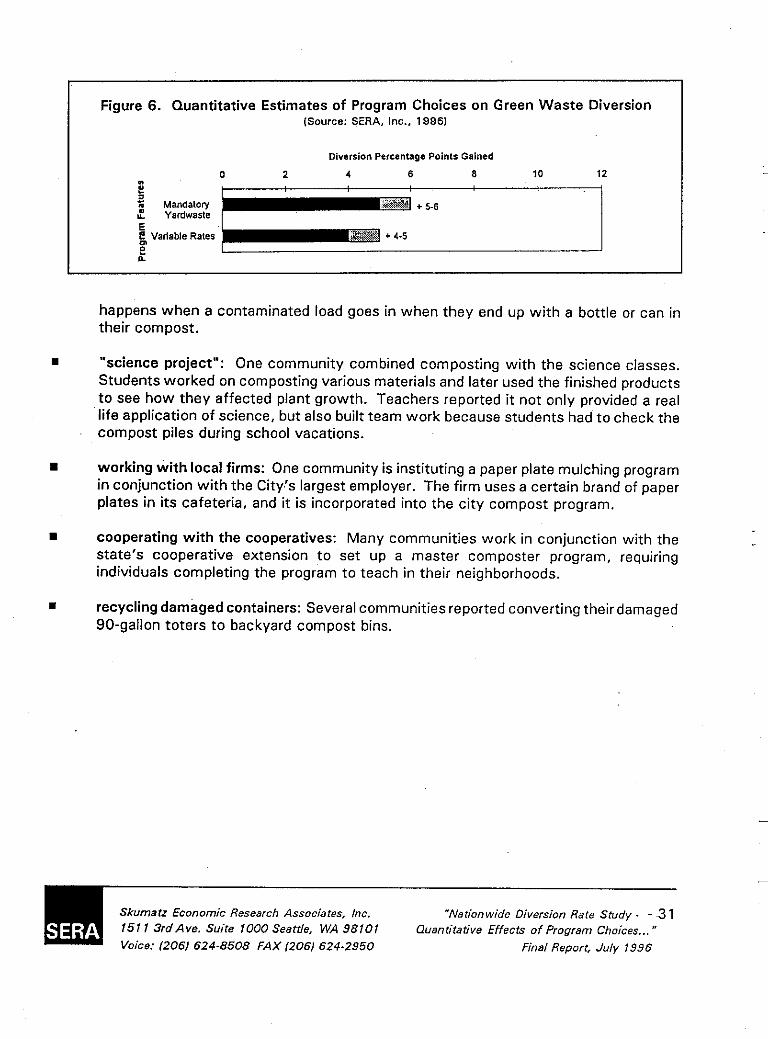
Figure 6. Quantitative Estimates of Program Choices on Green Waste Diversion (Source: SERA, Inc., 19961
Diversion Percentage Points Gained
0 2 4 6 8 10 12
E g, Variable Rates D n
happens when a contaminated load goes in when they end up with a bottle or can in their compost.
"science project": One community combined composting with the science classes. Students worked on composting various materials and later used the finished products to see how they affected plant growth. Teachers reported it not only provided a real life application of science, but also built team work because students had to check the compost piles during school vacations.
working with local firms: One community is instituting a paper plate mulching program in conjunction with the City's largest employer. The firm uses a certain brand of paper plates in its cafeteria, and it is incorporated into the city compost program.
cooperating with the cooperatives: Many communities work in conjunction with the state's cooperative extension to set up a master composter program, requiring individuals completing the program to teach in their neighborhoods.
recycling damaged containers: Several communities reported converting their damaged SO-gallon toters to backyard compost bins.
w
m
Skuma ti Economic Research Associates, lnc. 151 1 3rdAve. Suite 1000 Seattle, WA 98101 Voice: 12061 624-8508 FAX 12061 624-2950
"Nationwide Diversion Rate Study - - 31 Quantitative Effects of Program Choices ...
Final Report, July 1996
VIII. IMPLICATIONS, CONCLUSIONS, AND NEXT STEPS
A. Implications/ Applying the Results
The results indicate that a number of well-held beliefs are confirmed by the statistical results: higher income areas have higher diversion, weekly collection can add to diversion, variable rates can be a very effective diversion program, and so on. The results in this report support calculating a field-tested "how much extra" with a specific program change and sort out the effects separated from the interactions of other program features.
The data allow communities to assess whether, in particular cases, "more" diversion is worth the additional cost." Whether "more" is better depends on balancing the landfill and collection savings you might get from reducing disposal (and the additional revenues from sales of more materials), with the costs of implementing and operating the changed program. Balancing the economics with other important issues (including acceptability, operational issues, etc.) that can only be determined at the local level, helps the community conduct a proper and considered evaluation about what course to take. These quantitative impacts - estimates which are based on real-world performance by operating programs - are a crucial link in this decisionmaking process.
In order to identify whether a specific program change makes sense for a particular community, a straightforward calculation can be performed:
Step 1: Calculate the addition to program diversion. The new expected diversion in tons is derived by multiplying the diversion percent times total collection.
Additional diversion percentage from this study
new expected diversion lin tons). 1x1 totalcollection and diversion tons for the community eouals
- However, in making these decisions, it is very important to consider not just near-term "out of pocket" costs, but to make sure that the analysis is considering longer term impacts, and that the 'costs" incorporate broader impacts like environmental issues, siting and disposal facility maintenance issues, environmental equity, and other issues.
22
Skumat? Economic Research Associates, lnc. 1511 3rdAve. Suite lOOOSeattIe, WA 98101 Voice: (2061 624-8508 FAX I2061 624-2950
"Natiomvide Diversion Rate Study - - 32 Ouantitative Effects of Program Choices ... "
Final Report, July 1996
Step 2: Examine impact on costs of recycling program to implement and maintain the program change,
New program costs ($I = Cost of materials, labor, outreach, etc. (Subtract materials revenues or add processing costs as needed).
Step 3: New benefits ($I = Multiply the new additional tonnage diverted (Step 1) times the local avoided disposal fee (and other avoided costs).
Step 4: Compare new program costs (step 2) with new program benefits (step 3) to determine whether the program change is cost-effective.
These steps analyze how much a program will cost and how much i t will save in a community. Then, based on the stream of these net benefits or net costs and budget impacts, as wel las the range of other important factors like acceptability, assistance toward meeting diversion goals, operational factors, etc., the decisionmaker can determine whether a program change is beneficial.
B. Examples and Sample Calculations
Summaries of two simplified (hypothetical) examples are provided in Table 7 to illustrate the use of the types of results available from the study. We have selected one option that leads to more recycling (adding mixed paper to the curbside collection program) and one that leads to less recycling (changing recycling collection from weekly to every other week). The results are sensitive to several key items: recycling revenues, avoided disposal fees, and program cost changes. Some scenarios are provided at the bottom of the table, varying these assumptions.
*
1 ) Littlecity, USA (population 30,000) examines the cost-effectiveness of adding mixed paper to the curbside recycling program. The results of our study show that this city might realize an additional 3 percentage points of recycling. Data from the city includes the operational and capital costs of the program change (for example, $4OK/year), the per ton materials revenues (assume $1 Okon), disposal costs (assume, for consistency, $35/ton), and annual disposed plus diverted tonnage (20,000 tons/yr).
The basic results show that i t would cost the city $1 3,000 annually by implementing this change under these assumptions. Obviously, if recycling revenues were higher, or disposal costs were higher, or the program were cheaper to implement or operate, the program could save money (or vice versa). Given the range of assumptions shown in Table 7, the program might cost $1 9,000 or save up to $32,000 depending on local conditions.
Skumatz Economic Research Associates, lnc.
Voice: I2061 624-8508 FAX (2061 624-2950
"Nationwide Diversion Rate Study - - 33 Quantitative Effects of Program Choices ... "
Final Report, July 1996

2) Midcity, USA (population 100,000) examines the cost-effectiveness of reducing the frequency of collection for their curbside recycling program from once weekly to once every other week. Here, our estimate of the city's reduction in recycling would be 3%. The city's estimates of program changes are a savings of $100K annually from reduced labor and equipment; annual tonnage is 50,000, and again, we assume disposal costs and recycling revenues of $35/ton and $1 O/ton, respectively.
The results show that Midcity would save $32,500 annually by making this change, given the assumptions. If recycling revenues were higher, or disposal costs lower, or operational savings were lower than anticipated the program would become more costly for the city, and it might lose money. The range of alternate assumptions show the program could potentially save up to $47,000 or cost an additional $80,000, depending on the assumptions best matching local conditions.
These examples and the results of alternative assumptions .are presented in Table 7.
C. SUMMARY AND CONCLUSIONS
Over the last several years, it has become increasingly frustrating for program managers to try to achieve recycling goals under tougher "real world" conditions, including volatile revenues and tightening municipal budgets. Decisions have been hampered because case studies' represent the bulk of information available, and this type of information is of only limited use in trying to draw guidance for programs in other communities. In response, we designed an approach to use the diversity of programs and data from the thousands of existing programs to provide useful lessons for program managers on improving the efficiency, impacts, and cost-effectiveness of their recycling program^.'^
23Thanks to interest of a diversity of sponsors, we were able to raise the majority of costs to conduct this project. We are also extremelx grateful to the hundreds of community representatives who patiently (most of the time) endured our phone questionnaire, allowing us t o gather the data to support this work.
Skumatz Economic Research Associates, lnc. 1511 3rdAve. Suite IOOOSeattIe. WA 98101 Voice: I2061 624-8508 FAX (2061 624-2950
"Nationwide Diversion Rate Study - - 34 Quantitative Effects of Program Choices ... "
Final Report, July 1996
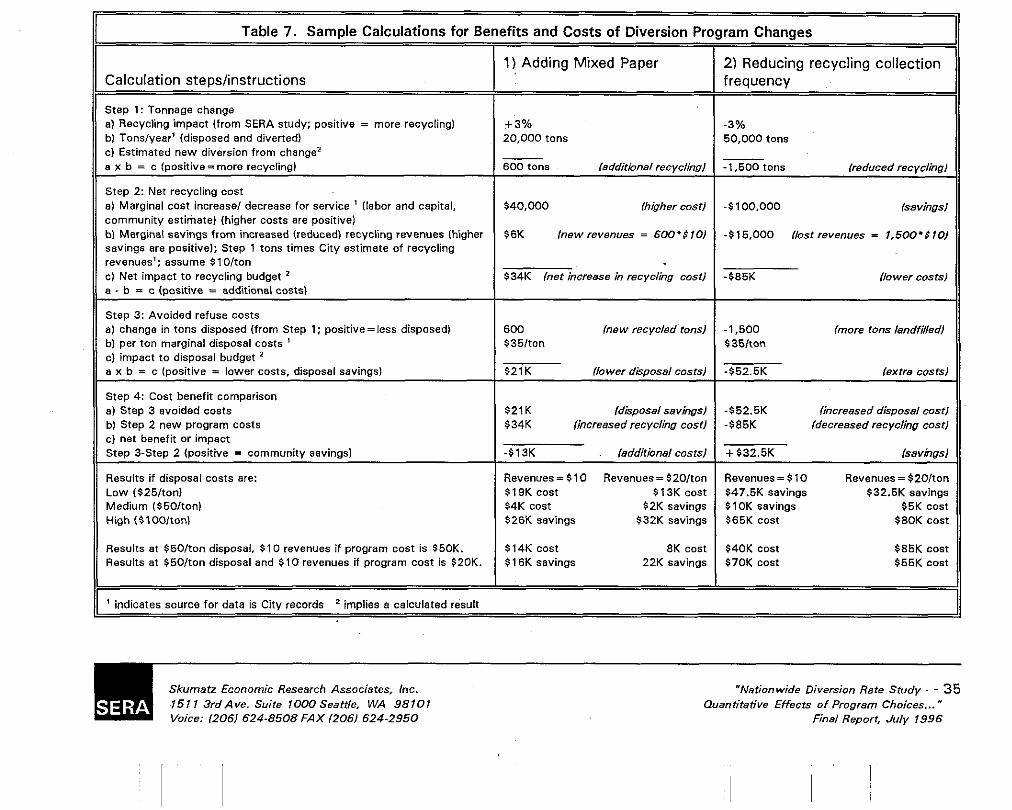
Table 7. SamDle Calculations for Benefits and Costs of Diversion Prc
Calculation steps/instructions
Step 1: Tonnage change a1 Recycling impact (from SERA study; positive = more recycling) bl Tonslyear' (disposed and diverted) c) Estimated new diversion from change' a x b = c lpositive=more recycling)
Step 2: Net recycling cost a) Marginal cost increase/ decrease for service ' (labor and capital, community estimate) (higher costs are positive) b) Marginal savings from increased (reduced) recycling revenues (higher savings are positive); Step 1 tons times City estimate of recycling revenues': essume SlOIton c] Net impact to recycling budget a - b = c loositive = additional costsl
Step 3: Avoided refuse costs a] change in tons disposed (from Step 1: positive=less disposed) b) per ton marginal disposal costs ' c] impact to disposal budget a x b = c (positive = lower costs, disposal savings)
Step 4: Cost benefit comparison a) Step 3 avoided costs bl Step 2 new program costs c l net benefit or impact Step 3-Step 2 (positive = community savings1
Results if disposal costs are: Low (5251ton) Medium 1$50/tonl High ($100ltonl
Results at $50lton disposal, $10 revenues if program cost is 550K. Results at $50/ton disposal and $10 revenues if program cost is $20K.
~ ~ ~ ~ ~~ ~~ ~
' indicates source for data is Citv records imolies a calculated result
1) Adding Mixed Paper
f 3 % 20,000 tons
- 600 tons (additional recycling/
$40,000 (higher costl
$6K hew revenues = 600'$f01
$34K (net increase in recycling costl
600 (new recycled tons1 $35/ton
$21K (lower disposal costsl
$21K (disposal savingsl $34K (increased recycling costl
-$13K (additional costs1
Revenues = $10 Revenues= $20/ton 5 13K cost $ 19K cost
$4K cost $2K savings S26K savings $32K savings
S14K cost 8K cost $1 6K savings 22K savings
lram Changes
2) Reducing recycling collection frequency
-3% 50,000 tons
-1,500 tons (reduced recvclinal -
-$100,000 lsavingsl
-$15,000 (lostrevenues = 1,50O'$fO1
-$85K (lower costsl
-1,500 (more tons landfilled1 $35/ton
-$52.5K iextrs costs)
-$52.5K (increased disposal cost/ -$85K (decreased recycling costl
+$32.5K Isavingsl
Revenues = $10 Revenues = $20lton $47.5K savings 532.5K savings $ 1 OK savings $5K cost $65K cost $80K cost
$40K cost $70K cost
$85K cost $55K cost
Skumatz Economic Research Associates, fnc.
Voice: (2061 624-8508 FAX (2061 624-2950
"Nationwide Diversion Rate Study - - 35 Quantitative Effects of Program Choices ... "
Final Report, July 1996

The results demonstrate the effectiveness of this analytical approach, and show that implementable lessons can be learned from all this "data" out there.z4 Even though this is a first effort at applying this analytical approach to solid waste programmatic questions, the types of statistical results generated through this study are defensible, generalizable, and transferable. The work allows us to model and provide specific quantitative estimates of the impacts of changes based on quantitative results from hundreds of communities across North America.
Programs can be made more cost-effective, and using the results from this study, program managers can base their decisions on a broader range of information and experience (e.g., combined with rather than relying on examining their remaining waste stream and using "rules of thumb" on capture, or basing decisions on a few case studies that program designers "hope" will be applicable). As expected, the quantitative work confirms a number of factors matter, including:
economic factors: variable rates and incentives, and avoided costs.
The quantitative results can be used to identify key strategies for increasing diversion, or for improving the cost-effectiveness of programs for communities.
Related work: The database was not only very useful in analyzing program impacts, but it also provides a rich resource for helping communities "benchmark" and compare their operational efficiencies, program features and impacts, costs, rates, and other characteristics. It supports continuing analysis of the effects of rates and container issues, further research into yard waste programs, and particularly, more detailed research on costs and cost-effectiveness issues. Given the differences by community and other factors, the results also have implications for goal setting.
The potential, accuracy, and robustness of this type of analysis should continue to improve because communities are collecting more complete and more consistent data in their efforts to monitor progress toward recycling and diversion goals. This study and future follow-on efforts should provide better and better lessons for other communities, helping improve the performance and cost-effectiveness of programs around the nation, and hopefully helping us achieve the broad range of community waste management and diversion goals in the most sustainable manner.
community factors: population, urbanhural, income, and region. program factors: materials, collection frequency and method, mandates, and other factors.
~
About the Author: Dr. Skumatz. an economist, is Principal o f Skumatz Economic Research Associates, lnc., a solid waste and economics consulting firm based in Seattle, Washington. Dr. Skumatz is best known for her work in rates and incentives. She has conducted numerous efficiency, benchmarking, and cost-effectiveness evaluations of,recycling and waste management programs for communities across the United States and Canada. Her focus is on applying quantitative techniques to real-world questions of solid waste policy and operations. Dr. Skumatz gratefully acknowledges the assistance of Erin Truitt and John Green in the compietion of this study.
Note: The author and sponsors would appreciate acknowledgment/attribution when information from this study is used.
"Besides the follow-on activities mentioned above, w e are conducting a similar study for the California Chapters of SWANA. The California study is examining many of the same types of issues as this nationwide study. but on a state- specific basis, end our work on the California study also focuses more deeply on the cost-effectiveness of achieving alternative levels of diversion, and incorporates the commercial and multifamily sectors.
~
.~
Skumatz Economic Research Associates, Inc. 151 1 3rdAve. Suite lOOOSeaftle, WA 98101 Voice: 12061 624-8508 FAX: 12061 624-2950
"Nationwide Diversion Rate Study - - 36 Quantitative Effects of Program Choices ... "
Final Report, July 1996