nationwide emission benefits of a low sulfur … emission benefits of a low sulfur diesel fuel march...
TRANSCRIPT

Nationwide Emission Benefits of a Low Sulfur Diesel Fuel
March 3, 1999
For: Engine Manufacturers Association
By: Tom Darlington Dennis Kahlbaum
Air Improvement Resource, Inc.47298 Sunnybrook Lane
Novi, Michigan48374

Table of Contents
1.0 Summary ....................................................................................................................... 3
2.0 Introduction................................................................................................................... 7
3.0 Review of Methods Used to Estimate SO2 and SO4 From Diesel Engines ................ 103.1 On-Road Models ................................................................................................. 10
3.1.1 EPA’s PART5 Model ................................................................................... 103.1.2 ARB’s MVEI7G Model................................................................................ 14
3.2 Off-Highway Models........................................................................................... 183.2.1 EPA’s NONROAD Model............................................................................ 183.2.2 ARB OFFROAD Model ............................................................................... 19
3.3 Comparison of Models ........................................................................................ 19
4.0 Modeling Method Used in This Analysis ................................................................... 214.1 Models Used........................................................................................................ 214.2 Comparison of SO2 from Mobile Sources to SO2 From Tall Stack StationarySources .......................................................................................................................... 224.3 Model Modifications ........................................................................................... 224.4 Activity ................................................................................................................ 234.5 Diesel Fuel Scenarios .......................................................................................... 24
5.0 Results......................................................................................................................... 255.1 On-Road Results.................................................................................................. 255.2 Off-Road Results ................................................................................................. 265.3 Total Program Emission Reductions ................................................................... 27
6.0 Conclusions ............................................................................................................... 29
7.0 References.................................................................................................................. 31
2

1.0 Summary
The Environmental Protection Agency (EPA) will release its Tier 2 Notice of Proposed Rulemaking (NPRM) early this year. In addition to lower emission standards for passenger cars and light trucks, sport utility vehicles, and vans, the NPRM is expected to include a proposal to reduce the sulfur level in gasoline by about 90%. A reduction in gasoline sulfur level is needed to reduce criteria pollutants emitted from current and future vehicles and to enable the next generation of vehicle emission control technology.
Along with lower sulfur levels in gasoline, EPA is also beginning to study lower sulfur levels in diesel fuel for both on-road and off-road engines. Sulfur in diesel fuel forms sulfur dioxide (SO2) and sulfate (SO4) particulate matter (PM) during combustion. These pollutants contribute to acidic deposition and raise particulate levels including ambient fine PM (i.e. < 2.5 microns) levels. EPA recently established a fine PM air quality standard that regions will have to meet. In addition to these air quality impacts, sulfur in diesel fuel contributes to increased acid levels in the engine, causing engine and emission control system wear. Finally, more stringent NOx standards for light duty diesel vehicles and trucks are being considered in the Tier 2 proposed rule, and more stringent standards for heavy-duty diesel vehicles have already been adopted for 2004 and later engines. Engine makers and aftertreatment suppliers are working on advanced emission control devices to meet more stringent standards, but many of these devices require low sulfur diesel fuel to be commercially available. Therefore, cutting on-road and off-road diesel fuel sulfur levels would reduce ambient SO2 and fine PM levels, improve engine and aftertreatment system durability, and enable new technology to be commercially viable.
To determine the SO2 and PM emission inventory impacts of lower sulfur on-road and off-road diesel fuel, the Engine Manufacturers Association (EMA) sponsored this study to evaluate two fuel control options. Current on-road diesel fuel has a fuel sulfur content on average of 300 parts per million (ppm), with off-road diesel 11 times that amount at 3300 ppm. Sulfur control Case A would reduce on-road and off-road sulfur levels to 30 ppm maximum by October 1, 2003. Case B would reduce on-road sulfur levels to the 30 ppm and off-road levels to 500 ppm by July 1, 2002. Case B would include a second phase for off-road diesel, reducing the sulfur level from 500 ppm to 30 ppm maximum by October 1, 2005. EMA’s choice of 30 ppm sulfur for modeling purposes is meant to show the emission reductions of this level of control, and does not mean to imply that EMA believes that 30 ppm is sufficient to enable advanced aftertreatment technology.
AIR reviewed the existing EPA and California Air Resources Board (ARB) on-road and off-road models for predicting SO2 and SO4 PM emissions from diesel engines. There were many similarities between the models, but the EPA models appear to more completely account for sulfur than the ARB models. Therefore, for this study, AIR used the EPA PART5 model for on-road engines and the EPA NONROAD model for off-road engines to estimate these pollutants. The fractions of light heavy-duty and medium heavy-duty diesel vehicles equipped with catalysts in the PART5 model were updated
3

with more recent information. AIR obtained on-road diesel vehicle activity information (miles per day by vehicle class) from EPA sources. Off-road activity is already included in the NONROAD model. The PART5 model includes indirect sulfates (i.e., those formed from reaction of SO2 to sulfates in the atmosphere), but the NONROAD model does not. AIR therefore estimated indirect sulfates for NONROAD engines consistent with the EPA PART5 model methodology. The EPA estimate of indirect sulfates, as explained in the body of the text, is a significant underestimate of the impact that low sulfur diesel fuel will make on nationwide PM concentrations and sulfate deposition. More refined estimates are beyond the scope of this report.
The results of the analysis are shown in Figures 1 and 2, which show SO2 and SO4 PM emission reductions by calendar year for the two cases. The reductions in tons per day for each pollutant are shown for calendar years 2002 to 2010, and are shown separately for on-road and off-road engines. There are differences in the cases in the transitional years (2002-2005), but the long-term reductions are the same, and peak at almost 3000 tons per day (tpd) for SO2, and 1100 tpd for SO4 PM. Since the off-road current sulfur level is nearly 11 times that of the on-road sulfur level, the majority of the reductions come from off-road diesel. These reductions represent a 95% cut in these pollutants for on-road sources, and a 99% cut for off-road sources.
The 3000 tpd reduction in SO2 in 2010 amounts to over 1 million tons per year. In 2010, total SO2 from all sources after the 10 million ton per year acid rain program is completed will be about 15 to 17 million tons per year. Therefore, the 1 million ton per year reduction is very significant, or about 6 or 7 % of the total SO2 in 2010.
4

5
��������
����������������������������������������
����������������������������������������
������������������������������������������������������������������������������������������������������������������������
����������������������������������������������������������������������������������������������������������������������������������������
��������������������������������������������������������������������������������������������������������������������������������
������������������������������������������������������������������������������������������������������������������������������������������������
�����������������������������������������������������������������������������������������������������������������������
��������������������������������������������������������������������������������������������������������������������������������������������������������
��������������������������������������������������������������������������������������������������������������������������������������������������������
��������������������������������������������������������������������������������������������������������������������������������������������������������
��������������������������������������������������������������������������������������������������������������������������������������������������������
����������������������������������������������������������������������������������������������������������������������������������������������������������������
����������������������������������������������������������������������������������������������������������������������������������������������������������������
������������������������������������������������������������������������������������������������������������������������������������������������������������������������
������������������������������������������������������������������������������������������������������������������������������������������������������������������������
��������������������������������������������������������������������������������������������������������������������������������������������������������������������������������
��������������������������������������������������������������������������������������������������������������������������������������������������������������������������������
2002 2003 2004 2005 2006 2007 2008 2009 20100
500
1,000
1,500
2,000
2,500
3,000
Year
�������������� Case A�������������� Case B
Figure 1National SO2 Reductions
Air Improvement Resource, Inc.
Off-RoadOn-Road

6
��������
����������������������������������������
����������������������������������������
������������������������������������������������������������������������������������������������������������������������
����������������������������������������������������������������������������������������������������������������������������������������
������������������������������������������������������������������������������������������������������������������������
����������������������������������������������������������������������������������������������������������������������������������������
�����������������������������������������������������������������������������������������������������������������������
������������������������������������������������������������������������������������������������������������������������������������������������
������������������������������������������������������������������������������������������������������������������������������������������������
������������������������������������������������������������������������������������������������������������������������������������������������
������������������������������������������������������������������������������������������������������������������������������������������������
��������������������������������������������������������������������������������������������������������������������������������������������������������
��������������������������������������������������������������������������������������������������������������������������������������������������������
����������������������������������������������������������������������������������������������������������������������������������������������������������������
����������������������������������������������������������������������������������������������������������������������������������������������������������������
������������������������������������������������������������������������������������������������������������������������������������������������������������������������
������������������������������������������������������������������������������������������������������������������������������������������������������������������������
2002 2003 2004 2005 2006 2007 2008 2009 20100
200
400
600
800
1,000
1,200
Year
�������������� Case A�������������� Case B
Figure 2National Total SO4 PM Reductions
Air Improvement Resource, Inc.
Off-RoadOn-Road
PM reductions includereductions in indirect sulfates.

2.0 Introduction
EPA plans to release its Tier 2 NPRM early this year. The NPRM will not only call for lower exhaust emissions standards for cars and light trucks, it will also propose tighter sulfur limits for gasoline. The tighter sulfur limits will have the immediate impact of lowering in-use emissions of ozone-forming pollutants, carbon monoxide and particulate matter. Sulfur control is critical because sulfur forms sulfur dioxide (SO2) in the engine during combustion, and SO2 impairs the ability of the catalytic converter to reduce exhaust emissions, especially in all vehicles equipped with catalytic converters, especially in vehicles equipped with advanced emission control technology. Current gasoline sulfur levels in non-California states vary significantly, but the national average is about 340 ppm. (1) EPA is studying a number of scenarios, including reducing this by over 90% to an average of about 30 ppm, and the possibility of eventually phasing in a “sulfur free” fuel. Sulfur levels in gasoline in California are under 30 ppm, because California’s Phase 2 reformulated gasoline requirement contains an averaging limit of 30 ppm. California is also studying the possibility of further reducing the sulfur in its gasoline below 30 ppm to essentially a “sulfur free” fuel corresponding to the next level of emission reductions requirements, LEV II.
Sulfur in diesel fuel also affects engine emissions. Sulfur forms SO2 during combustion, and some of the SO2 reacts with additional oxygen and water to form sulfate (H2SO4) particulate matter (PM). This PM is called “direct” PM. SO2 also forms additional PM by complex reactions in the atmosphere, and this is referred to as “indirect” PM. In 1993, EPA implemented a 500 ppm nationwide cap for the sulfur limit of on-highway diesel fuel. California also implemented the same cap for diesel fuel sold in California. California further controlled total aromatics in diesel fuel to a maximum of 10%, although uit has implemented a mechanism to certify fuels with alternative formulations that achieve equivalent emissions performance. The current national average sulfur level for on-highway diesel fuel is about 300 ppm. (2) Currently, there is no sulfur cap for off-highway diesel fuel, and EPA estimates that off-highway diesel fuel has a sulfur level of almost 3300 ppm, or about 11 times the on-highway level. (3) The adoption of Stage III/IV standards for 2000/2005 by Europe was accompanied by a phased reduction of sulfur to a 50 ppm cap. This was necessary for advanced diesel aftertreatment technology to function effectively.
Sulfur in diesel fuel also has an effect on exhaust emission aftertreatment expected to be used to meet lower NOx standards. The EPA has adopted stricter NOx standards for heavy-duty diesel engines starting in 2004, and many expect EPA to lower heavy-duty NOx standards further in the future. Many engine manufacturers will utilize exhaust gas recirculation (EGR), in combination with other strategies, to meet the 2004 NOx standards. However, in order for EGR to be effective at reducing NOx emissions, the exhaust gas must be cooled, and in the process of cooling the exhaust gas, sulfuric acid condenses in the EGR system. Thus, with current sulfur fuel, manufacturers must use premium components for EGR systems combined with shorter service intervals that increase overall maintenance costs.
7

8
In the longer term for heavy-duty diesel engines, if NOx standards are furthertightened, it is unlikely that EGR systems alone will be able to enable enginemanufacturers to meet lower standards. The diesel engine and emission controlmanufacturers are developing new technologies such as adsorption catalysts and otherdevices to reduce NOx from diesel engines. Like the catalytic converters used forgasoline vehicles, many of these advanced diesel technologies are also adverselyimpacted by SO2.
Some oil companies, expecting control of gasoline sulfur levels under the FederalTier 2 rule, also expect diesel fuel sulfur levels to be eventually reduced as well, and maydesire for EPA to reduce gasoline and diesel fuel sulfur levels along a similar timeline.Recognizing this, EPA is requesting input from all parties on an advance notice ofproposed rulemaking (ANPRM) on potentially controlling future diesel fuel sulfur levels.California would also like to reduce sulfur levels in diesel fuel.
The advantages of a lower sulfur on-highway and off-highway diesel fuel, thenare summarized below:
• Lower SO2 emissions from diesel engines, and reduced acidic deposition• Lower directly emitted PM from diesel engines• Lower indirect PM• Improved visibility and ambient PM levels• Increased EGR system life• Increased engine life and reduced maintenance costs• Allows for commercial application of advanced technology aftertreatment
Because of the need for lower sulfur on-highway and off-highway diesel fuel, theEngine Manufacturers Association (EMA) contracted with AIR to assess the SO2 andSO4 PM emission benefits of low sulfur diesel fuel in the nation, and in California. EMAalso contracted with MathPro to perform a study of the costs of lower sulfur diesel fuel.EMA desired to study the emission reductions of two control cases, as shown in Table 1.
Table 1. Diesel Fuel Control Scenarios Case On-Road Off-Road
Level Date Level Date A 30 max 10/1/2003 30 max 10/1/2003 B 30 max 7/1/2002 500 max 10/1/2002 30 max 10/1/2005
Case A would limit all on- and off-road diesel sulfur to 30 ppm maximum
starting on October 1, 2003. Case B would limit on-road diesel sulfur to 30 ppmmaximum on July 1, 2002, and would provide for a two-phase reduction for off-roaddiesel to 500 ppm maximum on October 1, 2002, followed by a further reduction to 30ppm maximum on October 1, 2005. EMA’s choice of 30 ppm sulfur for modelingpurposes is meant to show the emission reductions of this level of control, and does not

mean to imply that EMA believes that 30 ppm is sufficient to enable advanced aftertreatment technology.
The remainder of this report is divided into four sections. Section 3 Review of Methods to Estimate SO2 and SO4 Emissions From Diesel Engines reviews the methods used by the EPA and California Air Resources Board to estimate SO2 and SO4 emissions in the various on-road and off-road models. Section 4 Methods Used in This Analysis discusses the modeling approach used in this analysis. Section 5 Results presents the emission inventories and emissions reductions from the various cases. Section 6 Conclusions discusses implications of the analysis and remaining uncertainties.
9

10
3.0 Review of Methods Used to Estimate SO2 and SO4 From Diesel Engines EPA and ARB have two models each, which estimate SO2 and SO4 emissionsfrom on- and off-highway diesel engines. These models are shown in Table 2.
Table 2. ARB and EPA Models Source Model Name Vehicles Covered EPA PART5 On-Highway Vehicles
NONROAD Off-Road Vehicles ARB MVEI7G On-Highway Vehicles
OFFROAD Off-Road Vehicles The PART5 model was finalized shortly after MOBILE5 was finalized. EPAcurrently plans to update this model about a year after MOBILE6 is finalized (MOBILE6is scheduled to be completed by the end of 1999). MVEI7G is ARB’s current model forCalifornia; it is being updated at this time. The new model, EMFAC99, will be releasedsometime this spring. Both of the models for off-road engines are still underdevelopment, but both have been available for some time for review by interested parties.AIR has provided both organizations with comments on various parts of these models,but until now AIR has not reviewed in detail the methods used to estimate emissionsspecifically derived from the sulfur in diesel fuel.
The following sections review how each of these models estimate SO2 and SO4emissions. 3.1 On-Road Models 3.1.1 EPA’s PART5 Model EPA’s PART5 model estimates SO2 and SO4 emissions for the following dieselvehicle types: • Light Duty Diesel Vehicles• Light Duty Diesel Trucks (0-6000 lb GVW)• 2B Diesel Trucks (6,001-10,000 lb GVW)• Light-Heavy Duty Diesel Vehicles (10,001-19,500 lb GVW)• Medium-Heavy Duty Diesel Vehicles (19,501-33,000 lb GVW)• Heavy-Heavy Duty Diesel Vehicles (33,000+ lb GVW)
SO2 and SO4 emission rates are estimated for non-catalyst equipped vehicles withthe following expressions:
SO2 = (9.072 * Density * Sulfur * (1-FracSO4))/Fuel Economy (4)
Where

SO2 is in g/mi9.072 is (453.6 g * 2)/100, where 2 is the number of grams of SO2 formed pergram of S (64/32), and 100 converts sulfur from a wt % to a wt fractionDensity is the assumed density of diesel fuel, 7.11 lb/galSulfur is the wt percent of sulfur in on-road diesel fuel, assumed to be 0.05%, or500 ppmFracSO4 is the fraction of sulfur converted to SO4 in the exhaust, 2%Fuel Economy is the fuel economy in mpg for each model of each vehicle type
SO4 = (31.10 * Density * Sulfur * FracSO4)/Fuel Economy
Where
SO4 is in g/mi31.10 is (453.6 g/lb * 6.857)/100, where 6.857 is EPA’s estimate of the g ofH2SO4 : 7H2O per g of S, and 100 converts sulfur from wt % to a wt fractionOther terms are the same as for SO2
In the above expressions, the PART5 model splits the fuel sulfur into either SO2 or SO4 using the assumed fraction of sulfur converted to SO4 in the exhaust (2%). The expressions use fuel economy in mpg by vehicle type and model year to estimate SO2 and SO4 emissions in g/mi. Finally, EPA assumes that direct sulfate is emitted as sulfuric acid with associated water (7 water molecules per molecule of sulfuric acid).
In the above expression, EPA estimates that 6.857 is the ratio of sulfuric acid and 7 waters to sulfur ([H2SO4 + 7H2O]/S). EPA estimated this number as the product of two other ratios: SO4/S (96/32 = 3.0), and (H2SO4 + 7H20)/H2SO4 (224/98 = 2.2857). Note that EPA uses SO4 in the numerator of the first ratio and H2SO4 in the denominator of the second ratio. H2SO4 should have been used in the first ratio; then the 31.10 would be 31.75. This is not considered to be a major difference, so AIR used the EPA equation as is.
For the non-catalyst-equipped vehicle s, all of the above factors are constant except fuel economy, which varies by vehicle type and model year. To estimate fleet SO2 emission factors, the model combines the model year emission factors with travel fractions in the same manner that MOBILE5 does for HC, CO and NOx.
Direct PM emissions include sulfates, carbon, and a soluble organic fraction (SOF). EPA bases the PART5 PM estimates on total direct PM from its available test data. This data is assumed to have been gathered using a test fuel that matches the sulfur level of in-use fuel (500 ppm). To estimate the emission rates of the different PM types, EPA subtracts the estimated sulfates from total PM, and then splits the remainder (carbon + SOF) using an estimated SOF fraction.
11

For catalyst-equipped diesel vehicles, EPA assumes that the fraction of sulfur converted to sulfates increases to 3% from 2%. EPA estimates that 90% of the 1995 and later LHDVs, 75% of the 1995 and later MHDVs, and 100% of the 1991 and later buses are equipped with catalysts.
Fuel economy values assumed in the model for diesel vehicles are shown in Figures 3 (LDDV and LDDT) and 4 (HDDVs). The fuel economy values show a significant increase in fuel economy from the 1989 model year to the 1990 model year, which is not expected. The reason for this increase is an artifact of how the EPA referenced the fuel economy values to the MOBILE3 Fuel Consumption Model: EPA used 1975 fuel economy values for 1975-1989 vehicles, and a projection for 1990 for 1990 and later vehicles. (5) The fuel economy values should show more of a constant increase from 1975-1989, which has been acknowledged by the EPA. This has a tendency to overstate PM emissions, until the 1975-1989 vehicles are retired. AIR did not change the fuel economy values, but this should be addressed by the EPA in PART6, and the fuel economy values should probably be based on recent Truck Inventory and Use Surveys (TIUS).
The PART5 model also estimates indirect sulfates, that is, sulfates that are formed in the atmosphere from SO2. The model uses the following expression:
Indirect SO4 = Indirect FracSO4 * SO2 * 1.92
Where
Indirect SO4 is in g/miIndirect FracSO4 is the fraction of SO2 that reacts to form SO4 in the atmosphere,or 12%SO2 is in g/mi (from earlier expression)1.92 is the g of ammonium sulfate (NH2SO4) and ammonium bisulfate (NH4HSO4)(50/50) produced per g of SO2
12

13
0
5
10
15
20
25
30
35
1975 1980 1985 1990 1995 2000 2005 2010 2015 2020Model Year
LDDVLDDT
Figure 3 PART5 Light Duty Fuel Economy
Air Improvement Resource, Inc.
0
2
4
6
8
10
12
14
16
18
1975 1980 1985 1990 1995 2000 2005 2010 2015 2020Model Year
8501-14000 GVW14001-33000 GVW33000+ GVWBuses
Figure 4 PART5 Heavy Duty Fuel Economy
Air Improvement Resource, Inc.

EPA estimates that 12% of SO2 is converted in urban areas to sulfate PM.1 The source of this estimate is an EPA analysis of nationwide SO4 to SO2 ambient levels from SO2 and SO4 monitors across the U.S. (6) This analysis was performed for the 1990 diesel fuel sulfur rule, which lowered diesel fuel sulfur levels to 500 ppm. EPA assumes that the SO2 that reacts in the atmosphere forms either ammonium sulfate or ammonium bisulfate. In its analysis, EPA cites reaction rates in California as high as 6% per hour in the spring, summer, and fall, in which all of the SO2 would be expected to have formed sulfates within about 18 hours. However, to better represent non-California states, EPA developed the 12% figure from ambient sulfate and SO2 data in 10 non-California cities. The ambient data were year-round, rather than being in the spring or summer when reaction rates are probably significantly higher. Also, EPA’s analysis assumes that sulfate and SO2 deposition in the 10 cities occurs at the same rate (EPA assumes that because of the small size of the sulfate that it disperses like a gas). If SO4 deposition occurs faster than SO2 deposition, then the 12% conversion rate is underestimated.
Overall, our concern with the 12% figure is that it could be low, particularly in the spring and summer when meteorological conditions favor secondary PM formation, and human exposure is greater.
3.1.2 ARB’s MVEI7G Model
MVEI7G, ARB’s model for on-road vehicles, utilizes the EMFAC emission factor models and the BURDEN activity model to produce emissions for California in tons per day. The MVEI7G model estimates all on-highway emission rates (HC, CO, NOx, CO2, PM, SO2) for the following vehicle classes:
• Passenger cars • Light duty trucks (0-6000 lb GVW) • Medium duty trucks (6-8500 lb GVW) • Light-heavy-duty trucks (8,500-14,000 lb GVW) • Medium-heavy-duty trucks (14,000-33,000 lb GVW) • Heavy-heavy-duty trucks (33,000+ lb GVW) • Buses
In the MVEI7G model, SO2 emissions in tons per day are estimated with the following expression:
SO2 = (Fuel * Density * Sulfur * FracSO2)/(2*109) (7)
Where
SO2 is in tons per day
1 The remaining SO2 is assumed to be converted into sulfates in nonurban areas, or deposited onto surfaces in urban or nonurban areas without reacting. However, SO2 and SO4 that is deposited contribute to acid deposition.
14

15
Fuel is fuel consumption in 000s of gal/day Density is the assumed density of diesel fuel, 7.07 lb/gal Sulfur is the assumed sulfur content of diesel fuel, or 500 ppm starting in 1993 FracSO2 is the g of SO2 produced per gram of S (64/32) 2* 109 converts from ppm to a wt fraction and from lbs to tons
In the above expression, all of the fuel sulfur is assumed to react to form SO2.Fuel consumption in gal/day by vehicle class is estimated with fuel economy estimates byvehicle class and activity (miles per day). ARB fuel economy by vehicle class is shownin Figures 5 (LDDVs and LDDTs) and 6 (HDDVs). The above expression is similar toEPA’s expression, however, there are three differences in the input data and assumptions: • ARB assumes that all of the fuel sulfur reacts to form SO2, where EPA assumes that
98% reacts to form SO2
0
5
10
15
20
25
30
35
40
1975 1980 1985 1990 1995 2000 2005 2010 2015 2020Model Year
LDDVLDDT
Figure 5 ARB Light Duty Fuel Economy
Air Improvement Resource, Inc.

16
0
1
2
3
4
5
6
7
1975 1980 1985 1990 1995 2000 2005 2010 2015 2020Model Year
All HD Trucks and Buses
Figure 6 ARB Heavy Duty Fuel Economy
Air Improvement Resource, Inc.

17
0
5
10
15
20
25
30
35
40
1975 1980 1985 1990 1995 2000 2005 2010 2015 2020Model Year
ARB LDVARB LDTEPA LDVEPA LDT
Figure 7 Light Duty Fuel Economy Comparison
Air Improvement Resource, Inc.
0
2
4
6
8
10
12
14
16
18
1975 1980 1985 1990 1995 2000 2005 2010 2015 2020Model Year
ARB HDEPA 8501-14000EPA 14001-33000EPA 33000+EPA Bus
Figure 8 Heavy Duty Fuel Economy Comparison
Air Improvement Resource, Inc.

• There is a small difference in the assumed diesel fuel density (ARB – 7.07 lb/gal, EPA- 7.11 lb/gal)
• There are significant differences in estimated fuel economy by vehicle class, as shown in Figures 7 and 8. For light duty vehicles and light duty trucks, the EPA values are lower than the ARB values. The trends (increasing fuel economy with time) are similar. For the heavy-duty vehicles, ARB uses a single value for all heavy-duty vehicles, while EPA uses separate values by vehicle class. Because of this, it is difficult to compare the heavy-duty vehicle fuel economy estimates.
For sulfate particulate, ARB relies on its PM emission rates from test data. In this sense, ARB is double-counting the sulfur that forms sulfate particulate, because it does not subtract the sulfur that forms sulfate PM when estimating SO2 emissions.
3.2 Off-Highway Models
3.2.1 EPA’s Draft NONROAD Model
EPA’s Draft NONROAD model estimates HC, CO, NOx, SO2, and PM emissions (including sulfates) for the nation, for the following equipment types:
• Agriculture • Airport Ground Support • Lawn and Garden • Light Commercial • Logging • Recreation • Other Oil Field Equipment • Transport Refrigeration Units
The model does not yet include vessels and rail operations, but the final version is expected to include these equipment types.
For SO2 emissions, the model uses the following expression:
SO2 = (BSFC * (1-FracSO4) – HC) * Sulfur * 2 (8)
Where
SO2 is in g/hp-hrBSFC is the in-use adjusted fuel consumption in lb/hp-hr453.6 is the conversion factor from g to lbFracSO4 is the fraction of sulfur converted to sulfate, assumed to be 2.2%HC is the in-use adjusted HC emissions in g/hp-hr
18

Sulfur is the wt fraction of sulfur in nonroad diesel fuel, 0.0033%, or 3300 ppm 2 is the g of SO2 formed per g of S
The equation above includes corrections for the fraction of sulfur that is converted to direct PM and for the fraction of sulfur remaining in the unburned fuel. There are two differences in the above expression and the expression used for on-highway diesel vehicles:
• In the NONROAD model, EPA is assuming that 2.2% of the sulfur is converted to SO4, where the PART5 model assumes this percentage is 2.0%
• EPA also appears to be correcting for the sulfur in the unburned, or partially burned fuel
It is not clear why the NONROAD model assumes a conversion of 2.2%, while the onroad model PART5 assumes a conversion of 2.0% for noncatalyst-equipped vehicles. Also, EPA assumes that the fraction of sulfur in the unburned, or partially burned fuel is the same as in the raw fuel. First the HC emissions are probably at least partially burned, and there is no evidence that the fraction of sulfur in the partially burned fuel is the same as in the raw fuel. While this assumption and resulting adjustment is questionable, since HC emissions from diesel vehicles are very low, the adjustment has little effect on the overall SO2 emission rate.
For SO4 emissions, EPA utilizes test data of a number of engines on different test fuels, but adjusts the total PM to a sulfur level of 3300 ppm. Thus, there appears to be no double counting of sulfur.
Unlike the PART5 model, the NONROAD model does not estimate indirect sulfates. The reasons for this are not clear.
3.2.2 ARB Draft OFFROAD Model
In ARB’s OFFROAD model, SO2 emissions are estimated very similarly to the method ARB uses in its MVEI7G on-road model, except that fuel consumption by equipment type is estimated by multiplying fuel consumption in g/hp-hr by activity in total hp-hr. ARB assumes that all of the diesel fuel sulfur reacts to form SO2, but the PM emissions ARB uses includes SO4, so sulfur appears to be double-counted in this model as well. The OFFROAD diesel fuel sulfur level is assumed to be 2800 ppm.
3.3 Comparison of Models
A comparison of some of the input parameters for all four models is shown in Table 3. In the last column, we have indicated that for the EPA models, the sulfate PM is based on the fuel sulfur level and the assumed percent of sulfur converted to SO4, and that for ARB, the sulfate PM is based on test data, which could have varying sulfur levels.
19

20
Table 3. Input Parameter Comparison for the Various Models
Model Base SulfurLevel (ppm)
% SulfurConvert to
SO2
% SulfurConvertto SO4
Indirect SO4Estimated?
FuelDensity(lb/gal)
ExhaustSO4 PM
Based On PART5 –
EPA 500 98.0 2.0 Yes – 12% 7.11 Amount
converted MVEI7G –
ARB 500 100.0 0.0 No 7.07 Test data
NONROAD –EPA
3300 97.8 2.2 No NA Amountconverted
OFFROAD –ARB
2800 100.0 0.0 No NA Test data
NA = not applicable

4.0 Modeling Method Used in This Analysis
4.1 Models Used
Since both of the EPA models seem to effectively split the fuel sulfur into SO2 and SO4 without double counting, AIR will use the EPA models to estimate nationwide SO2 and SO4 emission inventories. It is recognized, however, that these two models are not exactly consistent with each other, in the following respects:
• The NONROAD model does not yet include indirect sulfates • There is a difference in the assumed percent of sulfur converted to SO4. The SO4
conversion is 2.2% for off-road engines, and 2.0% for on-road engines. The reason for this difference is not clear.
• The NONROAD model corrects for the sulfur in unburned or partially burned HC, while PART5 does not. The models should be made consistent, but the small size of this adjustment probably does not make much difference.
These differences should be corrected when the next version of each model is finalized. Certainly the biggest issue is the omission of estimating indirect sulfate particulate from the NONROAD model, and this analysis will include indirect sulfates for NONROAD vehicles, using the same fraction of SO2 reacted (12%) as in the PART5 model for onroad vehicles.
It should also be recognized that the NONROAD model is still being developed by EPA, although many parts of the model have receive substantial review and comment. One area that is still undergoing review by the EPA that could impact these estimates is nonroad diesel fuel consumption. Some have commented that the off-road diesel fuel consumption appears to be too high relative to other sources. If true, this could mean that the activity is too high, the populations are too high, or both. EPA is currently reviewing these comments and conducting additional analyses. If the fuel consumption in the model is too high, then the inventories and reductions as estimate from this analysis will also be too high. However, the emission reductions from nonroad sources are still expected to be very significant.
AIR has several other concerns with the EPA models, as follows:
1. The indirect sulfate conversion of 12% in PART5 may be very low. As mentioned earlier in this report, it was estimated by EPA on an annual average basis, and does not represent an episodic condition (late Spring, Summer, early Fall) in which the SO2 conversion may be significantly higher. EPA’s 12% estimate is for urban areas. The SO2 that does not react in the immediate urban area is transported downwind and reacts in rural areas, contributing to acid deposition, fine PM, and visibility problems in downwind areas.
2. The catalyst fractions in PART5 should be updated. This is discussed further in the next section.
21

22
3. The direct sulfate conversion of 3% for current catalyst-equipped vehicles may below. AIR has examined evidence that the conversion rate may be much higherthan 3%. The level of conversion is very sensitive to the catalyst formulation. Allof this evidence is on current and past diesel catalyst formulations. It is verylikely that future diesel catalyst formulations that must reduce NOx emissions by50-60% will likely have much higher SO2 conversions. In this analysis, however,we have used EPA’s estimate of 3%.
4.2 Human Exposure and the Source of SO2
AIR also believes that there could be a significant difference in the level ofhuman exposure to sulfate from diesel engines, versus from tall stack stationary sources.In the case of tall stacks located near urban areas, SO2 emitted can be blown many milesbefore it reacts to form sulfate PM. In the case of diesel engines, however, direct sulfate,indirect sulfate, and SO2 emissions are much closer to ground level, thereby increasinghuman exposure. This difference is not reflected in the models or inventories.
4.3 Model Modifications
First, for on-road engines, many 2b, light-heavy-duty, and medium heavy-dutyvehicles are now equipped with oxidation catalysts. The PART5 model assumes thefraction equipped for these vehicles is zero. In a previous analysis that AIR conducted forthe Canadian Vehicle Manufacturers Association (CVMA), AIR estimated that 90% of1995 and later 2b and light heavy duty vehicles are equipped with oxidation catalysts,and that 75% of 1995 and later medium duty vehicles are equipped with catalysts. (9) Asnoted earlier, EPA estimates that the fraction of sulfur that is converted to sulfatesincreases from 2% to 3% with an oxidation catalyst. Therefore, AIR adjusted the fractionof sulfur converted to sulfates in the model for 1995 and later 2bs, LHDDVs, andMHDDVs. The increased sulfate conversion fractions are shown in Table 4.
Table 4. Sulfate Conversion and Catalyst Fractions for Heavy Duty Diesels
Vehicle TypeSulfate Conversion Fraction Catalyst Fraction
1994 and earlierMY
1995 and later MY 1995 and later MY
2b and LHDDV 0.02 0.029 0.9MHDDV 0.02 0.0275 0.75HHDDV 0.02 0.02 0
Second, since the NONROAD model currently does not include indirect sulfates,AIR included indirect sulfates to be consistent with the PART5 model. This wasaccomplished by estimating the SO2 to indirect SO4 inventory ratio for the on-roadvehicles, and using this ratio with the NONROAD SO2 inventory to estimate the indirectsulfates from NONROAD sources.
23
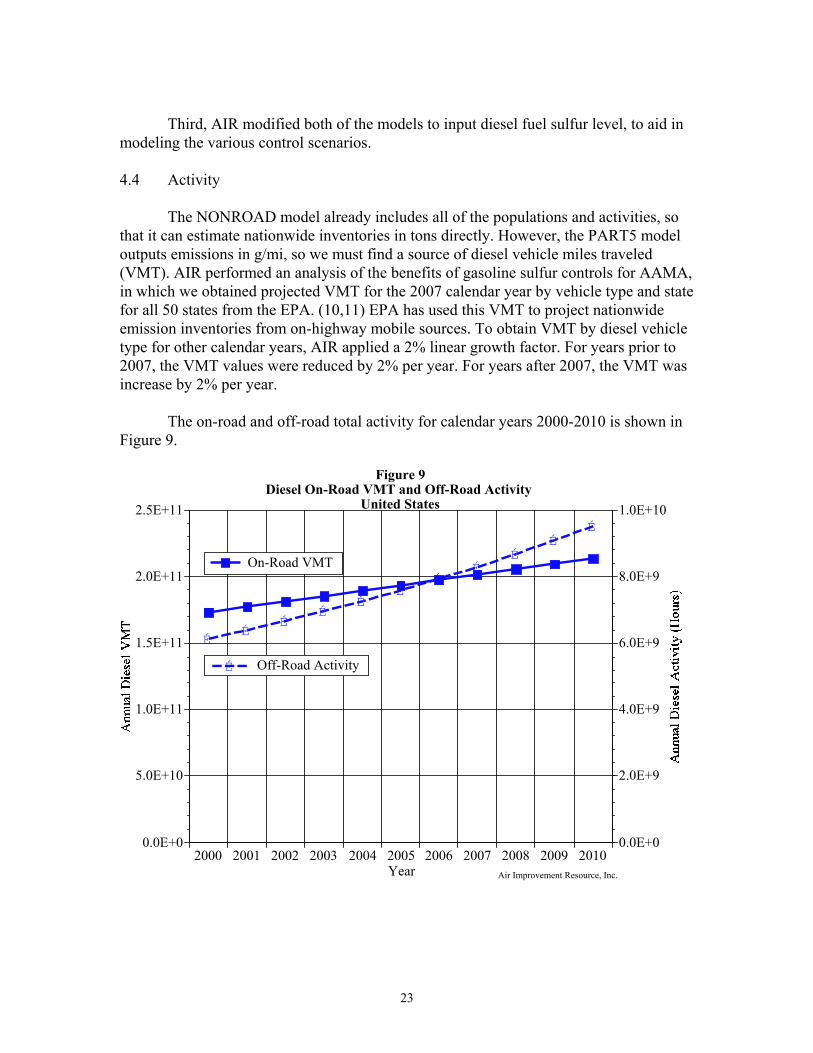
Third, AIR modified both of the models to input diesel fuel sulfur level, to aid inmodeling the various control scenarios.
4.4 Activity
The NONROAD model already includes all of the populations and activities, sothat it can estimate nationwide inventories in tons directly. However, the PART5 modeloutputs emissions in g/mi, so we must find a source of diesel vehicle miles traveled(VMT). AIR performed an analysis of the benefits of gasoline sulfur controls for AAMA,in which we obtained projected VMT for the 2007 calendar year by vehicle type and statefor all 50 states from the EPA. (10,11) EPA has used this VMT to project nationwideemission inventories from on-highway mobile sources. To obtain VMT by diesel vehicletype for other calendar years, AIR applied a 2% linear growth factor. For years prior to2007, the VMT values were reduced by 2% per year. For years after 2007, the VMT wasincrease by 2% per year.
The on-road and off-road total activity for calendar years 2000-2010 is shown inFigure 9.
ÉÉ
ÉÉ
ÉÉ
ÉÉ
ÉÉ
É
2000 2001 2002 2003 2004 2005 2006 2007 2008 2009 20100.0E+0
5.0E+10
1.0E+11
1.5E+11
2.0E+11
2.5E+11
0.0E+0
2.0E+9
4.0E+9
6.0E+9
8.0E+9
1.0E+10
Year
On-Road VMT
É Off-Road Activity
Figure 9Diesel On-Road VMT and Off-Road Activity
United States
Air Improvement Resource, Inc.

24
4.5 Diesel Fuel Scenarios
EMA’s diesel fuel control scenarios are shown in Table 5.
Table 5. Diesel Fuel Control ScenariosCase On-Road Off-Road
Level Date Level DateBase 300 NA 3000 NA
A 30 max/15 nom 10/1/2003 30 max/15 nom 10/1/2003B 30 max/15 nom 7/1/2002 500 max/300 nom 10/1/2002
30 max/15 nom 10/1/2005
The PART5 model assumes on-road diesel sulfur level is 500 ppm, and theNONROAD model assumes the sulfur level is 3300 ppm. AIR evaluated on-road nationalsulfur levels using AAMA’s fuel surveys, and the population-weighted average was veryclose to 300 ppm, therefore, 300 ppm was used in PART5 for on-road fuel in the basecase. EMA specified a 3000 ppm nominal value for the baseline for off-road diesel fuel,so 3000 ppm was used in the off-road modeling.
Control Case A implements a 30 ppm cap for both on-road and off-road fuel on10/1/2003. With a 30 ppm cap, AIR believes many refiners would sell fuel below the cap,therefore, we assumed a 15 ppm nominal level for all modeling of a 30 ppm cap. The10/1/2003 implementation date was modeled by assuming for 3/4s of the year, the fuelsulfur level was at 300 ppm, and for the last quarter, it was at the nominal level.
Control Case B implements the 30 ppm cap for on-road engines 15 months earlierthan Case A, but for off-road engines the first phase drops to a 500 ppm cap. The 500ppm cap is modeled at a nominal value of 300 ppm. This is further reduced to a 30 ppmcap (15 ppm nominal) in 2005.

25
5.0 Results
5.1 On-Road Results
On-road SO2, direct SO4, and indirect SO4 PM inventories in tons per day for theBase Case (i.e., 300 ppm S) are shown in Table 6. SO2 ranges from 132 tpd in 2000 to151 tpd in 2010. Total SO4 PM is around 50 tpd. It should be recalled that this is onlyurban PM; urban + rural PM is likely to be much higher due to continued reaction of SO2in other areas. Emission reductions from the Base Case for Cases A and B are shown inTable 7, and are shown graphically in Figures 10 and 11. Once the low sulfurrequirement is fully phased-in, SO2 and SO4 PM are reduced by 95%, or about 140 tpdand 50 tpd, respectively.
Table 6. Base Case SO2 and SO4 Inventories From On-Road Diesel Vehicles(tons per day)
Year SO2 Direct SO4 PM Indirect SO4PM
Total SO4 PM
2000 131.7 9.9 37.9 47.82001 134.8 10.3 38.8 49.12002 136.6 10.5 39.3 49.62003 138.4 10.6 39.8 50.22004 140.0 10.8 40.3 51.12005 141.8 11.0 40.8 51.92006 143.4 11.3 41.3 52.62007 145.1 11.5 41.8 53.32008 146.8 11.7 42.3 54.02009 148.6 11.9 42.8 54.72010 150.5 12.0 43.3 55.3

26
Table 7. On-Road Emission Reductions from Cases A and B (tons per day)Case A Case B
Year SO2 DirectSO4PM
IndirectSO4PM
TotalSO4PM
SO2 DirectSO4PM
IndirectSO4PM
TotalSO4PM
2000 0 0 0 0 0 0 0 02001 0 0 0 0 0 0 0 02002 0 0 0 0 64.9 5.0 18.7 23.72003 32.9 2.5 9.5 12.0 131.4 10.1 37.9 48.02004 133.0 10.3 38.3 48.6 133.0 10.3 38.3 48.62005 134.7 10.5 38.8 49.3 134.7 10.5 38.8 49.32006 136.2 10.7 39.2 49.9 136.2 10.7 39.2 49.92007 137.8 10.9 39.7 50.6 137.8 10.9 39.7 50.62008 139.5 11.1 40.2 51.2 139.5 11.1 40.2 51.22009 141.2 11.3 40.7 51.9 141.2 11.3 40.7 51.92010 143.0 11.4 41.2 52.6 143.0 11.4 41.2 52.6
5.2 Off-Road Results
Off-road SO2, total PM, and Indirect SO4 PM in tons per day for the Base Case,Case A, and Case B are shown in Table 8. SO2 and PM inventories are directly from themodel, and the Indirect SO4 emissions were estimated from SO2 with the same ratio ofSO2/SO4 as from on-road mobile sources. The PM emissions include nonsulfate PM asdiscussed earlier. Emission inventory reductions for the two cases are shown in Table 9,and are shown in Figures 12 and 13.
Table 8. Base Case Nonroad Vehicle SO2, PM, and Indirect SO4 Inventories (tpd)Year SO2 PM Indirect SO4
2000 1870 856 5382001 1935 875 5572002 2005 897 5772003 2078 923 5982004 2155 951 6212005 2235 982 6442006 2318 1016 6682007 2405 1051 6932008 2496 1089 7192009 2592 1131 7472010 2693 1174 776

27
Table 9. Nonroad SO2 and PM Emission Reductions (tpd)Case A Case B
Year SO2 DirectSO4PM
IndirectSO4PM
TotalSO4PM
SO2 DirectSO4PM
IndirectSO4PM
TotalSO4PM
2000 0 0 0 0 0 0 0 02001 0 0 0 0 0 0 0 02002 0 0 0 0 451 40 130 1702003 517 46 149 195 1871 167 538 7052004 2144 193 618 811 1939 174 559 7332005 2224 201 641 842 2064 187 641 8282006 2307 210 666 876 2307 210 666 8762007 2393 220 689 909 2393 220 689 9092008 2484 230 715 945 2484 230 715 9452009 2579 241 743 984 2579 241 743 9842010 2678 252 772 1024 2678 252 772 1024
Table 9 indicates that Case will reduce SO2 by 2100 tpd in 2004, expanding to2700 tpd in 2010. Total sulfate PM is reduced by 600 tpd in 2004, expanding to over1000 tpd in 2010. The reductions for Case B are approximately the same, except that theystart one year earlier.
5.3 Total Program Emission Reductions
Total on-highway and off-highway SO2 and SO4 PM reductions for the two casesare shown in Table 10. Nationwide SO2 reductions are almost 3000 tpd and total PM SO4reductions are in excess of 1000 tpd.
Table 10. Total Nationwide SO2 and PM Emission Inventory Reductions (tpd)Case A Case B
Year SO2 Total PM SO2 Total PM2000 0 0 0 02001 0 0 0 02002 0 0 516 1942003 541 207 2002 7532004 2277 860 2072 7822005 2359 891 2199 8782006 2443 926 2443 9262007 2531 960 2531 9602008 2624 996 2624 9962009 2720 1036 2720 10362010 2821 1077 2821 1077

28
��������
��������������������������������������������������������������������������������
����������������������������������������
��������������������������������������������������������������������������������������������������������������������������������������������������������
��������������������������������������������������������������������������������������������������������������������������������������������������������
��������������������������������������������������������������������������������������������������������������������������������������������������������
��������������������������������������������������������������������������������������������������������������������������������������������������������
�������������������������������������������������������������������������������������������������������������������������������������
����������������������������������������������������������������������������������������������������������������������������������������������������������������
����������������������������������������������������������������������������������������������������������������������������������������������������������������
����������������������������������������������������������������������������������������������������������������������������������������������������������������
����������������������������������������������������������������������������������������������������������������������������������������������������������������
����������������������������������������������������������������������������������������������������������������������������������������������������������������
����������������������������������������������������������������������������������������������������������������������������������������������������������������
����������������������������������������������������������������������������������������������������������������������������������������������������������������
����������������������������������������������������������������������������������������������������������������������������������������������������������������
����������������������������������������������������������������������������������������������������������������������������������������������������������������
����������������������������������������������������������������������������������������������������������������������������������������������������������������
2002 2003 2004 2005 2006 2007 2008 2009 20100
20
40
60
80
100
120
140
160
Year
�������������� Case A�������������� Case B
Figure 10On-Road National SO2 Reductions
Air Improvement Resource, Inc.
��������
������������������������������������������������������������������������
����������������������������������������
������������������������������������������������������������������������������������������������������������������������������������������������
������������������������������������������������������������������������������������������������������������������������������������������������
������������������������������������������������������������������������������������������������������������������������������������������������
��������������������������������������������������������������������������������������������������������������������������������������������������������
��������������������������������������������������������������������������������������������������������������������������������������������������������
���������������������������������������������������������������������������������������������������������������������������������������������������������������������������
�������������������������������������������������������������������������������������������������������������������������������������
��������������������������������������������������������������������������������������������������������������������������������������������������������
��������������������������������������������������������������������������������������������������������������������������������������������������������
��������������������������������������������������������������������������������������������������������������������������������������������������������
��������������������������������������������������������������������������������������������������������������������������������������������������������
����������������������������������������������������������������������������������������������������������������������������������������������������������������
����������������������������������������������������������������������������������������������������������������������������������������������������������������
����������������������������������������������������������������������������������������������������������������������������������������������������������������
����������������������������������������������������������������������������������������������������������������������������������������������������������������
2002 2003 2004 2005 2006 2007 2008 2009 20100
10
20
30
40
50
60
Year
�������������� Case A�������������� Case B
Figure 11On-Road National Total SO4 PM Reductions
Air Improvement Resource, Inc.
IndirectDirect

29
��������
����������������������������
���������������������������������������������
���������������������������������������������������������������������������������������������������������
����������������������������������������������������������������������������������������������������������������������������������������
������������������������������������������������������������������������������������������������������������������������
����������������������������������������������������������������������������������������������������������������������������������������
��������������������������������������������������������������������������������������������������������������������������������
������������������������������������������������������������������������������������������������������������������������������������������������
������������������������������������������������������������������������������������������������������������������������������������������������
������������������������������������������������������������������������������������������������������������������������������������������������
������������������������������������������������������������������������������������������������������������������������������������������������
��������������������������������������������������������������������������������������������������������������������������������������������������������
�������������������������������������������������������������������������������������������������������������������������������������
����������������������������������������������������������������������������������������������������������������������������������������������������������������
��������������������������������������������������������������������������������������������������������������������������������������������
2002 2003 2004 2005 2006 2007 2008 2009 20100
500
1,000
1,500
2,000
2,500
3,000
Year
�������������� Case A�������������� Case B
Figure 12Off-Road National SO2 Reductions
Air Improvement Resource, Inc.
��������
����������������������������
������������������������������������
��������������������������������������������������������������������������������������������������
������������������������������������������������������������������������������������������������������������������������
����������������������������������������������������������������������������������������������������������������
��������������������������������������������������������������������������������������������������������������������������������
��������������������������������������������������������������������������������������������������������������������������������
����������������������������������������������������������������������������������������������������������������������������������������
����������������������������������������������������������������������������������������������������������������������������������������
����������������������������������������������������������������������������������������������������������������������������������������
����������������������������������������������������������������������������������������������������������������������������������������
������������������������������������������������������������������������������������������������������������������������������������������������
������������������������������������������������������������������������������������������������������������������������������
��������������������������������������������������������������������������������������������������������������������������������������������������������
�������������������������������������������������������������������������������������������������������������������������������������
��������������������������������������������������������������������������������������������������������������������������������������������������������
�������������������������������������������������������������������������������������������������������������������������������������
2002 2003 2004 2005 2006 2007 2008 2009 20100
200
400
600
800
1,000
1,200
Year
�������������� Case A�������������� Case B
Figure 13On-Road National Total SO4 PM Reductions
Air Improvement Resource, Inc.
IndirectDirect

6.0 Conclusions
This analysis has shown that a low sulfur on-road and off-road diesel specification would result in significant reductions in SO2 and SO4 PM emission inventories. The reductions in PM inventories are probably greater than estimated here because of the low assumed reaction of SO2 to sulfate PM in this analysis. The PM reductions are certainly much greater in the summertime, when meteorological conditions favor much more rapid PM formation. Because sulfur oxides from diesel engines are emitted relatively close to the ground (compared to stationary sources), the reductions in SO2 and fine sulfate PM inventories should result in lower ambient fine PM levels, improved visibility, and reduced human exposure to these pollutants. Finally, reducing diesel sulfur levels would improve EGR system life in diesel engines, reduce engine wear and maintenance costs, and allow for commercial application of more advanced diesel aftertreatment control devices.
30

7.0 References
1. EPA’s MOBILE5 Model.
2. AIR derived this figure from AAMA’s 1996 Annual Fuel Survey data.
3. EPA’s Draft NONROAD Model.
4. “Draft User’s Guide to PART5: A Program For Calculating Particle Emissions From Motor Vehicles,” Office of Mobile Sources, EPA, February 1995.
5. Conversation with Lois Platte, U.S. EPA, OMS, March 3, 1999.
6. “Regulatory Impact Analysis: Control of Sulfur and Aromatic Content of On-Highway Diesel Fuel,” EPA Publication 420-R-90-103, U. S. EPA, Office of Air and Radiation, Office of Mobile Sources, June 1990.
7. “Methodology for Estimating Emissions From On-Road Vehicles, Volume IV: BURDEN7G,” ARB, November 1996.
8. “Exhaust Emission Factors for Nonroad Engine Modeling – Compression Ignition,” Report No. NR–009A, EPA, revised June 15, 1998.
9. “On-Highway Emission Benefits of Vehicle and Fuel Controls in Ontario,” AIR Report for Canadian Vehicle Manufacturers Association, February 12, 1996.
10. “Nationwide and State-by-State Emission Benefits of a Gasoline Sulfur Limit,” AIR, AWMA, December 1998.
11. “Comparison of Emission Benefits of AAMA and API Sulfur Proposals in the U.S.: Summary Tables,” AIR for AIAM, December 1998.
31