natural disaster data booknatural disaster data … disaster data booknatural disaster data book...
TRANSCRIPT

Natural Disaster Data BookNatural Disaster Data Book2009 (An Analytical Overview)
Asian Disaster Reduction Center
courtesy of the U.S. Geological Survey

Copyright(C) 2011 ADRC All Rights Reserved

ADRC Natural Disasters Data Book 2009
Overview The Asian Disaster Reduction Center (ADRC) Natural Disasters Data Book 2009 provides the statistical perspectives in figures and tables for 2009 as well as for the period 1975-2009 based on data obtained by EM-DAT. According to EM-DAT, 399 natural disasters occurred in 2009 worldwide, killing almost 16,000 people and affecting over 220 million people. The estimated amount of economic damage came close to US$50 billion. By region, Asia is the highest in all the indices: in disaster occurrences, Asia accounts for 35.8 percent; number of people killed, 52.1 percent; total number of affected people, 78.3 percent; and amount of economic damage, 44.9 percent. Worldwide disaster trends in composition of indices and top shares of impacts vary by disaster type. For instance, flood made up the largest share of 37.8 percent of all disaster occurrences; epidemic, 30.5 percent of total number of people killed; drought, 49.0 percent of total affected people; and storm, 53.0 percent of total amount of economic damage. Within Asia, the indices show similar trends except in the category of fatality which is led by storm-related disasters with a share of 34.0 percent. Typhoon Ketsana alone caused 715 deaths and affected a total of more than 7.5 million people across 4 countries—the Philippines, Viet Nam, Cambodia and Lao P.D.R. Total economic damage exceeded US$1.1 billion. In addition, Typhoon Morakot wrecked havoc in the Philippines, Taiwan, and China, killing 664, affecting a total of over 13 million people and costing about US$1.7 billion in economic damage. Another major disaster in Asia includes the September earthquake in Sumatra, Indonesia, which killed 1,195 people, affected a total of over 2.5 million people and caused around US$2.2 billion worth of economic damage. Data Book 2009 also contains tables of the 25 worst disasters by number of people killed and total affected people, economic damage, and their respective ratios to population and gross domestic product. It also includes tables of 2009 disasters in ADRC member and other Asian countries sorted by country and disaster type.
[Notes] Source: All the data are based on EM-DAT: The OFDA/CRED International Disaster Database – www.emdat.be, Université Catholique de Louvain, Brussels (Belgium), unless otherwise stated. EM-DAT Criteria: For a disaster to be entered into the database, at least one of the following criteria must be fulfilled: Ten (10) or more people reported killed Hundred (100) or more people reported
affected Declaration of a state of emergency Call for international assistance.
Data: “0” (zero) in tables reflect the EM-DAT database, which originally records them as zeros. “Total affected people” are the sum of injured, homeless, and affected. EM-DAT defines affected people as people requiring immediate assistance during a period of emergency; it can also include displaced or evacuated people. Disaster Terms: “Earthquake or seismic activity” includes ground shaking and tsunami. “Epidemic” includes bacterial and viral infectious diseases. “Extreme Temperature” includes heat wave, cold wave, and extreme winter conditions. “Flood” includes general flood, and flash flood. “Mass Movement” includes avalanche, landslide, and rockfall. “Storm” includes local storm, tropical cyclone, and winter storm. “Volcano” means volcanic eruption. “Wildfire” includes bush/brush fire, forest fire, and scrub/grassland fire. Sub-regions in Asia: Central Asia is composed of Kazakhstan, Kyrgyzstan, Tajikistan, Turkmenistan, and Uzbekistan Eastern Asia is composed of China P Rep, Hong Kong (China), Japan, Korea Dem P Rep, Korea Rep, Macau, Mongolia, and Taiwan (China)

ADRC Natural Disasters Data Book 2009
South-Eastern Asia is composed of Brunei Darussalam, Cambodia, Indonesia, Lao P Dem Rep, Malaysia, Myanmar, Philippines, Singapore, Thailand, Timor-Leste, and Viet Nam Southern Asia is composed of Afghanistan, Bangladesh, Bhutan, India, Iran Islam Rep, Maldives, Nepal, Pakistan, and Sri Lanka Western Asia is composed of Armenia, Azerbaijan, Bahrain, Cyprus, Georgia, Iraq, Israel, Jordan, Kuwait, Lebanon, Oman, Palestine (West Bank), Qatar, Saudi Arabia, Syrian Arab Rep, Turkey, United Arab Emirates, Yemen, Yemen Arab Rep, and Yemen P Dem Rep
To access the ADRC Natural Disaster Data Book 2009 online, log onto: http://www.adrc.asia/publications/databook/DB2009.html
For inquiries, please contact [email protected].

ADRC Natural Disasters Data Book 2009
Table of Contents Page
1. Impacts of Natural Disasters by Region, 2009 1
2. Impacts of Natural Disasters by Disaster Type, 2009 2
3. Impacts of Natural Disasters in Asia by Disaster Type, 2009 3
4. Trends of World Natural Disasters, 1975-2009 4
5. Impacts of World Natural Disasters by Region, 1975-2009 8
6. Impacts of Natural Disasters in Asia by Sub-Region in 2009 9
7. The 25 Worst Disasters in Asia by Number of People Killed, 2009 10
8. The 25 Worst Disasters in Asia by Number of People Killed per Million Population, 2009 11
9. The 25 Worst Disasters in Asia by Total Number of People Affected, 2009 12
10. The 25 Worst Disasters in Asia by Total Affected People per Thousand Population, 2009 13
11. The 25 Worst Disasters in Asia by Economic Damage, 2009 14
12. The 25 Worst Disasters in Asia by Ratio of Economic Damage to GDP, 2009 15
13. Disasters in Asia by Country, 2009 16
14. Disasters in Asia by Disaster Type, 2009 17
ADRC Natural Disasters Data Book 2009
1
1. Impacts of Natural Disasters by Region, 2009
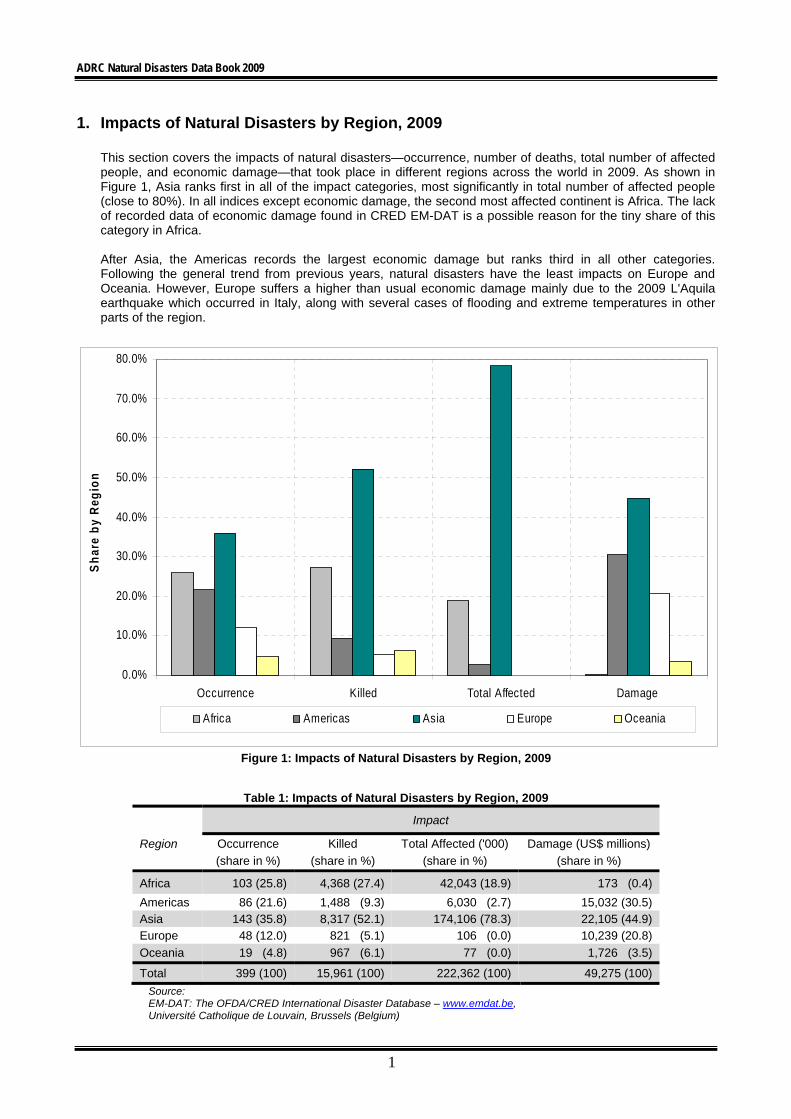
This section covers the impacts of natural disasters—occurrence, number of deaths, total number of affected people, and economic damage—that took place in different regions across the world in 2009. As shown in Figure 1, Asia ranks first in all of the impact categories, most significantly in total number of affected people (close to 80%). In all indices except economic damage, the second most affected continent is Africa. The lack of recorded data of economic damage found in CRED EM-DAT is a possible reason for the tiny share of this category in Africa. After Asia, the Americas records the largest economic damage but ranks third in all other categories. Following the general trend from previous years, natural disasters have the least impacts on Europe and Oceania. However, Europe suffers a higher than usual economic damage mainly due to the 2009 L'Aquila earthquake which occurred in Italy, along with several cases of flooding and extreme temperatures in other parts of the region.
0.0%
10.0%
20.0%
30.0%
40.0%
50.0%
60.0%
70.0%
80.0%
Occurrence Killed Total Affected Damage
Sh
are
by
Reg
ion
Africa Americas Asia Europe Oceania
Figure 1: Impacts of Natural Disasters by Region, 2009
Table 1: Impacts of Natural Disasters by Region, 2009
Impact
Region Occurrence Killed Total Affected ('000) Damage (US$ millions)
(share in %) (share in %) (share in %) (share in %)
Africa 103 (25.8) 4,368 (27.4) 42,043 (18.9) 173 (0.4)
Americas 86 (21.6) 1,488 (9.3) 6,030 (2.7) 15,032 (30.5) Asia 143 (35.8) 8,317 (52.1) 174,106 (78.3) 22,105 (44.9) Europe 48 (12.0) 821 (5.1) 106 (0.0) 10,239 (20.8)
Oceania 19 (4.8) 967 (6.1) 77 (0.0) 1,726 (3.5)
Total 399 (100) 15,961 (100) 222,362 (100) 49,275 (100)
Source: EM-DAT: The OFDA/CRED International Disaster Database – www.emdat.be, Université Catholique de Louvain, Brussels (Belgium)

ADRC Natural Disasters Data Book 2009
2
2. Impacts of Natural Disasters by Disaster Type, 2009
This section provides the breakdown of impacts of disasters sorted by disaster type. As Figure 2 shows, although the same dominant disaster type cannot be witnessed in all impact categories, flood and storm are generally prevalent by consistently being in the top three places. Flood (37.8%), epidemic (30.5%), drought (49.0%) and storm (53.0%) rank number one in impact categories of occurrence, killed, total affected and damage, respectively.
0.0%
10.0%
20.0%
30.0%
40.0%
50.0%
60.0%
Occurrence Killed Total Affected Damage
Sh
are
by
Dis
as
ter
Ty
pe
Drought Earthquake Epidemic Extreme temperature Flood Insect Infestation Mass Movement Storm Volcano Wildf ire
Figure 2: Impacts of Natural Disasters by Disaster Type, 2009
Table 2: Impacts of Natural Disasters by Disaster Type, 2009
Impact
Disaster Type Occurrence Killed Total Affected ('000) Damage (US$ millions)
(share in %) (share in %) (share in %) (share in %)
Drought 30 (7.5) 4 (0.0) 108,946 (49.0) 6246 (12.7)
Earthquake 22 (5.5) 1,888 (11.8) 3,221 (1.4) 6059 (12.3)
Epidemic 43 (10.8) 4,875 (30.5) 492 (0.2) 0 (0.0)
Extreme Temperature 24 (6.0) 1,370 (8.6) 856 (0.4) 1162 (2.4)
Flood 151 (37.8) 3,654 (22.9) 57,659 (25.9) 8004 (16.2)
Insect Infestation 1 (0.3) 0 (0.0) 500 (0.2) 0 (0.0)
Mass Movement 30 (7.52) 693 (4.3) 47 (0.0) 154 (0.3)
Storm 87 (21.8) 3,287 (20.6) 50,583 (23.0) 26135 (53.0)
Volcano 2 (0.5) 0 (0.0) 48 (0.0) 0 (0.0)
Wildfire 9 (2.3) 190 (1.2) 12 (0.0) 1515 (3.1)
Total 368 (100) 15,268 (100) 222,364 (100) 49,275 (100)
Source: EM-DAT: The OFDA/CRED International Disaster Database – www.emdat.be, Université Catholique de Louvain, Brussels (Belgium)

ADRC Natural Disasters Data Book 2009
3
3. Impacts of Natural Disasters in Asia by Disaster Type, 2009
This section provides the overview of impacts of disasters sorted by disaster type in Asia. As depicted in Figure 3, the three most predominant disaster types in general are flood, storm and drought. Flood is the most frequent with a share of more than 35 percent compared to other disasters. Storm ranks first in the number of deaths and economic damage, while drought, with a share of close to 40 percent, leads in total number of affected people. The share of deaths caused by earthquake in Asia (16.4%) is slightly high compared to that in the world (11.8%).
0.0%
5.0%
10.0%
15.0%
20.0%
25.0%
30.0%
35.0%
40.0%
Occurrence Killed Total Affected Damage (USD$ millions)
Sh
are
by
Dis
aste
r T
ype
Drought Earthquake Epidemic Extreme temperature Flood Mass Movement Storm Volcano
Figure 3: Impacts of Natural Disasters by Disaster Type in Asia, 2009
Table 3: Impacts of Natural Disasters by Disaster Type in Asia, 2009
Impact
Disaster Type Occurrence Killed Total Affected ('000) Damage (US$ millions) (share in %) (share in %) (share in %) (share in %)
Drought 8 (5.6) 0 (0.0) 67,463 (38.7) 5,918 (26.8)Earthquake 13 (9.1) 1,365 (16.4) 2,957 (1.7) 3,099 (14.0)Epidemic 3 (2.1) 971 (11.7) 95 (0.1) 0 (0.0)Extreme Temperature 4 (2.8) 278 (3.3) 819 (0.5) 62 (0.3)Flood 52 (36.4) 2,461 (29.6) 52,532 (30.2) 5,367 (24.3)Mass Movement 19 (13.3) 417 (5.0) 12 (0.0) 139 (0.6)Storm 43 (30.1) 2,825 (34.0) 50,182 (28.8) 7,519 (34.0)Volcano 1 (0.7) 0 (0.0) 47 (0.0) 0 (0.0)
Total 143 (100) 15,268 (100) 174,107 (100) 22,104 (100)
Source: EM-DAT: The OFDA/CRED International Disaster Database – www.emdat.be, Université Catholique de Louvain, Brussels (Belgium)

ADRC Natural Disasters Data Book 2009
4
4. Trends of World Natural Disasters, 1975-2009
In terms of number of disasters, the year 2009 has a slight increase from the previous year 2008. The upward shift of disaster occurrence’s trend continues from the end of the 1990s, which is clearly depicted in the collective 5-year period representation of data in Figure 4-2.
0
100
200
300
400
500
600
19
75
19
77
19
79
19
81
19
83
19
85
19
87
19
89
19
91
19
93
19
95
19
97
19
99
20
01
20
03
20
05
20
07
20
09
Year
No
. of
Dis
as
ters
Figure 4-1: Disaster Occurrence, 1975-2009
0
500
1000
1500
2000
2500
75-'79 80-'84 85-'89 90-'94 95-'99 00-'04 04-'09
5 Year Period
No
. of
Dis
as
ters
Figure 4-2: Disaster Occurrence (5-year period), 1975-2009
Source: EM-DAT: The OFDA/CRED International Disaster Database – www.emdat.be, Université Catholique de Louvain, Brussels (Belgium)

ADRC Natural Disasters Data Book 2009
5
4. Trends of World Natural Disasters, 1975-2009 (continued)
The year 2009 is among the years with the lowest number of recorded fatalities caused by natural disasters during the period 1975-2009. In comparison to 2008, 2009 witnesses a drastic reduction in the impact category of number of people killed. For the 5-year period analysis, the first half of the current decade in the 21st century closely matches the second half, with the number of people killed at approximately 400,000 in each period.
0
100,000
200,000
300,000
400,000
500,000
600,000
1975
1977
1979
1981
1983
1985
1987
1989
1991
1993
1995
1997
1999
2001
2003
2005
2007
2009
Year
No. o
f P
eople
Kill
ed
Figure 4-3: Number of People Killed, 1975-2009
0
100,000
200,000
300,000
400,000
500,000
600,000
75-'79 80-'84 85-'89 90-'94 95-'99 00-'04 04-'09
5 Year Period
No
. of
Pe
op
le K
ille
d
Figure 4-4: Number of People Killed (5-year period), 1975-2009
Source: EM-DAT: The OFDA/CRED International Disaster Database – www.emdat.be, Université Catholique de Louvain, Brussels (Belgium)

ADRC Natural Disasters Data Book 2009
6
4. Trends of World Natural Disasters, 1975-2009 (continued)
In terms of total number of affected people, 2009 sees a somewhat higher figure compared with 2008. For the 5 year period representation of data, it is evident that the total number of affected people in the second half of the current decade is noticeably lower than the first. The total number of affected people for the period 2000-2004 is the highest during the extended period of 1975-2009. As shown in Figure 4-6, there is a general upward trend from 1975 to 2009.
0
100
200
300
400
500
600
700
1975
1977
1979
1981
1983
1985
1987
1989
1991
1993
1995
1997
1999
2001
2003
2005
2007
2009
Year
No. o
f Tota
l Aff
ecte
d P
eople
(m
illio
ns)
Figure 4-5: Total Number of Affected People, 1975-2009
0.00
200.00
400.00
600.00
800.00
1000.00
1200.00
1400.00
1600.00
75-'79 80-'84 85-'89 90-'94 95-'99 00-'04 04-'09
5 Year Period
To
tal A
ffe
cte
d p
eo
ple
(m
illio
ns
)
Figure 4-6: Total Number of Affected People (5 year period), 1975-2009
Source: EM-DAT: The OFDA/CRED International Disaster Database – www.emdat.be, Université catholique de Louvain, Brussels (Belgium)

ADRC Natural Disasters Data Book 2009
7
4. Trends of World Natural Disasters, 1975-2009 (continued)
Economic damage caused by natural disasters in 2009 (approximately US$50 billion) is significantly lower than that in 2008. Three of the worst five years in the period of interest, 1975-2009, can be found in the 21st century (2004, 2005, and 2009). For the 5-year period analysis, the second half of the current decade records the largest amount of damage in the period 1975-2009.
0
20,000
40,000
60,000
80,000
100,000
120,000
140,000
160,000
180,000
200,000
1975
1977
1979
1981
1983
1985
1987
1989
1991
1993
1995
1997
1999
2001
2003
2005
2007
2009
Year
Dam
age
(US
$ m
illi
on
s)
Figure 4-7: Amount of Damage, 1975-2009
0
100,000
200,000
300,000
400,000
500,000
600,000
75-'79 80-'84 85-'89 90-'94 95-'99 00-'04 04-'09
5 Year Period
Dam
age
(US
$ m
illio
ns)
Figure 4-8: Amount of Damage (5-year period), 1975-2009
Source: EM-DAT: The OFDA/CRED International Disaster Database – www.emdat.be, Université Catholique de Louvain, Brussels (Belgium)

ADRC Natural Disasters Data Book 2009
8
5. Impacts of World Natural Disasters by Region, 1975-2009
For the period 1975-2009, Asia dominates and ranks first in all natural disaster’s impact categories across regions of the world. This is similar of the trend for 2009.
0%
10%
20%
30%
40%
50%
60%
70%
80%
90%
100%
Occurrence Killed Total Af fected Damage (US$)
Sh
are
by R
eg
ion
Africa Americas Asia Europe Oceania
Figure 5: Impacts of World Natural Disasters by Region, 1975-2009
Table 4: Impacts of Natural Disasters by Region, 1975-2009
Impact
Region Occurrence Killed (‘000)
Total Affected (in millions)
Damage (US$ millions)
(share in %) (share in %) (share in %) (share in %)
Africa 2,062 (20.6) 722 (29.0) 468 (7.7) 20,571 (1.3)
Americas 2,277 (22.8) 187 (7.5) 192 (3.2) 543,509 (34.6) Asia 3,727 (37.3) 1,522 (61.0) 5,399 (88.3) 734,670 (46.7) Europe 1,328 (13.3) 56 (2.3) 32 (0.5) 242,208 (15.4)
Oceania 601 (6.0) 6 (0.2) 20 (0.3) 31,988 (2.0)
Total 9,995 (100) 2,493 (100) 6,112 (100) 1,572,946 (100)
Source: EM-DAT: The OFDA/CRED International Disaster Database – www.emdat.be, Université Catholique de Louvain, Brussels (Belgium)

ADRC Natural Disasters Data Book 2009
9
6. Impacts of Natural Disasters in Asia by Sub-Region in 2009 As shown in Figure 5-1, the number of people killed by floods and storms are relatively high in 2009 in each sub-region of Asia. Many of sub-regions experienced rather large scale of floods and storms, such as Typhoon Morakot in Taiwan (China) and Flood in Mongolia in Eastern Asia, and Flood in India in Southern Asia. Figure 5-2 shows that the number of people affected by storms is comparatively high in 2009 in South-eastern Asia and Southern Asia. In Eastern Asia, West Asia and Central Asia, the number of people affected by drought is relatively high in 2009.
0%
20%
40%
60%
80%
100%
Eastern Asia 1975‐2008
Eastern Asia 2009
South‐Eastern Asia 1975‐2008
South‐Eastern Asia 2009
Southern Asia 1975‐2008
Southern Asia 2009
West Asia 1975‐2008
West Asia 2009
Central Asia 1975‐2008
Central Asia 2009
Drought Earthquake (seismic activity) Epidemic Extreme temperature
Flood Insect infestation Mass movement Storm
Volcano Wildfire Figure 5-1: Share of Number of Deaths by Disaster Type in Sub-Regions of Asia
0%
20%
40%
60%
80%
100%
Eastern Asia 1975‐2008
Eastern Asia 2009
South‐Eastern Asia 1975‐
2008
South‐Eastern Asia 2009
Southern Asia 1975‐2008
Southern Asia 2009
West Asia 1975‐2008
West Asia 2009
Central Asia 1975‐2008
Central Asia 2009
Drought Earthquake (seismic activity) Epidemic Extreme temperature
Flood Insect infestation Mass movement Storm
Volcano Wildfire
Figure 5-2: Share of Number of Affected by Disaster Type in Sub-Regions of Asia
Source: EM-DAT: The OFDA/CRED International Disaster Database – www.emdat.be, Université Catholique de Louvain, Brussels (Belgium)

ADRC Natural Disasters Data Book 2009
10
7. The 25 Worst Disasters in Asia by Number of People Killed, 2009
The earthquake that occurred in Sumatra, Indonesia on 30 September tops the list of number of people killed, with 1,195 deaths reported. In a different region (Bandung) of Indonesia, an earthquake also led to fatalities in the same month, taking the rank of 14. The second and third places are occupied by flood in India and storm in Taiwan (China), respectively. From the top 25 list, on the whole, disaster types with the greatest fatality impact are storm and flood. Countries most represented in the list are India, China and the Philippines.
Table 4: The 25 Worst Disasters in Asia by Number of People Killed, 2009
Rank Disaster Type Country Date
Started Killed
Total Affected
Damage (US$ millions)
1 Earthquake Indonesia 30-Sep 1,195 2,501,798 2,200
2 Flood India Jul 992 1,886,000 220
3 Storm Taiwan (China) 7-Aug 630 2,307,523 250
4 Storm Philippines 29-Sep 512 4,478,491 585
5 Storm (Ketsana) Philippines 24-Sep 501 4,901,763 237
6 Epidemic Sri Lanka Jan 346 35,007 0
7 Epidemic Nepal 1-May 314 58,874 0
8 Epidemic India Jan 311 1,521 0
9 Flood India 25-Sep 300 2,000,000 2,150
10 Storm Bangladesh 25-May 190 3,935,341 270
11 Storm (Ketsana) Viet Nam 28-Sep 182 2,477,315 785
12 Flood Saudi Arabia 24-Nov 161 10,000 900
13 Extreme Temperature Bangladesh 15-Dec 135 50,000 0
14 Earthquake Indonesia 2-Sep 128 339,792 160
15 Storm Viet Nam 2-Nov 124 500,145 280
16 Extreme Temperature India 14-Apr 120 25 0
17 Storm India 25-May 96 5,100,000 0
18 Flood China P. Rep. 1-Jul 90 39,372,000 1,000
19 Flood Nepal 4-Oct 87 257,786 60
20 Storm Philippines 7-May 77 401,007 30
21 Flood India 3-Nov 70 8 64
22 Mass Movement China P. Rep. 5-June 65 0 0
23 Flood Indonesia 26-Mar 64 1,600 0
24 Mass Movement China P. Rep. 14-Jul 54 10,004 139
25 Storm China P. Rep. 3-June 52 215 625
Source: EM-DAT: The OFDA/CRED International Disaster Database – www.emdat.be, Université Catholique de Louvain, Brussels (Belgium)

ADRC Natural Disasters Data Book 2009
11
8. The 25 Worst Disasters in Asia by Number of People Killed per Million
Population, 2009
Using the index of the ratio of the number of people killed to total country population, Typhoon Morakot, which hit Taiwan (China) in August, takes the first place. In addition, storm dominates the list with 10 incidences in 7 different countries. It is also worth noting that storm fatalities—which occurred in the Philippines on 24 September (9th rank), Viet Nam, 28 September (14th rank), Cambodia, 29 September (20th rank), and Lao People’s Democratic Republic, 1 October (13th rank)—were the works of Typhoon Ketsana alone.
Table 5: The 25 Worst Disasters in Asia by Number of People Killed per Million Population, 2009
Rank Disaster Type Country Date
StartedKilled
*Population ('000s)
Killed (per million)
1 Storm Taiwan (China) 7-Aug 630 **23,330 27.00
2 Storm Bhutan 25-May 12 697 17.21
3 Epidemic Sri Lanka Jan 346 20,303 17.04
4 Earthquake Bhutan 21-Sep 11 697 15.77
5 Epidemic Nepal 1-May 314 29,331 10.71
6 Flood Mongolia 16-Jul 26 2,671 9.73
7 Flood Saudi Arabia 24-Nov 161 25,391 6.34
8 Storm Philippines 29-Sep 512 91,983 5.57
9 Storm (Ketsana) Philippines 24-Sep 501 91,983 5.45
10 Earthquake Indonesia 30-Sep 1,195 229,965 5.20
11 Flood Tajikistan 21-Apr 21 6,952 3.02
12 Flood Nepal 4-Oct 87 29,331 2.97
13 Storm (Ketsana) Lao P. Dem. Rep. 1-Oct 16 6,320 2.53
14 Storm (Ketsana) Viet Nam 28-Sep 182 87,280 2.09
15 Extreme Temperature Mongolia Dec 5 2,671 1.87
16 Flood Lao P. Dem. Rep. 10-Aug 10 6,320 1.58
17 Storm Viet Nam 2-Nov 124 87,280 1.42
18 Flood Afghanistan 25-Mar 39 29,803 1.31
19 Storm Bangladesh 25-May 190 162,221 1.17
20 Storm (Ketsana) Cambodia 29-Sep 17 14,805 1.15
21 Flood Nepal 26-Jul 30 29,331 1.02
22 Flood India Jul 992 1,155,348 0.86
23 Storm Philippines 7-May 77 91,983 0.84
24 Extreme Temperature Bangladesh 15-Dec 135 162,221 0.83
25 Earthquake Afghanistan 17-Apr 22 29,803 0.74
Source: EM-DAT: The OFDA/CRED International Disaster Database – www.emdat.be, Université Catholique de Louvain, Brussels (Belgium) *Data from World Bank 2008; **Data from IMF World Economy Outlook Database

ADRC Natural Disasters Data Book 2009
12
9. The 25 Worst Disasters in Asia by Total Number of People Affected, 2009
In terms of total number of people affected, the drought in China that occurred in October ranks first with 60 million affected people. China dominates the list with 8 incidences, occupying all the top 5 places. Again, flood and storm are the most dominant in terms of incidence in the list, affecting China, India, the Philippines, Bangladesh, and Viet Nam. The other disaster types that make the list are earthquake in Indonesia (11th rank) and extreme temperature due to cold wave in Mongolia (21st rank).
Table 6: The 25 Worst Disasters in Asia by Total Number of People Affected, 2009
Rank Disaster Type Country Date
StartedKilled
Total Affected
Damage (US$ millions)
1 Drought China P. Rep. Oct 0 60,000,000 5,684
2 Flood China P. Rep. 1-Jul 90 39,372,000 1,000
3 Storm China P. Rep. 9-Aug 8 11,000,004 1,416
4 Storm China P. Rep. 9-Nov 41 10,000,096 1,030
5 Flood China P. Rep. 1-Apr 49 5,630,000 0
6 Storm India 25-May 96 5,100,000 0
7 Storm (Ketsana) Philippines 24-Sep 501 4,901,763 237
8 Storm Philippines 29-Sep 512 4,478,491 585
9 Storm Bangladesh 25-May 190 3,935,341 270
10 Drought China P. Rep. Nov 0 3,700,000 234
11 Earthquake Indonesia 30-Sep 1,195 2,501,798 2,200
12 Storm (Ketsana) Viet Nam 28-Sep 182 2,477,315 785
13 Storm Taiwan (China) 7-Aug 630 2,307,523 250
14 Flood India 25-Sep 300 2,000,000 2,150
15 Drought Kyrgyzstan - 0 2,000,000 0
16 Flood India Jul 992 1,886,000 220
17 Drought Syrian Arab Rep. - 0 1,300,000 0
18 Storm China P. Rep. 11-Nov 0 1,197,799 20
19 Storm China P. Rep. 14-Sep 13 1,000,058 295
20 Storm Philippines 28-Oct 39 802,175 15
21 Extreme Temperature Mongolia Dec 5 769,113 62
22 Flood Viet Nam 3-Jul 20 700,000 0
23 Flood Philippines 2-Jan 33 537,991 6
24 Flood Philippines 4-Jul 22 505,102 23
25 Storm Viet Nam 2-Nov 124 500,145 280
Source: EM-DAT: The OFDA/CRED International Disaster Database – www.emdat.be, Université Catholique de Louvain, Brussels (Belgium)
ADRC Natural Disasters Data Book 2009
13
10. The 25 Worst Disasters in Asia by Total Affected People per Thousand
Population, 2009
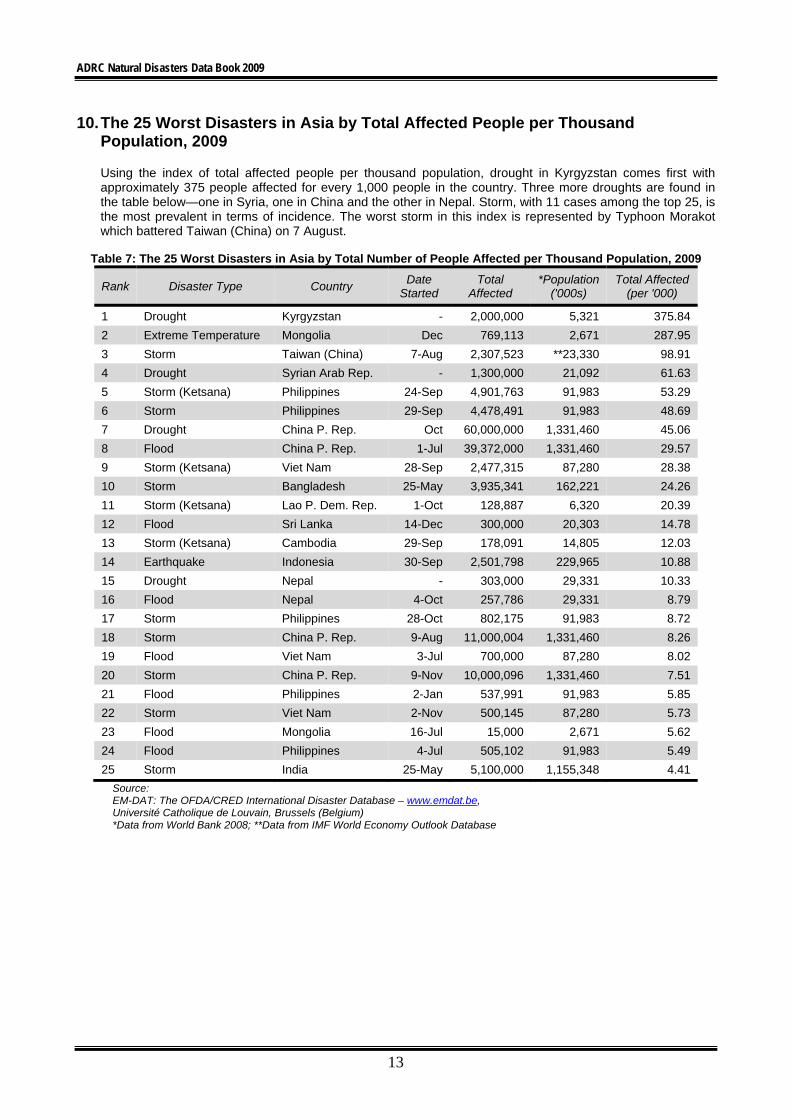
Using the index of total affected people per thousand population, drought in Kyrgyzstan comes first with approximately 375 people affected for every 1,000 people in the country. Three more droughts are found in the table below—one in Syria, one in China and the other in Nepal. Storm, with 11 cases among the top 25, is the most prevalent in terms of incidence. The worst storm in this index is represented by Typhoon Morakot which battered Taiwan (China) on 7 August.
Table 7: The 25 Worst Disasters in Asia by Total Number of People Affected per Thousand Population, 2009
Rank Disaster Type Country Date
StartedTotal
Affected *Population
('000s) Total Affected
(per '000)
1 Drought Kyrgyzstan - 2,000,000 5,321 375.84
2 Extreme Temperature Mongolia Dec 769,113 2,671 287.95
3 Storm Taiwan (China) 7-Aug 2,307,523 **23,330 98.91
4 Drought Syrian Arab Rep. - 1,300,000 21,092 61.63
5 Storm (Ketsana) Philippines 24-Sep 4,901,763 91,983 53.29
6 Storm Philippines 29-Sep 4,478,491 91,983 48.69
7 Drought China P. Rep. Oct 60,000,000 1,331,460 45.06
8 Flood China P. Rep. 1-Jul 39,372,000 1,331,460 29.57
9 Storm (Ketsana) Viet Nam 28-Sep 2,477,315 87,280 28.38
10 Storm Bangladesh 25-May 3,935,341 162,221 24.26
11 Storm (Ketsana) Lao P. Dem. Rep. 1-Oct 128,887 6,320 20.39
12 Flood Sri Lanka 14-Dec 300,000 20,303 14.78
13 Storm (Ketsana) Cambodia 29-Sep 178,091 14,805 12.03
14 Earthquake Indonesia 30-Sep 2,501,798 229,965 10.88
15 Drought Nepal - 303,000 29,331 10.33
16 Flood Nepal 4-Oct 257,786 29,331 8.79
17 Storm Philippines 28-Oct 802,175 91,983 8.72
18 Storm China P. Rep. 9-Aug 11,000,004 1,331,460 8.26
19 Flood Viet Nam 3-Jul 700,000 87,280 8.02
20 Storm China P. Rep. 9-Nov 10,000,096 1,331,460 7.51
21 Flood Philippines 2-Jan 537,991 91,983 5.85
22 Storm Viet Nam 2-Nov 500,145 87,280 5.73
23 Flood Mongolia 16-Jul 15,000 2,671 5.62
24 Flood Philippines 4-Jul 505,102 91,983 5.49
25 Storm India 25-May 5,100,000 1,155,348 4.41
Source: EM-DAT: The OFDA/CRED International Disaster Database – www.emdat.be, Université Catholique de Louvain, Brussels (Belgium) *Data from World Bank 2008; **Data from IMF World Economy Outlook Database

ADRC Natural Disasters Data Book 2009
14
11. The 25 Worst Disasters in Asia by Economic Damage, 2009
In the category of economic damage, the drought in China that took place in October again tops the list with damage amounting to approximately US$5.68 billion. Taking second place is the earthquake in Indonesia which struck Sumatra on 30 September, bringing about US$2.2 billion in economic damage. China, with 10 incidences on the list, is the worst affected country in this impact category of economic damage. In terms of disaster type, once more, storm is the most dominant, appearing 12 times on the list and affecting 7 countries. Flood and storm together occupy 18 of the top 25 places. There are a total of 4 incidences of earthquake which occurred in Indonesia, Japan, and China. Mass movement (landslide) in China ranks 25th in this index.
Table 8: The 25 Worst Disasters in Asia by Economic Damage, 2009
Rank Disaster Type Country Date
Started Killed
Total Affected
Damage (US$ millions)
1 Drought China P. Rep. Oct 0 60,000,000 5,6842 Earthquake Indonesia 30-Sep 1,195 2,501,798 2,2003 Flood India 25-Sep 300 2,000,000 2,1504 Storm China P. Rep. 9-Aug 8 11,000,004 1,4165 Storm China P. Rep. 9-Nov 41 10,000,096 1,0306 Flood China P. Rep. 1-Jul 90 39,372,000 1,0007 Storm Japan 7-Oct 4 5,119 1,0008 Flood Saudi Arabia 24-Nov 161 10,000 9009 Storm (Ketsana) Viet Nam 28-Sep 182 2,477,315 78510 Storm China P. Rep. 3-Jun 52 215 62511 Storm Philippines 29-Sep 512 4,478,491 58512 Flood Turkey 7-Sep 40 35,020 55013 Earthquake Japan 11-Aug 1 25,319 40014 Earthquake China P. Rep. 9-Jul 1 65,336 31515 Storm India 11-Nov 20 0 30016 Storm China P. Rep. 14-Sep 13 1,000,058 29517 Flood China P. Rep. 7-Jun 16 0 28118 Storm Viet Nam 2-Nov 124 500,145 28019 Storm Bangladesh 25-May 190 3,935,341 27020 Storm Taiwan (China) 7-Aug 630 2,307,523 25021 Storm (Ketsana) Philippines 24-Sep 501 4,901,763 23722 Drought China P. Rep. Nov 0 3,700,000 23423 Flood India Jul 992 1,886,000 22024 Earthquake Indonesia 2-Sep 128 339,792 16025 Mass Movement China P. Rep. 14-Jul 54 10,004 139
Source: EM-DAT: The OFDA/CRED International Disaster Database – www.emdat.be, Université Catholique de Louvain, Brussels (Belgium)

ADRC Natural Disasters Data Book 2009
15
12. The 25 Worst Disasters in Asia by Ratio of Economic Damage to GDP, 2009
In terms of economic damage incurred relative to gross domestic product (GDP), Typhoon Ketsana that hit Lao People’s Democratic Republic tops the list, accounting for 1.83 percent of GDP of Laos. In the second place, extreme temperature due to cold wave in Mongolia resulted in damage worth 1.18 percent of its GDP. The rest of the disasters on the top 25 list account for less than 1 percent of the respective country’s GDP. The most common form of disaster, which can be found on the list, is again storm, with a total of 13 incidences. With 8 incidences, flood is the second most prevalent.
Table 9: The 25 Worst Disasters in Asia by Ratio of Economic Damage to GDP, 2009
Rank Disaster Type Country Date
Started Damage
(US$ millions)*GDP
(US$ billions) Damage
(as % of GDP)
1 Storm (Ketsana) Lao P. Dem. Rep. 1-Oct 100 5.47 1.83
2 Extreme temperature Mongolia Dec 62 5.26 1.18
3 Storm (Ketsana) Viet Nam 28-Sep 785 81.27 0.97
4 Flood Nepal 4-Oct 60 12.61 0.48
5 Earthquake Indonesia 30-Sep 2,200 510.50 0.43
6 Storm Philippines 29-Sep 585 166.60 0.35
7 Storm Viet Nam 2-Nov 280 81.27 0.34
8 Storm Bangladesh 25-May 270 79.55 0.34
9 Flood Saudi Arabia 24-Nov 900 475.09 0.19
10 Flood Afghanistan 25-Mar 20 1,214.21 0.18
11 Flood India 25-Sep 2,150 11.76 0.17
12 Storm (Ketsana) Philippines 24-Sep 237 166.60 0.14
13 Drought China P. Rep. Oct 5,684 4,521.83 0.13
14 Flood Turkey 7-Sep 550 730.34 0.08
15 Storm Taiwan (China) 7-Aug 250 **402.69 0.06
16 Earthquake Indonesia 2-Sep 160 510.50 0.03
17 Storm China P. Rep. 9-Aug 1,416 4,521.83 0.03
18 Storm India 11-Nov 300 1,214.21 0.02
19 Storm China P. Rep. 9-Nov 1,030 4,521.83 0.02
20 Flood China P. Rep. 1-Jul 1,000 4,521.83 0.02
21 Storm Japan 7-Oct 1,000 4,886.97 0.02
22 Flood Tajikistan 21-Apr 1 5.13 0.02
23 Storm Philippines 7-May 30 166.60 0.02
24 Flood India Jul 220 1,214.21 0.02
25 Storm Philippines 29-Apr 26 166.60 0.02
Source: EM-DAT: The OFDA/CRED International Disaster Database – www.emdat.be, Université Catholique de Louvain, Brussels (Belgium) *Data from World Bank 2008; **Data from IMF World Economy Outlook Database

ADRC Natural Disasters Data Book 2009
16
13. Disasters in Asia by Country, 2009 Table 10. Disaster in Asia by Country, 2009
Country Disaster Type Occurrence Killed Total
Affected Damage
(US$ millions)
Afghanistan Earthquake 1 22 3,309 0
Flood 3 69 62,516 20.00
Mass Movement 1 10 32 0
Azerbaijan Flood 1 0 5,000 0Bangladesh Drought 1 0 0 0
Extreme Temperature 1 135 50,000 0
Flood 2 16 500,000 0 Storm 2 197 3,954,550 270.00
Bhutan Earthquake 1 11 12 0
Storm 1 12 0 0Cambodia Storm 2 19 178,091 0
China P. Rep. Drought 3 0 63,860,000 5,917.56
Earthquake 2 1 69,885 318.10 Flood 7 209 45,226,038 1,373.00
Mass Movement 5 196 10,022 139.00
Storm 10 169 23,296,806 3,601.45Georgia Earthquake 1 0 7,306 0
Hong Kong (China) Storm 1 0 350 0
India Drought 1 0 0 0 Epidemic 1 311 1,521 0
Extreme Temperature 1 120 25 0
Flood 6 1,445 3,886,008 2,434.00 Mass Movement 2 55 0 0
Storm 6 218 5,109,085 300.00
Indonesia Earthquake 5 1,330 2,850,364 2,381.00 Flood 5 126 26,804 0
Mass Movement 2 29 5 0
Iran Islam. Rep. Earthquake 1 0 269 0Iraq Flood 1 2 3,000 0
Japan Earthquake 1 1 25,319 400.00
Mass Movement 2 44 400 0 Storm 2 16 7,119 1,000.00
Kyrgyzstan Drought 1 0 2,000,000 0
Lao P. Dem. Rep. Flood 1 10 0 0 Storm 1 16 128,887 100.00
Malaysia Flood 2 0 10,875 0
Mongolia Extreme Temperature 1 5 769,113 62.00 Flood 1 26 15,000 0
Myanmar Mass Movement 1 24 1,351 0
Nepal Drought 1 0 303,000 0 Epidemic 1 314 58,874 0
Extreme Temperature 1 18 0 0
Flood 2 117 257,786 60.00 Mass Movement 1 10 0 0
Pakistan Flood 3 102 75,080 0
Philippines Earthquake 1 0 392 0.09 Flood 8 55 1,083,276 29.31
Mass Movement 1 10 16 0
Storm 14 1,242 12,221,663 932.70 Volcano 1 0 47,137 0
Saudi Arabia Flood 1 161 10,000 900.00
Sri Lanka Epidemic 1 346 35,007 0 Flood 3 3 380,000 0
Syria Drought 1 0 1,300,000 0
Taiwan (China) Storm 1 630 2,307,523 250.00Tajikistan Flood 1 21 15,000 1.00
Thailand Flood 1 15 200,000 0
Turkey Flood 2 47 35,131 550.00 Mass Movement 2 15 6 0
Viet Nam Flood 2 37 740,000 0
Mass Movement 1 13 1 0 Storm 3 306 2,977,460 1,065.20
Yemen Mass Movement 1 11 0 0
Grand Total 143 8,317 174,106,414 22,104.51
Source: EM-DAT: The OFDA/CRED International Disaster Database – www.emdat.be, Université Catholique de Louvain, Brussels (Belgium) *Data from World Bank 2008; **Data from IMF World Economy Outlook Database
In 2009, China accounts for 19 percent (27 occurrences) of the total number of disasters that hit Asia. The Philippines logged 25 disasters (18%), India 17 disasters (12%), and Indonesia 12 (8%). Bangladesh, Vietnam and Nepal each had 6 disasters (4%). In other indices, India recorded the most number of disaster-related deaths (2,149 or 26% of the total), followed by Indonesia with 1,485 deaths (18%) and the Philippines with 1,307 (16%). China leads both the lists of countries with the most number of affected people (76%) and with most economic damage (51%). In the list of affected people, the Philippines came second (8%), followed by India (5%). Next to China in the economic damage is India (12%), followed by Indonesia (11%).

ADRC Natural Disasters Data Book 2009
17
14. Disasters in Asia by Disaster Type, 2009 Table 11. Disasters in Asia by Disaster Type, 2009
Disaster Type Country Occurrence Killed Total
Affected Damage
(US$ millions)
Drought Bangladesh 1 0 0 0
China P. Rep. 3 0 63,860,000 5,917.56
India 1 0 0 0
Kyrgyzstan 1 0 2,000,000 0
Nepal 1 0 303,000 0
Syrian Arab Rep. 1 0 1,300,000 0
Earthquake Afghanistan 1 22 3,309 0
Bhutan 1 11 12 0
China P. Rep. 2 1 69,885 318.10
Georgia 1 0 7,306 0
Indonesia 5 1330 2,850,364 2,381.00
Iran 1 0 269 0
Japan 1 1 25,319 400.00
Philippines 1 0 392 0.09
Epidemic India 1 311 1,521 0
Nepal 1 314 58,874 0
Sri Lanka 1 346 35,007 0
Extreme Temperature Bangladesh 1 135 50,000 0
India 1 120 25 0
Mongolia 1 5 769,113 62.00
Nepal 1 18 0 0
Flood Afghanistan 3 69 62,516 20.00
Azerbaijan 1 0 5,000 0
Bangladesh 2 16 500,000 0
China P. Rep. 7 209 45,226,038 1,373.00
India 6 1,445 3,886,008 2,434.00
Indonesia 5 126 26,804 0
Iraq 1 2 3,000 0
Lao P. Dem. Rep. 1 10 0 0
Malaysia 2 0 10,875 0
Mongolia 1 26 15,000 0.09
Nepal 2 117 257,786 60.00
Pakistan 3 102 75,080 0
Philippines 8 55 1,083,276 29.31
Saudi Arabia 1 161 10,000 900.00
Sri Lanka 3 3 380,000 0
Tajikistan 1 21 15,000 1.00
Thailand 1 15 200,000 0
Turkey 2 47 35,131 550.00
Viet Nam 2 37 740,000 0
Mass Movement Afghanistan 1 10 32
China P. Rep. 5 196 10,022 139.00
India 2 55 0 0
Indonesia 2 29 5 0
Japan 2 44 400 0
Myanmar 1 24 1,351 0
Nepal 1 10 0 0
Philippines 1 10 16 0
Turkey 2 15 6 0
Viet Nam 1 13 1 0
Yemen 1 11 0 0
Storm Bangladesh 2 197 3,954,550 270.00
Bhutan 1 12 0 0
Cambodia 2 19 178,091 0
China P. Rep. 10 169 23,296,806 3,601.45
Hong Kong 1 0 350 0
India 6 218 5,109,085 300.00
Japan 2 16 7,119 1,000.00
Lao P. Dem. Rep. 1 16 128,887 100.00
Philippines 14 1,242 12,221,663 932.70
Taiwan (China) 1 630 2,307,523 250.00
Viet Nam 3 306 2,977,460 1,065.20
Volcano Philippines 1 0 47,137 0
Grand Total 143 8317 174,106,414 22,104.51
Source: EM-DAT: The OFDA/CRED International Disaster Database – www.emdat.be, Université Catholique de Louvain, Brussels (Belgium) *Data from World Bank 2008; **Data from IMF World Economy Outlook Database
In Asia, flood accounts for 36 percent (52 incidences) of the total number of disasters in 2009, while storm accounts for 30 percent (43). Floods ravaged the Philippines 8 times, China 7 and India 6, while storms hit the same countries 14, 10 and 6 times, respectively. Mass movement (19) and earthquake (13) account for 13 and 9 percent of the total disasters, respectively, with China (5) and Indonesia (5) receiving the most disasters respectively. The other disasters that hit Asia in 2009 include 9 droughts (3 in China), 4 extreme temperature-related disasters, 3 epidemics, and 1 volcanic eruption (the Philippines). Storm and flood account for 34 and 30 percent, respectively, of all disaster-related deaths in Asia in 2009. The Philippines and India reported the most number of deaths in these disasters, respectively. Drought, flood and storm are the most pervasive disasters in terms of total affected population (accounting for 39, 30 and 29 percent respectively), with China being the most affected country in all these categories. Storm (34%) is the most destructive disaster in terms of economic damage, followed by drought (27%) and flood (24%). In this index, China was the most affected country in the categories of drought and storm, while India sustained the most economic damage in flood category.

The Asian Disaster Reduction Center was established in Kobe, Japan in 1998 with the mission to enhance disaster resilience of its member-countries, to build safe communities, and to create a society where sustainable development is possiblesociety where sustainable development is possible. The Center works to build disaster resilient communities and to establish networks among countries through many programs including personnel exchanges in this field.
Asian Disaster Reduction Center