natural frequencies of concrete bridges in the...
TRANSCRIPT

TRANSPORTATION RESEARCH RECORD 1393 119
Natural Frequencies of Concrete Bridges in the Pacific Northwest
RALPH A. DussEAU AND HASSAN N. DuBAISI
Analyses of field ambient vibration were performed on 50 concrete bridge spans along Interstate highways 1-5 and 1-405 in Washington State. These 50 spans included 21 pretensioned concrete beam (PCB) spans, 19 reinforced concrete box-girder (CBOX) spans, and 10 reinforced concrete slab (CS) spans. Eight measurement transducers were used to record ambient bridge vibrations at three locations on each span: midspan, one-quarter point, and one support. These records of bridge motion versus time were each subjected to a fast Fourier transformation, and plots of amplitude versus frequency were generated for each record. The plots of amplitude versus frequency were used to determine the fundamental vertical and lateral frequencies for the bridge spans measured. These fundamental frequencies were used with the bridge design parameters to derive empirical formulas that will be used to estimate the fundamental vertical and lateral frequencies of other PCB, CBOX, and CS bridge spans along 1-5, 1-205, and 1-405 in the Pacific Northwest.
The research reported here was part of a 3-year project sponsored by the U.S. Geological Survey (USGS) as part of the National Earthquake Hazards Reduction Program. This study is referred to as the "I-5 Bridge Project." Two major objectives of the research are
1. To develop a computer data base, called the I-5 Bridge Database, containing design information for all 1,000 highway, railway, and pedestrian bridges on and over Interstate highways I-5, I-205, and I-405 (collectively referred to as "the I-5 corridor") in western Washington and northwestern Oregon.
2. To perform field ambient vibration analyses on a representative sample of highway bridge spans in Washington and to derive empirical formulas for estimating the fundamental vertical and lateral frequencies of other bridges in the 1-5 Bridge Database.
The present focus is on the second objective, which includes the results generated by the field ambient vibration analyses and the empirical formulas derived from these results.
The importance of structure frequency in seismic analysis is well established. In the wake of the September 19, 1985, Mexico City earthquakes (1), which demonstrated a strong correlation among earthquake frequency, structure frequency, and structure damage, structure frequency has become an even more important issue in earthquake engineering. The maximum ground acceleration in the Mexico City area during the earthquakes was about 0.5g, with a dominant frequency of 0.5 cycles per second (cps) and a secondary
Department of Civil and Environmental Engineering, Wayne State University, Detroit, Mich. 48202.
frequency near 1.0 cps. The majority of the buildings damaged in these shocks (61 percent) were 6- to 15-stories tall with _fundamental frequencies of approximately 0.6 to 1.4 cps. This strong correlation between ground motion frequency, structure frequency, and structure damage has provided an important new indication of the criticality of structure frequency in the determination of structure seismic damage.
With the goal of determining natural structure frequencies, field ambient vibration analyses have been conducted on a variety of structures, including multistory buildings (2 ,3), steel truss bridges (4), and suspension bridges (5 to 9). Thus the state of the art· of field ambient vibration analysis is well established and the procedures are well known (10).
The goal in performing field ambient vibration analyses as part of the I-5 Bridge Project was to determine the natural frequencies for a representative sample of bridge spans along the I-5 corridor in·Washington and to extrapolate these results to other bridges in the I-5 Bridge Database. To this end, field ambient vibration measurements and laboratory data analyses were performed on 52 spans from 20 typical highway bridges.
BRIDGE SPANS ANALYZED
The 52 bridge spans analyzed were chosen to reflect as closely as possible the actual distribution of bridge span type and length for the highway bridges along the I-5 corridor in Washington. These 52 spans were distributed as follows among four types of concrete bridges:
• 21 (40 percent) pretensioned concrete beam (PCB) spans, • 19 (37 percent) reinforced concrete box-girder (CBOX)
spans, • 10 (19 percent) reinforced concrete slab (CS) spans, and • 2 (4 percent) reinforced concrete T-beam spans.
Although other bridge types, such as prestressed concrete box-girders, steel beams and girders, steel trusses, timber trestles, steel and concrete arches, and steel box-girders, exist along the I-5 corridor in Washington, none represent more than 3 percent of the total number of bridge spans along the I-5 corridor.
The results presented here are for the 21 PCB spans, 19 CBOX spans, and 10 CS spans. These three span types represent approximately 90 percent of the bridge spans along the I-5 corridor in Washingt_on. These 50 spans are part of 19 different bridges along the I-5 corridor. The bridge type; Washington State Department of Transportation (WSDOT) bridge number; bridge name; number of spans per bridge;

120
top and bottom slab thickness (where applicable); number of beams, box-girders, or slabs; and number of columns or walls per intermediate support for each of these 19 bridges are presented in Table 1.
For safety reasons, most of the bridges measured in the field were undercrossings with wide sidewalks. The traffic along the 1-5 corridor was deemed too heavy to permit safe measurements on most highway overcrossings or ramps, and wide sidewalks were necessary to facilitate safe access to each bridge without disruption of vehicular traffic. At each bridge site, the measurement transducers, equipment, and cables were placed on only one of the two sidewalks to avoid having cables stretched across the roadway.
FIELD MEASUREMENTS
The bridge motion measured in the field was generated by ambient loads that consisted primarily of traffic and wind loads. For each bridge span analyzed, field ambient vibration
TRANSPORT AT/ON RESEARCH RECORD 1393
measurements were taken using eight signal transducers-six SS-1 seismometers and two FBA-11 accelerometers. The signal output from these eight transducers was amplified and then recorded on tape recorder. The two transducer configurations used covered half each bridge span, from midspan to one of the two supports. The configuration that was initially used and applied to all 21 PCB spans was as follows:
1. Seismometer-midspan location and vertical orientation,
2. Seismometer-midspan location and lateral orientation, 3. Seismometer-midspan location and longitudinal ori
entation, 4. Seismometer-quarter-point location and vertical ori
entation, 5. Seismometer-quarter-point location and lateral ori
entation, 6. Seismometer-support location and vertical orientation, 7. Accelerometer-midspan location and vertical orien
tation, and
TABLE 1 General Information for Concrete Bridges Analyzed
Bridge WSOOT Bridge Name Number Slab Number Number Type Bridge (OC = Overcrossing, of Thick- of of
Number UC = Undercrossing, Spans nesses, Beams, Columns RR = Railroad) per "'" Box- or
Bridge Girders Walls Top Bot. or per
Slabs Support
Pretensioned 5/457 PORT OF TACOMA UC 4 146 NA 9 5 Concrete
Beam 5/602 236TH STREET SW UC 4 146 NA 6 3 (PCB)
Bridges 5/605 220TH STREET SW UC 4 178 NA 15 7
5/615 164TH STREET SW UC 4 178 NA 12 6
5/630 41ST STREET UC 4 165 NA 7 3
5/656 MARSHALL ROAD UC 2 165 NA 8 2
405/42 MAIN STREET UC 3 146 NA 9 3
405/42.5 NE 4TH STREET UC 2 191 NA 13 6
Reinforced 5/418 BRIDGEPORT WAY UC 4 165 165 7 4 Concrete
Box-Girder 5/419 CARLYLE ROAD UC 4 165 152 4 1 (CBOX) Bridges 5/596 NE 185TH STREET UC 4 165 152 7 4
405/17 BENSON ROAD UC 4 165 152 5 1
405/50 N NE 72ND PLACE UC 4 191 178 4 1
405/50 s NE 72ND PLACE UC 4 191 178 4 1
405/57 s NE 124TH STREET UC 4 191 178 4 1
Reinforced 5/415 A GRAVELLY LAKE RR OC 1 305 NA 1 1 Concrete
Slab 5/417 CLOVER CREEK BRIDGE 3 330 NA 1 1 (CS)
Bridges 5/425 S 84TH STREET UC 2 864 NA 1 1
5/428 S 56TH STREET UC 4 584 NA 2 6

Dusseau and Dubaisi
8. Accelerometer-quarter-point location and vertical orientation.
Because the vertical direction was initially assumed to be the most flexible for each bridge span, three seismometers were oriented in that direction with one at midspan, one at a quarter point, and one at a support. In order to cover the full range of potential vertical bridge frequencies, the two accelerometers were also oriented vertically, with one at midspan and one at the quarter point. Two seismometers were oriented laterally, with one at midspan and one at the quarter point. The longitudinal direction was assumed to be the least flexible, and only one seismometer (located at midspan) was oriented longitudinally.
On the basis of the results for the PCB spans, the seismometers were considered sufficient for recording all vertical frequencies, but additional information on bridge responses at the supports was desired. Therefore for the CBOX and CS spans, the two accelerometers were moved to the support with one oriented longitudinally and one laterally.
80.0
rn 60.0 ....... E E
Q) 40.0 "C ::::s ...,
11 E <
20.0
0 5 10
121
LABORATORY DATA ANALYSES
In the laboratory analyses of the data recorded in the field, the signal output from each transducer was played back through a spectrum analyzer, and a fast Fourier transformation was performed. The final results for each transducer were plots of signal amplitude (velocity for the seismometers and acceleration for the accelerometers) versus frequency, from which the natural frequencies ofthe bridge span at the given location and in the given direction could be read directly. These analyses also included comparisons of phase and coherence between pairs of transducer signals. The comparisons aid in deducing the mode shape associated with each frequency.
SAMPLE OUTPUT
As samples of the analysis results that were derived for each bridge span, Figure 1 shows the amplitude versus frequency
15 20 25
Frequency (cps)
a) Transducer #1
rn ....... E E
11 E <
64.0
48.0
32.0
16.0
0 5 10 15 20
Frequency (cps)
b) Transducer #2
FIGURE 1 Sample output for Span 3 of WSDOT Bridge 405/17: (a) Transducer 1, (b) Transducer 2.
25
122
results for Transducers 1 and 2 as recorded on Span 3 of WSDOT Bridge 405/17. The results shown in Figure l(a) for Transducer 1, which represent vertical motion at midspan, indicate that for this span the fundamental frequency in the vertical direction is 5.8 cps. Previous experience suggests the associated mode shape is probably a half sine wave vertical motion of the bridge span.
The results for Transducer 2, which are plotted in Figure l(b) and which represent lateral motion at midspan, show that the fundamental lateral frequency for WSDOT Bridge 405/17 is 3.1 cps. The corresponding mode shape is most likely a half sine wave lateral motion of the entire bridge deck. This conclusion is supported by the fact that this frequency is also the fundamental lateral frequency for Spans 1 and 2 of this bridge as measured in the field.
TRANSPORTATION RESEARCH RECORD 1393
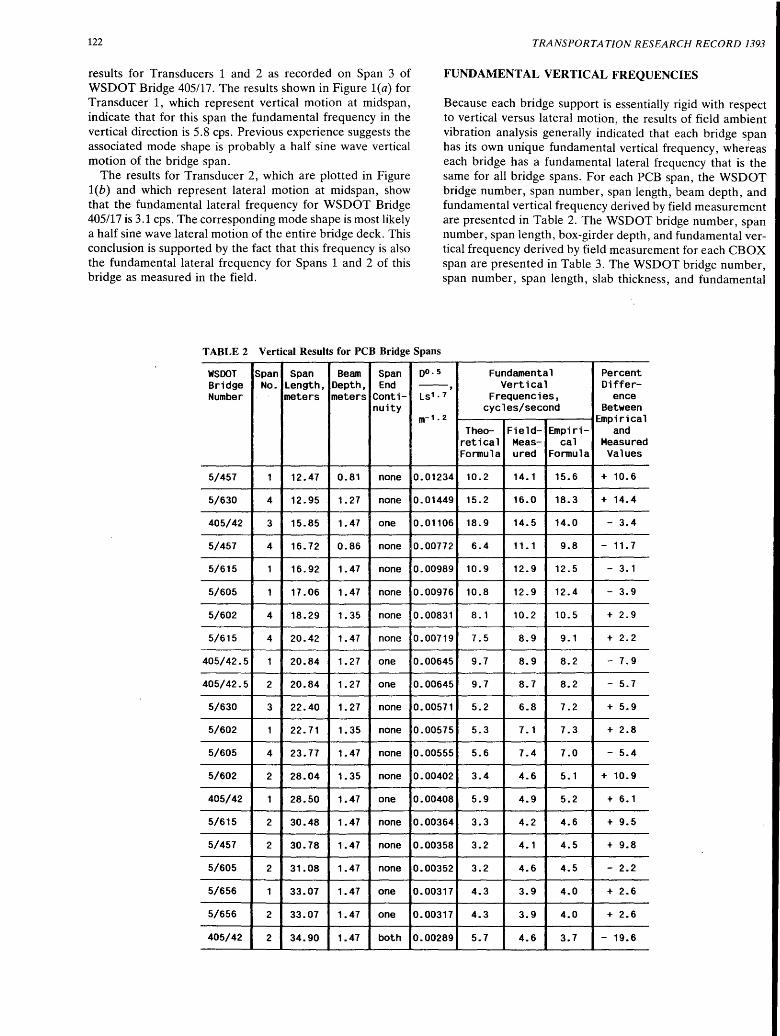
FUNDAMENTAL VERTICAL FREQUENCIES
Because each bridge support is essentially rigid with respect to vertical versus lateral motion, the results of field ambient vibration analysis generally indicated that each bridge span has its own unique fundamental vertical frequency, whereas each bridge has a fundamental lateral frequency that is the same for all bridge spans. For each PCB span, the WSDOT bridge number, span number, span length, beam depth, and fundamental vertical frequency derived by field measurement are presented in Table 2. The WSDOT bridge number, span number, span length, box-girder depth, and fundamental vertical frequency derived by field measurement for each CBOX span are presented in Table 3. The WSDOT bridge number, span number, span length, slab thickness, and fundamental
TABLE 2 Vertical Results for PCB Bridge Spans
WSOOT Span Span Beam Span D0.5 Fundamental Percent Bridge No. Length, Depth, End --, Vertical Differ-Number meters meters Conti- Ls1.1 Frequencies, ence
nuity cycles/second Between m-1. 2 Empirical
Theo- Field- Empiri- and retical Meas- cal Measured Formula ured Formula Values
5/457 1 12.47 0.81 none 0.01234 10.2 14.1 15.6 + 10.6
5/630 4 12.95 1.27 none 0.01449 15.2 16.0 18.3 + 14.4
405/42 3 15.85 1.47 one 0.01106 18.9 14.5 14.0 - 3.4
5/457 4 16.72 0.86 none 0.00772 6.4 11. 1 9.8 - 11. 7
5/615 1 16.92 1.47 none 0.00989 10.9 12.9 12.5 - 3. 1
5/605 1 17.06 1.47 none 0.00976 10.8 12.9 12.4 - 3.9
5/602 4 18.29 1.35 none 0.00831 8. 1 10.2 10.5 + 2.9
5/615 4 20.42 1.47 none 0.00719 7.5 8.9 9. 1 + 2.2
405/42.5 1 20.84 1.27 one 0.00645 9.7 8.9 8.2 - 7.9
405/42.5 2 20.84 1. 27 one 0.00645 9.7 8.7 8.2 - 5.7
5/630 3 22.40 1. 27 none 0.00571 5.2 6.8 7.2 + 5.9
5/602 1 22.71 1.35 none 0.00575 5.3 7. 1 7.3 + 2.8
5/605 4 23. 77 1.47 none 0.00555 5.6 7.4 7.0 - 5.4
5/602 2 28.04 1.35 none 0.00402 3.4 4.6 5.1 + 10.9
405/42 1 28.50 1.47 one 0.00408 5.9 4.9 5.2 + 6.1
5/615 2 30.48 1.47 none 0.00364 3.3 4.2 4.6 + 9.5
5/457 2 30.78 1.47 none 0.00358 3.2 4.1 4.5 + 9.8
5/605 2 31.08 1.47 none 0.00352 3.2 4.6 4.5 - 2.2
5/656 1 33.07 1.47 one o. 00317 4.3 3.9 4.0 + 2.6
5/656 2 33.07 1.47 one 0. 00317 4.3 3.9 4.0 + 2.6
405/42 2 34.90 1.47 both 0.00289 5.7 4.6 3.7 - 19.6

Dusseau and Dubaisi 123
TABLE 3 Vertical Results for Reinforced CBOX Bridge Spans
WSDOT Span Span Girder Span Bridge No. Length, Depth, End Number meters meters Conti-
nuity
5/596 4 13.72 1. 21 one
5/596 1 16.46 1. 21 one
5/418 1 18.07 1.12 one
5/418 4 18.07 1.12 one
405/17 1 18.43 1.16 one
5/419 4 20.73 1.17 one
5/596 2 22.96 1.21 both
5/596 3 22.96 1. 21 both
405/57 s 4 23. 71 2.36 one
405/17 2 23. 71 1. 16 both
405/17 3 23. 71 1.16 both
5/418 2 26.67 1.12 both
5/418 3 26.67 1.12 both
5/419 3 27.58 1.17 both
405/50 N 3 29.81 1.65 both
405/50 s 3 31.30 1.65 both
405/50 N 4 33.83 1.65 one
405/50 s 4 34.14 1.65 one
405/57 s 3 43.59 2.36 both
vertical frequency derived by field measurement for each CS span are presented in Table 4.
Rough theoretical estimates of the fundamental vertical frequencies for each span are also presented in Tables 2-4. These rough estimates were based on consistent-mass systems that assumed the ends of each span to be either simply supported, fixed at one end only, or fixed at both ends. The resulting theoretical formulas for fundamental vertical frequency are functions of the main member depth (beam depth, box-girder depth, or slab thickness) divided by the square of the span length. The end conditions for each bridge span are also noted in Tables 2-4. Because of the prestressing effects, the gross moments of inertia of the bridge deck were used to derive the theoretical fundamental vertical frequencies for the PCB spans, whereas half the gross moments of inertia of the bridge deck were used to calculate the theoretical fundamental vertical frequencies for the CBOX and CS spans.
In deriving empirical formulas to estimate the fundamental vertical frequencies of other PCB, CBOX, and CS spans along the 1-5 corridor, it was assumed that because the vertical stiffness and total mass of a given bridge span are functions
()0. 5 Fundamental Percent --, Vertical Differ-Ls1.e Frequencies, ence
cycles/second Between m-1.3 Empirical
Theo- Field- Empiri- and retical Meas- cal Measured Formula ured Formula Values
0.00987 21.5 16.2 17 .4 + 7.4
0.00711 14.9 13.0 12.5 - 3.8
0.00578 11.4 11. 5 10.2 - 11. 3
0.00578 11.4 12.8 10.2 - 20.3
0.00568 11.0 7.2 10.0 + 38.9
0.00462 8.5 8.9 8.1 - 9.0
0.00391 11. 1 6.2 6.9 + 11.3
0.00391 11. 1 6.2 6.9 + 11. 3
0.00512 12.7 10.5 9.0 - 14.3
0.00359 9.6 5.8 6.3 + 8.6
0.00359 9.6 5.8 6.3 + 8.6
0.00287 7.6 5.5 5.1 - 7.3
0.00287 7.6 5.6 5.1 - 8.9
0.00276 7.0 5.1 4.9 - 3.9
0.00285 8.4 3.9 5.0 + 28.2
0.00261 7.6 4.1 4.6 + 12.2
0.00227 4.5 3.8 4.0 + 5.3
0.00223 4.4 4.1 3.9 - 4.9
0.00172 5.5 3.4 3.0 - 11.8
of the span length and depth, the fundamental vertical frequency of the span will also be a function of the span length and depth (similar to the theoretical formulas discussed here). Thus the following general form for these empirical formulas was assumed:
Kv·Dm fv = --
Lsn
where
fv estimated fundamental vertical frequency, Ls span length, and D beam depth, box-girder depth, or slab thickness.
(1)
The constant K v and the coefficients m and n were derived for each bridge type by minimizing the standard deviation of the field-measured data points versus the empirical results. More precisely, for each bridge type and each trial empirical formula, the quantity Fv · Lsn/ Dm was calculated for each span, where Fv is the fundamental vertical frequency based on field ambient vibration measurement. The mean value and stan-

124 TRANSPORTATION RESEARCH RECORD 1393
TABLE 4 Vertical Results for Reinforced CS Bridge Spans
WSDOT Span Span Slab Span Bridge No. Length, Thick- End Nllllber meters ness, Conti-
meters nuity
5/417 1 6.37 0.33 one
5/417 3 6.37 0.33 one
5/415 A 1 8.17 0.30 none
5/417 2 8.23 0.33 both
5/428 1 13.72 0.58 one
5/428 4 13.72 0.58 one
5/428 2 17 .37 0.58 both
5/428 3 17.37 0.58 both
5/425 1 21.45 0.86 one
5/425 2 21.45 0.86 one
dard deviation for the quantities Fv ·Ls" f Dm were then calculated for each bridge type and each trial empirical formula. The empirical formulas that yielded the lowest standard deviation for each bridge type are presented next.
PCB Spans
The empirical formula derived for the PCB spans is as follows:
1230. vo.s fv = Lst.7 (2)
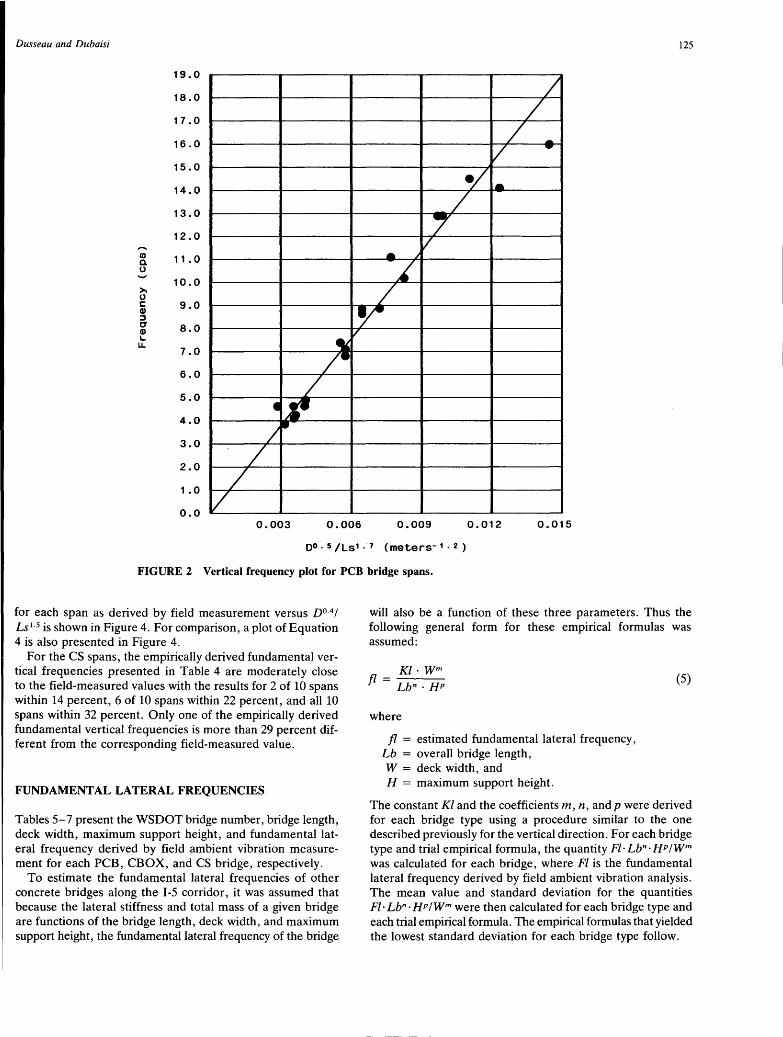
The quantity D 0·sf Lst.7 for each PCB span, the fundamental vertical frequency derived by Equation 2 for each span, and the percent difference between the latter and the fundamental vertical frequency derived by field measurement are presented in Table 2. A plot of the fundamental vertical frequency for each span as derived by field measurement versus D 0 ·sf Lst.7 is presented in Figure 2. Figure 2 also contains a straightline plot of Equation 2 for comparison.
The empirically derived fundamental vertical frequencies for the PCB spans, as presented in Table 2, are close to the field-measured values, with the results for 9 of 21 spans within 4 percent, 14 of 21 spans within 8 percent, 19 of 21 spans within 12 percent, and all 21 spans within 20 percent. Only one of the empirically derived fundamental vertical frequencies is more than 15 percent different from the corresponding field-measured value.
Reinforced CBOX Spans
For the CBOX spans, the empirical formula derived is as follows:
00. 4 Fundamental Percent -- ' Vertical Differ-Ls1.5 Frequencies, ence
cycles/second Between m-1.1 Empirical
Theo- Field- Empiri- and retical Meas- cal Measured Formula ured Formula Values
0.03992 25.3 19.0 24.5 + 28.9
0.03992 25.2 18.6 24.5 + 31.7
0.02646 12.0 20.1 16.3 - 18.9
0.02718 22.0 18.4 16.7 - 9.2
0.01582 8.5 13.5 9.7 - 28.1
0.01582 8.5 13.5 9.7 - 28.1
0.01111 7.7 5.6 6.8 + 21.4
0.01111 7.7 5.6 6.8 + 21.4
0.00948 4.9 5.1 5.8 + 13.7
0.00948 4.9 4.9 5.8 + 18.4
1760. D 0 ·S
fv = Lst.s (3)
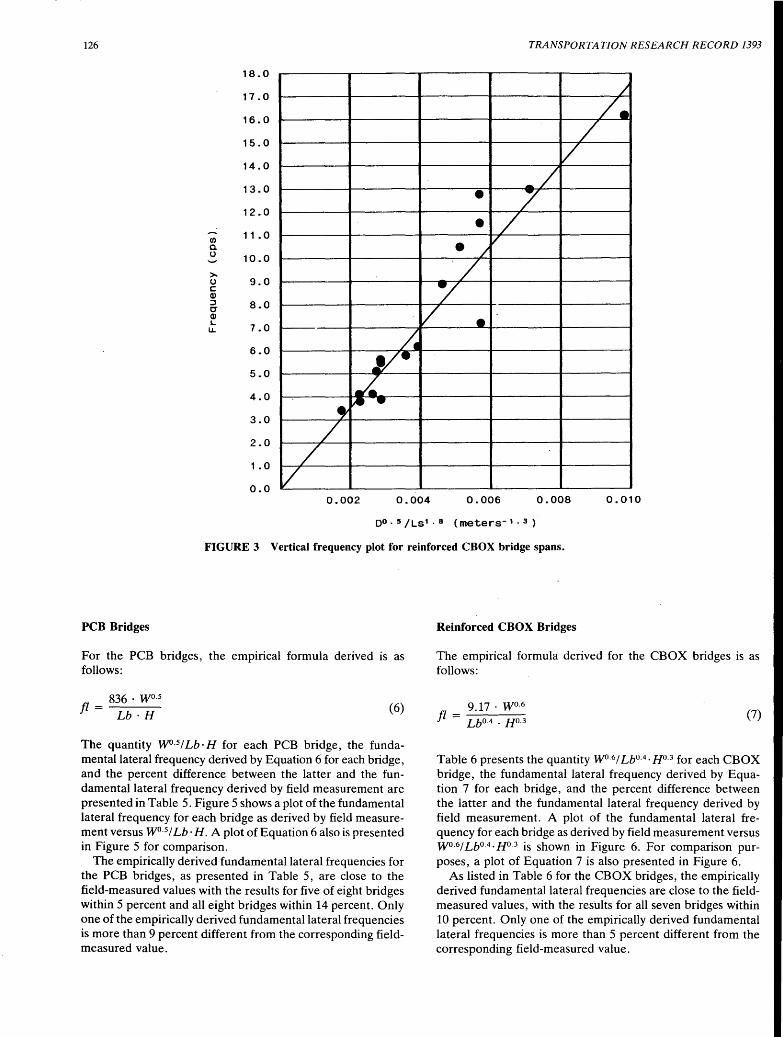
The quantity D 0·sf Lst.s for each CBOX span, the fundamental vertical frequency derived by Equation 3 for each span, and the percent difference between the latter and the fundamental vertical frequency derived by field measurement are presented in Table 3. Figure 3 shows a plot of the fundamental vertical frequency for each span as derived by field measurement versus vo.s f Ls t.s. A plot of Equation 3 is also shown in Figure 3 for comparison.
The empirically derived fundamental vertical frequencies presented in Table 3 for the CBOX spans are moderately close to the field-measured values. The results for 4 of 19 spans are within 6 percent, 10of19 spans are within 9 percent, 16 of 19 spans are within 15 percent, and all 19 spans are within 39 percent. Only one of the empirically derived fundamental vertical frequencies is more than 29 percent different from the corresponding field-measured value.
Reinforced CS Spans
The empirical formula derived for the CS spans is as follows:
615 . D 0·4
fv = Lst.s (4)
The quantity D 0 ·4 f Lst.s for each CS span, the fundamental vertical frequency derived by Equation 4 for each span, and the percent difference between the latter and the fundamental vertical frequency derived by field measurement are presented in Table 4. A plot of the fundamental vertical frequency
Dusseau and Dubaisi 125
19.0
18.0
17.0
16.0
/ /
/ -v -15.0
14.0
13.0
12.0
•/ • /
7 v
f/J 11. 0 Q. 0
10.0 >. 0
• ~
-~
/ c: 9.0 Q) :::l CT 8.0
y CD I.. LI.
7.0
6.0
5.0
4.0
3.0
2.0
1. 0
0.0
v
} /
·~ ;• /
/ v
0.003 0.006 0.009 0.012 0.015
oo · 5 /Ls1 · 1 (meters- 1 · 2 )
FIGURE 2 Vertical frequency plot for PCB bridge spans.
for each span as derived by field measurement versus D 0 ·4 /
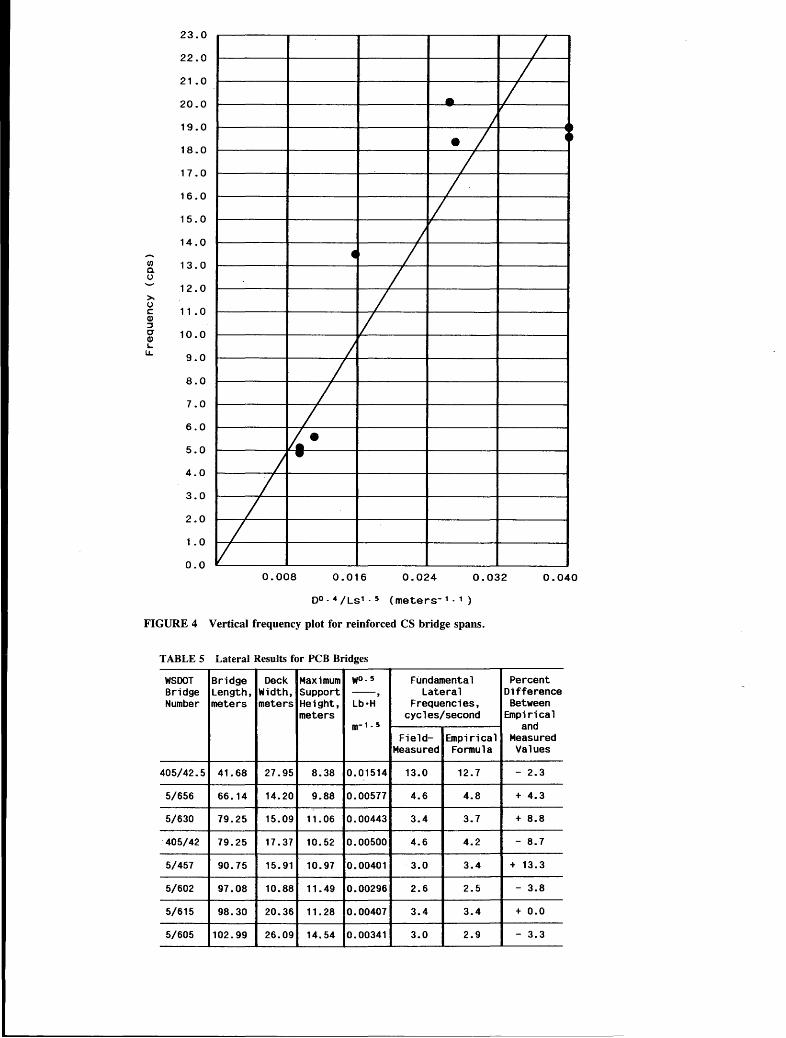
Lst.5 is shown in Figure 4. For comparison, a plot of Equation 4 is also presented in Figure 4.
For the CS spans, the empirically derived fundamental vertical frequencies presented in Table 4 are moderately close to the field-measured values with the results for 2 of 10 spans within 14 percent, 6 of 10 spans within 22 percent, and all 10 spans within 32 percent. Only one of the empirically derived fundamental vertical frequencies is more than 29 percent different from the corresponding field-measured value.
FUNDAMENTAL LATERAL FREQUENCIES
Tables 5-7 present the WSDOT bridge number, bridge length, deck width, maximum support height, and fundamental lateral frequency derived by field ambient vibration measurement for each PCB, CBOX, and CS bridge, respectively.
To estimate the fundamental lateral frequencies of other concrete bridges along the 1-5 corridor, it was assumed that because the lateral stiffness and total mass of a given bridge are functions of the bridge length, deck width, and maximum support height, the fundamental lateral frequency of the bridge
will also be a function of these three parameters. Thus the following general form for these empirical formulas was assumed:
where
fl = estimated fundamental lateral frequency, Lb = overall bridge length, W = deck width, and H = maximum support height.
(5)
The constant Kl and the coefficients m, n, and p were derived for each bridge type using a procedure similar to the one described previously for the vertical direction. For each bridge type and trial empirical formula, the quantity Fl· Lb"· HP /Wm was calculated for each bridge, where Fl is the fundamental lateral frequency derived by field ambient vibration analysis. The mean value and standard deviation for the quantities Fl· Lb"· HP /Wm were then calculated for each bridge type and each trial empirical formula. The empirical formulas that yielded the lowest standard deviation for each bridge type follow.
126 TRANSPORTATION RESEARCH RECORD 1393
18.0
17 .0
16.0
15.0
14.0
13.0
12.0
en 11.0 a. (.)
10.0
>-(.) 9.0 c: Q) :::I 8.0 C" Q) ~ 7.0 u..
6.0
5.0
4.0
3.0
2.0
1.0
0.0
/
/. /
/ _/
• 7 • /
• / / ./
/ v • /.
~· ./. ~ • • /
/ v 0.002 0.004 0.006 0.008 0.010
oo · 5 /Ls1 · 8 (meters- 1 · 3 }
FIGURE 3 Vertical frequency plot for reinforced CBOX bridge spans.
PCB Bridges
For the PCB bridges, the empirical formula derived is as follows:
836. W0 ·5
fl= Lb· H (6)
The quantity Wo· 5 I Lb· H for each PCB bridge, the fundamental lateral frequency derived by Equation 6 for each bridge, and the percent difference between the latter and the fundamental lateral frequency derived by field measurement are presented in Table 5. Figure 5 shows a plot of the fundamental lateral frequency for each bridge as derived by field measurement versus Wo· 5 I Lb· H. A plot of Equation 6 also is presented in Figure 5 for comparison.
The empirically derived fundamental lateral frequencies for the PCB bridges, as presented in Table 5, are close to the field-measured values with the results for five of eight bridges within 5 percent and all eight bridges within 14 percent. Only one of the empirically derived fundamental lateral frequencies is more than 9 percent different from the corresponding fieldmeasured value.
Reinforced CBOX Bridges
The empirical formula derived for the CBOX bridges is as follows:
9.17. W0 ·6
fl=---Lb0.4. Ho.3 (7)
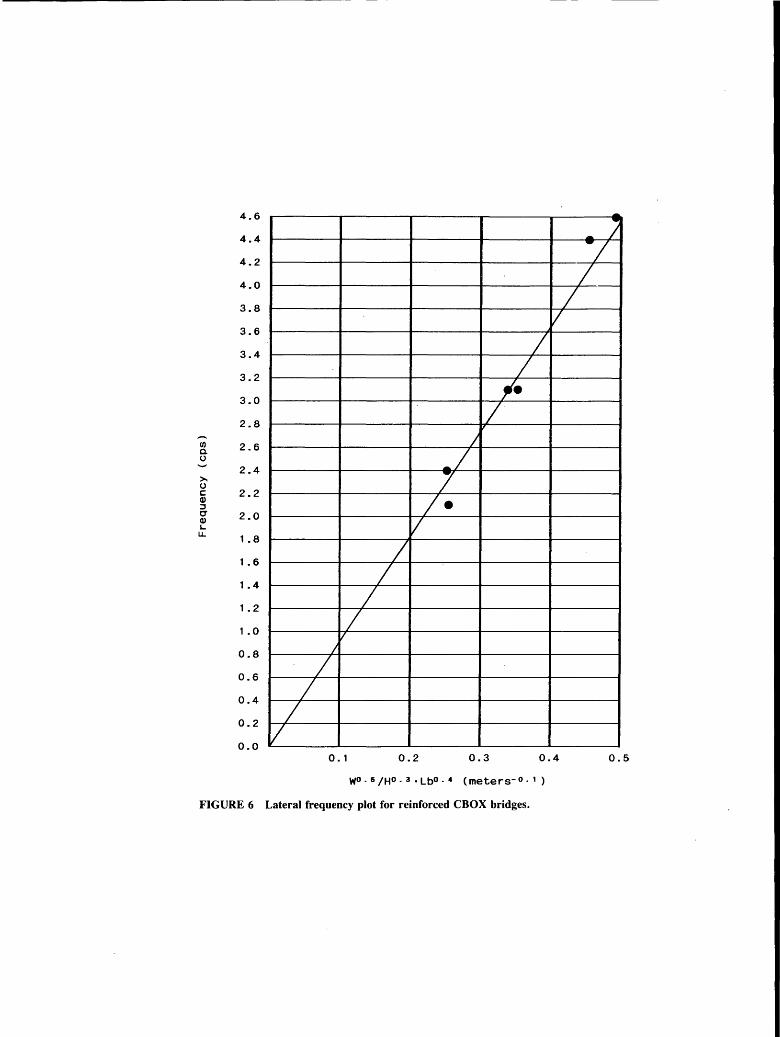
Table 6 presents the quantity Wo· 6 / Lb0 A. H 0 ·3 for each CBOX bridge, the fundamental lateral frequency derived by Equation 7 for each bridge, and the percent difference between the latter and the fundamental lateral frequency derived by field measurement. A plot of the fundamental lateral frequency for each bridge as derived by field measurement versus W 0·6 / Lb0.4 · H 0.3 is shown in Figure 6. For comparison purposes, a plot of Equation 7 is also presented in Figure 6.
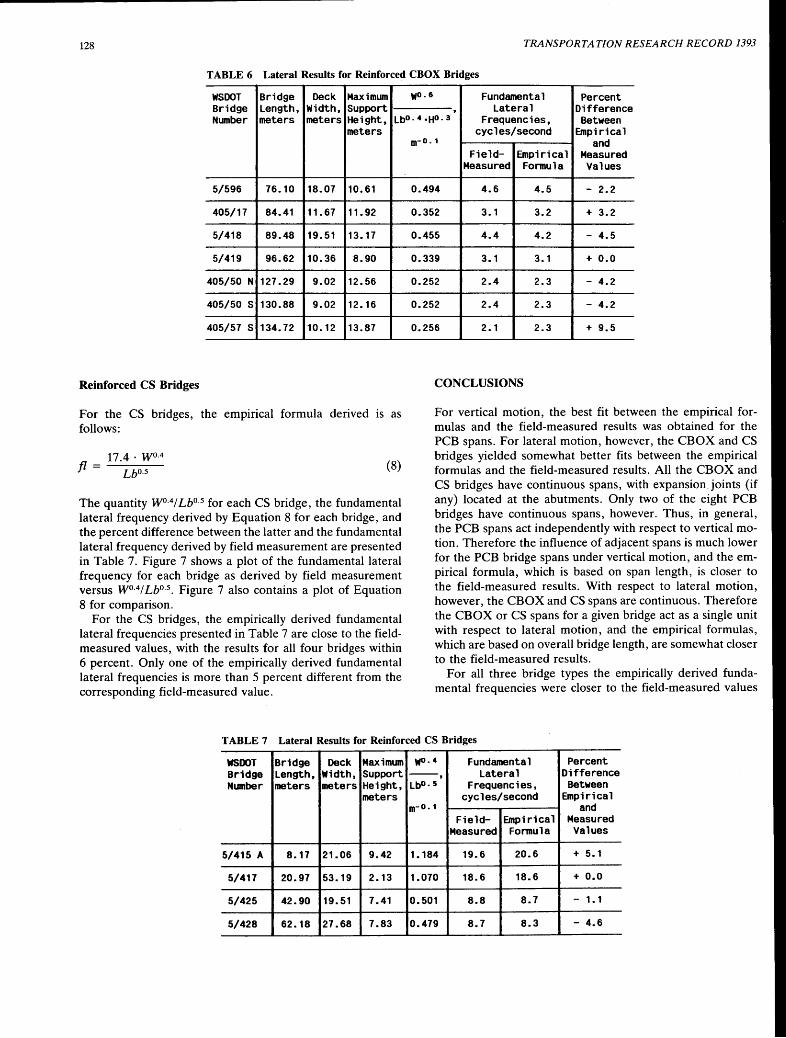
As listed in Table 6 for the CBOX bridges, the empirically derived fundamental lateral frequencies are close to the fieldmeasured values, with the res·ults for all seven bridges within 10 percent. Only one of the empirically derived fundamental lateral frequencies is more than 5 percent different from the corresponding field-measured value.
23.0
22.0
21.0
20.0
I I
- I "
19.0
18.0
17.0
16.0
15.0
/
• I 4 t
I I
I 14.0
en 13.0 0. (,)
12.0 >. (,) c: 11 . 0 CD :J CT 10.0 CD r... IJ. 9.0
8.0
7.0
6.0
5.0
4.0
3.0
2.0
1.0
0.0
/ t 7
I I
7 I
I I
I I..
I • I
I I v
0.008 0.016 0.024 0.032 0.040
o0 · 4 /Ls1 · 5 (meters- 1 · 1 )
FIGURE 4 Vertical frequency plot for reinforced CS bridge spans.
TABLE 5 Lateral Results for PCB Bridges
WSDOT Bridge Deck Maximum wo.5 Fimdamenta l Percent Bridge Length, Width, Support -- '
Lateral Difference Number meters meters Height, Lb·H Frequencies, Between
meters cycles/second Empirical m-1.5 and
Field- Empirical Measured Measured Formula Values
405/42.5 41.68 27.95 8.38 0.01514 13.0 12.7 - 2.3
5/656 66.14 14.20 9.88 0.00577 4.6 4.8 + 4.3
5/630 79.25 15.09 11.06 0.00443 3.4 3.7 + 8.8
405/42 79.25 17 .37 10.52 0.00500 4.6 4.2 - 8.7
5/457 90.75 15.91 10.97 0.00401 3.0 3.4 + 13.3
5/602 97.08 10.88 11.49 0.00296 2.6 2.5 - 3.8
5/615 98.30 20.36 11.28 0.00407 3.4 3.4 + 0.0
5/605 102.99 26.09 14.54 0.00341 3.0 2.9 - 3.3
128 TRANSPORTATION RESEARCH RECORD 1393
TABLE 6 Lateral Results for Reinforced CBOX Bridges
WSDOT Bridge Deck Maximum wo.6 Fundamental Percent Bridge Length, Width, Support
' Lateral Difference
Number meters meters Height, Lbo.4.Ho.a Frequencies, Between meters
5/596 76.10 18.07 10.61
405/17 84.41 11.67 11.92
5/418 89.48 19.51 13.17
5/419 96.62 10.36 8.90
405/50 N 127.29 9.02 12.56
405/50 s 130.88 9.02 12.16
405/57 s 134.72 10.12 13.87
Reinforced CS Bridges
For the CS bridges, the empirical formula derived is as follows:
17.4. wo.4 ft = Lbo.5 (8)
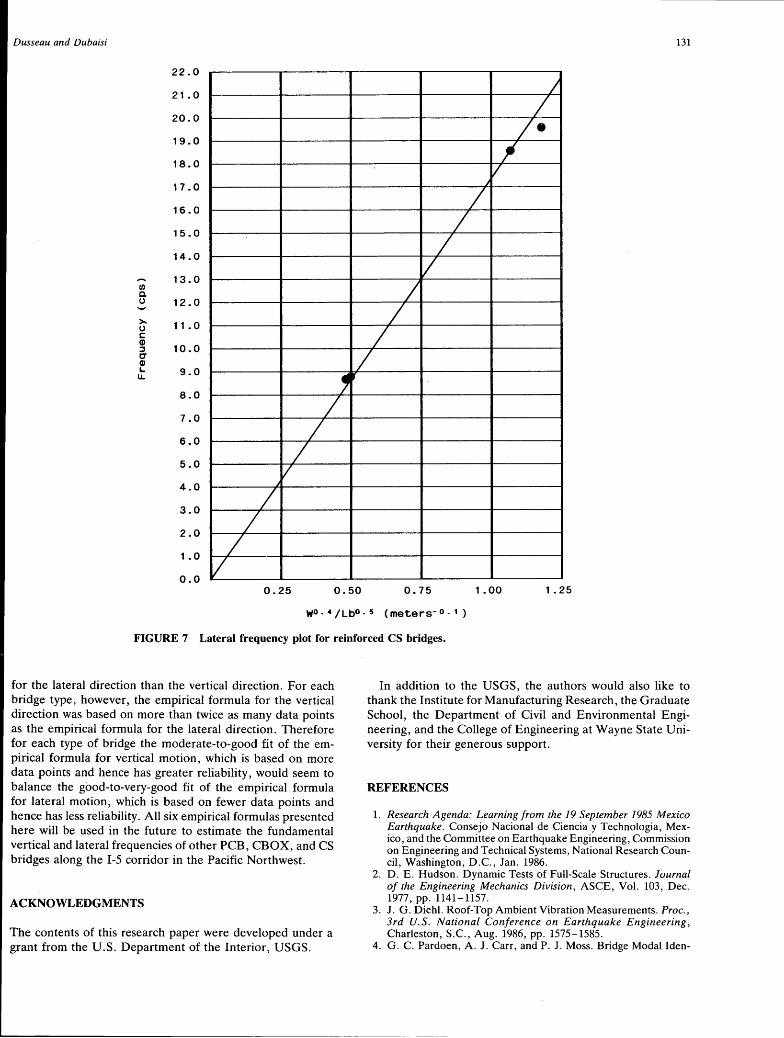
The quantity W0 .4/ Lb0 ·5 for each CS bridge, the fundamental lateral frequency derived by Equation 8 for each bridge, and the percent difference between the latter and the fundamental lateral frequency derived by field measurement are presented in Table 7. Figure 7 shows a plot of the fundamental lateral frequency for each bridge as derived by field measurement versus W0 ·4 I Lb0 ·5 • Figure 7 also contains a plot of Equation 8 for comparison.
For the CS bridges, the empirically derived fundamental lateral frequencies presented in Table 7 are close to the fieldmeasured values, with the results for all four bridges within 6 percent. Only one of the empirically derived fundamental lateral frequencies is more than 5 percent different from the corresponding field-measured value.
cycles/second Empirical m-o. 1 and
Field- Empirical Measured Measured Formula Values
0.494 4.6 4.5 - 2.2
0.352 3.1 3.2 + 3.2
0.455 4.4 4.2 - 4.5
0.339 3.1 3.1 + 0.0
0.252 2.4 2.3 - 4.2
0.252 2.4 2.3 - 4.2
0.256 2.1 2.3 + 9.5
CONCLUSIONS
For vertical motion, the best fit between the empirical formulas and the field-measured results was obtained for the PCB spans. For lateral motion, however, the CBOX and CS bridges yielded somewhat better fits between the empirical formulas and the field-measured results. All the CBOX and CS bridges have continuous spans, with expansion joints (if any) located at the abutments. Only two of the eight PCB bridges have continuous spans, however. Thus, in general, the PCB spans act independently with respect to vertical motion. Therefore the influence of adjacent spans is much lower for the PCB bridge spans under vertical motion, and the empirical formula, which is based on span length, is closer to the field-measured results. With respect to lateral motion, however, the CBOX and CS spans are continuous. Therefore the CBOX or CS spans for a given bridge act as a single unit with respect to lateral motion, and the empirical formulas, which are based on overall bridge length, are somewhat closer to the field-measured results.
For all three bridge types the empirically derived fundamental frequencies were closer to the field-measured values
TABLE 7 Lateral Results for Reinforced CS Bridges
WSDOT Bridge Deck Maximum Wo·• Fundamental Percent Bridge Length, Width, Support --, Lateral Difference Number meters meters Height, Lbo. s Frequencies, Between
meters cycles/second Empirical m-0.1 and
Field- Empirical Measured Measured Formula Values
5/415 A 8.17 21.06 9.42 1.184 19.6 20.6 + 5.1
5/417 20.97 53.19 2.13 1.070 18.6 18.6 + o.o
5/425 42.90 19.51 7.41 0.501 8.8 8.7 - 1.1
5/428 62.18 27.68 7.83 0.479 8.7 8.3 - 4.6

14.0
13.0 • ~
12.0
11.0
10.0
9.0
CIJ 8.0 Q.
CJ
/
/ v
/ /
v >.
7.0 CJ c: Q) ::s O"
6.0 Q) I.. u.
5.0
4.0
3.0
2.0
1.0
0.0
/
/ v
~ -~
) V"' -
/ v
0.003 0.006 0.009 0.012 0.015
wo.5/H•Lb (meters-1.s)
FIGURE 5 Lateral frequency plot for PCB bridges.
4.6 -.. 4.4
4.2
4.0
3.8
- J -; I
I v
3.6
3.4
3.2
3.0
2.8
I I
I• I
'I'
(/) 2.6 Q. (.)
2.4 >. (.) c: 2.2 Q) ::s C' 2.0 Q) "'-u. 1.8
1.6
1.4
1.2
1. 0
J _/ 7
/• v
I I
I I
v 0.8
0.6
0.4
0.2
0.0
J
I I
I v 0 .1 0.2 0.3 0.4 0.5
wo. & /HO. 3 • Lbo. 4 (meters- o. 1 )
FIGURE 6 Lateral frequency plot for reinforced CBOX bridges.
Dusseau and Dubaisi 131
22.0
21.0
20.0
19.0
18.0
J I
/• I v
17 .0
16.0
15.0
14.0
13.0 (fJ c. (.) 12.0
>. 11. 0 (.) c: Q)
10.0 :J C' Q) L.. 9.0 LL
j
I I
I v I
I I
I ,, 8.0
7.0 I 6.0
5.0
I I
v 4.0
3.0
2.0
1.0
0.0
J
I I
I v 0.25 0.50 0.75 1.00 1. 25
wo. •/Lbo. 5 (meters-0.1)
FIGURE 7 Lateral frequency plot for reinforced CS bridges.
for the lateral direction than the vertical direction. For each bridge type, however, the empirical formula for the vertical direction was based on more than twice as many data points as the empirical formula for the lateral direction. Therefore for each type of bridge the moderate-to-good fit of the empirical formula for vertical motion, which is based on more data points and hence has greater reliability, would seem to balance the good-to-very-good fit of the empirical formula for lateral motion, which is based on fewer data points and hence has less reliability. All six empirical formulas presented here will be used in the future to estimate the fundamental vertical and lateral frequencies of other PCB, CBOX, and CS bridges along the I-5 corridor in the Pacific Northwest.
ACKNOWLEDGMENTS
The contents of this research paper were developed under a grant from the U.S. Department of the Interior, USGS.
In addition to the USGS, the authors would also like to thank the Institute for Manufacturing Research, the Graduate School, the Department of Civil and Environmental Engineering, and the College of Engineering at Wayne State University for their generous support.
REFERENCES
1. Research Agenda: Learning from the 19 September 1985 Mexico Earthquake. Consejo Nacional de Ciencia y Technologia, Mexico, and the Committee on Earthquake Engineering, Commission on Engineering and Technical Systems, National Research Council, Washington, D.C., Jan. 1986.
2. D. E. Hudson. Dynamic Tests of Full-Scale Structures. Journal of the Engineering Mechanics Division, ASCE, Vol. 103, Dec. 1977, pp. 1141-1157.
3. J. G. Diehl. Roof-Top Ambient Vibration Measurements. Proc., 3rd U.S. National Conference on Earthquake Engineering, Charleston, S.C., Aug. 1986, pp. 1575-1585.
4. G. C. Pardoen, A. J. Carr, and P. J. Moss. Bridge Modal Iden-

132
tification Problems. Proc., 2nd Annual ASCE Engineering Mechanics Specialty Conference on the Dynamic Response of Structures, Atlanta, Ga., Jan. 1981, pp. 29-45.
5. A. M. Abdel-Ghaffar and G. W. Housner. Ambient Vibration Tests of Suspension Bridge. Journal of the Engineering Mechanics Division, ASCE, Vol. 108, Oct. 1982, pp. 2295-2312.
6. A. M. Abdel-Ghaffar and R.H. Scanlon. Ambient Vibration Studies of the Golden Gate Bridge: Suspended Structure. Journal of the Engineering Mechanics Division, ASCE, Vol. 111, April 1985, pp. 463-482.
7. P. G. Buckland, R. Hooley, B. D. Morgenstern, J. H. Rainer, and A. M. van Selst. Suspension Bridge Vibrations: Computed and Measured. Journal of the Structural Division, ASCE, Vol. 105, May 1979, pp. 859-874.
8. V. R. McLamore, G. C. Hart, and I. R. Stubbs. Ambient Vi-
TRANSPORTATION RESEARCH RECORD 1393
bration of Two Suspension Bridges. Journal of the Structural Division, ASCE, Vol. 97, Oct. 1971, pp. 2567-2582.
9. A. H. Mason and D. S. Carder. Vibration Frequencies of the Chesapeake Bay Bridge. Journal of the Structural Division, ASCE, Vol. 93, April 1967, pp. 237-245.
10. J. G. Diehl. Ambient Vibration Survey: Application, Theory and Analytical Techniques. Application Note 3, Kinemetrics, Inc., Pasadena, Calif., Undated.
The contents of this paper do not necessarily represent the policy of USGS, and the endorsement of the federal government should not be assumed. The results and conclusions presented in this paper are the sole responsibility of the authors.
Publication of this paper sponsored by Committee on Concrete Bridges.