natural hydrocarbon seepage on the continental slope to ... · natural hydrocarbon seepage on the...
TRANSCRIPT

Article
Volume 14, Number 6
17 June 2013
doi:10.1002/ggge.20130
ISSN: 1525-2027
Natural hydrocarbon seepage on the continental slope to theeast of Mississippi Canyon in the northern Gulf of Mexico
Asrarur Rahman Talukder, Andrew Ross, Emma Crooke, Charlotte Stalvies, ChristineTrefry, and Xiubin QiCSIRO Earth Science and Resource Engineering (CESRE), 26 Dick Perry Avenue, Kensington,Western Australia, 6009, Australia ([email protected])
David Fuentes and Stephane ArmandCSIRO Earth Science and Resource Engineering (CESRE), 11 Julius Avenue, North Ryde 2113,NSW, Australia
Andrew RevillCSIROMarine and Atmospheric Research (CMAR), Castray Esplanade, Hobart, Tasmania, Australia
[1] From 5 June to 15 September 2010, a multidisciplinary marine survey was undertaken onboard the M/VRyan Chouest in the region of the BP Deepwater Horizon incident site in the Gulf of Mexico. The primaryobjective of the survey was the continuous monitoring of hydrocarbon abundance from sea surface down toa maximum depth of 120m. Compound abundances were inferred using a hydrocarbon sensor array withassociated vertical cast system. In order to better understand the potential inputs from natural seepage inthe vicinity of the spill, a Simrad EK60 high-resolution split beam echo sounder, operated at 38 kHz, wasincluded in the survey between 7 July and 15 September 2010. During this period, three fields of naturalseeps characterized by hydroacoustic flares were studied in detail. These seep fields are at water depthsof approximately 430m, 880m, and 1370m. They are associated with extensive cold seep systems. Inparticular, the area around Seep Field 1 (the vicinity of Deepwater Horizon) seems to present a vast areaof active natural seepages in the Gulf of Mexico. The repeat surveys at two of the fields suggested thatthe cold seep systems here were active, with expulsions of hydrocarbons into the water column, at leastduring the periods of our acoustic surveys. Multiple lines of evidence gathered during the survey indicatedthat the observed hydroacoustic flares at the three fields identified consisted of oily bubble streams of gasesof thermogenic origin. However, direct observation and sampling are required to reveal the precise nature ofthe flares. In the deep water Gulf of Mexico, the formation of a hydrate rim around bubbles seems to be avery important mechanism for the long transport of methane and oil in the water column.
Components: 10,000 words, 8 figures.
Keywords: natural seepage; Deepwater Horizon; Gulf of Mexico.
Index Terms: 3004 Marine Geology and Geophysics: Gas and hydrate systems; 3045 Marine Geology andGeophysics: Seafloor morphology, geology, and geophysics; 4825; Oceanography: Biological and Chemical(0460): Geochemistry.
Received 28 September 2012; Revised 18 March 2013; Accepted 23 March 2013; Published 17 June 2013.
©2013. American Geophysical Union. All Rights Reserved. 1940

Talukder, A. R., A. Ross, E. Crooke, C. Stalvies, C. Trefry, X. Qi, D. Fuentes, S. Armand, A. Revill, and ShipboardScientific Party (2013), Natural seepage on the continental slope to the east of Mississippi Canyon in the northern Gulfof Mexico, Geochem. Geophys. Geosyst., 14, 1940–1956, doi:10.1002/ggge.20130.
1. Introduction
[2] Submarine natural seepage is a major source ofgeological emissions of methane and crude oilentering the marine environment [Kvenvolden andCooper, 2003; Kvenvolden and Rogers, 2005].However, it is difficult to estimate total submarinehydrocarbon emissions because natural seep systemsare highly transient in space and time [Greinert et al.,2006; Leifer et al., 2004; Tryon et al., 1999]. Repeatoffshore surveys reveal that vigorous fluxes of freegas bubbling can be intermittent over periods as shortas 2 or 3 h [Heeschen et al., 2003]. Even repeat sur-veys over the same location give only snapshots ofthe seafloor at discrete times, and a full appreciationof the temporal variability can only be achieved withlong-term continuous monitoring [Talukder, 2012].A second source of uncertainty relates to the fate ofthe released hydrocarbons in the water column. Atsites of natural seepage, dissolved methane isanaerobically oxidized and precipitated as authigeniccarbonate [Boetius et al., 2000; Ritger et al., 1987].Methane released as free gas escapes anaerobicoxidation of methane and enters the water columnas a bubble stream capable of transporting methaneto the surface [Talukder, 2012 and referencestherein]. Recent literature provides contradictoryinformation about the proportion of methane fromseepage at water depths greater than 200m thatreaches the atmosphere via the sea surface [Huet al., 2012; Schmale et al., 2005; Schubert et al.,2006; Solomon et al., 2009]. On the other hand, oilslicks on the sea surface originating from naturalseepage show clearly that liquid hydrocarbon com-ponents released from natural seepage even at waterdepths greater than 1000m reach the atmospherevia the sea surface [Garcia-Pineda et al., 2010;Leifer and MacDonald, 2003; MacDonald et al.,1993].MacDonald et al. [2002] show that the changein relative abundance of n-alkanes of varying carbonchain lengths in floating oil slicks is very rapid: themodal peak in normal alkanes shifted from nC17 tonC23 within 12min of oil surfacing. One kilometeraway from the surfacing point, the slick containedbarely detectable traces of oil. Nevertheless, the slickwas still visible in the remote-sensing images overdistances of 10 km [MacDonald et al., 2002].Therefore, any volumetric estimate based on slickdimensions using remote-sensing imagery would be
an overestimation [Kvenvolden and Cooper, 2003].Real data from oil and gas seepages fromwater depthsmore than 1000m are limited to studies of gasexchange occurring between bubbles and the sur-rounding water during their long transport throughthe water column, as well as bubble transport mecha-nisms from deep water and the formation of a gas hy-drate skin and/or thin oil layer around the bubble [e.g.,Greinert et al., 2006; Leifer and MacDonald, 2003].
[3] After the BP Deepwater Horizon incident, amarine survey was conducted by CommonwealthScientific and Industrial Research Organisation(CSIRO) scientists over a period of 4months (from5 June to 15 September 2010) onboard the M/VRyan Chouest. Initially, the main focus of thismultidisciplinary survey was the continuous monitor-ing of hydrocarbon concentrations at the sea surfaceusing a novel hydrocarbon sensor array. The continu-ous hydrocarbon monitoring was accompanied bycollection of water/slick samples of observed seasurface anomalies for geochemical analysis. It hasbeen well established that the Gulf of Mexico exhibitshigh levels of active, natural oil and gas seepage [e.g.,Anderson et al., 1983;Brooks et al., 1984;Kennicutt IIet al., 1988]. Therefore, from 7 July onward, a SimradEK60 high-resolution split beam echo sounder, operat-ing at 38kHz, was added to the onboard instrumenta-tion to establish the presence or absence of any naturalseepage in the water column and to better understandthe natural seepage activity around the incident site.During the survey, many interpreted instances ofnatural seepage with hydroacoustic flares were ob-served from water depths as shallow as 20m downto depths of 1400m. Three seep fields were studiedin detail on the continental slope east of MississippiCanyon at water depths between approximately430m (MC110), 880m (MC118), and 1370m(MC294) (Figure 1). The aim of this work was[4] 1. First, to determine the nature (gas and/or oil)and origin (source: biogenic versus thermogenic) ofthe observed seepages, temporal variability of theiractivity, and the evolution of the released hydrocar-bons during their long transport through the watercolumn from the seabed to the sea surface.[5] 2. Second, to constrain the mechanisms for thelong transport of the released oil and gas throughwater column occurring at the seep fields in the deepwater of the Gulf of Mexico.
GeochemistryGeophysicsGeosystemsG3G3 TALUKDER ET AL.: NATURAL SEEPAGE IN THE GULF OF MEXICO 10.1002/ggge.20130
1941
2. Geological Context, Natural Seeps,and Gas Hydrates in the Gulf of Mexico
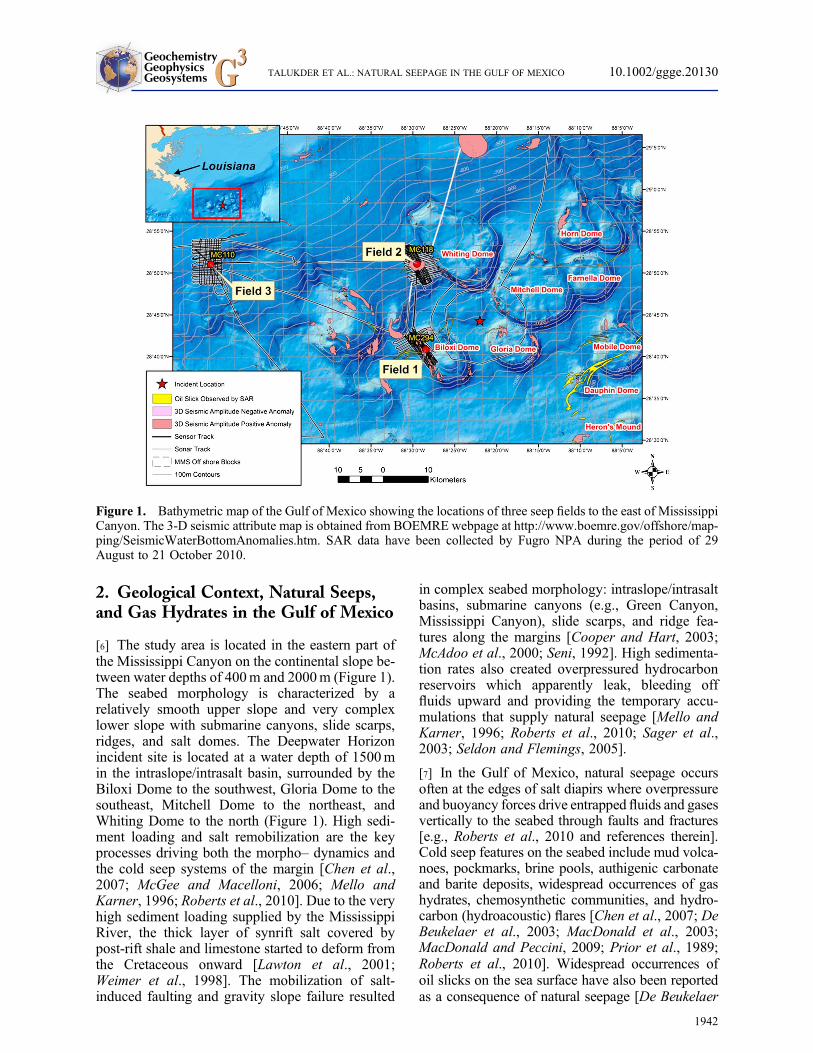
[6] The study area is located in the eastern part ofthe Mississippi Canyon on the continental slope be-tween water depths of 400m and 2000m (Figure 1).The seabed morphology is characterized by arelatively smooth upper slope and very complexlower slope with submarine canyons, slide scarps,ridges, and salt domes. The Deepwater Horizonincident site is located at a water depth of 1500min the intraslope/intrasalt basin, surrounded by theBiloxi Dome to the southwest, Gloria Dome to thesoutheast, Mitchell Dome to the northeast, andWhiting Dome to the north (Figure 1). High sedi-ment loading and salt remobilization are the keyprocesses driving both the morpho– dynamics andthe cold seep systems of the margin [Chen et al.,2007; McGee and Macelloni, 2006; Mello andKarner, 1996; Roberts et al., 2010]. Due to the veryhigh sediment loading supplied by the MississippiRiver, the thick layer of synrift salt covered bypost-rift shale and limestone started to deform fromthe Cretaceous onward [Lawton et al., 2001;Weimer et al., 1998]. The mobilization of salt-induced faulting and gravity slope failure resulted
in complex seabed morphology: intraslope/intrasaltbasins, submarine canyons (e.g., Green Canyon,Mississippi Canyon), slide scarps, and ridge fea-tures along the margins [Cooper and Hart, 2003;McAdoo et al., 2000; Seni, 1992]. High sedimenta-tion rates also created overpressured hydrocarbonreservoirs which apparently leak, bleeding offfluids upward and providing the temporary accu-mulations that supply natural seepage [Mello andKarner, 1996; Roberts et al., 2010; Sager et al.,2003; Seldon and Flemings, 2005].
[7] In the Gulf of Mexico, natural seepage occursoften at the edges of salt diapirs where overpressureand buoyancy forces drive entrapped fluids and gasesvertically to the seabed through faults and fractures[e.g., Roberts et al., 2010 and references therein].Cold seep features on the seabed include mud volca-noes, pockmarks, brine pools, authigenic carbonateand barite deposits, widespread occurrences of gashydrates, chemosynthetic communities, and hydro-carbon (hydroacoustic) flares [Chen et al., 2007; DeBeukelaer et al., 2003; MacDonald et al., 2003;MacDonald and Peccini, 2009; Prior et al., 1989;Roberts et al., 2010]. Widespread occurrences ofoil slicks on the sea surface have also been reportedas a consequence of natural seepage [De Beukelaer
Figure 1. Bathymetric map of the Gulf of Mexico showing the locations of three seep fields to the east of MississippiCanyon. The 3-D seismic attribute map is obtained from BOEMRE webpage at http://www.boemre.gov/offshore/map-ping/SeismicWaterBottomAnomalies.htm. SAR data have been collected by Fugro NPA during the period of 29August to 21 October 2010.
GeochemistryGeophysicsGeosystemsG3G3 TALUKDER ET AL.: NATURAL SEEPAGE IN THE GULF OF MEXICO 10.1002/ggge.20130
1942

et al., 2003; Garcia-Pineda et al., 2010;MacDonaldet al., 1993;MacDonald et al., 2002]. Hydrocarbonsreleased as a result of natural seepage can includebiogenic gas, thermogenic gas, or oil [De Beukelaeret al., 2003; Kennicutt II et al., 1988; Lorensonet al., 2008; Sassen et al., 2003]. Both bacterial(structure I) and thermogenic (structure II) gas hy-drates occur in the Gulf of Mexico [Boswell et al.,2012; Brooks et al., 1984; Milkov and Sassen,2003]. According to thermodynamic modeling, theminimum calculated water depths at which structureI and structure II hydrates would be stable are 615mand 300–400m, respectively [Cooper and Hart,2003; Milkov et al., 2000]. However, the minimumdepth at which gas hydrates have been sampled todate is 420m [Milkov and Sassen, 2000]. Althoughthe cold seep systems in the northern Gulf of Mexicoare some of the best studied in the world, most of thework, especially that related to the evolution ofreleased hydrocarbons in the water column, hasbeen carried out in the area of Green Canyon, tothe west of the Mississippi Canyon, at water depthsof 550–650m [De Beukelaer et al., 2003; Feng andRoberts, 2011; Leifer and Judd, 2002; Leifer andMacDonald, 2003; Leifer et al., 2004; MacDonaldet al., 2000; MacDonald et al., 2002; Sassen et al.,2003; Solomon et al., 2009]. To the east of theMississippi Canyon, studies have mainly focusedaround block MC118, in the region of our SeepField 2 [Hu et al., 2012; Ingram et al., 2010;Sassen et al., 2006; Sleeper et al., 2006]. Littlehas been published about the area near the Deep-water Horizon incident site, where our Seep Field1 is located. However, a detailed bathymetric mapof numerous salt diapirs adjacent to Biloxi Dome(Figure 1) suggests that cold seep systems withactive expulsion of oil and gas into the watercolumn could be extensive.
3. Methods Employed in theDiscrimination of Potential Seep Fields
[8] During the survey, once an acoustic flare hadbeen identified on the echo sounder profile, the surveytrack was redesigned to form a survey box withsufficient overlap of track lines to ensure full coverageof the seafloor in and around the seep fields (Figure 1).For example, Seep Field 1 lies at a water depth ofapproximately 1370m. The EK60 echo sounderoperating at 38 kHz has a beam angle of 7�. At adepth of 1400m, the beam footprint is approximately172m wide (tan 3.5� �water depth� 2). As such,survey lines spaced approximately 152m apart wereplanned to allow enough overlap to fully survey the
seabed. Often flares were tilted in the direction ofcurrents, making it difficult to capture the wholeflare in a 2-D echo sounder profile. Therefore, thesurvey track was also redesigned as a clover leaf overthe seep field in order to determine the maximumheight of the rising flares (Figure 1). In total,11,045 km (5967 nm) of echo sounder profiles werecompleted during the survey. Acoustic data interpreta-tion was based on several criteria: (i) overall geometryof the hydroacoustic flare (ratio between height andwidth) and the consistency of the flare in the acousticprofiles with different directions and times, (ii) meanvolume backscatter (MVB) values, and (iii) wherepossible, calculated bubble-rising velocity [Greinertet al., 2006].
[9] In addition to the acoustic survey, profiles ofinferred dissolved hydrocarbon concentrations insurface waters (1–2m) were logged every 2 s usinga CSIRO-developed hydrocarbon sensor array(Appendix A). The results presented in this paperwere obtained using one of the sensors in the array:a Chelsea Technologies Aquatracka. The Aquatrackais a commercially available oceanographic fluorome-ter tuned for the detection of polyaromatic hydrocar-bons (PAHs). Surface observations and photographywere also undertaken, and samples of water orsurface slick (where present) were collected in areasof observed surface anomalies and/or enhanced sen-sor response. Water and slick samples were analyzedonboard the vessel for organic compounds by gaschromatography-mass spectrometry (GC-MS), afterfirst extracting the samples with dichloromethane.
[10] In order to understand the extent of the cold seepsystems associated with the observed seep fields, wehave correlated our data set with the 3-D seismicamplitude anomaly maps of the water bottom hori-zon published by geoscientists at the Bureau ofOcean Energy and Management (BOEM) for thenorthern Gulf of Mexico. This is available throughtheir webpage (http://www.boem.gov/Oil-and-Gas-Energy-Program/Mapping-and-Data/Map-Gallery/Seismic-Water-Bottom-Anomalies-Map-Gallery.aspx). Over 400 of the amplitude anomalies havebeen confirmed as natural seeps by direct observa-tions (by submersible, autonomous underwatervehicle, remotely operated vehicle, and underwatercamera) and seabed sediment sampling (see URLlink mentioned above). We have also correlated ourdata set with the Synthetic Aperture Radar (SAR)data set collected by Fugro NPA during the periodof 29 August to 21 October 2010 to map the oil slicksassociated with the interpreted seep fields. The datawere acquired by ERS-1 and ERS-2 satellite SARwith coverage ~10,500 km2 each scene. The SAR
GeochemistryGeophysicsGeosystemsG3G3 TALUKDER ET AL.: NATURAL SEEPAGE IN THE GULF OF MEXICO 10.1002/ggge.20130
1943

data were processed and geo-referenced at FugroNPA using proprietary software, and interpretationof the SAR images was carried out at full resolution(approximately 20m) [Lawrence, 2011].
4. Description and Characterization ofthe Observed Seeps
4.1. Field 1 (MC294)
[11] The first interpreted seep field is locatedapproximately 12 km southwest of the incident sitein offshore block MC294 at a water depth of1370m (Figure 1). This field is characterized by ahydroacoustic flare rising from the seabed up to awater depth of 730m (Figures 2a and 2b). Thus,the whole flare lies in the gas hydrate stability field.This flare was imaged twice during the surveybetween 26 and 27 July 2010: it was imaged thefirst time in a profile crossing from a northwest tosoutheast direction (Figure 2a) and the second time,approximately 1 h later, from a southeast to north-west direction (Figure 2b). The MVB of the flarenear the seabed was �35 dB, which graduallydecreased toward the top of the flare (at 710mwater depth) to a value of �52 dB. Structurally theflare is associated with the Biloxi Dome (Figure 2c).The dome is (approximately 12 km� 6 km) elon-gated in a northwest-southeast direction and has acomplex morphology with fault traces, peripheralsynclines found along the southwest and northwestsides, and scarps created by mass wasting. The flareis located in the syncline at the southwest edge ofthe dome (Figure 2c).
4.2. Field 2 (MC118)
[12] This field, located approximately 18 km north-west of the incident site in offshore block MC118 ata water depth of 880m (Figure 1), was visited threetimes: on 28 July, 4 August, and 7 September 2010(Figure 3). On the first visit, the hydroacoustic flarewas imaged as a midwater contact from 776m(107m above seabed) rising up to a water depthof 400m (Figure 3a). Though it is a midwatercontact, the narrow subvertical geometry, as wellas observations of the flare at different times andfrom different directions during subsequent sur-veys, suggest that it’s a seep flare. On the secondvisit, in order to image the whole flare, the surveytrack was designed as a clover leaf over the seepfield, and the flare was traversed five times, eachtime approaching the emanation point from a differ-ent direction. The root of the seep on the seabedwas imaged on the first attempt, but the maximum
penetration into the water column appeared to betruncated (Figure 3b). The MVB value near theseabed was �38 dB. On the third visit, the cloverleaf survey pattern detected the flare five times butagain failed to image the whole flare (Figure 3c).
4.3. Field 3 (MC110)
[13] This field is located 58 km west-northwest of theincident site in offshore block MC110 at a waterdepth of approximately 430m (Figure 1). Thehydroacoustic flare rises up to a water depth of160m (Figures 4a–4c). It appears to originate froma seabed scarp located on the upper slope (Figure 4d).This flare was imaged on three occasions: on 28July, 4 August, and 6 September 2010. On the firstvisit, a complex flare was imaged on a profiletracking from east to west, and the maximumMVB value of �24 dB was observed near theseabed (Figure 4a). The MVB values decreasedgradually to�64 dB at the top of the flare at a waterdepth of 170m. On the second visit, the flare wasagain imaged, this time on a profile tracking fromwest to east (Figure 4b). The maximumMVB valuenear the seabed was �18 dB. This time, the flarewas inclined upslope (to the west) to a water depthof 250m. The flare then appeared to be pushedback to normal, or downslope (to the east), indicatingthe possible layering of two currents of opposingdirection (Figure 4b). On the third visit, a clover leafsurvey pattern was performed at very slow velocity.The vessel was also allowed to drift over the field.The echo sounder image obtained during the driftingallowed the calculation of the bubble-rising velocitynear the seabed (Figure 4c) by the method describedin Greinert et al. [2006]. The calculated risingvelocity near the seabed was 0.15–0.20m/s. Themaximum MVB value observed near the seabedwas �30 dB.
5. Correlation of Observed Seeps withHydrocarbon Sensor Data, GeochemicalData, and Surface Observations
5.1. Field 1 (MC294)
[14] On 26 and 27 July 2010 (12 days after theMC252 well was sealed), the overall ChelseaAquatracka fluorometry measurement values werelow in the survey area, with the responses observedbeing equivalent to those obtained with calibrationsolutions of polyaromatic hydrocarbons in a con-centration range of 0.01–0.4 ppb (Figure 5). Themaximum sensor responses, equivalent to 0.4 ppb
GeochemistryGeophysicsGeosystemsG3G3 TALUKDER ET AL.: NATURAL SEEPAGE IN THE GULF OF MEXICO 10.1002/ggge.20130
1944

of dissolved polyaromatic hydrocarbons, were ob-served in a well-defined area 1–3 km southwest ofthe acoustic flare. Five water samples were takenover the period, from water depths of approxi-mately 1m (Figure 5). Four of these samples weretaken to the southwest and one to the northwest of
the seep location. All samples were taken inresponse to elevated sensor responses, with GC-MS analyses of the samples indicating that theyall contained trace levels of hydrocarbons. How-ever, GC-MS analysis of one water sample takenfrom 1m water depth to the southwest of the seep
Figure 2. (a and b) Images of hydroacoustic plumes obtained by Simrad EK60 split beam echo sound systemsoperated at 38 kHz. (c) Detailed bathymetric map of Field 1 (Biloxi Dome).
GeochemistryGeophysicsGeosystemsG3G3 TALUKDER ET AL.: NATURAL SEEPAGE IN THE GULF OF MEXICO 10.1002/ggge.20130
1945

location on 27 July (latitude 28.661393�, longitude�88.475237�) revealed aliphatic hydrocarboncompound concentrations of 4 ppb, which includea homologous series of normal alkanes from nC17
to nC31. In addition, this sample contains very lowlevels of xylenes, toluene, and trimethyl-benzenes(Figure 6a) indicative of a potential thermogenicorigin with a proximal source (as the low molecularweight aromatic compounds would be rapidly lostthrough evaporation). The isoprenoid pristane/phy-tane source ratio of 0.5 is within the range for oilssourced in the area. No surface sheens or oil wereobserved in this location. The echo sounder data
suggest that the possible seep flare identified maycurve toward the sea surface area of enhancedsensor response, although further definition of thefluorescent feature would be required to provideadditional evidence that the two features are related.
5.2. Field 2 (MC118)
[15] The survey gridwas approximately 9.5 km� 6 kmtrending north-northwest to south-southeast in waterdepths ranging from 700m to 1200m (Figure 1).Overall Chelsea Aquatracka measurements indi-cated baseline levels of inferred hydrocarbons. A
Figure 3. (a–c) Images of hydroacoustic flares obtained by Simrad EK60 split beam echo sound systems operated at38 kHz on 28 July, 4 August, and 7 September 2010, respectively. (d) Detailed bathymetric map of Field 2.
GeochemistryGeophysicsGeosystemsG3G3 TALUKDER ET AL.: NATURAL SEEPAGE IN THE GULF OF MEXICO 10.1002/ggge.20130
1946

Figure 4. (a–c) Images of hydroacoustic flares obtained by Simrad EK60 split beam echo sound systems operated at38 kHz on 28 July, 4 August, and 6 September 2010, respectively. (d) Detailed bathymetric map of Field 3.
Figure 5. Sensor response plotted with position at Field 1, where the amplitude of the sensor response is expressedas equivalent total polyaromatic hydrocarbon (PAH) concentration. Equivalent PAH concentration was obtained bylaboratory calibration of the sensor against solutions of MC252 source oil/water extracts, where the total PAH ofthe water extract had been quantified by GC-MS for 16 PAHs. Low sensor responses were recorded overall in this areawith slightly elevated responses to the south/southwest and northwest of the seep field.
GeochemistryGeophysicsGeosystemsG3G3 TALUKDER ET AL.: NATURAL SEEPAGE IN THE GULF OF MEXICO 10.1002/ggge.20130
1947

Figure 6. Geochemistry of solvent-extracted seawater samples collected in the vicinity of natural seepage at SeepFields 1, 2, and 3. Large ion chromatograms show n-alkane distribution using m/z= 57 ion, and smaller inset ionchromatograms show distribution of ethylbenzenes and xylenes based on m/z = 106 ion. Pie charts detail total quanti-fied hydrocarbon abundance, plus relative proportion of aliphatic and aromatic components. (a) Sample collected at1m water depth to the SW of Seep Field 1 on 27 July 2010 (latitude 28.661393�, longitude �88.475237�) showingpredominance of aliphatic over aromatic components. m/z = 57 ion chromatogram to demonstrate homologous seriesof n-alkanes from nC17 to nC31. m/z = 106 shows very low levels of xylenes. (b) Geochemistry of water sample takenat 1m water depth within the area of elevated sensor response at Seep Field 2 on 4 August (latitude 28.87643�,longitude �88.50789�) showing only trace amounts of measured hydrocarbons, with values less than 1 ppb. (c) Sam-ple collected from surface waters on 4 August (latitude 28.853280�, longitude �88.825563�) showing a high relativeproportion of aliphatics, with m/z= 57 ion chromatogram illustrating a complex distribution of n-alkanes, high relativeabundances of nC15 and nC17, and a pronounced, later eluting, unresolved complex mixture (UCM). (d) Homologousseries of compounds visible in m/z = 57 ion chromatogram, suggesting a possible thermogenic origin from this surfacesample collected on 5 August (latitude 28.859788�, longitude �88.736393). Low levels of xylenes in m/z = 106 ionchromatogram (low signal to noise). (e) m/z = 57 ion chromatogram shows this surface sample (collected at the samelocation and on the same date as Figure 6d) exhibits a less pronounced series of n-alkanes compared to Figure 6d;however, m/z = 106 shows presence of xylenes, suggesting the source of hydrocarbons is within close proximity.
GeochemistryGeophysicsGeosystemsG3G3 TALUKDER ET AL.: NATURAL SEEPAGE IN THE GULF OF MEXICO 10.1002/ggge.20130
1948

relative rescaling (using corresponding highestand lowest sensor voltage values within the areasurveyed) of the track traveled shows a greatervariation within the data, especially in thenortheast-southwest trending tracks, possiblydue to a shift in currents. The water depth atthis field is deep (700m to 1200m), therefore,any expression of hydrocarbons on the seasurface may be offset, by some distance, relativeto the possible seep origin.
[16] Between 2 and 4 August 2010, the surfacewaters adjacent to, and over, Seep Field 2 weresurveyed using a rectangular survey box trendingnorth-northwest to south-southeast (9.5 km longby approximately 6 km wide) (Figure 7). Over theperiod of the grid survey, the overall ChelseaAquatracka measurements were low: 0.1–0.7 ppbPAH equivalent. The time taken to perform thenorth-northwest to south-southeast survey box wasgreater than 24 h. There was a distinct elevatedresponse between 2.3 and 4 km to the north-northwest of the observed acoustic flare, equivalentto between 0.5 and 0.6 ppb PAH (Figure 7).However, GC-MS analysis of the water sampletaken at 1m water depth within the area ofelevated response (latitude 28.87643�, longitude
�88.50789�) shows only trace amounts of totalmeasured hydrocarbons, with values of less than1 ppb (Figure 6b). Once west-east trending surveytracks were commenced, the Chelsea Aquatrackashowed an overall increase in response to this level,which could be due to changing current directionsor other, presently unknown, factors. Therefore,the elevated response in the north-northwesttrending track cannot be singularly assigned to theacoustic flare. It is possible that the bulk of theleaking hydrocarbons from MC118 are gaseous.The only observed surface features in the area wereconvergence lines. No surface slicks were observedin the survey box, although a satellite “hit” indicat-ing an oil slick occurred after the survey had endedin this area (Figure 1).
5.3. Field 3 (MC110)
[17] The majority of time spent in the vicinity ofField 3 was between 4 and 6 August 2010. Thepredominant current direction in this area at thetime of the survey was to the east-northeast up toapproximately 2 knots (based on vessel drift speedmeasured by GPS). The area is close to the outfallof the south pass of the Mississippi River, and there
Figure 7. Sensor response plotted with position at Field 2, where the amplitude of the sensor response is expressedas equivalent detected total polyaromatic hydrocarbon (PAH) concentration. Increased responses observed on thenorth-south survey lines cannot be assigned singularly to the acoustic flare due to increases that were also observedwhen the vessel began west-east survey lines.
GeochemistryGeophysicsGeosystemsG3G3 TALUKDER ET AL.: NATURAL SEEPAGE IN THE GULF OF MEXICO 10.1002/ggge.20130
1949

is significant observed mixing between distinctwater masses in the area. The survey grid wasapproximately 4� 5 nautical miles trending north-south in water depths ranging from 250 to 550m(Figure 8). The Chelsea Aquatracka measurementsshow low levels of inferred polyaromatic hydrocar-bons (0.02 to 1.00 ppb). A relative rescaling of theChelsea data (using corresponding highest and low-est sensor voltage values within the area surveyed)shows a broad increase in responses in the southernhalf of the survey box (Figure 8). There are distinctlocalized areas of enhanced response in the north-ern part of the grid and also on the survey tracksentering the grid from the east. Differences betweenthe north-south track lines and the east-west tracklines could possibly be due to the variable highcurrent regime observed over the 3 day period inthe area. The most significant Aquatracka measure-ments (inferred concentrations from 0.50 to1.00 ppb) at this site were a well-defined zone ofenhanced responses to the east-northeast of the seepsites (Figure 8).
[18] Eight valid samples were taken in the surveybox and along the vessel track, with six of the
samples collected from surface waters. Thesesurface samples were taken in response to observedanomalies, such as particles on the water surface,land-derived material, foam, rainbow sheen, orthese features in combination. The concentrationof measured hydrocarbons in surface water samplesranged from approximately 1.9 to 33.5 ppb, with themajority of samples containing low levels ofaliphatic, aromatic, and benzene, toluene, ethylben-zene, and xylene compounds. Comparison of thegeochemistry of the samples shows that the samplesexhibit distinct differences in the compounds thatare present and the abundance of these compounds,for example, the relative abundance of aliphatic andaromatic components (Figures 6c–6e, pie charts),and the abundance and distribution of the n-alkanes (Figures 6c–6e, m/z= 57 ion traces). Thesamples with distinct homologous series of hydro-carbons were collected on the survey tracks enteringthe grid from the east.
[19] Geochemical results from the sample shown inFigure 6c show a high relative proportion ofaliphatics. The n-alkane (m/z 57 ion) profile showsa complex distribution and a pronounced, later
Figure 8. Sensor response plotted with position at Field 3, where the amplitude of the sensor response is expressedas equivalent detected total polyaromatic hydrocarbon (PAH) concentration. Areas of increased response wererecorded to the south, north, and on west-bound survey lines entering the survey box from the east, in the vicinityof two seep fields. Samples containing homologous series of compounds and volatile xylenes (sample location SS-D3: also see Figures 6d and 6e) and aliphatics (sample location SS-D2: also see Figure 6c) were collected in this area.
GeochemistryGeophysicsGeosystemsG3G3 TALUKDER ET AL.: NATURAL SEEPAGE IN THE GULF OF MEXICO 10.1002/ggge.20130
1950

eluting, unresolved complex mixture (UCM),which together with the visual observations of thesample suggest that the material may not be locallyderived and has been subjected to biodegradation.
[20] The two samples shown in Figures 6d and 6e,respectively, collected to the east of the survey gridhave similar geochemical signatures to each other;however, the compounds differ in abundance(probably due to the level of success of samplingthe surface interface). These samples were takenafter the observation of rainbow sheen on thesurface. Figure 6d shows that this sample containsa homologous series of compounds suggesting apossible thermogenic origin. The sample illustratedin Figure 6e does not have a pronouncedhomologous series of n-alkanes but does containxylenes: compounds which would be quicklyremoved by water washing or evaporation. Thissuggests that the source of this material may beclose by. The location of these three samples(Figure 6c-6e) correlates well with enhanced sensorresponses to the east of Field 3 survey areas(location SS-D2 and SS-D3 in Figure 8).
6. Discussion
[21] The footprints of the echo sounder systems onthe seabed were approximately 170m, 110m, and60m for Fields 1, 2, and 3, respectively. The max-imum resolution of 60m obtained at Field 3 is stilltoo low to distinguish discrete streams of bubblesand/or oil droplets on the seabed [De Beukelaeret al., 2003; MacDonald et al., 2002]. During ourreturn visits, the locations of the hydroacousticflares were usually slightly different. The differencein distance was in the range of the footprints on theseabed, which suggested they were probably in thesame seep field. Nevertheless, it is possible thatevery seep field comprises multiple bubble streams,spaced over a distance less than the echo sounder’sfootprint on the seabed.
[22] The location of the seep fields indicates thatthey are structurally controlled. Field 1 is locatedat the edge of Biloxi Dome (Figure 2c). Seepsdeveloping at the edge of salt domes are verycommon in the Gulf of Mexico [Roberts et al.,2010]. Interpreted 3-D seismic amplitude anomalymaps of the sea bottom horizon from our study areashow that the edge of Biloxi Dome is characterizedby larger patches of high-amplitude positiveanomalies and smaller patches of negative anoma-lies (Figure 2c). Ground truth surveys have shownthat high-amplitude positive anomalies generally
correspond to carbonate deposits, gas hydrates,and/or chemosynthetic communities, while nega-tive anomalies correspond to areas of gas escapethrough the seafloor, characterized by gassy softsediments [Roberts et al., 2010]. Thus, the seismicamplitude anomaly maps suggest that Biloxi Domehas a prolonged history of natural seepage.
[23] Since 2004, offshore block MC118 has beenthe site for a gas hydrates seafloor observatory inthe Gulf of Mexico [McGee and Macelloni,2006]. As a result, very high resolution acousticdata sets are now published on the cold seeps andgas hydrate field in MC118 where our Seep Field2 is located [Sassen et al., 2006; Sleeper et al.,2006]. It presents an excellent opportunity tocharacterize the cold seep systems associated withthe observed hydroacoustic flares at Seep Field 2.Likewise, our data sets would also enable theconstruction of a time series of seep fluxes at thehydrate observatory. The cold seep systems atMC118 are characterized by deposits of authigeniccarbonates and gas hydrates, chemosyntheticcommunities, pockmarks, and complex vent mor-phologies around 100m in diameter [Sassen et al.,2006; Sleeper et al., 2006]. During their 2005marine survey, C&C Technologies, Inc. discoveredthree active vents along with several inactive vents[Sassen et al., 2006]. The hydroacoustic flares ofField 2, found during our survey, seem to originatefrom the southwestern vent discovered by C&CTechnologies (Figure 3d). Gas hydrates sampledfrom this vent were oil stained and consisted ofstructure II hydrates [Sassen et al., 2006]. Sub-bottom profiles across this vent show that it isassociated with an acoustic wipe-out zone [Sleeperet al., 2006]. In the Gulf of Mexico, this type ofacoustic blanking is interpreted as an accumulationof free gas [MacDonald et al., 2003]. This blankingcan also be partially caused by the carbonate and/orgas hydrate deposits on the seabed, inhibitingseismic penetration. Oily bubble streams and asso-ciated oil slicks at the sea surface directly abovethe field have also been observed [Sassen et al.,2006]. Data obtained during successive surveys inthe framework of the hydrate observatory show thatField 2 has developed as a result of deep thermo-genic gas seepage and venting through faults andfractures induced by salt diapirs lying 300mbeneath the seafloor [Ingram et al., 2010; McGeeand Macelloni, 2006; Sassen et al., 2006].
[24] In the absence of a detailed bathymetric map ofSeep Field 3, the correlation with the 3-D seismicamplitude anomaly maps shows small patches ofpositive seismic anomalies approximately 300m to
GeochemistryGeophysicsGeosystemsG3G3 TALUKDER ET AL.: NATURAL SEEPAGE IN THE GULF OF MEXICO 10.1002/ggge.20130
1951

the north of the seep field (Figure 4d) indicating thatthe cold seep system in Field 1 (Figure 2c) ismore extensive than in Field 3. Our calculatedbubble-rising velocities at Field 3 are in the rangeof 0.15–0.20m/s. These rising velocities are in thetypical range for rising dirty bubbles between 3 and10mm in diameter [Greinert et al., 2006; McGinniset al., 2006]. Leifer and MacDonald [2003]measured bubble-rising velocities of three bubblestreams in offshore blocks GC185 and GC294 inthe Gulf of Mexico at water depths of 525–550m,comparable to the water depth of Field 3. They foundthat rising velocities of 0.15–0.20m/s correspondto oily gas bubbles of 4–8mm in diameter.
[25] Flux rates at natural seep fields are highlyvariable over time [Greinert et al., 2006]. Vigorousfluxes of hydrocarbon can diminish over timescales of hours to minutes [Greinert, 2008;Heeschen et al., 2003; Schneider von Deimlinget al., 2010]. The values of MVB can be used as aqualitative indicator of relative seep intensity[Greinert and Nuetzel, 2004]. The MVB valuewould depend on initial bubble size, density, pres-ence or absence of surfactant, and rising velocity[McGinnis et al., 2006]. Bubbles are found to bebigger, denser, and faster in the center of the bubblestreams compared to at their edges [MacDonald etal., 2003]. Thus, the MVB values correspondingto the maximum flux can only be obtained if wecan image through the center of the flare. The over-all Gaussian shape of the flare at Fields 1 and 3(Figures 2 and 5) coupled with the consistentshapes during the surveys at different times andfrom different directions suggest that it is probablythe cores of the flares at Fields 1 and 3 that wereimaged. At Field 1, the second visit was only 1 hafter the first visit. MVB values indicated that theseep intensity remained the same over this timeperiod. At Field 3, MVB values were strongerduring our second visit (7 days after the first visit),which suggests that there was increased seep fluxat this time.
[26] Hydroacoustic flares can be composed of gasbubbles with or without oil and/or hydrate coating,oil droplets, hydrate particles, and/or lower densitywater bodies [Greinert et al., 2006]. Only samplingcan reveal the exact nature of the flares at Fields 1,2, and 3. Seismic amplitude anomaly maps andpublished literature show that all three fields are as-sociated with cold seep features, which suggest thatthe hydroacoustic flares have developed as a resultof active expulsion of gases and, potentially, oils,creating bubble streams in the water column. Inthe Gulf of Mexico, streams of both oily and non-
oily gas bubbles have been found [De Beukelaeret al., 2003]. At each of the fields reported herein,although overall sensor readings were low, arelative scaling of these responses revealed areasof elevated sensor (fluorescence) values. At Field1, water samples taken from the area of elevatedsensor responses contain trace levels of hydrocar-bons potentially indicating the presence of oil.One sample taken on 27 July to the southwest ofthe seep location reveals the presence of a homolo-gous series of normal alkanes from nC17 to nC31
and very low levels of xylenes, toluene, andtrimethyl-benzenes (Figure 6a). The presence ofthese aromatics of lower molecular weight charac-terized by short residence periods in the watercolumn suggests that the source is likely to be local,possibly the seeps at Field 1. At Field 3, thepredominant current direction during the secondvisit on 4 August, which was toward the east-northeast, suggests that the elevated sensorresponses observed to the east-northeast of the seeplocation could be associated with the seeps of thefield. Water samples collected from this area ofenhanced responses contained n-alkanes andxylenes suggesting a possible thermogenic origin(Figures 6c–6e). The presence of volatilecompounds such as xylene further indicates that itcould be associated with the seep.
[27] Satellite remote-sensing technologies have beenwidely used in the Gulf of Mexico to detect oil slicksthat form over natural seepages [Garcia-Pinedaet al., 2010; MacDonald et al., 2002]. SAR(Synthetic Aperture Radar) imagery collected byFugro NPA during the period of 29 August to 21October 2010 shows oil slicks (Figures 1–3, and 5),which seem to be surfacing from Seep Fields 1 and2. This indicates that the flares at these two fieldscould consist of oily bubbles. At Field 1, slicks pres-ent the distinctive shape of four parallel curvilinearlines, which could be the result of multiple discreteseeping points or pulses from the same seep repeatingover short periods of time [Garcia-Pineda et al., 2010;MacDonald et al., 2002]. It should be noted that wedetected the seep at Field 1 on 26–27 July, approxi-mately 1month before the SAR survey periods.SAR data correlate positively with the observationsfrom successive sampling surveys in the frameworkof the hydrate observatory at Field 2 (MC118), whichsuggest that the hydrocarbon flare consists of an oilybubble stream of thermogenic origin.
[28] The observed oil slicks associated with SeepFields 1 and 2, as well as the results from our chem-ical sampling, show that at least part of the releasedoil from the seeps is reaching the sea surface.
GeochemistryGeophysicsGeosystemsG3G3 TALUKDER ET AL.: NATURAL SEEPAGE IN THE GULF OF MEXICO 10.1002/ggge.20130
1952

MacDonald et al. [2002] suggest that the oil slicksthat consistently form near seep fields are the resultof bubble-mediated transport of oil to the surface.At the water depths of our seep fields in particular,the rise speed of oil droplets without associated gasbubbles would be too slow to reach the sea surfacein the vicinity of the seeps and create oil slicks onthe surface. One important limitation of our workis that we did not measure if there was anydissolved methane in sea surface waters. The echosounder images from different directions and atdifferent times show consistently that at Fields 1 and2, hydroacoustic flares rise from the seabed atapproximately 660m and 400m, respectively, andseem to disappear beneath the top edge of thehydrate stability field. The repeat and cloverleafpattern of the surveys over the seep fields(Figures 2–4) suggest that the disappearance ofthe flare in the echo sound profiles is not the resultof flares being in outer beam sections; rather it sug-gests the formation of a hydrate rim as the potentialmechanism for the long transport of the bubbles.When bubbles are released deep inside the hydratestability field, formation of gas hydrate rims occursaround them upon their emission into water [Riedelet al., 2002]. By substantially slowing the rate ofgas transfer into surrounding waters, the hydraterims extend the lifetime of bubbles during theirlong ascent through the water column [McGinniset al., 2006; Rehder et al., 2002]. Near the top ofthe hydrate stability field, at the point where disso-ciation of hydrates occurs, the bubbles—whichalready have low gas content—shrink quickly[Rehder et al., 2002]. The fate of gas bubbles inthe water column depends on initial bubble size,presence or absence of hydrate/oil coating, internalgas circulation, and rising velocity [McGinniset al., 2006; Rehder et al., 2002] With a hydratecoating, an initial diameter of 6mm would besufficient to allow a bubble to rise up to 800m[McGinnis et al., 2006]. Thus, with a hydrate coating,an initial bubble diameter of less than 6mm wouldbe enough for the observed hydroacoustic flares inFields 1 and 2. The oily bubble streams wouldrelease the oil droplets upon their dissolution nearthe top of the hydrate stability field [Leifer andJudd, 2002]. The trajectory of these oils to the seasurface would depend on the prevailing currentprofiles in the upper layer of the water column.During transport to the surface from depths of700 to 400m (at Fields 1 and 2, respectively), oildroplets would undergo further dissolution anddispersion into the water column, particularly ofthe lighter volatile soluble components. The lowconcentration of hydrocarbons surfacing after this
transportation process would explain the absenceor very low sensor responses at Fields 1 and 2.
[29] Like Biloxi Dome, the other salt domes aroundthe Deepwater Horizon area such as Gloria Dome,Dauphin Dome, Mobile Dome, and Mitchell Domeshow similar morphological characteristics on theseabed (Figure 1). The edges of these other domesare also characterized by extensive seismic ampli-tude anomalies. Dauphin Dome in particular showslarger patches of negative anomalies indicating ahigh potential of active gas escape from soft gassysediments. SAR images suggest that many of thesedomes are associated with oil seepage. Therefore,the area around Seep Field 1 seems to present a vastarea of active natural seepage in the Gulf of Mexicoabout which very little has been published. Unlikeother deep water (>1000m) natural seep areas,for example the Black Sea [Greinert et al., 2006;Sahling et al., 2009], Barents Sea [Foucher et al.,2010], at the Hikurangi margin, offshore NewZealand [Greinert et al., 2009], or at the Makranmargin, offshore Pakistan [Romer et al., 2012],where there exists only methane seepage, at SeepField 1, there are both oil and gas seepage withinthe gas hydrate stability field. This may present anexcellent opportunity to study the combination ofboth oil coating and hydrate rim formation duringthe long transport of gas bubbles through the watercolumn. Finally, any realistic estimate of the meth-ane or hydrocarbon budget from the seabed to thewater column for the Gulf of Mexico requires moredetailed study and further seep surveys in andaround Seep Field 1.
7. Conclusion
[30] 1. In this paper, we report the natural seep-age activities around the Deepwater Horizonincident site in the Gulf of Mexico from 7 Julyto 15 September 2010. Three seep fields character-ized by hydroacoustic flares were studied indetail on the continental slope east of MississippiCanyon at water depths of approximately 430m,880m, and 1370m.We interpret these hydroacousticflares as hydrocarbon bubbles and dropletsactively expelled from cold seep systems into thewater column.[31] 2. At Fields 2 and 3, the hydroacoustic flareswere observed during all three surveys from 26July to 9 September 2010, suggesting that the coldseep systems at these two fields were active withvigorous fluxes of hydrocarbons, at least duringthese periods.
GeochemistryGeophysicsGeosystemsG3G3 TALUKDER ET AL.: NATURAL SEEPAGE IN THE GULF OF MEXICO 10.1002/ggge.20130
1953

[32] 3. Cold seep systems at all three fields arestructurally controlled. At Fields 1 and 2, they arecontrolled by salt tectonics.[33] 4. Results from the sensor surveys and watersampling carried out at the seep fields, combinedwith SAR imagery as well as published literaturein the framework of the hydrate observatory atField 2, suggest that the observed hydroacousticflares at all three fields could consist of oily bubblestreams of gases of thermogenic origin. Nonethe-less, only direct observation and sampling canreveal the precise nature and origin of the flares.[34] 5. At Fields 1 and 2, the disappearance ofthe seep flares near the top edge of hydrate stabilityfield suggests that the formation of a hydrate rimaround a bubble is potentially the main mechanismfor the long transport of the gas bubble. The oilybubble streams, upon dissolution of the gas bub-bles above the hydrate stability fields, wouldrelease the oil, which would undergo further disso-lution and dispersion into the water column duringtheir rise to the sea surface. The low concentrationof hydrocarbons resulting from this transportationprocess would explain the absence of, or very low,sensor responses at Fields 1 and 2.
Appendix A: Description of Sensor Calibration
[35] The sensor results used in this paper wereobtained usingUVAquatracka (Chelsea TechnologiesGroup, UK), a portable oceanographic fluorometerfor the detection of polyaromatic hydrocarbons inwater [Lawford et al., 1990]
[36] The output of the Chelsea Aquatracka hasbeen expressed in this paper in units of equivalentpolyaromatic hydrocarbon concentration in partsper billion (ppb). This calibration was derived bymeasuring the sensor response to polyaromaticcompounds in the target oil (in this case, MC252source oil) that would dissolve into solution toform an “aqueous extract.” This extract wasintended to represent the true soluble componentof the oil likely to be detected in the field by thesensor.
[37] The method for preparing the extract wasadapted from Lang et al. [2009]. Milli-Q water(Millipore) and MC252 oil contained in a glassbottle were slowly stirred over a 48 h period toproduce an aqueous extract of the oil containingits soluble components. Details of the extractpreparation procedure have been described else-where [Qi et al., 2010].
[38] Total polyaromatic hydrocarbon concentrationof the oil/water extract was determined by GC-MSfor a total of 16 polyaromatic compounds. Note thatnot all PAH homologs could be detected.
[39] The calibration of sensor output against totalPAH was obtained by immersing the sensor in afixed volume of Milli-Q water in a stirred stainlesssteel vessel. Standard additions of oil/water extractwere made to the vessel as the sensor output wasrecorded. The 16 EPA (United States Environmen-tal Protection Agency) priority PAHs targeted inthe GC-MS analysis are listed as follows: naphtha-lene, acenaphthene, phenanthrene, fluoranthene,benz(a)anthracene, benzo(b)fluoranthene, benzo(a)pyrene, dibenz(a,h)anthracene, acenaphthylene,fluorene, anthracene, pyrene, chrysene, benzo(k)fluoranthene, indeno(1,2,3,c,d)pyrene, and benzo(g,h,i)perylene.
Acknowledgments
[40] The survey work was carried out on behalf of the UnifiedArea Command for the Deepwater Horizon Incident Responsein the Gulf of Mexico, and funded by BP America. We thankthe Editor and reviewers for their constructive criticism. Wethank C&C Technologies, Inc. for their collaboration duringshipboard scientific investigations. We thank Captain WilliamSmith and his crew for their efficient help during the surveyonboard the M/V Ryan Chouest. Finally, we thank CedricGriffiths for his careful and detailed linguistic revision of themanuscript. Analysis and preparation of this paper (CSIROmanuscript ref. no. EP122851) were funded by BP Gulf CoastRestoration Organization.
References
Anderson, R. K., R. S. Scalan, P. L. Parker, and E. W. Behrens(1983), Seep oil and gas in Gulf of Mexico slope sediment,Science, 619–621.
Boetius, A., K. Ravenschlag, C. J. Schubert, D. Rickert,F. Widdel, A. Gieseke, R. Amann, B. B. Jorgensen, U. Witte,and O. Pfannkuche (2000), A marine microbial consortiumapparently mediating anaerobic oxidation of methane,Nature, 407, 623–626.
Boswell, R., T. S. Collett, M. Frye, W. Shedd, D. R.McConnell, and D. Shelander (2012), Subsurface gashydrates in the northern Gulf of Mexico, Mar. Pet. Geol.,34(1), 4–30.
Brooks, J. M., M. C. Kennicutt II, R. R. Fay, T. J. McDoland,and R. Sassen (1984), Thermogenic gas hydrate in the Gulfof Mexico, Science, 225, 409–411.
Chen, Y., R. Matsumoto, C. K. Paull, W. Ussler, T. Lorenson,P. Hart, and W. Winters (2007), Methane-derived authigeniccarbonates from the northern Gulf of Mexico—MD02 cruise,J. Geochem. Explor., 95(1–3), 1–15.
Cooper, A. K., and P. E. Hart (2003), High-resolution seismic-reflection investigation of the northern Gulf of Mexico gas-hydrate-stability zone, Mar. Pet. Geol., 19(10), 1275–1293.
GeochemistryGeophysicsGeosystemsG3G3 TALUKDER ET AL.: NATURAL SEEPAGE IN THE GULF OF MEXICO 10.1002/ggge.20130
1954

De Beukelaer, S. M., I. MacDonald, N. L. Jr.Guinnasso, andJ. A. Murray (2003), Distinct side-scan sonar, RADARSATSAR, and acoustic profiler signature of gas and oilseeps on the Gulf of Mexico slope, Geo-Mar. Lett., 23,177–186.
Feng, D., and H. H. Roberts (2011), Geochemical character-istics of the barite deposits at cold seeps from the north-ern Gulf of Mexico continental slope, Earth Planet. Sci.Lett., 309(1–2), 89–99.
Foucher, J. P., S. Dupre, C. Scalabrin, T. Feseker,F. Harmegnies, and H. Nouze (2010), Changes in seabedmorphology, mud temperature and free gas venting at theHayenkon Mosby mud volcano, offshore northern Norway,over the time period 2003–2006, Geo-Mar. Lett., 30(3–4),157–167.
Garcia-Pineda, O., I. MacDonald, B. Zimmer, B. Shedd, andH. Roberts (2010), Remote-sensing evaluation of geophysicalanomaly sites in the outer continental slope, northern Gulf ofMexico, Deep-Sea Res. Part Ii-Topical Stud. Oceanography,57(21–23), 1859–1869.
Greinert, J., and B. Nuetzel (2004), Hydroacoustic experimentsto establish a method for the determination of methanebubble fluxes at cold seeps, Geo-Mar. Lett, 24, 75–85.
Greinert, J., Y. Artemov, V. Egorov, M. De Batist, andD. McGinnis (2006), 1300-m-high rising bubbles from mudvolcanoes at 2080 m in the Black Sea: Hydroacoustic charac-teristics and temporal variability, Earth. Planet. Sci. Lett.,244(1–2), 1–15.
Greinert, J. (2008), Monitoring temporal variability of bubblerelease at seeps: The hydroacoustic swath system GasQuant,J. Geophys. Res., 113, C07048.
Greinert, J., K. B. Lewis, J. Bialas, I. A. Pecher, A. Rowden,D. A. Bowden, M. De Batist, and P. Linke (2009), Methaneseepage along the Hikurangi Margin, New Zealand: Over-view of studies in 2006 and 2007 and new evidence fromvisual, bathymetric and hydroacoustic investigations, Mar.Geol., 272(1-4), 6–25.
Heeschen, K. U., A. M. Trehu, R. W. Collier, E. Suess, andG. Rehder (2003), Distribution and height of methane bubbleplumes on the Cascadia Margin characterized by acousticimaging, Geophys. Res. Lett., 30(12), 1643, doi:10.1029/2003GL016974.
Hu, L., S. A. Yvon-Lewis, J. D. Kessler, and I. R. MacDonald(2012), Methane fluxes to the atmosphere from deepwaterhydrocarbon seeps in the northern Gulf of Mexico, J.Geophys. Res. Oceans, 117, C01009, doi:10.1029/2011jc007208.
Ingram, W. C., S. R. Meyers, C. A. Brunner, and C. S.Martens (2010), Late Pleistocene-Holocene sedimentationsurrounding an active seafloor gas-hydrate and cold-seepfield on the Northern Gulf of Mexico Slope, Mar. Geol.,278(1–4), 43–53.
Kennicutt, M. C., II, J. M. Brooks, and G. J. Denoux(1988), Leakage of deep, reservoired petroleum to thenear surface on the Gulf of Mexico continental slope,Mar. Chem., 24(1), 39–59.
Kvenvolden, K. A., and A. K. Cooper (2003), Natural seep-age of crude oil into the marine environment, geo-Mar. Lett,23, 140–146.
Kvenvolden, K. A., and B. W. Rogers (2005), Gaia’sbreath—Global methane exhalations, Mar. Pet. Geol.,22(4), 579–590.
Lang, D. A., T. P. Bastow, B. G. K. Aarssen, B. Warton, G. B.Davis, and C. D. Johnston (2009), Polar compounds from thedissolution of weathered diesel, Ground Water Monit. Rem.(29), 85–93.
Lawford, V. A., M. Morgan, P. Vessey, and J. E. G. Wheaton(1990), An optical-system for detection and measurement ofhydrocarbon in the ocean, Environ. Pollut. Meas. Sens. Syst.,1269, 158–166.
Lawrence, G. (2011), Offshore Seepage Detection—CentralGulf of Mexico Benchmarking, 49 pp., BP America, Houston.
Lawton, T. F., F. J. Vega, K. A. Giles, and C. Rosales-Dominguez (2001), Stratigraphy and origin of the LaPopa basin, Nuevo Leon and Coahuila, Mexico, in TheWestern Gulf of Mexico Basin: Tectonics, SedimentaryBasins, and Petroleum Systems, edited by C. Bartolini,et al., pp. 219–240.
Leifer, I., and A. G. Judd (2002), Oceanic methane layers: Thehydrocarbon seep bubble deposition hypothesis, Terra Nova,14, 417–424.
Leifer, I., and I. MacDonald (2003), Dynamics of the gas fluxfrom shallow gas hydrate deposits: Interaction between oilyhydrate bubbles and the oceanic environment, Earth Planet.Sci. Lett., 210, 411–424.
Leifer, I., J. R. Boles, B. P. Luyendyk, and J. F. Clark (2004),Transient discharges from marine hydrocarbon seeps: Spatialand temporal variability, Environ. Geol., 46(8), 1038–1052.
Lorenson, T. D., G. E. Claypool, and J. A. Dougherty (2008),Natural gas geochemistry of sediments drilled on the 2005Gulf of Mexico JIP cruise, Mar. Pet. Geol., 25(9), 873–883.
MacDonald, I., N. Guinasso, S. G. Ackleson, J. F. Amos, R.Duckworth, R. Sassen, and J. M. Brooks (1993), Naturaloil slicks in the Gulf of Mexico visible from space, J.Geophys. Res., 98(C9), 16,351–16,364.
MacDonald, I. R., D. B. Buthman, W. W. Sager, M. B. Peccini,and N. L. Guinasso (2000), Pulsed oil discharge from a mudvolcano, Geology, 28(10), 907–910.
MacDonald, I. R., I. Leifer, R. Sassen, P. Stine, R. Mitchell,and N. Guinasso (2002), Transfer of hydrocarbons fromnatural seeps to the water column and atmosphere, Geofluids,2(2), 95–107.
MacDonald, I. R., W. W. Sager, and M. B. Peccini (2003), Gashydrate and chemosynthetic biota in mounded bathymetry atmid-slope hydrocarbon seeps: Northern Gulf of Mexico,Mar. Geol., 198(1–2), 133–158.
MacDonald, I. R., and M. B. Peccini (2009), Distinct activityphases during the recent geologic history of a Gulf of Mexicomud volcano, Mar. Pet. Geol., 26(9), 1824–1830.
McAdoo, B. G., L. F. Pratson, and D. L. Orange (2000),Submarine landslide geomorphology, US continental slope,Mar. Geol., 169, 103–136.
McGee, T.M., and L.Macelloni (2006),Overview of ObservatoryDevelopment and the Site Selection Process, Paper Presentedat Offshore Technology Conference, Houston, Texas.
McGinnis, D. F., J. Greinert, Y. Artemov, S. E. Beaubien, andA. Wuest (2006), Fate of rising methane bubbles in stratifiedwaters: How much methane reaches the atmosphere?,J. Geophys. Res. Oceans, 111(C9).
Mello, U. T., and G. D. Karner (1996), Development ofsediment overpressure and its effect on thermal maturation:Application to the Gulf of Mexico basin, AAPG Bull., 80(9), 1367–1396.
Milkov, A. V., and R. Sassen (2000), Thickness of the gashydrate stability zone, Gulf of Mexico continental slope,Mar. Pet. Geol., 17(9), 981–991.
Milkov, A. V., R. Sassen, I. Novikova, and E. Mikhailov(2000), Gas hydrates at minimum stability water depths inthe Gulf of Mexico: Significance to geohazard assessment,Gulf Coast Assoc. Geol. Societies Trans. L, 217–224.
Milkov, A. V., and R. Sassen (2003), Preliminary assessment ofresources and economic potential of individual gas hydrate
GeochemistryGeophysicsGeosystemsG3G3 TALUKDER ET AL.: NATURAL SEEPAGE IN THE GULF OF MEXICO 10.1002/ggge.20130
1955

accumulations in the Gulf of Mexico continental slope, Mar.Pet. Geol., 20(2), 111–128.
Prior, D. B., E. H. Doyle, and M. J. Kaluza (1989), Evidencefor sediment eruption on deep sea floor, Gulf of Mexico,Science, 243, 517–519.
Qi, X. B., A. Ross, T. P. Bastow, and C. Stalvies (2010),Revealing the properties of oils from their dissolved hydro-carbon compounds in water with an integrated sensor arraysystem, Analyst, 136, 3731–3738.
Rehder, G., P. W. Brewer, E. T. Peltzer, and G. Friederich(2002), Enhanced lifetime of methane bubble streams withinthe deep ocean, Geophys. Res. Lett., 29(15), 1731,doi:10.1029/2001gl013966.
Riedel, M., G. D. Spence, N. R. Chapman, and R. D. Hyndman(2002), Seismic investigations of a vent field associated withgas hydrates, offshore Vancouver Island, J. Geophys. Res.,107(B9), 2200, doi:10.1029/2001JB000269.
Ritger, S., B. Carson, and E. Suess (1987), Methane derivedauthigenic carbonates formed by subduction induced porewater expulsion along the Oregon Washington margin, Geol.Soc. Am. Bull., 98(2), 147–156.
Roberts, H. H., W. Shedd, and J. Jr.Hunt (2010), Dive sitegeology: DSV ALVIN (2006) and ROV JASON II (2007)dives to the middle-lower continental slope, northern Gulfof Mexico, Deep Sea Res. Part II: Topical Stud. Oceanogr.,57(21–23), 1837–1858.
Romer, M., H. Sahling, T. Pape, G. Bohrmann, and V. Spiess(2012), Quantification of gas bubble emissions from subma-rine hydrocarbon seeps at the Makran continental margin(offshore Pakistan), J. Geophys. Res. Oceans, 117, C10015,doi:10.1029/2011jc007424.
Sager, W. W., I. R. MacDonald, and R. Hou (2003), Geophys-ical signatures of mud mounds at hydrocarbon seeps on theLouisiana continental slope, northern Gulf of Mexico, Mar.Geol., 198(1-2), 97–132.
Sahling, H., et al. (2009), Vodyanitskii mud volcano, Sorokintrough, Black Sea: Geological characterization and quantifica-tion of gas bubble streams,Mar. Pet. Geol., 26(9), 1799–1811.
Sassen, R., A. V. Milkov, E. Ozgul, H. H. Roberts, J. L. Hunt, M.A. Beeunas, J. P. Chanton, D. A. DeFreitas, and S. T. Sweet(2003), Gas venting and subsurface charge in the Green Canyonarea, Gulf of Mexico continental slope: Evidence of a deep bac-terial methane source?, Org. Geochem., 34(10), 1455–1464.
Sassen, R., H. Roberts, W. Jung, C. B. Lutken, D. A.DeFreitas, S. T. Sweet, and N. Guinasso (2006), The
Mississippi Canyon 118 Gas Hydrate Site: A ComplexNatural System, Paper Presented at Offshore TechnologyConference, Houston, TX.
Schmale, O., J. Greinert, and G. Rehder (2005), Methane emis-sion from high-intensity marine gas seeps in the Black Seainto the atmosphere, Geophys. Res. Lett., 32(7), L07609,doi:10.1029/2004gl021138.
Schneider von Deimling, J., J. Greinert, N. R. Chapman,W. Rabbel, and P. Linke (2010), Acoustic imaging ofnatural gas seepage in the North Sea: Sensing bubblescontrolled by variable currents, Limnol. Oceanogr.Methods, 8, 155–171.
Schubert, C. J., E. Durisch-Kaiser, C. P. Holzner, L. Klauser,B. Wehrli, O. Schmale, J. Greinert, D. F. McGinnis, M. DeBatist, and R. Kipfer (2006), Methanotrophic microbial com-munities associated with bubble plumes above gas seeps inthe Black Sea, Geochem. Geophys. Geosyst., 7,doi:10.1029/2005gc001049.
Seldon, B., and P. B. Flemings (2005), Reservoir pressure andseafloor venting: Predicting trap integrity in a Gulf of Mexicodeepwater turbidite minibasin, AAPG Bull., 89(2), 13–209.
Seni, S. J. (1992), Evolution of salt structures during burial ofsalt sheets on the slope, northern Gulf of Mexico, Mar. Pet.Geol., 9, 452–468.
Sleeper, K., A. Lowrie, A. Bosman, and L. Macelloni (2006),Bathymetric mapping and high-resolution seismic profilingby AUV in MC 118 (Gulf of Mexico), paper presented atOffshore Technology Conference, Houston, Texas.
Solomon, E. A., M. Kastner, I. R. MacDonald, and I. Leifer(2009), Considerable methane fluxes to the atmosphere fromhydrocarbon seeps in the Gulf of Mexico, Nat. Geosci., 2(8),561–565.
Talukder, A. R. (2012), Review of submarine cold seep plumb-ing systems: Leakage to seepage and venting, Terra Nova,24, 255–272.
Tryon, M. D., K. M. Brown, M. E. Torres, A. M. Trehu, J.McManus, and R. W. Collier (1999), Measurements oftransience and downward fluid flow near episodicmethane gas vents, Hydrate Ridge, Cascadia, Geology,27(12), 1075–1078.
Weimer, P., et al. (1998), Sequence stratigraphy of Plioceneand Pleistocene turbidite systems, northern Green Canyonand Ewing Bank (offshore Louisiana), northern Gulf ofMexico, Aapg Bull. Am. Assoc. Pet. Geol., 82(5),918–960.
GeochemistryGeophysicsGeosystemsG3G3 TALUKDER ET AL.: NATURAL SEEPAGE IN THE GULF OF MEXICO 10.1002/ggge.20130
1956