natural state modeling of geothermal reservoir at dieng
TRANSCRIPT
GRC Transactions, Vol. 37, 2013
831
KeywordsDieng, Indonesia, numerical model, forward analysis method, natural state, reservoir simulation
AbstrAct
A three dimensional numerical reservoir model of the Dieng geothermal field was developed for the pre-exploitation stage us-ing the TOUGH2 simulator with a forward analysis method. The model was verified by matching temperature profiles of explora-tion wells. The numerical model in the natural state simulation was able to successfully reproduce initial temperatures from 11 wells.
1. Introduction
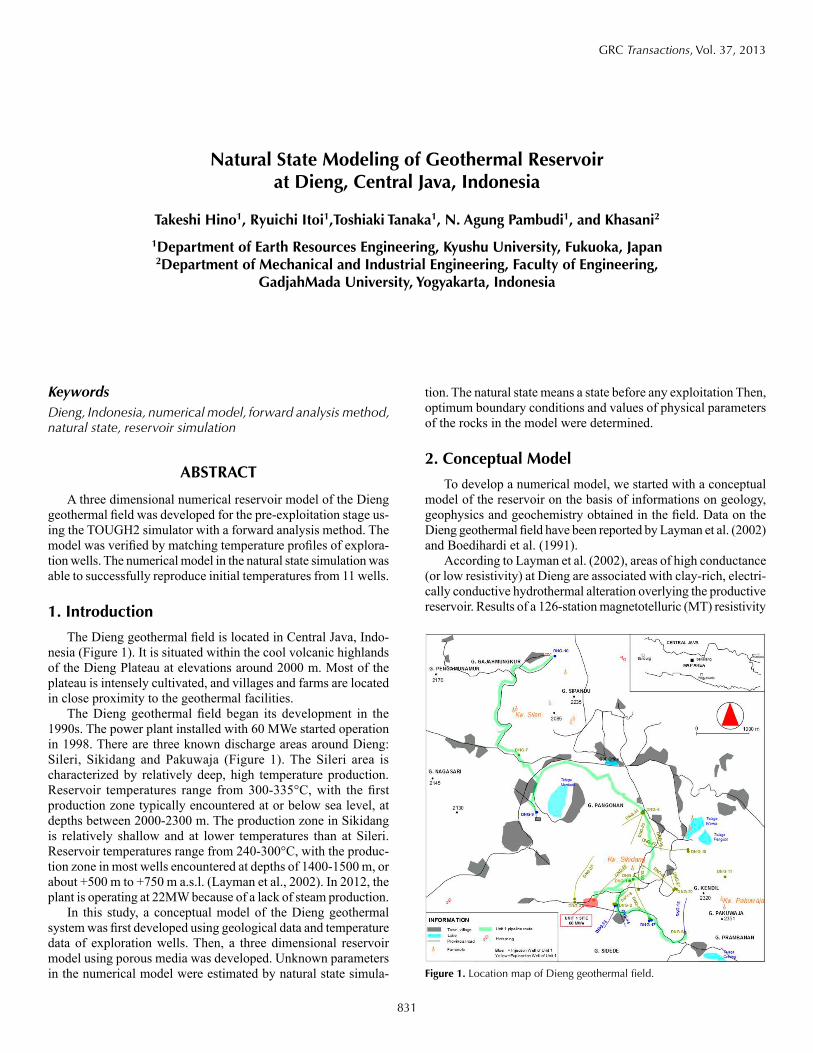
The Dieng geothermal field is located in Central Java, Indo-nesia (Figure 1). It is situated within the cool volcanic highlands of the Dieng Plateau at elevations around 2000 m. Most of the plateau is intensely cultivated, and villages and farms are located in close proximity to the geothermal facilities.
The Dieng geothermal field began its development in the 1990s. The power plant installed with 60 MWe started operation in 1998. There are three known discharge areas around Dieng: Sileri, Sikidang and Pakuwaja (Figure 1). The Sileri area is characterized by relatively deep, high temperature production. Reservoir temperatures range from 300-335°C, with the first production zone typically encountered at or below sea level, at depths between 2000-2300 m. The production zone in Sikidang is relatively shallow and at lower temperatures than at Sileri. Reservoir temperatures range from 240-300°C, with the produc-tion zone in most wells encountered at depths of 1400-1500 m, or about +500 m to +750 m a.s.l. (Layman et al., 2002). In 2012, the plant is operating at 22MW because of a lack of steam production.
In this study, a conceptual model of the Dieng geothermal system was first developed using geological data and temperature data of exploration wells. Then, a three dimensional reservoir model using porous media was developed. Unknown parameters in the numerical model were estimated by natural state simula-
tion. The natural state means a state before any exploitation Then, optimum boundary conditions and values of physical parameters of the rocks in the model were determined.
2. conceptual Model
To develop a numerical model, we started with a conceptual model of the reservoir on the basis of informations on geology, geophysics and geochemistry obtained in the field. Data on the Dieng geothermal field have been reported by Layman et al. (2002) and Boedihardi et al. (1991).
According to Layman et al. (2002), areas of high conductance (or low resistivity) at Dieng are associated with clay-rich, electri-cally conductive hydrothermal alteration overlying the productive reservoir. Results of a 126-station magnetotelluric (MT) resistivity
Natural state Modeling of Geothermal reservoir at Dieng, central Java, Indonesia
takeshi Hino1, ryuichi Itoi1,toshiaki tanaka1, N. Agung Pambudi1, and Khasani2
1Department of Earth resources Engineering, Kyushu University, Fukuoka, Japan2Department of Mechanical and Industrial Engineering, Faculty of Engineering,
GadjahMada University, Yogyakarta, Indonesia
Figure 1. Location map of Dieng geothermal field.

832
Hino, et al.
survey conducted in Dieng are summarized in a map of total conductance to 1 km depth (Figure 2). An elongated, northwest-trending area of high conductivity (log total conductance >2.0), with dimension 3 km×10 km, encloses the three main fumarolic areas. Within this broad conductive region, three separate and more intense anomalies (log total conductance >2.4) are associ-ated with the fumarolic areas at Sileri, Sikidang and Pakuwaja. Therefore, we assumed that there are domical high temperature zones at depth (Figure 3).
According to Boedihardi et al. (1992), there are faults running from northwest to southeast between Sileri and Sikidang (Figure4). The conceptual model for the Dieng geothermal field was then developed accordingly as shown in Figure 3. Two heat sources exist at deep zone below the Sileri and Sikidang areas, then high temperature fluid flows laterally from northwest to southeast at or near sea level. Fluid then discharges at the surface in the two fumarole regions: Sileri and Sikidang.
3. Numerical simulation3.1 Grid System
The code Mulgraph was used as pre-and postprocessor (O’Sullivan and Bullivant, 1995). The grid system of the numerical model measures 8.0 km by 8.5 km. Elevation of the model was given in a range from -2.0 km to 2.0 km above sea level. Figure 5 shows the three dimensional blocks of the numerical model. The model consists of 4560 grids in a size ranging from 250 m by 250 m to 1.0 km by 1.0 km. The model was further divided into 12 layers in the vertical direction with different thickness ranging from 200 m to 1.0 km. 12 layers were named starting with Layer A from the top of the model down to Layer L at the bottom layer.
3.2 Rock PropertiesAfter the grid system of the model was developed, the next
step is to divide the system into several zones on the basis of in-formation on geology, reservoir boundary, and location of faults. Then, rock properties are assigned to each zone.
The rock properties consist of density, porosity, permeability, thermal conductivity and specific heat, of which permeability is considered as the most important parameter in controlling fluid
Figure 2. Map of log total conductance (mho) to 1 km depth (Layman et al., 2002).
Figure 3. Conceptual model of the Dieng geothermal field.
Figure 4. Geological map of the Dieng geothermal field (Boedihardi, 1992).

833
Hino, et al.
flow in geothermal systems. Twelve rock types were used in this study to express heterogeneous and isotropic characters of the model mainly in permeability. Permeability-thickness products (kh) of wells were determined from well testing, and their values range from 1.3 to 6.5 darcy-m. These kh values were used as an initial guess of permeability of rock types by assuming a thick-ness of the formation.
Other rock properties were given the same values for all rock types density, porosity, thermal conductivity and specific heat as 2500 kg/m3, 0.1, 2.5W/m/K and 1000 J/kg/K, respectively. Then, rock type was assigned for each grid on the basis of con-ceptual model, and the distribution of rock types at each layer are shown in Figure 6. In order to realize surface discharges at Sileri and Sikidang, high permeable rock type was given in these areas and other areas in Layer A was assigned with low permeable rock type.
4. calibration of the Model – Natural state simulationOptimal values of permeabilities of rock types and recharge
rate of high temperature fluid and its specific enthalpy were estimated through natural state simulation. The simulation was conducted with the code TOUGH2 (Pruess et al., 1999).
Simulation results were compared with temperature profiles in 11 exploration wells. If the agreement between two kinds of temperature profiles was not good, the following conditions were adjusted: the amount of high temperature fluid recharge rate, heat flux at the bottom layer and permeabilities of rock types. Then, the
simulation was repeated. This process was iterated until good agreement with well temperature was obtained (Ishido, 2002).
The simulation period was given as 2 million years. Locations of 11 wells are shown in Figure 7. As for the initial con-ditions, the model domain was filled with water at 15°C under hydrostatic conditions. For the boundary conditions, constant temperature and pressure of atmosphere were given as 15°C and 0.803 bar at the top surface. Peripheries of the model were considered to be impermeable to mass and adiabatic to heat. Two zones were assigned for mass recharges as shown in Figure 7. Recharge A and B were assigned at the bottom layer below the Sileri and Sikidang areas, respectively. These locations were determined on the basis of the concep-tual model. Flow rate of Recharge A was estimated to be 18 kg/s with enthalpy of 1672 kJ/kg. For Recharge B, 6.5 kg/s and 1345 kJ/kg were estimated. The heat flux of 0.1 W/m2 was given to all grids at the bottom layer.
Figure 5. Three dimensional grid blocks for the numerical model of Dieng geothermal field.
Figure 6. Distribution of rock types in layers.
Figure 7. Locations of exploration well and mass source.
834
Hino, et al.
5. simulation results and Discussion
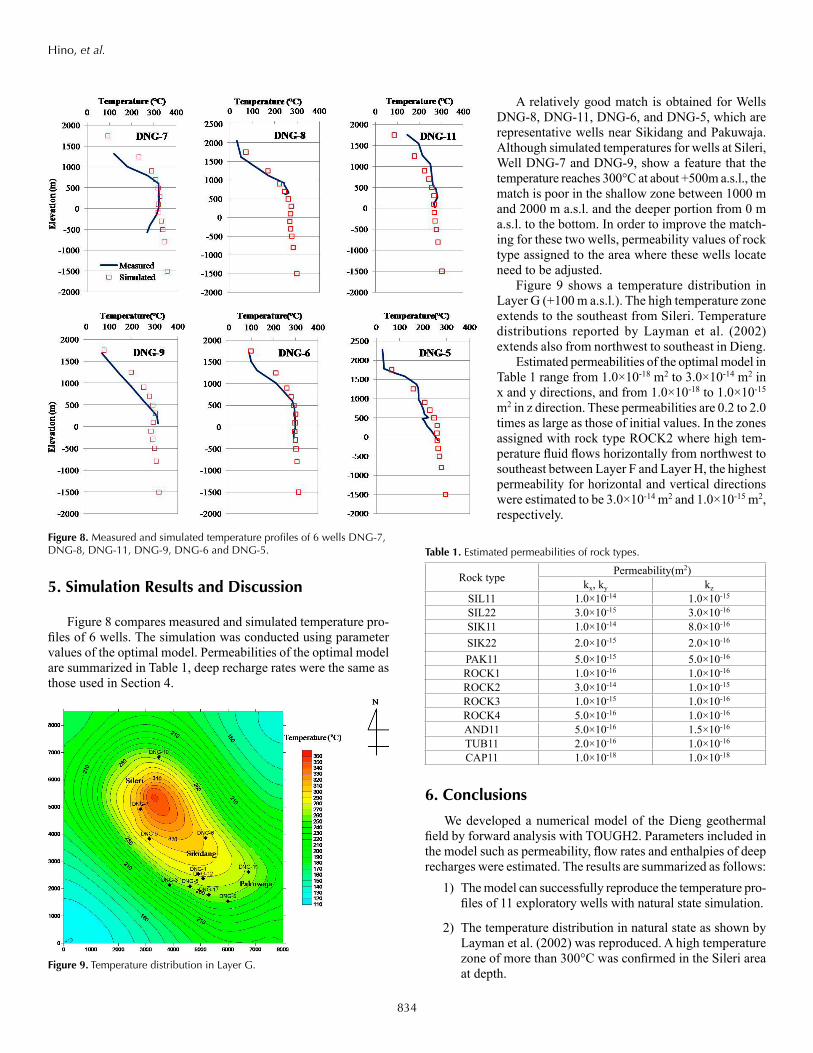
Figure 8 compares measured and simulated temperature pro-files of 6 wells. The simulation was conducted using parameter values of the optimal model. Permeabilities of the optimal model are summarized in Table 1, deep recharge rates were the same as those used in Section 4.
A relatively good match is obtained for Wells DNG-8, DNG-11, DNG-6, and DNG-5, which are representative wells near Sikidang and Pakuwaja. Although simulated temperatures for wells at Sileri, Well DNG-7 and DNG-9, show a feature that the temperature reaches 300°C at about +500m a.s.l., the match is poor in the shallow zone between 1000 m and 2000 m a.s.l. and the deeper portion from 0 m a.s.l. to the bottom. In order to improve the match-ing for these two wells, permeability values of rock type assigned to the area where these wells locate need to be adjusted.
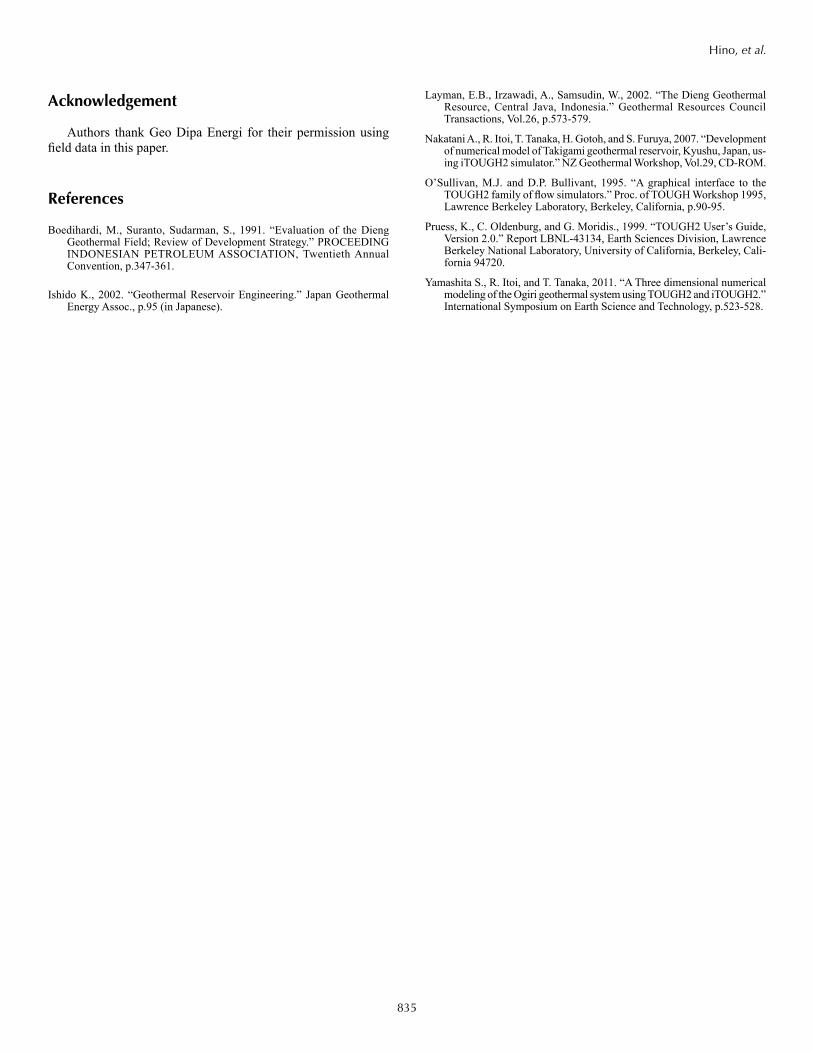
Figure 9 shows a temperature distribution in Layer G (+100 m a.s.l.). The high temperature zone extends to the southeast from Sileri. Temperature distributions reported by Layman et al. (2002) extends also from northwest to southeast in Dieng.
Estimated permeabilities of the optimal model in Table 1 range from 1.0×10⁻¹⁸ m2 to 3.0×10⁻¹⁴ m2 in x and y directions, and from 1.0×10⁻¹⁸ to 1.0×10⁻¹⁵ m2 in z direction. These permeabilities are 0.2 to 2.0 times as large as those of initial values. In the zones assigned with rock type ROCK2 where high tem-perature fluid flows horizontally from northwest to southeast between Layer F and Layer H, the highest permeability for horizontal and vertical directions were estimated to be 3.0×10⁻¹⁴ m2 and 1.0×10⁻¹⁵ m2, respectively.
6. conclusions
We developed a numerical model of the Dieng geothermal field by forward analysis with TOUGH2. Parameters included in the model such as permeability, flow rates and enthalpies of deep recharges were estimated. The results are summarized as follows:
1) The model can successfully reproduce the temperature pro-files of 11 exploratory wells with natural state simulation.
2) The temperature distribution in natural state as shown by Layman et al. (2002) was reproduced. A high temperature zone of more than 300°C was confirmed in the Sileri area at depth.
Figure 8. Measured and simulated temperature profiles of 6 wells DNG-7, DNG-8, DNG-11, DNG-9, DNG-6 and DNG-5.
Figure 9. Temperature distribution in Layer G.
table 1. Estimated permeabilities of rock types.
Rock type Permeability(m2)kx, ky kz
SIL11 1.0×10⁻¹⁴ 1.0×10⁻¹⁵
SIL22 3.0×10⁻¹⁵ 3.0×10⁻¹⁶
SIK11 1.0×10⁻¹⁴ 8.0×10⁻¹⁶
SIK22 2.0×10⁻¹⁵ 2.0×10⁻¹⁶
PAK11 5.0×10⁻¹⁵ 5.0×10⁻¹⁶
ROCK1 1.0×10⁻¹⁶ 1.0×10⁻¹⁶
ROCK2 3.0×10⁻¹⁴ 1.0×10⁻¹⁵
ROCK3 1.0×10⁻¹⁵ 1.0×10⁻¹⁶
ROCK4 5.0×10⁻¹⁶ 1.0×10⁻¹⁶
AND11 5.0×10⁻¹⁶ 1.5×10⁻¹⁶
TUB11 2.0×10⁻¹⁶ 1.0×10⁻¹⁶
CAP11 1.0×10⁻¹⁸ 1.0×10⁻¹⁸
835
Hino, et al.
Acknowledgement
Authors thank Geo Dipa Energi for their permission using field data in this paper.
references
Boedihardi, M., Suranto, Sudarman, S., 1991. “Evaluation of the Dieng Geothermal Field; Review of Development Strategy.” PROCEEDING INDONESIAN PETROLEUM ASSOCIATION, Twentieth Annual Convention, p.347-361.
Ishido K., 2002. “Geothermal Reservoir Engineering.” Japan Geothermal Energy Assoc., p.95 (in Japanese).
Layman, E.B., Irzawadi, A., Samsudin, W., 2002. “The Dieng Geothermal Resource, Central Java, Indonesia.” Geothermal Resources Council Transactions, Vol.26, p.573-579.
Nakatani A., R. Itoi, T. Tanaka, H. Gotoh, and S. Furuya, 2007. “Development of numerical model of Takigami geothermal reservoir, Kyushu, Japan, us-ing iTOUGH2 simulator.” NZ Geothermal Workshop, Vol.29, CD-ROM.
O’Sullivan, M.J. and D.P. Bullivant, 1995. “A graphical interface to the TOUGH2 family of flow simulators.” Proc. of TOUGH Workshop 1995, Lawrence Berkeley Laboratory, Berkeley, California, p.90-95.
Pruess, K., C. Oldenburg, and G. Moridis., 1999. “TOUGH2 User’s Guide, Version 2.0.” Report LBNL-43134, Earth Sciences Division, Lawrence Berkeley National Laboratory, University of California, Berkeley, Cali-fornia 94720.
Yamashita S., R. Itoi, and T. Tanaka, 2011. “A Three dimensional numerical modeling of the Ogiri geothermal system using TOUGH2 and iTOUGH2.” International Symposium on Earth Science and Technology, p.523-528.

836