natural variation in brachypodium links vernalization and ... · 182 vernalization periods showed...
TRANSCRIPT

1 Short title:
2 Natural variation in B. distachyon flowering time
3
4
5
6 Corresponding authors:
7 John H. Doonan
8 Institute of Biological, Environmental and Rural Sciences
9 Aberystwyth University
10 Aberystwyth
11 SY23 3DA
12 United Kingdom
13 Tel: +44 (0) 1970 823080
14 Email: [email protected]
15
16 Matthew J. Moscou
17 The Sainsbury Laboratory
18 Norwich Research Park
19 Norwich
20 NR4 7UH
21 United Kingdom
22 Tel: +44 (0)1603 450296
23 Email: [email protected]

24 Title:
25 Natural variation in Brachypodium links vernalization and flowering time loci as major
26 flowering determinants
27
28
29 Authors:
30 Jan Bettgenhaeuser1, Fiona M.K. Corke
2,3, Magdalena Opanowicz
3, Phon Green
1, Inmaculada
31 Hernández-Pinzón1, John H. Doonan
2,3, Matthew J. Moscou
1,4
32
33 Affiliations:
34 1The Sainsbury Laboratory, Norwich, NR4 7UH, United Kingdom
35 2Institute of Biological, Environmental and Rural Sciences, Aberystwyth University,
36 Aberystwyth, SY23 3DA, United Kingdom
37 3John Innes Centre, Norwich, NR4 7UH, United Kingdom
38 4School of Biological Sciences, University of East Anglia, Norwich, NR4 7TJ, United
39 Kingdom
40
41
42
43 One sentence summary:
44 Standing genetic variation for flowering time in a non-domesticated grass encompasses
45 known and novel regulators.
46 Footnotes:
47
48 Author contributions
49 JB, FC, MO, JD, and MM conceived the study, and participated in its design and
50 coordination. PG and IHP participated in the experiments. JB, FC, JD, and MM wrote the
51 manuscript. All authors read and approved the final manuscript.
52
53
54 Funding information
55 The work was funded by the Biotechnology and Biological Sciences Research Council
56 Doctoral Training Programme (BB/F017294/1) and Institute Strategic Programme
57 (BB/J004553/1), the Gatsby Charitable Foundation, the Leverhulme Trust (Grant reference
58 10754), the 2Blades Foundation, and the Human Frontiers Science Program
59 (LT000218/2011).
60
61
62 Present addresses
63 Magdalena Opanowicz
64 Thermo Fisher Scientific, Paisley, PA4 9RF, United Kingdom
65
66
67 Corresponding authors email addresses
68 John H. Doonan – [email protected]
69 Matthew J. Moscou – [email protected]
70 Abstract
71 The domestication of plants is underscored by the selection of agriculturally favorable
72 developmental traits, including flowering time, which resulted in the creation of varieties
73 with altered growth habits. Research into the pathways underlying these growth habits in
74 cereals has highlighted the role of three main flowering regulators: VRN1, VRN2, and FT.
75 Previous reverse genetic studies suggested that the roles of VRN1 and FT are conserved in
76 Brachypodium distachyon, yet identified considerable ambiguity surrounding the role of
77 VRN2. To investigate the natural diversity governing flowering time pathways in a non-
78 domesticated grass, the reference B. distachyon accession Bd21 was crossed with the
79 vernalization-dependent accession ABR6. Resequencing of ABR6 allowed the creation of a
80 SNP-based genetic map at the F4 stage of the mapping population. Flowering time was
81 evaluated in F4:5 families in five environmental conditions and three major loci were found to
82 govern flowering time. Interestingly, two of these loci colocalize with the B. distachyon
83 homologs of the major flowering pathway genes VRN2 and FT, whereas no linkage was
84 observed at VRN1. Characterization of these candidates identified sequence and expression
85 variation between the two parental genotypes, which may explain the contrasting growth
86 habits. However, the identification of additional QTLs suggests that greater complexity
87 underlies flowering time in this non-domesticated system. Studying the interaction of these
88 regulators in B. distachyon provides insights into the evolutionary context of flowering time
89 regulation in the Poaeceae, as well as elucidates the way humans have utilized the natural
90 variation present in grasses to create modern temperate cereals.
91 Introduction
92 Coordination of flowering time with geographic location and seasonal weather patterns has a
93 profound effect on flowering and reproductive success (Amasino, 2010). The mechanisms
94 underpinning this coordination are of great interest for understanding plant behavior and
95 distribution within natural ecosystems (Wilczek et al., 2010). Plants that fail to flower at the
96 appropriate time are unlikely to be maximally fertile and therefore will be less competitive in
97 the longer term. Likewise, optimal flowering time in crops is important for yield and quality:
98 seed and fruit crops need to flower early enough to allow ripening or to utilize seasonal rains,
99 while delayed flowering may be advantageous for leaf and forage crops (Distelfeld et al.,
100 2009; Jung and Müller, 2009).
101
102 Although developmental progression towards flowering can be modulated in several ways,
103 many plants have evolved means to detect seasonal episodes of cold weather and adjust their
104 flowering time accordingly, a process known as vernalization (Ream et al., 2012). Despite the
105 importance of flowering time, the molecular and genetic mechanisms underlying this
106 dependency have been studied in only a few systems, notably the Brassicaceae, Poaceae, and
107 Amaranthaceae (Andrés and Coupland, 2012; Ream et al., 2012). Three major
108 VERNALIZATION (VRN) genes appear to act in a regulatory loop in temperate grasses. The
109 wheat VRN1 gene is a MADS-box transcription factor, which is induced in the cold (Yan et
110 al., 2003; Andrés and Coupland, 2012). This gene is related to the Arabidopsis thaliana genes
111 APETALA1 and FRUITFUL (Yan et al., 2003; Andrés and Coupland, 2012). VRN2 encodes a
112 small CCT-domain protein (Yan et al., 2004) that is repressed by VRN1 and in turn represses
113 FLOWERING LOCUS T (FT), a strong universal promoter of flowering (Kardailsky et al.,
114 1999; Yan et al., 2006; Andrés and Coupland, 2012; Ream et al., 2012). In cereals, active
115 VRN2 alleles are necessary for a vernalization requirement. Spring barley and spring wheat
116 varieties, which do not require vernalization to flower, either lack VRN2 (Dubcovsky et al.,
117 2005; Karsai et al., 2005; von Zitzewitz et al., 2005), have point mutations in the conserved
118 CCT domain (Yan et al., 2004), or possess dominant constitutively active alleles of VRN1
119 (repressor of VRN2) (Yan et al., 2003; Fu et al., 2005) or FT (repressed by VRN2) (Yan et al.,
120 2006).
121
122 Investigations on the regulation of flowering in the Poaceae have focused on rice (Oryza
123 sativa), wheat (Triticum aestivum), and barley (Hordeum vulgare), all domesticated species
124 that have been heavily subjected to human selection over the past 10,000 years. Little
125 information is available on wild species within this family that have not been subjected to
126 human selection. Such a study could provide additional insights into the standing variation
127 present within wild systems and its likely pre-domestication adaptive significance in the
128 Poaceae (Schwartz et al., 2010). A favorable species for such a study is Brachypodium
129 distachyon, a small, wild grass, with a sequenced and annotated genome. B. distachyon was
130 originally developed as a model system for the agronomically important temperate cereals
131 (Draper et al., 2001; Opanowicz et al., 2008; The International Brachypodium Initiative,
132 2010; Catalán et al., 2014). With the recent availability of geographically dispersed diversity
133 collections, we can ask how wild grasses have adapted to different climatic zones.
134
135 Previous studies have begun to explore the molecular basis of vernalization in this system.
136 Higgins et al. (2010) identified homologs of the various flowering pathway genes in B.
137 distachyon, and several mainly reverse genetic studies have focused on characterizing these
138 genes further (Schwartz et al., 2010; Lv et al., 2014; Ream et al., 2014; Woods et al., 2014;
139 Woods et al., 2016). Schwartz et al. (2010) did not find complete correlation between
140 expression of VRN1 and flowering and hypothesized that VRN1 could therefore have
141 different activity or roles that are dependent on the genetic background. Yet, Ream et al.
142 (2014) found low VRN1 and FT levels in B. distachyon accessions with delayed flowering,
143 suggesting a conserved role of these homologs. Further support for a conserved role of VRN1
144 and FT comes from the observation that overexpression of these genes leads to extremely
145 early flowering (Lv et al., 2014; Ream et al., 2014) and RNAi-based silencing of FT and
146 amiRNA-based silencing of VRN1 prevent flowering (Lv et al., 2014; Woods et al., 2016).
147 The role of VRN2 in B. distachyon is less clear. Higgins et al. (2010) failed to identify a
148 homolog of VRN2 in B. distachyon; however, other studies identified Bradi3g10010 as the
149 best candidate for the B. distachyon VRN2 homolog (Schwartz et al., 2010; Ream et al.,
150 2012). Recent research supports the functional conservation of VRN2 in the role as a
151 flowering repressor, but suggests that the regulatory interaction between VRN1 and VRN2
152 evolved after the diversification of the Brachypodieae and the core Pooideae (e.g. wheat and
153 barley) (Woods et al., 2016).
154
155 To date most studies on the regulation of flowering time of B. distachyon have used reverse
156 genetic approaches to implicate the role of previously characterized genes from other species
157 (Higgins et al., 2010; Lv et al., 2014; Ream et al., 2014; Woods et al., 2016), while only few
158 studies have used the natural variation present among B. distachyon accessions to identify

159 flowering loci (Tyler et al., 2016; Wilson et al., 2016). Currently lacking is the
160 characterization of loci that control variation in flowering time in a biparental B. distachyon
161 mapping population. The Iraqi reference accession Bd21 does not require vernalization
162 (Vogel et al., 2006; Garvin et al., 2008) and in addition, vernalization does not greatly reduce
163 time to flowering in a 16 h or 20 h photoperiod (Schwartz et al., 2010; Ream et al., 2014). In
164 contrast, the Spanish accession ABR6 can be induced to flower following a six-week
165 vernalization period (Draper et al., 2001; Routledge et al., 2004).
166
167 In this paper, we report on the genetic architecture underlying flowering time in a mapping
168 population developed from ABR6 and Bd21. We observed the segregation of vernalization
169 dependency during population advancement (Figure 1) and characterized the genetic basis of
170 this dependency in detail at the F4:5 stage in multiple environments. The ability to flower
171 without vernalization was linked to three major loci, two of which colocalize with the B.
172 distachyon homologs of VRN2 and FT. Notably, our results further support the role of the
173 VRN2 locus as a conserved flowering time regulator in B. distachyon.
174
175
176
177 Results
178
179 Development of a B. distachyon mapping population between geographically and
180 phenotypically distinct accessions
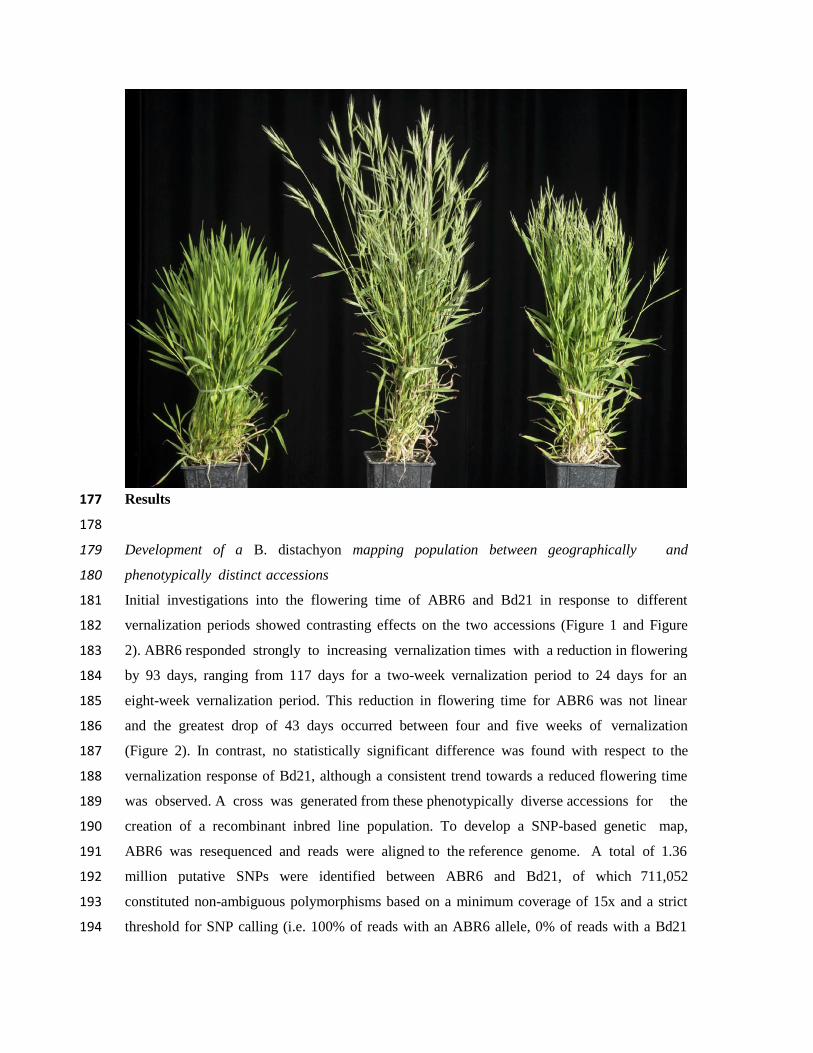
181 Initial investigations into the flowering time of ABR6 and Bd21 in response to different
182 vernalization periods showed contrasting effects on the two accessions (Figure 1 and Figure
183 2). ABR6 responded strongly to increasing vernalization times with a reduction in flowering
184 by 93 days, ranging from 117 days for a two-week vernalization period to 24 days for an
185 eight-week vernalization period. This reduction in flowering time for ABR6 was not linear
186 and the greatest drop of 43 days occurred between four and five weeks of vernalization
187 (Figure 2). In contrast, no statistically significant difference was found with respect to the
188 vernalization response of Bd21, although a consistent trend towards a reduced flowering time
189 was observed. A cross was generated from these phenotypically diverse accessions for the
190 creation of a recombinant inbred line population. To develop a SNP-based genetic map,
191 ABR6 was resequenced and reads were aligned to the reference genome. A total of 1.36
192 million putative SNPs were identified between ABR6 and Bd21, of which 711,052
193 constituted non-ambiguous polymorphisms based on a minimum coverage of 15x and a strict
194 threshold for SNP calling (i.e. 100% of reads with an ABR6 allele, 0% of reads with a Bd21

195 allele). Following iterative cycles of marker selection, the final genetic map consists of 252
196 non-redundant markers and has a cumulative size of 1,753 cM (Supplemental Figure S1).
197 This size is comparable to the previously characterized Bd3-1 x Bd21 mapping population
198 (Huo et al., 2011) and confirms that B. distachyon has a high rate of recombination compared
199 to other grass species. The quality of the genetic map was verified by assessing the two-way
200 recombination fractions for all 252 markers (Supplemental Figure S2). All five chromosomes
201 were scanned for segregation distortion by comparing observed and expected genotype
202 frequencies for each marker. The expected heterozygosity at the F4 stage is 12.50% and the
203 expected parental allele frequencies are 43.75% for ABR6 and Bd21 alleles, respectively.
204 Although all five chromosomes contained regions of potential segregation distortion (Figure
205 3), only two loci on chromosomes Bd1 (peak at 474.1 cM) and Bd4 (peak at 77.0 cM)
206 deviated significantly from these expected frequencies.
207

208 Multiple QTLs control flowering in the ABR6 x Bd21 mapping population
209 We evaluated the ABR6 x Bd21 F4:5 population in a number of environments to identify the
210 genetic architecture underlying flowering time (Supplemental Table S1 and Supplemental
211 Data S1). Four sets of the population were grown without vernalization, whereas in one
212 additional set flowering was scored in response to six weeks of vernalization. In all
213 experiments, the population was exposed to natural light, although in three experiments
214 supplemental light was used to ensure a minimum 16 h or 20 h growth period. In addition,
215 two experiments did not have any temperature control (i.e. plants were exposed to the natural
216 temperature in the greenhouse), three experiments had the temperature controlled at
217 22°C/20°C during light/dark cycles, and one experiment had the temperature maintained at a
218 minimum of 18°C/11.5°C during light/dark cycles. Analysis of the non-vernalized
219 environments revealed a bimodal distribution between families that flowered and families
220 that did not flower (Figure 4). However, considerable residual variation in flowering time
221 existed among the flowering families. For example, in Environment 5 flowering occurred
222 over a 42-day period from 63 days to 105 days after germination (Figure 4E). Flowering in
223 the other non-vernalized environments occurred over a similar time period (Figure 4).
224 Interestingly, transgressive segregation for early and late flowering phenotypes was observed
225 in Environment 4 (Figure 4D). Phenotypes in the vernalized environment were heavily
226 skewed towards early flowering (Figure 4B). Only limited residual variation existed among
227 the vernalized F4:5 families and all plants flowered within 11 days from the first observation
228 of flowering in the population. The variation in flowering time for all five environments was
229 found to be not normally distributed. Among these diverse environments, QTL analyses
230 using binary and non-parametric models were conservative in detecting QTLs controlling
231 flowering time (qFLT) (Supplemental Table S2 and Supplemental Table S3), whereas
232 transformation of flowering time consistently identified QTLs between environments
233 (Supplemental Table S4 and Supplemental Table S5; Table 1 and Table 2). Three major
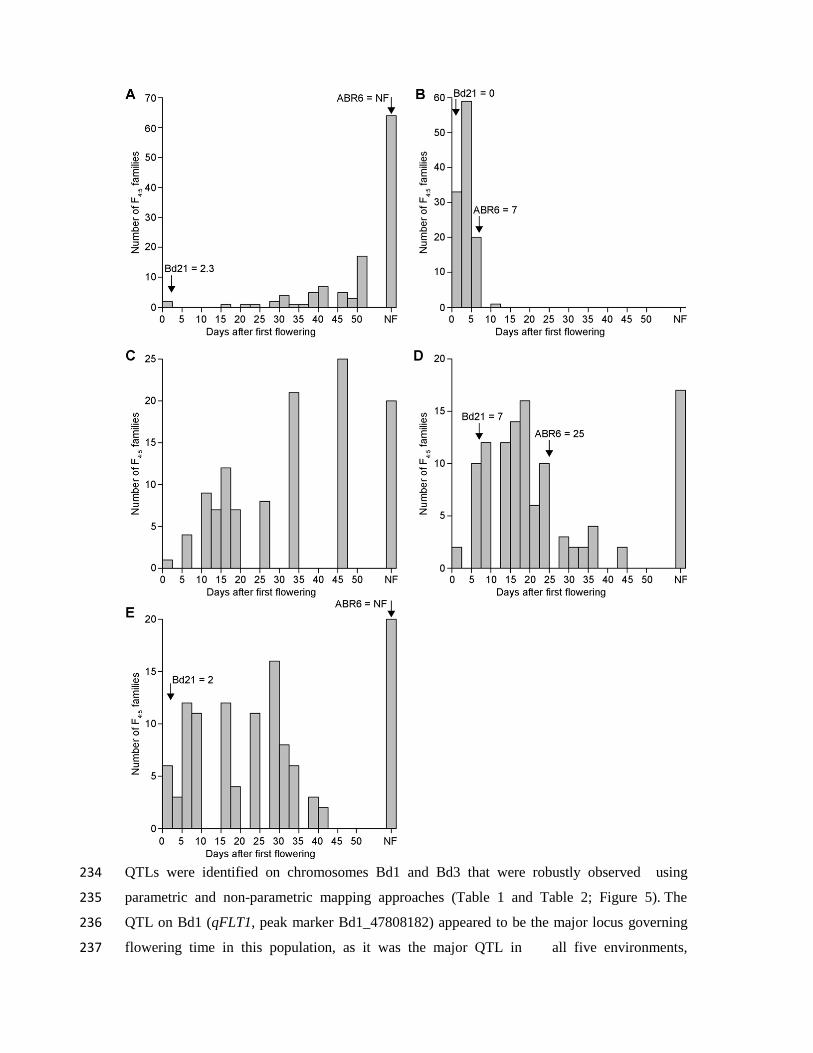
234 QTLs were identified on chromosomes Bd1 and Bd3 that were robustly observed using
235 parametric and non-parametric mapping approaches (Table 1 and Table 2; Figure 5). The
236 QTL on Bd1 (qFLT1, peak marker Bd1_47808182) appeared to be the major locus governing
237 flowering time in this population, as it was the major QTL in all five environments,

238 explaining the most phenotypic variation (phenotypic variance explained; PVE) compared to
239 any other QTL (Table 2). PVE values for this locus ranged from 15.9% to 37.5%. Another
240 QTL on Bd3 (qFLT6, peak marker Bd3_8029207) was also detected in all five studies,
241 though its contribution was only significant in three environments. PVE values for the
242 statistically significant QTLs ranged from 11.8% to 18.7%. Bd21 alleles at these two loci
243 promoted early flowering, whereas individuals with ABR6 alleles at both loci had maximal
244 flowering time or did not flower within the timescale of the experiment (Figure 6).
245 Interestingly, in the two environments where this former locus did not have a significant
246 contribution, two other QTLs were identified. A QTL on Bd3 (qFLT7, peak marker
247 Bd3_44806296) explained 13.6% and 14.0% of the variation observed in these studies and a
248 QTL on Bd2 (qFLT3, peak marker Bd2_53097824) was identified through a combination of
249 non-parametric and parametric analyses of Environments 4 and 5. Additional QTLs on Bd1
250 (qFLT2), Bd2 (qFLT4), Bd3 (qFLT5), and Bd4 (qFLT8) were not significant in more than
251 one of the environments tested (Table 1).
252
253 Previous studies identified the B. distachyon homologs of flowering regulators from
254 Arabidopsis, wheat, barley, and rice (Higgins et al., 2010; Ream et al., 2014). The one-LOD
255 support intervals of all statistically significant QTLs were combined to identify the maximal
256 one-LOD support interval for each QTL. Several of the previously identified B. distachyon
257 homologs of flowering regulators are candidate genes underlying these QTLs (Table 3).
258 Although several homologs fall within the one-LOD support intervals of qFLT1 on Bd1
259 (292.1 - 305.6 cM) and qFLT6 on the short arm of Bd3 (72.9 - 97.0 cM), these loci also
260 harbor the B. distachyon homologs of FT (Bradi1g48830) and VRN2 (Bradi3g10010), which
261 have been previously implicated in flowering time regulation in B. distachyon through a
262 series of mainly reverse genetic studies (Lv et al., 2014; Ream et al., 2014; Woods et al.,
263 2014; Woods et al., 2016).

264
265 Natural variation in FT and VRN2
266 Analysis of the resequencing and RNAseq data allowed an initial evaluation of candidate
267 genes underlying these QTLs. A de novo assembly was created from the ABR6 resequencing
268 reads and the resulting contigs were probed with the Bd21 sequences of FT (Bradi1g48830)
269 and VRN2 (Bradi3g10010), enabling the identification of structural variation between ABR6
270 and Bd21 (Figure 7; Supplemental Table S6). Spliced alignment of RNAseq reads permits
271 further characterization of candidate genes underlying an identified QTL through the
272 confirmation of polymorphisms between two parental genotypes, verification of annotated
273 candidate gene models, qualitative assessment of expression of candidate genes in the
274 sampled tissue, and discovery of potential splice variants.
275
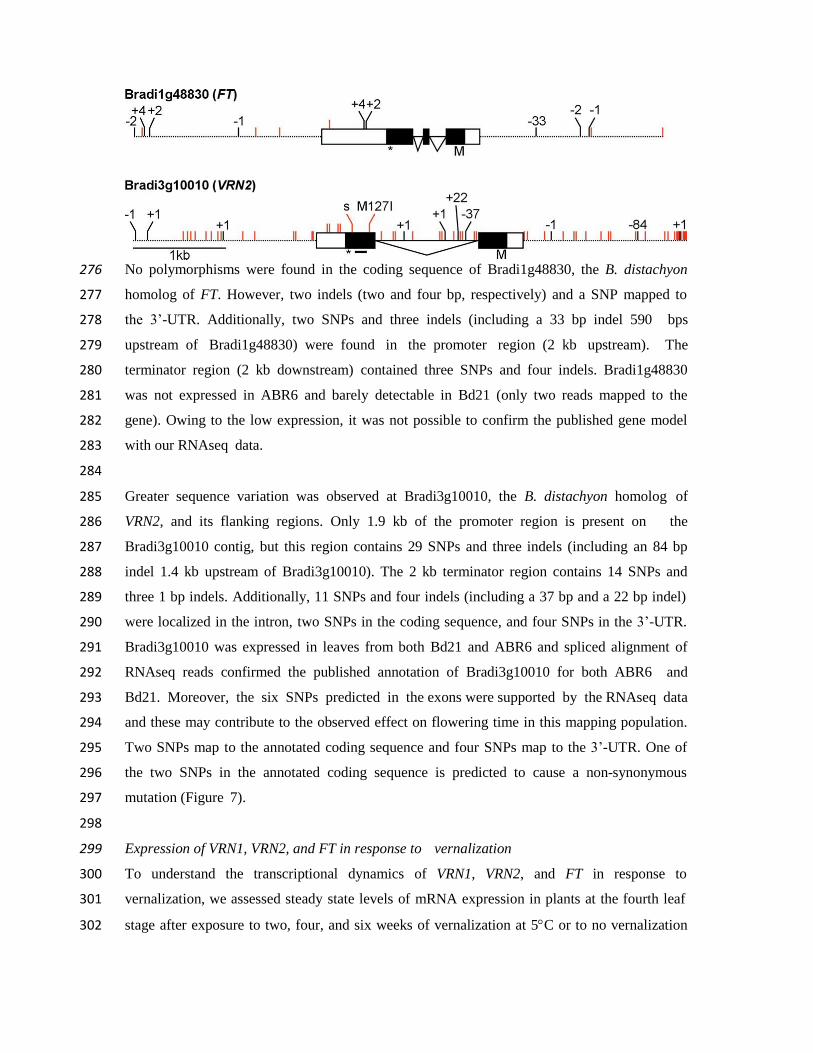
276 No polymorphisms were found in the coding sequence of Bradi1g48830, the B. distachyon
277 homolog of FT. However, two indels (two and four bp, respectively) and a SNP mapped to
278 the 3’-UTR. Additionally, two SNPs and three indels (including a 33 bp indel 590 bps
279 upstream of Bradi1g48830) were found in the promoter region (2 kb upstream). The
280 terminator region (2 kb downstream) contained three SNPs and four indels. Bradi1g48830
281 was not expressed in ABR6 and barely detectable in Bd21 (only two reads mapped to the
282 gene). Owing to the low expression, it was not possible to confirm the published gene model
283 with our RNAseq data.
284
285 Greater sequence variation was observed at Bradi3g10010, the B. distachyon homolog of
286 VRN2, and its flanking regions. Only 1.9 kb of the promoter region is present on the
287 Bradi3g10010 contig, but this region contains 29 SNPs and three indels (including an 84 bp
288 indel 1.4 kb upstream of Bradi3g10010). The 2 kb terminator region contains 14 SNPs and
289 three 1 bp indels. Additionally, 11 SNPs and four indels (including a 37 bp and a 22 bp indel)
290 were localized in the intron, two SNPs in the coding sequence, and four SNPs in the 3’-UTR.
291 Bradi3g10010 was expressed in leaves from both Bd21 and ABR6 and spliced alignment of
292 RNAseq reads confirmed the published annotation of Bradi3g10010 for both ABR6 and
293 Bd21. Moreover, the six SNPs predicted in the exons were supported by the RNAseq data
294 and these may contribute to the observed effect on flowering time in this mapping population.
295 Two SNPs map to the annotated coding sequence and four SNPs map to the 3’-UTR. One of
296 the two SNPs in the annotated coding sequence is predicted to cause a non-synonymous
297 mutation (Figure 7).
298
299 Expression of VRN1, VRN2, and FT in response to vernalization
300 To understand the transcriptional dynamics of VRN1, VRN2, and FT in response to
301 vernalization, we assessed steady state levels of mRNA expression in plants at the fourth leaf
302 stage after exposure to two, four, and six weeks of vernalization at 5C or to no vernalization

303 (Figure 8). VRN1 and FT had a similar pattern in steady state levels of gene expression in
304 response to vernalization (Figure 8A and 8C). For both genes, very low levels of expression
305 were observed in ABR6, whereas Bd21 had fairly high levels of transcript abundance. After
306 experiencing four weeks of vernalization, ABR6 had similar levels of VRN1 transcript as
307 Bd21 without vernalization treatment. In contrast, FT expression had a marginal increase
308 after four and six weeks of vernalization in ABR6 relative to no vernalization or two weeks
309 of vernalization. FT expression levels were significantly lower than Bd21 across all periods
310 of vernalization. Both VRN1 and FT expression increased significantly between Bd21
311 examples vernalized for two or four weeks. VRN2 expression in ABR6 was inversely
312 correlated with the length of vernalization, with similar levels of expression after no
313 vernalization and two weeks vernalization and increasingly lower levels of expression after
314 four and six weeks of vernalization (Figure 8B). Bd21 exhibited a similar reduction in VRN2
315 expression, although lower levels of expression were observed without vernalization
316 compared to ABR6 with six weeks vernalization. The trends of all three genes highlighted the
317 importance of four weeks of vernalization as the inflection point in transcriptional abundance,
318 which coincides with a significant reduction in days to flowering in ABR6 (Figure 2).
319
320
321

322 Discussion
323
324 In our advancement of the ABR6 x Bd21 RIL population, we observed substantial variation
325 in flowering time. To define the genetic architecture of flowering time, we developed a
326 comprehensive genetic map and assessed F4:5 families in multiple environments. We
327 uncovered three major QTLs, with two QTLs coincident with the B. distachyon homologs of
328 VRN2 and FT. Interestingly, VRN1 was not associated with flowering time and was found to
329 have no mutations within the transcribed sequence (Supplemental Table S6). Further minor
330 effect QTLs were identified, suggesting that additional regulators play a role in controlling
331 flowering time in B. distachyon.
332
333 Segregation distortion in the ABR6 x Bd21 population
334 Segregation distortion is a common observation in the development of mapping populations
335 in plants, including grasses such as rice, Aegilops, maize, or barley (Xu et al., 1997; Faris et
336 al., 1998; Lu et al., 2002; Muñoz-Amatriaín et al., 2011). In the ABR6 x Bd21 population,
337 significant deviation from expected genotype frequencies was observed at two loci on
338 chromosomes Bd1 and Bd4 (Figure 3). Interestingly, heterozygosity was not affected at these
339 loci, but the ABR6 allele was overrepresented. It is likely that these loci are linked to traits
340 that were inadvertently selected during population advancement based on genetic and/or
341 environmental factors. Several genetic mechanisms can contribute to segregation distortion in
342 intraspecific crosses, including hybrid necrosis (Bomblies and Weigel, 2007), genes involved
343 in vernalization requirement and flowering time (such as the vrn2 locus in the Haruna Nijo x
344 OHU602 doubled-haploid barley population (Muñoz-Amatriaín et al., 2011)), or preferential
345 transmission of a specific parental genotype. While segregation distortion at these loci was
346 not associated with the identified flowering time QTLs, canonical resistance genes encoding
347 nucleotide-binding, leucine-rich repeat proteins are present at the Bd4 locus (Bomblies et al.,
348 2007; Tan and Wu, 2012).
349
350 The genetic architecture of flowering time in B. distachyon
351 In Arabidopsis, natural variation has been used as a complementary forward genetics-based
352 approach for investigating flowering time (Koornneef et al., 2004). In our work, we identified
353 two major QTLs controlling flowering time (qFLT1 and qFLT6; Figure 6) in both vernalized
354 and non-vernalized environments that colocalized with the B. distachyon homologs of FT
355 (Bradi1g48830) and VRN2 (Bradi3g10010). These observations are consistent with previous

356 reverse genetic studies on the role of FT and VRN2 in controlling flowering time (Lv et al.,
357 2014; Ream et al., 2014; Woods et al., 2014; Woods et al., 2016). Two additional QTLs on
358 chromosomes Bd2 (qFLT3) and Bd3 (qFLT7) were detected in two environments, whereas
359 three minor effect QTLs (qFLT2, qFLT4, qFLT5, and qFLT8) were found in individual
360 environments only. Two recent genome-wide association studies (GWAS) used the natural
361 variation found within B. distachyon germplasm to identify SNPs associated with flowering
362 time (Tyler et al., 2016; Wilson et al., 2016). Tyler et al. (2016) identified nine significant
363 marker-trait associations, none of which overlap with the QTLs identified in our study. In
364 contrast, Wilson et al. (2016) identified a much simpler genetic architecture consisting of
365 three significant marker-trait associations, one of which could be linked to FT. These
366 additional QTLs and marker-trait associations identified in our study and the GWAS studies
367 could either correspond to one of the identified homologs of flowering genes in B. distachyon
368 (Table 3; compare Higgins et al. 2010) or constitute novel loci as hypothesized by Schwartz
369 et al. (2010). With the exception of the proximal QTL on Bd2 (qFLT3), all QTLs in our study
370 were contributed by ABR6 (Table 1). Bd21 has previously been classified as a “spring
371 annual” (Schwartz et al., 2010) or “extremely rapid flowering” (Ream et al., 2014). However,
372 increased vernalization times still led to a modest reduction in flowering time (Figure 2),
373 which is explained by the detection of a QTL contributed by Bd21.
374
375 We hypothesized that structural variation between ABR6 and Bd21 would underlie the
376 observed variation in flowering time. No structural variation in FT was observed between
377 ABR6 and Bd21 in the coding sequence, however, several indels map to the promoter region
378 (Figure 7). These polymorphisms may explain expression differences between these two
379 accessions. As expected, no FT expression was found in ABR6 seedlings, and only two Bd21
380 RNAseq reads mapped to this gene. Steady-state expression levels of FT in the fourth leaf
381 were significantly lower in ABR6 relative to Bd21 without vernalization (Figure 8C). After
382 four weeks vernalization, FT expression levels increased in ABR6, although they were
383 significantly lower than Bd21 steady-state levels after any level of vernalization. It was
384 previously shown that in barley, wheat, and B. distachyon, FT expression is upregulated after
385 vernalization (Sasani et al., 2009; Chen and Dubcovsky, 2012; Ream et al., 2014). Our
386 observations indicate that FT is expressed in Bd21 and increases less than VRN1 in response
387 to vernalization. In contrast, FT in ABR6 only increases marginally after four weeks of
388 vernalization and remains significantly below the levels observed in Bd21 after no
389 vernalization.

390
391 Interestingly, an intact copy of the flowering repressor VRN2 is also present in Bd21 (Ream
392 et al., 2012), which does not have a strong vernalization response (Vogel et al., 2006; Garvin
393 et al., 2008). The lack of vernalization requirement in some B. distachyon accessions cannot,
394 therefore, be explained by an absence of VRN2 (Ream et al., 2014). Intriguingly, early-
395 flowering mutants identified in genetic screens have thus far not mapped in the VRN2 region
396 (Ream et al., 2014). Moreover, expression levels for VRN2 also did not vary among early and
397 late flowering accessions and VRN2 mRNA levels are likely not rate limiting (Ream et al.,
398 2014). An earlier study by Schwartz et al. (2010) described potential correlation between
399 different VRN2 alleles and flowering time. The authors did not rule out the effects of
400 population structure and proposed that elucidating the role of VRN2 in B. distachyon will
401 require more in-depth genetic studies. A recent comprehensive analysis of population
402 structure in B. distachyon collections revealed that flowering time, and not geographic origin,
403 is indeed the major distinguishing factor between genotypically distinct clusters (Tyler et al.,
404 2016). Our results confirm VRN2 as an important flowering regulator in the ABR6 x Bd21
405 mapping population and highlight structural and expression variation between parental
406 accessions. However, none of the SNPs identified in the coding sequence map to the CCT
407 domain. A point mutation in this domain results in a spring growth habit in cultivated
408 Triticum monococcum accessions (Yan et al., 2004). It is unclear whether the structural
409 variation surrounding VRN2 corresponds to the allelic variation observed by Schwartz et al.
410 (2010). Woods and Amasino (2016) hypothesize that even though VRN2 may not be involved
411 in vernalization control in B. distachyon, it may still possess an ancestral role in flowering
412 regulation. This is further supported by the observation that VRN2 expression is not
413 controlled by VRN1 in B. distachyon, yet VRN2 was found to be a functional repressor of
414 flowering in this species (Woods et al., 2016). We observed a negative correlation between
415 VRN2 transcript accumulation and vernalization period in ABR6 and Bd21 (Figure 8B).
416 Similar decreases were observed for ABR6 and Bd21, although transcript abundance in Bd21
417 were significantly lower than ABR6 under any vernalization period. Therefore, our
418 identification of natural variation in VRN2 among geographically diverse B. distachyon
419 accessions further supports VRN2 as a core flowering regulator in this non-domesticated
420 grass.
421
422 In our study of the natural variation between two morphologically and geographically diverse
423 B. distachyon accessions we failed to implicate VRN1 as a flowering regulator. However,

424 VRN1 expression during and after cold treatment and the failure of VRN1 silenced lines to
425 flower suggests a conserved role of VRN1 as a promoter of flowering (Woods and Amasino,
426 2016; Woods et al., 2016). Interestingly, a QTL in the Bd21 x Bd1-1 B. distachyon mapping
427 population colocalized with VRN1 and the light receptor PHYTOCHROME C (PHYC)
428 (Woods et al., 2016). Between ABR6 and Bd21, sequence variation was found in the
429 promoter and terminator regions of VRN1 and a strong positive correlation was observed with
430 extended periods of vernalization (Figure 8A), particularly at four weeks vernalization, which
431 was a critical inflection point for flowering time in ABR6. Despite this sequence and
432 expression variation, VRN1 was not found to contribute to flowering time in the ABR6 x
433 Bd21 mapping population. Interestingly, an assessment of allelic variation in 53 B.
434 distachyon accessions currently available in Phytozome (Version 11.0.2,
435 https://phytozome.jgi.doe.gov) found that none of these accessions possess structural
436 variation in the VRN1 annotated coding sequence. These findings suggest that VRN1 is a
437 crucial regulator of flowering in B. distachyon and under strong selection pressure.
438
439
440 Conclusions
441
442 Thanks to their economic and evolutionary importance, flowering time pathways are of
443 particular interest in the cereals and related grasses. Our report adds to this body of research
444 by using natural variation to map vernalization dependency in a B. distachyon mapping
445 population. Since B. distachyon is partly sympatric with the wild relatives of wheat and
446 barley, it seems likely that the species would have been subject to similar selective pressure
447 and therefore is a useful model for understanding pre-domestication or standing variation. We
448 investigated this standing variation by assessing segregation of flowering regulators in a
449 mapping population derived from two geographically diverse accessions of B. distachyon.
450 Notably, we found additional support for the roles of FT and VRN2 in controlling flowering
451 in wild temperate grasses. Additionally, allelic variation may explain the ambiguity around
452 the role of the VRN2 homolog observed in B. distachyon. Further fine-mapping will be
453 required to confirm the roles of these genes in B. distachyon flowering time. However, we
454 also detected novel components in the form of additional QTLs, which reflects the power of
455 studying natural variation in mapping populations derived from phenotypically diverse
456 parents. During population advancement, we have observed a variety of additional
457 morphological and pathological characteristics segregating in this population and it will serve
458 as a useful resource for other researchers investigating standing variation in non-domesticated
459 grasses.
460
461
462 Materials and Methods
463
464 Plant growth for assessing ABR6 and Bd21 vernalization response
465 Six seeds for ABR6 and Bd21 were germinated on paper (in darkness at room temperature)
466 and transferred to an equal mixture of the John Innes Cereal Mix and a peat and sand mix
467 (Vain et al., 2008) four days after germination. Vernalization was initiated 14 days after
468 germination for either two, three, four, five, six, seven, or eight weeks (8 h day length; 1.2
469 klux light intensity; 5°C). The different sets were staggered to ensure that all sets left
470 vernalization on the same date. After vernalization plants were grown in a Sanyo Versatile
471 Environmental Test Chamber (Model MLR-351; 16 h photoperiod; 8.0 klux light intensity;
472 22°C/20°C day/night temperatures) for 35 days and then transferred to a greenhouse without
473 light and temperature control (late April to mid July 2013; Norwich, UK). Days to flowering
474 was measured from the end of vernalization until the emergence of the first spike and was
475 averaged across all six biological replicates (only five replicates were available for Bd21 after
476 7 weeks of vernalization). Statistical significances were assessed by pairwise comparisons
477 using t-tests with pooled standard deviations and Bonferroni correction for multiple
478 comparisons.
479
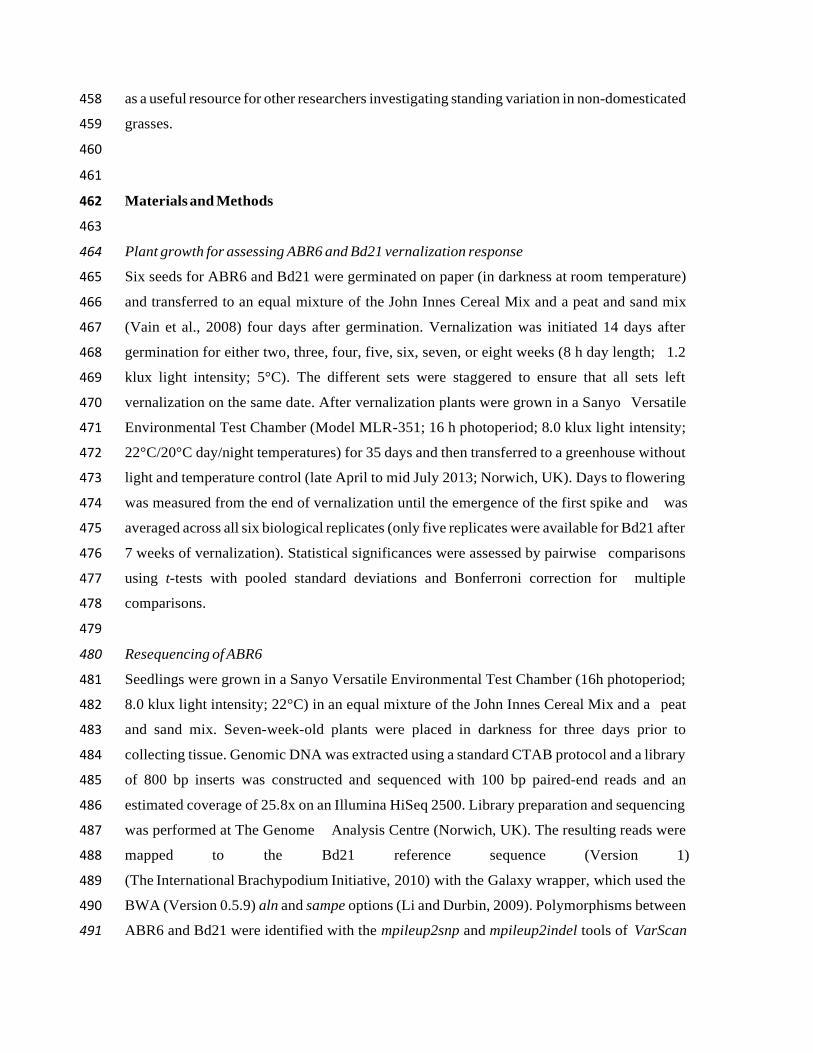
480 Resequencing of ABR6
481 Seedlings were grown in a Sanyo Versatile Environmental Test Chamber (16h photoperiod;
482 8.0 klux light intensity; 22°C) in an equal mixture of the John Innes Cereal Mix and a peat
483 and sand mix. Seven-week-old plants were placed in darkness for three days prior to
484 collecting tissue. Genomic DNA was extracted using a standard CTAB protocol and a library
485 of 800 bp inserts was constructed and sequenced with 100 bp paired-end reads and an
486 estimated coverage of 25.8x on an Illumina HiSeq 2500. Library preparation and sequencing
487 was performed at The Genome Analysis Centre (Norwich, UK). The resulting reads were
488 mapped to the Bd21 reference sequence (Version 1)
489 (The International Brachypodium Initiative, 2010) with the Galaxy wrapper, which used the
490 BWA (Version 0.5.9) aln and sampe options (Li and Durbin, 2009). Polymorphisms between
491 ABR6 and Bd21 were identified with the mpileup2snp and mpileup2indel tools of VarScan

492 (Version 2.3.6) using default settings (Koboldt et al., 2009). A de novo assembly was created
493 from the raw ABR6 reads using default settings of the CLC Assembly Cell (Version 4.2.0)
494 and default parameters. Potential structural variation between ABR6 and Bd21 was
495 investigated by performing a BLAST search with the Bd21 regions of interest against the
496 ABR6 de novo assembly and mapping contigs for hits with at least 95% identity and an E-
497 value under 1e-20
to the Bd21 reference sequence (Version 3).
498
499 Development of the ABR6 x Bd21 F4 population and genetic map
500 The B. distachyon accessions ABR6 and Bd21 were crossed and three ABR6 x Bd21 F1
501 individuals, confirmed as hybrid by SSR marker analysis (data not shown), were allowed to
502 self-pollinate to generate a founder F2 population comprised of 155 individuals. After single
503 seed descent, DNA was extracted from leaf tissue of 114 independent F4 lines using a CTAB
504 gDNA extraction protocol modified for plate-based extraction (Dawson et al., 2016). SNPs
505 for genetic map construction were selected based on a previously characterized Bd21 x Bd3-1
506 F2 genetic map to ensure an even distribution of markers relative to physical and genetic
507 distances (Huo et al., 2011). SNPs without additional sequence variation in a 120 bp window
508 were selected every 10 cM. The Agena Bioscience MassARRAY design suite was used to
509 develop 17 assays that genotyped 449 putative SNPs using the iPLEX Gold assay at the Iowa
510 State University Genomic Technologies Facility (Supplemental Data S2). Markers were
511 excluded for being monomorphic (106), dominant (34), or for missing data for the parental
512 controls (33). Heterozygous genotype calls for some markers were difficult to distinguish and
513 classified as missing data. Additional SNPs between ABR6 and Bd21 in six markers
514 developed for the Bd21 x Bd3-1 F2 genetic map (Barbieri et al., 2012) were converted into
515 CAPS markers (Konieczny and Ausubel, 1993) (Supplemental Table S7). The integrity of
516 these 282 markers was evaluated using R/qtl (Version 1.33-7) recombination fraction plots
517 (Broman et al., 2003). Two markers were removed for not showing linkage and one marker
518 was moved to its correct position based on linkage. Genetic distances were calculated using
519 the Kosambi function in MapManager QTX (Version b20) (Manly et al., 2014). Removal of
520 unlinked and redundant markers produced a final ABR6 x Bd21 F4 genetic map consisting of
521 252 SNP-based markers (Supplemental Data S3). Segregation distortion was assessed using a
522 chi-square test with Bonferroni correction for multiple comparisons.
523
524 Plant growth and phenotyping of flowering time in the ABR6 x Bd21 F4:5 families

525 Three to five plants for each of the 114 ABR6 x Bd21 F4:5 families were grown under five
526 different environmental conditions as detailed in Supplemental Table S1. For the
527 phenotyping performed in Aberystwyth, individual seeds were sown in 6 cm pots with a
528 mixture of 20% grit sand and 80% Levington F2 peat-based compost. Seeds were grown for
529 2 weeks in greenhouse conditions (22°C/20°C, natural light supplemented with 20 h lighting)
530 and then either maintained in the greenhouse or transferred to a vernalization room for six
531 weeks (16 h day length, 5°C). Plants were returned to the greenhouse following vernalization
532 and grown to maturity. Flowering time was defined as the emergence of the first
533 inflorescence and was measured from the first day that flowering was observed in the entire
534 mapping population. Flowering time was averaged across the individuals of an F4:5 family.
535 For the phenotyping performed in Norwich, plants were first subjected to growth conditions
536 and pathogen assays as described in Dawson et al. 2015. Plants were germinated in a peat-
537 based compost in 1 L pots and grown for six weeks in a controlled environment room
538 (18°C/11°C, 16 h light period). Six weeks post germination, the fourth or fifth leaf of each
539 plant was cut off for pathological assays. The plants were transplanted into 9 cm pots with an
540 equal mixture of the John Innes Cereal Mix and a peat and sand mix (Vain et al., 2008) and
541 transferred to the respective growth environments for flowering assessment (Supplemental
542 Table S1). Flowering time was defined as the emergence of the first inflorescence within an
543 F4:5 family and was measured from the first day that flowering was observed in the entire
544 mapping population. Families that did not flower 60 days after emergence of the first
545 inflorescence in the mapping population were scored as not flowering.
546
547 Quantitative trait locus analysis for flowering time
548 Flowering phenotypes were assessed for normality using the Shapiro-Wilk test (Royston,
549 1982). In an initial analysis, phenotypic values were converted into a binary classification
550 based on whether families flowered (F) or did not flower (NF). Interval mapping was
551 performed with the scanone function in R/qtl under a binary model with conditional genotype
552 probabilities computed with default parameters and the Kosambi map function (Xu and
553 Atchley, 1996; Broman et al., 2006). Simulation of genotypes was performed with a fixed
554 step distance of 2 cM, 128 simulation replicates, and a genotyping error rate of 0.001.
555 Statistical significance for QTLs was determined by performing 1,000 permutations and
556 controlled at = 0.05 (Doerge and Churchill, 1996). Non-parametric interval mapping was
557 performed with similar parameters in R/qtl under an np model (Kruglyak and Lander, 1995).

558 For parametric mapping, flowering time data was transformed (T) using the following
559 approaches: (T1) the removal of all F4:5 families that did not flower within the timescale of
560 the experiment, (T2) transforming all non-flowering phenotypic scores to one day above the
561 maximum observed, and (T3) transforming by ranking families according to their flowering
562 time. For the third transformation approach (T3), the earliest flowering family was given a
563 rank score of 1 and subsequent ordered families given incremental scores based on rank (2, 3,
564 4, etc.). When two or more families had shared flowering time, they were given the same
565 rank and the next ranked family was given an incremental rank score based on the number of
566 preceding shared rank families. Non-flowering families were given the next incremental rank
567 after the last flowering rank. For all three transformations, composite interval mapping was
568 performed under an additive model (H0:H1) using QTL Cartographer (Version 1.17j) with the
569 selection of five background markers, a walking speed of 2 cM, and a window size of 10 cM
570 (Zeng, 1993, 1994; Basten et al., 2004). Statistical significance for QTLs was determined by
571 performing 1,000 permutations with reselection of background markers and controlled at =
572 0.05 (Doerge and Churchill, 1996; Lauter et al., 2008). One-LOD support intervals were
573 estimated based on interval mapping (Lander and Botstein, 1989).
574
575 RNAseq of ABR6 and Bd21
576 Plants were grown in a controlled environment room with 16 h light at 22°C and fourth and
577 fifth leaves were harvested as soon as the fifth leaf was fully expanded (roughly 28 days after
578 germination). RNA was extracted using the TRI Reagent (Sigma-Aldrich®
) according to the
579 manufacturer’s specifications. TruSeq libraries were generated from total RNA and mean
580 insert sizes were 251 bp and 254 bp for ABR6 and Bd21, respectively. Library preparation
581 and sequencing was performed at The Genome Analysis Centre (Norwich, UK). Sequencing
582 was carried out using 150 bp paired-end reads on an Illumina HiSeq 2500 and ABR6 and
583 Bd21 yielded 38,867,987 and 37,566,711 raw reads, respectively. RNAseq data quality was
584 assessed with FastQC and reads were removed using Trimmomatic (Version 0.32) (Bolger et
585 al., 2014) with parameters set at ILLUMINACLIP:TruSeq 3-PE.fa:2:30:10, LEADING:3,
586 TRAILING:3, SLIDINGWINDOW:4:15, and MINLEN:100. These parameters will remove
587 all reads with adapter sequence, ambiguous bases, or a substantial reduction in read quality.
588 The sequenced reads were mapped to the Bd21 reference genome using the TopHat (Version
589 2.0.9) spliced alignment pipeline (Trapnell et al., 2009).
590

591 RT-qPCR analyses
592 ABR6 and Bd21 seeds were surface sterilized (70% ethanol for 30 seconds, washed in
593 autoclaved dH2O, 1.3% sodium hypochlorite for 4 minutes, washed in autoclaved H2O three
594 times), transferred to moistened Whatman filter paper, left at room temperature in darkness
595 overnight, and vernalized for either two, four, or six weeks (in darkness at 5°C). A control set
596 was surface sterilized and transferred to filter paper overnight, but not vernalized. Following
597 vernalization, plants were transferred to soil and grown in a Sanyo Versatile Environmental
598 Test Chamber in conditions similar to Environment 2 (20h photoperiod; 4.0 klux light
599 intensity; 22°C/20°C). Once fully expanded, fourth leaves were collected in the middle of the
600 photoperiod and flash frozen in liquid nitrogen.
601
602 Total RNA was extracted using TRI reagent according to manufacturer’s instructions (Sigma-
603 Aldrich®
). RNA samples were treated with DNase I (Roche) prior to cDNA synthesis.
604 Quality and quantity of RNA samples were assessed using a NanoDrop spectrophotometer
605 followed by agarose electrophoresis. First-strand cDNA was synthesized according to
606 manufacturer’s instructions (Invitrogen). Briefly, 1 g of total RNA, 1 L of 0.5 M poly-T
607 primers, and 1 L of 10 mM dNTP were incubated at 65C for 5 min and 4C for 2 min, with
608 subsequent reverse transcription reactions performed using 2 L of 10x reverse transcription
609 buffer, 4 L of 25 mM MgCl2, 2 L of 0.1 M DTT, 1 L of RNaseOUT (40 U/L), and 1 L
610 of SuperScript III reverse transcriptase (200 U/L) at 50C for 50 min. Reverse transcription
611 was inactivated by incubating at 85C for 5 min and residual RNA was removed with the
612 addition of 1 L Rnase H (2 U/L) and incubation at 37C for 20 min.
613
614 Quantitative real time PCR was performed in 20 L reaction volumes using 10 L of SYBR-
615 Green mix (Sigma-Aldrich), 1 L of 10 M forward and reverse primers, 4 L water, and 4
616 L of cDNA diluted 10-fold. The program for PCR amplification involved an initial
617 denaturation at 95C for 3 min and then 40 cycles of 94C for 10 sec, 60C for 15 sec, and
618 72C for 15 sec. Fluorescence data was collected at 72C at the extension step and during the
619 melting curve program on a CFX96 Real-Time system (Bio-Rad).
620
621 Relative gene expression was determined using the 2-CT
method described by Livak and
622 Schmittgen (2001) using UBIQUITIN-CONJUGATING ENZYME18 (Brachypodium
623 distachyon; (Hong et al., 2008); Schwartz et al. 2010) for normalization. All primers were
624 previously used by Ream et al. (2014) and had PCR efficiency ranging from 95 to 110%.
625 Statistical analysis of gene expression was performed using R (Version 3.2.3). Comparisons
626 between all genotype by treatment combinations were made with pairwise t-tests using log
627 transformed relative expression levels, with p-values corrected for multiple hypothesis testing
628 based on the Benjamini-Hochberg approach.
629
630 Accession numbers for data in public repositories
631 Raw resequencing reads of ABR6 have been submitted to the NCBI Short Read Archive
632 under the BioProject ID PRJNA319372 and SRA accession SRX1720894. The ABR6 de
633 novo assembly has been deposited at DDBJ/ENA/GenBank under the accession
634 LXJM00000000. The version described in this paper is version LXJM01000000. Raw
635 RNAseq reads have been submitted to the NCBI Short Read Archive under the BioProject ID
636 PRJNA319373 and SRA accessions SRX1721358 (ABR6) and SRX1721359 (Bd21).
637
638
639 Acknowledgements
640 We thank John Vogel for sharing preliminary sequencing data, Burkhard Steuernagel for
641 assistance with the de novo assembly of the ABR6 genome, David Garvin and Luis Mur for
642 providing seed, and Claire Collett, Ray Smith, Tom Thomas, and Aliyah Debbonaire for
643 assistance with population progression. MassARRAY genotyping was performed at the
644 Genomic Technologies Facility at Iowa State University. The work was funded by the
645 Biotechnology and Biological Sciences Research Council Doctoral Training Programme
646 (BB/F017294/1) and Institute Strategic Programme (BB/J004553/1), the Gatsby Charitable
647 Foundation, the Leverhulme Trust (Grant reference 10754), the 2Blades Foundation, and the
648 Human Frontiers Science Program (LT000218/2011).

649 Tables
650
651 Table 1. Significant flowering time QTLs (qFLT) in the different environments identified
652 using several binary, non-parametric, and parametric approaches.
Locus Chra
cM Alleleb
E1c
E2 E3 E4 E5
qFLT1 Bd1 297.6 Bd21
B, T2, T1, T3, T2, T3, T2, T3
T1, T2,
qFLT7 Bd3 294.6 Bd21 - - - NP T3, NP
qFLT8 Bd4 90.1 Bd21 - - - NP -
653 aChromosome
654 bAllele that reduces flowering time
655 cEnvironment (see Supplemental Table S1)
656 dQTL analyses were performed with interval mapping using binary classification (B) and
657 non-parametric analysis (NP), and composite interval mapping using transformed data (T1,
658 T2, and T3).
qFLT2
Bd1
465.2
Bd21
T3, NPd
T2
NP
-
NP
-
-
T3, NP
-
qFLT3 Bd2 338.3 ABR6 - - - NP T2, T3
qFLT4 Bd2 409.0 Bd21 - T1, T3 - - -
qFLT5 Bd3 60.8 Bd21 - - - T1 -
qFLT6 Bd3 91.2 Bd21 T2, T3 T1, T3 T2, T3 -
T2, T3,
-
B, T2,

659 Table 2. Significant QTLs from composite interval mapping of transformed flowering time
660 phenotypes (T3) in the ABR6 x Bd21 F4:5 families.
ENVa
Locus Chrb cM EWT
c LOD AEE
d PVE
e 1-LOD SI
f
1 qFLT1 Bd1 297.6 3.06 12.96 2.87 36.3% 296.1 - 305.6
1 qFLT6 Bd3 91.2 3.06 4.51 1.64 11.8% ND
2 qFLT1 Bd1 297.6 3.09 7.59 0.82 20.0% 296.1 - 305.6
2 qFLT4 Bd2 409.0 3.09 3.20 0.47 6.7% 403.2 - 411.0
2 qFLT6 Bd3 93.2 3.09 6.64 0.79 18.2% 72.9 - 97.0
3 qFLT1 Bd1 297.6 3.20 8.61 1.50 31.1% 292.1 - 303.6
3 qFLT6 Bd3 91.2 3.20 5.69 1.20 18.7% 74.9 - 97.0
4 qFLT1 Bd1 297.6 3.19 3.49 1.77 15.9% 292.1 - 305.6
4 qFLT7 Bd3 294.6 3.19 3.79 1.59 14.0% 273.9 - 300.7
5 qFLT1 Bd1 297.6 3.17 8.62 3.43 37.5% 294.1 - 301.6
5 qFLT3 Bd2 338.3 3.17 3.70 -1.75 9.9% 323.7 - 348.0
5 qFLT7 Bd3 294.6 3.17 5.61 2.02 13.6% 275.9 - 302.0
661 aEnvironment (see Supplemental Table S1)
662 bChromosome
663 cExperiment-wide permutation threshold
664 dAdditive effect estimate for transformed phenotypes
665 ePercent of phenotypic variance explained
666 fOne-LOD support interval (cM); ND denotes QTLs not detected using standard interval
667 mapping.

668 Table 3. Previously identified B. distachyon homologs of flowering regulators in Arabidopsis
669 (At), hexaploid and diploid wheat (Ta and Tm), barley (Hv), and rice (Os) within the one-
670 LOD support intervals of the statistically significant QTLs under transformation T3.
671 aChromosome
672 bCombined maximal one-LOD support interval (cM) from all significant QTLs
673 cIdentified in Higgins et al. 2010 and Ream et al. 2012
Locus Chra 1-LOD SI
b B. distachyon gene Homologous genes
c
qFLT1
qFLT3
Bd1
Bd2
292.1 - 305.6
323.7 - 348.0
Bradi1g45810
Bradi1g46060
Bradi1g48340
Bradi1g48830
Bradi2g53060
AtAGL24, TaVRT2, OsMADS55
AtABF1
AtCLF, OsCLF
AtTSF, HvFT1, OsHd3a/OsFTL2
AtFDP
qFLT4
Bd2
403.2 - 411.0
Bradi2g54200
Bradi2g55550
Bradi2g60820
AtNF-YB10
AtbZIP67
AtFY, OsFY
qFLT6
Bd3
72.9 - 97.0
Bradi2g62070
Bradi3g08890
AtLUX, OsLUX
OsFTL13
qFLT7
Bd3
273.9 - 300.7
Bradi3g10010
Bradi3g12900
Bradi3g41300
TaVRN2, TmCCT2, OsGhd7
AtHUA2
OsMADS37
Bradi3g42910
Bradi3g44860
AtSPY, OsSPY
OsRCN2

674 Figures
675
676 Figure 1. Flowering behavior within the ABR6 x Bd21 mapping population. Three months
677 after a six-week vernalization period, ABR6 (left) is not flowering, whereas Bd21 (center) is
678 flowering and an individual in the ABR6 x Bd21 mapping population displays an
679 intermediate flowering phenotype (right).
680
681 Figure 2. Effect of vernalization on flowering time in ABR6 and Bd21. Days to flowering
682 was measured from the end of vernalization for seven different vernalization periods. After
683 vernalization plants were grown in a growth chamber (16 h photoperiod) for 35 days and then
684 transferred to a greenhouse without light and temperature control (late April to mid July
685 2013; Norwich, UK). Mean days to flowering and standard error are based on six biological
686 replicates. Different letters represent statistically significant differences based on pairwise
687 comparisons using t-tests with pooled standard deviations and Bonferroni correction for
688 multiple comparisons.
689
690 Figure 3. Segregation distortion in the ABR6 x Bd21 F4 population. For each marker of the
691 genetic map the frequencies of F4 individuals with homozygous ABR6 genotype (solid
692 magenta), homozygous Bd21 genotype (dashed green), or heterozygous genotype (solid
693 black) were calculated (scale on left). Data coverage (percent of F4 individuals with genotype
694 calls per marker) is represented by the gray line (scale on right).
695
696 Figure 4. Frequency distribution of flowering time in the ABR6 x Bd21 population.
697 Flowering time was measured from the first day that flowering was observed in the entire
698 population. (A) Environment 1 (April to July, natural light supplemented for 20h, 22°C/20°C,
699 no vernalization), (B) Environment 2 (April to July, natural light supplemented for 20h,
700 22°C/20°C, six weeks vernalization), (C) Environment 3 (May to July, natural light and
701 temperatures, no vernalization), (D) Environment 4 (September to November, natural light
702 supplemented for 16h, minimum 18°C/11.5°C, no vernalization), (E) Environment 5 (March
703 to May, natural light and temperatures, no vernalization). Flowering times for the parental
704 lines are indicated by arrows (no data for Environment 3). NF = not flowering.
705
706 Figure 5. Linkage mapping of flowering time in the ABR6 x Bd21 population. Time to
707 flowering for 114 F4:5 families of the population was transformed into ordered rank values,

708 QTL analysis performed using composite interval mapping under an additive model
709 hypothesis test (H0:H1), and plotted based on normalized permutation thresholds. The blue
710 horizontal line represents the threshold of statistical significance based on 1,000
711 permutations. Orange = Environment 1(April to July, natural light supplemented for 20h,
712 22°C/20°C, no vernalization), blue = Environment 2 (April to July, natural light
713 supplemented for 20h, 22°C/20°C, six weeks vernalization), red = Environment 3 (May to
714 July, natural light and temperatures, no vernalization), yellow = Environment 4 (September to
715 November, natural light supplemented for 16h, minimum 18°C/11.5°C, no vernalization),
716 green = Environment 5 (March to May, natural light and temperatures, no vernalization). See
717 Supplemental Table S1 for full environmental details. The genetic positions of the previously
718 identified homologs of VRN1, VRN2, and FT are indicated (compare Higgins et al. 2010 and
719 Ream et al. 2012).
720
721 Figure 6. Phenotype by genotype plot for the two major loci controlling flowering time in the
722 ABR6 x Bd21 mapping population. Days to flowering in Environment 3 for the ABR6 x
723 Bd21 F4:5 families homozygous at qFLT1 and qFLT6 shows that the Bd21 alleles at these two
724 loci promote early flowering. Error bars represent one standard error; NF = not flowering.
725
726 Figure 7. Comparison of the flowering regulators FT and VRN2 between the B. distachyon
727 accessions Bd21 and ABR6. Contigs of the ABR6 de novo assembly were aligned to the
728 Bd21 reference sequence (Version 3) and polymorphisms were identified in the genes of
729 interest and 2kb promoter and terminator sequence (1.9kb promoter for VRN2). Red ticks
730 represent SNPs and black ticks represent indels. The length of indels (bp) is shown with + for
731 insertion and – for deletion. The amino acid change of the non-synonymous SNP in VRN2 is
732 indicated. s = synonymous SNP; dashed line = promoter or terminator; white box = 5’-UTR
733 or 3’-UTR; black box = exon; black line = intron; M = methionine/translation start; star =
734 translation stop; black bar under VRN2 = CCT domain.
735
736 Figure 8. VRN1, VRN2, and FT expression in fourth leaf of ABR6 and Bd21 after varying
737 periods of cold treatment. Seeds were imbibed with water and not vernalized or vernalized
738 for two, four, or six weeks, and transferred to a growth chamber with parameters similar to
739 Environment 2. Fully expanded fourth leaves were harvested in the middle of the
740 photoperiod. Relative gene expression of VRN1 (A), VRN2 (B), and FT (C) was determined
741 using RT-qPCR and analyzed using the 2-Ct
method. All genes were normalized to 1
based

742 on Bd21 expression with no cold treatment (0 weeks) and UBQ18 was used as internal
743 control. Bars represent the mean of three biological replicates with error bars showing 1
744 standard error. Different letters represent statistically significant differences based on
745 pairwise t-tests using a multiple hypothesis corrected p-value threshold of 0.05 with the
746 Benjamini-Hochberg approach.
747 Supplemental Material
748
749 Supplemental Figure S1. Linkage groups of ABR6 x Bd21 genetic map.
750 Supplemental Figure S2. Two-way recombination fraction plot for the ABR6 x Bd21 F4
751 population.
752 Supplemental Table S1. Summary of the environmental conditions tested.
753 Supplemental Table S2. Significant QTLs from interval mapping of binary classification of
754 flowering time phenotypes in the ABR6 x Bd21 F4:5 families.
755 Supplemental Table S3. Significant QTLs from interval mapping using a non-parametric
756 model for flowering time phenotypes in the ABR6 x Bd21 F4:5 families (NP).
757 Supplemental Table S4. Significant QTLs from composite interval mapping of transformed
758 flowering time phenotypes in the ABR6 x Bd21 F4:5 families (T1).
759 Supplemental Table S5. Significant QTLs from composite interval mapping of transformed
760 flowering time phenotypes in the ABR6 x Bd21 F4:5 families (T2).
761 Supplemental Table S6. Summary of the structural variation between Bd21 and ABR6 for
762 the flowering regulators Bradi1g48830 (FT), Bradi3g10010 (VRN2), and Bradi1g08340
763 (VRN1).
764 Supplemental Table S7. Five cleaved amplified polymorphic sequences (CAPS) markers
765 included in the ABR6 x Bd21 genetic map design.
766 Supplemental Data S1. Raw, binary, and transformed flowering time data for the ABR6 x
767 Bd21 F4:5 families in the five environments tested.
768 Supplemental Data S2. Sequence information used to develop iPLEX assays for the 247
769 MassARRAY markers in the ABR6 x Bd21 genetic map design.
770 Supplemental Data S3. ABR6 x Bd21 genetic map.
771
772
773 Supplemental Figure S1. Linkage groups of ABR6 x Bd21 genetic map. Cumulative cM
774 distances and SNP marker names are shown to the left and right of each chromosome,
775 respectively. cM distance at the F4 stage was estimated using the Kosambi function. SNP
776 marker names consist of the corresponding chromosome and physical position in the Bd21
777 reference genome (Version 3).
778
779 Supplemental Figure S2. Two-way recombination fraction plot for the ABR6 x Bd21 F4
780 population.

781
782 Supplemental Table S1. Summary of the environmental conditions tested.
783
784 Supplemental Table S2. Significant QTLs from interval mapping of binary classification of
785 flowering time phenotypes in the ABR6 x Bd21 F4:5 families.
786
787 Supplemental Table S3. Significant QTLs from interval mapping using a non-parametric
788 model for flowering time phenotypes in the ABR6 x Bd21 F4:5 families (NP).
789
790 Supplemental Table S4. Significant QTLs from composite interval mapping of transformed
791 flowering time phenotypes in the ABR6 x Bd21 F4:5 families (T1).
792
793 Supplemental Table S5. Significant QTLs from composite interval mapping of transformed
794 flowering time phenotypes in the ABR6 x Bd21 F4:5 families (T2).
795
796 Supplemental Table S6. Summary of the structural variation between Bd21 and ABR6 for
797 the flowering regulators Bradi1g48830 (FT), Bradi3g10010 (VRN2), and Bradi1g08340
798 (VRN1).
799
800 Supplemental Table S7. Five cleaved amplified polymorphic sequences (CAPS) markers
801 included in the ABR6 x Bd21 genetic map design. Marker names consist of the
802 corresponding chromosome and physical position in the Bd21 reference genome (Version 3).
803 Synonymous names refer to Barbieri et al. 2012.
804
805 Supplemental Data S1. Raw, binary, and transformed flowering time data for the ABR6 x
806 Bd21 F4:5 families in the five environments tested.
807
808 Supplemental Data S2. Sequence information used to develop iPLEX assays for the 247
809 MassARRAY markers in the ABR6 x Bd21 genetic map design. Marker names consist of the
810 corresponding chromosome and physical position in the Bd21 reference genome (Version 3)
811 and SNPs are indicated in square brackets.
812

813 Supplemental Data S3. ABR6 x Bd21 genetic map. “A” genotype calls refer to ABR6, “B”
814 genotype calls to Bd21, “H” genotype calls to heterozygous markers and “-“ to missing data
815 points.

Parsed Citations
Amasino R (2010) Seasonal and developmental timing of flowering. Plant J 61: 1001-1013 Pubmed: Author and Title CrossRef: Author and Title Google Scholar: Author Only Title Only Author and Title
Andrés F, Coupland G (2012) The genetic basis of flowering responses to seasonal cues. Nat Rev Genet 13: 627-639 Pubmed: Author and Title CrossRef: Author and Title Google Scholar: Author Only Title Only Author and Title
Barbieri M, Marcel TC, Niks RE, Francia E, Pasquariello M, Mazzamurro V, Garvin DF, Pecchioni N (2012) QTLs for resistance to the false brome rust Puccinia brachypodii in the model grass Brachypodium distachyon L. Genome 55: 152-163
Pubmed: Author and Title CrossRef: Author and Title Google Scholar: Author Only Title Only Author and Title
Basten CJ, Weir BS, Zeng Z-B (2004) QTL Cartographer, version 1.17. Department of Statistics, North Carolina State University, Raleigh, NC
Pubmed: Author and Title CrossRef: Author and Title Google Scholar: Author Only Title Only Author and Title
Bolger AM, Lohse M, Usadel B (2014) Trimmomatic: a flexible trimmer for Illumina sequence data. Bioinformatics 30: 2114-2120 Pubmed: Author and Title CrossRef: Author and Title Google Scholar: Author Only Title Only Author and Title
Bomblies K, Lempe J, Epple P, Warthmann N, Lanz C, Dangl JL, Weigel D (2007) Autoimmune response as a mechanism for a Dobzhansky-Muller-type incompatibility syndrome in plants. PLoS Biology 5: e236
Pubmed: Author and Title CrossRef: Author and Title Google Scholar: Author Only Title Only Author and Title
Bomblies K, Weigel D (2007) Hybrid necrosis: autoimmunity as a potential gene-flow barrier in plant species. Nat Rev Genet 8: 382- 393
Pubmed: Author and Title CrossRef: Author and Title Google Scholar: Author Only Title Only Author and Title
Broman KW, Sen S, Owens SE, Manichaikul A, Southard-Smith EM, Churchill GA(2006) The X chromosome in quantitative trait locus mapping. Genetics 174: 2151-2158
Pubmed: Author and Title CrossRef: Author and Title Google Scholar: Author Only Title Only Author and Title
Broman KW, Wu H, Sen S, Churchill GA(2003) R/qtl: QTL mapping in experimental crosses. Bioinformatics 19: 889-890 Pubmed: Author and Title CrossRef: Author and Title Google Scholar: Author Only Title Only Author and Title
Catalán P, Chalhoub B, Chochois V, Garvin DF, Hasterok R, Manzaneda AJ, Mur LA, Pecchioni N, Rasmussen SK, Vogel JP, Voxeur A(2014) Update on the genomics and basic biology of Brachypodium: International Brachypodium Initiative (IBI). Trends Plant Sci 19: 414-418
Pubmed: Author and Title CrossRef: Author and Title Google Scholar: Author Only Title Only Author and Title
Chen A, Dubcovsky J (2012) Wheat TILLING mutants show that the vernalization gene VRN1 down-regulates the flowering repressor VRN2 in leaves but is not essential for flowering. PLoS Genet 8: e1003134
Pubmed: Author and Title CrossRef: Author and Title Google Scholar: Author Only Title Only Author and Title
Dawson AM, Bettgenhaeuser J, Gardiner M, Green P, Hernández-Pinzón I, Hubbard A, Moscou MJ (2015) The development of quick, robust, quantitative phenotypic assays for describing the host-nonhost landscape to stripe rust. Frontiers in Plant Science 6
Pubmed: Author and Title CrossRef: Author and Title Google Scholar: Author Only Title Only Author and Title
Dawson AM, Ferguson JN, Gardiner M, Green P, Hubbard A, Moscou MJ (2016) Isolation and fine mapping of Rps6: an intermediate host resistance gene in barley to wheat stripe rust. Theoretical and Applied Genetics 129: 831-843
Pubmed: Author and Title CrossRef: Author and Title Google Scholar: Author Only Title Only Author and Title
Distelfeld A, Li C, Dubcovsky J (2009) Regulation of flowering in temperate cereals. Curr Opin Plant Biol 12: 178-184 Pubmed: Author and TitleDownloaded from www.plantphysiol.org on September 20, 2016 - Published by www.plantphysiol.org

CrossRef: Author and Title Google Scholar: Author Only Title Only Author and Title
Doerge RW, Churchill GA(1996) Permutation tests for multiple loci affecting a quantitative character. Genetics 142: 285-294 Pubmed: Author and Title CrossRef: Author and Title Google Scholar: Author Only Title Only Author and Title
Draper J, Mur LA, Jenkins G, Ghosh-Biswas GC, Bablak P, Hasterok R, Routledge AP (2001) Brachypodium distachyon. Anew model system for functional genomics in grasses. Plant Physiol 127: 1539-1555
Pubmed: Author and Title CrossRef: Author and Title Google Scholar: Author Only Title Only Author and Title
Dubcovsky J, Chen C, Yan L (2005) Molecular characterization of the allelic variation at the VRN-H2 vernalization locus in barley. Molecular Breeding 15: 395-407
Pubmed: Author and Title CrossRef: Author and Title Google Scholar: Author Only Title Only Author and Title
Faris JD, Laddomada B, Gill BS (1998) Molecular mapping of segregation distortion loci in Aegilops tauschii. Genetics 149: 319-327 Pubmed: Author and Title CrossRef: Author and Title Google Scholar: Author Only Title Only Author and Title
Fu D, Szücs P, Yan L, Helguera M, Skinner JS, von Zitzewitz J, Hayes PM, Dubcovsky J (2005) Large deletions within the first intron in VRN-1 are associated with spring growth habit in barley and wheat. Mol Genet Genomics 273: 54-65
Pubmed: Author and Title CrossRef: Author and Title Google Scholar: Author Only Title Only Author and Title
Garvin DF, Gu Y-Q, Hasterok R, Hazen SP, Jenkins G, Mockler TC, Mur LAJ, Vogel JP (2008) Development of genetic and genomic research resources for Brachypodium distachyon, a new model system for grass crop research. Crop Science 48: S-69
Pubmed: Author and Title CrossRef: Author and Title Google Scholar: Author Only Title Only Author and Title
Higgins JA, Bailey PC, Laurie DA(2010) Comparative genomics of flowering time pathways using Brachypodium distachyon as a model for the temperate grasses. PLoS One 5: e10065
Pubmed: Author and Title CrossRef: Author and Title Google Scholar: Author Only Title Only Author and Title
Hong SY, Seo PJ, Yang MS, Xiang F, Park CM (2008) Exploring valid reference genes for gene expression studies in Brachypodium distachyon by real-time PCR. BMC Plant Biol 8: 112
Pubmed: Author and Title CrossRef: Author and Title Google Scholar: Author Only Title Only Author and Title
Huo N, Garvin DF, You FM, McMahon S, Luo MC, Gu YQ, Lazo GR, Vogel JP (2011) Comparison of a high-density genetic linkage map to genome features in the model grass Brachypodium distachyon. Theor Appl Genet 123: 455-464
Pubmed: Author and Title CrossRef: Author and Title Google Scholar: Author Only Title Only Author and Title
Jung C, Müller AE (2009) Flowering time control and applications in plant breeding. Trends Plant Sci 14: 563-573 Pubmed: Author and Title CrossRef: Author and Title Google Scholar: Author Only Title Only Author and Title
Kardailsky I, Shukla VK, Ahn JH, Dagenais N, Christensen SK, Nguyen JT, Chory J, Harrison MJ, Weigel D (1999) Activation tagging of the floral inducer FT. Science 286: 1962-1965
Pubmed: Author and Title CrossRef: Author and Title Google Scholar: Author Only Title Only Author and Title
Karsai I, Szücs P, Mészáros K, Filichkina T, Hayes PM, Skinner JS, Lang L, Bedö Z (2005) The Vrn-H2 locus is a major determinant of flowering time in a facultative x winter growth habit barley (Hordeumvulgare L.) mapping population. Theoretical and Applied Genetics 110: 1458-1466
Pubmed: Author and Title CrossRef: Author and Title Google Scholar: Author Only Title Only Author and Title
Koboldt DC, Chen K, Wylie T, Larson DE, McLellan MD, Mardis ER, Weinstock GM, Wilson RK, Ding L (2009) VarScan: variant detection in massively parallel sequencing of individual and pooled samples. Bioinformatics 25: 2283-2285
Pubmed: Author and Title CrossRef: Author and Title Google Scholar: Author Only Title Only Author and Title
Konieczny A, Ausubel FM (1993) Aprocedure for mapping Arabidopsis mutations using co-dominant ecotype-specific PCR-based markers. The Plant Jornal

Pubmed: Author and Title
CrossRef: Author and Title Google Scholar: Author Only Title Only Author and Title
Koornneef M, Alonso-Blanco C, Vreugdenhil D (2004) Naturally occurring genetic variation in Arabidopsis thaliana. Annu Rev Plant Biol 55: 141-172
Pubmed: Author and Title CrossRef: Author and Title Google Scholar: Author Only Title Only Author and Title
Kruglyak L, Lander ES (1995) Anonparametric approach for mapping quantitative trait loci. Genetics 139: 1421-1428 Pubmed: Author and Title CrossRef: Author and Title Google Scholar: Author Only Title Only Author and Title
Lander ES, Botstein D (1989) Mapping mendelian factors underlying quantitative traits using RFLP linkage maps. Genetics 121: 185-199
Pubmed: Author and Title CrossRef: Author and Title Google Scholar: Author Only Title Only Author and Title
Lauter N, Moscou MJ, Habiger J, Moose SP (2008) Quantitative genetic dissection of shoot architecture traits in maize: towards a functional genomics approach. The Plant Genome 1: 99
Pubmed: Author and Title CrossRef: Author and Title Google Scholar: Author Only Title Only Author and Title
Li H, Durbin R (2009) Fast and accurate short read alignment with Burrows-Wheeler transform. Bioinformatics 25: 1754-1760 Pubmed: Author and Title CrossRef: Author and Title Google Scholar: Author Only Title Only Author and Title
Livak KJ, Schmittgen TD (2001) Analysis of relative gene expression data using real-time quantitative PCR and the 2(-Delta Delta C(T)) method. Methods 25: 402-408
Pubmed: Author and Title CrossRef: Author and Title Google Scholar: Author Only Title Only Author and Title
Lu H, Romero-Severson J, Bernardo R (2002) Chromosomal regions associated with segregation distortion in maize. Theor Appl Genet 105: 622-628
Pubmed: Author and Title CrossRef: Author and Title Google Scholar: Author Only Title Only Author and Title
Lv B, Nitcher R, Han X, Wang S, Ni F, Li K, Pearce S, Wu J, Dubcovsky J, Fu D (2014) Characterization of FLOWERING LOCUS T1 (FT1) gene in Brachypodium and wheat. PLoS One 9: e94171
Pubmed: Author and Title CrossRef: Author and Title Google Scholar: Author Only Title Only Author and Title
Manly KF, Cudmore RH, Meer JM (2014) Map Manager QTX, cross-platformsoftware for genetic mapping. Mammalian Genome 12: 930-932
Pubmed: Author and Title CrossRef: Author and Title Google Scholar: Author Only Title Only Author and Title
Muñoz-Amatriaín M, Moscou MJ, Bhat PR, Svensson JT, Bartos? J, Suchánková P, S?imkova ́H, Endo TR, Fenton RD, Lonardi S, Castillo AM, Chao SM, Cistué L, Cuesta-Marcos A, Forrest KL, Hayden MJ, Hayes PM, Horsley RD, Makoto K, Moody D, Sato K, Vallés MP, Wulff BBH, Muehlbauer GJ, Dolez?el J, Close TJ (2011) An improved consensus linkage map of barley based on flow- sorted chromosomes and single nucleotide polymorphism markers. Plant Genome 4: 238-249
Pubmed: Author and Title CrossRef: Author and Title Google Scholar: Author Only Title Only Author and Title
Opanowicz M, Vain P, Draper J, Parker D, Doonan JH (2008) Brachypodium distachyon: making hay with a wild grass. Trends Plant Sci 13: 172-177
Pubmed: Author and Title CrossRef: Author and Title Google Scholar: Author Only Title Only Author and Title
Ream TS, Woods DP, Amasino RM (2012) The molecular basis of vernalization in different plant groups. Cold Spring Harbor Symposia on Quantitative Biology 77: 105-115
Pubmed: Author and Title CrossRef: Author and Title Google Scholar: Author Only Title Only Author and Title
Ream TS, Woods DP, Schwartz CJ, Sanabria CP, Mahoy JA, Walters EM, Kaeppler HF, Amasino RM (2014) Interaction of photoperiod and vernalization determines flowering time of Brachypodium distachyon. Plant Physiol 164: 694-709
Pubmed: Author and Title CrossRef: Author and Title

Routledge APM, Shelley G, Smith JV, Talbot NJ, Draper J, Mur LAJ (2004) Magnaporthe grisea interactions with the model grass Brachypodium distachyon closely resemble those with rice (Oryza sativa). Molecular Plant Pathology 5: 253-265
Pubmed: Author and Title CrossRef: Author and Title Google Scholar: Author Only Title Only Author and Title
Royston JP (1982) An Extension of Shapiro and Wilk's WTest for Normality to Large Samples. Applied Statistics 31: 115 Pubmed: Author and Title CrossRef: Author and Title Google Scholar: Author Only Title Only Author and Title
Sasani S, Hemming MN, Oliver SN, Greenup A, Tavakkol-Afshari R, Mahfoozi S, Poustini K, Sharifi HR, Dennis ES, Peacock WJ, Trevaskis B (2009) The influence of vernalization and daylength on expression of flowering-time genes in the shoot apex and leaves of barley (Hordeumvulgare). J Exp Bot 60: 2169-2178
Pubmed: Author and Title CrossRef: Author and Title Google Scholar: Author Only Title Only Author and Title
Schwartz CJ, Doyle MR, Manzaneda AJ, Rey PJ, Mitchell-Olds T, Amasino RM (2010) Natural variation of flowering time and vernalization responsiveness in Brachypodium distachyon. BioEnergy Research 3: 38-46
Pubmed: Author and Title CrossRef: Author and Title Google Scholar: Author Only Title Only Author and Title
Tan S, Wu S (2012) Genome wide analysis of nucleotide-binding site disease resistance genes in Brachypodium distachyon. Comp Funct Genomics 2012: 418208
Pubmed: Author and Title CrossRef: Author and Title Google Scholar: Author Only Title Only Author and Title
The International Brachypodium Initiative (2010) Genome sequencing and analysis of the model grass Brachypodium distachyon. Nature 463: 763-768
Pubmed: Author and Title CrossRef: Author and Title Google Scholar: Author Only Title Only Author and Title
Trapnell C, Pachter L, Salzberg SL (2009) TopHat: discovering splice junctions with RNA-Seq. Bioinformatics 25: 1105-1111 Pubmed: Author and Title CrossRef: Author and Title Google Scholar: Author Only Title Only Author and Title
Tyler L, Lee SJ, Young ND, DeIulio GA, Benavente E, Reagon M, Sysopha J, Baldini RM, Troi`a A, Hazen SP, Caicedo AL (2016) Population structure in the model grass Brachypodium distachyon is highly correlated with flowering differences across broad geographic areas. The Plant Genome 9: 1-20
Pubmed: Author and Title CrossRef: Author and Title Google Scholar: Author Only Title Only Author and Title
Vain P, Worland B, Thole V, McKenzie N, Alves SC, Opanowicz M, Fish LJ, Bevan MW, Snape JW(2008) Agrobacterium-mediated transformation of the temperate grass Brachypodium distachyon (genotype Bd21) for T-DNAinsertional mutagenesis. Plant Biotechnol J 6: 236-245
Pubmed: Author and Title CrossRef: Author and Title Google Scholar: Author Only Title Only Author and Title
Vogel JP, Garvin DF, Leong OM, Hayden DM (2006) Agrobacterium-mediated transformation and inbred line development in the model grass Brachypodium distachyon. Plant Cell, Tissue and Organ Culture 84: 199-211
Pubmed: Author and Title CrossRef: Author and Title Google Scholar: Author Only Title Only Author and Title
von Zitzewitz J, Szücs P, Dubcovsky J, Yan L, Francia E, Pecchioni N, Casas A, Chen TH, Hayes PM, Skinner JS (2005) Molecular and structural characterization of barley vernalization genes. Plant Mol Biol 59: 449-467
Pubmed: Author and Title CrossRef: Author and Title Google Scholar: Author Only Title Only Author and Title
Wilczek AM, Burghardt LT, Cobb AR, Cooper MD, Welch SM, Schmitt J (2010) Genetic and physiological bases for phenological responses to current and predicted climates. Philosophical Transactions of the Royal Society of London, Series B: Biological Sciences 365: 3129-3147
Pubmed: Author and Title CrossRef: Author and Title Google Scholar: Author Only Title Only Author and Title
Wilson P, Streich J, Borevitz J (2016) Genomic diversity and climate adaptation in Brachypodium. In JP Vogel, ed, Genetics and Genomics of Brachypodium. Springer International Publishing, pp 107-127
Pubmed: Author and Title CrossRef: Author and Title Google Scholar: Author Only Title Only Author and Title

Woods D, Amasino R (2016) Dissecting the control of flowering time in grasses using Brachypodium distachyon. In JP Vogel, ed, Genetics and Genomics of Brachypodium. Springer International Publishing, pp 259-273
Pubmed: Author and Title CrossRef: Author and Title Google Scholar: Author Only Title Only Author and Title
Woods D, Bednarek R, Bouché F, Gordon SP, Vogel J, Garvin DF, Amasino R (2016) Genetic architecture of flowering-time variation in Brachypodium distachyon.
Woods D, McKeown M, Dong Y, Preston JC, Amasino RM (2016) Evolution of VRN2/GhD7-like genes in vernalization-mediated repression of grass flowering. Plant Physiol
Pubmed: Author and Title CrossRef: Author and Title Google Scholar: Author Only Title Only Author and Title
Woods DP, Ream TS, Minevich G, Hobert O, Amasino RM (2014) PHYTOCHROME C is an essential light receptor for photoperiodic flowering in the temperate grass, Brachypodium distachyon. Genetics 198: 397-408
Pubmed: Author and Title CrossRef: Author and Title Google Scholar: Author Only Title Only Author and Title
Xu SZ, Atchley WR (1996) Mapping quantitative trait loci for complex binary diseases using line crosses. Genetics 143: 1417-1424 Pubmed: Author and Title CrossRef: Author and Title Google Scholar: Author Only Title Only Author and Title
Xu Y, Zhu L, Xiao J, Huang N, McCouch SR (1997) Chromosomal regions associated with segregation distortion of molecular markers in F2, backcross, doubled haploid, and recombinant inbred populations in rice (Oryza sativa L). Molecular and General Genetics 253: 535-545
Pubmed: Author and Title CrossRef: Author and Title Google Scholar: Author Only Title Only Author and Title
Yan L, Fu D, Li C, Blechl A, Tranquilli G, Bonafede M, Sanchez A, Valarik M, Yasuda S, Dubcovsky J (2006) The wheat and barley vernalization gene VRN3 is an orthologue of FT. Proceedings of the National Academy of Sciences, USA 103: 19581-19586
Pubmed: Author and Title CrossRef: Author and Title Google Scholar: Author Only Title Only Author and Title
Yan L, Loukoianov A, Blechl A, Tranquilli G, Ramakrishna W, SanMiguel P, Bennetzen JL, Echenique V, Dubcovsky J (2004) The wheat VRN2 gene is a flowering repressor down-regulated by vernalization. Science 303: 1640-1644
Pubmed: Author and Title CrossRef: Author and Title Google Scholar: Author Only Title Only Author and Title
Yan L, Loukoianov A, Tranquilli G, Helguera M, Fahima T, Dubcovsky J (2003) Positional cloning of the wheat vernalization gene VRN1. Proceedings of the National Academy of Sciences, USA 100: 6263-6268
Pubmed: Author and Title CrossRef: Author and Title Google Scholar: Author Only Title Only Author and Title
Zeng Z-B (1993) Theoretical basis for separation of multiple linked gene effects in mapping quantitative trait loci. Proceedings of the National Academy of Sciences, USA 90: 10972-10976
Pubmed: Author and Title CrossRef: Author and Title Google Scholar: Author Only Title Only Author and Title
Zeng Z-B (1994) Precision mapping of quantitative trait loci. Genetics 136: 1457-1468 Pubmed: Author and Title CrossRef: Author and Title Google Scholar: Author Only Title Only Author and Title