nature neuroscience: doi:10.1038/nn · supplementary figure 1 . fmri experiment on 8 year olds. (a)...
TRANSCRIPT

Supplementary Figure 1
fMRI experiment on 8 year olds. (a) At age 8, children were shown words, scrambled words, line-drawings of objects, and line-drawings of faces over 6 experimental runs in a blocked design. A grid was overlaid on top of the stimuli so that all stimulus types (not just scrambled words) had edges. Each stimulus was presented for 500ms (ISI=0.193s) and overlaid on a different single-color background. Each run consisted of 18 blocks (4 blocks per stimulus type and 3 fixation blocks per run), and participants performed a one-back task. (b) fROIs were defined in each individual by intersecting that individual’s relevant thresholded activation contrast map with the relevant constraint region (e.g. for the VWFA, words > line-drawings of objects within VWFA constraint region). Constraint regions were defined from fMRI data in a separate group of adult participants as parcels within which most subjects had a significant activation, and were registered to each child’s native anatomy. Constraint regions for the VWFA (magenta), lFFA (yellow), and lPFS (cyan) are shown on an example subject’s inflated cortical surface. Note that while constraint regions are large (to accommodate individual variation) and overlap, the resulting fROIs within an individual are small and do not overlap.
Nature Neuroscience: doi:10.1038/nn.4354
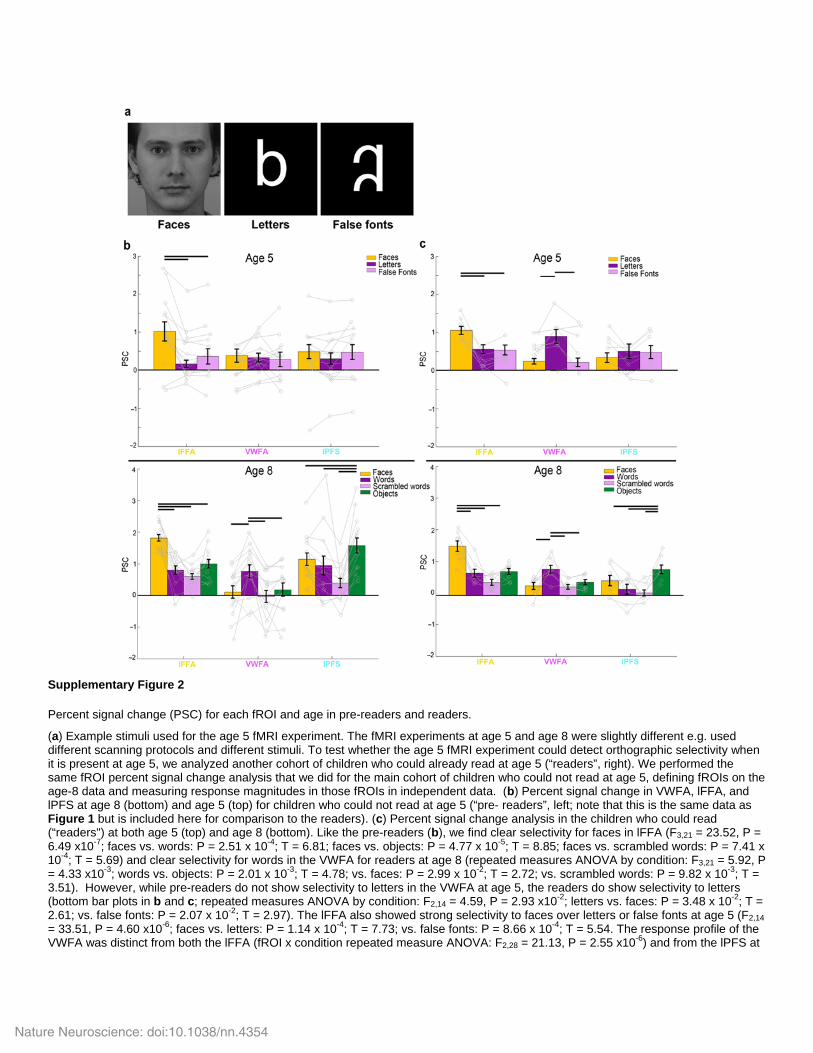
Supplementary Figure 2
Percent signal change (PSC) for each fROI and age in pre-readers and readers.
(a) Example stimuli used for the age 5 fMRI experiment. The fMRI experiments at age 5 and age 8 were slightly different e.g. used different scanning protocols and different stimuli. To test whether the age 5 fMRI experiment could detect orthographic selectivity when it is present at age 5, we analyzed another cohort of children who could already read at age 5 (“readers”, right). We performed the same fROI percent signal change analysis that we did for the main cohort of children who could not read at age 5, defining fROIs on the age-8 data and measuring response magnitudes in those fROIs in independent data. (b) Percent signal change in VWFA, lFFA, and lPFS at age 8 (bottom) and age 5 (top) for children who could not read at age 5 (“pre- readers”, left; note that this is the same data as Figure 1 but is included here for comparison to the readers). (c) Percent signal change analysis in the children who could read (“readers") at both age 5 (top) and age 8 (bottom). Like the pre-readers (b), we find clear selectivity for faces in lFFA (F3,21 = 23.52, P = 6.49 x10⁻⁷; faces vs. words: P = 2.51 x 10⁻⁴; T = 6.81; faces vs. objects: P = 4.77 x 10⁻⁵; T = 8.85; faces vs. scrambled words: P = 7.41 x 10⁻⁴; T = 5.69) and clear selectivity for words in the VWFA for readers at age 8 (repeated measures ANOVA by condition: F3,21 = 5.92, P = 4.33 x10⁻³; words vs. objects: P = 2.01 x 10⁻³; T = 4.78; vs. faces: P = 2.99 x 10⁻²; T = 2.72; vs. scrambled words: P = 9.82 x 10⁻³; T = 3.51). However, while pre-readers do not show selectivity to letters in the VWFA at age 5, the readers do show selectivity to letters (bottom bar plots in b and c; repeated measures ANOVA by condition: F2,14 = 4.59, P = 2.93 x10⁻²; letters vs. faces: P = 3.48 x 10⁻²; T = 2.61; vs. false fonts: P = 2.07 x 10⁻²; T = 2.97). The lFFA also showed strong selectivity to faces over letters or false fonts at age 5 (F2,14 = 33.51, P = 4.60 x10⁻⁶; faces vs. letters: P = 1.14 x 10⁻⁴; T = 7.73; vs. false fonts: P = 8.66 x 10⁻⁴; T = 5.54. The response profile of the VWFA was distinct from both the lFFA (fROI x condition repeated measure ANOVA: F2,28 = 21.13, P = 2.55 x10⁻⁶) and from the lPFS at
Nature Neuroscience: doi:10.1038/nn.4354

age 5 (F2,28 = 9.78, P = 6.01 x10⁻⁴) as well as at age 8 (VWFA vs. lFFA same three conditions as age 5, i.e. no objects condition: F2,28 = 18.30, P = 8.26 x10⁻⁶ and VWFA vs. lPFS: F2,28 = 5.93, P = 7.12 x10⁻³). Error bars = SE and horizontal bars reflect individual posthoc tests significant at P < 0.05.
Nature Neuroscience: doi:10.1038/nn.4354

Supplementary Figure 3
Percent signal change in the VWFA as a function of fROI volume in pre-readers and readers.
(a) Children who were not able to read at age 5 (“pre-readers”) did not show selectivity for letters as compared to faces or false fonts (top; for 5th percentile: letters vs. false fonts: P = 0.126; T(13) = 1.63; letters vs. faces: P = 0.711; T(13) = -0.379). We also defined percentiles in exactly the same way from age 8 data (bottom), and found strong selectivity for words (words vs. scrambled words: P = 3.02 x10⁻²; T(13) = 2.43; words vs. faces: P = 1.38 x10⁻²; T(13) = 4.05). Note that (a) is the same figure as Figure 2 in main text but also included here for comparison to children who could already read at age 5 (“readers”). (b) Readers do show selectivity for letters as compared to faces or false fonts, even in the most selective bin (top 5%) at age 5 (top; letters vs. false fonts: P = 1.79x10⁻²; T(7) = 3.08; letters vs. faces: P = 2.04 x 10⁻³; T(7) = 4.77) as well as at age 8 (bottom; words vs. scrambled words: P = 2.65 x10⁻²; (t7) = 2.80; words vs. faces: P = 2.19 x10⁻²; T(7) = 2.93). Error bars = SE.
Nature Neuroscience: doi:10.1038/nn.4354
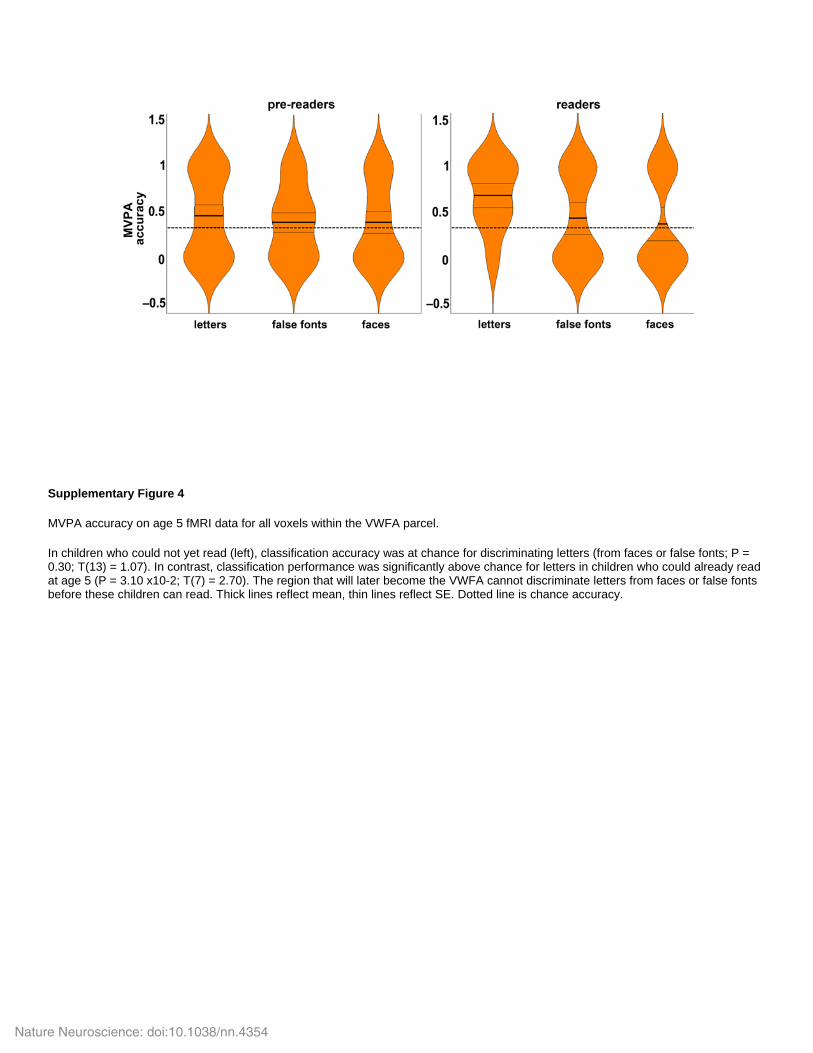
Supplementary Figure 4
MVPA accuracy on age 5 fMRI data for all voxels within the VWFA parcel.
In children who could not yet read (left), classification accuracy was at chance for discriminating letters (from faces or false fonts; P = 0.30; T(13) = 1.07). In contrast, classification performance was significantly above chance for letters in children who could already read at age 5 (P = 3.10 x10⁻²; T(7) = 2.70). The region that will later become the VWFA cannot discriminate letters from faces or false fonts before these children can read. Thick lines reflect mean, thin lines reflect SE. Dotted line is chance accuracy.
Nature Neuroscience: doi:10.1038/nn.4354

Supplementary Figure 5
Group average (random effects) map for words > objects for leave-one-subject-out analysis on template brain.
Although the VWFA usually falls within the lateral surface of the occipitotemporal cortex, its precise location varies substantially across individuals13. Thus the group average maps of word-selectivity do not show above threshold activations as illustrated here. Colorbar scale indicates -log(p) values.
Nature Neuroscience: doi:10.1038/nn.4354

Supplementary Table 1. fMRI selectivity in longitudinal DWI cohort. The main fMRI selectivity results (Figure 1) are based on the full set of 14 subjects for maximal statistical power. The fMRI results are qualitatively unchanged with the same 11 subjects used in the DWI predictions. At age 8, the VWFA and lFFA showed a significant difference in their responses (2-way repeated measures ANOVA of ROI x condition); repeated measures ANOVAs by condition revealed that both the VWFA and lFFA responded significantly differently across stimulus conditions. However, at age 5, the VWFA did not show any differential response by condition whereas the lFFA already did. These data again provide no evidence of functional differentiation of the VWFA at age 5. Age 8 VWFA vs. lFFA F3,60 = 19.83; P = 4.74 x10⁻⁹ VWFA F3,30 = 12.70; P = 1.57 x10⁻⁵ lFFA F3,30 = 21.07; P = 1.54 x10⁻⁷ Age 5 VWFA vs. lFFA F2,32 = 6.07; P = 5.80 x 10⁻³ VWFA F2,16 = 1.72; P = 0.21 lFFA F2,16 = 5.08; P = 1.95 x10⁻²
Nature Neuroscience: doi:10.1038/nn.4354
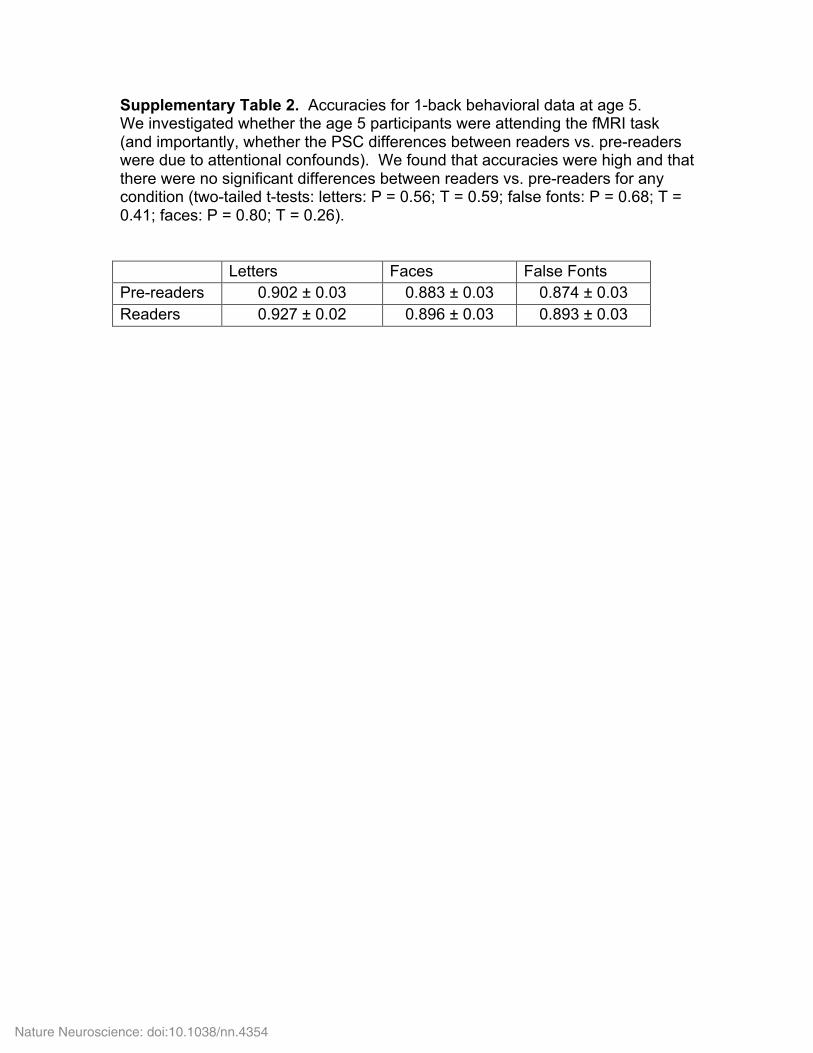
Supplementary Table 2. Accuracies for 1-back behavioral data at age 5. We investigated whether the age 5 participants were attending the fMRI task (and importantly, whether the PSC differences between readers vs. pre-readers were due to attentional confounds). We found that accuracies were high and that there were no significant differences between readers vs. pre-readers for any condition (two-tailed t-tests: letters: P = 0.56; T = 0.59; false fonts: P = 0.68; T = 0.41; faces: P = 0.80; T = 0.26). Letters Faces False Fonts Pre-readers 0.902 ± 0.03 0.883 ± 0.03 0.874 ± 0.03 Readers 0.927 ± 0.02 0.896 ± 0.03 0.893 ± 0.03
Nature Neuroscience: doi:10.1038/nn.4354

Supplementary Table 3. Correlation coefficients for DWI and fMRI motion measures. None of the fMRI motion measures (total vector motion, root mean squared motion, between time-point translation, and rotation) were correlated with any of the DWI motion measures (all P>0.05; average translation, rotation, percentage bad slices, and average drop-out score). Total vector
motion Root mean squared rotation
Translation Rotation
Translation 0.10 0.14 0.47 0.05 Rotation –0.18 0.03 0.35 0.21 Percent bad slices –0.38 –0.18 –0.32 –0.12 Average drop-out –0.40 –0.19 0.22 –0.14
Nature Neuroscience: doi:10.1038/nn.4354