nav - aditya birla capital · nav & contents 2 market outlook 3 birla advantage fund 4 birla...
TRANSCRIPT
NAV & Contents 2
Market Outlook 3
Birla Advantage Fund 4
Birla Dividend Yield Plus 5
Birla Midcap Fund 6
Birla MNC Fund 7
Birla India
Opportunities Fund 8
Birla Index Fund 9
Birla Equity Plan 10
Birla Balance 11
Birla MIP 12
Birla MIP II 13 - 14
Birla Income Plus 15
Birla Gilt Plus 16
Birla Dynamic Bond Fund 17
Birla Bond Index Fund 17
Birla Bond Plus 18
Birla Floating Rate Fund 19
Birla Cash Plus 20
Birla Asset Allocation Fund 21
India Advantage Fund 22
Addendums 23
Methodology of Ranking 24
Load Structure 25
Dividend History 26
Performance 27
Contact Details 28
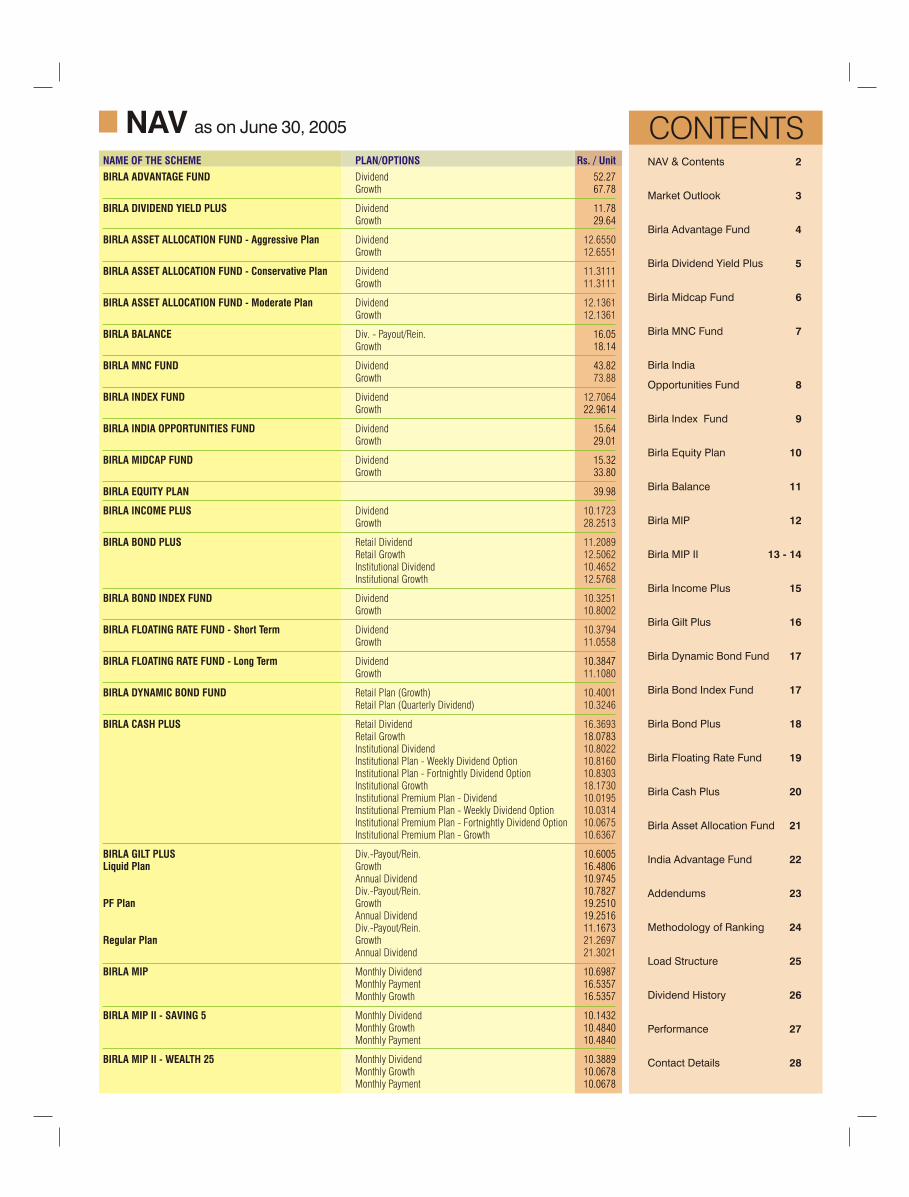
CONTENTSNAV as on June 30, 2005
BIRLA ADVANTAGE FUND Dividend Growth
BIRLA DIVIDEND YIELD PLUS DividendGrowth
BIRLA ASSET ALLOCATION FUND - Aggressive Plan Dividend 12.6550Growth 12.6551
BIRLA ASSET ALLOCATION FUND - Conservative Plan Dividend 11.3111 Growth 11.3111
BIRLA ASSET ALLOCATION FUND - Moderate Plan Dividend 12.1361 Growth 12.1361
BIRLA BALANCE Div. - Payout/Rein. Growth
BIRLA MNC FUND Dividend Growth 73.88
BIRLA INDEX FUND Dividend 12.7064 Growth
BIRLA INDIA OPPORTUNITIES FUND Dividend Growth
BIRLA MIDCAP FUND Dividend Growth
BIRLA EQUITY PLAN
BIRLA INCOME PLUS Dividend 10.1723Growth 28.2513
BIRLA BOND PLUS Retail Dividend 11.2089Retail Growth 12.5062Institutional Dividend 10.4652 Institutional Growth 12.5768
BIRLA BOND INDEX FUND Dividend 10.3251 Growth 10.8002
BIRLA FLOATING RATE FUND - Short Term Dividend 10.3794 Growth 11.0558
BIRLA FLOATING RATE FUND - Long Term Dividend Growth 11.1080
BIRLA DYNAMIC BOND FUND Retail Plan (Growth) 10.4001 Retail Plan (Quarterly Dividend) 10.3246
BIRLA CASH PLUS Retail Dividend 16.3693Retail Growth Institutional Dividend 10.8022Institutional Plan - Weekly Dividend Option 10.8160Institutional Plan - Fortnightly Dividend Option 10.8303Institutional Growth 18.1730Institutional Premium Plan - Dividend 10.0195 Institutional Premium Plan - Weekly Dividend Option 10.0314Institutional Premium Plan - Fortnightly Dividend Option 10.0675Institutional Premium Plan - Growth 10.6367
BIRLA GILT PLUS Div.-Payout/Rein. Liquid Plan Growth Annual Dividend Div.-Payout/Rein. PF Plan Growth
Annual Dividend Div.-Payout/Rein.
Regular Plan Growth 21.2697Annual Dividend 21.3021
BIRLA MIP Monthly Dividend Monthly Payment Monthly Growth
BIRLA MIP II - SAVING 5 Monthly Dividend Monthly Growth Monthly Payment
BIRLA MIP II - WEALTH 25 Monthly Dividend Monthly Growth Monthly Payment
52.27 67.78
11.78 29.64
16.05 18.14
43.82
22.9614
15.64 29.01
15.32 33.80
39.98
10.3847
18.0783
10.600516.480610.974510.782719.251019.251611.1673
10.698716.535716.5357
10.143210.484010.4840
10.388910.067810.0678
NAME OF THE SCHEME PLAN/OPTIONS Rs. / Unit
Market Outlook
Equity Markets
After a few months of getting sidelined by their mid-cap
counterparts, June saw the large-cap stocks back in action. The
momentum in most large-cap stocks helped the BSE Sensex soar
past the 7000 mark for the first time.
International markets continued with their see-sawing, but none
matched the sheer pace of the Indian equity markets' run.
Corporate results largely matched expectations, inflation data was
benign and foreign institutional investment resumed with renewed
vigour. Add to this, the massive amounts of money deployed by
domestic mutual funds raised from their new fund offerings of the
previous months, the markets just kept growing.
Even as the markets rejoice, it would be prudent to highlight some
concerns inadequate monsoons, rising oil prices and interest
rates. For years, June has been looked at for key data points
regarding the monsoons. Monsoons still remain the primary source
of irrigation but their relevance to GDP growth has substantially
reduced. Distribution of rainfall is as critical as the quantum of it and
the dispersion of monsoons over the next few months need to be
watched clearly. However, with services now constituting more
than half of the GDP, the scourge of monsoons or rather the lack of it
, has become a thing of the past.
Next, on to the slippery subject of rising oil prices. Rising global
consumption and energy demands have ensured that oil prices
remain high. The manufacturing sector in particular would be under
considerable margin pressure and only the best of the lot , the ones
that employ modern technology while striving for continuous cost
reduction, would survive.
The wherewithal of companies to withstand this would be evident
by their ability to pass on cost increases, increase manufacturing
efficiencies, outsourcing of non critical applications and
arrangement of alternative sources of capital, locally or globally.
Although the index is at an all time high, the forward valuations of
the Indian markets at 13 X Earnings still look attractive. Adjusted for
inflation, the economy is expected to achieve nominal GDP growth
of around 12%. This would ensure long term earnings growth of
15%+ for most top corporates. Many of our portfolio companies
have bettered this performance backed by our continuous focus on
bottoms up investment research and analysis.
To mark the celebrations of the New India, June saw the launch of
the Birla India Gen Next Fund - a fund driven by the lives and
aspirations of India's youth. The Fund seeks to benefit from the
growing consumption boom in the country and remains open for
subscription till July 12, 2005. The Fund with its unique thematic
focus will seek to provide long term capital growth and presents
itself as an ideal investment vehicle for investors.
Debt Market
The month began on a positive note against the backdrop of easing
inflation and declining US yields. The markets remained upbeat
throughout the month except for the third week when the 10 year
benchmark yield rose to 6.94%. The Finance Minister's statement
that the central government would go ahead with its borrowing plan
coupled with an increase in the US treasury yields dampened
market sentiments. A surge in the US treasuries helped the markets
gain in the last week. The yield on the benchmark bond touched a
low of 6.80% during the month and closed at 6.88% on June 30,
2005. The government hiked domestic and diesel prices in the
current month, the hike being lower than expectations and leading
to positive sentiments in the fixed income markets.
The Reserve Bank of India (RBI) conducted twin auctions worth
Rs 10,000 crore in the second week, setting the cut-off prices at
Rs 103 (7.37 2014 bond) and Rs 125.71 (10.25 2021 bond). On
June 14 2005, a state loan auction was carried out raising Rs 24.81
crore. The RBI set a cut-off yield of 7.39 % on 10-year loans issued
by 10 states, while the cut-off was 7.35 % for the loan issued by
Tamil Nadu.
On June 29 2005, the RBI announced that it would sell
Rs 32500 crores worth of treasury bills in the July - September
period under MSS to replace Rs. 26251 crores of treasury bills and
another Rs 20000 crores of bonds that were maturing.
Inflation continued its downward trend for five consecutive weeks
largely due to a high-base effect. It stood at 4.22% for the week
ended June 4, 2005. However, it rose marginally to 4.33% for the
week ended June 11, 2005.
Brent crude oil price continued to increase throughout the month
moving to around $53 for the first two weeks. Prices surged above
$55 per barrel in the third week despite the Oil Petroleum Exporting
Countries (OPEC) agreeing to increase its production quotas by
5,00,000 barrels a day. During the last week, prices touched the $60
per barrel mark. Prices spiraled due to refining capacity concerns
and high US demand.
Liquidity was ample during the month except for the third week
when outflows towards state loan auctions and advance tax
payments caused a strain. Call rates moved in a range of 4.9 to
5.1% for most of the month. However, call rates closed higher at 5-
5.2% on certain days due to higher demand for funds against falling
liquidity. Call rates were at 5.65-5.75% on June 30, 2005.
Rupee traded in a narrow range of $43.55/56 against the dollar this
month. It closed at Rs. 43.56/57 per dollar on June 30, 2005.
In this situation, we continue recommending liquid and floating rate
funds. One could also look at short-term debt funds like Birla Bond
Plus.
3
Q U A R T E R L YQ U A R T E R L Y
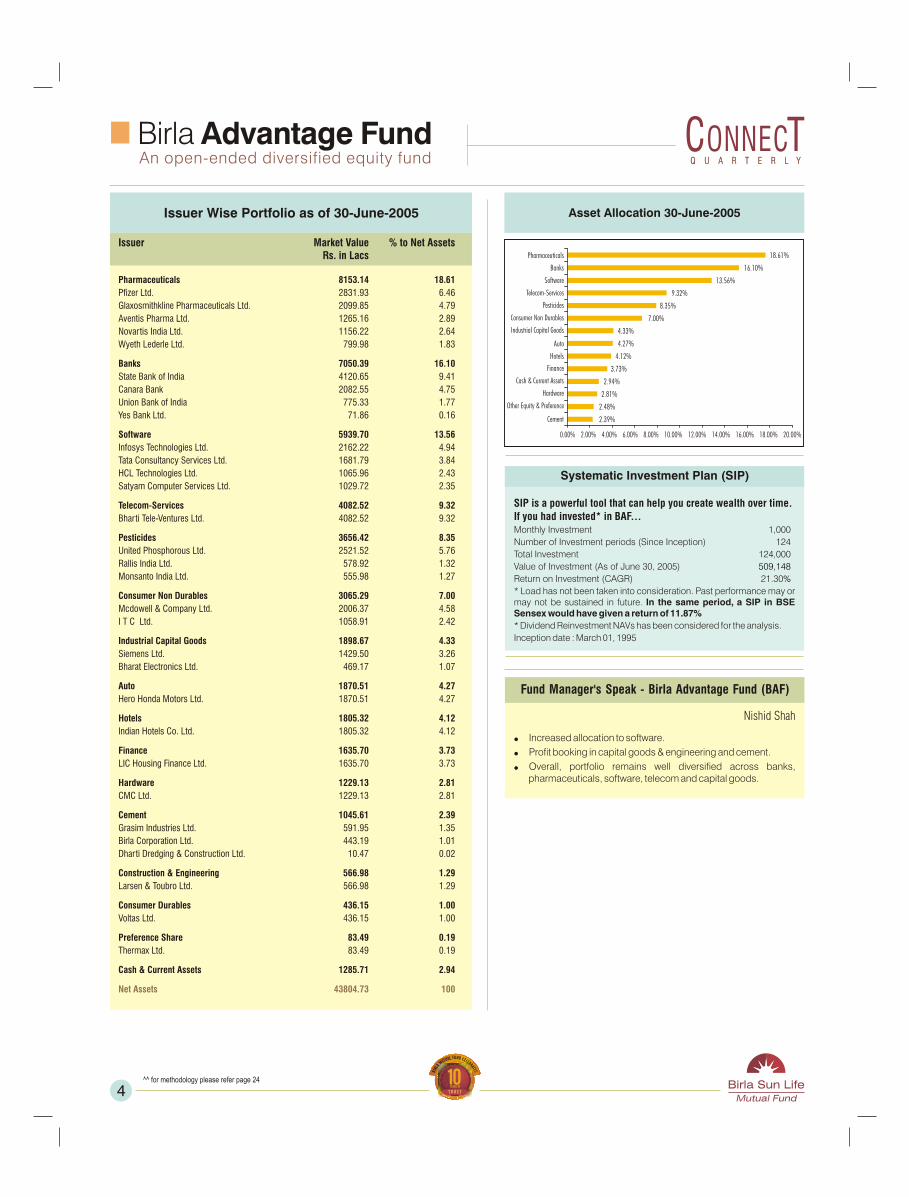
Systematic Investment Plan (SIP)
SIP is a powerful tool that can help you create wealth over time.
If you had invested* in BAF...
Monthly Investment 1,000
Number of Investment periods (Since Inception) 124
Total Investment 124,000
Value of Investment (As of June 30, 2005)
Return on Investment (CAGR) 21.30
* Load has not been taken into consideration. Past performance may or may not be sustained in future. In the same period, a SIP in BSE Sensex would have given a return of 11.87%
* Dividend Reinvestment NAVs has been considered for the analysis.
Inception date : March 01, 1995
509,148
%
Birla Advantage FundAn open-ended diversified equity fund
Issuer Market Value % to Net AssetsRs. in Lacs
Pharmaceuticals 8153.14 18.61
Pfizer Ltd. 2831.93 6.46
Glaxosmithkline Pharmaceuticals Ltd. 2099.85 4.79
Aventis Pharma Ltd. 1265.16 2.89
Novartis India Ltd. 1156.22 2.64
Wyeth Lederle Ltd. 799.98 1.83
Banks 7050.39 16.10
State Bank of India 4120.65 9.41
Canara Bank 2082.55 4.75
Union Bank of India 775.33 1.77
Yes Bank Ltd. 71.86 0.16
Software 5939.70 13.56
Infosys Technologies Ltd. 2162.22 4.94
Tata Consultancy Services Ltd. 1681.79 3.84
HCL Technologies Ltd. 1065.96 2.43
Satyam Computer Services Ltd. 1029.72 2.35
Telecom-Services 4082.52 9.32
Bharti Tele-Ventures Ltd. 4082.52 9.32
Pesticides 3656.42 8.35
United Phosphorous Ltd. 2521.52 5.76
Rallis India Ltd. 578.92 1.32
Monsanto India Ltd. 555.98 1.27
Consumer Non Durables 3065.29 7.00
Mcdowell & Company Ltd. 2006.37 4.58
I T C Ltd. 1058.91 2.42
Industrial Capital Goods 1898.67 4.33
Siemens Ltd. 1429.50 3.26
Bharat Electronics Ltd. 469.17 1.07
Auto 1870.51 4.27
Hero Honda Motors Ltd. 1870.51 4.27
Hotels 1805.32 4.12
Indian Hotels Co. Ltd. 1805.32 4.12
Finance 1635.70 3.73
LIC Housing Finance Ltd. 1635.70 3.73
Hardware 1229.13 2.81
CMC Ltd. 1229.13 2.81
Cement 1045.61 2.39
Grasim Industries Ltd. 591.95 1.35
Birla Corporation Ltd. 443.19 1.01
Dharti Dredging & Construction Ltd. 10.47 0.02
Construction & Engineering 566.98 1.29
Larsen & Toubro Ltd. 566.98 1.29
Consumer Durables 436.15 1.00
Voltas Ltd. 436.15 1.00
Preference Share 83.49 0.19
Thermax Ltd. 83.49 0.19
Cash & Current Assets 1285.71 2.94
Net Assets 43804.73 100
Issuer Wise Portfolio as of 30-June-2005
Fund Manager's Speak - Birla Advantage Fund (BAF)
Nishid Shah
4
! Increased allocation to software.
! Profit booking in capital goods & engineering and cement.
! Overall, portfolio remains well diversified across banks, pharmaceuticals, software, telecom and capital goods.
^^ for methodology please refer page 24
Q U A R T E R L YQ U A R T E R L Y
Asset Allocation 30-June-2005
0.00% 2.00% 4.00% 6.00% 8.00% 10.00% 12.00% 14.00% 16.00% 18.00% 20.00%
2.39%
2.48%
2.81%
2.94%
3.73%
4.12%
4.27%
4.33%
7.00%
8.35%
9.32%
13.56%
16.10%
18.61%
Cement
Other Equity & Preference
Hardware
Cash & Current Assets
Finance
Hotels
Auto
Industrial Capital Goods
Consumer Non Durables
Pesticides
Telecom-Services
Software
Banks
Pharmaceuticals
Systematic Investment Plan (SIP)
SIP is a powerful tool that can help you create wealth over time.
If you had invested* in BDYP...
Monthly Investment 1,000
Number of Investment periods (Since Inception) 28
Total Investment 28,000
Value of Investment (As of June 30, 2005) 45,388
Return on Investment (CAGR) 45.11%
* Load has not been taken into consideration. Past performance may or may not be sustained in future. In the same period, a SIP in CNX 500 would have given a return of 39.94%
Inception date: March 01, 2003
Birla Dividend Yield PlusAn open-ended growth scheme investing in high dividend yield companies
Issuer Market Value % to Net AssetsRs. in Lacs
Consumer Non Durables 9834.04 14.89Colgate Palmolive (I) Ltd. 2166.39 3.28Hindustan Lever Ltd. 1646.69 2.49Procter & Gamble Hygiene & Health Care Ltd. 1643.88 2.49Godrej Consumer Products Ltd. 1577.59 2.39Nestle India Ltd. 1342.78 2.03ICI India Ltd. 1121.64 1.70Heritage Foods (India) Ltd. 335.08 0.51Banks 8957.90 13.57Vijaya Bank 2414.39 3.66Union Bank of India 2071.33 3.14Andhra Bank 1945.23 2.95Indian Overseas Bank 1925.30 2.92IndusInd Bank Ltd. 601.65 0.91Petroleum Products 7243.18 10.97Castrol (India) Ltd. 2256.57 3.42Bongaigaon Refinery & Petrochemicals Ltd 1800.16 2.73Indian Oil Corporation Ltd. 1731.45 2.62Kochi Refineries Ltd. 1455.00 2.20Industrial Capital Goods 5703.61 8.64Alfa Laval (India) Ltd. 2340.72 3.55Crompton Greaves Ltd. 1976.11 2.99Thermax Ltd. 1386.78 2.10Auto 5520.83 8.36Hero Honda Motors Ltd. 3155.83 4.78Ashok Leyland Ltd. 2365.00 3.58Industrial Products 3988.57 6.04Cummins India Ltd. 2007.10 3.04Essel Propack Ltd. 1981.47 3.00Pharmaceuticals 2844.12 4.31Glaxosmithkline Pharmaceuticals Ltd. 1930.92 2.92Abbott Laboratories (India) Ltd. 913.20 1.38Oil 2470.22 3.74Oil & Natural Gas Corporation Ltd. 2470.22 3.74Textiles-Synthetic 2366.56 3.58Century Enka Ltd. 2366.56 3.58Fertilisers 2084.93 3.16Tata Chemicals Ltd. 2084.93 3.16Telecom-Services 1596.48 2.42Mahanagar Telephone Nigam Ltd. 1596.48 2.42Gas 1457.06 2.21Gas Authority of India Ltd. 1457.06 2.21Chemicals 1413.73 2.14Clariant (India) Ltd. 1095.46 1.66Finolex Industries Ltd. 318.27 0.48Software 1069.48 1.62HCL Technologies Ltd. 1069.48 1.62Auto Ancillaries 1035.57 1.57Carborundum Universal Ltd. 1035.57 1.57Ferrous Metals 673.47 1.02PSL Holdings Ltd. 673.47 1.02Transportation 637.65 0.97The Great Eastern Shipping Co. Ltd. 637.65 0.97Steel 627.40 0.95Steel Authority of India Ltd. 627.40 0.95Hardware 510.44 0.77HCL Infosystems Ltd. 510.44 0.77Electric Utilities 415.25 0.63National Thermal Power Corporation Ltd. 415.25 0.63Packaging 323.51 0.49Cosmo Films Ltd. 323.51 0.49Preference Share 57.38 0.09Thermax Ltd. 57.38 0.09Treasury Bills 1482.04 2.24Treasury Bills 1482.04 2.24Floating Rate Instruments 2010.99 3.05ICICI Bank Ltd. 2010.99 3.05Cash & Current Assets 1700.60 2.58Net Assets 66025.00 100.00
Issuer Wise Portfolio as of 30-June-2005
5
Fund Manager's Speak - Birla Dividend Yield Plus (BDYP)
Deven Sangoi
! Dividend yield of portfolio around 3.8%.
! Overweight on FMCG companies.
! Reduced exposure to oil marketing companies.
Q U A R T E R L YQ U A R T E R L Y
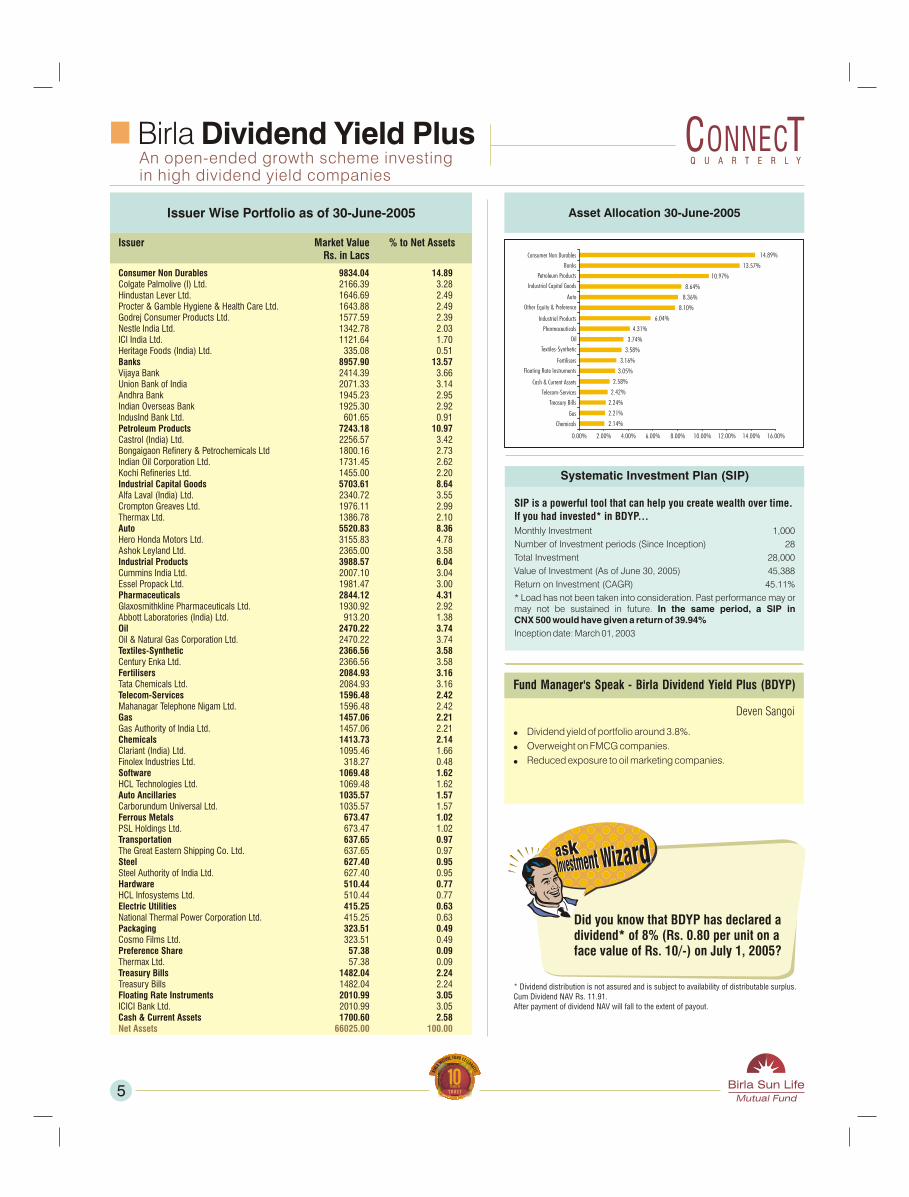
Asset Allocation 30-June-2005
0.00% 2.00% 4.00% 6.00% 8.00% 10.00% 12.00% 14.00% 16.00%
2.14%
2.21%
2.24%
2.42%
2.58%
3.05%
3.16%
3.58%
3.74%
4.31%
6.04%
8.10%
8.36%
8.64%
10.97%
13.57%
14.89%
Chemicals
Gas
Treasury Bills
Telecom-Services
Cash & Current Assets
Floating Rate Instruments
Fertilisers
Textiles-Synthetic
Oil
Pharmaceuticals
Industrial Products
Other Equity & Preference
Auto
Industrial Capital Goods
Petroleum Products
Banks
Consumer Non Durables
* Dividend distribution is not assured and is subject to availability of distributable surplus.
Cum Dividend NAV Rs. 11.91.
After payment of dividend NAV will fall to the extent of payout.
Did you know that BDYP has declared a dividend* of 8% (Rs. 0.80 per unit on a face value of Rs. 10/-) on July 1, 2005?

Systematic Investment Plan (SIP)
SIP is a powerful tool that can help you create wealth over time.
If you had invested* in BMC...
Monthly Investment 1,000
Number of Investment periods (Since Inception) 32
Total Investment 32,000
Value of Investment (As of June 30, 2005)
Return on Investment (CAGR) 73.05
* Load has not been taken into consideration. Past performance may or may not be sustained in future. In the same period, a SIP in CNX Midcap would have given a return of 77.60
Inception date : November 01, 2002
63,898
%
%
Birla Midcap FundAn open-ended growth scheme investing primarily in midcap stocks
Issuer Market Value % to Net AssetsRs. in Lacs
Pharmaceuticals 2455.67 18.08Abbott Laboratories (India) Ltd. 707.30 5.21Pfizer Ltd. 439.94 3.24Aventis Pharma Ltd. 353.58 2.60E. Merck (India) Ltd. 347.35 2.56Fulford (India) Ltd. 256.18 1.89Glaxosmithkline Pharmaceuticals Ltd. 180.76 1.33Novartis India Ltd. 170.57 1.26
Consumer Non Durables 1796.40 13.23Mcdowell & Company Ltd. 811.98 5.98Kajaria Ceramics Ltd. 400.15 2.95Macmillan India Ltd. 350.06 2.58I T C Ltd. 234.21 1.72
Banks 1660.38 12.23Federal Bank Ltd. 616.64 4.54The Jammu & Kashmir Bank Ltd. 457.46 3.37Union Bank of India 237.49 1.75Oriental Bank of Commerce 189.78 1.40Indian Overseas Bank 136.03 1.00Yes Bank Ltd. 22.98 0.17
Software 1328.46 9.78Mastek Ltd. 427.97 3.15Subex Systems Ltd. 295.46 2.18Geometric Software Solutions Co. Ltd. 272.10 2.00Helios& Matheson Information Techno. Ltd 210.91 1.55Hinduja TMT Ltd. 122.03 0.90
Hotels 1162.12 8.56Taj GVK Hotels & Resorts Ltd. 656.89 4.84Asian Hotels Ltd. 349.67 2.57Oriental Hotels Ltd. 155.56 1.15
Hardware 966.85 7.12Tata Elxsi Ltd. 689.99 5.08CMC Ltd. 276.86 2.04
Pesticides 638.03 4.70Rallis India Ltd. 475.81 3.50Syngenta (India) Ltd. 162.21 1.19
Telecom-Services 548.84 4.04Bharti Tele-Ventures Ltd. 548.84 4.04
Industrial Capital Goods 547.62 4.03Alstom Power India Ltd. 294.55 2.17Siemens Ltd. 253.06 1.86
Finance 495.92 3.65LIC Housing Finance Ltd. 495.92 3.65
Power Equipment 300.31 2.21Torrent Cables Ltd. 300.31 2.21
Retailing 285.73 2.10Trent Ltd 280.63 2.07Trent Ltd - Rights 5.09 0.04
Cement 256.90 1.89Birla Corporation Ltd. 256.90 1.89
Ferrous Metals 249.20 1.83Tata Metaliks Ltd. 145.50 1.07Kalyani Steel 103.71 0.76
Industrial Products 214.45 1.58Kirloskar Oil Engines Ltd. 214.45 1.58
Consumer Durables 182.32 1.34Voltas Ltd. 182.32 1.34
Auto Ancillaries 139.92 1.03Auto Corporation of Goa Ltd. 72.43 0.53Automotive Axles Ltd. 67.49 0.50
Preference Share 10.61 0.08Thermax Ltd. 10.61 0.08
Cash & Current Assets 341.10 2.51
Net Assets 13580.83 100.00
Issuer Wise Portfolio as of 30-June-2005
6
Fund Manager's Speak - Birla Midcap Fund (BMC)
Nishid Shah! Increased exposure in banks due to attractive valuations and
substantial credit offtake.
! Increased weightage in hotels to take advantage of the upturn in the hospitality sector.
! Profit booking in shipping & textiles.
! Portfolio well diversified across banks, pharma, software and hotels.
CRISIL~CPR 2 Open End Equity Category^^
(Past performance is no guarantee of future results.)
^^ for methodology please refer page 24
Q U A R T E R L YQ U A R T E R L Y
Asset Allocation 30-June-2005
0.00% 2.00% 4.00% 6.00% 8.00% 10.00% 12.00% 14.00% 16.00% 18.00% 20.00%
2.10%
2.21%
2.51%
3.65%
4.03%
4.04%
4.70%
7.12%
7.76%
8.56%
9.78%
12.23%
13.23%
18.08%
Retailing
Power Equipment
Cash & Current Assets
Finance
Industrial Capital Goods
Telecom-Services
Pesticides
Hardware
Other Equity & Preference
Hotels
Software
Banks
Consumer Non Durables
Pharmaceuticals
Did you know that in the last 1 year theCNX Midcap Index has appreciated by around 96%?
Systematic Investment Plan (SIP)
SIP is a powerful tool that can help you create wealth over time.
If you had invested* in BMNC...
Monthly Investment 1,000
Number of Investment periods (Since takeover) 66
Total Investment 66,000
Value of Investment (As of June 30, 2005)
Return on Investment (CAGR) 28.24
* Load has not been taken into consideration. Past performance may or may not be sustained in future. In the same period, a SIP in CNX MNC would have given a return of 12.15
Takeover date : January 01, 2000
141,772
%
%
Birla MNC FundAn open-ended growth scheme investing in multinational companies
Issuer Market Value % to Net Rs. in Lacs
Consumer Non Durables 4216.72 26.51
I T C Ltd. 1030.88 6.48
Colgate Palmolive (I) Ltd. 770.88 4.85
Hindustan Lever Ltd. 696.94 4.38
Britannia Industries Ltd. 656.41 4.13
Glaxo Smithkline Consumer Healthcare Ltd 540.83 3.40
Procter & Gamble Hygiene & Health Care L 520.80 3.27
Pharmaceuticals 3990.18 25.08
Pfizer Ltd. 1132.51 7.12
Glaxosmithkline Pharmaceuticals Ltd. 1087.26 6.83
Aventis Pharma Ltd. 974.52 6.13
Novartis India Ltd. 564.78 3.55
Wyeth Lederle Ltd. 231.11 1.45
Software 2232.96 14.04
I-Flex Solutions Ltd. 975.59 6.13
Flextronics Software Systems Ltd. 855.42 5.38
Mphasis BFL Ltd. 401.95 2.53
Industrial Capital Goods 1998.42 12.56
Siemens Ltd. 773.23 4.86
ABB Ltd. 601.60 3.78
Alstom Power India Ltd. 378.23 2.38
Alfa Laval (India) Ltd. 245.36 1.54
Auto 991.87 6.23
Hero Honda Motors Ltd. 671.42 4.22
Maruti Udyog Ltd. 320.45 2.01
Pesticides 991.28 6.23
Monsanto India Ltd. 530.32 3.33
Syngenta (India) Ltd. 460.95 2.90
Industrial Products 358.29 2.25
Vesuvius India Ltd. 203.69 1.28
ESAB India Ltd. 154.59 0.97
Telecom-Services 335.62 2.11
Bharti Tele-Ventures Ltd. 335.62 2.11
Trading 272.23 1.71
3M India Ltd. 272.23 1.71
Auto Ancillaries 138.86 0.87
Automotive Axles Ltd. 138.86 0.87
Cash & Current Assets 382.41 2.40
Net Assets 15908.84 100.00
Issuer Wise Portfolio as of 30-June-2005
7
Fund Manager's Speak - Birla MNC Fund (BMNC)
Nishid Shah
! Increased allocation to auto, software and FMCG.
! Realignment in capital goods and engineering.
! Portfolio remains well diversified across sectors.
Q U A R T E R L YQ U A R T E R L Y
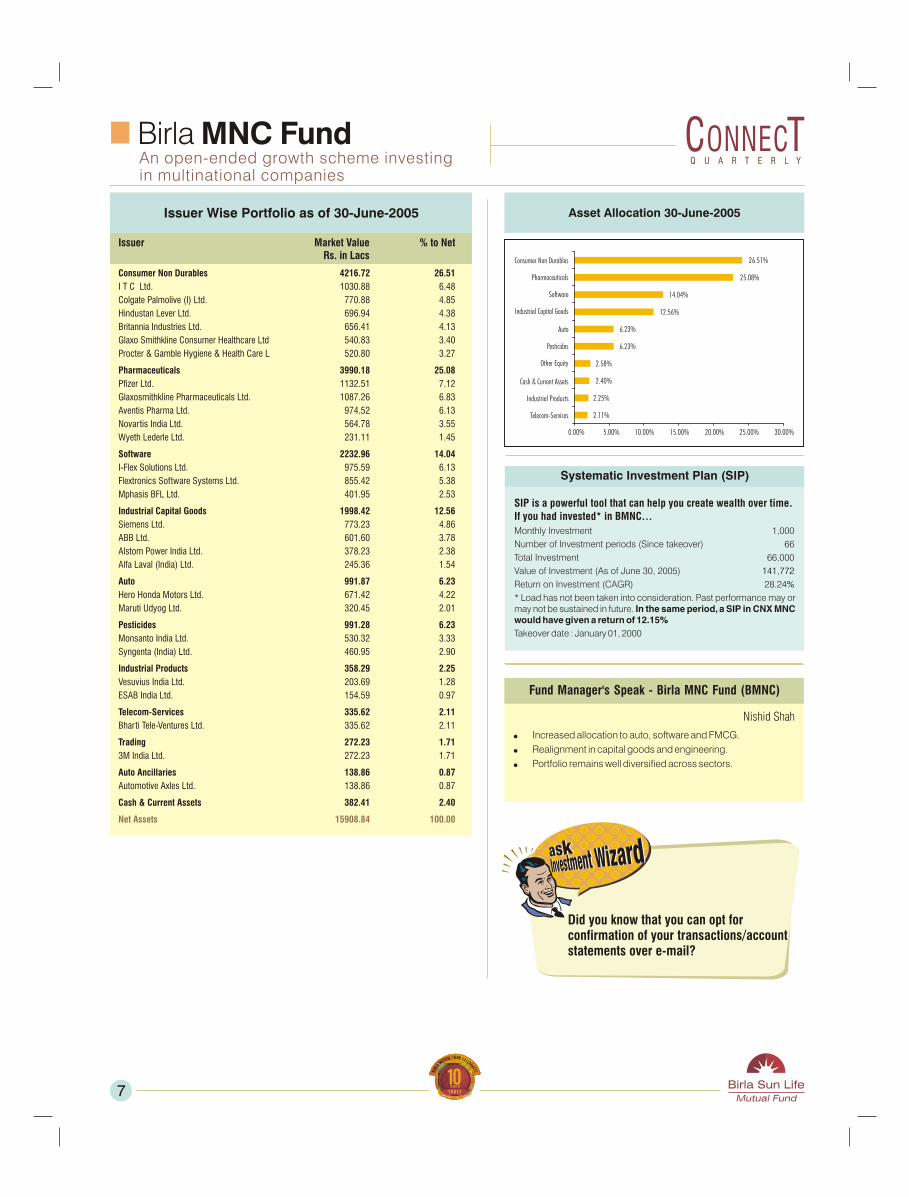
Asset Allocation 30-June-2005
0.00% 5.00% 10.00% 15.00% 20.00% 25.00% 30.00%
2.11%
2.25%
2.40%
2.58%
6.23%
6.23%
12.56%
14.04%
25.08%
26.51%
Telecom-Services
Industrial Products
Cash & Current Assets
Other Equity
Pesticides
Auto
Industrial Capital Goods
Software
Pharmaceuticals
Consumer Non Durables
Did you know that you can opt for confirmation of your transactions/account statements over e-mail?
Systematic Investment Plan (SIP)
SIP is a powerful tool that can help you create wealth over time.
If you had invested* in BIOF...
Monthly Investment 1,000
Number of Investment periods (Since takeover) 66
Total Investment 66,000
Value of Investment (As of June 30, 2005)
Return on Investment (CAGR) 25.98
* Load has not been taken into consideration. Past performance may or may not be sustained in future. In the same period, a SIP in CNX 500 would have given a return of 25.11
Takeover date : January 01, 2000
134,859
%
%
Birla India Opportunities FundAn open-ended equity fund that focuses on businessesemanating from India's competitive strengths
Issuer Market Value % to Net AssetsRs. in Lacs
Software 2815.72 31.57Infosys Technologies Ltd. 598.77 6.71Tata Consultancy Services Ltd. 432.05 4.84Subex Systems Ltd. 429.23 4.81Geometric Software Solutions Co. Ltd. 409.67 4.59I-Flex Solutions Ltd. 365.26 4.09Flextronics Software Systems Ltd. 315.09 3.53Mastek Ltd. 189.15 2.12Datamatics Technologies Ltd. 76.49 0.86
Industrial Capital Goods 1290.60 14.47Thermax Ltd. 380.49 4.27Crompton Greaves Ltd. 321.60 3.61ABB Ltd. 218.26 2.45Siemens Ltd. 194.67 2.18Bharat Electronics Ltd. 175.59 1.97
Hardware 1064.89 11.94HCL Infosystems Ltd. 436.90 4.90CMC Ltd. 358.80 4.02Tata Elxsi Ltd. 269.19 3.02
Pharmaceuticals 1043.88 11.70Cipla Ltd. 313.60 3.52Torrent Pharmaceuticals Ltd. 297.39 3.33Aventis Pharma Ltd. 257.61 2.89IPCA Laboratories Ltd. 175.29 1.97
Industrial Products 676.87 7.59Bharat Forge Ltd. 379.00 4.25Essel Propack Ltd. 295.25 3.31Bharat Forge - Warrants 2.63 0.03
Pesticides 607.47 6.81United Phosphorous Ltd. 607.47 6.81
Auto Ancillaries 531.98 5.96Sundaram Fasteners Ltd. 531.98 5.96
Consumer Non Durables 393.74 4.41Macmillan India Ltd. 393.74 4.41
Textiles-Silk 132.27 1.48Himatsingka Seide Ltd. 132.27 1.48
Textiles 14.07 0.16Gokaldas Exports Ltd. 14.07 0.16
Cash & Current Assets 348.40 3.91
Net Assets 8919.91 100.00
Issuer Wise Portfolio as of 30-June-2005
Fund Manager's Speak - Birla India Opportunities Fund (BIOF)
Deven Sangoi
! Bullish on prospects of IT outsourcing companies.
! Select pharma exposures expected to do well.
! Boom in capital expenditure across sectors expected to benefit engineering stocks in portfolio.
@ for methodology please refer page 24
@ICRA Online Awards 2005 : Ranked MFR1 in 'Open Ended Sectoral
Schemes - Technology' (3 year)
(Past performance is no guarantee of future results.)
8
Q U A R T E R L YQ U A R T E R L Y
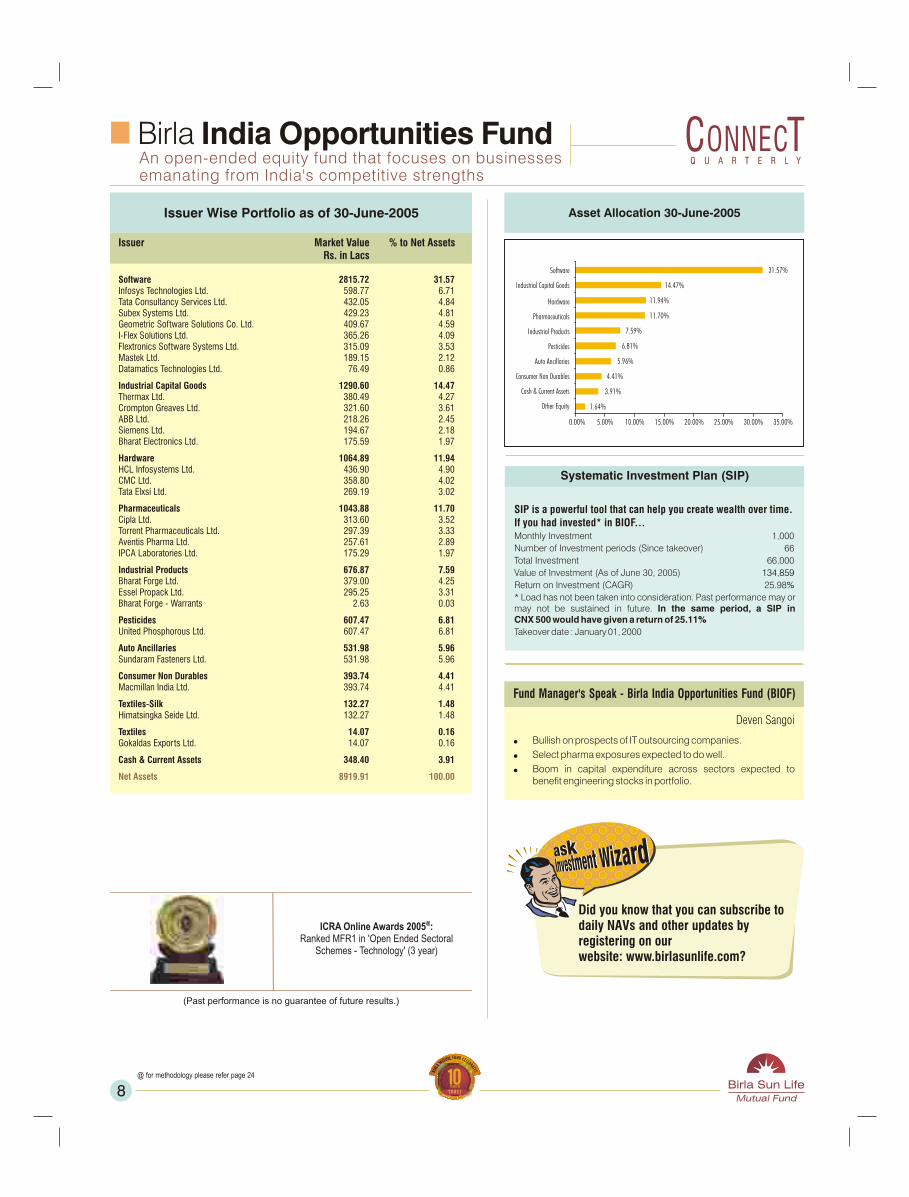
Asset Allocation 30-June-2005
0.00% 5.00% 10.00% 15.00% 20.00% 25.00% 35.00%
1.64%
3.91%
4.41%
5.96%
6.81%
7.59%
11.70%
11.94%
14.47%
31.57%
Other Equity
Cash & Current Assets
Consumer Non Durables
Auto Ancillaries
Pesticides
Industrial Products
Pharmaceuticals
Hardware
Industrial Capital Goods
Software
30.00%
Did you know that you can subscribe todaily NAVs and other updates by registering on our website: www.birlasunlife.com?
Systematic Investment Plan (SIP)
SIP is a powerful tool that can help you create wealth over time.
If you had invested* in BIF...
Monthly Investment
Number of Investment periods (Since Inception)
Total Investment 33,000
Value of Investment (As of June 30, 2005)
Return on Investment (CAGR) 34.56
* Load has not been taken into consideration. Past performance may or may not be sustained in future. In the same period, a SIP in S & P Nifty would have given a return of 34.09
Inception date : October 02, 2002
1,000
33
48,327
%
%
Birla Index FundAn open-ended index fund tracking the Nifty
Issuer Market Value % to Net AssetsRs. in Lacs
Software 60.64 13.06Tata Consultancy Services Ltd. 19.48 4.19Infosys Technologies Ltd. 16.91 3.64Wipro Ltd. 16.08 3.46Satyam Computer Services Ltd. 4.85 1.04HCL Technologies Ltd. 3.33 0.72
Oil 44.02 9.48Oil and Natural Gas Corporation Ltd. 44.02 9.48
Petroleum Products 33.44 7.20Reliance Industries Ltd. 26.99 5.81Bharat Petroleum Corporation Ltd. 3.31 0.71Hindustan Petroleum Corporation Ltd. 3.14 0.68
Banks 29.69 6.39State Bank of India 10.80 2.33ICICI Bank Ltd. 9.39 2.02HDFC Bank Ltd. 5.20 1.12Punjab National Bank 2.87 0.62Oriental Bank Of Commerce 1.43 0.31
Consumer Non Durables 26.37 5.68I T C Ltd. 12.37 2.66Hindustan Lever Ltd 10.85 2.34Dabur India Ltd. 1.12 0.24Tata Tea Ltd. 1.03 0.22Colgate Palmolive (I) Ltd. 1.00 0.22
Auto 18.31 3.94Tata Motors Ltd. 4.57 0.98Bajaj Auto Ltd. 4.26 0.92Maruti Udyog Ltd. 4.02 0.87Hero Honda Motors Ltd. 3.50 0.75Mahindra & Mahindra Ltd. 1.96 0.42
Telecom-Services 17.82 3.84Bharti Tele-Ventures Ltd. 13.52 2.91Mahanagar Telephone Nigam Ltd. 2.19 0.47Videsh Sanchar Nigam Ltd. 2.12 0.46
Pharmaceuticals 15.82 3.41Ranbaxy Laboratories Ltd. 5.94 1.28Sun Pharmaceutical Industries Ltd. 3.26 0.70Cipla Ltd. 2.82 0.61GlaxoSmithKline Pharmaceuticals Ltd. 2.09 0.45Dr. Reddys Laboratories Ltd. 1.70 0.37
Industrial Capital Goods 12.63 2.72Bharat Heavy Electricals Ltd. 6.38 1.37Larsen & Toubro Ltd. 4.48 0.97ABB Ltd. 1.77 0.38
Ferrous Metals 11.63 2.51Steel Authority of India Ltd. 5.97 1.29Tata Iron and Steel Co. Ltd 5.66 1.22
Cement 7.32 1.58Grasim Industries Ltd. 2.95 0.63Gujarat Ambuja Cements Ltd. 2.36 0.51The Associated Cement Companies Ltd. 2.02 0.43
Finance 6.59 1.42Housing Development Finance Corp. Ltd. 6.59 1.42
Non-Ferrous Metals 6.00 1.29Hindalco Industries Ltd. 3.30 0.71National Aluminium Company Ltd. 2.71 0.58
Gas 5.77 1.24Gas Authority of India Ltd. 5.77 1.24
Power 5.74 1.24Reliance Energy Ltd. 3.52 0.76Tata Power Co. Ltd. 2.22 0.48
Media & Entertainment 1.93 0.42Zee Telefilms Ltd. 1.93 0.42
Chemicals 1.28 0.27Indian Petrochemicals Corporation Ltd. 1.28 0.27
Transportation 1.20 0.26Shipping Corporation of India Ltd. 1.20 0.26Fertilisers 1.07 0.23Tata Chemicals Ltd. 1.07 0.23
Cash & Current Assets 156.99 33.81
Net Assets 464.27 100.00
Issuer Wise Portfolio as of 30-June-2005
Fund Manager's Speak - Birla Index Fund (BIF)
Navneet Munot
! Fund performance for the month was 7.67% as against Nifty's return of 7.15%.
! Outlook for Equity market continues to remain positive considering strong domestic economy and corporate fundamentals.
9
Q U A R T E R L YQ U A R T E R L Y
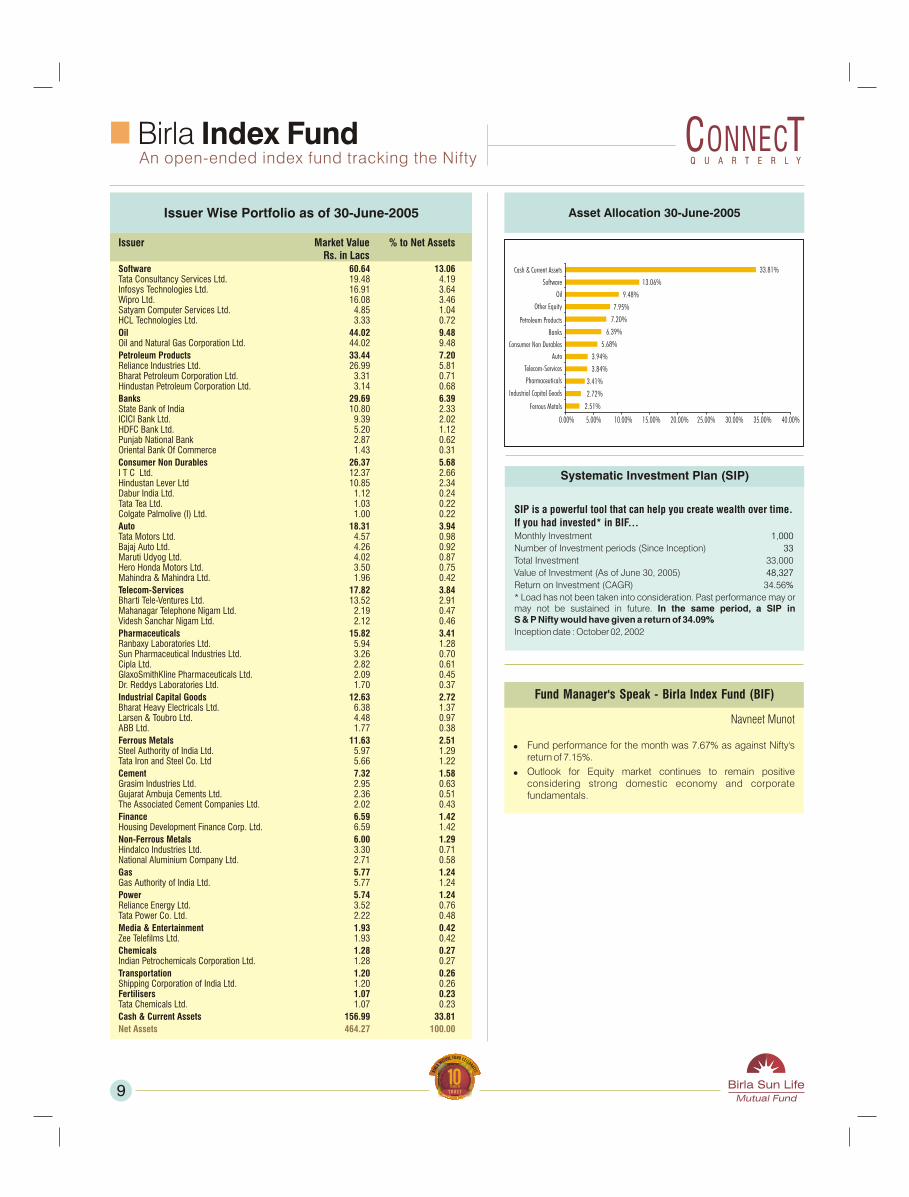
Asset Allocation 30-June-2005
0.00% 5.00% 10.00% 15.00% 20.00% 25.00% 30.00% 35.00% 40.00%
2.51%
2.72%
3.41%
3.84%
3.94%
5.68%
6.39%
7.20%
7.95%
9.48%
13.06%
33.81%
Ferrous Metals
Industrial Capital Goods
Pharmaceuticals
Telecom-Services
Auto
Consumer Non Durables
Banks
Petroleum Products
Other Equity
Oil
Software
Cash & Current Assets
Systematic Investment Plan (SIP)
SIP is a powerful tool that can help you create wealth over time.
If you had invested* in BEP...
Monthly Investment 1,000
Number of Investment periods (Since Inception) 76
Total Investment 76,000
Value of Investment (As of June 30, 2005)
Return on Investment (CAGR) 35
* Load has not been taken into consideration. Past performance may or may not be sustained in future. In the same period, a SIP in BSE Sensex would have given a return of 17.65
**Dividend reinvestment NAVs have been considered for the analyses.
Inception date : March 01,1999
229,497
%
%
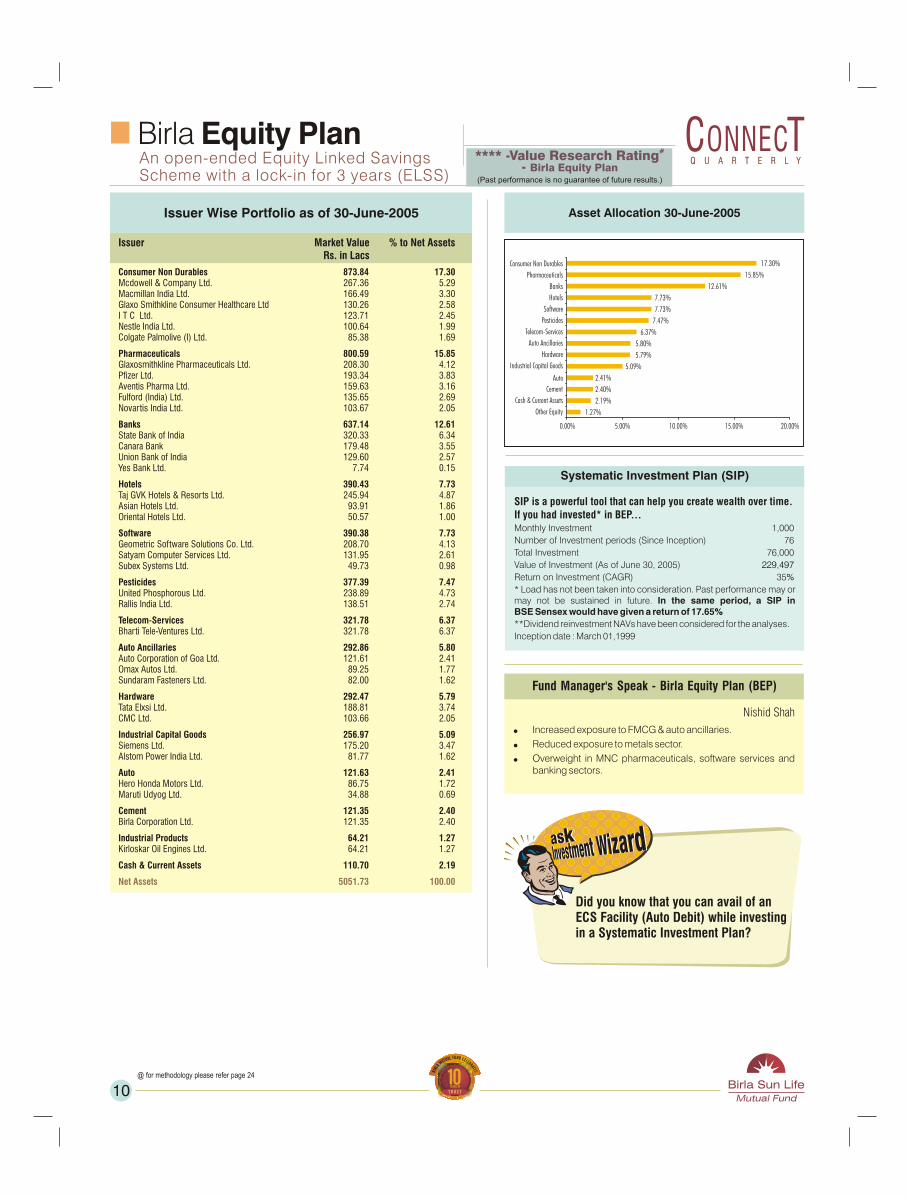
Birla Equity PlanAn open-ended Equity Linked Savings Scheme with a lock-in for 3 years (ELSS)
Issuer Market Value % to Net AssetsRs. in Lacs
Consumer Non Durables 873.84 17.30Mcdowell & Company Ltd. 267.36 5.29Macmillan India Ltd. 166.49 3.30Glaxo Smithkline Consumer Healthcare Ltd 130.26 2.58I T C Ltd. 123.71 2.45Nestle India Ltd. 100.64 1.99Colgate Palmolive (I) Ltd. 85.38 1.69
Pharmaceuticals 800.59 15.85Glaxosmithkline Pharmaceuticals Ltd. 208.30 4.12Pfizer Ltd. 193.34 3.83Aventis Pharma Ltd. 159.63 3.16Fulford (India) Ltd. 135.65 2.69Novartis India Ltd. 103.67 2.05
Banks 637.14 12.61State Bank of India 320.33 6.34Canara Bank 179.48 3.55Union Bank of India 129.60 2.57Yes Bank Ltd. 7.74 0.15
Hotels 390.43 7.73Taj GVK Hotels & Resorts Ltd. 245.94 4.87Asian Hotels Ltd. 93.91 1.86Oriental Hotels Ltd. 50.57 1.00
Software 390.38 7.73Geometric Software Solutions Co. Ltd. 208.70 4.13Satyam Computer Services Ltd. 131.95 2.61Subex Systems Ltd. 49.73 0.98
Pesticides 377.39 7.47United Phosphorous Ltd. 238.89 4.73Rallis India Ltd. 138.51 2.74
Telecom-Services 321.78 6.37Bharti Tele-Ventures Ltd. 321.78 6.37
Auto Ancillaries 292.86 5.80Auto Corporation of Goa Ltd. 121.61 2.41Omax Autos Ltd. 89.25 1.77Sundaram Fasteners Ltd. 82.00 1.62
Hardware 292.47 5.79Tata Elxsi Ltd. 188.81 3.74CMC Ltd. 103.66 2.05
Industrial Capital Goods 256.97 5.09Siemens Ltd. 175.20 3.47Alstom Power India Ltd. 81.77 1.62
Auto 121.63 2.41Hero Honda Motors Ltd. 86.75 1.72Maruti Udyog Ltd. 34.88 0.69
Cement 121.35 2.40Birla Corporation Ltd. 121.35 2.40
Industrial Products 64.21 1.27Kirloskar Oil Engines Ltd. 64.21 1.27
Cash & Current Assets 110.70 2.19
Net Assets 5051.73 100.00
Issuer Wise Portfolio as of 30-June-2005
Fund Manager's Speak - Birla Equity Plan (BEP)
Nishid Shah
! Increased exposure to FMCG & auto ancillaries.
! Reduced exposure to metals sector.
! Overweight in MNC pharmaceuticals, software services and banking sectors.
10
Systematic Investment Plan (SIP)
SIP is a powerful tool that can help you create wealth over time.
If you had invested* in BEP...
Monthly Investment 1,000
Number of Investment periods (Since Inception) 76
Total Investment 76,000
Value of Investment (As of June 30, 2005)
Return on Investment (CAGR) 35
* Load has not been taken into consideration. Past performance may or may not be sustained in future. In the same period, a SIP in BSE Sensex would have given a return of 17.65
**Dividend reinvestment NAVs have been considered for the analyses.
Inception date : March 01,1999
229,497
%
%
Birla Equity PlanAn open-ended Equity Linked Savings Scheme with a lock-in for 3 years (ELSS)
Issuer Market Value % to Net AssetsRs. in Lacs
Consumer Non Durables 873.84 17.30Mcdowell & Company Ltd. 267.36 5.29Macmillan India Ltd. 166.49 3.30Glaxo Smithkline Consumer Healthcare Ltd 130.26 2.58I T C Ltd. 123.71 2.45Nestle India Ltd. 100.64 1.99Colgate Palmolive (I) Ltd. 85.38 1.69
Pharmaceuticals 800.59 15.85Glaxosmithkline Pharmaceuticals Ltd. 208.30 4.12Pfizer Ltd. 193.34 3.83Aventis Pharma Ltd. 159.63 3.16Fulford (India) Ltd. 135.65 2.69Novartis India Ltd. 103.67 2.05
Banks 637.14 12.61State Bank of India 320.33 6.34Canara Bank 179.48 3.55Union Bank of India 129.60 2.57Yes Bank Ltd. 7.74 0.15
Hotels 390.43 7.73Taj GVK Hotels & Resorts Ltd. 245.94 4.87Asian Hotels Ltd. 93.91 1.86Oriental Hotels Ltd. 50.57 1.00
Software 390.38 7.73Geometric Software Solutions Co. Ltd. 208.70 4.13Satyam Computer Services Ltd. 131.95 2.61Subex Systems Ltd. 49.73 0.98
Pesticides 377.39 7.47United Phosphorous Ltd. 238.89 4.73Rallis India Ltd. 138.51 2.74
Telecom-Services 321.78 6.37Bharti Tele-Ventures Ltd. 321.78 6.37
Auto Ancillaries 292.86 5.80Auto Corporation of Goa Ltd. 121.61 2.41Omax Autos Ltd. 89.25 1.77Sundaram Fasteners Ltd. 82.00 1.62
Hardware 292.47 5.79Tata Elxsi Ltd. 188.81 3.74CMC Ltd. 103.66 2.05
Industrial Capital Goods 256.97 5.09Siemens Ltd. 175.20 3.47Alstom Power India Ltd. 81.77 1.62
Auto 121.63 2.41Hero Honda Motors Ltd. 86.75 1.72Maruti Udyog Ltd. 34.88 0.69
Cement 121.35 2.40Birla Corporation Ltd. 121.35 2.40
Industrial Products 64.21 1.27Kirloskar Oil Engines Ltd. 64.21 1.27
Cash & Current Assets 110.70 2.19
Net Assets 5051.73 100.00
Issuer Wise Portfolio as of 30-June-2005
Fund Manager's Speak - Birla Equity Plan (BEP)
Nishid Shah
! Increased exposure to FMCG & auto ancillaries.
! Reduced exposure to metals sector.
! Overweight in MNC pharmaceuticals, software services and banking sectors.
10
#**** -Value Research Rating- Birla Equity Plan
(Past performance is no guarantee of future results.)
@ for methodology please refer page 24
Q U A R T E R L YQ U A R T E R L Y
Asset Allocation 30-June-2005
0.00% 5.00% 10.00% 15.00% 20.00%
1.27%
2.19%
2.40%
2.41%
5.09%
5.79%
5.80%
6.37%
7.47%
7.73%
7.73%
12.61%
15.85%
17.30%
Other Equity
Cash & Current Assets
Cement
Auto
Industrial Capital Goods
Hardware
Auto Ancillaries
Telecom-Services
Pesticides
Software
Hotels
Banks
Pharmaceuticals
Consumer Non Durables
Did you know that you can avail of an ECS Facility (Auto Debit) while investing in a Systematic Investment Plan?
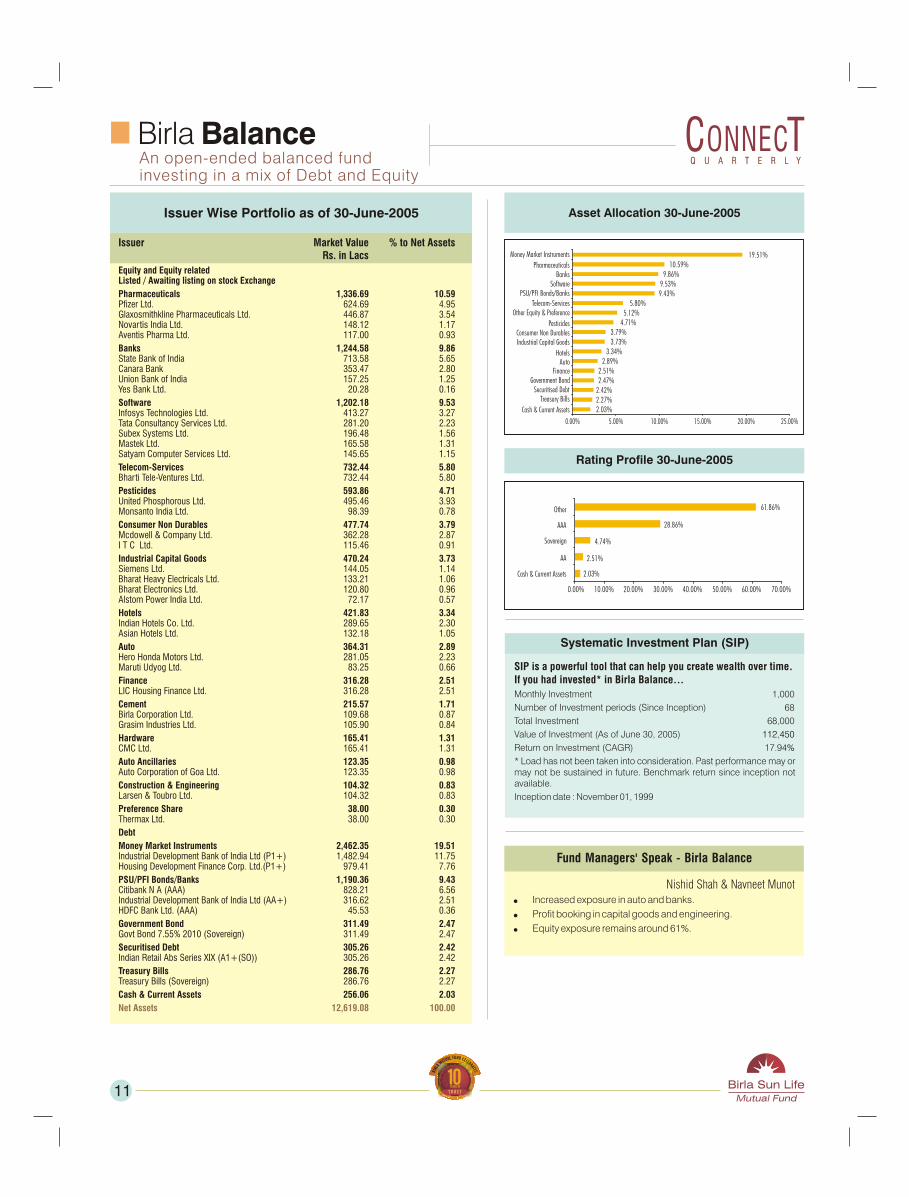
Birla BalanceAn open-ended balanced fund investing in a mix of Debt and Equity
Issuer Market Value % to Net AssetsRs. in Lacs
Equity and Equity relatedListed / Awaiting listing on stock Exchange
Pharmaceuticals 1,336.69 10.59Pfizer Ltd. 624.69 4.95Glaxosmithkline Pharmaceuticals Ltd. 446.87 3.54Novartis India Ltd. 148.12 1.17Aventis Pharma Ltd. 117.00 0.93
Banks 1,244.58 9.86State Bank of India 713.58 5.65Canara Bank 353.47 2.80Union Bank of India 157.25 1.25Yes Bank Ltd. 20.28 0.16
Software 1,202.18 9.53Infosys Technologies Ltd. 413.27 3.27Tata Consultancy Services Ltd. 281.20 2.23Subex Systems Ltd. 196.48 1.56Mastek Ltd. 165.58 1.31Satyam Computer Services Ltd. 145.65 1.15
Telecom-Services 732.44 5.80Bharti Tele-Ventures Ltd. 732.44 5.80
Pesticides 593.86 4.71United Phosphorous Ltd. 495.46 3.93Monsanto India Ltd. 98.39 0.78
Consumer Non Durables 477.74 3.79Mcdowell & Company Ltd. 362.28 2.87I T C Ltd. 115.46 0.91
Industrial Capital Goods 470.24 3.73Siemens Ltd. 144.05 1.14Bharat Heavy Electricals Ltd. 133.21 1.06Bharat Electronics Ltd. 120.80 0.96Alstom Power India Ltd. 72.17 0.57
Hotels 421.83 3.34Indian Hotels Co. Ltd. 289.65 2.30Asian Hotels Ltd. 132.18 1.05
Auto 364.31 2.89Hero Honda Motors Ltd. 281.05 2.23Maruti Udyog Ltd. 83.25 0.66
Finance 316.28 2.51LIC Housing Finance Ltd. 316.28 2.51
Cement 215.57 1.71Birla Corporation Ltd. 109.68 0.87Grasim Industries Ltd. 105.90 0.84
Hardware 165.41 1.31CMC Ltd. 165.41 1.31
Auto Ancillaries 123.35 0.98Auto Corporation of Goa Ltd. 123.35 0.98
Construction & Engineering 104.32 0.83Larsen & Toubro Ltd. 104.32 0.83
Preference Share 38.00 0.30Thermax Ltd. 38.00 0.30
Debt
Money Market Instruments 2,462.35 19.51Industrial Development Bank of India Ltd (P1+) 1,482.94 11.75Housing Development Finance Corp. Ltd.(P1+) 979.41 7.76
PSU/PFI Bonds/Banks 1,190.36 9.43Citibank N A (AAA) 828.21 6.56Industrial Development Bank of India Ltd (AA+) 316.62 2.51HDFC Bank Ltd. (AAA) 45.53 0.36
Government Bond 311.49 2.47Govt Bond 7.55% 2010 (Sovereign) 311.49 2.47
Securitised Debt 305.26 2.42Indian Retail Abs Series XIX (A1+(SO)) 305.26 2.42
Treasury Bills 286.76 2.27Treasury Bills (Sovereign) 286.76 2.27
Cash & Current Assets 256.06 2.03
Net Assets 12,619.08 100.00
Issuer Wise Portfolio as of 30-June-2005
Systematic Investment Plan (SIP)
SIP is a powerful tool that can help you create wealth over time.
If you had invested* in Birla Balance...
Monthly Investment 1,000
Number of Investment periods (Since Inception) 68
Total Investment 68,000
Value of Investment (As of June 30, 2005)
Return on Investment (CAGR) 17.94
* Load has not been taken into consideration. Past performance may or may not be sustained in future. Benchmark return since inception not available.
Inception date : November 01, 1999
112,450
%
Fund Managers' Speak - Birla Balance
Nishid Shah & Navneet Munot! Increased exposure in auto and banks.
! Profit booking in capital goods and engineering.
! Equity exposure remains around 61%.
11
Q U A R T E R L YQ U A R T E R L Y
Asset Allocation 30-June-2005
Rating Profile 30-June-2005
0.00% 5.00% 10.00% 15.00% 20.00% 25.00%
2.03%2.27%2.42%2.47%2.51%
2.89%3.34%
3.73%3.79%
4.71%5.12%
5.80%9.43%9.53%
9.86%10.59%
19.51%
Cash & Current Assets
Treasury BillsSecuritised Debt
Government BondFinance
AutoHotels
Industrial Capital GoodsConsumer Non Durables
Pesticides
Other Equity & PreferenceTelecom-Services
PSU/PFI Bonds/BanksSoftware
BanksPharmaceuticals
Money Market Instruments
2.03%
2.51%
4.74%
28.86%
61.86%
0.00% 10.00% 20.00% 30.00% 40.00% 50.00% 60.00% 70.00%
Cash & Current Assets
AA
Sovereign
AAA
Other
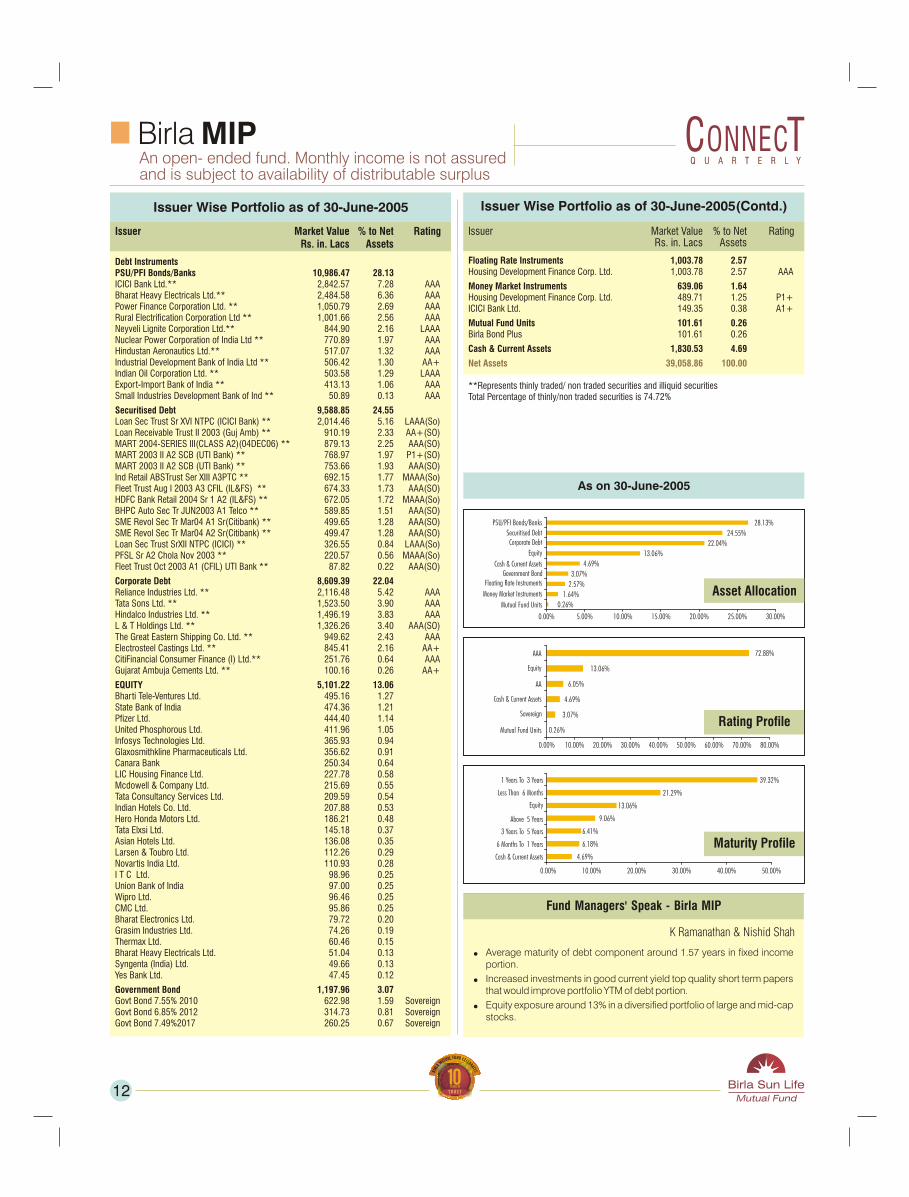
Birla MIPAn open- ended fund. Monthly income is not assured and is subject to availability of distributable surplus
Issuer Wise Portfolio as of 30-June-2005
Issuer Market Value % to Net RatingRs. in. Lacs Assets
Debt InstrumentsPSU/PFI Bonds/Banks 10,986.47 28.13ICICI Bank Ltd.** 2,842.57 7.28 AAABharat Heavy Electricals Ltd.** 2,484.58 6.36 AAAPower Finance Corporation Ltd. ** 1,050.79 2.69 AAARural Electrification Corporation Ltd ** 1,001.66 2.56 AAANeyveli Lignite Corporation Ltd.** 844.90 2.16 LAAANuclear Power Corporation of India Ltd ** 770.89 1.97 AAAHindustan Aeronautics Ltd.** 517.07 1.32 AAAIndustrial Development Bank of India Ltd ** 506.42 1.30 AA+Indian Oil Corporation Ltd. ** 503.58 1.29 LAAAExport-Import Bank of India ** 413.13 1.06 AAASmall Industries Development Bank of Ind ** 50.89 0.13 AAA
Securitised Debt 9,588.85 24.55Loan Sec Trust Sr XVI NTPC (ICICI Bank) ** 2,014.46 5.16 LAAA(So)Loan Receivable Trust II 2003 (Guj Amb) ** 910.19 2.33 AA+(SO)MART 2004-SERIES III(CLASS A2)(04DEC06) ** 879.13 2.25 AAA(SO)MART 2003 II A2 SCB (UTI Bank) ** 768.97 1.97 P1+(SO)MART 2003 II A2 SCB (UTI Bank) ** 753.66 1.93 AAA(SO)Ind Retail ABSTrust Ser XIII A3PTC ** 692.15 1.77 MAAA(So)Fleet Trust Aug I 2003 A3 CFIL (IL&FS) ** 674.33 1.73 AAA(SO)HDFC Bank Retail 2004 Sr 1 A2 (IL&FS) ** 672.05 1.72 MAAA(So)BHPC Auto Sec Tr JUN2003 A1 Telco ** 589.85 1.51 AAA(SO)SME Revol Sec Tr Mar04 A1 Sr(Citibank) ** 499.65 1.28 AAA(SO)SME Revol Sec Tr Mar04 A2 Sr(Citibank) ** 499.47 1.28 AAA(SO)Loan Sec Trust SrXII NTPC (ICICI) ** 326.55 0.84 LAAA(So)PFSL Sr A2 Chola Nov 2003 ** 220.57 0.56 MAAA(So)Fleet Trust Oct 2003 A1 (CFIL) UTI Bank ** 87.82 0.22 AAA(SO)
Corporate Debt 8,609.39 22.04Reliance Industries Ltd. ** 2,116.48 5.42 AAATata Sons Ltd. ** 1,523.50 3.90 AAAHindalco Industries Ltd. ** 1,496.19 3.83 AAAL & T Holdings Ltd. ** 1,326.26 3.40 AAA(SO)The Great Eastern Shipping Co. Ltd. ** 949.62 2.43 AAAElectrosteel Castings Ltd. ** 845.41 2.16 AA+CitiFinancial Consumer Finance (I) Ltd.** 251.76 0.64 AAAGujarat Ambuja Cements Ltd. ** 100.16 0.26 AA+
EQUITY 5,101.22 13.06Bharti Tele-Ventures Ltd. 495.16 1.27 State Bank of India 474.36 1.21 Pfizer Ltd. 444.40 1.14 United Phosphorous Ltd. 411.96 1.05 Infosys Technologies Ltd. 365.93 0.94 Glaxosmithkline Pharmaceuticals Ltd. 356.62 0.91 Canara Bank 250.34 0.64 LIC Housing Finance Ltd. 227.78 0.58 Mcdowell & Company Ltd. 215.69 0.55 Tata Consultancy Services Ltd. 209.59 0.54 Indian Hotels Co. Ltd. 207.88 0.53 Hero Honda Motors Ltd. 186.21 0.48 Tata Elxsi Ltd. 145.18 0.37 Asian Hotels Ltd. 136.08 0.35 Larsen & Toubro Ltd. 112.26 0.29 Novartis India Ltd. 110.93 0.28 I T C Ltd. 98.96 0.25 Union Bank of India 97.00 0.25 Wipro Ltd. 96.46 0.25 CMC Ltd. 95.86 0.25 Bharat Electronics Ltd. 79.72 0.20 Grasim Industries Ltd. 74.26 0.19 Thermax Ltd. 60.46 0.15 Bharat Heavy Electricals Ltd. 51.04 0.13 Syngenta (India) Ltd. 49.66 0.13 Yes Bank Ltd. 47.45 0.12
Government Bond 1,197.96 3.07Govt Bond 7.55% 2010 622.98 1.59 SovereignGovt Bond 6.85% 2012 314.73 0.81 SovereignGovt Bond 7.49%2017 260.25 0.67 Sovereign
Issuer Wise Portfolio as of 30-June-2005(Contd.)
Floating Rate Instruments 1,003.78 2.57Housing Development Finance Corp. Ltd. 1,003.78 2.57 AAA
Money Market Instruments 639.06 1.64Housing Development Finance Corp. Ltd. 489.71 1.25 P1+ICICI Bank Ltd. 149.35 0.38 A1+
Mutual Fund Units 101.61 0.26Birla Bond Plus 101.61 0.26
Cash & Current Assets 1,830.53 4.69
**Represents thinly traded/ non traded securities and illiquid securities Total Percentage of thinly/non traded securities is 74.72%
Net Assets 39,058.86 100.00
Issuer Market Value % to Net RatingRs. in. Lacs Assets
Fund Managers' Speak - Birla MIP
K Ramanathan & Nishid Shah
! Average maturity of debt component around 1.57 years in fixed income portion.
! Increased investments in good current yield top quality short term papers that would improve portfolio YTM of debt portion.
! Equity exposure around 13% in a diversified portfolio of large and mid-cap stocks.
12
Q U A R T E R L YQ U A R T E R L Y
As on 30-June-2005
Asset Allocation
Rating Profile
0.00% 5.00% 10.00% 15.00% 20.00% 25.00% 30.00%
0.00% 10.00% 20.00% 30.00% 40.00% 50.00% 60.00% 80.00%
Mutual Fund Units
Sovereign
Cash & Current Assets
AA
Equity
AAA
0.26%
1.64%
2.57%
3.07%
4.69%
13.06%
22.04%
24.55%
28.13%
Mutual Fund Units
Money Market Instruments
Floating Rate InstrumentsGovernment Bond
Cash & Current Assets
Equity
Corporate DebtSecuritised Debt
PSU/PFI Bonds/Banks
0.26%
3.07%
4.69%
6.05%
13.06%
72.88%
70.00%
Maturity Profile
0.00% 10.00% 20.00% 40.00% 50.00%
4.69%
6.18%
6.41%
9.06%
13.06%
21.29%
39.32%
Cash & Current Assets
6 Months To 1 Years
3 Years To 5 Years
Above 5 Years
Equity
Less Than 6 Months
1 Years To 3 Years
30.00%
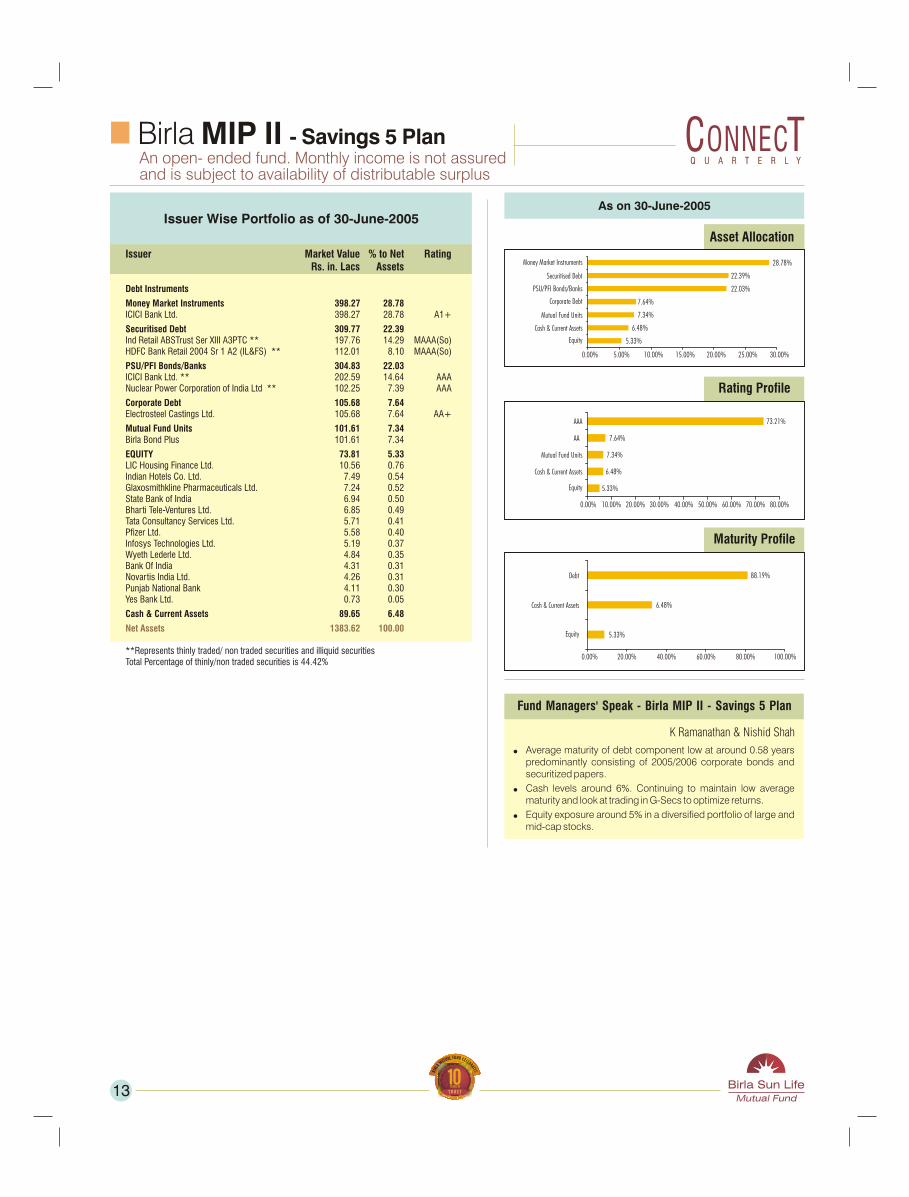
Birla MIP II - Savings 5 PlanAn open- ended fund. Monthly income is not assured and is subject to availability of distributable surplus
Fund Managers' Speak - Birla MIP II - Savings 5 Plan
K Ramanathan & Nishid Shah
! Average maturity of debt component low at around 0.58 years predominantly consisting of 2005/2006 corporate bonds and securitized papers.
! Cash levels around 6%. Continuing to maintain low average maturity and look at trading in G-Secs to optimize returns.
! Equity exposure around 5% in a diversified portfolio of large and mid-cap stocks.
Issuer Wise Portfolio as of 30-June-2005
Issuer Market Value % to Net RatingRs. in. Lacs Assets
Debt Instruments
Money Market Instruments 398.27 28.78ICICI Bank Ltd. 398.27 28.78 A1+
Securitised Debt 309.77 22.39Ind Retail ABSTrust Ser XIII A3PTC ** 197.76 14.29 MAAA(So)HDFC Bank Retail 2004 Sr 1 A2 (IL&FS) ** 112.01 8.10 MAAA(So)
PSU/PFI Bonds/Banks 304.83 22.03ICICI Bank Ltd. ** 202.59 14.64 AAANuclear Power Corporation of India Ltd ** 102.25 7.39 AAA
Corporate Debt 105.68 7.64Electrosteel Castings Ltd. 105.68 7.64 AA+
Mutual Fund Units 101.61 7.34Birla Bond Plus 101.61 7.34
EQUITY 73.81 5.33LIC Housing Finance Ltd. 10.56 0.76Indian Hotels Co. Ltd. 7.49 0.54Glaxosmithkline Pharmaceuticals Ltd. 7.24 0.52State Bank of India 6.94 0.50Bharti Tele-Ventures Ltd. 6.85 0.49Tata Consultancy Services Ltd. 5.71 0.41Pfizer Ltd. 5.58 0.40Infosys Technologies Ltd. 5.19 0.37Wyeth Lederle Ltd. 4.84 0.35Bank Of India 4.31 0.31Novartis India Ltd. 4.26 0.31Punjab National Bank 4.11 0.30Yes Bank Ltd. 0.73 0.05
Cash & Current Assets 89.65 6.48
**Represents thinly traded/ non traded securities and illiquid securities Total Percentage of thinly/non traded securities is 44.42%
Net Assets 1383.62 100.00
13
Q U A R T E R L YQ U A R T E R L Y
As on 30-June-2005
Asset Allocation
Maturity Profile
Asset Allocation
Rating Profile
0.00% 5.00% 10.00% 15.00% 20.00% 25.00% 30.00%
Equity
Mutual Fund Units
Cash & Current Assets
PSU/PFI Bonds/Banks
Securitised Debt
Money Market Instruments
0.00% 10.00% 20.00% 30.00% 40.00% 50.00% 60.00% 70.00% 80.00%
73.21%AAA
5.33%Equity
6.48%
Mutual Fund Units
7.64%
Cash & Current Assets
5.33%
6.48%
88.19%
0.00% 20.00% 40.00% 60.00% 80.00% 100.00%
Equity
Cash & Current Assets
5.33%
6.48%
7.34%
7.64%
22.03%
22.39%
28.78%
Corporate Debt
7.34%
AA
Debt
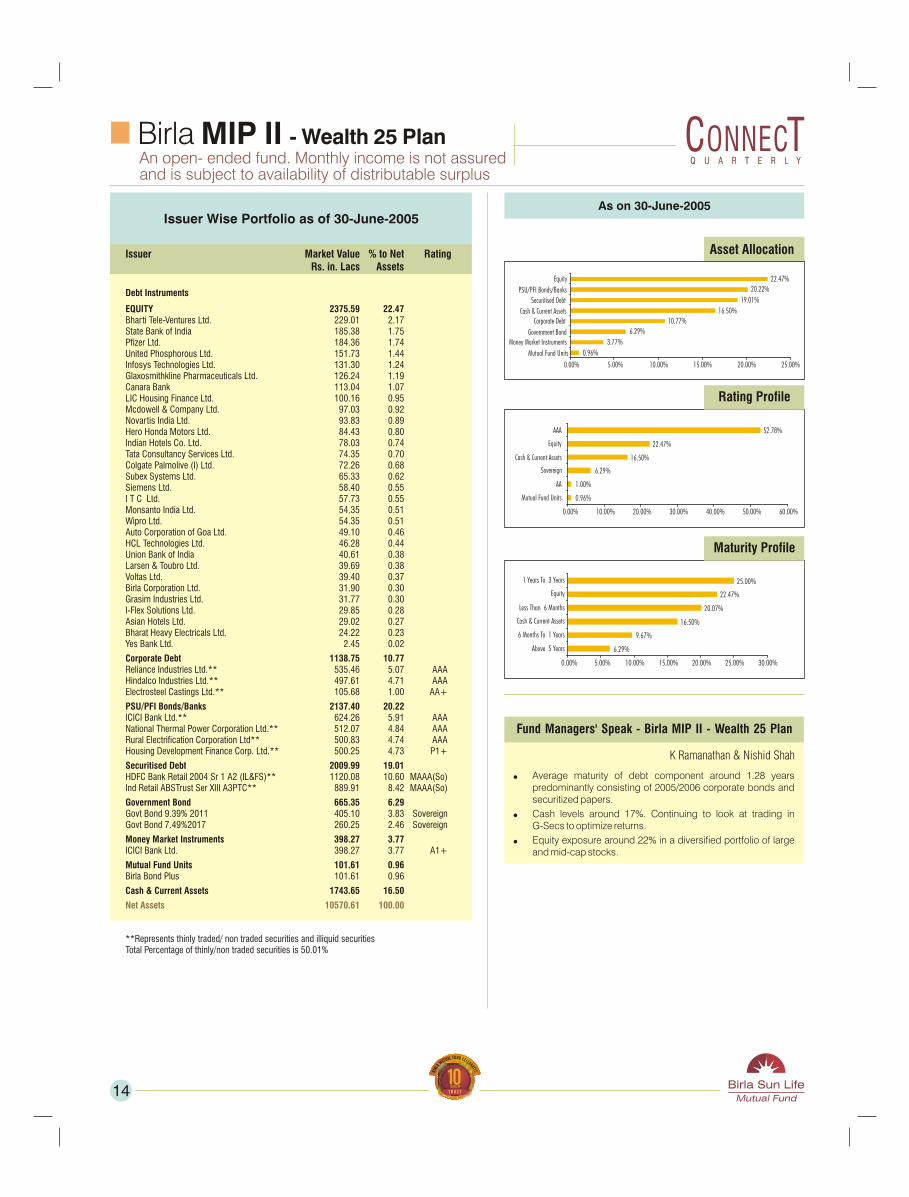
Birla MIP II - Wealth 25 PlanAn open- ended fund. Monthly income is not assured and is subject to availability of distributable surplus
Fund Managers' Speak - Birla MIP II - Wealth 25 Plan
K Ramanathan & Nishid Shah
! Average maturity of debt component around 1.28 years predominantly consisting of 2005/2006 corporate bonds and securitized papers.
! Cash levels around 17%. Continuing to look at trading in G-Secs to optimize returns.
! Equity exposure around 22% in a diversified portfolio of large and mid-cap stocks.
Issuer Wise Portfolio as of 30-June-2005
Issuer Market Value % to Net RatingRs. in. Lacs Assets
Debt Instruments
EQUITY 2375.59 22.47Bharti Tele-Ventures Ltd. 229.01 2.17 State Bank of India 185.38 1.75 Pfizer Ltd. 184.36 1.74 United Phosphorous Ltd. 151.73 1.44 Infosys Technologies Ltd. 131.30 1.24 Glaxosmithkline Pharmaceuticals Ltd. 126.24 1.19 Canara Bank 113.04 1.07 LIC Housing Finance Ltd. 100.16 0.95 Mcdowell & Company Ltd. 97.03 0.92 Novartis India Ltd. 93.83 0.89 Hero Honda Motors Ltd. 84.43 0.80 Indian Hotels Co. Ltd. 78.03 0.74 Tata Consultancy Services Ltd. 74.35 0.70 Colgate Palmolive (I) Ltd. 72.26 0.68 Subex Systems Ltd. 65.33 0.62 Siemens Ltd. 58.40 0.55 I T C Ltd. 57.73 0.55 Monsanto India Ltd. 54.35 0.51 Wipro Ltd. 54.35 0.51 Auto Corporation of Goa Ltd. 49.10 0.46 HCL Technologies Ltd. 46.28 0.44 Union Bank of India 40.61 0.38 Larsen & Toubro Ltd. 39.69 0.38 Voltas Ltd. 39.40 0.37 Birla Corporation Ltd. 31.90 0.30 Grasim Industries Ltd. 31.77 0.30 I-Flex Solutions Ltd. 29.85 0.28 Asian Hotels Ltd. 29.02 0.27 Bharat Heavy Electricals Ltd. 24.22 0.23 Yes Bank Ltd. 2.45 0.02
Corporate Debt 1138.75 10.77Reliance Industries Ltd.** 535.46 5.07 AAAHindalco Industries Ltd.** 497.61 4.71 AAAElectrosteel Castings Ltd.** 105.68 1.00 AA+
PSU/PFI Bonds/Banks 2137.40 20.22ICICI Bank Ltd.** 624.26 5.91 AAANational Thermal Power Corporation Ltd.** 512.07 4.84 AAARural Electrification Corporation Ltd** 500.83 4.74 AAAHousing Development Finance Corp. Ltd.** 500.25 4.73 P1+
Securitised Debt 2009.99 19.01HDFC Bank Retail 2004 Sr 1 A2 (IL&FS)** 1120.08 10.60 MAAA(So)Ind Retail ABSTrust Ser XIII A3PTC** 889.91 8.42 MAAA(So)
Government Bond 665.35 6.29Govt Bond 9.39% 2011 405.10 3.83 SovereignGovt Bond 7.49%2017 260.25 2.46 Sovereign
Money Market Instruments 398.27 3.77ICICI Bank Ltd. 398.27 3.77 A1+
Mutual Fund Units 101.61 0.96Birla Bond Plus 101.61 0.96
Cash & Current Assets 1743.65 16.50
**Represents thinly traded/ non traded securities and illiquid securities Total Percentage of thinly/non traded securities is 50.01%
Net Assets 10570.61 100.00
14
Q U A R T E R L YQ U A R T E R L Y
As on 30-June-2005
Asset Allocation
Maturity Profile
Asset Allocation
Rating Profile
0.96%
3.77%
6.29%
10.77%
16.50%
19.01%
20.22%
22.47%
0.00% 5.00% 10.00% 15.00% 20.00% 25.00%
Mutual Fund Units
Money Market InstrumentsGovernment Bond
Corporate DebtCash & Current Assets
Securitised Debt
PSU/PFI Bonds/Banks
Equity
0.96%
1.00%
6.29%
16.50%
22.47%
52.78%
0.00% 10.00% 20.00% 30.00% 40.00% 50.00% 60.00%
Mutual Fund Units
AA
Sovereign
Cash & Current Assets
Equity
AAA
6.29%
9.67%
16.50%
20.07%
22.47%
25.00%
0.00% 5.00% 10.00% 15.00% 20.00% 25.00% 30.00%
Above 5 Years
6 Months To 1 Years
Cash & Current Assets
Less Than 6 Months
Equity
1 Years To 3 Years
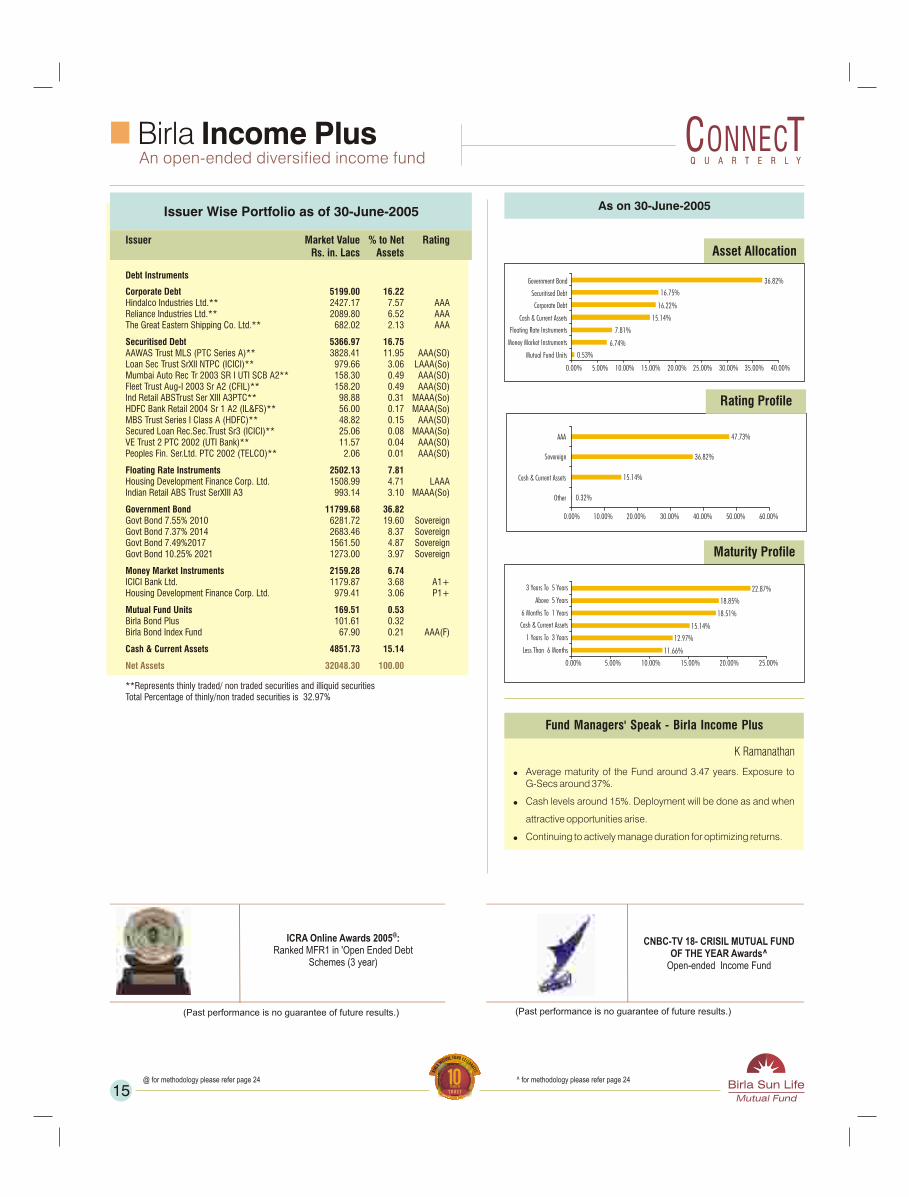
Birla Income PlusAn open-ended diversified income fund
Fund Managers' Speak - Birla Income Plus
K Ramanathan
! Average maturity of the Fund around 3.47 years. Exposure to G-Secs around 37%.
! Cash levels around 15%. Deployment will be done as and when
attractive opportunities arise.
! Continuing to actively manage duration for optimizing returns.
Issuer Wise Portfolio as of 30-June-2005
Issuer Market Value % to Net RatingRs. in. Lacs Assets
Debt Instruments
Corporate Debt 5199.00 16.22Hindalco Industries Ltd.** 2427.17 7.57 AAAReliance Industries Ltd.** 2089.80 6.52 AAAThe Great Eastern Shipping Co. Ltd.** 682.02 2.13 AAA
Securitised Debt 5366.97 16.75AAWAS Trust MLS (PTC Series A)** 3828.41 11.95 AAA(SO)Loan Sec Trust SrXII NTPC (ICICI)** 979.66 3.06 LAAA(So)Mumbai Auto Rec Tr 2003 SR I UTI SCB A2** 158.30 0.49 AAA(SO)Fleet Trust Aug-I 2003 Sr A2 (CFIL)** 158.20 0.49 AAA(SO)Ind Retail ABSTrust Ser XIII A3PTC** 98.88 0.31 MAAA(So)HDFC Bank Retail 2004 Sr 1 A2 (IL&FS)** 56.00 0.17 MAAA(So)MBS Trust Series I Class A (HDFC)** 48.82 0.15 AAA(SO)Secured Loan Rec.Sec.Trust Sr3 (ICICI)** 25.06 0.08 MAAA(So)VE Trust 2 PTC 2002 (UTI Bank)** 11.57 0.04 AAA(SO)Peoples Fin. Ser.Ltd. PTC 2002 (TELCO)** 2.06 0.01 AAA(SO)
Floating Rate Instruments 2502.13 7.81Housing Development Finance Corp. Ltd. 1508.99 4.71 LAAAIndian Retail ABS Trust SerXIII A3 993.14 3.10 MAAA(So)
Government Bond 11799.68 36.82Govt Bond 7.55% 2010 6281.72 19.60 SovereignGovt Bond 7.37% 2014 2683.46 8.37 SovereignGovt Bond 7.49%2017 1561.50 4.87 SovereignGovt Bond 10.25% 2021 1273.00 3.97 Sovereign
Money Market Instruments 2159.28 6.74ICICI Bank Ltd. 1179.87 3.68 A1+Housing Development Finance Corp. Ltd. 979.41 3.06 P1+
Mutual Fund Units 169.51 0.53Birla Bond Plus 101.61 0.32 Birla Bond Index Fund 67.90 0.21 AAA(F)
Cash & Current Assets 4851.73 15.14
**Represents thinly traded/ non traded securities and illiquid securitiesTotal Percentage of thinly/non traded securities is 32.97%
Net Assets 32048.30 100.00
15
@ICRA Online Awards 2005 : Ranked MFR1 in 'Open Ended Debt
Schemes (3 year)
(Past performance is no guarantee of future results.)
@ for methodology please refer page 24
CNBC-TV 18- CRISIL MUTUAL FUND OF THE YEAR Awards^
Open-ended Income Fund
(Past performance is no guarantee of future results.)
^ for methodology please refer page 24
Q U A R T E R L YQ U A R T E R L Y
As on 30-June-2005
Rating Profile
Maturity Profile
Asset Allocation
0.53%
6.74%
7.81%
15.14%
16.22%
16.75%
36.82%
0.00% 5.00% 10.00% 15.00% 20.00% 25.00% 30.00% 35.00% 40.00%
Mutual Fund Units
Money Market Instruments
Floating Rate Instruments
Cash & Current Assets
Corporate Debt
Securitised Debt
Government Bond
0.32%
15.14%
36.82%
47.73%
0.00% 10.00% 20.00% 30.00% 40.00% 50.00% 60.00%
Other
Cash & Current Assets
Sovereign
AAA
11.66%
12.97%
15.14%
18.51%
18.85%
22.87%
0.00% 5.00% 10.00% 15.00% 20.00% 25.00%
Less Than 6 Months
1 Years To 3 Years
Cash & Current Assets
6 Months To 1 Years
Above 5 Years
3 Years To 5 Years
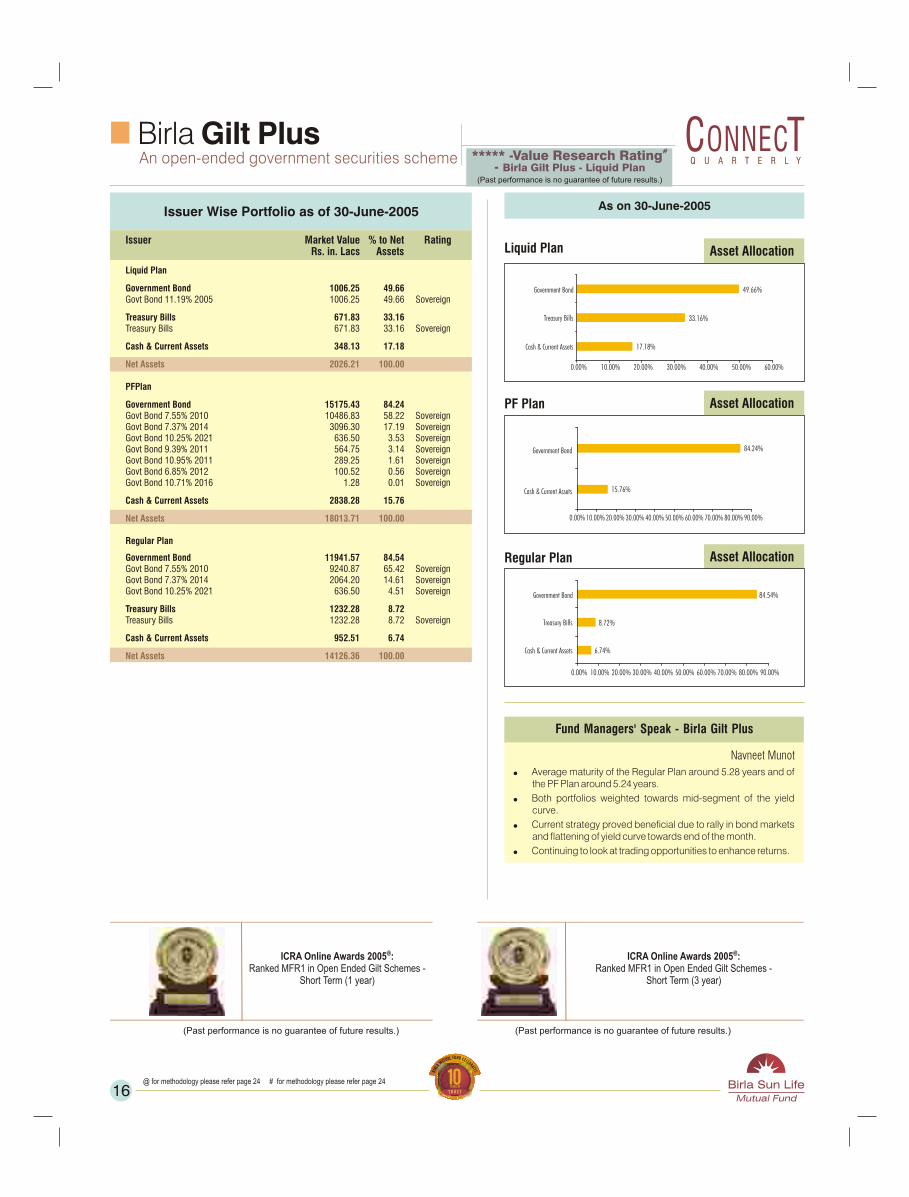
Birla Gilt Plus An open-ended government securities scheme
Fund Managers' Speak - Birla Gilt Plus
Navneet Munot
! Average maturity of the Regular Plan around 5.28 years and of the PF Plan around 5.24 years.
! Both portfolios weighted towards mid-segment of the yield curve.
! Current strategy proved beneficial due to rally in bond markets and flattening of yield curve towards end of the month.
! Continuing to look at trading opportunities to enhance returns.
Issuer Wise Portfolio as of 30-June-2005
Issuer Market Value % to Net RatingRs. in. Lacs Assets
Liquid Plan
Government Bond 1006.25 49.66Govt Bond 11.19% 2005 1006.25 49.66 Sovereign
Treasury Bills 671.83 33.16Treasury Bills 671.83 33.16 Sovereign
Cash & Current Assets 348.13 17.18
PFPlan
Government Bond 15175.43 84.24Govt Bond 7.55% 2010 10486.83 58.22 SovereignGovt Bond 7.37% 2014 3096.30 17.19 SovereignGovt Bond 10.25% 2021 636.50 3.53 SovereignGovt Bond 9.39% 2011 564.75 3.14 SovereignGovt Bond 10.95% 2011 289.25 1.61 SovereignGovt Bond 6.85% 2012 100.52 0.56 SovereignGovt Bond 10.71% 2016 1.28 0.01 Sovereign
Cash & Current Assets 2838.28 15.76
Regular Plan
Government Bond 11941.57 84.54Govt Bond 7.55% 2010 9240.87 65.42 SovereignGovt Bond 7.37% 2014 2064.20 14.61 SovereignGovt Bond 10.25% 2021 636.50 4.51 Sovereign
Treasury Bills 1232.28 8.72Treasury Bills 1232.28 8.72 Sovereign
Cash & Current Assets 952.51 6.74
Net Assets 2026.21 100.00
Net Assets 18013.71 100.00
Net Assets 14126.36 100.00
16
@ICRA Online Awards 2005 : Ranked MFR1 in Open Ended Gilt Schemes -
Short Term (1 year)
(Past performance is no guarantee of future results.)
@ICRA Online Awards 2005 : Ranked MFR1 in Open Ended Gilt Schemes -
Short Term (3 year)
(Past performance is no guarantee of future results.)
@ for methodology please refer page 24 # for methodology please refer page 24
#***** -Value Research Rating- Birla Gilt Plus - Liquid Plan
(Past performance is no guarantee of future results.)
Q U A R T E R L YQ U A R T E R L Y
As on 30-June-2005
Asset Allocation
Asset Allocation
Asset Allocation
Liquid Plan
PF Plan
Regular Plan
17.18%
33.16%
49.66%
0.00% 10.00% 20.00% 30.00% 40.00% 50.00% 60.00%
Cash & Current Assets
Treasury Bills
Government Bond
15.76%
84.24%
0.00% 10.00% 20.00% 30.00% 40.00% 50.00% 60.00% 70.00% 80.00% 90.00%
Cash & Current Assets
Government Bond
6.74%
8.72%
84.54%
0.00% 10.00% 20.00% 30.00% 40.00% 50.00% 60.00% 70.00% 80.00% 90.00%
Cash & Current Assets
Treasury Bills
Government Bond
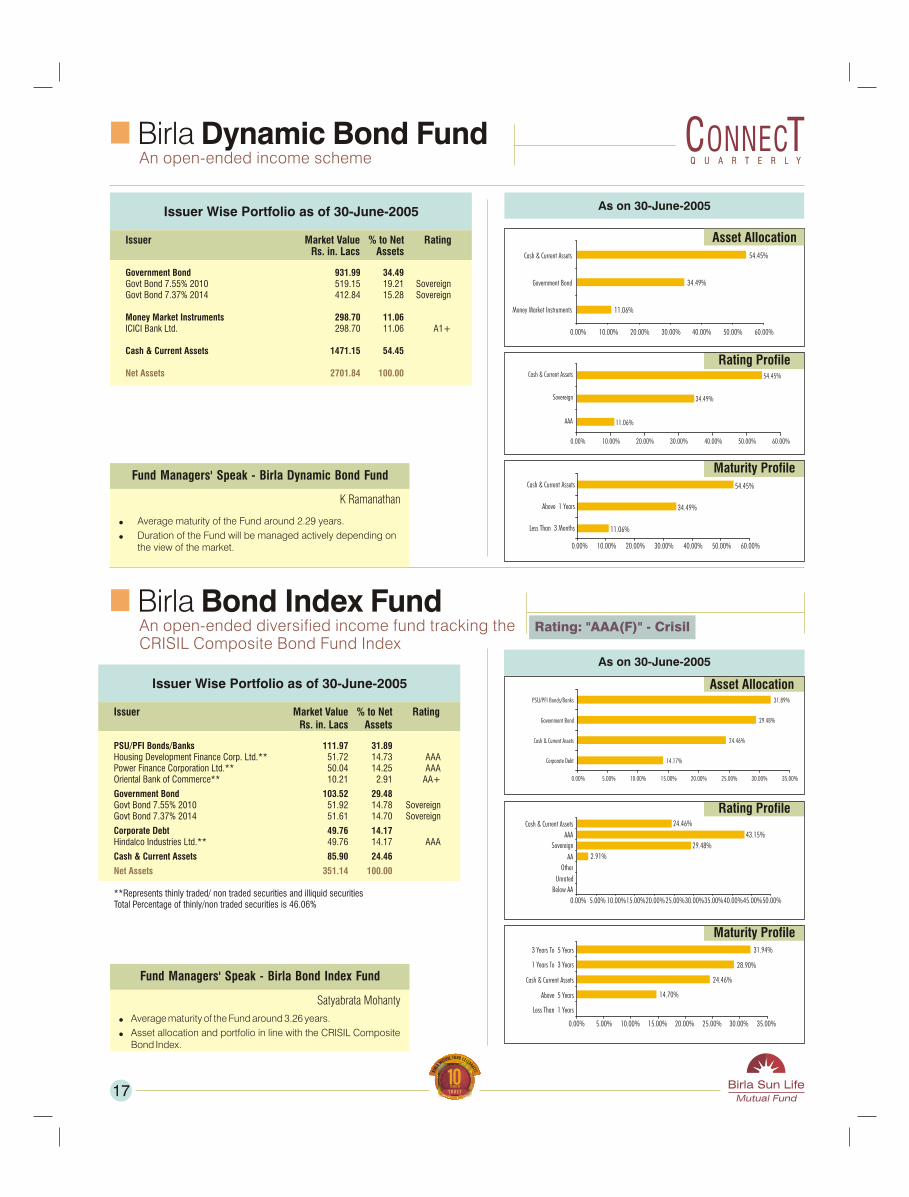
Birla Dynamic Bond FundAn open-ended income scheme
Issuer Wise Portfolio as of 30-June-2005
Issuer Market Value % to Net RatingRs. in. Lacs Assets
Government Bond 931.99 34.49Govt Bond 7.55% 2010 519.15 19.21 SovereignGovt Bond 7.37% 2014 412.84 15.28 Sovereign
Money Market Instruments 298.70 11.06ICICI Bank Ltd. 298.70 11.06 A1+
Cash & Current Assets 1471.15 54.45
Net Assets 2701.84 100.00
17
Fund Managers' Speak - Birla Dynamic Bond Fund
! Average maturity of the Fund around 2.29 years.
! Duration of the Fund will be managed actively depending on the view of the market.
K Ramanathan
Fund Managers' Speak - Birla Bond Index Fund
Satyabrata Mohanty
! Average maturity of the Fund around 3.26 years.
! Asset allocation and portfolio in line with the CRISIL Composite Bond Index.
Issuer Wise Portfolio as of 30-June-2005
Issuer Market Value % to Net RatingRs. in. Lacs Assets
PSU/PFI Bonds/Banks 111.97 31.89Housing Development Finance Corp. Ltd.** 51.72 14.73 AAAPower Finance Corporation Ltd.** 50.04 14.25 AAAOriental Bank of Commerce** 10.21 2.91 AA+
Government Bond 103.52 29.48Govt Bond 7.55% 2010 51.92 14.78 SovereignGovt Bond 7.37% 2014 51.61 14.70 Sovereign
Corporate Debt 49.76 14.17Hindalco Industries Ltd.** 49.76 14.17 AAA
Cash & Current Assets 85.90 24.46
**Represents thinly traded/ non traded securities and illiquid securities Total Percentage of thinly/non traded securities is 46.06%
Net Assets 351.14 100.00
Birla Bond Index FundAn open-ended diversified income fund tracking theCRISIL Composite Bond Fund Index
Rating: "AAA(F)" - Crisil
Q U A R T E R L YQ U A R T E R L Y
As on 30-June-2005
As on 30-June-2005
Asset Allocation
Maturity Profile
Rating Profile
Rating Profile
Maturity Profile
Asset Allocation
11.06%
34.49%
54.45%
0.00% 10.00% 20.00% 30.00% 40.00% 50.00% 60.00%
Money Market Instruments
Government Bond
Cash & Current Assets
11.06%
34.49%
54.45%
0.00% 10.00% 20.00% 30.00% 40.00% 50.00% 60.00%
AAA
Sovereign
Cash & Current Assets
11.06%
34.49%
54.45%
0.00% 10.00% 20.00% 30.00% 40.00% 50.00% 60.00%
Less Than 3 Months
Above 1 Years
Cash & Current Assets
14.17%
24.46%
29.48%
31.89%
0.00% 5.00% 10.00% 15.00% 20.00% 25.00% 30.00% 35.00%
Corporate Debt
Cash & Current Assets
Government Bond
PSU/PFI Bonds/Banks
2.91%
29.48%
43.15%
24.46%
0.00% 5.00% 10.00%15.00%20.00%25.00%30.00%35.00%40.00%45.00%50.00%
Below AA
Unrated
Other
AA
Sovereign
AAA
Cash & Current Assets
14.70%
24.46%
28.90%
31.94%
0.00% 5.00% 10.00% 15.00% 20.00% 25.00% 30.00% 35.00%
Less Than 1 Years
Above 5 Years
Cash & Current Assets
1 Years To 3 Years
3 Years To 5 Years
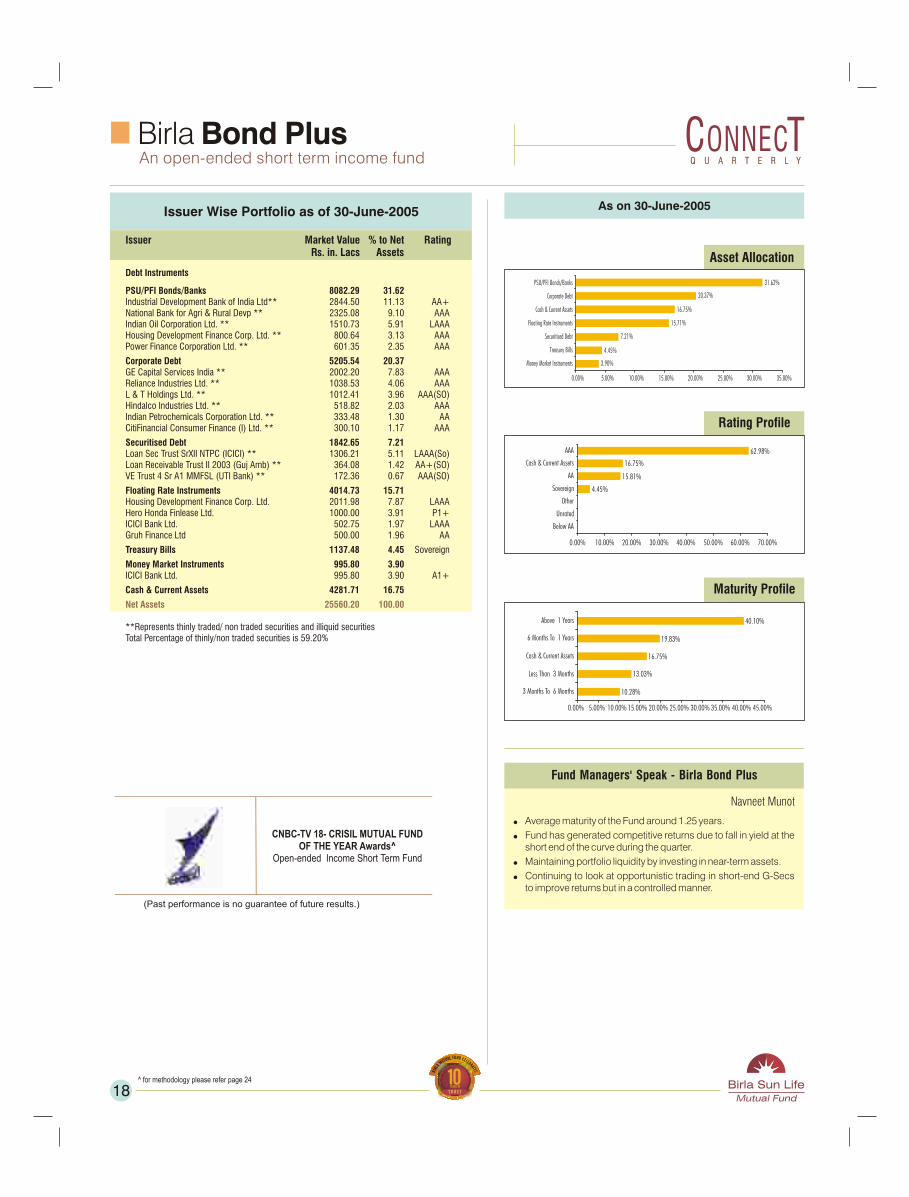
Birla Bond PlusAn open-ended short term income fund
Fund Managers' Speak - Birla Bond Plus
Navneet Munot
! Average maturity of the Fund around 1.25 years.
! Fund has generated competitive returns due to fall in yield at the short end of the curve during the quarter.
! Maintaining portfolio liquidity by investing in near-term assets.
! Continuing to look at opportunistic trading in short-end G-Secs to improve returns but in a controlled manner.
Issuer Wise Portfolio as of 30-June-2005
Issuer Market Value % to Net RatingRs. in. Lacs Assets
Debt Instruments
PSU/PFI Bonds/Banks 8082.29 31.62Industrial Development Bank of India Ltd** 2844.50 11.13 AA+National Bank for Agri & Rural Devp ** 2325.08 9.10 AAAIndian Oil Corporation Ltd. ** 1510.73 5.91 LAAAHousing Development Finance Corp. Ltd. ** 800.64 3.13 AAAPower Finance Corporation Ltd. ** 601.35 2.35 AAA
Corporate Debt 5205.54 20.37GE Capital Services India ** 2002.20 7.83 AAAReliance Industries Ltd. ** 1038.53 4.06 AAAL & T Holdings Ltd. ** 1012.41 3.96 AAA(SO)Hindalco Industries Ltd. ** 518.82 2.03 AAAIndian Petrochemicals Corporation Ltd. ** 333.48 1.30 AACitiFinancial Consumer Finance (I) Ltd. ** 300.10 1.17 AAA
Securitised Debt 1842.65 7.21Loan Sec Trust SrXII NTPC (ICICI) ** 1306.21 5.11 LAAA(So)Loan Receivable Trust II 2003 (Guj Amb) ** 364.08 1.42 AA+(SO)VE Trust 4 Sr A1 MMFSL (UTI Bank) ** 172.36 0.67 AAA(SO)
Floating Rate Instruments 4014.73 15.71Housing Development Finance Corp. Ltd. 2011.98 7.87 LAAAHero Honda Finlease Ltd. 1000.00 3.91 P1+ICICI Bank Ltd. 502.75 1.97 LAAAGruh Finance Ltd 500.00 1.96 AA
Treasury Bills 1137.48 4.45 Sovereign
Money Market Instruments 995.80 3.90ICICI Bank Ltd. 995.80 3.90 A1+
Cash & Current Assets 4281.71 16.75
**Represents thinly traded/ non traded securities and illiquid securities Total Percentage of thinly/non traded securities is 59.20%
Net Assets 25560.20 100.00
18^ for methodology please refer page 24
CNBC-TV 18- CRISIL MUTUAL FUND OF THE YEAR Awards^
Open-ended Income Short Term Fund
(Past performance is no guarantee of future results.)
Q U A R T E R L YQ U A R T E R L Y
As on 30-June-2005
Maturity Profile
Rating Profile
Asset Allocation
3.90%
4.45%
7.21%
15.71%
16.75%
20.37%
31.62%
0.00% 5.00% 10.00% 15.00% 20.00% 25.00% 30.00% 35.00%
Money Market Instruments
Treasury Bills
Securitised Debt
Floating Rate Instruments
Cash & Current Assets
Corporate Debt
PSU/PFI Bonds/Banks
4.45%
15.81%
16.75%
62.98%
0.00% 10.00% 20.00% 30.00% 40.00% 50.00% 60.00% 70.00%
Below AA
Unrated
Other
Sovereign
AA
Cash & Current Assets
AAA
10.28%
13.03%
16.75%
19.83%
40.10%
0.00% 5.00% 10.00% 15.00% 20.00% 25.00% 30.00% 35.00% 40.00% 45.00%
3 Months To 6 Months
Less Than 3 Months
Cash & Current Assets
6 Months To 1 Years
Above 1 Years
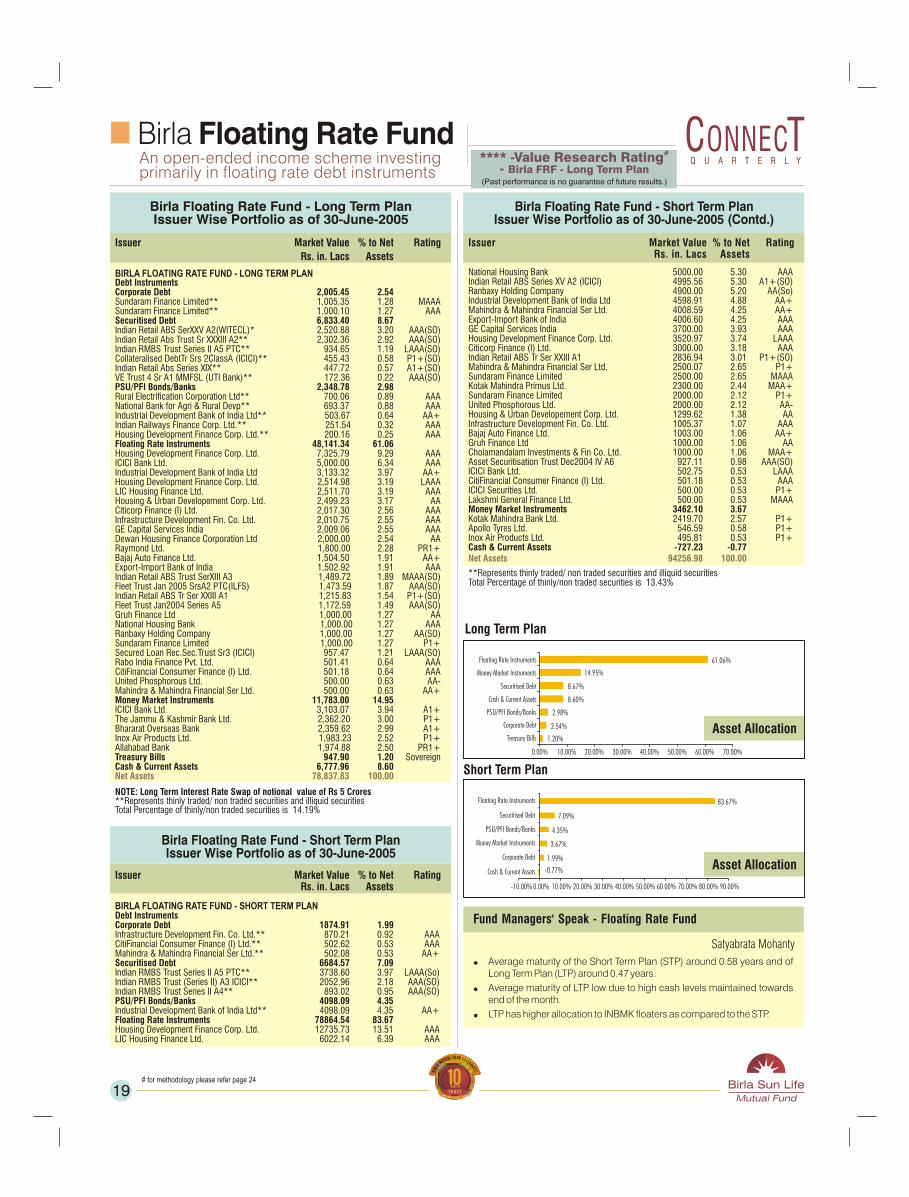
Fund Managers' Speak - Floating Rate Fund
Satyabrata Mohanty
! Average maturity of the Short Term Plan (STP) around 0.58 years and of Long Term Plan (LTP) around 0.47 years.
! Average maturity of LTP low due to high cash levels maintained towards end of the month.
! LTP has higher allocation to INBMK floaters as compared to the STP.
Birla Floating Rate Fund - Long Term PlanIssuer Wise Portfolio as of 30-June-2005
National Housing Bank 5000.00 5.30 AAAIndian Retail ABS Series XV A2 (ICICI) 4995.56 5.30 A1+(SO)Ranbaxy Holding Company 4900.00 5.20 AA(So)Industrial Development Bank of India Ltd 4598.91 4.88 AA+Mahindra & Mahindra Financial Ser Ltd. 4008.59 4.25 AA+Export-Import Bank of India 4006.60 4.25 AAAGE Capital Services India 3700.00 3.93 AAAHousing Development Finance Corp. Ltd. 3520.97 3.74 LAAACiticorp Finance (I) Ltd. 3000.00 3.18 AAAIndian Retail ABS Tr Ser XXIII A1 2836.94 3.01 P1+(SO)Mahindra & Mahindra Financial Ser Ltd. 2500.07 2.65 P1+Sundaram Finance Limited 2500.00 2.65 MAAAKotak Mahindra Primus Ltd. 2300.00 2.44 MAA+Sundaram Finance Limited 2000.00 2.12 P1+United Phosphorous Ltd. 2000.00 2.12 AA-Housing & Urban Developement Corp. Ltd. 1299.62 1.38 AAInfrastructure Development Fin. Co. Ltd. 1005.37 1.07 AAABajaj Auto Finance Ltd. 1003.00 1.06 AA+Gruh Finance Ltd 1000.00 1.06 AACholamandalam Investments & Fin Co. Ltd. 1000.00 1.06 MAA+Asset Securitisation Trust Dec2004 IV A6 927.11 0.98 AAA(SO)ICICI Bank Ltd. 502.75 0.53 LAAACitiFinancial Consumer Finance (I) Ltd. 501.18 0.53 AAAICICI Securities Ltd. 500.00 0.53 P1+Lakshmi General Finance Ltd. 500.00 0.53 MAAAMoney Market Instruments 3462.10 3.67Kotak Mahindra Bank Ltd. 2419.70 2.57 P1+Apollo Tyres Ltd. 546.59 0.58 P1+Inox Air Products Ltd. 495.81 0.53 P1+Cash & Current Assets -727.23 -0.77
**Represents thinly traded/ non traded securities and illiquid securitiesTotal Percentage of thinly/non traded securities is 13.43%
Net Assets 94256.98 100.00
Issuer Market Value % to Net RatingRs. in. Lacs Assets
Birla Floating Rate FundAn open-ended income scheme investing primarily in floating rate debt instruments
Issuer Market Value % to Net Rating
Rs. in. Lacs Assets
BIRLA FLOATING RATE FUND - LONG TERM PLANDebt InstrumentsCorporate Debt 2,005.45 2.54Sundaram Finance Limited** 1,005.35 1.28 MAAASundaram Finance Limited** 1,000.10 1.27 AAASecuritised Debt 6,833.40 8.67Indian Retail ABS SerXXV A2(WITECL)* 2,520.88 3.20 AAA(SO)Indian Retail Abs Trust Sr XXXIII A2** 2,302.36 2.92 AAA(SO)Indian RMBS Trust Series II A5 PTC** 934.65 1.19 LAAA(SO)Collateralised DebtTr Srs 2ClassA (ICICI)** 455.43 0.58 P1+(SO)Indian Retail Abs Series XIX** 447.72 0.57 A1+(SO)VE Trust 4 Sr A1 MMFSL (UTI Bank)** 172.36 0.22 AAA(SO)PSU/PFI Bonds/Banks 2,348.78 2.98Rural Electrification Corporation Ltd** 700.06 0.89 AAANational Bank for Agri & Rural Devp** 693.37 0.88 AAAIndustrial Development Bank of India Ltd** 503.67 0.64 AA+Indian Railways Finance Corp. Ltd.** 251.54 0.32 AAAHousing Development Finance Corp. Ltd.** 200.16 0.25 AAAFloating Rate Instruments 48,141.34 61.06Housing Development Finance Corp. Ltd. 7,325.79 9.29 AAAICICI Bank Ltd. 5,000.00 6.34 AAAIndustrial Development Bank of India Ltd 3,133.32 3.97 AA+Housing Development Finance Corp. Ltd. 2,514.98 3.19 LAAALIC Housing Finance Ltd. 2,511.70 3.19 AAAHousing & Urban Developement Corp. Ltd. 2,499.23 3.17 AACiticorp Finance (I) Ltd. 2,017.30 2.56 AAAInfrastructure Development Fin. Co. Ltd. 2,010.75 2.55 AAAGE Capital Services India 2,009.06 2.55 AAADewan Housing Finance Corporation Ltd 2,000.00 2.54 AARaymond Ltd. 1,800.00 2.28 PR1+Bajaj Auto Finance Ltd. 1,504.50 1.91 AA+Export-Import Bank of India 1,502.92 1.91 AAAIndian Retail ABS Trust SerXIII A3 1,489.72 1.89 MAAA(SO)Fleet Trust Jan 2005 SrsA2 PTC(ILFS) 1,473.59 1.87 AAA(SO)Indian Retail ABS Tr Ser XXIII A1 1,215.83 1.54 P1+(SO)Fleet Trust Jan2004 Series A5 1,172.59 1.49 AAA(SO)Gruh Finance Ltd 1,000.00 1.27 AANational Housing Bank 1,000.00 1.27 AAARanbaxy Holding Company 1,000.00 1.27 AA(SO)Sundaram Finance Limited 1,000.00 1.27 P1+Secured Loan Rec.Sec.Trust Sr3 (ICICI) 957.47 1.21 LAAA(SO)Rabo India Finance Pvt. Ltd. 501.41 0.64 AAACitiFinancial Consumer Finance (I) Ltd. 501.18 0.64 AAAUnited Phosphorous Ltd. 500.00 0.63 AA-Mahindra & Mahindra Financial Ser Ltd. 500.00 0.63 AA+Money Market Instruments 11,783.00 14.95ICICI Bank Ltd. 3,103.07 3.94 A1+The Jammu & Kashmir Bank Ltd. 2,362.20 3.00 P1+Bhararat Overseas Bank 2,359.62 2.99 A1+Inox Air Products Ltd. 1,983.23 2.52 P1+Allahabad Bank 1,974.88 2.50 PR1+Treasury Bills 947.90 1.20 SovereignCash & Current Assets 6,777.96 8.60
NOTE: Long Term Interest Rate Swap of notional value of Rs 5 Crores**Represents thinly traded/ non traded securities and illiquid securitiesTotal Percentage of thinly/non traded securities is 14.19%
Net Assets 78,837.83 100.00
Birla Floating Rate Fund - Short Term PlanIssuer Wise Portfolio as of 30-June-2005
Issuer Market Value % to Net RatingRs. in. Lacs Assets
BIRLA FLOATING RATE FUND - SHORT TERM PLANDebt InstrumentsCorporate Debt 1874.91 1.99Infrastructure Development Fin. Co. Ltd.** 870.21 0.92 AAACitiFinancial Consumer Finance (I) Ltd.** 502.62 0.53 AAAMahindra & Mahindra Financial Ser Ltd.** 502.08 0.53 AA+Securitised Debt 6684.57 7.09Indian RMBS Trust Series II A5 PTC** 3738.60 3.97 LAAA(So)Indian RMBS Trust (Series II) A3 ICICI** 2052.96 2.18 AAA(SO)Indian RMBS Trust Series II A4** 893.02 0.95 AAA(SO)PSU/PFI Bonds/Banks 4098.09 4.35Industrial Development Bank of India Ltd** 4098.09 4.35 AA+Floating Rate Instruments 78864.54 83.67Housing Development Finance Corp. Ltd. 12735.73 13.51 AAALIC Housing Finance Ltd. 6022.14 6.39 AAA
Birla Floating Rate Fund - Short Term Plan Issuer Wise Portfolio as of 30-June-2005 (Contd.)
19
#**** -Value Research Rating- Birla FRF - Long Term Plan
(Past performance is no guarantee of future results.)
# for methodology please refer page 24
Fund Managers' Speak - Floating Rate Fund
Satyabrata Mohanty
! Average maturity of the Short Term Plan (STP) around 0.58 years and of Long Term Plan (LTP) around 0.47 years.
! Average maturity of LTP low due to high cash levels maintained towards end of the month.
! LTP has higgher allocation to INBMK floaters as compared to the STP.
Birla Floating Rate Fund - Long Term PlanIssuer Wise Portfolio as of 30-June-2005
National Housing Bank 5000.00 5.30 AAAIndian Retail ABS Series XV A2 (ICICI) 4995.56 5.30 A1+(SO)Ranbaxy Holding Company 4900.00 5.20 AA(So)Industrial Development Bank of India Ltd 4598.91 4.88 AA+Mahindra & Mahindra Financial Ser Ltd. 4008.59 4.25 AA+Export-Import Bank of India 4006.60 4.25 AAAGE Capital Services India 3700.00 3.93 AAAHousing Development Finance Corp. Ltd. 3520.97 3.74 LAAACiticorp Finance (I) Ltd. 3000.00 3.18 AAAIndian Retail ABS Tr Ser XXIII A1 2836.94 3.01 P1+(SO)Mahindra & Mahindra Financial Ser Ltd. 2500.07 2.65 P1+Sundaram Finance Limited 2500.00 2.65 MAAAKotak Mahindra Primus Ltd. 2300.00 2.44 MAA+Sundaram Finance Limited 2000.00 2.12 P1+United Phosphorous Ltd. 2000.00 2.12 AA-Housing & Urban Developement Corp. Ltd. 1299.62 1.38 AAInfrastructure Development Fin. Co. Ltd. 1005.37 1.07 AAABajaj Auto Finance Ltd. 1003.00 1.06 AA+Gruh Finance Ltd 1000.00 1.06 AACholamandalam Investments & Fin Co. Ltd. 1000.00 1.06 MAA+Asset Securitisation Trust Dec2004 IV A6 927.11 0.98 AAA(SO)ICICI Bank Ltd. 502.75 0.53 LAAACitiFinancial Consumer Finance (I) Ltd. 501.18 0.53 AAAICICI Securities Ltd. 500.00 0.53 P1+Lakshmi General Finance Ltd. 500.00 0.53 MAAAMoney Market Instruments 3462.10 3.67Kotak Mahindra Bank Ltd. 2419.70 2.57 P1+Apollo Tyres Ltd. 546.59 0.58 P1+Inox Air Products Ltd. 495.81 0.53 P1+Cash & Current Assets -727.23 -0.77
**Represents thinly traded/ non traded securities and illiquid securitiesTotal Percentage of thinly/non traded securities is 13.43%
Net Assets 94256.98 100.00
Issuer Market Value % to Net RatingRs. in. Lacs Assets
Birla Floating Rate FundAn open-ended income scheme investing primarily in floating rate debt instruments
Issuer Market Value % to Net Rating
Rs. in. Lacs Assets
BIRLA FLOATING RATE FUND - LONG TERM PLANDebt InstrumentsCorporate Debt 2,005.45 2.54Sundaram Finance Limited** 1,005.35 1.28 MAAASundaram Finance Limited** 1,000.10 1.27 AAASecuritised Debt 6,833.40 8.67Indian Retail ABS SerXXV A2(WITECL)* 2,520.88 3.20 AAA(SO)Indian Retail Abs Trust Sr XXXIII A2** 2,302.36 2.92 AAA(SO)Indian RMBS Trust Series II A5 PTC** 934.65 1.19 LAAA(SO)Collateralised DebtTr Srs 2ClassA (ICICI)** 455.43 0.58 P1+(SO)Indian Retail Abs Series XIX** 447.72 0.57 A1+(SO)VE Trust 4 Sr A1 MMFSL (UTI Bank)** 172.36 0.22 AAA(SO)PSU/PFI Bonds/Banks 2,348.78 2.98Rural Electrification Corporation Ltd** 700.06 0.89 AAANational Bank for Agri & Rural Devp** 693.37 0.88 AAAIndustrial Development Bank of India Ltd** 503.67 0.64 AA+Indian Railways Finance Corp. Ltd.** 251.54 0.32 AAAHousing Development Finance Corp. Ltd.** 200.16 0.25 AAAFloating Rate Instruments 48,141.34 61.06Housing Development Finance Corp. Ltd. 7,325.79 9.29 AAAICICI Bank Ltd. 5,000.00 6.34 AAAIndustrial Development Bank of India Ltd 3,133.32 3.97 AA+Housing Development Finance Corp. Ltd. 2,514.98 3.19 LAAALIC Housing Finance Ltd. 2,511.70 3.19 AAAHousing & Urban Developement Corp. Ltd. 2,499.23 3.17 AACiticorp Finance (I) Ltd. 2,017.30 2.56 AAAInfrastructure Development Fin. Co. Ltd. 2,010.75 2.55 AAAGE Capital Services India 2,009.06 2.55 AAADewan Housing Finance Corporation Ltd 2,000.00 2.54 AARaymond Ltd. 1,800.00 2.28 PR1+Bajaj Auto Finance Ltd. 1,504.50 1.91 AA+Export-Import Bank of India 1,502.92 1.91 AAAIndian Retail ABS Trust SerXIII A3 1,489.72 1.89 MAAA(SO)Fleet Trust Jan 2005 SrsA2 PTC(ILFS) 1,473.59 1.87 AAA(SO)Indian Retail ABS Tr Ser XXIII A1 1,215.83 1.54 P1+(SO)Fleet Trust Jan2004 Series A5 1,172.59 1.49 AAA(SO)Gruh Finance Ltd 1,000.00 1.27 AANational Housing Bank 1,000.00 1.27 AAARanbaxy Holding Company 1,000.00 1.27 AA(SO)Sundaram Finance Limited 1,000.00 1.27 P1+Secured Loan Rec.Sec.Trust Sr3 (ICICI) 957.47 1.21 LAAA(SO)Rabo India Finance Pvt. Ltd. 501.41 0.64 AAACitiFinancial Consumer Finance (I) Ltd. 501.18 0.64 AAAUnited Phosphorous Ltd. 500.00 0.63 AA-Mahindra & Mahindra Financial Ser Ltd. 500.00 0.63 AA+Money Market Instruments 11,783.00 14.95ICICI Bank Ltd. 3,103.07 3.94 A1+The Jammu & Kashmir Bank Ltd. 2,362.20 3.00 P1+Bhararat Overseas Bank 2,359.62 2.99 A1+Inox Air Products Ltd. 1,983.23 2.52 P1+Allahabad Bank 1,974.88 2.50 PR1+Treasury Bills 947.90 1.20 SovereignCash & Current Assets 6,777.96 8.60
NOTE: Long Term Interest Rate Swap of notional value of Rs 5 Crores**Represents thinly traded/ non traded securities and illiquid securitiesTotal Percentage of thinly/non traded securities is 14.19%
Net Assets 78,837.83 100.00
Birla Floating Rate Fund - Short Term PlanIssuer Wise Portfolio as of 30-June-2005
Issuer Market Value % to Net RatingRs. in. Lacs Assets
BIRLA FLOATING RATE FUND - SHORT TERM PLANDebt InstrumentsCorporate Debt 1874.91 1.99Infrastructure Development Fin. Co. Ltd.** 870.21 0.92 AAACitiFinancial Consumer Finance (I) Ltd.** 502.62 0.53 AAAMahindra & Mahindra Financial Ser Ltd.** 502.08 0.53 AA+Securitised Debt 6684.57 7.09Indian RMBS Trust Series II A5 PTC** 3738.60 3.97 LAAA(So)Indian RMBS Trust (Series II) A3 ICICI** 2052.96 2.18 AAA(SO)Indian RMBS Trust Series II A4** 893.02 0.95 AAA(SO)PSU/PFI Bonds/Banks 4098.09 4.35Industrial Development Bank of India Ltd** 4098.09 4.35 AA+Floating Rate Instruments 78864.54 83.67Housing Development Finance Corp. Ltd. 12735.73 13.51 AAALIC Housing Finance Ltd. 6022.14 6.39 AAA
Birla Floating Rate Fund - Short Term Plan Issuer Wise Portfolio as of 30-June-2005 (Contd.)
19
#**** -Value Research Rating- Birla FRF - Long Term Plan
(Past performance is no guarantee of future results.)
# for methodology please refer page 24
Q U A R T E R L YQ U A R T E R L Y
Long Term Plan
Asset Allocation
Short Term Plan
Asset Allocation1.20%
2.54%
2.98%
8.60%
8.67%
14.95%
61.06%
0.00% 10.00% 20.00% 30.00% 40.00% 50.00% 60.00% 70.00%
Treasury Bills
Corporate Debt
PSU/PFI Bonds/Banks
Cash & Current Assets
Securitised Debt
Money Market Instruments
Floating Rate Instruments
1.99%
3.67%
4.35%
7.09%
83.67%
-0.77%
-10.00% 0.00% 10.00% 20.00% 30.00% 40.00% 50.00% 60.00% 70.00% 80.00% 90.00%
Cash & Current Assets
Corporate Debt
Money Market Instruments
PSU/PFI Bonds/Banks
Securitised Debt
Floating Rate Instruments

Fund Managers' Speak - Birla Cash Plus
Navneet Munot
! Average maturity around 135 days.
! Continuing to look at yield pick up by investing in top quality unrated/AA/AA+ short term papers to improve the portfolio yield. Ensuring at least 80% of the portfolio invested in AAA/P1+/call money/repo at any point in time.
Issuer Wise Portfolio as of 30-June-2005
Issuer Wise Portfolio as of 30-June-2005 (Contd.)
Citicorp Maruti Finance Ltd. 1999.13 0.73 P1+
Citi Financial Consumer Finance (I) Ltd. 1502.01 0.55 AAA
Kotak Mahindra Primus Ltd. 1500.00 0.55 P1+
Cholamandalam Investments & Finance Ltd. 1006.47 0.37 MAA+
Mahindra & Mahindra Financial Ser. Ltd. 1000.56 0.37 AA+
Canbank Factors Ltd. 1000.00 0.37 P1+
Jindal Steel Ltd 1000.00 0.37 A1+
Swaraj Engines Ltd. 1000.00 0.37 UNRATED
Tube Investment of India Ltd. 1000.00 0.37 P1+
DCM Shriram Consolidated Ltd. 1000.00 0.37 A1+
Colour-Chem Ltd 1000.00 0.37 P1+
Reliance Industries Ltd. 506.28 0.19 AAA
Tata Sons Ltd. 501.17 0.18 AAA
PSU/PFI Bonds/Banks ** 13379.49 4.89
Industrial Development Bank of India 6831.48 2.50 AA+
Housing & Urban Developement Corp. Ltd. 5038.78 1.84 UNRATED
National Bank for Agri. & Rural Devt. 1509.22 0.55 AAA
Cash & Current Assets 10500.28 3.84
**Represents thinly traded/ non traded securities and illiquid securities Total Percentage of thinly/non traded securities is 39.01%
Net Assets 273487.33 100.00
Issuer Market % to Net RatingValue Assets
Birla Cash PlusAn open-ended high liquidity fund investingin short term debt and money market instruments
Issuer Market Value % to Net RatingRs. in. Lacs Assets
Money Market Instruments 92829.27 33.94
ICICI Bank Ltd. 29510.16 10.79 A1+
Kotak Mahindra Bank Ltd. 13340.47 4.88 P1+
Indusind bank 6327.53 2.31 P1+
IndusInd Bank Ltd. 5559.98 2.03 P1+
Allahabad Bank 5332.18 1.95 PR1+
Power Finance Corp. Ltd. 4979.68 1.82 P1+
Uco Bank 4742.42 1.73 P1+
Karnataka Bank Ltd 2945.05 1.08 A1+
Yes Bank Ltd. 2441.32 0.89 A1+
Industrial Development Bank of India 2416.31 0.88 P1+
OCL India Ltd. 1994.38 0.73 A1+
ING Vysya Bank Ltd. 1977.89 0.72 P1+
GE Countrywide Consumer Fin Ser Ltd. 1976.31 0.72 P1+
Larsen & Toubro Ltd. 1947.20 0.71 PR1+
Ballarpur Industries Ltd. 1918.00 0.70 F1+
Rabo India Finance Pvt. Ltd. 1486.33 0.54 P1+
Citi Financial Consumer Finance (I) Ltd. 996.79 0.36 P1+
UTI Bank Ltd. 991.38 0.36 A1+
Bajaj Auto Finance Ltd. 978.70 0.36 P1+
Kotak Mahindra Primus Ltd. 967.17 0.35 P1+
Floating Rate Instruments 63460.92 23.20
Housing Development Finance Corp. Ltd. 21062.61 7.70 AAA
Indian Retail ABS Series. XV A2- (ICICI) 14487.11 5.30 A1+(SO)
National Housing Bank 9000.00 3.29 AAA
Citicorp Finance (I) Ltd. 4500.00 1.65 AAA
Housing & Urban Developement Corp. Ltd. 3004.06 1.10 F1+
Ranbaxy Holding Company. 3000.00 1.10 AA(So)
Indian Ret ABS Ser XXXII - Pac Sr 2406.06 0.88 LAAA(So)
Sundaram Finance Ltd 2000.00 0.73 P1+
Citi Financial Consumer Finance (I) Ltd. 2000.00 0.73 AAA
GE Capital Services India Ltd 1000.00 0.37 AAA
Mahindra & Mahindra Financial Ser. Ltd. 501.08 0.18 AA+
Sundaram Finance Ltd 500.00 0.18 MAAA
Securitised Debt ** 60298.68 22.05
Indian RMBS Trust SR1 A4 20Dec04 ICICI 12948.73 4.73 AAA(SO)
Indian RMBS TR (SR-II) A3 (20-MAY-2005) 9338.82 3.41 AAA(SO)
UBL Trust Series 12 - A1 (27-Mar-2006) 6568.63 2.40 AAA(SO)
INDIAN RETAIL ABS TRUST SR. XXXIV (A1) 5445.64 1.99 P1+
India Loan Sec Sr IV 15APR08 4812.73 1.76 P1+(SO)
Retail Trust Sept. 2004 Sr-A3 (Citi) 4125.55 1.51 AAA(SO)
India Loan Sec Sr IV 15JUN06 3414.53 1.25 AAA(SO)
Indian RMBS Trust SR1 A3 20Nov04 ICICI 2856.29 1.04 AAA(SO)
Ind Ret ABS Tr Sr. XXXI -18 Dec5 (ICICI) 2336.90 0.85 AAA(SO)
Retail Trust 2004 Ser. III A3(HDFC Bank) 1596.15 0.58 AAA(SO)
UBL Ser. 11 Senior PTC Ser. A1 (UTI BK) 1519.46 0.56 AAA(SO)
Retail Trust 2004 Ser. III A1(HDFC Bank) 1387.65 0.51 AAA(SO)
India Loan Securtisation Ser.IV Trust 04 1018.99 0.37 P1+(SO)
Collateralised Debt Trust Ser-2 (Rabo) 910.85 0.33 P1+(SO)
Loan Securitisation Trust Series IX PGC 883.81 0.32 LAAA(So)
Collat Debt Tr Sr 1 (UTI Bank) (08JUL05) 625.17 0.23 A1+(SO)
Indian Retail Abs Series XIX-13-Sep-2005 508.77 0.19 A1+(SO)
Corporate Debt ** 33018.70 12.07
United Phosphorus Ltd 5000.00 1.83 UNRATED
Electrosteel Castings Ltd. 4000.00 1.46 P1+
Bajaj Hindusthan Ltd. 3000.00 1.10 UNRATED
Ranbaxy Holding Company. 2503.08 0.92 UNRATED
Larsen & Toubro Finance Ltd. 2500.00 0.91 UNRATED
Motherson Sumi Systems Ltd. 2000.00 0.73 A1+
20
+'mfAAA' by ICRA
+ for methodology please refer page 24
The grading has been assigned by ICRA and indicates highest quality. The investment quality is similar to that of fixed income obligations of highest safety and with maturity corresponding upto 1 year. This grading should however, not be construed as an indication of the performance of the Mutual Fund scheme or of volatility in its returns.
^^ for methodology please refer page 24.
CRISIL~CPR 2 Open Ended Liquid Category^^
(Past performance is no guarantee of future results.)
Q U A R T E R L YQ U A R T E R L Y
Asset Allocation
Rating Profile
3.84%
4.89%
12.07%
22.05%
23.20%
33.94%
0.00% 5.00% 10.00% 15.00% 20.00% 25.00% 30.00% 35.00% 40.00%
Cash & Current Assets
PSU/PFI Bonds/Banks
Corporate Debt
Securitised Debt
Floating Rate Instruments
Money Market Instruments
3.84%
4.51%
6.96%
84.69%
0.00% 10.00% 20.00% 30.00% 40.00% 50.00% 60.00% 70.00% 80.00% 90.00%
Cash & Current Assets
AA
Unrated
AAA
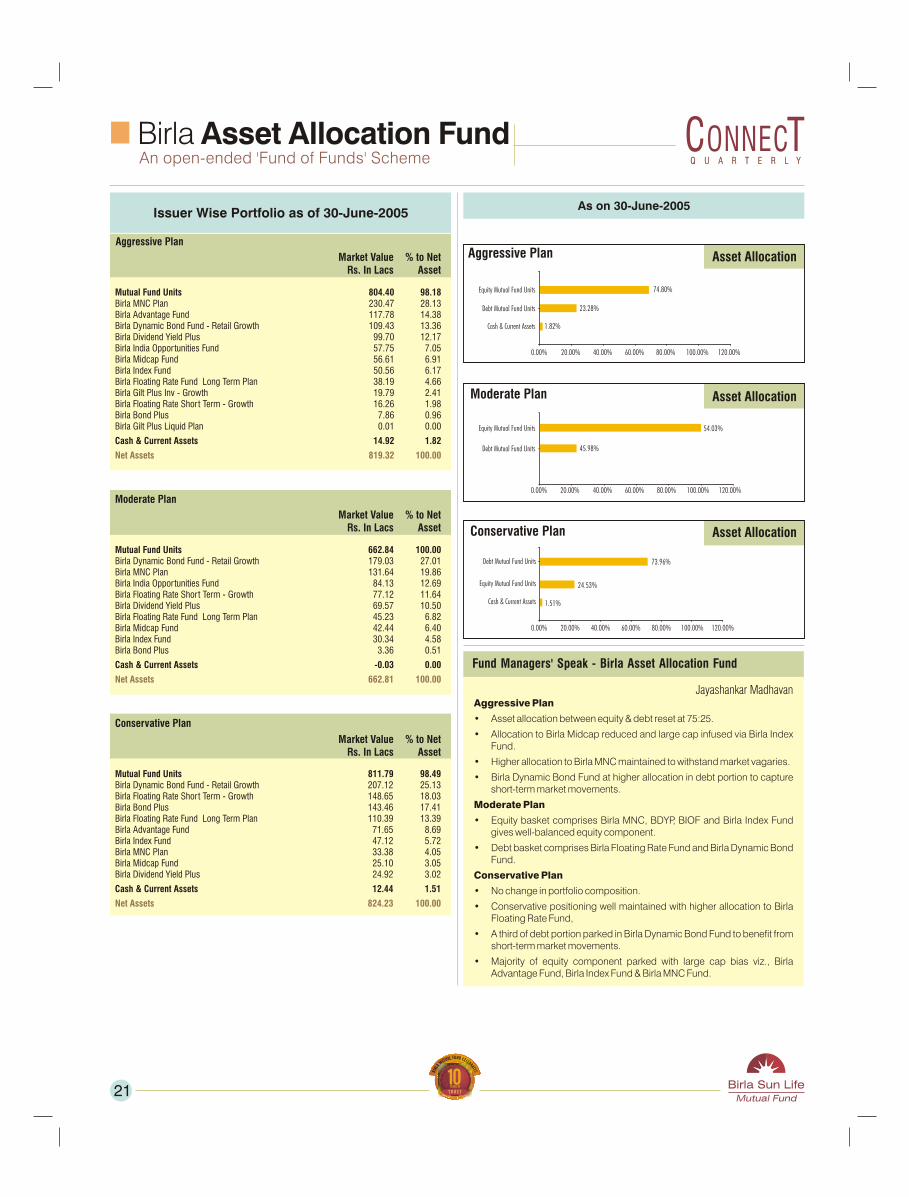
Fund Managers' Speak - Birla Asset Allocation Fund
Jayashankar Madhavan
Issuer Wise Portfolio as of 30-June-2005
Birla Asset Allocation FundAn open-ended 'Fund of Funds' Scheme
Market Value % to NetRs. In Lacs Asset
Mutual Fund Units 804.40 98.18Birla MNC Plan 230.47 28.13Birla Advantage Fund 117.78 14.38Birla Dynamic Bond Fund - Retail Growth 109.43 13.36Birla Dividend Yield Plus 99.70 12.17Birla India Opportunities Fund 57.75 7.05Birla Midcap Fund 56.61 6.91Birla Index Fund 50.56 6.17Birla Floating Rate Fund Long Term Plan 38.19 4.66Birla Gilt Plus Inv - Growth 19.79 2.41Birla Floating Rate Short Term - Growth 16.26 1.98Birla Bond Plus 7.86 0.96Birla Gilt Plus Liquid Plan 0.01 0.00
Cash & Current Assets 14.92 1.82
Net Assets 819.32 100.00
21
Aggressive Plan
Market Value % to NetRs. In Lacs Asset
Mutual Fund Units 662.84 100.00Birla Dynamic Bond Fund - Retail Growth 179.03 27.01Birla MNC Plan 131.64 19.86Birla India Opportunities Fund 84.13 12.69Birla Floating Rate Short Term - Growth 77.12 11.64Birla Dividend Yield Plus 69.57 10.50Birla Floating Rate Fund Long Term Plan 45.23 6.82Birla Midcap Fund 42.44 6.40Birla Index Fund 30.34 4.58Birla Bond Plus 3.36 0.51
Cash & Current Assets -0.03 0.00
Net Assets 662.81 100.00
Moderate Plan
Market Value % to NetRs. In Lacs Asset
Mutual Fund Units 811.79 98.49Birla Dynamic Bond Fund - Retail Growth 207.12 25.13Birla Floating Rate Short Term - Growth 148.65 18.03Birla Bond Plus 143.46 17.41Birla Floating Rate Fund Long Term Plan 110.39 13.39Birla Advantage Fund 71.65 8.69Birla Index Fund 47.12 5.72Birla MNC Plan 33.38 4.05Birla Midcap Fund 25.10 3.05Birla Dividend Yield Plus 24.92 3.02
Cash & Current Assets 12.44 1.51
Net Assets 824.23 100.00
Conservative Plan
Q U A R T E R L YQ U A R T E R L Y
Aggressive Plan
• Asset allocation between equity & debt reset at 75:25.
• Allocation to Birla Midcap reduced and large cap infused via Birla Index Fund.
• Higher allocation to Birla MNC maintained to withstand market vagaries.
• Birla Dynamic Bond Fund at higher allocation in debt portion to capture short-term market movements.
Moderate Plan
• Equity basket comprises Birla MNC, BDYP, BIOF and Birla Index Fund gives well-balanced equity component.
• Debt basket comprises Birla Floating Rate Fund and Birla Dynamic Bond Fund.
Conservative Plan
• No change in portfolio composition.
• Conservative positioning well maintained with higher allocation to BirlaFloating Rate Fund,
• A third of debt portion parked in Birla Dynamic Bond Fund to benefit fromshort-term market movements.
• Majority of equity component parked with large cap bias viz., BirlaAdvantage Fund, Birla Index Fund & Birla MNC Fund.
As on 30-June-2005
Asset Allocation
Asset Allocation
Asset AllocationAggressive Plan
Moderate Plan
Conservative Plan
1.82%
74.80%
23.28%
0.00% 20.00% 40.00% 60.00% 80.00% 100.00% 120.00%
Cash & Current Assets
Equity Mutual Fund Units
Debt Mutual Fund Units
0.00% 20.00% 40.00% 60.00% 80.00% 100.00% 120.00%
1.51%
0.00% 20.00% 40.00% 60.00% 80.00% 100.00% 120.00%
Cash & Current Assets
24.53%Equity Mutual Fund Units
73.96%Debt Mutual Fund Units
45.98%Debt Mutual Fund Units
54.03%Equity Mutual Fund Units
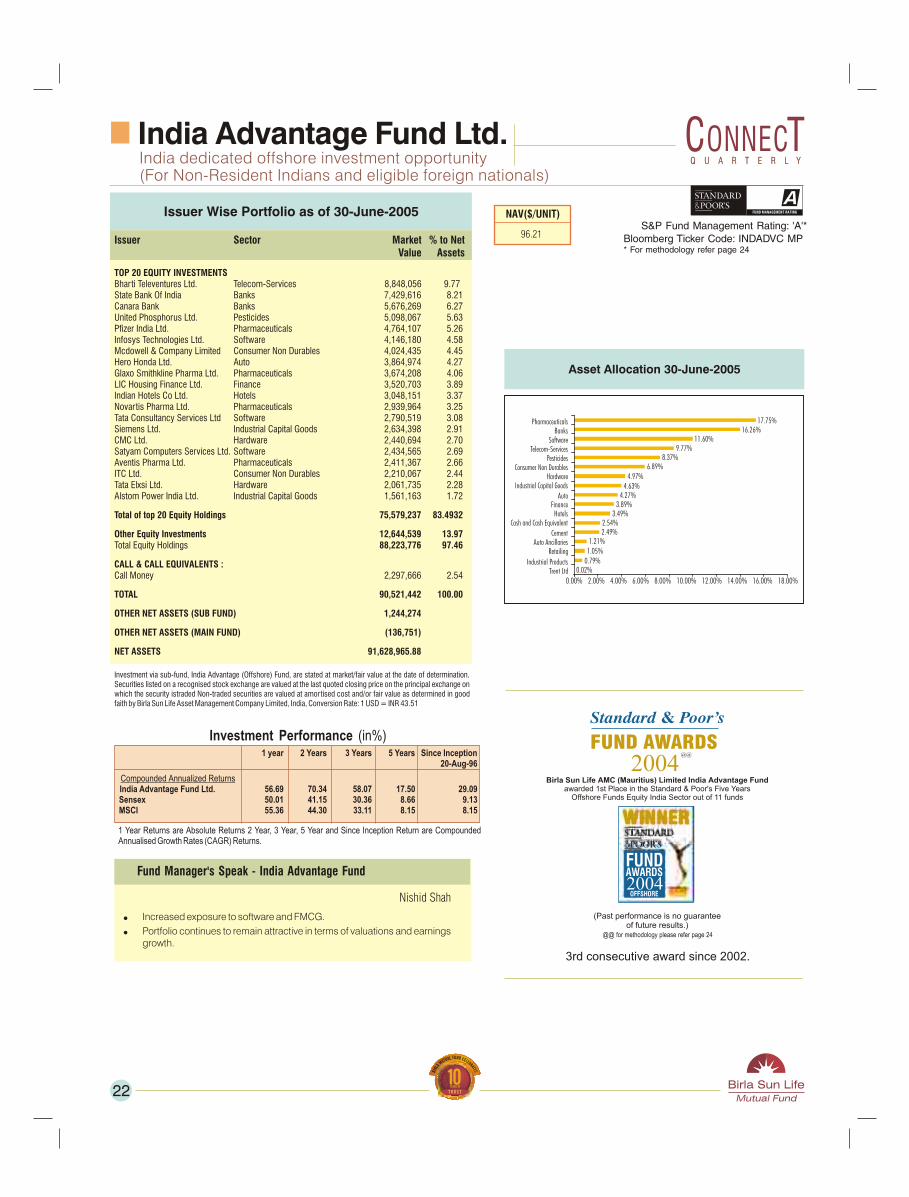
India Advantage Fund Ltd.India dedicated offshore investment opportunity(For Non-Resident Indians and eligible foreign nationals)
Issuer Wise Portfolio as of 30-June-2005
Issuer Sector Market % to NetValue Assets
TOP 20 EQUITY INVESTMENTS Bharti Televentures Ltd. Telecom-Services 8,848,056 9.77State Bank Of India Banks 7,429,616 8.21Canara Bank Banks 5,676,269 6.27United Phosphorus Ltd. Pesticides 5,098,067 5.63Pfizer India Ltd. Pharmaceuticals 4,764,107 5.26Infosys Technologies Ltd. Software 4,146,180 4.58Mcdowell & Company Limited Consumer Non Durables 4,024,435 4.45Hero Honda Ltd. Auto 3,864,974 4.27Glaxo Smithkline Pharma Ltd. Pharmaceuticals 3,674,208 4.06LIC Housing Finance Ltd. Finance 3,520,703 3.89Indian Hotels Co Ltd. Hotels 3,048,151 3.37Novartis Pharma Ltd. Pharmaceuticals 2,939,964 3.25Tata Consultancy Services Ltd Software 2,790,519 3.08Siemens Ltd. Industrial Capital Goods 2,634,398 2.91CMC Ltd. Hardware 2,440,694 2.70Satyam Computers Services Ltd. Software 2,434,565 2.69Aventis Pharma Ltd. Pharmaceuticals 2,411,367 2.66ITC Ltd. Consumer Non Durables 2,210,067 2.44Tata Elxsi Ltd. Hardware 2,061,735 2.28Alstom Power India Ltd. Industrial Capital Goods 1,561,163 1.72
Total of top 20 Equity Holdings 75,579,237 83.4932
Other Equity Investments 12,644,539 13.97 Total Equity Holdings 88,223,776 97.46
CALL & CALL EQUIVALENTS :Call Money 2,297,666 2.54
TOTAL 90,521,442 100.00
OTHER NET ASSETS (SUB FUND) 1,244,274
OTHER NET ASSETS (MAIN FUND) (136,751)
NET ASSETS 91,628,965.88
Investment via sub-fund, India Advantage (Offshore) Fund, are stated at market/fair value at the date of determination. Securities listed on a recognised stock exchange are valued at the last quoted closing price on the principal exchange on which the security istraded Non-traded securities are valued at amortised cost and/or fair value as determined in good faith by Birla Sun Life Asset Management Company Limited, India, Conversion Rate: 1 USD = INR 43.51
Fund Manager's Speak - India Advantage Fund
Nishid Shah
! Increased exposure to software and FMCG.
! Portfolio continues to remain attractive in terms of valuations and earnings growth.
22
Investment Performance (in%)
1 Year Returns are Absolute Returns 2 Year, 3 Year, 5 Year and Since Inception Return are Compounded Annualised Growth Rates (CAGR) Returns.
Bloomberg Ticker Code: INDADVC MP* For methodology refer page 24
S&P Fund Management Rating: 'A'*
Birla Sun Life AMC (Mauritius) Limited India Advantage Fundawarded 1st Place in the Standard & Poor's Five Years
Offshore Funds Equity India Sector out of 11 funds
2004 @@
2004
@@ for methodology please refer page 24
(Past performance is no guaranteeof future results.)
3rd consecutive award since 2002.
NAV($/UNIT)
96.21
1 year 2 Years 3 Years 5 Years Since Inception20-Aug-96
Compounded Annualized Returns India Advantage Fund Ltd. 56.69 70.34 58.07 17.50 29.09
Sensex 50.01 41.15 30.36 8.66 9.13 MSCI 55.36 44.30 33.11 8.15 8.15
Q U A R T E R L YQ U A R T E R L Y
Asset Allocation 30-June-2005
0.02%0.79%1.05%1.21%
2.49%2.54%
3.49%3.89%
4.27%4.63%
4.97%6.89%
8.37%9.77%
11.60%16.26%
17.75%
0.00% 2.00% 4.00% 6.00% 8.00% 10.00% 12.00% 14.00% 16.00% 18.00%Trent Ltd
Industrial Products
RetailingAuto Ancillaries
Cement
Cash and Cash EquivalentHotels
FinanceAuto
Industrial Capital GoodsHardware
Consumer Non DurablesPesticides
Telecom-ServicesSoftware
BanksPharmaceuticals
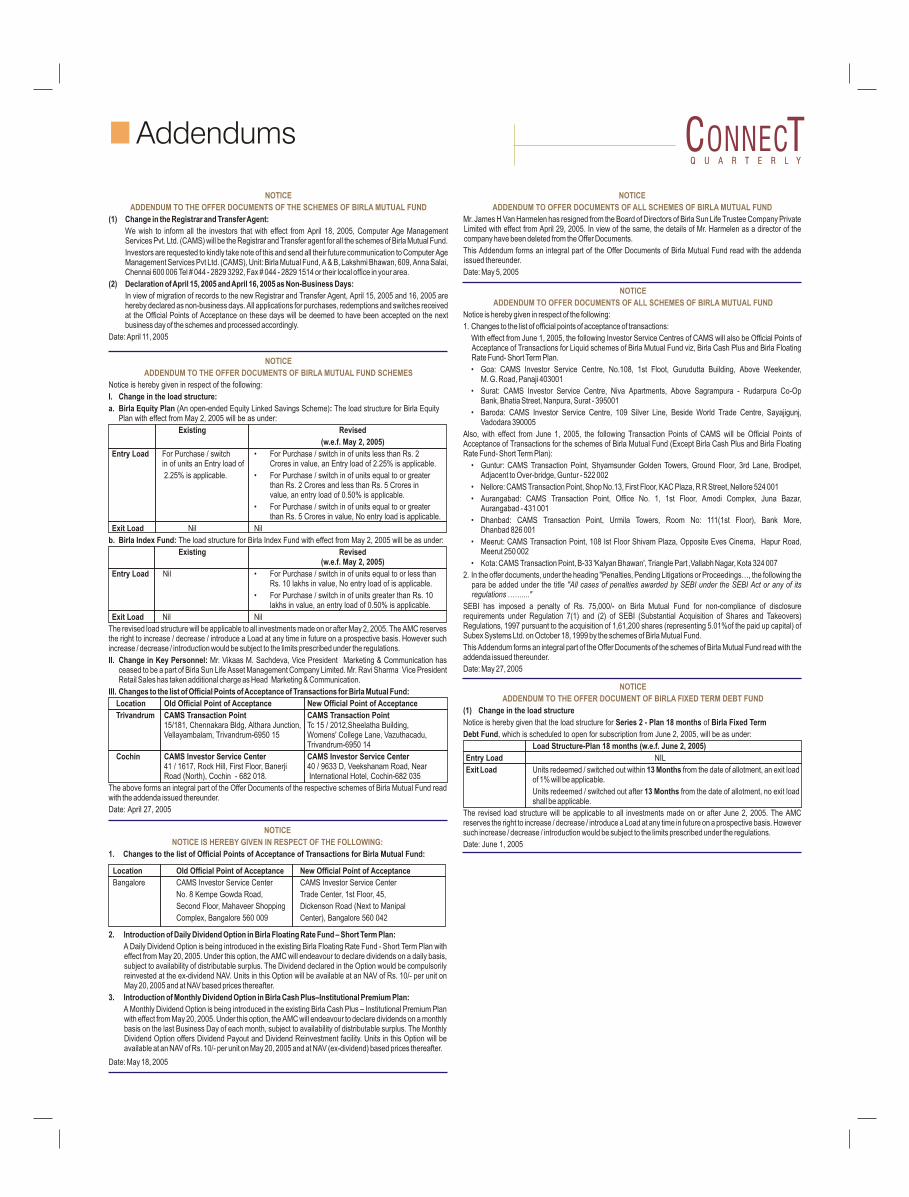
Addendums
NOTICE
ADDENDUM TO THE OFFER DOCUMENTS OF BIRLA MUTUAL FUND SCHEMES
Notice is hereby given in respect of the following:
I. Change in the load structure:
a. Birla Equity Plan (An open-ended Equity Linked Savings Scheme): The load structure for Birla Equity Plan with effect from May 2, 2005 will be as under:
Existing Revised
(w.e.f. May 2, 2005)
Entry Load For Purchase / switch • For Purchase / switch in of units less than Rs. 2in of units an Entry load of Crores in value, an Entry load of 2.25% is applicable.
2.25% is applicable. • For Purchase / switch in of units equal to or greaterthan Rs. 2 Crores and less than Rs. 5 Crores invalue, an entry load of 0.50% is applicable.
• For Purchase / switch in of units equal to or greaterthan Rs. 5 Crores in value, No entry load is applicable.
Exit Load Nil Nil
b. Birla Index Fund: The load structure for Birla Index Fund with effect from May 2, 2005 will be as under:
Existing Revised(w.e.f. May 2, 2005)
Entry Load Nil • For Purchase / switch in of units equal to or less thanRs. 10 lakhs in value, No entry load of is applicable.
• For Purchase / switch in of units greater than Rs. 10lakhs in value, an entry load of 0.50% is applicable.
Exit Load Nil Nil
The revised load structure will be applicable to all investments made on or after May 2, 2005. The AMC reserves the right to increase / decrease / introduce a Load at any time in future on a prospective basis. However such increase / decrease / introduction would be subject to the limits prescribed under the regulations.
II. Change in Key Personnel: Mr. Vikaas M. Sachdeva, Vice President Marketing & Communication hasceased to be a part of Birla Sun Life Asset Management Company Limited. Mr. Ravi Sharma Vice President Retail Sales has taken additional charge as Head Marketing & Communication.
III. Changes to the list of Official Points of Acceptance of Transactions for Birla Mutual Fund:
Location Old Official Point of Acceptance New Official Point of Acceptance
Trivandrum CAMS Transaction Point CAMS Transaction Point 15/181, Chennakara Bldg, Althara Junction, Tc 15 / 2012,Sheelatha Building,Vellayambalam, Trivandrum-6950 15 Womens' College Lane, Vazuthacadu,
Trivandrum-6950 14
Cochin CAMS Investor Service Center CAMS Investor Service Center41 / 1617, Rock Hill, First Floor, Banerji 40 / 9633 D, Veekshanam Road, NearRoad (North), Cochin - 682 018. International Hotel, Cochin-682 035
The above forms an integral part of the Offer Documents of the respective schemes of Birla Mutual Fund read with the addenda issued thereunder.
Date: April 27, 2005
NOTICE
ADDENDUM TO THE OFFER DOCUMENTS OF THE SCHEMES OF BIRLA MUTUAL FUND
(1) Change in the Registrar and Transfer Agent:
We wish to inform all the investors that with effect from April 18, 2005, Computer Age Management Services Pvt. Ltd. (CAMS) will be the Registrar and Transfer agent for all the schemes of Birla Mutual Fund.
Investors are requested to kindly take note of this and send all their future communication to Computer Age Management Services Pvt Ltd. (CAMS), Unit: Birla Mutual Fund, A & B, Lakshmi Bhawan, 609, Anna Salai, Chennai 600 006 Tel # 044 - 2829 3292, Fax # 044 - 2829 1514 or their local office in your area.
(2) Declaration of April 15, 2005 and April 16, 2005 as Non-Business Days:
In view of migration of records to the new Registrar and Transfer Agent, April 15, 2005 and 16, 2005 are hereby declared as non-business days. All applications for purchases, redemptions and switches received at the Official Points of Acceptance on these days will be deemed to have been accepted on the next business day of the schemes and processed accordingly.
Date: April 11, 2005
NOTICE
NOTICE IS HEREBY GIVEN IN RESPECT OF THE FOLLOWING:
1. Changes to the list of Official Points of Acceptance of Transactions for Birla Mutual Fund:
Location Old Official Point of Acceptance New Official Point of Acceptance
Bangalore CAMS Investor Service Center CAMS Investor Service Center
No. 8 Kempe Gowda Road, Trade Center, 1st Floor, 45,
Second Floor, Mahaveer Shopping Dickenson Road (Next to Manipal
Complex, Bangalore 560 009 Center), Bangalore 560 042
2. Introduction of Daily Dividend Option in Birla Floating Rate Fund – Short Term Plan:
A Daily Dividend Option is being introduced in the existing Birla Floating Rate Fund - Short Term Plan with effect from May 20, 2005. Under this option, the AMC will endeavour to declare dividends on a daily basis, subject to availability of distributable surplus. The Dividend declared in the Option would be compulsorily reinvested at the ex-dividend NAV. Units in this Option will be available at an NAV of Rs. 10/- per unit on May 20, 2005 and at NAV based prices thereafter.
3. Introduction of Monthly Dividend Option in Birla Cash Plus–Institutional Premium Plan:
A Monthly Dividend Option is being introduced in the existing Birla Cash Plus – Institutional Premium Plan with effect from May 20, 2005. Under this option, the AMC will endeavour to declare dividends on a monthly basis on the last Business Day of each month, subject to availability of distributable surplus. The Monthly Dividend Option offers Dividend Payout and Dividend Reinvestment facility. Units in this Option will be available at an NAV of Rs. 10/- per unit on May 20, 2005 and at NAV (ex-dividend) based prices thereafter.
Date: May 18, 2005
NOTICE
ADDENDUM TO THE OFFER DOCUMENT OF BIRLA FIXED TERM DEBT FUND
(1) Change in the load structure
Notice is hereby given that the load structure for Series 2 - Plan 18 months of Birla Fixed Term
Debt Fund, which is scheduled to open for subscription from June 2, 2005, will be as under:
Load Structure-Plan 18 months (w.e.f. June 2, 2005)
Entry Load NIL
Exit Load Units redeemed / switched out within 13 Months from the date of allotment, an exit loadof 1% will be applicable.
Units redeemed / switched out after 13 Months from the date of allotment, no exit loadshall be applicable.
The revised load structure will be applicable to all investments made on or after June 2, 2005. The AMC reserves the right to increase / decrease / introduce a Load at any time in future on a prospective basis. However such increase / decrease / introduction would be subject to the limits prescribed under the regulations.
Date: June 1, 2005
NOTICE
ADDENDUM TO OFFER DOCUMENTS OF ALL SCHEMES OF BIRLA MUTUAL FUND
Notice is hereby given in respect of the following:
1. Changes to the list of official points of acceptance of transactions:
With effect from June 1, 2005, the following Investor Service Centres of CAMS will also be Official Points of Acceptance of Transactions for Liquid schemes of Birla Mutual Fund viz, Birla Cash Plus and Birla Floating Rate Fund- Short Term Plan.
• Goa: CAMS Investor Service Centre, No.108, 1st Floot, Gurudutta Building, Above Weekender, M. G. Road, Panaji 403001
• Surat: CAMS Investor Service Centre, Niva Apartments, Above Sagrampura - Rudarpura Co-OpBank, Bhatia Street, Nanpura, Surat - 395001
• Baroda: CAMS Investor Service Centre, 109 Silver Line, Beside World Trade Centre, Sayajigunj,Vadodara 390005
Also, with effect from June 1, 2005, the following Transaction Points of CAMS will be Official Points of Acceptance of Transactions for the schemes of Birla Mutual Fund (Except Birla Cash Plus and Birla Floating Rate Fund- Short Term Plan):
• Guntur: CAMS Transaction Point, Shyamsunder Golden Towers, Ground Floor, 3rd Lane, Brodipet,Adjacent to Over-bridge, Guntur - 522 002
• Nellore: CAMS Transaction Point, Shop No.13, First Floor, KAC Plaza, R R Street, Nellore 524 001
• Aurangabad: CAMS Transaction Point, Office No. 1, 1st Floor, Amodi Complex, Juna Bazar, Aurangabad - 431 001
• Dhanbad: CAMS Transaction Point, Urmila Towers, Room No: 111(1st Floor), Bank More, Dhanbad 826 001
• Meerut: CAMS Transaction Point, 108 Ist Floor Shivam Plaza, Opposite Eves Cinema, Hapur Road,Meerut 250 002
• Kota: CAMS Transaction Point, B-33 'Kalyan Bhawan', Triangle Part ,Vallabh Nagar, Kota 324 007
2. In the offer documents, under the heading "Penalties, Pending Litigations or Proceedings…, the following the para be added under the title "All cases of penalties awarded by SEBI under the SEBI Act or any of its regulations ……...."
SEBI has imposed a penalty of Rs. 75,000/- on Birla Mutual Fund for non-compliance of disclosure requirements under Regulation 7(1) and (2) of SEBI (Substantial Acquisition of Shares and Takeovers) Regulations, 1997 pursuant to the acquisition of 1,61,200 shares (representing 5.01%of the paid up capital) of Subex Systems Ltd. on October 18, 1999 by the schemes of Birla Mutual Fund.
This Addendum forms an integral part of the Offer Documents of the schemes of Birla Mutual Fund read with theaddenda issued thereunder.
Date: May 27, 2005
NOTICE
ADDENDUM TO OFFER DOCUMENTS OF ALL SCHEMES OF BIRLA MUTUAL FUND
Mr. James H Van Harmelen has resigned from the Board of Directors of Birla Sun Life Trustee Company Private Limited with effect from April 29, 2005. In view of the same, the details of Mr. Harmelen as a director of the company have been deleted from the Offer Documents.
This Addendum forms an integral part of the Offer Documents of Birla Mutual Fund read with the addenda issued thereunder.
Date: May 5, 2005
Q U A R T E R L YQ U A R T E R L Y
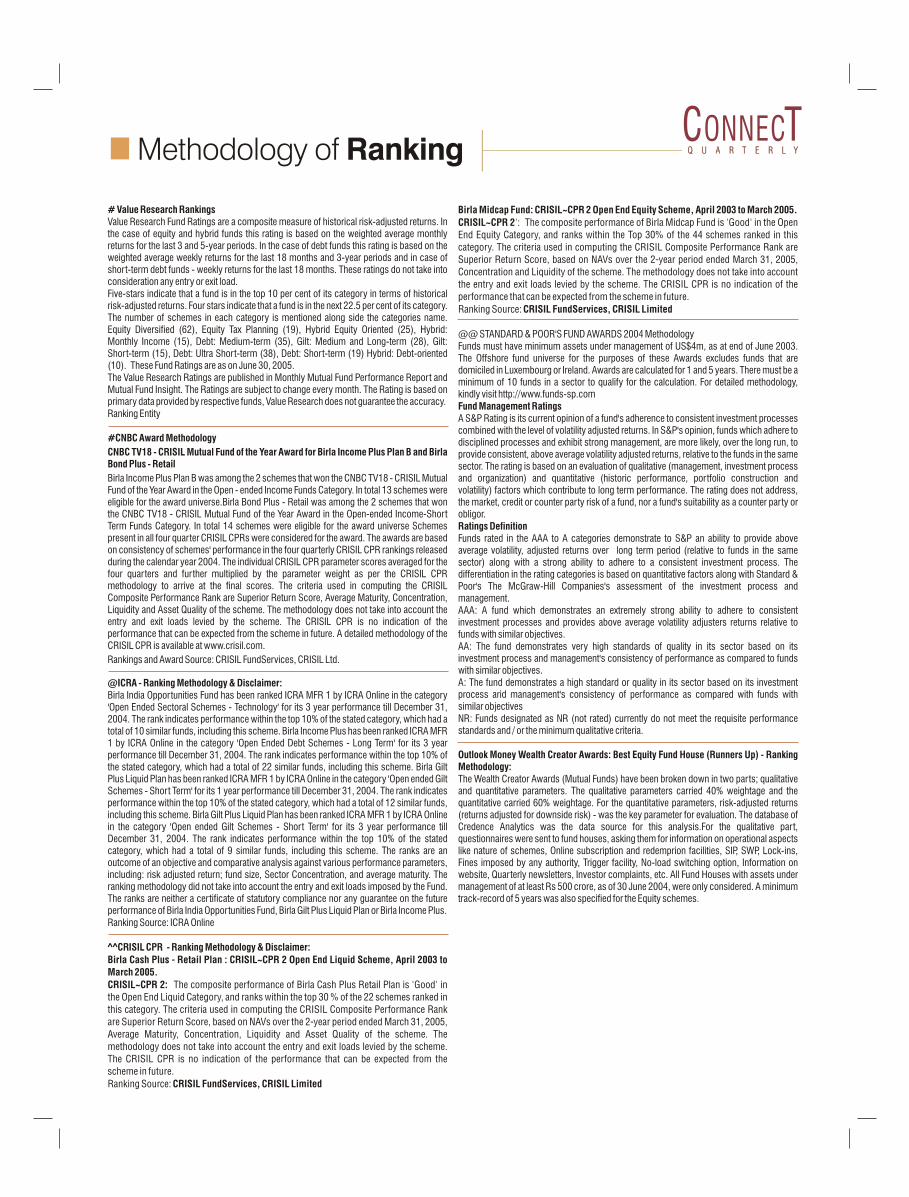
# Value Research RankingsValue Research Fund Ratings are a composite measure of historical risk-adjusted returns. In the case of equity and hybrid funds this rating is based on the weighted average monthly returns for the last 3 and 5-year periods. In the case of debt funds this rating is based on the weighted average weekly returns for the last 18 months and 3-year periods and in case of short-term debt funds - weekly returns for the last 18 months. These ratings do not take into consideration any entry or exit load.Five-stars indicate that a fund is in the top 10 per cent of its category in terms of historical risk-adjusted returns. Four stars indicate that a fund is in the next 22.5 per cent of its category. The number of schemes in each category is mentioned along side the categories name. Equity Diversified (62), Equity Tax Planning (19), Hybrid Equity Oriented (25), Hybrid: Monthly Income (15), Debt: Medium-term (35), Gilt: Medium and Long-term (28), Gilt: Short-term (15), Debt: Ultra Short-term (38), Debt: Short-term (19) Hybrid: Debt-oriented (10). These Fund Ratings are as on June 30, 2005. The Value Research Ratings are published in Monthly Mutual Fund Performance Report and Mutual Fund Insight. The Ratings are subject to change every month. The Rating is based on primary data provided by respective funds, Value Research does not guarantee the accuracy.Ranking Entity
#CNBC Award Methodology
CNBC TV18 - CRISIL Mutual Fund of the Year Award for Birla Income Plus Plan B and Birla Bond Plus - Retail
Birla Income Plus Plan B was among the 2 schemes that won the CNBC TV18 - CRISIL Mutual Fund of the Year Award in the Open - ended Income Funds Category. In total 13 schemes were eligible for the award universe.Birla Bond Plus - Retail was among the 2 schemes that won the CNBC TV18 - CRISIL Mutual Fund of the Year Award in the Open-ended Income-Short Term Funds Category. In total 14 schemes were eligible for the award universe Schemes present in all four quarter CRISIL CPRs were considered for the award. The awards are based on consistency of schemes' performance in the four quarterly CRISIL CPR rankings released during the calendar year 2004. The individual CRISIL CPR parameter scores averaged for the four quarters and further multiplied by the parameter weight as per the CRISIL CPR methodology to arrive at the final scores. The criteria used in computing the CRISIL Composite Performance Rank are Superior Return Score, Average Maturity, Concentration, Liquidity and Asset Quality of the scheme. The methodology does not take into account the entry and exit loads levied by the scheme. The CRISIL CPR is no indication of the performance that can be expected from the scheme in future. A detailed methodology of the CRISIL CPR is available at www.crisil.com.
Rankings and Award Source: CRISIL FundServices, CRISIL Ltd.
@ICRA - Ranking Methodology & Disclaimer: Birla India Opportunities Fund has been ranked ICRA MFR 1 by ICRA Online in the category 'Open Ended Sectoral Schemes - Technology' for its 3 year performance till December 31, 2004. The rank indicates performance within the top 10% of the stated category, which had a total of 10 similar funds, including this scheme. Birla Income Plus has been ranked ICRA MFR 1 by ICRA Online in the category 'Open Ended Debt Schemes - Long Term' for its 3 year performance till December 31, 2004. The rank indicates performance within the top 10% of the stated category, which had a total of 22 similar funds, including this scheme. Birla Gilt Plus Liquid Plan has been ranked ICRA MFR 1 by ICRA Online in the category 'Open ended Gilt Schemes - Short Term' for its 1 year performance till December 31, 2004. The rank indicates performance within the top 10% of the stated category, which had a total of 12 similar funds, including this scheme. Birla Gilt Plus Liquid Plan has been ranked ICRA MFR 1 by ICRA Online in the category 'Open ended Gilt Schemes - Short Term' for its 3 year performance till December 31, 2004. The rank indicates performance within the top 10% of the stated category, which had a total of 9 similar funds, including this scheme. The ranks are an outcome of an objective and comparative analysis against various performance parameters, including: risk adjusted return; fund size, Sector Concentration, and average maturity. The ranking methodology did not take into account the entry and exit loads imposed by the Fund. The ranks are neither a certificate of statutory compliance nor any guarantee on the future performance of Birla India Opportunities Fund, Birla Gilt Plus Liquid Plan or Birla Income Plus. Ranking Source: ICRA Online
^^CRISIL CPR - Ranking Methodology & Disclaimer:
Birla Cash Plus - Retail Plan : CRISIL~CPR 2 Open End Liquid Scheme, April 2003 to
March 2005.
CRISIL~CPR 2: The composite performance of Birla Cash Plus Retail Plan is 'Good' in
the Open End Liquid Category, and ranks within the top 30 % of the 22 schemes ranked in
this category. The criteria used in computing the CRISIL Composite Performance Rank
are Superior Return Score, based on NAVs over the 2-year period ended March 31, 2005,
Average Maturity, Concentration, Liquidity and Asset Quality of the scheme. The
methodology does not take into account the entry and exit loads levied by the scheme.
The CRISIL CPR is no indication of the performance that can be expected from the
scheme in future.
Ranking Source: CRISIL FundServices, CRISIL Limited
Methodology of Ranking
Birla Midcap Fund: CRISIL~CPR 2 Open End Equity Scheme, April 2003 to March 2005.
CRISIL~CPR 2': The composite performance of Birla Midcap Fund is 'Good' in the Open
End Equity Category, and ranks within the Top 30% of the 44 schemes ranked in this
category. The criteria used in computing the CRISIL Composite Performance Rank are
Superior Return Score, based on NAVs over the 2-year period ended March 31, 2005,
Concentration and Liquidity of the scheme. The methodology does not take into account
the entry and exit loads levied by the scheme. The CRISIL CPR is no indication of the
performance that can be expected from the scheme in future.
Ranking Source: CRISIL FundServices, CRISIL Limited
@@ STANDARD & POOR'S FUND AWARDS 2004 MethodologyFunds must have minimum assets under management of US$4m, as at end of June 2003. The Offshore fund universe for the purposes of these Awards excludes funds that are domiciled in Luxembourg or Ireland. Awards are calculated for 1 and 5 years. There must be a minimum of 10 funds in a sector to qualify for the calculation. For detailed methodology, kindly visit http://www.funds-sp.comFund Management RatingsA S&P Rating is its current opinion of a fund's adherence to consistent investment processes combined with the level of volatility adjusted returns. In S&P's opinion, funds which adhere to disciplined processes and exhibit strong management, are more likely, over the long run, to provide consistent, above average volatility adjusted returns, relative to the funds in the same sector. The rating is based on an evaluation of qualitative (management, investment process and organization) and quantitative (historic performance, portfolio construction and volatility) factors which contribute to long term performance. The rating does not address, the market, credit or counter party risk of a fund, nor a fund's suitability as a counter party or obligor.Ratings Definition Funds rated in the AAA to A categories demonstrate to S&P an ability to provide above average volatility, adjusted returns over long term period (relative to funds in the same sector) along with a strong ability to adhere to a consistent investment process. The differentiation in the rating categories is based on quantitative factors along with Standard & Poor's The McGraw-Hill Companies's assessment of the investment process and management.AAA: A fund which demonstrates an extremely strong ability to adhere to consistent investment processes and provides above average volatility adjusters returns relative to funds with similar objectives. AA: The fund demonstrates very high standards of quality in its sector based on its investment process and management's consistency of performance as compared to funds with similar objectives. A: The fund demonstrates a high standard or quality in its sector based on its investment process arid management's consistency of performance as compared with funds with similar objectives NR: Funds designated as NR (not rated) currently do not meet the requisite performance standards and / or the minimum qualitative criteria.
Outlook Money Wealth Creator Awards: Best Equity Fund House (Runners Up) - Ranking Methodology: The Wealth Creator Awards (Mutual Funds) have been broken down in two parts; qualitative and quantitative parameters. The qualitative parameters carried 40% weightage and the quantitative carried 60% weightage. For the quantitative parameters, risk-adjusted returns (returns adjusted for downside risk) - was the key parameter for evaluation. The database of Credence Analytics was the data source for this analysis.For the qualitative part, questionnaires were sent to fund houses, asking them for information on operational aspects like nature of schemes, Online subscription and redemprion facilities, SIP, SWP, Lock-ins, Fines imposed by any authority, Trigger facility, No-load switching option, Information on website, Quarterly newsletters, Investor complaints, etc. All Fund Houses with assets under management of at least Rs 500 crore, as of 30 June 2004, were only considered. A minimum track-record of 5 years was also specified for the Equity schemes.
Q U A R T E R L YQ U A R T E R L Y
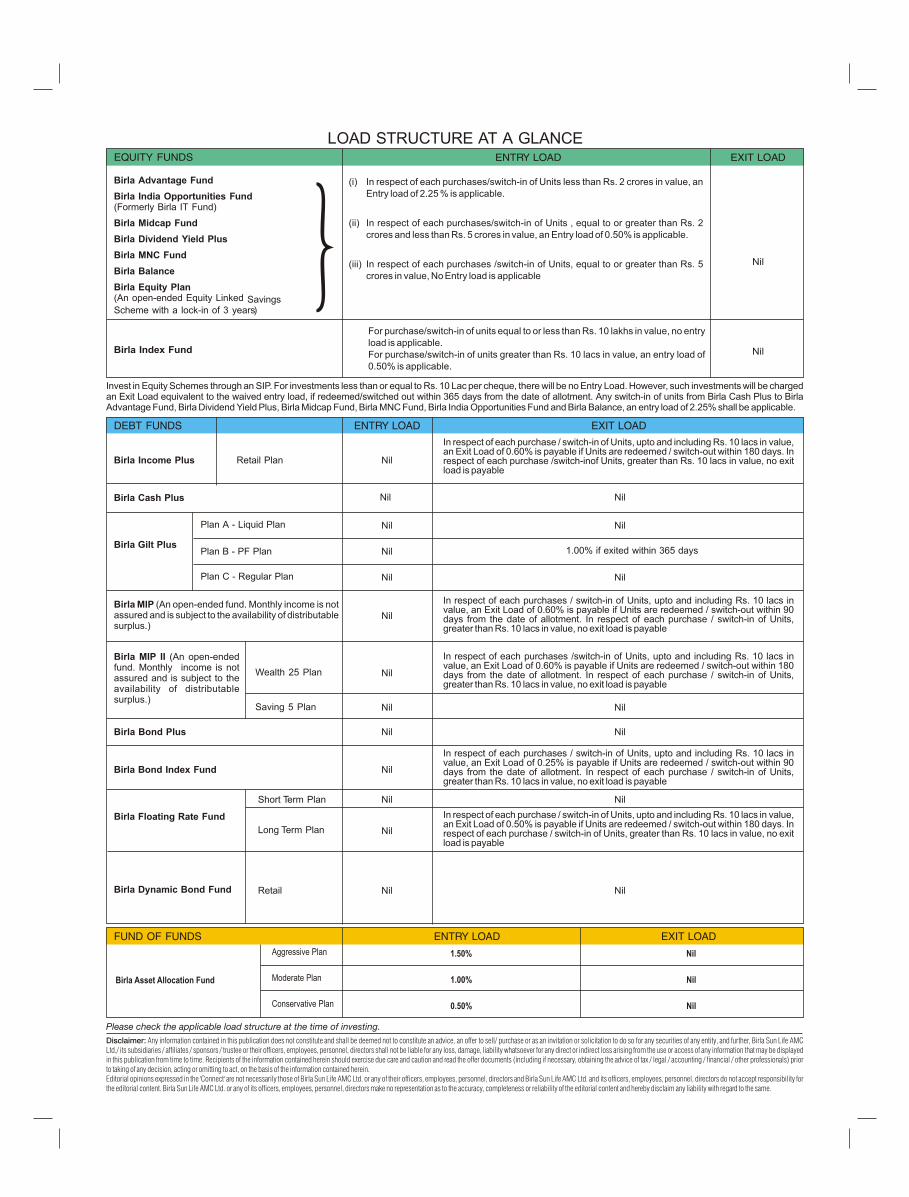
LOAD STRUCTURE AT A GLANCEEQUITY FUNDS ENTRY LOAD EXIT LOAD
(i) In respect of each purchases/switch-in of Units less than Rs. 2 crores in value, an Entry load of 2.25 % is applicable.
(ii) In respect of each purchases/switch-in of Units , equal to or greater than Rs. 2 crores and less than Rs. 5 crores in value, an Entry load of 0.50% is applicable.
(iii) In respect of each purchases /switch-in of Units, equal to or greater than Rs. 5 crores in value, No Entry load is applicable
Birla Index Fund
Birla Advantage Fund
Birla India Opportunities Fund(Formerly Birla IT Fund)
Birla Midcap Fund
Birla Dividend Yield Plus
Birla MNC Fund
Birla Balance
Birla Equity Plan(An open-ended Equity Linked Savings Scheme with a lock-in of 3 years)
Nil
DEBT FUNDS ENTRY LOAD EXIT LOAD
Birla Income Plus Retail Plan Nil
Nil
Nil
Nil
Nil
Nil
Birla Cash Plus
Birla MIP (An open-ended fund. Monthly income is not assured and is subject to the availability of distributable surplus.)
Birla Bond Plus
Birla Bond Index Fund
Birla Floating Rate Fund
Short Term Plan
Long Term Plan
Nil
Nil
Nil
Nil
Birla Gilt Plus
Plan A - Liquid Plan
Plan B - PF Plan
Plan C - Regular Plan
1.00% if exited within 365 days
Nil
In respect of each purchase / switch-in of Units, upto and including Rs. 10 lacs in value, an Exit Load of 0.60% is payable if Units are redeemed / switch-out within 180 days. In respect of each purchase /switch-inof Units, greater than Rs. 10 lacs in value, no exit load is payable
In respect of each purchases / switch-in of Units, upto and including Rs. 10 lacs in value, an Exit Load of 0.60% is payable if Units are redeemed / switch-out within 90 days from the date of allotment. In respect of each purchase / switch-in of Units, greater than Rs. 10 lacs in value, no exit load is payable
In respect of each purchase / switch-in of Units, upto and including Rs. 10 lacs in value, an Exit Load of 0.50% is payable if Units are redeemed / switch-out within 180 days. In respect of each purchase / switch-in of Units, greater than Rs. 10 lacs in value, no exit load is payable
Nil
Nil Nil
Nil
Nil
Nil
Birla MIP II (An open-ended fund. Monthly income is not assured and is subject to the availability of distributable surplus.)
Saving 5 Plan
Wealth 25 Plan
Please check the applicable load structure at the time of investing.
Disclaimer: Any information contained in this publication does not constitute and shall be deemed not to constitute an advice, an offer to sell/ purchase or as an invitation or solicitation to do so for any securities of any entity, and further, Birla Sun Life AMC Ltd./ its subsidiaries / affiliates / sponsors / trustee or their officers, employees, personnel, directors shall not be liable for any loss, damage, liability whatsoever for any direct or indirect loss arising from the use or access of any information that may be displayed in this publication from time to time. Recipients of the information contained herein should exercise due care and caution and read the offer documents (including if necessary, obtaining the advice of tax / legal / accounting / financial / other professionals) prior to taking of any decision, acting or omitting to act, on the basis of the information contained herein.Editorial opinions expressed in the 'Connect' are not necessarily those of Birla Sun Life AMC Ltd. or any of their officers, employees, personnel, directors and Birla Sun Life AMC Ltd. and its officers, employees, personnel, directors do not accept responsibility for the editorial content. Birla Sun Life AMC Ltd. or any of its officers, employees, personnel, directors make no representation as to the accuracy, completeness or reliability of the editorial content and hereby disclaim any liability with regard to the same.
Aggressive Plan
Moderate Plan
Conservative Plan
1.50%
1.00%
0.50%
Nil
Nil
Nil
FUND OF FUNDS ENTRY LOAD EXIT LOAD
Birla Asset Allocation Fund
Nil
In respect of each purchases /switch-in of Units, upto and including Rs. 10 lacs in value, an Exit Load of 0.60% is payable if Units are redeemed / switch-out within 180 days from the date of allotment. In respect of each purchase / switch-in of Units, greater than Rs. 10 lacs in value, no exit load is payable
In respect of each purchases / switch-in of Units, upto and including Rs. 10 lacs in value, an Exit Load of 0.25% is payable if Units are redeemed / switch-out within 90 days from the date of allotment. In respect of each purchase / switch-in of Units, greater than Rs. 10 lacs in value, no exit load is payable
Birla Dynamic Bond Fund Retail Nil
Nil
Nil
Invest in Equity Schemes through an SIP. For investments less than or equal to Rs. 10 Lac per cheque, there will be no Entry Load. However, such investments will be charged an Exit Load equivalent to the waived entry load, if redeemed/switched out within 365 days from the date of allotment. Any switch-in of units from Birla Cash Plus to Birla Advantage Fund, Birla Dividend Yield Plus, Birla Midcap Fund, Birla MNC Fund, Birla India Opportunities Fund and Birla Balance, an entry load of 2.25% shall be applicable.
For purchase/switch-in of units equal to or less than Rs. 10 lakhs in value, no entry load is applicable.For purchase/switch-in of units greater than Rs. 10 lacs in value, an entry load of 0.50% is applicable.
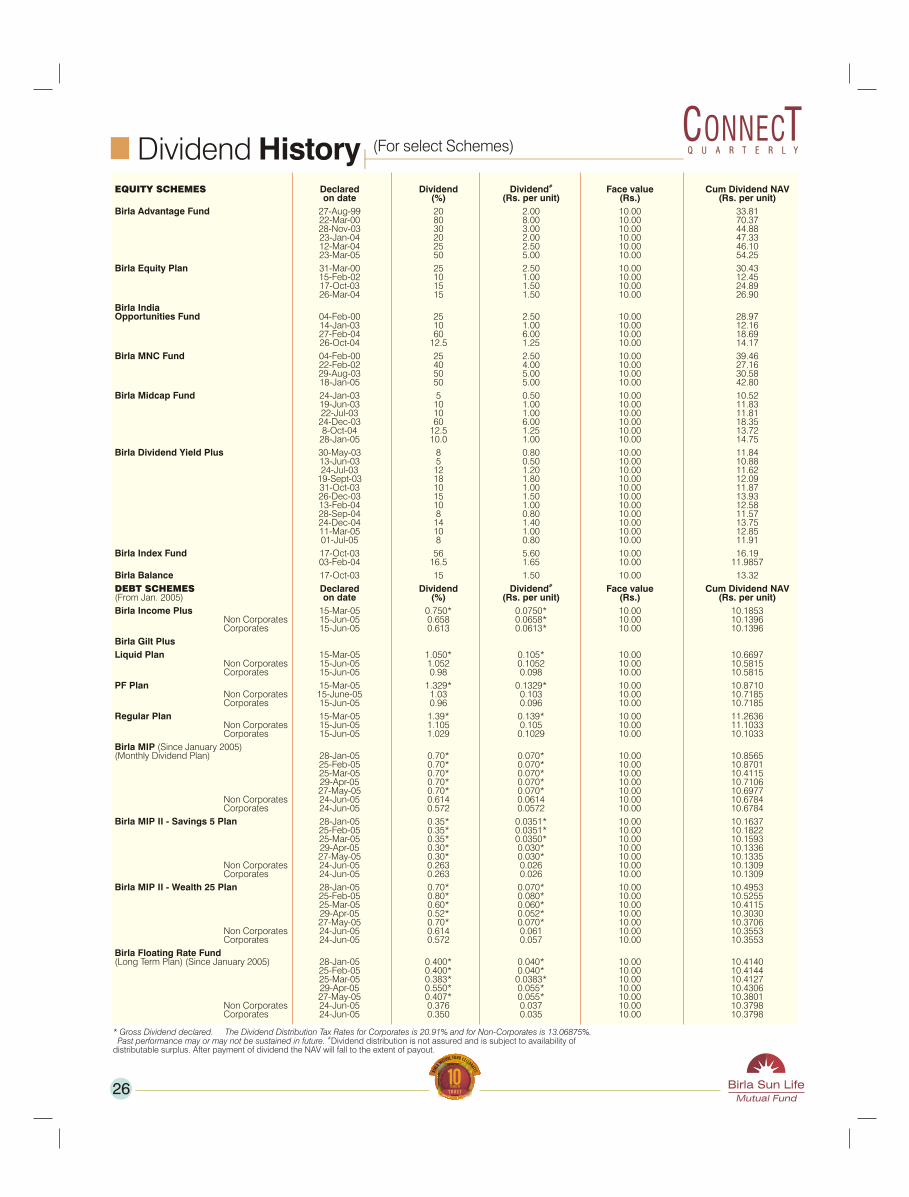
Dividend History#EQUITY SCHEMES Declared Dividend Dividend Face value Cum Dividend NAV
on date (%) (Rs. per unit) (Rs.) (Rs. per unit)
Birla Advantage Fund 27-Aug-99 20 2.00 10.00 33.8122-Mar-00 80 8.00 10.00 70.3728-Nov-03 30 3.00 10.00 44.8823-Jan-04 20 2.00 10.00 47.3312-Mar-04 25 2.50 10.00 46.1023-Mar-05 50 5.00 10.00 54.25
Birla Equity Plan 31-Mar-00 25 2.50 10.00 30.4315-Feb-02 10 1.00 10.00 12.4517-Oct-03 15 1.50 10.00 24.8926-Mar-04 15 1.50 10.00 26.90
Birla India Opportunities Fund 04-Feb-00 25 2.50 10.00 28.97
14-Jan-03 10 1.00 10.00 12.1627-Feb-04 60 6.00 10.00 18.6926-Oct-04 12.5 1.25 10.00 14.17
Birla MNC Fund 04-Feb-00 25 2.50 10.00 39.4622-Feb-02 40 4.00 10.00 27.1629-Aug-03 50 5.00 10.00 30.5818-Jan-05 50 5.00 10.00 42.80
Birla Midcap Fund 24-Jan-03 5 0.50 10.00 10.5219-Jun-03 10 1.00 10.00 11.8322-Jul-03 10 1.00 10.00 11.8124-Dec-03 60 6.00 10.00 18.358-Oct-04 12.5 1.25 10.00 13.72
28-Jan-05 10.0 1.00 10.00 14.75
Birla Dividend Yield Plus 30-May-03 8 0.80 10.00 11.8413-Jun-03 5 0.50 10.00 10.8824-Jul-03 12 1.20 10.00 11.62
19-Sept-03 18 1.80 10.00 12.0931-Oct-03 10 1.00 10.00 11.8726-Dec-03 15 1.50 10.00 13.9313-Feb-04 10 1.00 10.00 12.5828-Sep-04 8 0.80 10.00 11.5724-Dec-04 14 1.40 10.00 13.7511-Mar-05 10 1.00 10.00 12.8501-Jul-05 8 0.80 10.00 11.91
Birla Index Fund 17-Oct-03 56 5.60 10.00 16.1903-Feb-04 16.5 1.65 10.00 11.9857
Birla Balance 17-Oct-03 15 1.50 10.00 13.32#DEBT SCHEMES Declared Dividend Dividend Face value Cum Dividend NAV
(From Jan. 2005) on date (%) (Rs. per unit) (Rs.) (Rs. per unit)
Birla Income Plus 15-Mar-05 0.750* 0.0750* 10.00 10.1853 Non Corporates 15-Jun-05 0.658 0.0658* 10.00 10.1396 Corporates 15-Jun-05 0.613 0.0613* 10.00 10.1396
Birla Gilt Plus
Liquid Plan 15-Mar-05 1.050* 0.105* 10.00 10.6697 Non Corporates 15-Jun-05 1.052 0.1052 10.00 10.5815 Corporates 15-Jun-05 0.98 0.098 10.00 10.5815
PF Plan 15-Mar-05 1.329* 0.1329* 10.00 10.8710 Non Corporates 15-June-05 1.03 0.103 10.00 10.7185 Corporates 15-Jun-05 0.96 0.096 10.00 10.7185
Regular Plan 15-Mar-05 1.39* 0.139* 10.00 11.2636 Non Corporates 15-Jun-05 1.105 0.105 10.00 11.1033 Corporates 15-Jun-05 1.029 0.1029 10.00 10.1033
Birla MIP (Since January 2005)(Monthly Dividend Plan) 28-Jan-05 0.70* 0.070* 10.00 10.8565
25-Feb-05 0.70* 0.070* 10.00 10.870125-Mar-05 0.70* 0.070* 10.00 10.411529-Apr-05 0.70* 0.070* 10.00 10.710627-May-05 0.70* 0.070* 10.00 10.6977
Non Corporates 24-Jun-05 0.614 0.0614 10.00 10.6784 Corporates 24-Jun-05 0.572 0.0572 10.00 10.6784
Birla MIP II - Savings 5 Plan 28-Jan-05 0.35* 0.0351* 10.00 10.163725-Feb-05 0.35* 0.0351* 10.00 10.182225-Mar-05 0.35* 0.0350* 10.00 10.159329-Apr-05 0.30* 0.030* 10.00 10.133627-May-05 0.30* 0.030* 10.00 10.1335
Non Corporates 24-Jun-05 0.263 0.026 10.00 10.1309 Corporates 24-Jun-05 0.263 0.026 10.00 10.1309
Birla MIP II - Wealth 25 Plan 28-Jan-05 0.70* 0.070* 10.00 10.495325-Feb-05 0.80* 0.080* 10.00 10.525525-Mar-05 0.60* 0.060* 10.00 10.411529-Apr-05 0.52* 0.052* 10.00 10.303027-May-05 0.70* 0.070* 10.00 10.3706
Non Corporates 24-Jun-05 0.614 0.061 10.00 10.3553 Corporates 24-Jun-05 0.572 0.057 10.00 10.3553
Birla Floating Rate Fund(Long Term Plan) (Since January 2005) 28-Jan-05 0.400* 0.040* 10.00 10.4140
25-Feb-05 0.400* 0.040* 10.00 10.414425-Mar-05 0.383* 0.0383* 10.00 10.412729-Apr-05 0.550* 0.055* 10.00 10.430627-May-05 0.407* 0.055* 10.00 10.3801
Non Corporates 24-Jun-05 0.376 0.037 10.00 10.3798 Corporates 24-Jun-05 0.350 0.035 10.00 10.3798
(For select Schemes)
* Gross Dividend declared. The Dividend Distribution Tax Rates for Corporates is 20.91% and for Non-Corporates is 13.06875%.# Past performance may or may not be sustained in future. Dividend distribution is not assured and is subject to availability of
distributable surplus. After payment of dividend the NAV will fall to the extent of payout.
26
Q U A R T E R L YQ U A R T E R L Y
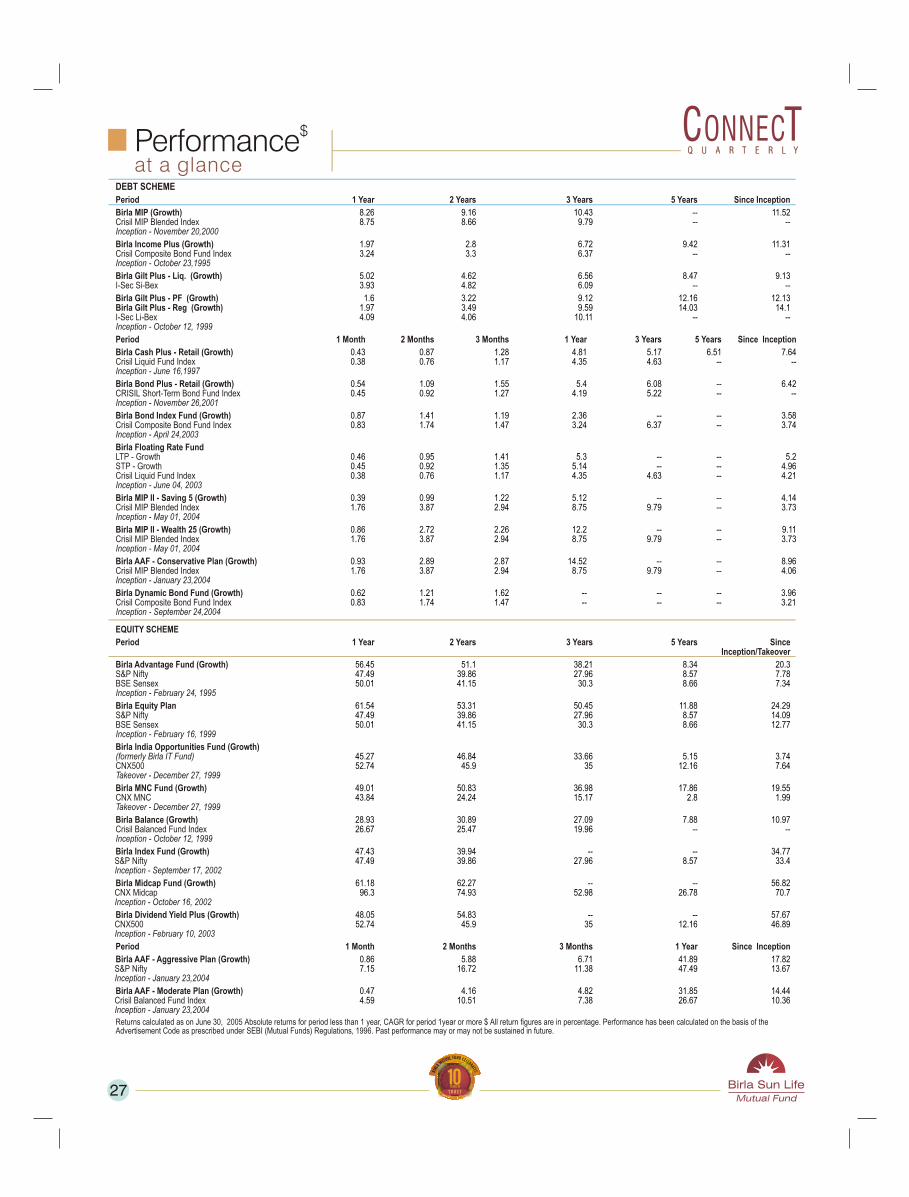
$Performanceat a glance
DEBT SCHEME
Period 1 Year 2 Years 3 Years 5 Years Since Inception
Birla MIP (Growth)Crisil MIP Blended IndexInception - November 20,2000
Birla Income Plus (Growth)Crisil Composite Bond Fund IndexInception - October 23,1995
Birla Gilt Plus - Liq. (Growth)I-Sec Si-Bex
Birla Gilt Plus - PF (Growth)Birla Gilt Plus - Reg (Growth)I-Sec Li-BexInception - October 12, 1999
Period 1 Month 2 Months 3 Months 1 Year 3 Years 5 Years Since Inception
Birla Cash Plus - Retail (Growth)Crisil Liquid Fund IndexInception - June 16,1997
Birla Bond Plus - Retail (Growth)CRISIL Short-Term Bond Fund Index Inception - November 26,2001
Birla Bond Index Fund (Growth)Crisil Composite Bond Fund Index Inception - April 24,2003
Birla Floating Rate Fund LTP - GrowthSTP - Growth Crisil Liquid Fund IndexInception - June 04, 2003
Birla MIP II - Saving 5 (Growth)Crisil MIP Blended IndexInception - May 01, 2004
Birla MIP II - Wealth 25 (Growth)Crisil MIP Blended IndexInception - May 01, 2004
Birla AAF - Conservative Plan (Growth)Crisil MIP Blended IndexInception - January 23,2004
Birla Dynamic Bond Fund (Growth)Crisil Composite Bond Fund IndexInception - September 24,2004
EQUITY SCHEME
Period 1 Year 2 Years 3 Years 5 Years SinceInception/Takeover
Birla Advantage Fund (Growth)S&P NiftyBSE SensexInception - February 24, 1995
Birla Equity PlanS&P NiftyBSE SensexInception - February 16, 1999
Birla India Opportunities Fund (Growth)(formerly Birla IT Fund)CNX500Takeover - December 27, 1999
Birla MNC Fund (Growth)CNX MNC Takeover - December 27, 1999
Birla Balance (Growth)Crisil Balanced Fund Index Inception - October 12, 1999
Birla Index Fund (Growth) S&P NiftyInception - September 17, 2002
Birla Midcap Fund (Growth)CNX Midcap Inception - October 16, 2002
Birla Dividend Yield Plus (Growth) CNX500Inception - February 10, 2003
Period 1 Month 2 Months 3 Months 1 Year Since Inception
Birla AAF - Aggressive Plan (Growth)S&P NiftyInception - January 23,2004
Birla AAF - Moderate Plan (Growth)Crisil Balanced Fund IndexInception - January 23,2004
Returns calculated as on June 30, 2005 Absolute returns for period less than 1 year, CAGR for period 1year or more $ All return figures are in percentage. Performance has been calculated on the basis of the Advertisement Code as prescribed under SEBI (Mutual Funds) Regulations, 1996. Past performance may or may not be sustained in future.
8.26 9.16 10.43 -- 11.528.75 8.66 9.79 -- --
1.97 2.8 6.72 9.42 11.313.24 3.3 6.37 -- --
5.02 4.62 6.56 8.47 9.133.93 4.82 6.09 -- --
1.6 3.22 9.12 12.16 12.131.97 3.49 9.59 14.03 14.14.09 4.06 10.11 -- --
0.43 0.87 1.28 4.81 5.17 6.51 7.640.38 0.76 1.17 4.35 4.63 -- --
0.54 1.09 1.55 5.4 6.08 -- 6.420.45 0.92 1.27 4.19 5.22 -- --
0.87 1.41 1.19 2.36 -- -- 3.580.83 1.74 1.47 3.24 6.37 -- 3.74
0.46 0.95 1.41 5.3 -- -- 5.20.45 0.92 1.35 5.14 -- -- 4.960.38 0.76 1.17 4.35 4.63 -- 4.21
0.39 0.99 1.22 5.12 -- -- 4.141.76 3.87 2.94 8.75 9.79 -- 3.73
0.86 2.72 2.26 12.2 -- -- 9.111.76 3.87 2.94 8.75 9.79 -- 3.73
0.93 2.89 2.87 14.52 -- -- 8.961.76 3.87 2.94 8.75 9.79 -- 4.06
0.62 1.21 1.62 -- -- -- 3.960.83 1.74 1.47 -- -- -- 3.21
56.45 51.1 38.21 8.34 20.347.49 39.86 27.96 8.57 7.7850.01 41.15 30.3 8.66 7.34
61.54 53.31 50.45 11.88 24.2947.49 39.86 27.96 8.57 14.0950.01 41.15 30.3 8.66 12.77
45.27 46.84 33.66 5.15 3.7452.74 45.9 35 12.16 7.64
49.01 50.83 36.98 17.86 19.5543.84 24.24 15.17 2.8 1.99
28.93 30.89 27.09 7.88 10.9726.67 25.47 19.96 -- --
47.43 39.94 -- -- 34.7747.49 39.86 27.96 8.57 33.4
61.18 62.27 -- -- 56.8296.3 74.93 52.98 26.78 70.7
48.05 54.83 -- -- 57.6752.74 45.9 35 12.16 46.89
0.86 5.88 6.71 41.89 17.827.15 16.72 11.38 47.49 13.67
0.47 4.16 4.82 31.85 14.444.59 10.51 7.38 26.67 10.36
27
Q U A R T E R L YQ U A R T E R L Y
The name inspires trust
For further details on our Fund, please contact our Customers Service Centres at details given below.
Prin
ted
in J
uly
2005
The Material provided in the Connect cannot be reproduced or quoted anywhere without express permission from Birla Sun Life Asset Management Company Ltd.
Constitution: Birla Mutual Fund (BMF), has been set up as a trust under the Indian Trust Act, 1882. Sponsors: Sun Life (India) AMC Investments Inc. and Birla Global Finance Ltd. (liability restricted to seed corpus of Rs. 1 lac) Trustee: Birla Sun Life Trustee Co. Pvt. Ltd. Investment Manager: Birla Sun Life Asset Management Company Ltd. Risk Factors: Mutual Funds and securities investments are subject to usual risks associated with capital and money market instruments. There can be no assurance that the funds objectives will be achieved. As with any investment in securities, the NAV of the units issued under the schemes can go up or down depending on the factors and forces affecting the securities markets. Past performance of BMF does not guarantee the future performance of the schemes of BMF and does not form a basis of comparison with other investments. The names of schemes do not in any manner indicate either the quality of the schemes, their future prospects or returns. Scheme Objective: Birla Advantage Fund: An Open-ended Growth Scheme to achieve long-term growth of capital at relatively moderate levels of risk through a diversified research based investment approach. Birla Equity Plan: An Open-ended Equity Linked Savings Scheme to achieve long-term growth of capital along with income tax relief for investment. Birla India Opportunities Fund: An Open-ended Growth Scheme to achieve superior long-term growth of capital by investing in shares of companies that do one or more of the following: Leverage India's intellectual capital for providing services, research and creative inputs; Seek to use current and impending changes in patent laws / import tariffs / quotas to supply goods and services; Leverage India's lower labour costs for providing services and manufactured goods; Leverage India's large population of English speaking people for providing services. Birla MNC Fund: An Open-ended Growth Scheme to achieve long-term growth of capital at relatively moderate levels of risk by making investments in securities of multi-national companies through a research based investment approach. Birla Midcap Fund: An Open-ended Growth Scheme to achieve long-term growth of capital at controlled level of risk by primarily investing in Midcap stocks. Birla Index Fund: An Open-ended Index-Linked Scheme to generate returns commensurate with the performance of Nifty subject to tracking errors. Birla Dividend Yield Plus: An Open-ended Growth Scheme to provide capital growth and income by investing primarily in a well diversified portfolio of dividend paying companies that have a relatively high dividend yield. Birla Balance: An Open-ended Balanced Scheme with an objective to balance income requirements with long-term growth of capital at relatively moderate levels of risks through a diversified research based investment approach. Birla Bond Index Fund: An Open-ended Income Scheme tracking the CRISIL Composite Bond Fund Index. Birla Income Plus: An Open-ended Income Scheme to generate consistent income through superior yields on its investments at moderate levels of risk through a diversified investment approach. Birla Gilt Plus: An Open-ended Government Securities Scheme to generate income and capital appreciation through investments exclusively in Government Securities. Birla MIP: An Open-ended Fund to generate regular income so as to make monthly distribution to unit holders with the secondary objective being growth of capital. Monthly Income is not assured and is subject to availability of distributable surplus. Birla MIP II: An Open-ended Fund to generate regular income so as to make monthly payment or distribution to unit holders with the secondary objective being growth of capital. Monthly Income is not assured and is subject to availability of distributable surplus. Birla Dynamic Bond Fund: An Open-ended Income Scheme to generate optimal returns with high liquidity through active management of the portfolio by investing in High Quality Debt and Money Market Instruments.Birla Floating Rate Fund: An Open-ended Income Scheme to generate regular income through investment in a portfolio comprising substantially of floating rate debt / money market instruments. Birla Bond Plus: An Open-ended Short Term Income Scheme to generate regular returns through investments in debt and money market securities. Birla Cash Plus: An Open-ended Liquid Scheme to provide reasonable returns at a high level of safety and liquidity through judicious investments in high quality debt and money market instruments. Birla Asset Allocation Fund: An Open-ended Fund of Funds Scheme to provide income and capital appreciation along with diversification by investing in a basket of debt and equity Mutual Fund schemes in line with the risk profile of the investor. Birla Fixed Maturity Plan: An open-ended scheme with an objective to generate regular income through investments in a portfolio of fixed income securities normally maturing in line with the time profile of the plan. The fixed maturity plans may not be able to generate similar returns as compared to the debt instruments with similar maturity. India Advantage Fund and Excel India Fund: Funds designed to seek long-term appreciation through investment primarily in equity related securities of companies in India that are run by efficient management, have a sustainable and robust business model and are available at reasonable valuations. Liquidity: The schemes offer NAVs, subscription and redemptions on all business days. For all schemes please check applicable load structure before investing. For details and scheme specific risk factors read offer documents and refer to your financial advisor before investing.
BIRLA SUN LIFE AMC LTD.: BRANCHES - OFFICIAL POINTS OF ACCEPTANCE OF APPLICATIONS : AHMEDABAD: 079-640 3553 /48; BANGALORE: 080-2238 9991/2/3; CHENNAI: 044- 5204 5003 /2819 1681; KOLKATA: 033-2288 2595/288 2592/94; MUMBAI (Head Office): 022 - 5692 8000; MUMBAI (SALES Office): 022 - 5637 9999; NEW DELHI: 011-2335 8636 -2332 0831/3364; PUNE: 020-56011865 /66 /67; SECUNDARABAD: 040- 2772 1818 /5531 1052/3580. OTHER BRANCHES: BARODA: 0265- 558 2984 / 2986; BHUBANESHWAR: 0674-253 5521/3413; CHANDIGARH: 0172-274 9172/73; COCHIN: 0484-238 3969 /236 6817; COIMBATORE: 0422 - 535 0262 / 64; GOA: 0832-243 7628/29; GUWAHATI: 0361-259 8273 /259 5020; INDORE: 0731-504 6789/0496,253 4502; JAIPUR: 0141-2372935 /2367882; KANPUR: 0512-233 1116 /1121; LUCKNOW: 0522- 229 4110; LUDHIANA: 0161-508 8847/277 1217; PATNA: 0612-220 7022/7023 / 3090873; SURAT: 0261- 558 1707/ 1708. OTHER OFFICIAL POINTS OF ACCEPTANCE OF APPLICATIONS - CAMS: Agra: 0562-252 1812; Ahmedabad: 079 -2642 4940 / 2646 4929; Allahabad: 0532 – 260 1602; Amritsar: 0183 – 221 1194; Bangalore: 080 -2225 9491 / 2220 3157; Belgaum: 0831-2425 305; Bhilai: 0788 -505 0568; Bhopal: 0755 – 528 5266; Bhubaneswar: 0674-253 4909 / 253 5395; Calicut: 0495 - 2723175; Chandigarh: 0172– 2706 651/ 2711 325; Chennai: 044 - 2855 9950; Coimbatore: 0422- 252 5353 / 252 0817; Dehradun: 0135 - 271 3233; Durgapur: 0343 -254 8190; Goa: 0832 –242 4527/ 564 1070; Guwahati: 0361-2607771; Hubli: 0836- 2358688; Indore: 0731-252 8609 / 252 9261; Jaipur: 141-222-0948 / 0141-222-0951; Jalandhar: 0181-2456336; Jamnagar: 0288 - 255 8467; Jamshedpur: 0657 – 310 5930; Jodhpur: 0291-309 2892 / 262 8039; Kanpur: 0512-230 6668 / 230 6685; Kochi: 0484– 238 0443; Kolkata: 033- 22171474 / 22171475; Lucknow: 0522–237309; Ludhiana: 0161-501 7502 / 241 0279; Madurai: 0452 - 2622 682; Mangalore: 0824- 243 6567/ 525 2525; Manipal: 0820 -257 3333; Moradabad: 0591-3092844; Mumbai: 022 - 22702414 / 22702415 / 22702416; Mysore: 0821- 309 1244 / 234 2182; Nagpur: 0712-253 2447/ 253 7321; Nasik: 0253 - 257 7449; New Delhi: 011- 2335 3832/33; Patiala: 0175-2229633 / 3093724; Patna: 0612-2322 206; Pondicherry: 0413 -5210030/ 3092468; Pune: 020 – 2545 9439 / 2545 9440; Raipur: 0771 – 309 0830; Rajahmundry: 02883 - 5565531; Rajkot: 0281- 2241 399; Ranchi: 0651-3095122; Salem: 0427-244 6338; Secundarabad: 040 - 5532 1531 / 5532 1532; Siliguri: 0353-2216065; Surat: 0261– 246 4887 / 246 4679; Trichur: 0487-2420646; Trichy: 0431 - 274 1717; Trivandrum: 0471- 272 4687; Udaipur: 0294 -3091722; Vadodara: 0265- 222 5146 / 236 2412; Valsad: 02632-249 957; Varanasi: 0542–220 8546 / 311 3810; Vijaywada: 0866 – 559 5657; Visakhapatnam: 0891–2598 875 / 2540 175.
Book-Post
If undelivered, please return to :
Birla Sun Life Asset Management Company LimitedAhura Centre, 2nd Floor, Tower A, 96/A-D, Mahakali Caves Road, Andheri (East), Mumbai 400 093.
An ISO 9001:2000 Certified Company
ISO 9001:2000
REGISTEREDFIRM