naval postgraduate school · naval postgraduate school ... important because budget planners and...
TRANSCRIPT

NAVAL
POSTGRADUATE
SCHOOL
MONTEREY, CALIFORNIA
THESIS
Approved for public release; distribution is unlimited
A MARKOV MODEL FOR FORECASTING INVENTORY
LEVELS FOR U.S NAVY MEDICAL SERVICE CORPS
HEALTHCARE ADMINISTRATORS
by
Sobondo Josiah
March 2014
Thesis Co-Advisors: Chad W. Seagren
William Hatch

THIS PAGE INTENTIONALLY LEFT BLANK

i
REPORT DOCUMENTATION PAGE Form Approved OMB No. 0704-0188 Public reporting burden for this collection of information is estimated to average 1 hour per response, including the time for reviewing instruction,
searching existing data sources, gathering and maintaining the data needed, and completing and reviewing the collection of information. Send
comments regarding this burden estimate or any other aspect of this collection of information, including suggestions for reducing this burden, to Washington headquarters Services, Directorate for Information Operations and Reports, 1215 Jefferson Davis Highway, Suite 1204, Arlington, VA
22202-4302, and to the Office of Management and Budget, Paperwork Reduction Project (0704-0188) Washington DC 20503.
1. AGENCY USE ONLY (Leave blank)
2. REPORT DATE March 2014
3. REPORT TYPE AND DATES COVERED Master’s Thesis
4. TITLE AND SUBTITLE
A MARKOV MODEL FOR FORECASTING INVENTORY LEVELS FOR U.S
NAVY MEDICAL SERVICE CORPS HEALTHCARE ADMINISTRATORS
5. FUNDING NUMBERS
6. AUTHOR(S) Sobondo Josiah
7. PERFORMING ORGANIZATION NAME(S) AND ADDRESS(ES)
Naval Postgraduate School
Monterey, CA 93943-5000
8. PERFORMING ORGANIZATION
REPORT NUMBER
9. SPONSORING /MONITORING AGENCY NAME(S) AND ADDRESS(ES)
N/A
10. SPONSORING/MONITORING
AGENCY REPORT NUMBER
11. SUPPLEMENTARY NOTES The views expressed in this thesis are those of the author and do not reflect the official policy
or position of the Department of Defense or the U.S. Government. IRB protocol number: N/A
12a. DISTRIBUTION / AVAILABILITY STATEMENT Approved for public release; distribution is unlimited
12b. DISTRIBUTION CODE A
13. ABSTRACT (maximum 200 words)
The United States Navy Medical Service Corps is a diverse group of healthcare professionals that functions as a
support community, providing administrative and clinical services as an integral part of Navy Medicine. There are
currently more than 3,000 active and reserve Medical Service Corps officers serving around the globe, approximately
40 percent of whom are healthcare administrators.
This thesis develops a Markov model to estimate the number of HCA accessions necessary to meet
inventory requirements from FY14 to FY18. The general HCA model validation and analysis show that aggregate
annual transition rates pass the stationary assumption required of Markov models. Models the study develops for
some subspecialties perform better than others and are consistent and accurate. Consistency and accuracy are
important because budget planners and recruiting command rely on manpower estimates during the fiscal year.
These results suggest that the Markov model is a useful tool for HCA community managers to forecast
inventory levels across rank and subspecialties, and is effective for determining force structure.
Determining the end strength of HCA officers is an important part of the accession planning process for
manpower planners to balance the force structure to effectively minimize deviation from target inventory levels that
impact training and labor costs, as well as to manage career progression.
14. SUBJECT TERMS Manpower Planning, Markov Model, Manpower Forecasting, Transition
Probabilities, Navy Medical Service Corps, Healthcare Administrators 15. NUMBER OF
PAGES 73
16. PRICE CODE
17. SECURITY
CLASSIFICATION OF
REPORT Unclassified
18. SECURITY
CLASSIFICATION OF THIS
PAGE
Unclassified
19. SECURITY
CLASSIFICATION OF
ABSTRACT
Unclassified
20. LIMITATION OF
ABSTRACT
UL
NSN 7540-01-280-5500 Standard Form 298 (Rev. 2-89)
Prescribed by ANSI Std. 239-18

ii
THIS PAGE INTENTIONALLY LEFT BLANK

iii
Approved for public release; distribution is unlimited
A MARKOV MODEL FOR FORECASTING INVENTORY LEVELS FOR U.S
NAVY MEDICAL SERVICE CORPS HEALTHCARE ADMINISTRATORS
Sobondo Josiah
Lieutenant, United States Navy
B.A., Brown University, 2007
Submitted in partial fulfillment of the
requirements for the degree of
MASTER OF SCIENCE IN MANAGEMENT
from the
NAVAL POSTGRADUATE SCHOOL
March 2014
Author: Sobondo Josiah
Approved by: Chad W. Seagren
Thesis Co-Advisor
William Hatch
Co-Advisor
Bill Gates
Dean, Graduate School of Business and Public Policy

iv
THIS PAGE INTENTIONALLY LEFT BLANK
v
ABSTRACT
The United States Navy Medical Service Corps is a diverse group of healthcare
professionals that functions as a support community, providing administrative and
clinical services as an integral part of Navy Medicine. There are currently more than
3,000 active and reserve Medical Service Corps officers serving around the globe,
approximately 40 percent of whom are healthcare administrators.
This thesis develops a Markov model to estimate the number of HCA accessions
necessary to meet inventory requirements from FY14 to FY18. The general HCA model
validation and analysis show that aggregate annual transition rates pass the stationary
assumption required of Markov models. Models the study develops for some
subspecialties perform better than others and are consistent and accurate. Consistency and
accuracy are important because budget planners and recruiting command rely on
manpower estimates during the fiscal year.
These results suggest that the Markov model is a useful tool for HCA community
managers to forecast inventory levels across rank and subspecialties, and is effective for
determining force structure.
Determining the end strength of HCA officers is an important part of the
accession planning process for manpower planners to balance the force structure to
effectively minimize deviation from target inventory levels that impact training and labor
costs, as well as to manage career progression.

vi
THIS PAGE INTENTIONALLY LEFT BLANK

vii
TABLE OF CONTENTS
I. INTRODUCTION........................................................................................................1 A. OBJECTIVES/PURPOSE ..............................................................................1 B. BACKGROUND ..............................................................................................1
1. United States Navy Medical Service Corps .......................................3
2. Navy Manpower Requirements and Authorizations Process ..........5 3. Accession Planning...............................................................................6 4. Officer Promotions...............................................................................8
C. MSC ACCESSIONS ........................................................................................9 1. In-Service Procurement Program ....................................................10
2. Health Services Collegiate Program.................................................10
3. Health Professions Scholarship Program ........................................11
4. Direct Accession .................................................................................11 D. CURRENT FORCE PLANNING TOOLS ..................................................11
E. SCOPE AND METHODOLOGY ................................................................11 F. ORGANIZATION OF STUDY ....................................................................12
II. LITERATURE REVIEW .........................................................................................13 A. OVERVIEW ...................................................................................................13 B. BARTHOLOMEW, FORBES, AND MCCLEAN ......................................13
C. OTHER CIVILIAN STUDIES .....................................................................14 D. ACCESSION AND ATTRITION BEHAVIOR PATTERNS....................15
E. MILITARY APPLICATIONS OF MARKOV MODELS .........................16 1. Uncertainty in Personnel Force Modeling .......................................16
2. Steady-State Analysis and Logistic Regression ...............................17 3. Survival Analysis ................................................................................20
F. CHAPTER SUMMARY ................................................................................21
III. DATA AND METHODOLOGY ..............................................................................23 A. INTRODUCTION..........................................................................................23
B. DATA SOURCES ..........................................................................................23 1. Descriptive Variables .........................................................................23
a. Social Security Number ..........................................................23 b. Rank .........................................................................................24 c. Sub-specialty Codes.................................................................24
2. Descriptive Statistics ..........................................................................24 C. MARKOV MODEL THEORY ....................................................................25
1. Markov Model Formulation .............................................................25 a. Basic Markov Model Assumptions .........................................25
D. METHODOLOGY ........................................................................................26 1. Conceptual Model ..............................................................................26 2. Fixed Inventory and Fixed Recruiting Models ...............................29
a. Equation ..................................................................................29 b. Analysis....................................................................................29

viii
3. Fundamental Matrix ..........................................................................30
E. CHAPTER SUMMARY ................................................................................31
IV. MODEL IMPLEMENTATION AND VALIDATION ..........................................33
A. STOCK FORECAST .....................................................................................33 B. FUNDAMENTAL MATRIX ........................................................................37 C. MODEL VALIDATION ...............................................................................38
1. Measure of Effectiveness—Percentage of Satisfactory
Estimates .............................................................................................40
D. LIMITATIONS ..............................................................................................41
V. SUMMARY, CONCLUSIONS AND RECOMMENDATIONS ...........................43 A. SUMMARY ....................................................................................................43 B. CONCLUSIONS AND RECOMMENDATIONS .......................................43
a. Conclusion ...............................................................................43 b. Recommendation .....................................................................44
c. Conclusion ...............................................................................44 d. Recommendation .....................................................................44
C. FURTHER RESEARCH ...............................................................................45
VI. APPENDIX. FIXED INVENTORY MODEL FOR ALL SUBSPECIALTY
CODES (TABLES 15 – 24) .......................................................................................47
LIST OF REFERENCES ......................................................................................................51
INITIAL DISTRIBUTION LIST .........................................................................................55

ix
LIST OF FIGURES
Figure 1. Navy Manpower Manning Process (from Hatch, 2013) ....................................7 Figure 2. Observations by Rank ......................................................................................24 Figure 3. Observations by Subspecialty Codes ...............................................................25 Figure 4. Truncated conceptual model (transition probabilities suppressed for
clarity) ..............................................................................................................27
Figure 5. General HCA (1800) Inventory Forecast by Rank and FYs for FY14 to
FY18 ................................................................................................................35 Figure 6. Patient Administration (1801) Inventory Forecast by Rank and FYs for
FY14 and FY18................................................................................................36 Figure 7. Manpower (3130) Inventory Forecast by Rank and FYs for FY14 and
FY18 ................................................................................................................36
Figure 8. Estimated Transition Probabilities for 70% Confidence Interval for O-
4/1800 continuing as O-4/1800 ........................................................................39 Figure 9. Subspecialty 1800 Overall Model Satisfactory Validation by Year, FY11
through FY13 ...................................................................................................40 Figure 10. Subspecialty 1800 Overall Model Satisfactory Validation by Year, FY12
to FY13 ............................................................................................................41

x
THIS PAGE INTENTIONALLY LEFT BLANK

xi
LIST OF TABLES
Table 1. MSC Subspecialties and Inventory, September 2013 ( after BUMED MSC
report, 2013) .......................................................................................................4 Table 2. MSC Report as of 30 September 2013 (from BUMED MSC report, 2013)......5 Table 3. Promotion Flow Points (after Rostker et al., 1993) ...........................................8 Table 4. FY2013 & FY2012 MSC HCA Accessioning Source Percentages (after
BUMED MSC report, 2013) ............................................................................10 Table 5. Aggregated Flows from FY10 through FY13 ..................................................28 Table 6. Aggregated Transition Probabilities Matrix P for FY10 through FY13 ..........28 Table 7. Aggregate Accession Vector r for FY10 through FY13 .................................33 Table 8. Aggregate R for FY14 through FY18 ..............................................................33
Table 9. Aggregate Inventory Forecast (Fixed Inventory Model) for FY13 to FY18 ...34
Table 10. Aggregate Inventory Forecast (Fixed Recruiting Model) for FY13 to FY18 ..34 Table 11. Fundamental Matrix .........................................................................................37 Table 12. Conditional Probabilities of Attaining Given States ........................................37
Table 13. Summary of Fundamental Matrix and Conditional Probabilities, FY14 and
FY18 ................................................................................................................38
Table 14. Model Satisfactory Validation for Each Subspecialty by Year .......................41 Table 15. 1800 Inventory Forecast for FY13 to FY18 ....................................................47 Table 16. 1801 Inventory Forecast for FY13 to FY18 ....................................................47
Table 17. 1802 & 3121 Inventory Forecast for FY13 to FY18 .......................................47 Table 18. 1803 & 6201 Inventory Forecast for FY13 to FY18 .......................................48
Table 19. 1804 Inventory Forecast for FY13 to FY18 ....................................................48 Table 20. 1805 Inventory Forecast for FY13 to FY18 ....................................................48
Table 21. 3110-3112 Inventory Forecast for FY13 to FY18 ...........................................49 Table 22. 3130 Inventory Forecast for FY13 to FY18 ....................................................49
Table 23. 3150 Inventory Forecast for FY13 to FY18 ....................................................49 Table 24. 3211 Inventory Forecast for FY13 to FY18 ....................................................49

xii
THIS PAGE INTENTIONALLY LEFT BLANK

xiii
LIST OF ACRONYMS AND ABBREVIATIONS
AC active component
AMD Activity Manpower Document
BA Billets Authorized
BSO Budget Submitting Office
BUMIS Bureau of Medicine Manpower Information System
CNA Center of Naval Analysis
CCP Clinical Care Providers
CNP/PERS-2 Chief of Naval Personnel
DMDC Defense Manpower Data Center
DP Direct Procurement
DOPMA Defense Officer Personnel Management Act
FY Fiscal Year
FYDP Future Year Defense Plan
HCA Healthcare Administration
HCS Healthcare Sciences
HSCP Health Professions Scholarship Program
IPP In-Service Procurement Program
IST Inter-Service Transfers
MedMACRE Medical Manpower All Corps Requirements Estimator
MSC Medical Service Corps
MFT Mission, Functions and Tasks
NAVMAC Navy Manpower Analysis Center
NPC Navy Personnel Command
NC Nurse Corps
OCM Officer Community Managers
POE Projected Operational Environment
POMI Plans Operations Medical Intelligence
RC Reserve Component
ROC Required Operational Capabilities
SSN Social Security Number

xiv
THIS PAGE INTENTIONALLY LEFT BLANK

xv
ACKNOWLEDGMENTS
I want to express my profound gratitude and deep regard to my advisors, Chad
Seagren and William Hatch, for their exemplary guidance, dedication and constant
mentoring throughout the course of this thesis. Their insight into the world of manpower
planning, and the instruction they provided shall carry me a long way in the journey of
life.
I would also like to express a deep sense of gratitude to Erich Dietrich for his
cordial support, valuable information and guidance, which helped me complete this task.
Your willingness to answer e-mails, phone calls, and requests for data are much
appreciated and duly noted.
Finally, I want to thank my daughter, Jamir, who without knowing it, provided the
inspiration to complete this thesis; and my caring, loving, and supportive parents, Louise
and Joseph, for their prayers, support, and encouragement throughout this process and
when times got rough.

xvi
THIS PAGE INTENTIONALLY LEFT BLANK

1
I. INTRODUCTION
A. OBJECTIVES/PURPOSE
During the past few years, the Medical Service Corps (MSC) has undergone
myriad changes. Most challenging to the MSC Healthcare Administration (HCA)
community is the pressure to reduce end-strength, while the Navy tasks manpower
planners with designing an appropriate force structure to support the fleet based on
unclear future mission requirements. While the MSC currently utilizes the operationally
focused Medical Manpower All Corps Requirements Estimator (MedMACRE)
manpower planning tool to ensure that they can support operational and wartime
requirements, it does not focus on peacetime requirements. The evolving process of
personnel planning has to ensure that the proper number and mix of MSC officers are
available. It is therefore imperative to examine the current state of personnel planning in
the HCA community, and determine its most robust force structure.
This thesis evaluates the effectiveness of a Markov model to create a five-year
forecast of MSC HCA inventory levels by rank and subspecialties. We employ the model
to determine the number of HCA accessions required to meet inventory requirements
over the next five years, to include classification targets for each subspecialty.
Furthermore, this thesis examines current business practices used for personnel planning
and forecasting in the MSC to meet its readiness and peacetime missions.
B. BACKGROUND
In recent years, the Navy has experienced a decrease in accession and retention of
the MSC mainly due to the challenges of sequestration, the Navy’s changing mission, and
continued downsizing. In his 2011 Admiral’s call, former Navy Surgeon General Vice
Admiral Adam M. Robinson, Jr., stated
I recently spoke at Navy Medicine’s annual Leadership Symposium. This
year’s theme was “Total Force - Focusing on the Future.” The
Symposium’s objectives are worth repeating because they really should be
our focus as well in how we build our future force in the coming years: 1)
Improve our readiness to fully support current and future operations; 2)

2
attain agility in how we lead, how we communicate, and how we support
our diverse staff; 3) strengthen our delivery of primary care; and 4) adapt
to the changing environmental healthcare needs of our population…Over a
year ago, we began an Enterprise-wide assessment of the size, specialty
levels, and distribution of our Total Force billet requirements and
personnel inventories. This yielded the development of several assessment
tools. MedMACRE provides an analytical defense for sizing our force,
especially for less than full mobilization scenarios and issues relating to
Force Specialty Mix. Demand Based Staffing Tool is a regional and
command level management tool that takes inputs from MedMACRE to
help create uniform requirements. Fit-to-Fill Assessments help identify
who is doing the work and where the work is being done. Lastly, Total
Force Assessments provide more transparent assessments of force mix,
distribution, and Military Training Facility workload, and are used in
partnership with the Bureau of Medicine and Surgery, Regions, and
Commands. Our Total Force Concept is about standardizing how we
allocate, recruit, retain, educate, train and incentivize the right work force
for the right mission across the Enterprise in order to eliminate gaps and
overlaps, increase efficiencies through resource sharing, and integrate
learning strategies. (Robinson, 2011, p. 4).
The MSC actively supports the Navy and Marine Corps team and Navy
Medicine’s readiness and health benefits missions with a community of active component
(AC) and reserve component (RC) professionals. Health care accessions and recruiting
remain a top priority, despite some critical wartime specialty shortages. At the end of
Fiscal Years (FY) 2011 and 2012, AC Medical Service Corps manning was 97 percent of
authorized levels and decreased to 95 percent in FY13 (Nathan, 2012).
Of the 10 HCA subspecialties examined, a staffing shortage exists for the patient
administration specialty, manned at 45 percent, and education and training management,
at 30 percent. This shortage is due to increased requirements and billet growth during the
past three years. The Navy anticipates that these specialties will be fully manned by the
end of FY2014 through increased accessions and incentive programs. Improvements in
special pays have mitigated manning shortfalls; however, it will take several years until
Navy Medicine is fully manned in several critical areas.

3
1. United States Navy Medical Service Corps
The United States Navy MSC is a diverse group of healthcare professionals that
functions as a support community, providing administrative and clinical services as an
integral part of Navy Medicine. Founded on 4 August 1947 with the passing of the Army-
Navy Medical Service Corps Act, the MSC was originally called the Navy Hospital
Corps in World War I (“Medical Service Corps,” 2013). The MSC originally had four
specialties: Supply and Administration, Medical Allied Sciences, Optometry, and
Pharmacy. Today, the MSC comprises 31 subspecialties, organized under three major
categories: Healthcare Administrators (HCA), Clinical Care Providers (CCP), and
Healthcare Sciences (HCS). The HCA category further subdivides into ten subspecialties:
General HCA, Patient Administration, Material Logistics Management, Health Facility
Planning and Project, Plans Operations Medical Intelligence (POMI), Manpower and
Personnel Management, Financial Management, Education and Training, Operations
Research and Information Systems Management.
There are currently more than 3,000 active and reserve MSC officers serving
around the globe, while the Navy HCA makes up approximately 40 percent of the MSCs.
MSC officers come from varying educational backgrounds, and specialize in an array of
fields to provide quality healthcare in support of Navy Medicine’s primary mission of
readiness and provision of healthcare benefits. They are entrusted with significant
responsibilities that determine the direction of healthcare for U.S. service members and
their families, ranging from managing the Navy healthcare system to providing direct
patient care. With strong operational presence at sea and ashore, MSC officers serve in a
variety of locations and situations, including deployments and humanitarian missions,
aircraft carriers, joint commands, Navy hospitals and clinics worldwide. They also
provide combat support to put Marines into the fight where they are needed.
To better understand the breakdown of the MSC subspecialties and differences in
manning and inventory levels, Tables 1 and 2 illustrate the MSC manpower inventory.
The inventory of MSC officers as of 30 September 2013 was 2,690, with 987 of them
being HCAs. During this period, there were 2,796 total MSC billets authorized (BA),
which put the overall MSC at 95% manning level further detailed in Table 2 by manning

4
levels, inventories, and billets authorized by specialty for MSC officers. This research
focuses on the HCA community as the subject of this study due to the homogeneous
nature of the ten subspecialties and the fact that they make up a high proportion of the
MSC.
Table 1. MSC Subspecialties and Inventory, September 2013
( after BUMED MSC report, 2013)
Health Care Admin Health Care Science Clinical Care Provider
Subspecialty Total Inv Inv % Subspecialty Total Inv Inv % Subspecialty Total Inv Inv %
Gen. Health Care Admin 603 61% Biochemistry 38 6% Clinical Psych 179 17%
Patient Admin 31 3% Microbiology 52 8% Audiology 29 3%
Mat'l Logist Mgt 63 6% Radiation Health 97 14% Social Work 71 7%
Info Systems 33 3% Physiology 16 2% Physical Therapy 118 11%
Hlth Fac Pln & Proj 15 2% Aerospace Physio 98 15% Occupational Therapy 38 4%
Plans/Ops/Med Int 117 12% Aerosp Exper Psych 30 4% Clinical Dietetics 26 3%
Financial Mgt 78 8% Research Psych 17 3% Optometry 109 11%
MPT&E 31 3% Entomology 39 6% Pharmacy, General 136 13%
Educ & Trng Mgt 7 1% Environmental Health 96 14% Podiatry 26 3%
Operation Research 9 1% Industrial Hygiene 112 17% Physician Assistant 300 29%
Medical Technology 76 11%
Total 987 100% 671 100% 1,032 100%

5
Table 2. MSC Report as of 30 September 2013 (from BUMED MSC report, 2013)
2. Navy Manpower Requirements and Authorizations Process
Understanding the manpower requirements and authorization processes is
essential to examining MSC requirements. There are several important sub-processes by
which the Navy executes manpower policy. Navy manpower requirements originate in
the National Security Strategy (Hatch, 2013). The goal of manpower requirements is to
establish the quantitative and qualitative military and civilian manpower necessary to
execute missions assigned to ships, aircraft squadrons, and shore establishments that
support deploying forces. The resource sponsor is tasked with identifying the aggregation
of resources and desired level of manpower authorizations required to support the
assigned missions and support functions. This request is submitted to Congress for

6
approval as part of the budget and Military Personnel Navy (MPN) end strength request.
Manpower authorization represents manpower requirements supported by approved
funding and end strength for the current fiscal year and programmed through the Future
Year Defense Plan (FYDP). Manpower authorizations are programmed in the Planning,
Programming and Budget Execution System (PPBES) cycle, which are then submitted as
part of the president’s budget. The approved manpower authorization level or end
strength is then sent back to the resource sponsor and Budget Submitting Office (BSO)
for execution. The approved end strength is used as a guide by officer community
managers (OCM) to develop and execute personnel inventories.
Manpower requirements are based on a naval activity’s capabilities under which
they are expected to operate afloat, referred to as Required Operational Capabilities
(ROC) and the Projected Operational Environment (POE). Activities ashore operate
under Mission, Functions and Tasks (MFT).
Based on each activity’s ROC/POE, the Navy Manpower Analysis Center
(NAVMAC) establishes a Ship Manpower Document (SMD) and Squadron Manpower
Document (SQMD). The BSO develops the Statement of Manpower Requirements
(SMR) for shore activities. These documents are the bases of the Activity Manpower
Document (AMD). The AMD lists all the qualitative (billets) and quantitative manpower
requirements necessary for a specific activity, and identifies which requirements are to be
funded. The qualitative expression of manpower is depicted by the skill set of the officer
as described by the subspecialty code.
3. Accession Planning
Navy Medicine uses personnel plans to meet future readiness and peacetime
missions, ensuring that the quantity and quality of MSC officers are available. End strength,
accession, and promotion are three personnel plans used by the MSC planners to ensure that
the right number of officers are at the right grade and available at the right time.
The Chief of Naval Personnel (CNP/PERS-2) issues policy guidance in the
execution of the Navy’s personnel plans. This assists the MSC OCM and manpower
analyst in the development of accession plans to target projected inventory levels and
peacetime recruiting goals for future fiscal years. The MSC manpower analyst work
closely with the specific OCM to determine the number and mix of officers they wish to

7
recruit and to develop the most efficient and effective accession plan. With the manpower
analyst located at BUMED, and the OCM located at Navy Personnel Command (NPC),
there is the need for proper communication and accurate information to keep the
accession planning process adaptable to required changes.
After the promotion plan is completed and promotion numbers determined by
pay-grade, the accession plan is formulated. The results of the promotion plan enable the
OCM and manpower analyst to identify gaps in pay-grades for the future year and target
the expected number of new officers required by specialty. Thus, the accession plan is
developed by examining the beginning inventory and current personnel inventory, in
addition to expected gains minus expected losses. This identifies an accession figure.
Once combined, the OCM and manpower analyst comprise the new fiscal year end
strength targets. This calculation can be adjusted by increasing or decreasing to ensure
that the targeted end strength figures are met.
Figure 1. Navy Manpower Manning Process (from Hatch, 2013)
MSC accessions come from a variety of sources such as NROTC, recalls, and
lateral transfers from other communities that apply to the MSC. The most common
accession sources are the In-Service Procurement Program (IPP), the Health Services
Collegiate Program (HSCP), the Health Professions Scholarship Program (HPSP) and
Direct Procurement (DP).

8
The accession plan begins in July and is completed in December, two fiscal years
ahead of time from the current year. After the CNP approves the accession plan, a mid-
year review is conducted as changes may develop during the review process (Houser,
1996). Modifications to the accession plan must be approved by the OCM.
4. Officer Promotions
Promotion planning ensures the Navy meets its end strength requirements and is
vacancy-driven. When gains and losses are calculated, promotion planners use end
strength numbers to develop promotion rates. The promotion cycle begins when end
strength figures are broken down by grade. The Defense Officer Personnel Management
Act (DOPMA) of 1980, amended by Congress, establishes the control grades of
lieutenant commander, commander and captain, which decisively affect promotion flow
points, selection for promotion and promotion opportunities (Rostker et al., 1993). Unlike
the Medical and Dental Corps, the MSC has a limited number of officers in these control
grades as established by DOPMA. The promotion flow points as specified in DOPMA
guidance is shown in Table 3.
Table 3. Promotion Flow Points (after Rostker et al., 1993)
Promotion To: Flow Point
Captain 21 to 23 years
Commander 15 to 17 years
Lieutenant Commander 9 to 11 years
Lieutenant 4 years
Lieutenant (Junior Grade) 2 years
Ensign N/A
Based on DOPMA guidance, all ensigns receive a statutory promotion to
lieutenant junior grade after 18 months to two years of service. The last row indicates
“N/A” because an individual cannot be “promoted to” ensign. The flow point column
illustrates the overall view of the total time it takes to advance to the next grade.
Advancement from lieutenant junior grade to lieutenant is similar to that of an ensign in
that it is an automatic promotion as well. An annual promotion board is convened for

9
selected officers from the ranks of lieutenant to captains eligible to promote. Officers
above the grade of captain are appointed, not promoted, by the president of the United
States to the admiral pay-grades.
C. MSC ACCESSIONS
The most common accession sources used to procure MSC officers are IPP,
HSCP, HPSP, and DP. These programs will be discussed in detail in the following
paragraphs. The others such as Inter-Service Transfers (IST), recalls and lateral transfers
from other communities that apply to the MSC make up a very small percentage of MSC
accessions.
Most HCA officers are recruited from the civilian sector (direct
accession/procurement) or from enlisted status (in-service procurement). The HSCP and
portion of the IPP are the only educational and training programs utilized to recruit
officers to the MSC. Due to gaps in training, it is difficult to determine whether there
could be losses. MSC manpower planners use direct accessioning to fill in these gaps in
order to balance officer shortfalls and to make the necessary adjustments during the fiscal
year. When officers are accessed through these programs, it is based on different pay-
grades by education level. For example, a new MSC recruit with a bachelor’s, master’s or
doctorate degree, will be given the rank of ensign, lieutenant junior grade, and lieutenant,
respectively.

10
Table 4. FY2013 & FY2012 MSC HCA Accessioning Source Percentages
(after BUMED MSC report, 2013)
Accession FY2013 FY2012
Sources Number Percentage Number Percentage
IPP 17 30% 20 36%
Direct 16 28% 18 32%
HSCP 24 42% 17 30%
HPSP 0 0% 1 2%
IST 0 0% 0 0%
Recall 0 0% 0 0%
Total 57 100% 56 100%
1. In-Service Procurement Program
The IPP is the most popular accession source in Navy Medicine. The majority of
HCA officer accessions are commissioned with some type of previous military
experience. Enlisted service members eligible to receive a commission have the
opportunity to serve in most of the subspecialties depending on their level of education
and degree program. The OPNAV instruction provides all specific qualifications for IPP.
However, the instruction changes each year as the needs of the Navy change to support
its mission. A selection board made up of senior MSC officers meets annually to review
Navy or Marine Corps enlisted members, E-5 and above for selection into the program.
While in the program, the enlisted member receives educational benefits and retains
eligibility for enlisted promotion.
2. Health Services Collegiate Program
The HSCP is an accession source that is an educational pathway for individuals,
with or without prior military service, entering an accredited graduate program to receive
a commission as an MSC officer. This program provides a two or three-year scholarship,
depending on whether it is a Master’s or Doctorate program, for students to pursue an
advance degree for a designated health profession. The program also provides students
with E-3 pay and additional benefits.
11
3. Health Professions Scholarship Program
The HPSP primarily provides Optometrists with a full scholarship, monthly
stipend and a commission as lieutenant upon graduation. They serve for a minimum of
three years, after which they are promoted to the next pay-grade.
4. Direct Accession
Candidates for direct accession, usually with no prior military experience, apply
to be commissioned after completing an accredited educational program in a chosen field.
D. CURRENT FORCE PLANNING TOOLS
BUMED currently uses the MedMACRE modeling tool, to size the force, assess
specialty levels, distribute personnel inventories and determine the minimum manpower
resources required to deliver quality health care to the fleet. MedMACRE is one such tool
that provides an analytical defense for sizing our force, especially for less than full
mobilization scenarios and issues relating to Force Specialty Mix.
However, the inventory of subspecialty training are not tracked or managed in any
way. By only tracking current HCA inventory and accessions, manpower planners and
OCM remain purely reactive and lack a holistic view of the community.
E. SCOPE AND METHODOLOGY
Of particular interest is exploration of the systematic behavior within the HCA
community in terms of accession, transition and attrition to ensure that the MSC has on
active duty the right number of HCA officers, at the right grade, at the right time. The
scope of this thesis consists of Navy HCA officers from pay-grades O–1 through O–6,
and their respective subspecialties from FY2010 to FY2013. The aggregate data from the
Defense Manpower Data Center (DMDC) Master file for each officer populates the
probabilistic representation of accession, transition, and attrition within the HCA
community. The thesis concludes with recommendations and potential areas for further
research.

12
F. ORGANIZATION OF STUDY
This chapter examines the overall objectives, purpose, scope and organization of
the thesis. It also provides an overview of the Navy MSC and describes the background
of the HCA community and its structure. Chapter II provides a detailed literature review
and describes other studies of Markov modeling as it relates to civilian firms, the
military, and more specifically, the MSC HCA accessioning process and manpower
determination. Chapter III captures the specific data and methodology used to develop a
Markov model of the behavior of the HCA community. This chapter also determines the
best transition matrix for the Markov modeling. Chapter IV provides the implementation
and validation of the Markov model and provides the limitations of the model as well.
The final chapter summarizes the study and provides conclusions and recommendations
for each of the research questions as well as recommendations for further research.

13
II. LITERATURE REVIEW
A. OVERVIEW
This chapter explores research on manpower planning and derives methodologies
to assist in the current study. Manpower analysts tend to concentrate on topics in the
civilian sector, but there are relatively few studies directly related to the MSC manpower
and personnel. Furthermore, most military personnel planning models are deterministic—
“they ignore the uncertainty implicit in personnel loss projections”—and most of them
are steady-state—“they ignore current personnel inventory and its evolutionary
possibilities” (Hall & Moore, 1982, p. v). Only two studies focus specifically on the
behavior of MSC HCA officers. One of the studies describes attrition and retention in the
HCA community. The other uses a steady-state analysis to determine the optimal number
of MSC HCA officers the Navy must access each year in order to maintain a desired end
strength. However, we find no research that develops new models which includes current
personnel inventory that specifically focus on tracking and managing subspecialties. This
thesis attempts to fill that gap.
B. BARTHOLOMEW, FORBES, AND MCCLEAN
In the second edition of their book, Statistical Techniques for Manpower
Planning, Bartholomew, Forbes, and McClean include an account of most of the
stochastic models researchers use in manpower planning and provide a systematic
account of the technical aspects of manpower planning tools. Stochastic models on
manpower planning have been developed and studied in the past by many well-known
researchers like Bartholomew (1971), Smith (1970), Forbes(1971), Vajda (1975), and
Grinold and Marshall (1977). We apply the basic concept, terminology and notations
derived from Bartholomew et al. in this study.
The statistical approach to manpower planning has mainly been contributed by
Bartholomew (1971) due to features of most manpower planning problems. The two
main features are concerned with aggregates and uncertainty. Manpower systems can be
explored through an examination of historical data. Data from the historical study

14
aggregates to provide an extensive description of the system. The behavior patterns or
probabilities are then used to represent these aggregates and reflect the uncertainties that
generally arise from the highly unpredictable human behavior (Bartholomew et al.,
1991).
Each model for a manpower system, according to Bartholomew et al., must be
presented as a mathematical description of a succession process with a known scheme of
successional transitions and their time characteristics which describe the flow within the
system (Bartholomew et al., 1991). As stated in the previous chapter, billets and
authorizations are limited. However, the system can generate more personnel than there
are billets to bring manning levels to 100 percent. The manpower system describes the
personnel flow in the model of the system and how the system is constrained by available
resources. Despite these constraints, the system is able to control some behaviors such as
promotion, which requires a board. Other behaviors such as voluntary retirement can be
difficult to control. All manpower models have these common aspects of constraints and
flows.
Bartholomew et al. highly recommend the use of transition models based on the
theory of Markov chains when dealing with heterogeneous systems. Based on this theory,
the MSC community can be referred to as a heterogeneous system, a system that
classifies people to “such things as grades, age, or location” (Bartholomew et al., 1991).
Markov chains play a vital role in the study of military systems in which personnel exist
in each state of the model which are mutually exclusive, such as subspecialties and rank.
According to Bartholomew et al., Markov chains are useful in determining the “ideal”
manpower population and force structure (Bartholomew et al., 1991).
C. OTHER CIVILIAN STUDIES
During the past decade, Markov chains have received considerable attention in the
literature. This is evident in the growing number of journal articles, literature, and
proceedings of national and international conferences that deal with manpower planning
15
methods. It has also received the support of civilian firms, military and governmental
agencies, operations research, management science and a host of other entities interested
in manpower systems.
The use of Markov models in civilian manpower planning varies widely in the
populations studied compared to the military. Including Bartholomew, numerous
researchers like Davies (1973 and 1981), Zanakis & Maret (1980), Sales (1971),
Ugwuowo & McClean (2000) make appreciable contributions in the general application
of Markov modeling in the areas of statistical manpower planning and control. Vassiliou
(1997) and a host of other referenced authors in this thesis apply studies in other contexts
such as non-homogeneous and semi-Markov manpower models to manpower planning
and specific populations including patient care (Faddy & McClean, 2005), police force
(Birge & Pollock, 1989), and medical decision making (Sonnenberg & Beck, 1993).
Consequently, researchers and analysts use the processes of Markov modeling in a wide
variety of applications in manpower planning.
D. ACCESSION AND ATTRITION BEHAVIOR PATTERNS
From 1983 through 1988, the Center of Naval Analysis (CNA) found a decrease
in the accession and retention rate for the Medical Corps and the Nurse Corps. In 1989,
Dolfinin conducted a study in an attempt to discover whether similar issues arose within
the MSC community. The study examines accession and retention of MSC officers to
determine whether there exists an actual manpower shortage.
Dolfinin uses the MSC continuation rate to examine accession and retention at the
aggregate community level, and finds that from FY1984 to FY1988, the continuation
rates for both aggregate and community levels are consistent at 90 percent or above.
Additionally, it reveals disparities between HCA officers and HCS officers in regards to
their continuation and retention rates. HCA officers are relatively stable for the first 10
years of commissioned service and then experience a downward trend thereafter. While
HCS officers on the other hand, experience a different continuation pattern. They tend to
make a long-term career decision to stay in the Navy, once they reach 10 years of
commissioned service. HCS officers usually serve until the 20 year mark before the

16
continuation rate drops. These different retention patterns between HCA and HCS
officers are mostly attributed to the majority of the HCA officers who are prior-enlisted
and have the ability to retire before 20 years of commissioned service.
The study recommends leadership in policy decision making, to increase the
accessions or continuation rates, or both to solve the manpower shortage problem.
Although the study does not provide recruiting strategies, it forecasts average
continuation and maintenance rates for the future, as well as provides HCA and HCS
personnel inventory levels during the study. It also recommends adjusting the
accessioning process, which our thesis attempts to fulfill.
E. MILITARY APPLICATIONS OF MARKOV MODELS
Military personnel possess various attributes like rank and occupational specialty.
They also transition to various ranks and specialties during the course of a career.
Markov chains are adept at modeling the flow of personnel through such a system.
It is not possible to guarantee continued service or attrition for specific personnel
in the military. Therefore, manpower analysts estimate attrition and retention behavior by
using analytical judgment, prior experience, and most importantly historical personnel
data. Historical data can include observable predictive variables such as rank and
subspecialties, for each individual as of some specified point in time, and whether or not
each individual continued service (and for how long) after that point in time. By applying
these estimates to current personnel, analysts obtain a prediction of future behavior.
While some studies utilize logistic regression techniques, steady-state analysis,
and survival analysis, our thesis takes a deterministic approach considering the current
personnel inventory due to the data available.
1. Uncertainty in Personnel Force Modeling
Hall and Moore (1982) address the impact of uncertainties related to the recruiting
shortfalls, stay/leave decisions, and accession and retention rate estimation of enlisted Air
Force personnel. The project examines the impact of various types of uncertainties on
projections of force structures using a Markov flow model of the first-term force.

17
Development of these specifications for an enlisted force management planning system
replaces the Air Force’s current system at the time known as TOPCAP (Total Objective
Plan for Career Airman Personnel). Like most military studies, the TOPCAP consists of
deterministic models. To develop new models, the researcher investigates the degree of
uncertainty implicit in personnel flows and evaluates the need to incorporate uncertainty
in these new models as well as alternative means of performing this task.
The study analyzes the impact of uncertainty on accession requirements,
reenlistment requirements and personnel costs. Findings indicate that individual
stay/leave decisions and the proportion of accession requirements are the largest
contributors to uncertainty, while uncertainties regarding estimates of flow rates and the
mix of people contribute less.
The study makes two recommendations. One advises the development of
improved procedures such as including “environmental” data (e.g., occupational
categories) for estimating probabilistic parameters in personnel flow models such as loss
rate. The other recommends the revision and extension of recently-developed retention
decision models to predict how the flow behaviors for various categories will change
based on policy changes. Our thesis focuses on assisting in the second recommendation
for HCA officers to improve procedures and methods to provide consistent, interpretable
and cost effective sets of parameters for model estimations, flow rates, variables, and
outcomes.
2. Steady-State Analysis and Logistic Regression
We review three studies that analyze the steady-state inventory of officers. The
first and second studies are two NC theses that focus on predicting NC career
progression. One of these theses provides an in-depth focus on regression analysis
techniques to improve validity. The third study focuses on personnel progression within
the MSC HCA community to determine the steady-state of HCA officers and compare
them to the actual target end strength and accessioning numbers.
Deen and Buni (2004) use Markov modeling to provide the Navy NC with a tool
to forecast recruiting goals. This NC thesis focuses on officers between grades O-1 and

18
O-3 categorized by time in service and rank based on 11-year data (FY1991 to FY2003),
provided by BUMIS. The transition matrix depicts the personnel flow process of NC
officers, where an officer remains at the current rank, promote to the next rank or attrite
or leave the Navy. There are no demotions in this model. Additionally, to create the best
transition matrix for the model, the study allows officers in pay-grades O-4 and O-5 to
flow through the system. It also uses logistic regression to investigate and predict if any
variables in the data set, especially accession sources, affect the probability of staying in
the NC. The study merges NC cohort data files from FY1990 to FY1994 and FY1996 to
FY1998 for analysis.
Findings from the logistic regression show that Recalls, Medical Enlisted
Commissioning Program (MECP) and Nurse Candidate Program (NCP) are all correlated
with increased probability of staying in the NC. They also show that males are more
likely than females to stay in the NC. Furthermore, change in education levels decrease
the probability of staying in the NC. By observing the Markov model function over the
ten-year period, the thesis finds that officers in pay-grades O-1 and O-2 reach a steady
state at the eight-year mark. Officers in pay-grade O-3 on the other hand, reach a steady
state at the 17-year mark. Furthermore, findings indicate that at steady state, there are 521
ensigns, 530 lieutenants junior grade and 900 lieutenants. The thesis makes no changes to
these values as long as NC number and rank of accession remains the same. When the
study compares these values to target figures, it shows that O-1s are 220 over, O-2s are
63 under and O-3s are 220 under, which yields an overall shortage of 63 nurses.
Therefore, the study finds that there is a severe shortage of O-3s and an overflow of O-1s
when it compares the current accession plans to the NC goals.
Kinstler and Johnson (2005) complete a follow-on thesis which focuses on the
accession challenges of the NC in determining the appropriate number of nurses
manpower planners should access each year in order to maintain desired end strength.
The study uses logistic regression to examine promotion and exit rates (leaving) at
various pay-grades based on accession source. Given these dependent variables, the study
uses logistic regression in an attempt to estimate the probability that a nurse would
promote, stay in the Navy, or leave the service.
19
Results indicate that the accession source significantly impacts the probability of
a person leaving. Although there does not appear to be a clear pattern, it is also shown to
significantly impact promotion rates. The model includes officers in pay-grade O-4. The
study merges data obtained from BUMIS and DMDC for analysis. Like the first NC
thesis, the study develops a similar transition matrix. It compares the results from a two-
year projection, 2006–2009, to the targeted end strength in the same period. It runs
several scenarios to minimize overages and shortfalls in rank distribution, by changing
both the distribution of accession sources and the distribution of recruited ranks. Optimal
distribution of accession source and rank are dependent upon the degree of acceptable
deviation from the targets set by the NC. However, due to unavailable information, the
study does not provide a recommendation on the best mix of accession source and rank to
meet current targets. Findings also show that two-year projection of current business
practices of the NC optimizes accessions but would not produce large deviations in the
near term. Greater efficiency, however, could be obtained in the out-years.
Vance (2006) uses a Markov model and steady-state analysis that specifically
focuses on MSC HCA officers. The thesis adapts the methodologies used in the two prior
NC theses above. The purpose of the thesis is to determine the optimal number of MSC
HCA officers that the Navy must access each year in order to maintain a desired end
strength. The study obtains data from BUMIS and DMDC, but the major contributor of
data comes from DMDC. The study examines the flow of officers in pay-grades O-1
through O-4 using sixteen-year data (1988–2004) pulled using cohort files of all MSC
officers including HCSs as well as HCAs. It develops the primary transition matrix by
combining data over all the seventeen calendar years, and broken down by pay-grade and
years of service within that pay-grade.
The study analyzes five scenarios to determine the most effective method to
determine accession levels. One focuses on the historical averages of the past four
accession plans. Conducting a four-year historical review helps identify that the current
business practices will not allow for steady-states to be reached at each pay-grade.
Results determine commissioning source to be significant and influences retention at the
seven and ten year mark. There are three scenarios that focus on the junior officer ranks.

20
The study achieves optimization by changing with distribution of accessions sources and
recruiting ranks. The final scenario applies a solver application to minimize “badness.”
When it compares the force structure to the predicted value, the solver scenario provides
the alternative with the least amount of shortfalls and overages.
Survival analysis identifies that IPP has a different survival function than other
sources. Regression analysis addresses the retention of MSC HCA officers at certain year
milestones. Findings show that single officers are less likely to be retained to seven years,
when compared to married officers. It also shows that officers who are commissioned
when older are less likely to be retained to seven years. Furthermore, HCA officers who
enter the service through the IPP are more likely to be retained to seven years than
officers entering through other programs. Results also indicate increased variations
between the current force structure plan and the predicted Markov model outcomes. This
suggests that greater efficiency could be obtained in future years. The study finds Markov
model to be a useful tool for improving extended forecast for accessioning.
3. Survival Analysis
Military studies use survival analysis to analyze the survivability (stay/leave)
patterns of personnel. It is one method of looking at retention behavior and is especially
useful for observing differences across groups over time. We review two NPS theses in
this section. The first thesis focuses specifically on MSC HCA officers, and the second is
a review of survival analysis techniques which focuses specifically on the United States
Marine Corps (USMC).
Farr (1994) utilizes data obtained from the Navy Officer Master File, Navy
Officer Loss File, and Navy Personnel Research and Development Center’s Officer
Fitness Report File, to estimate the factors that influence the effectiveness of accession
through the IPP and direct procurement. The thesis uses multivariate analyses to compare
officers by accession sources. It also uses various survival analysis techniques including
proportional hazard models, ordinary least square models, and logit models. The thesis
uses proportional “hazard” models to estimate the years of commissioned service the
MSC HCA officers expect to serve before retiring or being voluntarily released from
21
active duty. It uses the ordinary least square models to estimate the influence of accession
source, education, and personnel demographics on separation behavior and fitness report
performance. Lastly, it uses logit models to evaluate the probability of promotion and the
probability of having above average fitness report performance values as a function of the
accession source.
Results indicate that HCA officers with ten or more years of commissioned
service are more likely to leave within a few years of becoming eligible to retire. The
thesis also identifies a significant difference in education levels and early fitness report
performance between officers who access through IPP and direct procurement. The thesis
recommends a cost-benefit analysis to determine the optimal HCA accession policy.
Hoglin (2004) analyzes the determinants on the survival of prior and non-prior
enlisted officers and to develop the methodology to optimize the accessions of these
officers. The study obtains data from the Marine Corps Officer Accession Career
(MCOAC) file. The study utilizes a Cox proportions hazards model to estimate the
effects of commissioned officer characteristics on their survival in the USMC. Results
indicate that prior enlisted officers have a better survival rate than non-prior enlisted
officers. The study also uses a Markov model to determine the optimal percentage of
prior and non-prior enlisted accessions for the USMC. Findings also show that officers
who are married, commissioned through MECEP, graduate in the top third of their TBS
class, and are assigned to a combat support MOS have a better survival rate than officers
who are unmarried, commissioned through USNA, graduate in the middle third of their
TBS class, and are assigned to either combat or combat service support MOS.
Additionally, the optimum number of prior enlisted officer accessions is significantly
lower than recent trends and differs across MOS. The study recommends a review of
prior enlisted officer accession figures.
F. CHAPTER SUMMARY
This chapter establishes the use of the Markov chain as a manpower tool both in
the civilian sector and within the military. While this review discusses and evaluates
studies that deal directly with methodologies that could be applied to this thesis,

22
Bartholomew et al. serve as the basis for applying a Markov chain to the MSC HCA
community, and helps answer the primary research question of our study.

23
III. DATA AND METHODOLOGY
A. INTRODUCTION
This chapter introduces a Markov modeling method applied to this study to create
a five-year forecast (FY2014 to FY2018) of MSC HCA personnel inventory levels by
rank and subspecialties. To understand the type of information required to create this
model, Chapter III describes the data we use for the study. As discussed in the previous
chapter, personnel in the Markov model flow through the system either by staying at
current rank, promoting to the next rank or leaving the system (attrite). The transition
matrix developed for this model does not allow demotions. The ranks analyzed in the
Markov model are ensigns though captains (O-1 through O-6).
B. DATA SOURCES
1. Descriptive Variables
This thesis obtains data from DMDC field office of Monterey, California,
received as an Excel file. We pull the following descriptive variables from DMDC using
cohort files of all active duty Navy MSC HCA officers over a four year period (FY2010
to FY2013). The data consist of three variables which we input into SAS to merge, code
and clean. We then export the cleaned data into Microsoft Excel format to incorporate
into the Markov model.
a. Social Security Number
Our model requires the use of Social Security Numbers (SSN) to provide a means
of identifying personnel within the data. For privacy reasons, we replace SSNs with a
unique identifier—a numeric string associated with identifying the individual in the
system.

24
b. Rank
The data contain ranks from ensigns (O-1) through captains (O-6). The variable
rank has only six possible values (O01 through O06 representing ensigns through
captains).
c. Sub-specialty Codes
The sub-specialty code variable captures in numeric format the primary
subspecialty of each HCA officer. These codes include all the 1800s, 3100s and 3200s.
The data contain 10 possible subspecialties as shown in Table 2 (1800, 1801, 1802/3121,
1803/6201, 1804, 1805, 3110-3112, 3130, 3150, and 3211).
2. Descriptive Statistics
The sample size includes 56,621 observations. The observations consist of MSC
HCA officers in the pay-grades O-1 to O-6 (Figure 2) and with subspecialty codes 1800
to 3211 as shown in Figure 3.
Figure 2. Observations by Rank

25
Figure 3. Observations by Subspecialty Codes
C. MARKOV MODEL THEORY
1. Markov Model Formulation
According to Zanakis and Maret (1980), “Personnel supply in an organization can
be forecasted using Markov chains to model the flow of people through various “states”
(usually skill or position levels, minority status, and sometimes years of service)” (p.
1095). We can further classify the HCA community into mutually exclusive states of
rank and subspecialties. Given these characteristics, the systematic behavior of the HCA
community allows the modeling application of a Markov chain.
a. Basic Markov Model Assumptions
Probabilistic models such as Markov models are extremely useful in manpower
management applications and for predicting the aggregate behavior of the system, i.e. total
end strength. Markov models require adherence to the following three fundamental
assumptions: Finite State Space, Markovian Property, and Stationary Transition Probabilities.
States in the Markov chains in this thesis are countable, mutually exclusive, and
exhaustive. An element of the Markov model may reside in a “state” for a period of time.

26
For our purposes, the states of the models we employ consist of grade-subspecialty code
combinations. See figure 4 for an illustration of the conceptual model.
The Markovian Property is the property such that the probability that the system
will transition to any particular state depends only upon the current state (Bartholomew,
1971). This means that the probability of promotion in rank, subspecialty code, or both
depends only upon the current grade-subspecialty code combination. Because this study
examines annual transitions, we look at what happens to each individual at each rank
after one year. For instance, there are four possible outcomes for ensigns as seen in
Figure 4: First, an O-1 might remain an O-1. Secondly, an O-1 might be promoted to O-2.
Thirdly, an O-1 might make a lateral move to another subspecialty. Finally, an O-1 might
attrite, or leave the Navy. The same idea applies to the other ranks. However, there is no
“promotion” out of O-6. Individuals who promote to O-7 count as “attrites” because they
are leaving the “system”.
For transition probabilities to be stationary, then the following must be true for all
values of t: ( | ( | . Thus, the probability that the
system transitions from state i to state j at time t, is the same as the probability that the
system makes this same transition at time t = 1. In other words, the Markov chain should
have transition probabilities which remain stationary over the life of the model (Sales,
1971). The predictive power of the model degrades if the transition probabilities change
from one time period to the next.
D. METHODOLOGY
1. Conceptual Model
The Markov Model we develop for this thesis shows the flow of personnel
through the manpower system. It consists of a transition matrix, an inventory vector, and
a recruitment vector. The model calculates the annual officer strength by identifying the
number of HCA officers in the system at each state and how likely they are to transition
to the next state. Personnel can flow through the system either by advancing to the next
state or by leaving the system (attrition). Figure 4 depicts the system from pay-grades O-
1 to O-6.

27
A truncated depiction of the model of HCA officer manpower flow shows the
system’s annual transitions from O-1 to O-6. The transition probability, p11 is the
probability that an O-1 with a subspecialty of 1800 might remain an O-1 with a
subspecialty of 1800, and p12 is the probability that an O-1 with a subspecialty of 1800
might promote to O-2 with a subspecialty of 1800 in the next time step. If an officer
leaves the system for any reason, he or she flows into the attrition state. The same idea
applies to the other ranks.
Figure 4. Truncated conceptual model (transition probabilities suppressed for clarity)
The purpose of this subsection of the thesis is to construct and illustrate the
characteristics and capabilities of the fixed inventory and fixed recruiting models. The
fixed inventory model of the Markov chain determines the number of personnel required
to access to meet required end strength of the MSC HCA community. Alternatively, the
fixed recruiting model determines the expected end strength generated by the given
accession mission.
28
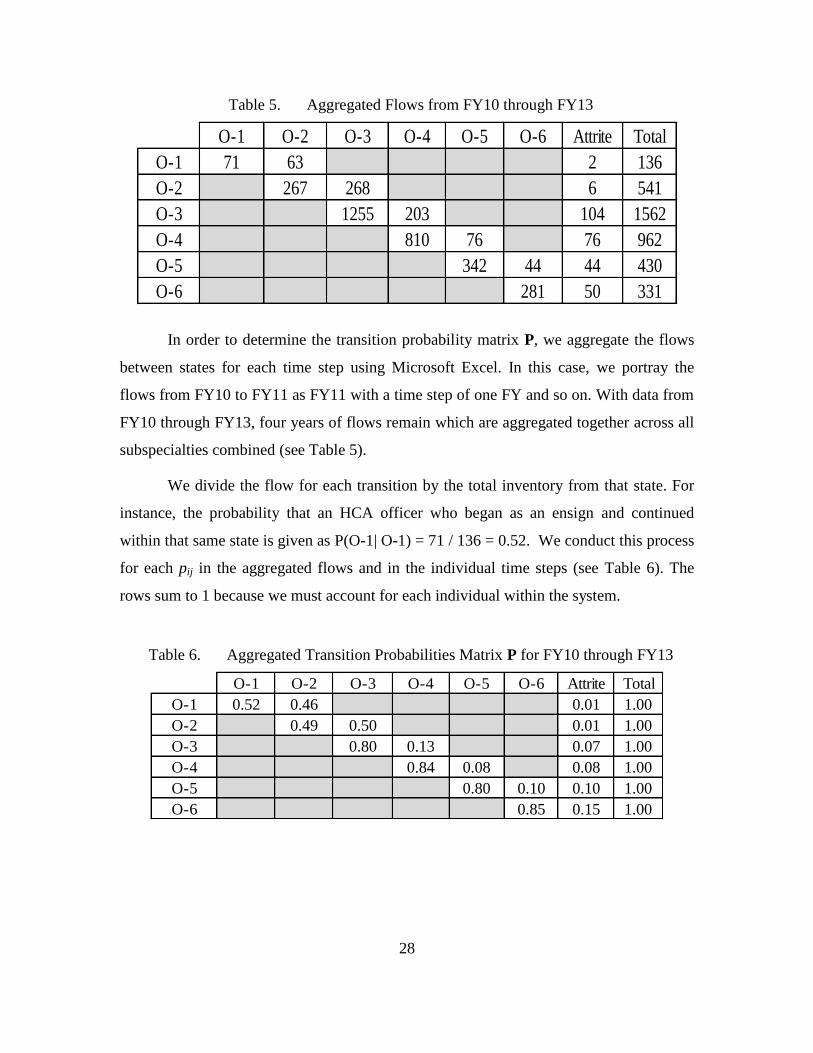
Table 5. Aggregated Flows from FY10 through FY13
In order to determine the transition probability matrix P, we aggregate the flows
between states for each time step using Microsoft Excel. In this case, we portray the
flows from FY10 to FY11 as FY11 with a time step of one FY and so on. With data from
FY10 through FY13, four years of flows remain which are aggregated together across all
subspecialties combined (see Table 5).
We divide the flow for each transition by the total inventory from that state. For
instance, the probability that an HCA officer who began as an ensign and continued
within that same state is given as P(O-1| O-1) = 71 / 136 = 0.52. We conduct this process
for each pij in the aggregated flows and in the individual time steps (see Table 6). The
rows sum to 1 because we must account for each individual within the system.
Table 6. Aggregated Transition Probabilities Matrix P for FY10 through FY13
O-1 O-2 O-3 O-4 O-5 O-6 Attrite Total
O-1 71 63 2 136
O-2 267 268 6 541
O-3 1255 203 104 1562
O-4 810 76 76 962
O-5 342 44 44 430
O-6 281 50 331
O-1 O-2 O-3 O-4 O-5 O-6 Attrite Total
O-1 0.52 0.46 0.01 1.00
O-2 0.49 0.50 0.01 1.00
O-3 0.80 0.13 0.07 1.00
O-4 0.84 0.08 0.08 1.00
O-5 0.80 0.10 0.10 1.00
O-6 0.85 0.15 1.00

29
2. Fixed Inventory and Fixed Recruiting Models
a. Equation
The equation for the fixed inventory model is exactly the same as the fixed
recruiting model. We use the equation in the fixed inventory model to predict stock sizes
in the different categories while controlling the number of people recruited during the
forecasted period of time (Erhardt, 2012). The idea is to determine the number of
accessions required to achieve desired inventory targets. Whereas, for the fixed recruiting
model, the number of accessions are determined and we predict the resulting inventory
levels through time.
n(t) = n(t −1)∙Ρ + R(t)r
Defining the following indices based on Bartholomew et al (1991):
n(t) is the predicted stocks or inventory vector at time t. Time is labeled in
discrete increments, such as t = 0,1,2, 3,...T. For this study, time steps are
annual.
n(t-1) is the inventory vector at the previous time step. n(0) represents the
initial inventory vector.
P is the matrix of transition probabilities. The transition probability pij is the
probability an officer will transition from state i to state j in one time step.
R(t) is the number of HCA officers accessed into the system during time (t).
r is the recruitment vector that determines the proportion of total recruits
distributed among each state. For example, if r = (0.80, 0.20, 0, 0), then 80%
of the new personnel recruited will enter category one, 20% will enter
category two, and 0% will enter category three or category four.
b. Analysis
Using a fixed inventory model allows manpower planners to adjust various inputs
to the model and assists to facilitate the understanding of the behavior of the HCA
community. Additionally, the fixed inventory model uses transition probabilities, an
inventory vector, and an accession (or recruiting) vector to estimate a number of
manpower outputs.
We examine the expected behavior of the system once the trajectory of recruiting
is fixed through the forecasted time period. This is known as the fixed recruiting model.
30
For a given sequence of recruitment vectors, it is possible to determine the expected end
strength of the system (that is the distribution between states) at each time-step.
Alternatively, we can seek a sequence of recruiting vectors which would produce a given
goal or target structure.
Utilizing a fixed recruiting model allows manpower planners the ability to decide
ahead of time what the recruiting mission is going to be through the future years. Like the
fixed inventory model, it utilizes transition probabilities, an inventory vector, and an
accession (or recruiting) vector as well. The only difference is that end strength targets
are set (i.e. fixed) ahead of time and the model provides us with the number of recruits
necessary to achieve these goals.
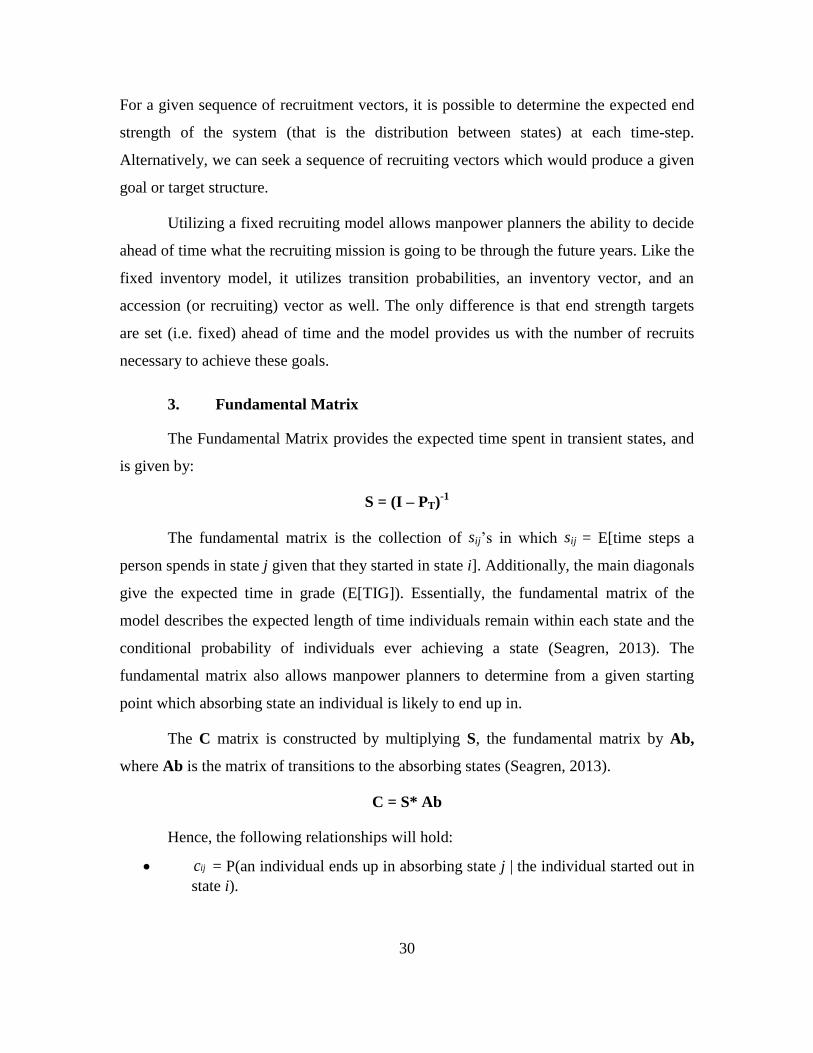
3. Fundamental Matrix
The Fundamental Matrix provides the expected time spent in transient states, and
is given by:
S = (I – PT)-1
The fundamental matrix is the collection of sij’s in which sij = E[time steps a
person spends in state j given that they started in state i]. Additionally, the main diagonals
give the expected time in grade (E[TIG]). Essentially, the fundamental matrix of the
model describes the expected length of time individuals remain within each state and the
conditional probability of individuals ever achieving a state (Seagren, 2013). The
fundamental matrix also allows manpower planners to determine from a given starting
point which absorbing state an individual is likely to end up in.
The C matrix is constructed by multiplying S, the fundamental matrix by Ab,
where Ab is the matrix of transitions to the absorbing states (Seagren, 2013).
C = S* Ab
Hence, the following relationships will hold:
ijc = P(an individual ends up in absorbing state j | the individual started out in
state i).

31
E. CHAPTER SUMMARY
This chapter provides the background information of the data set used for this
thesis, including basic descriptive statistics for the data and the methodology on how to
construct fixed inventory and fixed recruiting Markov models. The Markov model proves
to be a useful tool for accession and end strength planning for the MSC HCA community.

32
THIS PAGE INTENTIONALLY LEFT BLANK

33
IV. MODEL IMPLEMENTATION AND VALIDATION
This chapter outlines the implementation of the MSC HCA officer manpower
models in Excel. In addition, it assesses the validity of the models with respect to the
stationary assumption. We construct each subspecialty model and the aggregate in one
Excel workbook.
A. STOCK FORECAST
This study bases the behavior of the MSC HCA manpower model on stocks and
flows. Stocks are the distribution of HCA officers in each pay grade and the total
population of the HCA community. Flows, on the other hand, are the transitions to the
next state. The two main types of flows within our system are: Flows into the system
(recruitment), and flows between the various parts of the system (promotion, lateral
moves, and attrition) (Bartholomew, 1971).
Suppose, for example, the future inventory requirements for HCAs are given by
the “Target” column in Table 9. We can use the equation: n(t) = n(t −1)∙Ρ + R(t)r, to
forecast the accessions required to achieve these inventory targets. Table 8 gives the
accession mission that achieves these goals.
Table 7. Aggregate Accession Vector r for FY10 through FY13
Table 8. Aggregate R for FY14 through FY18
O-1 O-2 O-3 O-4 O-5 O-6
Accession Vector ( r ) 0.22 0.62 0.05 0.04 0.03 0.05
R
FY14 76
FY15 72
FY16 72
FY17 72
FY18 72
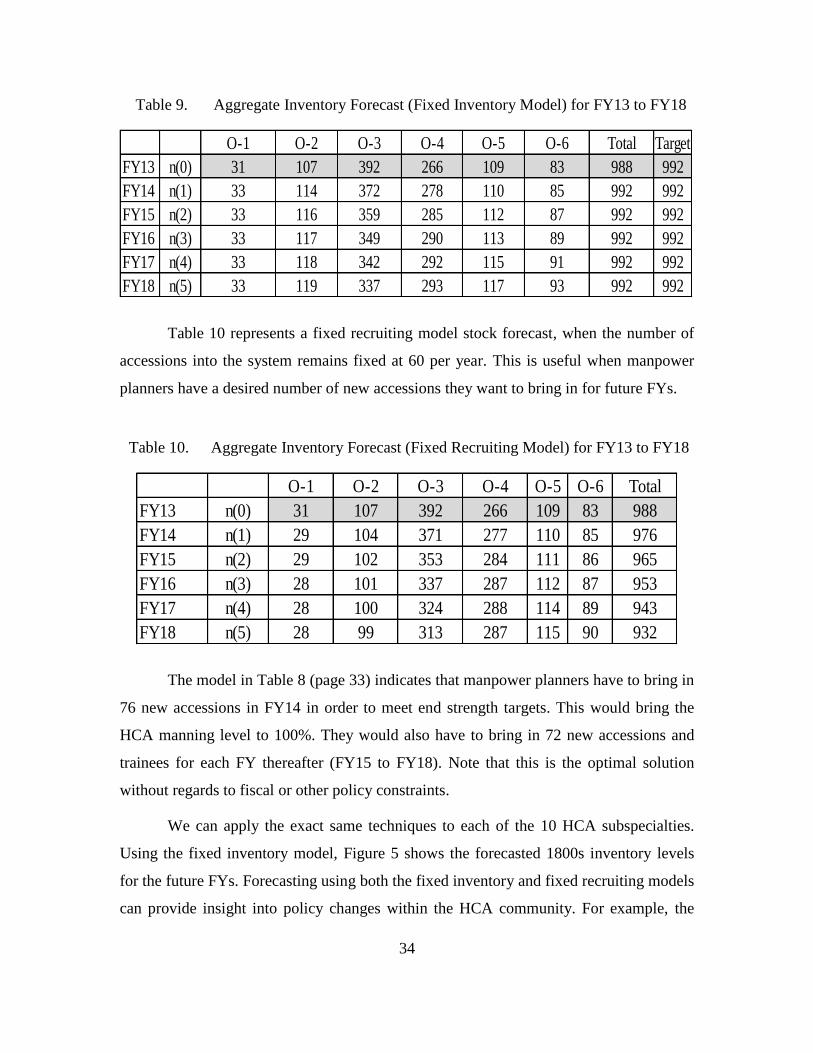
34
Table 9. Aggregate Inventory Forecast (Fixed Inventory Model) for FY13 to FY18
Table 10 represents a fixed recruiting model stock forecast, when the number of
accessions into the system remains fixed at 60 per year. This is useful when manpower
planners have a desired number of new accessions they want to bring in for future FYs.
Table 10. Aggregate Inventory Forecast (Fixed Recruiting Model) for FY13 to FY18
The model in Table 8 (page 33) indicates that manpower planners have to bring in
76 new accessions in FY14 in order to meet end strength targets. This would bring the
HCA manning level to 100%. They would also have to bring in 72 new accessions and
trainees for each FY thereafter (FY15 to FY18). Note that this is the optimal solution
without regards to fiscal or other policy constraints.
We can apply the exact same techniques to each of the 10 HCA subspecialties.
Using the fixed inventory model, Figure 5 shows the forecasted 1800s inventory levels
for the future FYs. Forecasting using both the fixed inventory and fixed recruiting models
can provide insight into policy changes within the HCA community. For example, the
O-1 O-2 O-3 O-4 O-5 O-6 Total Target
FY13 n(0) 31 107 392 266 109 83 988 992
FY14 n(1) 33 114 372 278 110 85 992 992
FY15 n(2) 33 116 359 285 112 87 992 992
FY16 n(3) 33 117 349 290 113 89 992 992
FY17 n(4) 33 118 342 292 115 91 992 992
FY18 n(5) 33 119 337 293 117 93 992 992
O-1 O-2 O-3 O-4 O-5 O-6 Total
FY13 n(0) 31 107 392 266 109 83 988
FY14 n(1) 29 104 371 277 110 85 976
FY15 n(2) 29 102 353 284 111 86 965
FY16 n(3) 28 101 337 287 112 87 953
FY17 n(4) 28 100 324 288 114 89 943
FY18 n(5) 28 99 313 287 115 90 932

35
1800s, which make up the largest proportion of the HCA category receives the largest
number of new accessions yearly. Reducing the number of billets for the 1800s would
reduce the number of 1800 accessions at all ranks. By adjusting the number of accessions
to represent this policy, the model forecasts the shape and size of the HCA community in
the following years. Adjusting the accession inputs or the transition probabilities within
the model provides a variety of policy evaluation tools for manpower planners.
Figure 5. General HCA (1800) Inventory Forecast by Rank and FYs for FY14 to FY18
Figure 6 and Figure 7 show the future FYs inventory forecast for the 1801 and
3130 subspecialties, respectively. Determining the end strengths for each subspecialty
level in the HCA community is necessary for manpower planners to balance the force
structure, minimize personnel excesses and shortages that impact training and labor costs,
and manage career progression.

36
Figure 6. Patient Administration (1801) Inventory Forecast by Rank and FYs for FY14
and FY18
Figure 7. Manpower (3130) Inventory Forecast by Rank and FYs for FY14 and FY18

37
B. FUNDAMENTAL MATRIX
The fundamental matrix illustrated in Table 11 helps to evaluate the HCA
community. The main diagonals show the E[TIG] for each grade. For instance the
E[TIG] for an ensign with the subspecialty of 1800 is 1.94 years and the E[TIG] for a
lieutenant with a subspecialty of 1800 is 4.21 years. The same idea applies to the other
pay-grades.
Table 11. Fundamental Matrix
Table 12. Conditional Probabilities of Attaining Given States
Additionally, Table 12 indicates various conditional probabilities derived by
multiplying the fundamental matrix S, by the matrix of transition probabilities into the
absorbing states, Ab. In this model, a lieutenant with the subspecialty of 1800 has a 51%
probability of ever making a lateral move to another subspecialty (at some point in
his/her career) and a 49% probability of ever attriting outright. Both of these types of data
O-1/1800 O-2/1800 O-3/1800 O-4/1800 O-5/1800 O-6/1800
O-1/1800 1.94 1.61 3.32 1.32 0.25 0.20
O-2/1800 1.79 3.69 1.47 0.28 0.23
O-3/1800 4.21 1.68 0.32 0.26
O-4/1800 4.60 0.88 0.71
O-5/1800 3.28 2.65
O-6/1800 5.81
Latmove Attrition
O-1/1800 0.57 0.43
O-2/1800 0.55 0.45
O-3/1800 0.51 0.49
O-4/1800 0.41 0.59
O-5/1800 0.22 0.78
O-6/1800 0.09 0.91

38
provide manpower planners a description of how long an individual remains at various
states within the HCA community, as well as their probability of ever attaining differing
states within the community.
Table 13. Summary of Fundamental Matrix and Conditional Probabilities, FY14 and
FY18
C. MODEL VALIDATION
For the Markov model to satisfy the stationary requirement, the transition rates for
each i to j transition for each year must be sufficiently similar to the aggregate transition
probability. Using Sales graphical method for validation, we use the following steps to
validate the model in this study:
First, we aggregate the transition probability for each pij (Table 6). Then, we
calculate the standard error for each pij as:
1
2(1 )( ( ))
( )
ij ijij
i
p pSE p t
n t
1800 1801 1802 & 3121 1803 & 6201 1804 1805 3110 - 3112 3130 3150 3211
O-1 2 1 1 1 1 1 1 1 1 1
O-2 2 1 1 1 1 1 2 1 1 1
Expected Time in Grade O-3 4 2 3 2 4 2 3 3 2 6
(years) O-4 5 5 5 3 6 5 3 6 4 3
O-5 3 4 1 4 9 6 3 4 6 6
O-6 6 8 7 8 2 7 4 4 4 1
O-1 0.57 0.00 0.00 0.00 1.00 0.00 0.00 0.00 0.00 0.00
O-2 0.55 0.00 0.00 0.42 0.20 0.00 0.68 0.00 0.00 0.00
Latmoves O-3 0.51 0.28 0.32 0.42 0.20 0.25 0.68 0.66 0.00 0.00
O-4 0.41 0.23 0.29 0.24 0.20 0.17 0.61 0.77 0.00 1.00
O-5 0.22 0.00 0.00 0.29 0.00 0.15 0.47 0.87 0.00 1.00
O-6 0.09 0.00 0.00 0.00 0.00 0.09 0.14 0.67 0.00 0.00
O-1 0.43 0.00 0.00 0.00 0.00 0.00 0.00 0.00 0.00 0.00
O-2 0.45 0.00 0.00 0.52 0.80 0.00 0.32 0.00 0.00 0.00
Attrites O-3 0.49 0.66 0.46 0.52 0.80 0.75 0.32 0.34 0.80 1.00
O-4 0.59 0.67 0.35 0.63 0.80 0.83 0.39 0.23 0.75 0.00
O-5 0.78 0.75 0.00 0.43 1.00 0.85 0.53 0.13 0.00 0.00
O-6 0.91 0.00 1.00 0.00 1.00 0.91 0.86 0.33 1.00 0.00

39
With the standard error, we then calculate the confidence interval for each pij given as,
ˆ ˆ ˆ(t) ( ), ( ) ( )ij ijp se t p t se t . Finally, we compare each yearly confidence interval to
determine whether it contains ˆ ijp (Sales, 1971). The study uses the graphical method in
Figure 8 to confirm annual rates are sufficiently close to the aggregate (red line). This
means that our estimated pij (the aggregate) should fall within 70% confidence interval
we build around each annual pij(t). For example, Figure 8 shows the validation from the
probability of continuing in the state O-4/1800 given that the person started in state O-
4/1800. Thus, two-thirds of the estimated annual transition probabilities are sufficiently
close to the aggregate. We repeat this process for each pij.
Figure 8. Estimated Transition Probabilities for 70% Confidence Interval for O-4/1800
continuing as O-4/1800
Aggregate 0.80

40
1. Measure of Effectiveness—Percentage of Satisfactory Estimates
We calculate the proportion of confidence intervals that contain the corresponding
aggregate transition probabilities. An estimate is satisfactory when the interval for the
yearly ˆ ijp (t) contains the aggregate ˆ ijp . Using O-4/1800 to O-4/1800 as an example
(Figure 8), we find that of the three time annual transition rates we construct, only two
(66%) fall within the 70% confidence interval. The higher the proportion becomes, the
higher the confidence we have in the estimator or model and vice versa as seen in Figure
9 and Figure 10. The overall model validation provides 61% proportion of satisfactory
intervals for all years, FY11 through FY13 as seen in Figure 9. This is a valid model.
However, the model slightly improves by dropping the first transition year FY11. The
model, using data from FY12 through FY13 provides improved validity with 62%
satisfaction (Figure 10). The difference in satisfaction is not significant because as stated
earlier, this model is already a valid model using FY11 through FY13. But the case in
which the overall model is less than 60% proportion of satisfactory intervals (invalid
model), we continue to shrink the window of empirical data until we achieve a valid
model, or only one year remains. According to Seagren, 2013, any Markov model with
annual transitions built from one year of data is going to be stationary using this method.
Figure 9. Subspecialty 1800 Overall Model Satisfactory Validation by Year, FY11
through FY13

41
Figure 10. Subspecialty 1800 Overall Model Satisfactory Validation by Year, FY12 to
FY13
Table 14 highlights the proportion of satisfactory interval for each valid model in
bold fonts, by subspecialties and year.
Table 14. Model Satisfactory Validation for Each Subspecialty by Year
D. LIMITATIONS
The primary limitation with the model is the small sample size of some
subspecialties and the number of observations which result in an invalid model.
Therefore, the transition probabilities will be highly variable because of the small sample
size. As a result, we find certain transitions for given years might be abnormally high or
low. This is a relatively more significant problem for those subspecialties with smaller
inventories. Furthermore, the number of years’ worth of data provided by DMDC is not
sufficient enough to test the measure of effectiveness and predictive validity of the
During 1800 1801 1802 & 3121 1803 & 6201 1804 1805 3110 - 3112 3130 3150 3211 Aggregate
FY11-FY13 61% 64% 56% 53% 37% 53% 61% 71% 30% 38% 74%
FY12-FY13 69% 64% 71% 57% 44% 85%
FY13 100% 100%

42
models. As a result of these limitations, future studies need to collect further years of data
in order to further validate the stock forecasts and measure of effectiveness of the models.

43
V. SUMMARY, CONCLUSIONS AND RECOMMENDATIONS
A. SUMMARY
This research develops a Markov model to forecast the inventory for HCA
officers and to best match the accessioning plan to their recruiting and training targets.
Focusing on the HCA category of MSC officers allows for an in-depth analysis and a
more specific emphasis on one comparable group. Today, there are many manpower tools
available to determine accessions. However, due to the periodic rotations of community
managers and manpower planners within the MSC, it is necessary to have a standard tool
to manage the accessioning process. This would lower training cost and reduce the
learning curve for newly reporting community managers and manpower planners.
Furthermore, the use of the Markov model would develop an effective and functional
force planning for the MSC HCA community.
B. CONCLUSIONS AND RECOMMENDATIONS
How many HCA accessions are required to meet inventory requirements
over the next five years? How many HCA personnel should be classified into each
subspecialty?
a. Conclusion
Our model indicates that 76 new accessions are required to meet inventory
requirements in FY14 and 72 in each FY thereafter (FY15 through FY18). The appendix
provides the results of the fixed inventory model for each subspecialty showing the
number of personnel that should be accessed for training or classified into each
subspecialty over the next five years (Table 15-24).
The model provides the optimal accession mission to bring the HCA manning
levels to 100%. However, due to exogenous factors such as budgetary restrictions,
scarcity of training resources, and other limitations, the solution to the fixed inventory
model may prove infeasible in reality. The forecasts of the model should be weighed by
the workforce experience and analysis of manpower planners, and the HCA leadership.

44
Given that there are a limited number of decision making tools, the model proves to be
the only empirical tool currently available for aiding in future policy decisions.
b. Recommendation
We recommend BUMED manpower planners use the Markov model we develop
in this research as an accession planning tool to minimize deviation from target inventory
levels. Manpower planners should consistently update the Markov model with their
accessioning plans, to ensure that it reflects the most accurate billet requirements and
authorizations to allow for the optimal mix of accessions to meet recruiting, accessioning
and training goals.
How effective is the Markov model in determining inventory requirements
for the MSC HCA community?
c. Conclusion
The validation results demonstrate that the aggregate model for HCA officers is
valid and is currently optimal for use in force structure policy decision making. We
validated the models for each subspecialty and show that they either pass or fail the
stationary assumption required of Markov models by FYs. By shrinking the window of
empirical data, we find that approximately 70% of all transition probability estimates are
satisfactorily close to the respective aggregate estimate for each of the models.
When using the Markov model as a planning tool, consistency and accuracy are
important because budget analysts, community managers, and manpower planners rely on
manpower estimates during the fiscal year. In addition, program managers, recruiting and
training commands all rely on the most accurate manpower estimates to conduct
programming, budgeting, mission planning and execution. The Markov model also
proves to be an excellent decision making tool in future policy decisions.
d. Recommendation
Manpower planners should continue to collect data and closely monitor lateral
transfers to improve the model’s validity. As the number of observations in smaller

45
subspecialties matures, the collection of additional years of data should improve the
model’s validity as developed by this research.
C. FURTHER RESEARCH
The following topics are recommended for future research.
1. A study that assesses the continuation behavior of HCS and CCP
officers versus HCA officers. Since data is currently available, we
believe that researchers should explore in the near future.
2. Analysis of behavior between training and recruiting accessions
among the various HCA subspecialties.
3. Analysis of loss in terms of actual losses to the Navy, particularly
to subspecialty changes.
4. An examination of the inventory of secondary subspecialties when
determining how many of the specialties we need to train.

46
THIS PAGE INTENTIONALLY LEFT BLANK

47
VI. APPENDIX. FIXED INVENTORY MODEL FOR ALL
SUBSPECIALTY CODES (TABLES 15 – 24)
The appendix provides the fixed inventory model for each subspecialty code in
Tables 15 to 24. These show the number of new accessions manpower planners should
bring into the system and the training numbers for each subspecialty for future FYs.
Table 15. 1800 Inventory Forecast for FY13 to FY18
Table 16. 1801 Inventory Forecast for FY13 to FY18
Table 17. 1802 & 3121 Inventory Forecast for FY13 to FY18
1800 O-1 O-2 O-3 O-4 O-5 O-6 TotalTarget
FY13 n(0) 31 97 278 110 38 45 599 483
FY14 n(1) 15 57 260 110 33 43 517 483
FY15 n(2) 17 59 228 109 29 41 483 483
FY16 n(3) 25 80 206 106 27 39 483 483
FY17 n(4) 28 91 200 101 25 38 483 483
FY18 n(5) 29 97 200 97 24 36 483 483
R r
0 0.24 0.68 0.05 0.01 0 0.02
40 0.24 0.68 0.05 0.01 0 0.02
69 0.24 0.68 0.05 0.01 0 0.02
66 0.24 0.68 0.05 0.01 0 0.02
65 0.24 0.68 0.05 0.01 0 0.02
1801 O-1 O-2 O-3 O-4 O-5 O-6 Total Target
FY13 n(0) 0 0 2 21 5 3 31 70
FY14 n(1) 0 0 1 61 5 3 70 70
FY15 n(2) 0 0 1 58 8 4 70 70
FY16 n(3) 0 0 0 56 10 4 70 70
FY17 n(4) 0 0 0 54 11 5 70 70
FY18 n(5) 0 0 0 52 12 6 70 70
R r
43 0.0 0.0 0.0 1.0 0.0 0.0
8 0.0 0.0 0.0 1.0 0.0 0.0
9 0.0 0.0 0.0 1.0 0.0 0.0
9 0.0 0.0 0.0 1.0 0.0 0.0
9 0.0 0.0 0.0 1.0 0.0 0.0
1802 &
3121 O-1 O-2 O-3 O-4 O-5 O-6 Total Target
FY13 n(0) 0 3 22 28 8 4 65 83
FY14 n(1) 0 9 14 37 11 12 83 83
FY15 n(2) 0 7 9 40 9 18 83 83
FY16 n(3) 0 6 6 41 9 21 83 83
FY17 n(4) 0 6 4 41 9 24 83 83
FY18 n(5) 0 6 2 40 9 26 83 83
R r
36 0 0.25 0 0.25 0.25 0.25
28 0 0.25 0 0.25 0.25 0.25
25 0 0.25 0 0.25 0.25 0.25
24 0 0.25 0 0.25 0.25 0.25
24 0 0.25 0 0.25 0.25 0.25

48
Table 18. 1803 & 6201 Inventory Forecast for FY13 to FY18
Table 19. 1804 Inventory Forecast for FY13 to FY18
Table 20. 1805 Inventory Forecast for FY13 to FY18
1803 &
6201 O-1 O-2 O-3 O-4 O-5 O-6 Total Target
FY13 n(0) 0 2 15 8 6 2 33 33
FY14 n(1) 0 0 11 8 11 2 33 33
FY15 n(2) 0 0 6 8 15 3 33 33
FY16 n(3) 0 0 4 7 18 4 33 33
FY17 n(4) 0 0 2 5 20 6 33 33
FY18 n(5) 0 0 1 4 20 7 33 33
R r
6 0 0 0 0 1 0
6 0 0 0 0 1 0
5 0 0 0 0 1 0
5 0 0 0 0 1 0
5 0 0 0 0 1 0
1804 O-1 O-2 O-3 O-4 O-5 O-6 Total Target
FY13 n(0) 0 0 5 8 3 0 16 19
FY14 n(1) 0 0 4 8 3 4 19 19
FY15 n(2) 0 0 3 7 3 5 19 19
FY16 n(3) 0 0 2 7 4 7 19 19
FY17 n(4) 0 0 2 6 4 8 19 19
FY18 n(5) 0 0 1 5 4 9 19 19
R r
4 0 0 0 0 0 1
3 0 0 0 0 0 1
4 0 0 0 0 0 1
4 0 0 0 0 0 1
5 0 0 0 0 0 1
1805 O-1 O-2 O-3 O-4 O-5 O-6 Total Target
FY13 n(0) 0 0 18 50 31 20 119 164
FY14 n(1) 0 0 11 66 37 51 164 164
FY15 n(2) 0 0 6 62 40 56 164 164
FY16 n(3) 0 0 4 58 42 60 164 164
FY17 n(4) 0 0 2 54 44 64 164 164
FY18 n(5) 0 0 1 50 44 68 164 164
R r
56 0 0 0 0.36 0.09 0.55
17 0 0 0 0.36 0.09 0.55
17 0 0 0 0.36 0.09 0.55
17 0 0 0 0.36 0.09 0.55
17 0 0 0 0.36 0.09 0.55

49
Table 21. 3110-3112 Inventory Forecast for FY13 to FY18
Table 22. 3130 Inventory Forecast for FY13 to FY18
Table 23. 3150 Inventory Forecast for FY13 to FY18
Table 24. 3211 Inventory Forecast for FY13 to FY18
3110 -
3112 O-1 O-2 O-3 O-4 O-5 O-6 Total Target
FY13 n(0) 0 3 36 23 10 6 78 79
FY14 n(1) 0 11 31 24 8 5 79 79
FY15 n(2) 0 13 32 23 6 5 79 79
FY16 n(3) 0 14 34 22 5 4 79 79
FY17 n(4) 0 14 35 22 5 3 79 79
FY18 n(5) 0 14 36 22 4 3 79 79
R r
19 0 0.5 0.25 0.25 0 0
17 0 0.5 0.25 0.25 0 0
16 0 0.5 0.25 0.25 0 0
16 0 0.5 0.25 0.25 0 0
16 0 0.5 0.25 0.25 0 0
3130 O-1 O-2 O-3 O-4 O-5 O-6 Total Target
FY13 n(0) 0 0 12 12 4 3 31 35
FY14 n(1) 0 0 8 13 9 5 35 35
FY15 n(2) 0 0 6 13 11 5 35 35
FY16 n(3) 0 0 4 12 12 6 35 35
FY17 n(4) 0 0 3 11 14 7 35 35
FY18 n(5) 0 0 2 10 15 8 35 35
R r
7 0 0 0 0 0.75 0.25
4 0 0 0 0 0.75 0.25
5 0 0 0 0 0.75 0.25
5 0 0 0 0 0.75 0.25
5 0 0 0 0 0.75 0.25
3150 O-1 O-2 O-3 O-4 O-5 O-6 Total Target
FY13 n(0) 0 1 1 4 1 0 7 19
FY14 n(1) 0 0 1 17 1 0 19 19
FY15 n(2) 0 0 0 16 2 0 19 19
FY16 n(3) 0 0 0 15 3 0 19 19
FY17 n(4) 0 0 0 15 4 0 19 19
FY18 n(5) 0 0 0 14 5 0 19 19
R r
14 0 0 0 1 0 0
3 0 0 0 1 0 0
3 0 0 0 1 0 0
3 0 0 0 1 0 0
3 0 0 0 1 0 0
3211 O-1 O-2 O-3 O-4 O-5 O-6 Total Target
FY13 n(0) 0 1 3 2 3 0 9 7
FY14 n(1) 0 0 2 1 3 0 7 7
FY15 n(2) 0 0 2 2 3 0 7 7
FY16 n(3) 0 0 2 2 3 0 7 7
FY17 n(4) 0 0 1 2 3 0 7 7
FY18 n(5) 0 0 1 2 3 0 7 7
R r
0 0 0 0 1 0 0
1 0 0 0 1 0 0
1 0 0 0 1 0 0
1 0 0 0 1 0 0
1 0 0 0 1 0 0

50
THIS PAGE INTENTIONALLY LEFT BLANK

51
LIST OF REFERENCES
Bartholomew, D.J., Forbes, A.F., & McClean, S.I. (1991). Statistical techniques for
manpower planning. Chichester, England: John Wiley & Sons.
Bartholomew, D.J. (1971). The statistical approach to manpower planning. Journal of the
Royal Statistical Society. 20(1), 3–26.
Birge, J.R. & Pollock S.M. (1989). Modelling rural police patrol. Journal of Operational
Research Society, 40, 41–54.
BUMED, (2013). Medical Service Corps Report [Internal document]. Falls Church, VA:
Author.
Faddy, M. & McClean, S.I. (2005). Markov chain modelling for geriatric patient care.
Methods of Information in Medicine, pp. 369–373.
Farr, D. (1994). Analysis of U.S. Navy Medical Service Corps health care administrator
direct and in-service procurement accession programs (Master’s thesis).
Retrieved from www.dtic.mil/cgi-bin/GetTRDoc?AD=ADA297218
Forbes, A.F. (1971). Markov chain model for manpower systems. In D. J.. Bartholomew
and A. R. Smith (Eds.), Manpower and Management Science (pp. 93–113).
London: English Universities Press.
Davies, G.S. (1973). Structural control in a graded manpower system. Management
Science, 20(1), pp 76–84.
Davies, G.S. (1981). Maintainable regions in a Markov manpower model. Journal of
Applied Probability, 18(3), 738–742.
Deen, G. & Buni, G. (2004). Development of a steady state model for forecasting U.S.
Navy Nurse Corps personnel (Master’s thesis). Retrieved from www.dtic.mil/cgi-
bin/GetTRDoc?AD=ADA422191.
Dolfinin, M. (1989). Navy Medical Service Corps attrition and retention for FY 1983
through FY 1988, Center for Naval Analysis study. Retrieved from
www.dtic.mil/cgi-bin/GetTRDoc?AD=ADA445299.
Erhardt Jr, J.B. (2012). Development of a Markov model for forecasting continuation
rates for enlisted prior service and non-prior service personnel in the Selective
Marine Corps Reserve (SMCR) (Master’s thesis). Retrieved from
https://calhoun.nps.edu/public/bitstream/handle/10945/6791/12Mar_Erhardt.pdf?s
equence=1.
52
Grinold, C. & Marshall, T. (1977). Manpower planning models. New York: Elsevier-
North Holland.
Hall, G. & Moore, S. (1982). Uncertainty in personnel force modeling. Retrieved from
the RAND Corporation website:
www.rand.org/content/dam/rand/pubs/notes/2005/N1842.pdf
Hatch, W. (2013). Navy manpower requirements process. Retrieved from Naval
Postgraduate School Course MN4119 Sakai site: https://cle.nps.edu/xsl-
portal/site/~sjosiah.
Hoglin, P. (2004). Survival analysis and accession optimization of prior enlisted United
States Marine Corps officers (Master’s thesis). Retrieved from www.dtic.mil/cgi-
bin/GetTRDoc?AD=ADA422142.
Houser, K.J. (1996). Personnel planner in the Medical Service Corps: A training guide
for healthcare executives (Master’s thesis). Retrieved from www.dtic.mil/cgi-
bin/GetTRDoc AD ADA32 9 .
Kinstler, D., & Johnson, R. (2005). Developing a Markov model to be used as a force
shaping tool for the Navy Nurse Corps (Master’s thesis). Retrieved from
www.dtic.mil/cgi-bin/GetTRDoc?AD=ADA432402&Location.
Licari, D.A. (2013). Developing a Markov model for forecasting end strength of Selected
Marine Corps Reserve (SMCR) officers (Master’s thesis). Retrieved from
http://calhoun.nps.edu/public/bitstream/handle/10945/32856/13Mar_Licari_Antho
ny.pdf?sequence=1.
Navy Knowledge Online Website, Medical Service Corps Homepage, (2013). Retrieved
from https://www.nko.navy.mil/portal/page?paf_pageId=page12263.
Robinson Jr., A. (2011). Admiral’s call: Navy medicine building the future force. Navy
Medicine,Spring 2011, p. 4.
Rostker, B., Thie, H., Lacy, J., Kawata, J., & Purnell, S. (1993). The defense officer
personnel management act of 1980: A retrospective assessment. Retrieved from
the RAND Corporation website:
http://www.rand.org/content/dam/rand/pubs/reports/1993/R4246.pdf
Sales, P. (1971). The validity of the Markov chain model for a class of the civil service.
Journal of the Royal Statistical Society 20(1), 85–110.
Seagren, W.C. (2013). Manpower and Personnel Models, Retrieved from Naval
Postgraduate School Course OS4701 Sakai site: https://cle.nps.edu/xsl-
portal/site/~sjosiah.
53
Smith, A.R. (1970). Models of manpower systems. London: The English Universities
Press Limited.
Sonnenberg, F. & Beck, J. (1993). Markov models in medical decision making: A
practical guide. Medical Decision Making, 13, 322–338.
Statement of Vice Admiral Matthew L. Nathan, MC, USN Surgeon General of the Navy
before the Subcommittee on Military Personnel of the House Armed Services
Committee: Defense Health Program Budget Overview, March 21, 2012.
Ugwuowo, F.I. & McClean, S.I. (2000). Modelling heterogeneity in a manpower
system:a review. Applied Stochastic Models in Business and Industry, 16, 99–110.
Vajda, S. (1978). Mathematics of manpower planning. New York: Wiley.
Vance, V. (2006). Determining personnel accession requirements for Medical Service
Corps health care administrators using a steady state analysis (Master’s thesis).
Retrieved from www.dtic.mil/cgi-bin/GetTRDoc AD ADA 299 .
Vassiliou, P.-C. G. (1997), The evolution of the theory of non-homogeneous Markov
systems. Applied Stochastic Models Data Analysis 13, 159–176
Zanakis, S.H. & Maret, M.W. (1980). A Markov chain application to manpower supply
planning. The Journal of the Operational Research Society, 31(12), 1095–1102.

54
THIS PAGE INTENTIONALLY LEFT BLANK

55
INITIAL DISTRIBUTION LIST
1. Defense Technical Information Center
Ft. Belvoir, Virginia
2. Dudley Knox Library
Naval Postgraduate School
Monterey, California