naval postgraduate school - apps.dtic.mil · resources to make productive decisions towards...
TRANSCRIPT

NAVAL
POSTGRADUATE SCHOOL
MONTEREY, CALIFORNIA
THESIS ASSESSING PERFORMANCE MEASUREMENT FOR THE
NAVAL SURFACE WARFARE CENTER, PORT HUENEME DIVISION
by
Thomas J. Dickinson
December 2005
Thesis Co-Advisors: Mary Malina K.J. Euske
Approved for public release; distribution is unlimited

THIS PAGE INTENTIONALLY LEFT BLANK

i
REPORT DOCUMENTATION PAGE Form Approved OMB No. 0704-0188
Public reporting burden for this collection of information is estimated to average 1 hour per response, including the time for reviewing instruction, searching existing data sources, gathering and maintaining the data needed, and completing and reviewing the collection of information. Send comments regarding this burden estimate or any other aspect of this collection of information, including suggestions for reducing this burden, to Washington headquarters Services, Directorate for Information Operations and Reports, 1215 Jefferson Davis Highway, Suite 1204, Arlington, VA 22202-4302, and to the Office of Management and Budget, Paperwork Reduction Project (0704-0188) Washington DC 20503. 1. AGENCY USE ONLY (Leave blank)
2. REPORT DATE December 2005
3. REPORT TYPE AND DATES COVERED Master’s Thesis
4. TITLE AND SUBTITLE: Assessing Performance Measurement for the Naval Surface Warfare Center, Port Hueneme Division
6. AUTHOR(S) Dickinson, Thomas J.
5. FUNDING NUMBERS
7. PERFORMING ORGANIZATION NAME(S) AND ADDRESS(ES) Naval Postgraduate School Monterey, CA 93943-5000
8. PERFORMING ORGANIZATION REPORT NUMBER
9. SPONSORING / MONITORING AGENCY NAME(S) AND ADDRESS(ES) N/A
10. SPONSORING / MONITORING AGENCY REPORT NUMBER
11. SUPPLEMENTARY NOTES The views expressed in this thesis are those of the author and do not reflect the official policy or position of the Department of Defense or the U.S. Government. 12a. DISTRIBUTION / AVAILABILITY STATEMENT Approved for public release; distribution is unlimited
12b. DISTRIBUTION CODE
13. ABSTRACT (maximum 200 words) Performance measurement is a growing field of study and practice within federal government. From department level agencies to unit level commands, measuring performance is critical to achieving strategic objectives within public resource constraints. Performance metrics enable federal managers entrusted with the nation’s resources to make productive decisions towards operational effectiveness and economic efficiency. This thesis assesses the performance measurement system of a singular organization: Naval Surface Warfare Center, Port Hueneme Division (PHD). This assessment addresses the appropriateness and quality of existing metrics at PHD based on academic research, while also comparing performance measurement at PHD with federal guidance. Performance drivers were captured during interviews with senior managers in offices and departments at PHD. These interviews were used to gain visibility into PHD’s “story of success” in terms of critical inputs, processes, and outcomes. Causal performance maps were utilized to visually depict the interaction among these performance drivers and determine common critical performance variables (CPV) across PHD. Once determined, common CPV’s were analyzed and existing metrics were assessed within balance scorecard perspectives. This analysis and assessment provided a framework for comparison between PHD and the performance measurement guidance within the federal chain of command. The assessment of existing metrics and recommendations will hopefully be useful to NSWC PHD in continuing progress toward achieving strategic success. It is also hoped that this thesis will provide a common framework for performance analysis to other Naval Surface Warfare Center commands.
15. NUMBER OF PAGES
137
14. SUBJECT TERMS Performance Metric, Critical Performance Variable, Causal Performance Map, Balanced Scorecard, Performance
16. PRICE CODE
17. SECURITY CLASSIFICATION OF REPORT Unclassified
18. SECURITY CLASSIFICATION OF THIS PAGE Unclassified
19. SECURITY CLASSIFICATION OF ABSTRACT Unclassified
20. LIMITATION OF ABSTRACT
UL

ii
THIS PAGE INTENTIONALLY LEFT BLANK

iii
Approved for public release; distribution is unlimited
ASSESSING PERFORMANCE MEASUREMENT FOR THE NAVAL SURFACE WARFARE CENTER, PORT HUENEME DIVISION
Thomas J. Dickinson
Lieutenant Commander, United States Navy B.S., United States Naval Academy, 1995
Submitted in partial fulfillment of the requirements for the degree of
MASTER OF BUSINESS ADMINISTRATION
from the
NAVAL POSTGRADUATE SCHOOL December 2005
Author: Thomas J. Dickinson
Approved by: Mary A. Malina
Thesis Co-Advisor
Kenneth J. Euske Thesis Co-Advisor
Robert N. Beck Dean, Graduate School Business and Public Policy

iv
THIS PAGE INTENTIONALLY LEFT BLANK

v
ABSTRACT
Performance measurement is a growing field of study and practice within federal
government. From department level agencies to unit level commands, measuring
performance is critical to achieving strategic objectives within public resource
constraints. Performance metrics enable federal managers entrusted with the nation’s
resources to make productive decisions towards operational effectiveness and economic
efficiency. This thesis assesses the performance measurement system of a singular
organization: Naval Surface Warfare Center, Port Hueneme Division (PHD). This
assessment addresses the appropriateness and quality of existing metrics at PHD based on
academic research, while also comparing performance measurement at PHD with federal
guidance. Performance drivers were captured during interviews with senior managers in
offices and departments at PHD. These interviews were used to gain visibility into
PHD’s “story of success” in terms of critical inputs, processes, and outcomes. Causal
performance maps were utilized to visually depict the interaction among these
performance drivers and determine common critical performance variables (CPV) across
PHD. Once determined, common CPV’s were analyzed and existing metrics were
assessed within balance scorecard perspectives. This analysis and assessment provided a
framework for comparison between PHD and the performance measurement guidance
within the federal chain of command. The assessment of existing metrics and
recommendations will hopefully be useful to NSWC PHD in continuing progress toward
achieving strategic success. It is also hoped that this thesis will provide a common
framework for performance analysis to other Naval Surface Warfare Center commands.

vi
THIS PAGE INTENTIONALLY LEFT BLANK

vii
TABLE OF CONTENTS
I. INTRODUCTION........................................................................................................1 A. BACKGROUND ..............................................................................................1 B. OBJECTIVE ....................................................................................................3 C. RESEARCH QUESTIONS.............................................................................4 D. SCOPE AND LIMITATIONS........................................................................4
1. PHD .......................................................................................................4 2. Alignment and Metrics ........................................................................4 3. Perspective ............................................................................................4 4. Limitations............................................................................................5
E. METHODOLOGY ..........................................................................................5 1. Tacit Knowledge...................................................................................5 2. Interviews..............................................................................................5 3. Causal Performance Maps ..................................................................5 4. Performance Measurement Assessment ............................................6
F. ORGANIZATION OF THESIS .....................................................................6
II. LITERATURE REVIEW ...........................................................................................7 A. THE NEED FOR PERFORMANCE MEASUREMENT............................7 B. PERFORMANCE MEASUREMENT IN DETAIL .....................................8
1. Strategy and Performance Measurement Systems ...........................8 2. Selecting Performance Measures........................................................9 3. Balance Among Performance Measures..........................................10 4. Using Performance Measures ...........................................................11 5. Pervasiveness in Performance Measurement..................................12
III. FEDERAL GUIDANCE REVIEW..........................................................................13 A. FEDERAL PERFORMANCE MEASUREMENT HISTORY AND
POLICY..........................................................................................................13 1. Government Performance and Results Act of 1993 (GPRA).........13 2. GAO High-Risk Series.......................................................................14
a. Approach to Business Transformation ..................................14 b. Business Systems Modernization ...........................................14 c. Financial Management...........................................................14 d. Supply Chain Management ....................................................14 e. Weapons Systems Acquisition ................................................15 f Contract Management ............................................................15
3. President’s Management Agenda.....................................................15 4. Office of Management and Budget...................................................17 5. Office of the Secretary of Defense (OSD) ........................................19
a. Strategic Management of Human Capital Initiative .............21 b. Competitive Sourcing..............................................................22 c. Improved Financial Management..........................................22

viii
d. Expanded Electronic Government .........................................22 e. Budget and Performance Integration Initiative ....................23
6. Secretary of the Navy and Financial Management and Budget ....23 B. STRATEGIC OBJECTIVES........................................................................25
1. The Secretary of the Navy.................................................................25 2. Chief of Naval Operations.................................................................25 3. Naval Sea Systems Command...........................................................26 4. Naval Surface Warfare Center .........................................................26 5. Naval Surface Warfare Center, Port Hueneme Division ...............27
IV. COLLECTED DATA ................................................................................................29 A. INTERVIEWS................................................................................................29 B. CAUSAL PERFORMANCE MAPS ............................................................30
1. Engineering and Technology ............................................................32 a. Outcomes .................................................................................32 b. Processes..................................................................................33 c. Inputs.......................................................................................36
2. Office of Logistics...............................................................................38 a. Outcomes .................................................................................38 b. Processes..................................................................................39 c. Inputs.......................................................................................40
3. Comptroller ........................................................................................42 a. Outcomes .................................................................................42 b. Processes..................................................................................43 c. Inputs.......................................................................................44
4. Office of Corporate Business ............................................................45 a. Outcomes .................................................................................45 b. Processes..................................................................................46 c. Inputs.......................................................................................47
5. Office of Technical Operations .........................................................48 a. Outcomes .................................................................................48 b. Processes..................................................................................48 c. Inputs.......................................................................................49
6. Ship Defense and Expeditionary Warfare Department .................50 a. Outcomes .................................................................................51 b. Processes..................................................................................51 c. Inputs.......................................................................................53
7. Consolidated Causal Performance Map ..........................................55
V. ANALYSIS AND ASSESSMENT OF EXISTING METRICS .............................57 A. CRITICAL PERFORMANCE VARIABLES.............................................57
1. Learning and Growth Perspective ...................................................60 a. Human Capital Input..............................................................60 b. Workforce Development Process............................................61 c. Task Force Lean Process........................................................62 d. Communication and Collaboration Processes.......................62 e. Competent Workforce Outcome .............................................64

ix
2. Internal Business Processes Perspective ..........................................64 a. Requirements and Regulations Input ....................................64 b. Project Planning Process........................................................65 c. Project Execution Process ......................................................65 d 66 e. Task Force Lean Process........................................................67 f. Cost, Schedule, Performance Outcome..................................67 g. Standardized Processes Outcome ...........................................67
3. Customer Perspective ........................................................................67 a. Fleet Requirements Input .......................................................68 b. Project Planning Process........................................................68 c. Project Execution Process ......................................................69 d. Fleet Combat Readiness Outcome..........................................69 e. Cost, Schedule, Performance Outcome..................................69 f. Customer Satisfaction Outcome .............................................70
4. Financial Perspective .........................................................................70 a. Financial Regulation Input ....................................................71 b. Budgeting and Execution Process..........................................71 c. Communication and Collaboration Processes.......................73 d. Meeting NOR and Carryover Goals Outcome .......................73
B. ASSESSMENT OF EXISTING PERFORMANCE METRICS AT PHD .................................................................................................................73 1. Learning and Growth Perspective ...................................................74
a. Human Capital Input..............................................................75 b. Workforce Development Process............................................75 c. Task Force Lean Process........................................................77 d. Communication and Collaboration Processes.......................77 e. Competent Workforce Outcome .............................................78
2. Internal Business Processes Perspective ..........................................79 a. Requirements and Regulations Input ....................................81 b. Project Planning Process........................................................81 c. Project Execution Process ......................................................82 d. Contracting Process ................................................................83 e. Leadership and Oversight, Communication, and
Collaboration Processes..........................................................83 f. Task Force Lean Process........................................................84 g. Standardized Processes Outcome ...........................................85
3. Customer Perspective ........................................................................85 a. Requirements Input.................................................................85 b. Project Planning and Project Execution Processes...............87 c. Communication and Collaboration Processes.......................90 d. Fleet Combat Readiness Outcome..........................................90 e. Customer Satisfaction and Cost, Schedule, Performance
Outcomes .................................................................................91 4. FINANCIAL PERSPECTIVE..........................................................91

x
a. Financial Regulations Input ..................................................92 b. Budgeting and Execution Process..........................................92 c. Communication and Collaboration Processes.......................93 d. Meet NOR and Carryover Goals Outcome.............................94
VI. ALIGNMENT OF PHD WITH FEDERAL GUIDANCE .....................................95 A. NSWC HEADQUARTERS...........................................................................95 B. NAVSEA .........................................................................................................97 C. CNO.................................................................................................................98 D. SECNAV AND FMB....................................................................................100 E. DOD...............................................................................................................102 F. OFFICE OF MANAGEMENT AND BUDGET .......................................103
1. Program Purpose and Design .........................................................104 2. Strategic Planning............................................................................105 3. Program Management.....................................................................107 4. Program Results/Accountability.....................................................107
G. PRESIDENT’S MANAGEMENT AGENDA............................................108
VII. CONCLUSIONS ......................................................................................................111 A. EXISTING METRICS ................................................................................111 B. ALIGNMENT WITH FEDERAL GUIDANCE .......................................111 C. POTENTIAL FOR FUTURE RESEARCH..............................................112
LIST OF REFERENCES....................................................................................................115
INITIAL DISTRIBUTION LIST .......................................................................................119

xi
LIST OF FIGURES
Figure 1. NSWC PHD Organizational Chart (NSWC PHD 2005) ..................................2 Figure 2. Cybernetic Feedback Model (From: Simons 2000)...........................................7 Figure 3. Balance Scorecard Model (Kaplan and Norton 1992).....................................11 Figure 4. Alignment of DOD Risk Management Framework with Balanced
Scorecard Perspectives (OSD/PA&E 2005) ....................................................19 Figure 5. OSD Balanced Scorecard Process (From Assistant Secretary of the Army
for Financial Management and Comptroller) ..................................................20 Figure 6. DOD Risk Area Scorecard Goals (DOD 2004) ...............................................21 Figure 7. Navy Balanced Scorecard (FMB 2005)...........................................................24 Figure 8. Alignment of Strategic Goals through NSWC PHD........................................28 Figure 9. Causal Performance Map – Subject A.............................................................32 Figure 10. Causal Performance Map – Subject B .............................................................38 Figure 11. Causal Performance Map – Subject C .............................................................42 Figure 12. Causal Performance Map – Subject D.............................................................45 Figure 13. Causal Performance Map – Subject E .............................................................47 Figure 14. Causal Performance Map – Subject F..............................................................50 Figure 15. PHD Consolidated Causal Performance Map..................................................54 Figure 16. Common CPV’s Across PHD..........................................................................59 Figure 17. Learning and Growth Perspective CPV’s ........................................................60 Figure 18. Internal Business Processes CPV’s..................................................................64 Figure 19. Customer Perspective CPV’s...........................................................................68 Figure 20. Financial Perspective CPV’s............................................................................70 Figure 21. PHD Human Capital Process (NSWC PHD 2005)..........................................79 Figure 22. ROI Methodology (Phillips 2005, NSWC PHD 2005)....................................83 Figure 23. PHD Risk Assessment Framework (NSWC PHD 2003).................................87 Figure 24. Alignment of PHD and NSWC Strategic Objectives ......................................95 Figure 25. Alignment of PHD and NAVSEA Strategic Objectives..................................97 Figure 26. Alignment of PHD and CNO Strategic Objectives..........................................99 Figure 27. Alignment of PHD and SECNAV Strategic Enablers ...................................100 Figure 28. PART Program Purpose and Design Questions.............................................103 Figure 29. PART Strategic Planning Questions..............................................................105 Figure 30. PART Program Management Questions........................................................106 Figure 31. PART Program Results/Accountability Questions........................................107

xii
THIS PAGE INTENTIONALLY LEFT BLANK

xiii
LIST OF TABLES
Table 1. 2005 Department of Defense PART Ratings (OMB 2005) .............................18 Table 2. Interview Protocol............................................................................................31 Table 3. Earned Value Management System (Naval Postgraduate School 2005) .........52 Table 4. CPV’s Across PHD..........................................................................................58 Table 5. Existing Metrics and Suggestions (Learning and Growth)..............................74 Table 6. Existing Metrics and Suggestions(Internal Business Processes) .....................80 Table 7. Existing Metrics and Suggestions (Customer Perspective) .............................86 Table 8. Existing Metrics and Suggestions (Financial Perspective)..............................92

xiv
THIS PAGE INTENTIONALLY LEFT BLANK

xv
ACKNOWLEDGMENTS
I would like to thank Dr. Ken Euske and Dr. Mary Malina for their mentorship in
guiding me through the thesis process. They made this experience both professionally
rewarding and personally enjoyable.
I am very thankful for the opportunity to interact with the line managers at Naval
Surface Warfare Center, Port Hueneme Division. Captain Stephen Huber was a very
gracious host, and Mr. Michael Sauthoff went well out of his way to accommodate my
research needs. I especially thank the interview subjects for taking time out of their work
schedule to engage in open, honest, and candid discussions throughout the course of this
research.
I also thank my wife for her patience, love, and understanding as I focused on
completing this milestone. Most importantly, I thank God for blessing me in so many
different ways.

xvi
THIS PAGE INTENTIONALLY LEFT BLANK

1
I. INTRODUCTION
A. BACKGROUND Performance measurement is a critical function within federal agencies, now more
than ever. The federal government currently spends over $2 trillion on approximately
1,000 federal programs, and the American people are entitled to know what they are
getting for their money (Office of Management and Budget (OMB) 2004). The passage
of the Government Performance and Results Act (GPRA) of 1993 set the stage for
sweeping changes in federal business practices, requiring strategic planning and
performance measurement within all federal agencies and programs. The current
administration under President Bush is dedicated to improving compliance with the
GPRA. This commitment is becoming pervasive within the Department of the Navy,
permeating down to the unit command level.
This study focuses on one such unit within the Naval Sea Systems Command
(NAVSEA). The Naval Surface Warfare Center, Port Hueneme Division (PHD) is
involved in the acquisition and in-service support of Navy surface warfare systems. The
command was established in 1962 by the Chief of Naval Operations, Admiral Arleigh
Burke to “oversee the testing, installation, and support of surface missile systems to
assure their operability.” For almost 30 years Port Hueneme operated as an individual
Naval engineering facility. The Base Relocation and Closure Act (BRAC) of 1991
established the Naval Surface Warfare Center (NSWC) to consolidate naval weapons and
engineering activities under a parent command (NSWC 2005). Port Hueneme then
became one of six divisions within NSWC, with activities strategically located in five
geographic areas.
The current mission of PHD is “to integrate, test, evaluate, and provide life-cycle
engineering and logistics for today’s and tomorrow’s surface warfare systems (NSWC
PHD 2005).” PHD’s work on surface ships ranges from existing Aegis ships and
carriers, to new production platforms such as DD(X) and the Littoral Combat Ship
(LCS). The desired outcomes at PHD are combat and weapons systems that are safe,
effective, and affordable for the fleet. Functioning in this role, PHD serves as the link

between the acquisition community and the operational fleet for weapon system
integration, technical authority, and engineering logistics solutions (NSWC PHD 2005).
These focus areas require a knowledge-based organization that is heavily involved in the
operations and sustainment (O&S) phase of the acquisition cycle.
PHD’s organization is comprised of four offices and five departments as
illustrated in Figure 1. The Air Dominance, Ship Defense & Expeditionary Warfare, and
Land Attack Departments are located in Port Hueneme, CA. The Gun Systems
Department is located in Louisville, KY, and the Land & Sea Test Department is located
at White Sands, NM.
NAVSEA VADM Sullivan
NSWC RADM Macy
Ships and Ship Systems
Surface Ship Combat Systems
Surface Ship Combat Systems
Surface Ship Combat Systems
Assessment Ordnance
Port Hueneme Division
Corona Division Indian Head Division Carderock Division Dahlgren Division Crane Division
Office of Technical Operations
Office of Logistics Office of Engineering & Technology
Office of Corporate Business
2
Air Dominance Department
Ship Defense & Expeditionary
Warfare Department
Land Attack Department
Gun Systems Department
Land & Sea Test Department
Figure 1. NSWC PHD Organizational Chart (NSWC PHD 2005)
The five departments provide the majority of services funded by program
sponsors, while the four offices serve in a supporting role of the PHD enterprise. PHD
has the “lead” for all installation, testing, and support of surface warfare systems in the
Navy, while playing a supporting role in the concept, design, build, fix, and
decommission (disposal) stages of the acquisition life cycle. As a knowledge-based
organization, the only physical products produced by PHD are predominantly
information-based, such as technical manuals, maintenance procedures, or test plans.

3
The greater part of its contribution to the Navy is in services provided to enhance the
effectiveness of warfare systems in the hands of the end-user. (NSWC PHD 2005)
As a Navy Working Capital Fund (NWCF), PHD receives 63 percent of their
funded workload from Program Executive Officer (PEO) Integrated Warfare Systems
(IWS), and 15 percent from PEO Ships. The remainder of their funding comes from
NAVSEA, the Naval Air Systems Command, and PEO Carriers, with eight percent
originating from various other organizations. Due to the nature of the technically-
oriented work PHD performs, a great emphasis is placed on the visionary aspects of
innovation and process development. This effort must also be balanced with
affordability. The four offices of Engineering and Technology, Logistics, Corporate
Business, and Technical Operations support the PHD enterprise by ensuring there is a
balance between a visionary and day-to-day focus in the planning and execution of work
at PHD. While the offices function in a supporting role, their leadership in that role is
critical to the successful execution of PHD’s mission. (NSWC PHD 2005)
With a business base of approximately $600 million per year, the span of control
at PHD necessitates performance measurement. With sound performance measurement
and management control, NSWC PHD can answer three critical questions:
- Are we focused on core competencies?
- Are we performing well in those core competencies?
- Are we linking our performance metrics with strategy?
B. OBJECTIVE The purpose of this thesis is twofold. The first objective is to assess the
appropriateness and quality of the existing performance measurement system at PHD
based on an academic literature review. The second objective is to assess performance
measurement at PHD in a comparative framework with OMB, the Office of the Secretary
of Defense (OSD), the Office of the Secretary of the Navy (SECNAV), and the chain of
command above PHD. The intended products are recommendations for improved
I moved a line of text to the next page for more text at top of page

4
alignment and operational effectiveness of performance measurement at PHD. Each
office at PHD was studied, and after analysis of collected data, assessments and
recommendations are suggested.
C. RESEARCH QUESTIONS The primary research questions studied were:
• Research Question 1: Are the performance metrics currently in place adequate for PHD to achieve its strategic objectives?
• Research Question 2: Is the performance measurement system at PHD aligned with OMB, OSD, and SECNAV guidance?
In addition, several secondary questions are addressed including:
- What are the command mission, strategy, goals, and “story of success” at PHD?
- What are the existing performance metrics at PHD?
- What are the critical performance variables at PHD?
- How is performance measurement used at PHD?
D. SCOPE AND LIMITATIONS
1. PHD This thesis is limited to an overall assessment of performance measurement at
PHD. While recommendations at the tactical level are discussed, the intended scope is to
provide an overarching evaluation. It is possible that the results of this thesis will have
applications to other Warfare Centers (WC) within NSWC. However, recommendations
are limited to improving the existing performance measurement system at PHD.
2. Alignment and Metrics In terms of alignment, this thesis is limited to an overarching evaluation of the
linkage between PHD and OMB, OSD, and SECNAV performance measurement
execution. Metrics are limited to those appropriate for supporting the strategy of PHD.
3. Perspective This thesis is written from the perspective that its primary users will be the senior
managers of PHD.

5
4. Limitations This is the author’s first exposure to a Navy Working Capital Fund (NWCF)
activity and a knowledge-based organization. The learning process that accompanied
research may be evident at different points in this thesis.
E. METHODOLOGY This thesis attempts to assess performance measurement at PHD by establishing a
foundation of academic research in the subject area, and then applying this knowledge to
data gathered in personal interviews with senior and middle management.
1. Tacit Knowledge PHD is a knowledge-based organization that is technically focused. The strategy
of this organization is ever-evolving and forward-looking. The best source of strategic
and operational information in an organization such as this comes from the tacit
knowledge of experienced managers within the ranks. Tacit knowledge is not easily
accessible because it is deeply ingrained in the minds of organizational members. Tacit
knowledge can be articulated by organizational members if they are asked the right
questions and allowed to “tell a story” or use metaphors to get their point across.
(Ambrosini and Bowman 2002). Capturing this knowledge provides a solid foundation
for an objective assessment of the performance measurement system.
2. Interviews The medium used for capturing tacit knowledge was personal interviews with
senior and middle management at PHD. While a formal format for the interviews was
utilized as a starting point, discussions evolved to informal and candid exchanges.
Support from the leadership of PHD was essential in creating a cooperative atmosphere
during these interviews. It was experienced without exception.
3. Causal Performance Maps Cognitive maps are the representation of an individual’s personal knowledge
(Ambrosini and Bowman 2002), and of an individual’s own experience (Weick and
Bougon 1986), and they are ways of representing individuals’ views of reality (Eden et
al. 1981). Causal maps are a type of cognitive map that reflect what is understood to be
happening in an organization (Ambrosini and Bowman 2002). The ability of the causal

6
performance map to visually represent employee tacit knowledge about factors critical to
organizational success makes it suitable for the study of PHD’s organization.
Interviews captured the tacit knowledge and interaction of performance drivers
within each office or department at PHD. From these data, “causal performance maps”
were created to visually illustrate the goal orientation and operational methodology
within each office and department. This methodology provides the reader with a clear
linkage between performance drivers and their effect on outputs.
4. Performance Measurement Assessment After creating the causal performance maps, existing performance metrics in use
at PHD are compared to observed performance driver relationships. An assessment is
then made concerning the appropriateness and quality of existing metrics based on
literature studied and data gathered. Following this, the performance measurement
system at PHD is assessed in terms of alignment with federal guidance.
F. ORGANIZATION OF THESIS Following this introduction, Chapter II reviews performance measurement
literature. Chapter III provides a review of federal performance measurement guidance
from OMB down to the Department of the Navy, including strategic objectives within
PHD’s chain of command. Chapter IV presents collected data from interviews with line
managers at PHD, as well as causal performance maps resulting from these interviews.
Chapter V analyzes critical performance variables within PHD and provides an
assessment of the appropriateness and quality of existing performance at PHD. Chapter
VI provides an assessment of the alignment between PHD’s performance measurement
system and federal guidance. Chapter VII presents conclusions.

II. LITERATURE REVIEW
A. THE NEED FOR PERFORMANCE MEASUREMENT In general terms, any organization can be characterized as having inputs,
transforming those inputs via certain processes, and achieving outputs from that
transformation. The outputs, or ideally desired outcomes, are the reasons the
organization exists. In order to determine how well the organization is progressing
toward achievement of desired outcomes, a standard or benchmark is required against
which to measure performance. In addition to this standard, a feedback channel is
required to communicate throughout the organization how actual performance varies
from expected performance. This variance information, and the standards used to obtain
it, provides the manager with a means of controlling the transformation process and
influencing desired outcomes. This process is captured in the Cybernetic Feedback
Model (Figure 2).
Performance measurement through the cybernetic process is an important
foundation for each and every organization. In the absence of this basic idea, managers
lack a systematic method with which to evaluate performance variance, and thus have
limited control over influencing outcomes.
7
Figure 2. Cybernetic Feedback Model (From: Simons 2000)
Process
Inputs
Standard
Outputs
Feedback

8
Returning to the basic framework of inputs, processes, and outputs, it is often
unclear where in the transformation process the standard should be placed for the
measurement of performance. This decision process is guided by the following
principles:
- Measure inputs when it is impossible to monitor processes or outputs, cost of
input is high relative to value of outputs, or quality and safety are important.
- Measure processes when they can be observed or measured, cost of
measuring them is low, standardization is critical for safety and quality, cause-
and-effect relationships are understood, and process enhancements can result
in strategic advantage.
- Measure outputs when they can be observed or measured, cost of measuring is
low, cause-and-effect relationships are not well understood, and freedom to
innovate is desired. (Simons 2000)
B. PERFORMANCE MEASUREMENT IN DETAIL
1. Strategy and Performance Measurement Systems Much research has been completed in the field of performance measurement in
the past 30 years. The most reliable, valid, and common typology in this research is that
control systems should be congruent with strategy (Miles and Snow 1978, Shortell and
Zajac 1990, Doty, Glick and Huber 1993, Boulianne 2002). Strategies are simply
assumptions and expectations about cause-and-effect relationships, transformed into a
formal plan. To bring strategies to life, managers must use specific performance goals to
communicate direction to subordinates (Simons 2000). These performance goals are
what members of the organization are going to optimize by nature, so it is critical that
they are linked with strategy. This linkage naturally encourages a strategic focus within
the organization, as success depends on supporting strategic objectives. This leads to the
criticality of understanding what factors make the strategy succeed, and how to create a
system of measurement around those central factors.

9
2. Selecting Performance Measures For any chosen strategy, performance drivers are variables that either influence
the probability of successfully implementing the strategy (an effectiveness criterion) or
provide the largest potential for marginal gain over time (an efficiency criterion). Critical
performance variables (CPV’s) are the specific performance drivers that determine
whether an organization succeeds or fails to achieve strategic goals (Simons 2000).
CPV’s should be causally linked and mutually reinforcing (Kaplan and Norton 1996). If
a CPV is not considered when designing the performance measurement system, it is
highly probably that the organization will fail to achieve one or a number of desired
outcomes in the near future. The risk of this failure makes the process of identifying
CPV’s the most critical piece in designing a successful performance measurement
system. If the wrong metrics are selected to capture CPV’s, attention and energy within
the organization will be focused on measuring data of lesser consequence.
In addition to capturing CPV’s, performance metrics must meet certain criteria to
be meaningful. Ideally, measures should be objective, complete, and responsive (Simons
2000).
- Objective measures are specific, can be independently measured, verified
for accuracy, and trusted. Subjectivity encourages subordinates to expend energy
trying to manage impressions instead of results, which raises the potential of
personal bias, unfairness, and a lack of trust in the organization (Manzoni 2002).
- Complete measures capture all major aspects that are relevant to achieving
a target or goal. An incomplete measure encourages the dedication of energy to
unintended activities, creating a vulnerability to dysfunctional behavior.
- Responsive measures are within management’s span of control,
encouraging timely and actionable feedback. Unresponsive measures limit the
influence of management on desired outcomes.

10
While it is difficult to obtain all three of these attributes within a performance
measure, that should always be the goal. If not possible, managers should at least
understand the impact of how a deficiency in a selected performance measure will impact
employee behavior.
3. Balance Among Performance Measures Kaplan and Norton (1992) identify the need for a balance of perspectives within a
performance measurement system. The development of the balanced scorecard was
driven by the insight that financial performance indicators are “lagging” and not
sufficient to keep an organization on track in a rapidly changing environment. “Leading”
indicators, as reflected in non-financial performance measures, are also necessary for an
organization to achieve strategic objectives within this environment. (Kaplan and Norton
1992) Leading indicators are forward-looking, providing visibility into future
performance that lagging indicators cannot provide.
As shown in Figure 3, the balanced scorecard suggests that organizations should
look at four distinctive perspectives using both lagging and leading indicators to
comprehensively develop metrics, collect data, and analyze results. By focusing on
CPV’s within this balanced framework, a “story of success” for the organization becomes
apparent.

Financial “To succeed
financially, how should be appear to
shareholders?”
Customer Internal Business Processes “To achieve our vision,
how should we appear to customers?”
“To satisfy our shareholders and
customers, what business processes must we
Learning and Growth excel at?” “To achieve our vision, how will we sustain our
ability to change and improve?”
Vision and Strategy
Figure 3. Balance Scorecard Model (Kaplan and Norton 1992) 4. Using Performance Measures
Organizations use performance measurement systems to track progress in
activities critical to strategic success. Managers can use a performance measurement
system in either a diagnostic or interactive fashion. Using a system diagnostically allows
managers to monitor organizational outcomes and correct deviations from preset
standards of performance (Simons 2000). This is the classic top-down approach where
managers establish pre-conditions for the organization and “manage by exception,” only
interceding when actual performance varies from expectations. The diagnostic approach
is more suitable for transformation processes that are stable in nature.
A performance measurement system can be used interactively when high levels of
strategic uncertainty are present. Strategic uncertainty forces managers to actively
participate in the transformation process. When managers involve themselves regularly
and personally in the decision activities of subordinates, the entire organization should be
focused on strategic uncertainty, disruptive changes, and opportunities (Simons 2000).
11

12
This is quite different and more challenging than the management by exception approach,
but also more realistic when the organization has a volatile transformation process or
environment.
Managers can use both diagnostic and interactive approaches within the
organization’s performance measurement system, matching each to appropriate
transformation processes. This minimizes the amount of management energy dedicated
to activities that can be handled at a lower level, while also ensuring that risk is mitigated
in areas of high uncertainty.
5. Pervasiveness in Performance Measurement The technical difficulties of developing, implementing, and using performance
measurement systems are much easier to address than the organizational dynamics their
introduction triggers (Manzoni 2002). If users of performance measurement systems do
not recognize a benefit from the system, there is less incentive to dedicate time to using it
effectively. Research indicates that managers reject performance measurement systems
when they perceive measures to be inaccurate or subjective, targets to be arbitrary, and
when communication is “top-down” only (Malina and Selto 2001). On the other hand,
employees that use a performance measurement system with metrics that are objective,
complete, responsive, and provide value in their work environment are likely to accept
and embrace transformation (Simons 2000). For performance measurement to be
pervasive throughout the organization, there must be alignment among strategy,
organizational beliefs, and the performance measurement system. This alignment
encourages users to commit themselves to performance measurement.

13
III. FEDERAL GUIDANCE REVIEW
In this chapter, the intent of the author is to provide a federal perspective on
performance measurement from Congress down through the Department of the Navy. In
order to bridge the gap between the department level and PHD, the author also includes a
visual display of strategic objectives within PHD’s chain of command. This chapter
establishes the framework for the alignment assessment performed in Chapter VI.
A. FEDERAL PERFORMANCE MEASUREMENT HISTORY AND POLICY
1. Government Performance and Results Act of 1993 (GPRA) Congress passed the GPRA in January 1993 for the following stated purposes:
(1) improve the confidence of the American people in the capability of the Federal Government, by systematically holding Federal agencies accountable for achieving program results;
(2) initiate program performance reform with a series of pilot project setting program goals, measuring program performance against those goals, and reporting publicly on their progress;
(3) improve Federal program effectiveness and public accountability by promoting a new focus on results, service quality, and customer satisfaction;
(4) help Federal managers improve service delivery, by requiring that they plan for meeting program objectives and by providing them with information about program results and service quality;
(5) improve congressional decision-making by providing more objective information on achieving statutory objectives, and on the relative effectiveness and efficiency of Federal programs and spending; and
(6) improve internal management of the Federal Government.
As stated by the Government Accountability Office (GAO), the GPRA “seeks to shift the
focus of government decision-making and accountability away from a preoccupation with
the activities that are undertaken - such as grants dispensed or inspections made - to a
focus on the results of those activities, such as real gains in employability, safety,
responsiveness, or program quality.” The GPRA was intended to create a more effective,
efficient, transparent, and accountable budget process that would force federal agencies
to measure real outputs and outcomes in conjunction with strategic planning. The GPRA

14
also incorporated a reporting process to track the progress of strategic planning and
performance measurement within federal programs. More than a decade later progress
lags expectations as noted by the GAO.
2. GAO High-Risk Series The GAO monitors progress and challenges in performance budgeting and
associated initiatives within the current administration. The vehicle utilized by GAO to
express areas of highest concern is an annual “high-risk list” which identifies federal
programs, activities, and functions that require improvement. The Department of
Defense (DOD) plays a role in over fifty percent of the 2005 high-risk areas, with the
majority falling into the business transformation arena. The criticality of performance
measurement is consistently emphasized as a common shortcoming within these high-risk
areas, as demonstrated in the following 2005 high-risk summaries:
a. Approach to Business Transformation GAO found that DOD is not executing a strategic, integrated business
transformation plan that includes specific goals, measures, and accountability
mechanisms to monitor progress.
b. Business Systems Modernization GAO found that DOD has not defined performance metrics for evaluating
the creation of a business enterprise architecture.
c. Financial Management GAO found that DOD required financial management reform in the area
of “plans and related results-oriented performance measures.”
d. Supply Chain Management GAO found that DOD is weak in areas of asset visibility, distribution
capability, and inventory management. Furthermore, a lack of an integrated inventory
management information system is cited as a limitation on measurement of overall
effectiveness.

15
e. Weapons Systems Acquisition GAO found that individual programs within DOD are challenged by
inherent funding, management, and cultural factors that lead managers to develop
business cases for new programs that over-promise on cost, delivery, and performance of
weapons systems.
f Contract Management GAO found that DOD personnel did not always make sound use of tools
such as performance-based service contracting, and that safeguards for inappropriate
waivers of requirements were lacking. (2005 GAO High-Risk Series)
These summaries indicate that DOD has many challenges in transforming
the agency to comply with the performance and results focus of the GPRA. The
President’s Management Agenda (PMA) directs conscious effort at achieving goals
which would mitigate these deficiencies, while also improving the quality of GPRA
performance plans and budgets.
3. President’s Management Agenda The 2001 PMA articulates a sense of urgency for aggressive improvement in
government performance. The focus of this plan is to achieve “immediate, concrete, and
measurable results in the near term” in alignment with five government-wide goals.
These five overarching goals are: (1) Strategic Management of Human Capital, (2)
Competitive Sourcing, (3) Improved Financial Management, (4) Expanded Electronic
Government, and (5) Budget and Performance Integration. These goals are not
independent, but linked and mutually reinforcing within respective agencies. The
President puts all government agencies to task in taking a “disciplined and focused
approach to address these long-standing and substantial challenges (OMB 2001).”
In terms of human capital, the President expects agencies to determine core
competencies and execute a human capital strategy that is linked to the mission, vision,
core values, goals, and objectives of the organization. Agencies are also expected to
strategically align recruitment, training, and incentive plans to maintain a high-
performing workforce. These actions are emphasized as necessary to meet and exceed
established productivity and performance goals (OMB 2001).

16
Competitive sourcing is mutually reinforced with the determination of core
competencies. Identifying core competencies, measuring the output of resources
consumed in those competencies, and providing true competition for commercial
alternatives are all challenges faced by DOD. Objective comparisons of efficiencies
between government and commercial work are often difficult to measure, but nonetheless
necessary to optimize the allocation of scarce resources. The goal of the administration is
to regularly examine commercial activities performed by government, promote
competition through increased participation in OMB Circular A-76 initiatives, and
objectively identify the most efficient means to accomplish tasks whether by the
government or the commercial sector (OMB 2001).
Improving financial management in the government, and especially DOD, is
another goal of the PMA. The President expects DOD to achieve a clean financial audit
and maintain the ability to produce accurate and timely financial information.
Amplifying this expectation, the PMA calls for improved financial systems to measure
and affect performance immediately, while ensuring consistency to facilitate better
performance measurement (OMB 2001).
The President also lists expanding electronic government as an essential goal for
improving government performance, specifically for the citizen stakeholder. The
President cites the Defense Finance and Accounting System (DFAS) as a success story in
this area, having embraced the opportunity to work across service boundaries and
consolidate functions to realize efficiencies and provide better services. The President’s
specific focus in this area are to reduce the expense and difficulty of doing business with
the government, to cut government costs, and to make government more transparent and
accountable (OMB 2001).
The final goal identified in the PMA is budget and performance integration. The
President emphasizes this goal as the most critical, stating that improvements in the
previous four goals will “matter little if they are not linked to results.” Existing problems
in this area include ill-defined performance measures within agencies, failures to use
performance information for program management, failures to integrate performance
measures with budget submissions, and failure to measure the full cost of programs. The

17
President’s goal is to integrate performance reviews into the budget process, rewarding
programs that prove themselves while breeding competition based on full costing of
resources. The desired end-state is having the ability to present the American people
with a transparent budget that clearly indicates the linkage to overall objectives of the
administration (OMB 2001).
The President’s Management Council developed an “Executive Branch
Management Scorecard” and “Program Initiatives Scorecard” to track the status and
progress towards achieving the goals of the PMA (OMB 2005). These “dashboards”
provide the President with information on PMA progress at the agency-level, but do not
drill down to specific program effectiveness. Progress for each and every federal
program is tracked by the Office of Management and Budget (OMB) using Program
Performance Assessments (PPA) (OMB 2002).
4. Office of Management and Budget OMB established PPA’s to evaluate the effectiveness of budget and performance
integration within federal programs. The Performance Assessment Rating Tool (PART)
is the instrument within the PPA utilized for a standard performance evaluation across all
agencies. The PART evaluation is a questionnaire of approximately 30 questions that
proceeds through four critical areas of assessment – purpose and design, strategic
planning, management, and results and accountability. Questions within the PART are
tailored for each specific type of program to capture essential distinctions. The questions
are designed to provide a means to aggressively inquire whether GPRA standards are met
within the program, placing emphasis on outcome, output, and efficiency measures.
Clear criteria are given for qualifying answers. An excerpt from the PART illustrates
this:
II. STRATEGIC PLANNING
2.3 Does the program have a limited number of specific annual performance measures that can demonstrate progress toward achieving the program’s long-term goals?
A yes answer must have the following elements:

(1) A limited number of discrete, quantifiable, and measurable annual performance measures have been established for the program.
(2) Annual performance measures adequately measure the program’s progress toward reaching the long-term goals evaluated in Questions 2.1 and 2.2 (previous questions in the PART)
(3) Annual performance measures focus on outcomes. Measures may focus on outputs if the program can adequately justify why it is unable to define a satisfactory quantifiable outcome measure. The explanation must clearly state how the outcomes help achieve the long-term goals of the program.
(4) Programs must have at least one efficiency measure as part of their annual measures. (OMB 2002)
The PART scores each of the four areas on a numeric scale, which is then
translated into an overall qualitative rating that ranges from Effective, to Moderately
Effective, to Adequate, to Ineffective, to Result Not Demonstrated. The intent of the
PART is to put the burden of proof for effectiveness on federal managers, while
ultimately providing a baseline for results-based budget decisions.
As of 2004, over half of the programs analyzed by the PART received a rating of
Results Not Demonstrated due to a lack of performance measures and/or performance
data. OMB plans to review approximately one-fifth of all federal programs every year,
such that by the 2008 budget submission every program will have an evaluation from the
PART (OMB 2004). As of 2005, 23 DOD programs have been evaluated by the PART,
with ratings broken down in Table 1. Ratings thus far are mixed, but heavily
concentrated towards “Moderately Effective” and “Effective.”
Table 1. 2005 Department of Defense PART Ratings (OMB 2005)
The Executive Branch also has proposed legislation for further performance and
results regulatory authority. The Government Reorganization and Program Performance
Results not
Demonstrated
Ineffective Adequate Moderately
Effective
Effective
3 1 3 6 10
18

Improvement Act of 2005 would authorize “Results Commissions” to assess problematic
agencies and programs. The results of these assessments could lead to reorganization or
possibly abolishing agencies and programs that do not demonstrate results. In this vein, it
is clear that OMB is actively tracking and forcing improvement within the area of
performance measurement.
5. Office of the Secretary of Defense (OSD) DOD is making constant progress towards achieving each of the five strategic
goals in the PMA. Much of this progress is centered on performance measurement. OSD
prescribed Management Initiative Decision (MID) 901 to better align DOD’s
performance management activities with the PMA and the Risk Management Framework
established in the 2001 Quadrennial Defense Review (QDR). The QDR provides a long-
range projection (notionally 20 years) of strategic objectives in areas of force structure,
force modernization, infrastructure, and budget. The Risk Management Framework in
the QDR is based on the balanced scorecard approach, but utilizing risk factors as
illustrated in Figure 4.
- Operational Risk Financial o Available Forces o Ready Forces o Train Forces
- Force Management Risk Internal Business o Recruit and Retain o Reasonable Force Costs
- Institutional Risk Customer o Equip Forces o Improve Facilities
- Future Challenges Risk Learning and Growth o Human Capital Investment o Innovation o Transformation
Figure 4. Alignment of DOD Risk Management Framework with Balanced Scorecard Perspectives (OSD/PA&E 2005)
19
The QDR is coupled with Strategic Planning Guidance (SPG), Joint Planning
Guidance (JPG), and the Future Years Defense Plan (FYDP) documents to provide the
20
input fo
ecretary of the ment and Comptroller)
f k
area scorecard,” each with associated output measures. These outputs must be tied to
strategy
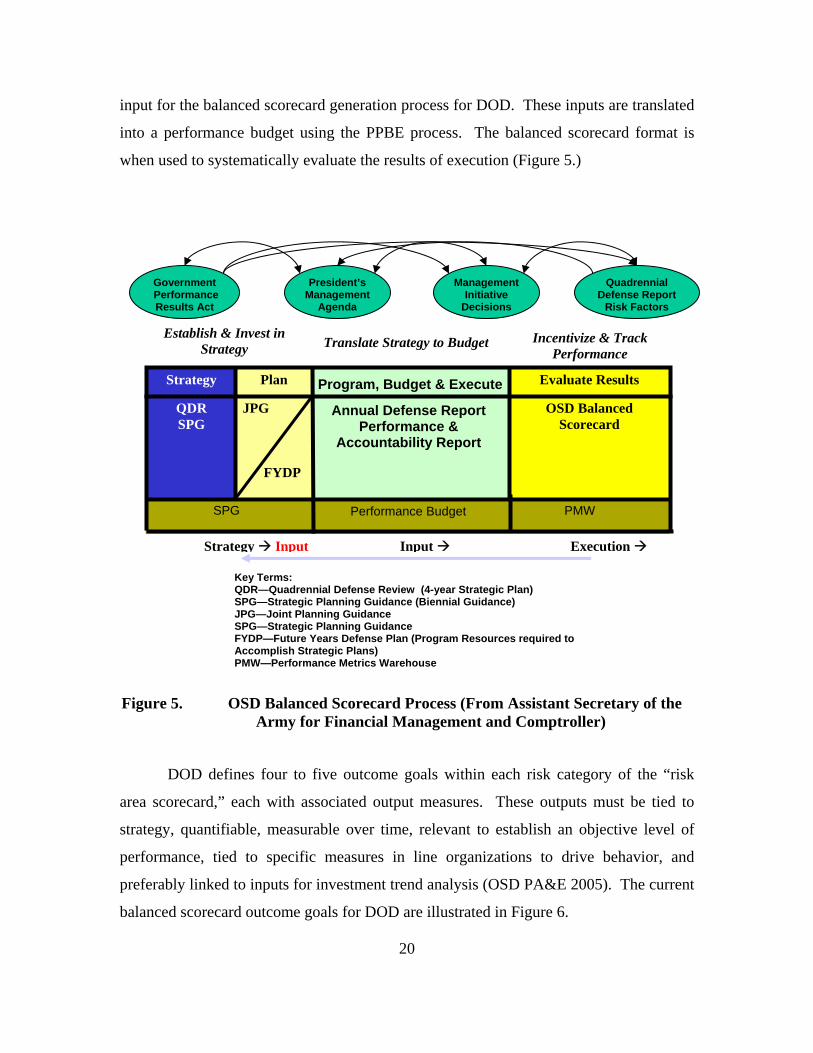
r the balanced scorecard generation process for DOD. These inputs are translated
into a performance budget using the PPBE process. The balanced scorecard format is
when used to systematically evaluate the results of execution (Figure 5.)
Figure 5. OSD Balanced Scorecard Process (From Assistant S
Army for Financial Manage
DOD de ines four to five outcome goals within each risk category of the “ris
, quantifiable, measurable over time, relevant to establish an objective level of
performance, tied to specific measures in line organizations to drive behavior, and
preferably linked to inputs for investment trend analysis (OSD PA&E 2005). The current
balanced scorecard outcome goals for DOD are illustrated in Figure 6.
Evaluate Results Plan Strategy
Translate Strategy to B
Execution In
udget
put Strategy Input
QDR SPG
OSD Balanced Scorecard
JPG
D
Incentivize &Perform
Invest in egy
FY P
Track ance
Establish &Strat
Annual Defense Report Performance &
Program, Budget & Execute
Accountability Report
Key Terms: —Quadre ial Defense Revi ear Strategic Plan)
Planning Guidan l Guidance) JPG—Joint Planning Guidance
ic Planning Guidance ired to
Government Performance Results Act
Management Initiative
Decisions
Quadrennial Defense Report
Risk Factors
President’s Management
Agenda
SPG PMW Performance Budget
QDR nnSPG—Strategic
ew (4-yce (Biennia
SPG—StrategFYDP—Future Years Defense Plan (Program Resources requAccomplish Strategic Plans)
house PMW—Performance Metrics Ware

Force Management Goals Operational Goals
t
A
D
t
p
S
p
i
D
m
t
N
-Ensure sustainable military tempo -Main-Shape the force of the future
-Successful plan/strategy execution -Critical n ,
sustainment, and infrastructure tain workforce satisfaction eeds, systems, people
-Maintain quality workforce -Are forces currently ready? -Maintain reasonable force costs -Do we have the forces available?
Future Challenges Goals
-Drive Joint Operations -Defin n
capa skills and
-Develop more effective organizations
e and develop transformatiobilities
-Define future humancompetencies
Institutional Goals
-Streamline decision process, drive financiaacquisit
y
-Realign support to the warfighter
l management, and ion excellence
-Improve readiness and quality of kefacilities
-Manage overhead and indirect costs
21
Area Scorecard Goals (DOD 2004)
Using the framework presented in Figure 6, DOD made tangible progress towards
he objectives of the PMA. In July 2005, DOD released “President’s Management
genda
els of
OD, with performan place within
he workforce
Figure 6. DOD Risk
: Results for the Department of Defense, 2005,” which details DOD’s
erformance measurement mentality and achievements to date. Highlights follow:
a. Strategic Management of Human Capital Initiative Effort is being expended to build a performance culture at all lev
ce-based initiatives and incentives either planned or in
. Examples include a pay-for-performance strategy at Senior Executive
ervice (SES) and senior management levels, finalizing the design of the revolutionary
erformance-based National Security Personnel System (NSPS) for DOD civilians, and
ncreasing utilization of stakeholder surveys to provide timely and accurate feedback.
OD is also taking an approach of examining core competencies in the workforce to
inimize competency gap risk and ensure “the right person is in the right job at the right
ime.” Additionally, focus is also being placed on electronic government integration with
SPS, the base realignments and closure (BRAC) Priority Placement Program (PPP), and

22
akes military
and economic etition, DOD focuses on outcome and
efficiency goal
e financial management transformation such
that it better aligns w credible financial statements,
and provides
efficiency,
effectiveness, ou role in the procurement and
acquisition are
the Workforce Planning and Restructuring initiatives to ensure human capital
transformation is transparent, effective, and efficient. (OSD 2005)
b. Competitive Sourcing DOD intends to use “competitive sourcing” whenever it m
sense to do so. In promoting comp
s, training responsible officials as enablers within the competitive sourcing
program, providing timely and accurate information for decision-making, and
performance-based cost comparisons. DOD is addressing a lag in new competitions
within DOD in 2005 with a renewed emphasis on achieving competitive sourcing goals
in accordance with the PMA. (OSD 2005)
c. Improved Financial Management DOD’s intention is to improv
ith commercial practices, produces
the ability to make more efficient and effective business decisions in
support of the warfighter. Outcomes and efficiency are measured in an effort to reduce
unnecessary penalties, delinquencies, reports and accounting adjustments. Common
business rules have been identified to improve Military Equipment (ME) visibility, one of
the shortcomings identified in the PMA. For the long term, the Business Management
Modernization Program (BMMP) within DOD is focused on improving the overall
performance of critical enterprise business systems programs. (OSD 2005)
d. Expanded Electronic Government DOD’s role in expanding electronic government is centered on
and tcome goals. DOD plays a leading
as to effect implementation of the Integrated Acquisition Environment
(IAE). The vision of IAE is to simplify and unify acquisition business practices within
electronic government while meeting strategic and cost-effective goals for acquisition
and delivery of goods and services to the warfighter. DOD developed three programs
under the IAE that are now used across the government. These programs provide
common business practices for contractor registry, technical data solutions, and past
performance information retrieval. Other initiatives in defense travel services, training

23
lectronic format to realize efficiencies, increase effectiveness, and influence desired
lizes e Planning, Programming, Budgeting and Execution
(PPBE) proce to ion by linking
perform ce r
006 President’s
Budget. For
MA, PART, and DOD Risk Management Framework provide the
founda for of the
and education transformation, and grant application have been standardized in an
e
outcomes. (OSD 2005)
e. Budget and Performance Integration Initiative DOD uti th
ss increase the effectiveness of resource allocat
an esults to programming and budgeting decisions and placing additional
emphasis on program execution. Adjustments to resource allocation are made based on
evaluations of performance data and assessments of how programs contribute to mission
success. Over $30 billion in savings was realized in the FY06 President’s Budget
through PPBE and an emphasis on performance criteria. This is evidence that budget and
performance integration is quickly becoming a standard as called for in the PMA.
Furthermore, programs which execute poorly or fail to demonstrate results are in danger
of losing resources to higher priority efforts within DOD. (OSD 2005)
In addition to PMA progress, DOD is embracing the PART to assess
programs representing more than 60 percent of resources in the FY 2
the FY07 budget, PART assessments will be conducted on eight new
programs, with four reassessments conducted on previously assessed programs (OSD
2005). This emphasis on the PART and the performance and results mentality are likely
to have a trickle-down effect as each service structures programs to meet and exceed
PART requirements.
6. Secretary of the Navy and Financial Management and Budget The GPRA, P
tion performance measurement requirements within the Department
Navy. The Navy appears to be committed to achieving the goals of the PMA as
evidenced through the planning and execution of DOD and service-specific initiatives
such as the Navy Converged Enterprise Resource Planning (C-ERP) program, the
commitment to study 63,420 positions for competitive sourcing, conversion to NSPS, and
a completely revamped human capital strategy (FMB 2005). The Navy has completed
nine PART assessments (39 percent of total DOD assessments), while utilizing

performance metrics for eighty-six percent of requested resources in the FY
2006/FY2007 Budget (FY 2006/FY2007 Department of the Navy Budget). This budget
and performance integration process resulted in identifying 17 strategic goals for the
Navy within DOD’s Risk Management Framework, with performance metrics tied to
each strategic goal. This integration follows the intent of the GPRA and PART
instrument, while covering the objectives of the PMA in a detailed manner. The
Secretary of the Navy adapted this framework to include strategic enablers within the
Navy as identified in the Navy’s balanced scorecard (Figure 7) (FMB 2005).
Combat Capability People st- Execute Global War on Terrorism - Shape the 21 century workforce
- Execute Fleet Response Plan - Improve training & development - Maintain forw power
ces - Accelerate investment to recapitalize - Improve productivity - Empha ize system survivability - Support BRAC process - Sustain
ard seabasing - Streamline & align man Technology Insertion Improved Business Practi
s robust and balanced R&D effort - Achieve facility support goals
24
05)
The Chief of Naval Operation erformance
measur ent in his 2006 guidance. One of his ten guiding principles is “effects-based
thinkin
Fig
Remain Ready While Developing Future Capabilities
ure 7. Navy Balanced Scorecard (FMB 20
s (CNO) also emphasizes p
em
g,” which will be applied across the Navy to “continually monitor progress against
a discrete set of metrics, reallocating resources or effort as required to achieve concisely
stated desired effects (CNO 2005).” The CNO’s methodology for implementing this
principle is to “institutionalize executive development for our senior military and civilian
leadership to include formal training and career path planning (CNO 2005).” It appears
that this top-down management style seeks to achieve the same effects as the GPRA,
PART, and PMA. A performance and results mentality should permeate through senior
leadership, drilling down to the unit level.

25
c environment within which PHD operates.
tween the department level and PHD by
discuss
ination of the strategic
environ
stated, the Secretary aligns the Navy’s overarching goals within
DOD’s sk M Force Management Risk, Operational Risk,
• Combat Capability
• Technology Insertion
• Improved Business Practices
2. s In the O ains committed to the three priorities of
sustain com t for the future, and developing 21st century
B. STRATEGIC OBJECTIVES This section establishes the strategi
The author intends to bridge the gap be
ing strategy within each office, and then providing a visual illustration of the
linkage of strategic objectives within the chain of command.
As performance metrics should be linked with strategy, an appropriate starting
point for analyzing performance measurement is a determ
ment for PHD. PHD reports directly to NSWC Headquarters in Washington D.C.
for all formal matters. NSWC Headquarters reports directly to the Commander, Naval
Sea Systems Command (NAVSEA), who subsequently reports to the Chief of Naval
Operations (CNO). In turn, the CNO reports to the Secretary of the Navy (SECNAV).
(NSWC PHD 2005)
1. The Secretary of the Navy As previously
Ri anagement Framework of
Institutional Risk, and Future Challenges Risk. SECNAV’s strategic objectives include
executing the Global War on Terrorism, shaping the 21st century workforce, sustainment
of a robust and balanced R&D effort, and improving productivity across the board (FMB
2005). Progress toward these objectives is made through four strategic enablers:
• People
Chief of Naval OperationCN ’s guidance for 2006, he rem
ing bat readiness, building a flee
leaders. To address these priorities, the CNO has seven strategic objectives. (CNO 2005)
• Support the joint and combined war on terror both from the sea and ashore, while staying ready to meet other operational requirements.

26
nd
• ments
•
• relationships with the U.S. Coast Guard and
•
• innovation. (CNO 2005)
3. The strategic objectives articulated in NAVSEA’s 2005 guidance are as follows:
sure Productivity
4. Naval Surface Warfare Center culates five strategic objectives:
ace
, and Systems Transformation to Sea Power
21 and Joint Vision 2020 (NSWC 2005)
• Determine and deliver on the Navy’s future force structure requirements by a) defining an improved force structure aconstruction plan and b) contributing to a stable industrial base.
Drive to execution Sea Warrior and other ongoing manpower and personnel transformation efforts. Deliver on specific improvethat will improve the lives, careers, and leadership potential of our Sailors and our families.
With the USMC, increase the value of contributions to the Joint Force.
Develop closer working other governmental and non-governmental organizations to support national security policy, enhanced homeland defense, and improve maritime domain awareness.
Apply effects-based thinking across the Navy.
Become leaders of change and
Naval Sea Systems Command
• Human Capital Strategy Enhancement
• Capture Cost Reduction
• Task Force Lean
• Improve and Mea
• Virtual SYSCOM (NAVSEA 2005)
NSWC’s 2005 Concept of Operations arti
• Operate as a single, cost-effective enterprise
• Warfighting effectiveness
• Right Work at the Right Pl
• Manage Technical Risk
• People, Process, Facility

27
5. NSWC PH g a strategy planning session
in April 2005.
• Operate as a Seamless Organization by Improving Enterprise
• eward Our Workforce (Human Capital Strategy)
• Improve the Efficiency, Delivery and Quality of Our
On the following page, Figure 8 cascades
from the Secretary of een
reportin
Naval Surface Warfare Center, Port Hueneme Division D identified five strategic objectives durin
• Improve Combat Systems Readiness
Collaboration
• Embrace New Technology and Develop a Culture of Innovation
Develop and R
Products…Right Work at the Right Cost (NSWC PHD 2005)
the objectives and goals listed above
the Navy down to PHD, illustrating the linkage of strategy betw
g levels. While PHD should link their performance metrics to their specific
strategic objectives, it is also important to consider the alignment of PHD with strategic
objectives within their immediate chain of command. An effective performance
measurement system should provide feedback internally throughout PHD, and also up
through the chain of command. The illustration of the linkage in strategic objectives and
goals between reporting levels is made by the author based on his understanding of
organizational perspectives. The author intends for this linkage to be the foundation for
an assessment of PHD’s performance measurement alignment with federal guidance.
This assessment is conducted in Chapter VI.

STRATEGIC OBJECTIVES AND GOALS
Operate as Single Cost-
Effective
Warfighting Effectiveness
Right Work at the Right
Place
Manage Technical
Risk
People, Process, Facility, and
Systems
Task Force Lean
Improve & Measure
Productivity
Human Capital Strategy
Virtual SYSCOM
Capture Cost Reduction
Combat Capability
Technology Insertion
Improved Business Practices
People
V
Human Capital
Strategy
Effects-Based Thinking
GWOT and Current
Readiness
Build Fleet of the Future
Leaders of Change and Innovation
Joint Contribution
and Collaboration
O
A
C
NSWEnterprise Transformation to SP21 and JV2020
Enterprise Collaboration
Human Capital Strategy
New Technology
and
Improve Combat Systems
Right Work at the Right
Cost
NSWC PHDNAVSE
I
CN
SECNA
Innovation Readiness
SEARs (NAVSEA
Best Practice)
Communities of Practice
Human Capital Strategy
Task Force Lean
Distance Support
(NAVSEA Best Practice)
Innovation Forums
PHDnitiatives
28
Figure 8. Alignment of Strategic Goals through NSWC PHD

29
IV. COLLECTED DATA
A. INTERVIEWS Seven interviews were conducted to capture the tacit knowledge of line managers
in the offices and departments at PHD. Questions during the interviews were directed to
allow managers to describe how their organization operates, how success is viewed, and
what performance drivers determine success or failure. Causal performance maps were
created from the data collected during these interviews, from which managers were asked
to provide feedback on the accuracy contained therein. The process of fine tuning the
maps provides a clear look at the office or department from the perspective of each line
manager.
In order to visually illustrate a comprehensive picture of the performance drivers
at PHD, the individual maps were then merged into a composite map. This was
accomplished by examining performance drivers for commonality, while also ensuring
that important factors were not excluded for the sake of simplicity. In a forward-looking,
technically-oriented, knowledge-based organization such as PHD, the interaction of
performance drivers is varied and complex. The mapping provides a true representation
of data collected on the determining factors of success at PHD, highlighting the
complexity of the organization.
The subjects interviewed were within the Office of Corporate Business, the Office
of Logistics, the Office of Engineering and Technology, the Office of Technical
Operations, the Ship Defense and Expeditionary Warfare Department, and the Task Force
LEAN office. Two interviews were conducted within the Office of Corporate Business
to distinguish between comptroller and other business functions. The purpose of the Task
Force LEAN interview was to provide a background for a critical process at PHD, and
was not translated into a causal performance map. Subjects for interviews were selected
based on who was likely to possess the most tacit knowledge within a specific office or
department. Each interview was conducted by the author at PHD.

30
The interviews were semi-structured. The protocol for the interview is depicted
in Table 2. Deviations from the protocol occurred frequently during the interviews when
explication of organizational issues was required. The interviews provided the data to
identify the inputs and processes that have an effect on the outcomes critical to success.
These cause-and-effect relationships were transformed into the causal performance maps.
B. CAUSAL PERFORMANCE MAPS Figures 9 through 14 illustrate individual causal performance maps created for the
offices and departments at PHD. A description of and relevant information follow each
map. Interview subjects are identified as Subjects A through F for the purpose of
anonymity. The maps organize inputs on the left, processes in the center, and desired
outcomes on the right. The arrows and double-headed arrows indicate the linkage of
inputs and processes to desired outcomes. The author utilizes common terms across
maps if doing so does not diminish the information presented by the subjects interviewed.
Figure 15 illustrates a composite causal performance map created by
consolidating individual maps from the offices and departments at PHD. This composite
map sets the foundation for creating performance metrics, as it identifies the critical
performance variables across the organization.

31
1. Record time, place, and identity of interviewee. 2. Indicate that the interviewee will remain anonymous and record consent to being recorded for the purpose of this performance measurement project. 3. Could you describe your role and responsibilities in your current position? 4. What would you say are the overarching goals of your office? 5. Ideally, what would be the desired performance outcomes for your office in support of PHD’s strategic objectives? 6. If you could describe how your office could achieve those desired outcomes, how would you describe that scenario? 7. What factors are critical in determining whether you successfully meet your goals and optimize the performance of your office? Possible follow-up examples include: A. Financial efficiency (Achieving NOR and other financial targets) B. Maintaining a strong business base (Communication/innovation) C. Investments in the workforce (hiring/attrition plan, training, incentives/rewards, human capital strategy) D. Investments in infrastructure and technology E. Collaboration with other entities (other WCs and product areas) F. Competitive sourcing of contract work (Quality) 8. Are the factors you mentioned linked in any way? 9. Do you measure these factors? Are any of these factors difficult to measure? 10. If any factors are not being measured, would measurement help your office achieve success? 11. In your opinion, does the workforce at PHD use the measures currently in place? 12. Looking into the future 5 years, are there any factors you did not mention that will eventually be critical to PHD’s success? 13. Who are the customers that you serve, both internal and external to the organization? 14. How do you measure customer satisfaction? 15. What is the biggest indicator of failure for PHD?
Table 2. Interview Protocol

Subject A Office of Engineering and Technology
t cesses Outcomes
InpuCustomer Satisfaction
Fleet Combat Readiness
Project Planning Predict Future Requirements Combat System Assessments
Future Workforce Development Education/Training/Tool Sets Rotational Assignments
In-Service Engineering Initiatives Technical “due diligence” Sound Decision Making Risk Management System Optimization Trade-offs
Environmental Scan Acquisition Reform Fleet requirements Technology Trends COC guidance SEA POWER 21 Technical Authority
Fleet Sponsors & Stakeholders
Competent Workforce Systems Engineers T&E Practitioners
Human Capital Hiring Attrition Education
1.
Technology
operations.
the cutting-e
goal, or outc
that this is a
and also thr
Pro
Leadership and Oversight Technical Warrant Holders Technical Authority
Collaboration Internal External - WC’s, gov’t labs, Industry & Academia
Figure 9.
Engineering an
a. OutcomSubject A indi
(E&T) should b
This is due to the
dge of technology
ome, of his office
ccomplished throu
ough two other d
Task Force Lean Strategic Mapping
Communication Internal/SEAR External
32
Causal Perfor
d Technology
es cated that the f
e 75 percent v
forward-looking
for the surface
is to facilitate hi
gh effective pro
esired outcomes
Knowledge ManagementPortal Systems Engineering Board Expert Systems Communities of Practice Lessons Learned Strategic enablers
mance Map – Subject A
ocus for the Office of Engineering and
isionary and 25 percent on day-to-day
leadership he must provide to remain on
fleet. Subject A stressed that the primary
gher fleet combat readiness. He indicated
cess management that is discussed below,
: a competent workforce and practicing
Sustaining Organization
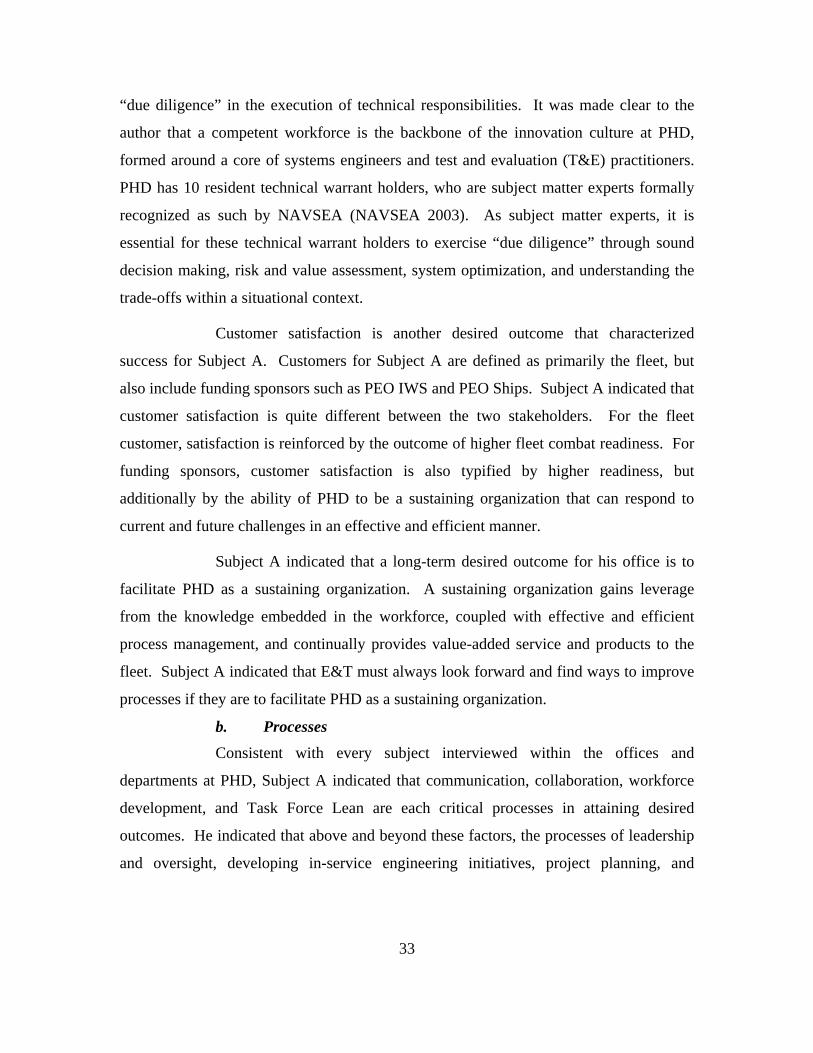
33
“due diligence” in the execution of technical responsibilities. It was made clear to the
author that a competent workforce is the backbone of the innovation culture at PHD,
formed around a core of systems engineers and test and evaluation (T&E) practitioners.
PHD has 10 resident technical warrant holders, who are subject matter experts formally
recognized as such by NAVSEA (NAVSEA 2003). As subject matter experts, it is
essential for these technical warrant holders to exercise “due diligence” through sound
decision making, risk and value assessment, system optimization, and understanding the
trade-offs within a situational context.
Customer satisfaction is another desired outcome that characterized
success for Subject A. Customers for Subject A are defined as primarily the fleet, but
also include funding sponsors such as PEO IWS and PEO Ships. Subject A indicated that
customer satisfaction is quite different between the two stakeholders. For the fleet
customer, satisfaction is reinforced by the outcome of higher fleet combat readiness. For
funding sponsors, customer satisfaction is also typified by higher readiness, but
additionally by the ability of PHD to be a sustaining organization that can respond to
current and future challenges in an effective and efficient manner.
Subject A indicated that a long-term desired outcome for his office is to
facilitate PHD as a sustaining organization. A sustaining organization gains leverage
from the knowledge embedded in the workforce, coupled with effective and efficient
process management, and continually provides value-added service and products to the
fleet. Subject A indicated that E&T must always look forward and find ways to improve
processes if they are to facilitate PHD as a sustaining organization.
b. Processes Consistent with every subject interviewed within the offices and
departments at PHD, Subject A indicated that communication, collaboration, workforce
development, and Task Force Lean are each critical processes in attaining desired
outcomes. He indicated that above and beyond these factors, the processes of leadership
and oversight, developing in-service engineering initiatives, project planning, and

34
knowledge management are critical processes within his office. Within these processes,
knowledge management and future workforce development were specifically highlighted
as essential for success.
Subject A also indicated that internal and external communication is a key
process within E&T. Internally, E&T communicates with every office and department to
understand and influence planning and execution efforts. Externally, communications
with other Warfare Centers (WC) is essential in facilitating collaboration while
maintaining an accurate picture of the overall NSWC enterprise. Additionally,
maintaining an interface with outside organizations such as program offices, fleet
commands, and type commanders was stressed as essential to recognizing emerging
trends and requirements, while also receiving feedback from the front line.
Collaboration, facilitated by communication, is an especially critical
process for PHD. Subject A indicated that E&T functions as an integrator to realize
synergies between and across departments at PHD. He indicated that these synergies are
the entering argument to developing in-service engineering initiatives, which directly
influence fleet combat readiness. External collaboration was also cited as critical. E&T
collaborates with other WC’s, and also with government laboratories, industry, and
academia to stay on the leading edge of technology.
Subject A indicated that developing and implementing in-service
engineering initiatives is the core process that E&T performs, directly influencing fleet
combat readiness and customer satisfaction outcomes by providing value-added services.
Subject A commented on PHD’s innovation of the “Distance Support” system,
recognized as a “best business practice” by NAVSEA. Distance Support is a system
where PHD engineers are able to provide direct technical services to the fleet via “low-
touch” information technology. This frees up capacity for PHD engineers to perform
more work at PHD, instead of “high-touch” assist visits to ships (NSWC PHD 2005).
However, Subject A inferred that creating and implementing these initiatives is anything
but simple. An example that Subject A presented was a potential technological change
from live-fire testing of a certain weapon system to computer modeling for validation
criteria. In order to successfully plan and execute the initiative, a workforce trained and

35
accustomed to live-fire methodologies must be provided the tool sets and training
necessary to succeed in a modeling environment. Subject A indicated that collaboration
between offices and line managers within the departments is essential in adapting to new
processes, such as in this example. These comments highlight the significant impact that
the future workforce development process and collaboration process have on in-service
engineering initiatives developed within E&T.
Subject A indicated that future workforce development is a critical process
within E&T due to an increasing span of attention in an environment of accelerated
technological change. Subject A stated that the single indicator of failure in his office
would be complacency or the inability to adapt to change. He indicated that rotational
assignments within departments are an essential component of ensuring change is
embraced at PHD. These assignments breed cross-functional expertise in the workforce,
leading to “communities of practice” where knowledge is optimized across departments.
Subject A also made it clear that E&T must provide the education, training, guidance,
and tool sets to the workforce if they are to execute technical warrant holder duties
satisfactorily. This includes education in Task Force Lean, which is discussed below.
Subject A also indicated that E&T relies heavily on early and accurate
planning. The planning process is critical in predicting and meeting future requirements
for the surface fleet. E&T analyzes from a systems perspective how best to direct energy
and efforts toward future needs, which directly results in projects that enhance fleet
combat readiness (NSWC PHD 2005). Other than the systems approach within the
lifelines at PHD, another avenue by which E&T captures trends and fleet needs is the
Combat System Assessment (CSA). During a CSA, a Navy ship will moor at Port
Hueneme and will receive a comprehensive assessment, or “groom,” of her combat
systems suite. This provides PHD engineers with the opportunity to target specific areas
of concern, while receiving face-to-face feedback from fleet technicians. Engineers
assess everything from configuration control, to spare parts management, to maintenance
procedures in order to obtain a comprehensive picture of system effectiveness (NSWC
PHD 2005). This hands-on expertise not only provides valuable feedback, but also sets
the planning stage for further innovations to enhance readiness.

36
Subject A alluded to the criticality of leadership and oversight within
E&T. He stated that E&T has the responsibility of “shepherding” technical warrant
holders; ensuring technical authority held by NAVSEA is sufficiently supported. He
stated that E&T also provides the leadership for safe, effective, and affordable processes
at PHD. The Safety, Effectiveness, Affordability, and Reliability (SEAR) program at
PHD is led by E&T, as their primary function is to integrate standards across the
command (NSWC PHD 2005). This indicated to the author that leadership and oversight
contributes to collaboration, project planning, and the development of in-service
engineering initiatives within E&T.
Knowledge management is a process viewed as a strategic enabler by
Subject A. Centralizing knowledge via the PHD information technology portal, using the
Systems Engineering Board to standardize processes, using expert systems to streamline
processes, developing communities of practice, and applying lessons learned were all
cited as elements of a successful knowledge management process at PHD. The ability to
organize and learn from an immense bank of knowledge should directly support the
outcome of a “sustaining organization” at PHD.
Consistent with all other interviews, Subject A indicated that a “Lean
mentality” must be pervasive across the command to truly improve processes, and
support PHD as a sustaining organization. NAVSEA implemented the “Lean”
methodology across all subordinate commands in August 2004. “Lean events” map out
inefficient processes in great detail, with the goal of realizing cost savings through a more
efficient allocation of resources in that process (e.g., time, people, effort). At PHD,
processes to be “Lean-ed” are identified strategically by senior managers, with focus
placed on the best prospects for cost savings (NSWC PHD 2005). In order to execute
these events, the workforce must be trained to understand and have the ability to apply
the methodology (NSWC PHD 2005).
c. Inputs Each subject interviewed indicated that human capital is an input to the
processes in their office or department. Subject A indicated that within E&T human
capital is viewed as a civilian and military partnership. While the majority of the

37
workforce is civilian, he indicated that the military component provides E&T with a pulse
from the fleet. This should result in a more balanced current and future perspective for
the work within E&T. Subject A also indicated that a role of E&T is to guide line
managers in hiring decisions. Turnover of experienced workers has increased due to end-
strength policies, but Subject A views this as both an opportunity and a threat. While
losing a worker with 20 to 30 years of experience will result in “brain drain” in the
organization, it also allows E&T, through hiring decisions, to better align the work force
with new technologies (NSWC PHD 2005).
Subject A indicated that another relevant input for work within E&T is an
“environmental scan.” He indicated that it is critical to keep abreast of acquisition
reform, changing fleet requirements, and technology trends. Additionally, guidance from
the chain of command and the Navy’s Sea Power 21 were stressed as important in terms
of direction provided and a framework within E&T to work. Subject A also indicated
that understanding the technical authority environment is key to successfully executing
due diligence in performance of technical warrant holder duties.

38
Subject B Office of Logistics
Figure 10. Causal Performance Map – Subject B
2. Office of Logistics
a. Outcomes Subject B indicated that success in his office is defined by integrating and
standardizing logistics processes, developing a competent workforce, satisfying
customers, and ensuring future logistics effectiveness. Similar to E&T, the design of the
Office of Logistics is intended to be 75 percent visionary and 25 percent day-to-day.
Subject B stated that in practice, inverse proportions of focus are more realistic. This is
primarily due to a need for integrated and standardized logistics processes that require
less day-to-day involvement. Coded logisticians are not centralized within Subject B’s
office, but rather “farmed out” to the departments with the Office of Technical
Customer Satisfaction Logisticians at PHD Fleet Project Sponsors
Competent Workforce
Integrated and Standardized Logistics Processes Visionary vice day-to-day
Logistics Support Oversight Contracting Performance-Based Logistics Technical Documents Repair parts
Logistics Project Planning Predict future requirements Align with industry standards
Communication Internal External Product Area Directors Other WC’s
Work Force Development Formalized Logistics Education “Cross-Pollinization”
Future Logistics Effectiveness
Human Capital Intellect Hiring Education
Collaboration Internal Cross-Functional External - WC’s, NAVSEA FISC, NAVSUP
Logistics Requirements and Regulations
Task Force Lean Identify value streams
Processes Input Outcomes

39
ed outcome for Subject B. The
customer pers
at the core processes performed in the Office of
Logistics are
e two processes of logistics project planning and logistics support. In order to execute
Operations. With only four personnel assigned to his office, Subject B indicated that a
large amount of attention is paid to logistical activities within these departments. Breaks
in continuity in the workforce, identifying requirements, and re-creating programs that
fell by the wayside are challenges that Subject B is addressing. To minimize the day-to-
day load, Subject B indicated that standardizing processes would be the best method of
establishing common business practices for all logisticians at PHD. Subject B indicated
that the desired outcome of a competent workforce reinforces this integrated and
standardized culture, as an educated and “cross-pollinated” team of logisticians is
required to optimize logistics effectiveness at PHD.
Customer satisfaction is again a desir
pective for the office focuses primarily on the logisticians within the
lifelines at PHD, which in turn ensures that the fleet receives the logistical support (e.g.,
technical manuals, engineering changes, ordnance alterations) that they require. Subject
B also indicated that program sponsors are customers since the office performs a variety
of logistical services for them. The office could be funded to provide logistical support
for an entire project or it could be funded to provide oversight of a contractor, or
anywhere in between. Subject B alluded to the need for the office to stay at the leading-
edge of such initiatives as Performance-Based Logistics (PBL) and other evolving
industry standards to maintain this business base.
b. Processes Subject B indicated th
logistics project planning and logistics support. He indicated that the
logistics project planning process aligns current requirements, future requirements and
industry standards with actual services performed. Based on the interview with Subject
B, the author views logistics support as the project execution process where actual
services are performed. This support includes services such as contracting, oversight of
logistics projects, managing spare parts, or creating technical documents. Subject B
made it clear to the author that every desired outcome in the office is influenced between
th

40
&T, Subject B stated that he serves as an integrator of logistics
functions acro
eply involved in chasing value streams
via the Lean p
nput is viewed by Subject B as the most critical input
within his off
t cited by Subject
B that form the boundaries within which the planning, workforce development, and
these processes satisfactorily, Subject B indicated that the office relies on the support of
other upstream processes.
Similar to E
ss PHD. As such, he indicated that communication and collaboration are
the most important processes to facilitate effective logistics planning and support. One
example provided by Subject B indicated that cross-departmental collaboration and
communication resulted in applying lessons learned from a previous PBL project to a
new project, realizing significant resource savings. On the other hand, Subject B said
that it is difficult to break workers out of their set routine. He cited that some workers
walk the same number of steps to work, perform meaningful work, read the paper at
lunch, perform meaningful work again, and then finish up the day without having shared
any information. Subject B was optimistic about more PBL examples in the future, with
lesser amounts of the stovepipe mentality. Subject B also indicated that communication
and collaboration with other agencies (e.g., WC’s, NAVSEA, fleet) is conducted on a
limited basis.
Subject B stated that his office is de
rocess. This directly influences the planning process, how integrated and
standardized processes evolve, and also the viability of future logistics efforts (NSWC
PHD 2005). Workforce development was cited as essential to ensuring the Lean process
is executed properly while also ensuring that a competent workforce is serving the fleet
and program sponsors. Subject B placed emphasis on a formalized logistics education
that he says is necessary to truly develop a logistics focus within PHD.
c. Inputs The human capital i
ice. Due to the complex nature of logistics across many differentiated
products and services, hiring decisions are the one thing that he says causes him to lose
sleep at night. Subject B cited intellect and education as essential entering arguments
into how well his organization is suited to achieve the necessary tasks.
Logistics requirements and regulations are another inpu

41
logistics suppo
rt processes operate. A better understanding of these requirements and
regulations should result in a lesser focus on day-to-day activities.

Subject C Comptroller
Processes Outcomes t
Inpu42
Figure 11. Causal Performance Map – Subject C
3. Comptroller
a. Outcomes Subject C defined success as meeting Net Operating Result (NOR) and
carryover goals, maintaining compliancy with financial regulations, developing a
competent workforce, standardizing billing methodology and accounting practices, and
customer satisfaction. As a Navy Working Capital Fund (NWCF), PHD operates like a
business by charging customers with a stabilized billing rate for work performed and
allocating overhead for indirect expenses. Contrary to maximizing profits in a business,
the goal of a NWCF is to break even in terms of funded and executed workload. NOR
Customer Satisfaction Employees Sponsors of funded workload NSWC Headquarters
Achieve Carryover goal
Competent Workforce
Achieve NOR goalWorkforce Development Budgeting & Execution Education Funded workload Training Direct Hours
Overhead allocation Stabilized Rate
Task Force Lean Realize cost savings
Human Capital Compliancy Hiring Advise CO Attrition
Communication End Strength Collaboration Internal w/dept’s External w/ other WC’s
External - DFAS, NUWC,
Standardized Billing Methodology & Accounting Practices
Other WC’s Financial Requirements/ Regulations NWCF
Provide Services Contracting Payroll, travel, etc. Balance outlays w/ in-house work
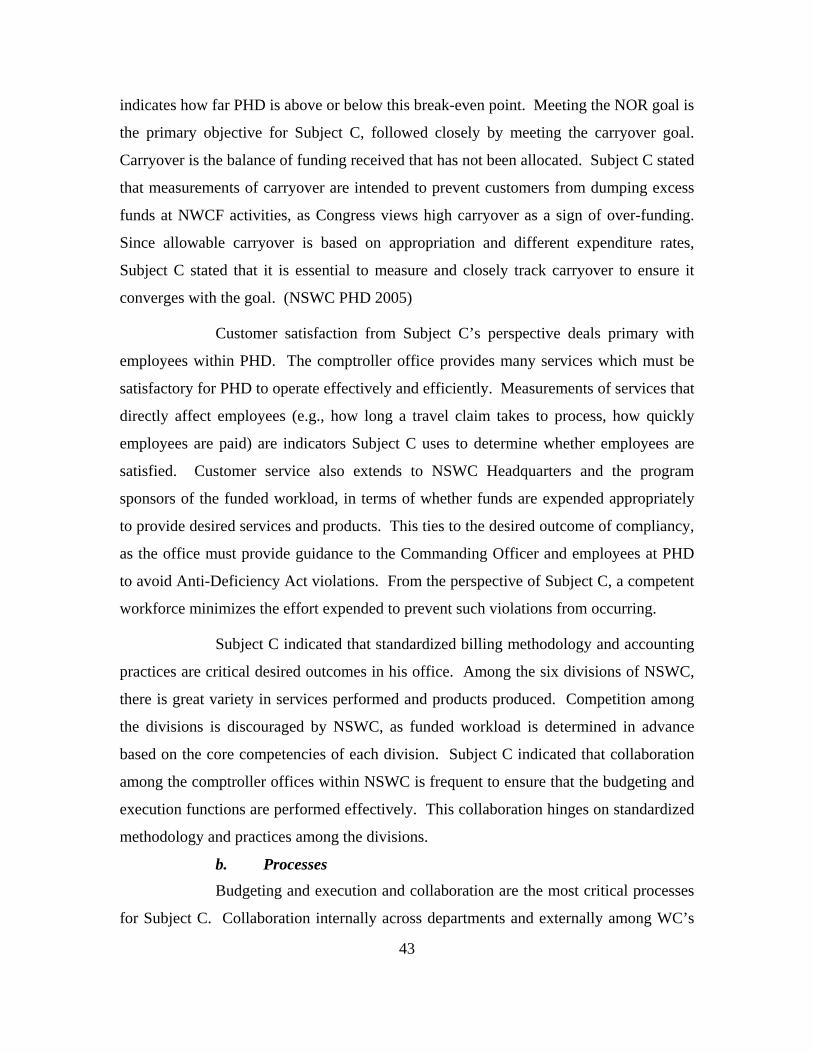
43
indicates how far PHD is above or below this break-even point. Meeting the NOR goal is
the primary objective for Subject C, followed closely by meeting the carryover goal.
Carryover is the balance of funding received that has not been allocated. Subject C stated
that measurements of carryover are intended to prevent customers from dumping excess
funds at NWCF activities, as Congress views high carryover as a sign of over-funding.
Since allowable carryover is based on appropriation and different expenditure rates,
Subject C stated that it is essential to measure and closely track carryover to ensure it
converges with the goal. (NSWC PHD 2005)
Customer satisfaction from Subject C’s perspective deals primary with
employees within PHD. The comptroller office provides many services which must be
satisfactory for PHD to operate effectively and efficiently. Measurements of services that
directly affect employees (e.g., how long a travel claim takes to process, how quickly
employees are paid) are indicators Subject C uses to determine whether employees are
satisfied. Customer service also extends to NSWC Headquarters and the program
sponsors of the funded workload, in terms of whether funds are expended appropriately
to provide desired services and products. This ties to the desired outcome of compliancy,
as the office must provide guidance to the Commanding Officer and employees at PHD
to avoid Anti-Deficiency Act violations. From the perspective of Subject C, a competent
workforce minimizes the effort expended to prevent such violations from occurring.
Subject C indicated that standardized billing methodology and accounting
practices are critical desired outcomes in his office. Among the six divisions of NSWC,
there is great variety in services performed and products produced. Competition among
the divisions is discouraged by NSWC, as funded workload is determined in advance
based on the core competencies of each division. Subject C indicated that collaboration
among the comptroller offices within NSWC is frequent to ensure that the budgeting and
execution functions are performed effectively. This collaboration hinges on standardized
methodology and practices among the divisions.
b. Processes Budgeting and execution and collaboration are the most critical processes
for Subject C. Collaboration internally across departments and externally among WC’s

44
provides a common foundation for the budgeting and execution process within PHD.
Subject C alluded to the communications process facilitating this collaboration. The
budgeting and execution process itself directly facilitates achievement of NOR,
carryover, and customer satisfaction goals. This process must balance direct hours with
overhead allocation, and also in-house work with contractual outlays. Subject C stated
that costs savings from Task Force Lean events add an additional complication into the
process, as capacity is ideally freed up for more work to be accomplished with the same
funded workload. Throwing PHD’s stabilized rate into the mix, it is clear to the author
that this process is a complex puzzle that must be managed closely.
Subject C indicated that workforce development process plays heavily into
how complex the process can become. An example was a department that was having
difficulty meeting financial goals over a two-month period. The department was
subjected to periodic financial reviews that were time-intensive in terms of preparation
and the review itself, for both the department and the comptroller’s office. Once the
department was properly trained and back on track, the periodic reviews stopped. This
provided an incentive for the department to stay on track and support execution of the
budget. Subject C indicated that other departments are learning from this example, and
of late the budgeting and execution process is running smoothly.
c. Inputs Human capital is again the most critical input for Subject C. From his
perspective, the important factors are the hiring, attrition, end strength, and “productive
workyear” numbers that form the basis of his budget. Everything from holidays, to
unplanned days off, to Presidential deaths must be figured into the budget for better
accuracy. Financial regulations are another important input into the processes, as they
again define the boundaries within which PHD can operate in a financial sense.

Subject D Office of Corporate Business
Processes Outcomes t
Inpu45
Figure 12. Causal Performance Map – Subject D
4. Office of Corporate Business
a. Outcomes Subject D defined success as meeting funded workload targets, realizing
cost savings through various processes, ensuring compliance with regulations, developing
a competent workforce, and satisfying customers. Corporate business within PHD differs
from comptroller functions in that in deals primarily with overhead. Facilities upkeep,
warehousing, security, and utilities are but a few of the services provided by this office.
The focus of services, and perspective of customers, is internal within PHD. Subject D
indicated that his greatest challenges, and most critical outcomes, are meeting funded
Customer Satisfaction PHD employees Field activities
Cost Savings
Competent Workforce
Meet Funded Workload Targets
Budgeting & Execution Allocation and projection - Funded workload - Overhead allocation
Identify Benchmarks Consistency in business operations
Provide Services Facilities, security, utilities, etc.
Communication Internal Divisions External Divisions - government agencies - other WC’s - customers Southwest Region Workforce Development
Training
Compliancy Inspector General NSWC Headquarters
Human Capital Hiring Attrition
Collaboration External w/ other WC’s
Business Requirement/ Regulations Task Force Lean
Identify targets of opportunity
Contracting Right person for right work

46
workload targets while ensuring compliance with regulations. Subject D stated that there
is uncertainty within regulations across so many activities, creating an imbalance between
compliance and running the day-to-day business.
Subject D indicated that a lack of common business rules across NSWC
encourages a day-to-day focus as divisions search for benchmarks and standards for
various activities. Within this challenging environment, corporate business must
continue to provide satisfactory services to employees and field activities, otherwise
department operations could be negatively affected. This highlights the customer
satisfaction outcome, which is viewed by Subject D as providing services strictly to PHD
employees.
b. Processes Benchmark identification is the most critical process for Subject D. It was
made clear to the author that uncertainty within core functions of the office prevents
optimization of effort in terms of both planning and execution. Subject D indicated that
he wrestles with a variety of benchmark issues within areas such as cell phone usage,
training allocation, facility modernization, and warehouse management responsibilities.
In order to eliminate uncertainty in areas such as these, he emphasized that common
business rules must be established. In the author’s opinion, the collaboration and
communication processes should be used to ensure everyone is on the same page
internally within PHD, while also establishing commonalities among WC’s.
Consistency of business operations drives the budgeting and execution
process for corporate business, as less uncertainty results in a straighter path to meeting
funded workload goals. As corporate business deals primarily with overhead, budgeting
and execution is directly affected by overtime, hiring, loss of direct hours in programs,
and other increased requirements (training, leave, budget marks, etc.). According to
Subject D, Task Force Lean events identify “targets of opportunity” for cost savings that
can relieve some of this budget pressure. Conversely, more expensive contractual outlays
are often necessary due to constrained abilities to respond to new tasks and initiatives.
Similar to the comptroller office, this creates a complex puzzle in terms of budgeting and
execution.

c. Inputs Human capital and regulations are again essential inputs for corporate
business. Regulations provide a foundation for common business rules and how
corporate business plans and executes. Employees within corporate business are essential
in terms of both responding to a volatile business environment and providing continuity
of experience to the overall organization.
Subject E Office of Technical Operations
Processes Outcomes t
Inpu47
Communication Collaboration Quality ProductInternal across dept’s Internal across dept’s External w/ other WC’s External w/ PAD’s, PM’s
Economically Viable Human Capital Affordability Intellect Eliminate Waste
Workforce Development Hiring Education Training
ScheduleEducation
Figure 13. Causal Performance Map – Subject E
Customer Satisfaction Fleet Project Sponsors
Competent Workforce
Fleet Combat Readiness Current Future
Technical Development and Support Current Fleet Future Fleet Risk Management
Planning Existing requirements Predict future requirements
Weapon System Requirements
Task Force Lean Identify value streams Mitigate inherent risk

48
5. Office of Technical Operations
a. Outcomes In the author’s opinion, the Office of Technical Operations is by far the
most complex organization within PHD. With five departments spread over five
geographic locations, providing support to over 50 surface warfare systems, many factors
are involved in determining success for this office. Subject E stated that first and
foremost, current and future fleet combat readiness are the desired outcomes. He
indicated that readiness is dependent on building reliability, maintainability, and
supportability factors into products and services up front. Subject E discussed the affect
of these factors on operational availability, which is discussed in Chapter V.
In terms of customer satisfaction, Subject E views the fleet as the primary
customer with sponsors of the funded workload as an important secondary customer.
Subject E further stated that quality products delivered on schedule are essential
outcomes, within the constraints of economic viability. In the author’s opinion these
outcomes also directly support customer satisfaction for both the fleet and program
sponsors. Subject E indicated that the success of each of these outcomes rests directly on
the workforce, placing emphasis on competency.
b. Processes The technical development and support process directly influences fleet
combat readiness, customer satisfaction, quality, cost, and schedule outcomes. In the
author’s opinion, technical development can be seen as project planning, while technical
support can be seen as project execution. It was made clear to the author that the project
execution process is fed by the project planning process in accordance with existing and
future weapon system requirements, development of the technical workforce,
collaboration across offices and departments, and efficiencies realized from Task Force
Lean events.
Subject E indicated that collaboration is an especially important process
within this office. In 2003 NSWC completed implementation of “Product Area
Directors” (PAD) that directly interface with customers (program sponsors) across 12
different product areas. These PAD’s are spread across the six divisions of NSWC,

49
strategically located where they are most needed. The “Surface Ship Combat Systems”
PAD is located at PHD, and has “customer advocates” assigned to his office. These
customer advocates are located within each of the five departments of Technical
Operations, and they communicate and collaborate with department managers, offices,
PAD’s, and customers for various programs and projects. Communication and
collaboration with PAD’s and other WC’s are critical to ensuring concerns are addressed,
outside activities are on the same page, and project health is at the desired level.
Collaboration with E&T is especially important, as the future direction of the office is
determined through this interaction.
Developing a capable workforce is another critical process for Subject E.
Shaping the workforce through training and education to stay at the leading edge of
technology is essential to maintaining a workforce suited to knowledge-based work.
Assigning the right person to the right work is key to effective allocation of direct hours
and completion of projects in a timely manner.
Managing risk is a specific concern for Subject E. When processes are
“Lean-ed” and steps are eliminated, he indicated that a sanity check should be conducted
to ensure that the reasons for including those steps are now invalid. Ensuring that
requirements and performance are not compromised for cost savings is an important
consideration for Subject E. He indicated that efficiencies should be realized without
serious impact to the safety, operational availability, and reliability of warfare systems.
Subject E stated that the Safety, Effectiveness, and Affordability Review (SEAR)
program is utilized within all projects at PHD to ensure risk is managed satisfactorily.
The components of the SEAR are discussed at length in Chapter V.
c. Inputs Weapon systems requirements are the most critical input for the Office of
Technical Operations. Subject E indicated that they are the entering argument not just for
planning, but also for hiring decisions to effectively shape the workforce. This indicated
to the author that human capital is also a critical input for Subject E.

Subject F Ship Defense and Expeditionary Warfare Department
Processes Outcomes t
Inpu50
Figure 14. Causal Performance Map – Subject F
6. Ship Defense and Expeditionary Warfare Department The Ship Defense and Expeditionary Warfare Department (S-Department) is the
second-largest department at PHD with a 2005 funded workload of approximately $123
million. With arguably the most diverse operations among all departments, systems
supported include radars, missiles, gun systems, and underway replenishment. (NSWC
PHD 2005) The author’s mentor at PHD recommended analysis of this department due
to this comprehensive nature of operations.
Customer Satisfaction Fleet Project Sponsors
Standardized Best Business Practices
Competent Workforce Systems Engineers T&E practitioners
Project Execution Funding profile Leadership and Oversight Changes Program/Project Health
Fleet Combat Readiness Earned Value Management Technical Authority Supportability Direct hours/overhead
Project Planning Analogy/historical comparison Life Cycle analysis Reliability/supply chain Emerging Technologies
Direct
Communication Internal Divisions External Divisions Product Area Directors Other WC’s Fleet Help Desk
Workforce Development Education/On-the-job training Rotational Assignments
Cost, Performance, Schedule
Human Capital
Collaboration Internal External
Hiring Attrition Education
- WC’s, Industry, NATO
Fleet and Sponsor Requirements
Task Force Lean Identify value streams

51
a. Outcomes Subject F defined success as improving fleet combat readiness, satisfying
customers, developing a competent workforce, and standardizing best business practices.
Meeting cost, performance, and schedule requirements is also a desired outcome. The
primary focus is improvements in operational availability, reliability, maintainability, and
supportability of fleet warfare systems. Subject F’s perspective of customers is again
primarily the fleet, with project sponsors coming in a close second. Subject F indicated a
competent workforce is essential in maintaining a consistent level of effort in the
provision of services and products. Standardized business practices are also essential to
ensure everyone in S-Department is on the same page in terms of business operations,
execution of work, and reporting up the chain of command.
b. Processes Subject F indicated that the two most essential processes within S-
Department are project planning and project execution. Interview data collected
indicated that these processes directly support fleet combat readiness, customer
satisfaction, and cost, performance, schedule outcomes. Within project planning, Subject
F stated that accurate analogy and historical comparisons of previously-executed projects
play a critical part in designing new projects. Additionally, he stated that accurate life-
cycle analysis of projects is necessary to capture costs connected with reliability,
maintainability, and other supply chain factors over the life of the system. He further
emphasized that contrary to a historical analysis, emerging technologies must also be
considered to maximize the effectiveness of in-service engineering initiatives. The
project planning process is also constrained by budgeted direct hours and overhead
allocation.
Based on the interview with Subject F, it is clear to the author that the
planning process in S-department feeds directly into project execution. The project
execution process meticulously tracks deviations from the project funding profile
developed in the planning phase, and also changes in planned requirements. Subject F
indicated that the Earned Value Management System (EVMS) is a management tool
frequently used to integrate cost, performance, and schedule factors for a project, whether

52
work is performed “in-house” or contracted out. Within EVMS, the cost performance
index (CPI) compares budgeted cost of work performed (BCWP) to actual cost of work
performed (ACWP). Cost variance (CV) is BCWP less ACWP. The schedule
performance index (SPI) compares BCWP to budgeted cost for work scheduled (BCWS).
Schedule variance (SV) is BCWS less BCWP. This is illustrated in Table 3. Subject F
also stated that straight-lined spend plans are used to track level-of-effort contracts, with
step functions linked to surge activities within applicable schedules.
CPI CV SPI SV
Budgeted Cost of Work Performed/
Actual Cost of Work Performed
Budgeted Cost of Work Performed –
Actual Cost of Work Performed
Budgeted Cost of Work Performed/ Budgeted Cost of Work Scheduled
Budgeted Cost of Work Performed – Budgeted Cost of Work Scheduled
Table 3. Earned Value Management System (Naval Postgraduate School 2005)
With many projects in motion at any given time within S-Department,
Subject F indicated that leadership and oversight are essential for two reasons. First, it is
cited as necessary to monitor the overall project health and progress of workload
execution. Second, it is cited as necessary to ensure technical authority is not violated,
and that technical warrant holders are meeting their responsibilities. Subject F indicated
that these safeguards support PHD as a sustaining organization characterized by
continuous improvement. They also support the outcome of customer satisfaction, both
in terms of improved products and services for the fleet and meeting project sponsor
expectations.
Collaboration and communication are again essential, but distinct in the
direct interface S-Department has with PAD’s, the fleet, and outside agencies such as
NATO. As previously mentioned, customer advocates are located within each
department to serve as liaisons among customers, PAD’s, and departmental projects.
NSWC as a cost-effective single enterprise hinges on these relationships. S-Department
also has direct interface with the fleet via the “fleet help desk,” providing maintenance
and operational assistance via distance support and assist visits. Additionally, S-

53
Department is responsible for the NATO Sea Sparrow missile system, leading to close
relations with NATO headquarters and other NATO countries.
Workforce development is again a key process emphasized by Subject F.
Rotational assignments are utilized within the department to encourage a cross-functional
workforce capable of adapting to changing requirements. Junior professionals are young
engineers who are provided internships to grow within the organization from the bottom-
up. Workers are also trained in the Task Force Lean methodology to identify value
streams and standardize best business practices across PHD.
c. Inputs Processes and outcomes within S-department are derived from fleet and
sponsor requirements from the outset. Human capital strategy is again pivotal in support
of core competencies within the department. Both of these inputs are equally critical
across each department within the Office of Technical Operations.

54
PHD Consolidated Map
Figure 15. PHD Consolidated Causal Performance Map
Customer Satisfaction Fleet Sponsors & Stakeholders Workforce
Integrated and Standardized Processes Common business rules Billing & Accounting practices
Competent Workforce Systems Engineers T&E practitioners
Fleet Combat Readiness Current/Future Supportability Logistics Effectiveness
Project Execution Funding profile Changes Earned Value Management Direct hours/overhead
Leadership and Oversight Program/Project Health Technical Warrant Holders Technical Authority
Project Planning Future Requirements Life Cycle analysis Emerging Technologies Align w/ industry
Communication Internal/SEAR External Product Area Directors Other WC’s Fleet Help Desk
Workforce Development Formalized Education Training/Tool Sets “Cross-Pollinization” Rotational Assignments
Cost, Performance, Schedule Quality Product
Human Capital Hiring Attrition Education End Strength
Collaboration Internal External - WC’s, PAD’s, Industry, labs, academia, other outside agencies
Requirements/ Regulations Fleet and Sponsor Weapon Systems Logistics Financial (NWCF) Business
Task Force Lean Strategic Mapping Identify value streams Realize cost savings
Environmental Scan Acquisition Reform Technology Trends COC guidance SEA POWER 21 Technical Authority
Knowledge Management Portal Systems Engineering Board Expert Systems Communities of Practice Lessons Learned Strategic enablers
Technical “due diligence” Sound Decision Making Risk Management System Optimization Trade-offs
Sustaining Organization
Logistics Support Oversight Performance-Based Logistics Technical Documents Repair parts
Provide Services Payroll, travel, accounting Facilities, security, utilities
Contracting Balance outlays & in-house Right person for right work
Budgeting & Execution Funded workload Direct Hours Overhead allocation Stabilized Rate
Achieve NOR & Carryover goals
Compliancy Advise CO
Identify Benchmarks Consistency in business ops
Technical Development and Support In-Service Engineering Initiatives Core Services/Risk Management
Processes Outcomes Input

55
7. Consolidated Causal Performance Map Figure 15 reflects the complexity of interactions among inputs, processes, and
outcomes captured from the tacit knowledge of line managers at PHD. In Chapter V the
author will analyze these data in terms of critical performance variables and suggested
balance of perspectives within the organization. Additionally, existing performance
metrics within PHD will be identified and assessed in terms of federal guidance
alignment and overall appropriateness and quality of metrics.

56
THIS PAGE LEFT INTENTIONALLY BLANK

57
V. ANALYSIS AND ASSESSMENT OF EXISTING METRICS
A. CRITICAL PERFORMANCE VARIABLES The causal performance maps developed for PHD openly communicate the
factors that PHD line managers view as critical to success. After conferring with
interview subjects to verify the accuracy of the maps, critical performance variables
(CPV) were selected by the author for each office or department based on performance
drivers within the maps. Recall that while all performance drivers are important, only
some are truly critical to success at PHD. Although interviews indicated that there is a
wide variation in the type of work and services performed within each office or
department, there is a commonality in CPV’s that define success across PHD. Table 4
illustrates CPV’s for each office and department interviewed, with common CPV’s
within PHD illustrated in the last column. Figure 16 also illustrates these common
CPV’s, but in the format of a causal performance map for better visualization.
Identifying CPV’s should place focus squarely on the performance drivers for
success within PHD. The common CPV’s in Figure 16 are a synchronized “story of
success” for PHD, as line managers agree on the ingredients required to achieve success.
In the following analysis, the author organizes CPV’s within the balanced scorecard
perspectives discussed in Chapter II. The purpose of this is to ensure each perspective is
represented in PHD’s “story of success,” while also establishing a balanced foundation
for assessment of existing metrics at PHD. Prior to each perspective, the author includes
a figure to provide a visual illustration of the CPV’s applicable within each perspective.

58
Engineering & Technology
Logistics Comptroller CorporateBusiness
Technical Operations
S-Department Common CPV’s
Inputs Human Capital Fleet Requirements Acquisition Reform Technical Authority Technology Trends Senior Guidance Processes Collaboration Communication Leadership and Oversight
Task Force Lean Future Workforce Development
Project Planning Knowledge
Management In-Service Engineering Initiatives
Outcomes Customer Satisfaction Competent Workforce Fleet Combat Readiness
Sustaining Organization
Technical due diligence
Inputs Human Capital Logistics
Requirements Processes Collaboration Communication Task Force Lean Workforce
Development Project Planning Logistics Support (Provide Services)
Outcomes Customer Satisfaction Competent Workforce Future Logistics
Effectiveness Integrated and
Standardized Processes
Inputs Human Capital Financial Regulations Processes Collaboration Communication Task Force Lean Workforce Development
Budgeting and Execution
Contracting Provide Services Outcomes Customer Satisfaction Competent Workforce Achieve NOR and Carryover Goals
Compliancy Standardized Billing & Accounting Practices
Inputs Human Capital Business Requirements and Regulations
Processes Collaboration Communication Task Force Lean Workforce Development
Budgeting and Execution
Contracting Provide Services Outcomes Customer Satisfaction Competent Workforce Meet Funded Workload Targets
Compliancy Cost Savings
Inputs Human Capital Weapon System
Requirements Processes Collaboration Communication Task Force Lean Workforce Development
Planning Technical
Development and Support (Project Execution)
Outcomes Customer Satisfaction Competent Workforce Fleet Combat Readiness
Quality Product Economically Viable Schedule
Inputs Human Capital Fleet and Sponsor
Requirements Processes Collaboration Communication Leadership and
Oversight Task Force Lean Workforce
Development Project Planning Project Execution Outcomes Customer Satisfaction Competent Workforce Fleet Combat Readiness
Cost, Performance, Schedule
Standardized Best Business Practices
Inputs Human Capital Requirements and
Regulations Processes Collaboration/Knowledge
Management Communication Leadership and Oversight Task Force Lean Workforce Development Project Planning Project Execution Budgeting & Execution Outcomes Customer Satisfaction Competent Workforce Fleet Combat Readiness Cost Performance Schedule Meet NOR and
Carryover Goals Standardized Processes
Table 4. CPV’s Across PHD

59
Figure 16. Common CPV’s Across PHD
CUSTOMER SATISFACTION
STANDARDIZED PROCESSES
COMPETENT WORKFORCE
FLEET COMBAT READINESS
Common CPV’s Across PHD
PROJECT EXECUTION
LEADERSHIP & OVERSIGHT
PROJECT PLANNING
COMMUNICATION
WORKFORCE DEVELOPMENT
COST, PERFORMANCE, SCHEDULE
HUMAN CAPITAL
COLLABORATION/KNOWLEDGE MANAGEMENT
TASK FORCE LEAN
REQUIREMENTS/REGULATIONS
BUDGETING & EXECUTION
MEET NOR AND CARRYOVER GOALS
Processes CPV’s Input CPV’s Outcome CPV’s

1. Learning and Growth Perspective In applying the learning and growth perspective to PHD, the question that should
be answered is “To achieve our vision, how will we sustain our ability to change and
improve (Kaplan and Norton 1992)?” The CPV’s within Figure 17 should answer this
key question.
60
Figure 17. Learning and Growth Perspective CPV’s
a. Human Capital Input Interviews indicated that highly skilled, experienced workers are required
to provide effective support for over 50 surface warfare systems that fall under PHD.
Testing new missiles, integrating new computer baselines, and upgrading fire control
radars are not the sort of work that entry-level personnel can likely accomplish. The
COMPETENT WORKFORCE
Learning and Growth Perspective
COMMUNICATION
WORKFORCE DEVELOPMENT
HUMAN CAPITAL
COLLABORATION/KNOWLEDGE MANAGEMENT
TASK FORCE LEAN
PROCESS CPV’s INPUT CPV’s OUTCOME CPV’s

61
average age of the workforce at PHD is 47 years, indicating a reliance on experience.
Increasing numbers of these workers are eligible to retire. Additionally, NSWC
Headquarters directed a reduction in work years by 5 percent each year for the next three
years, all while sustaining current performance levels (NSWC PHD 2005). This
translates into more attrition, fewer hiring opportunities, and constant or increasing
requirements. The challenge here is obvious as the weight of the future workforce hangs
on the effectiveness of a limited number of hiring decisions. In terms of human capital,
the learning and growth of PHD depends directly on these decisions. Interviews
reinforced how heavily this weighed on the minds of line managers.
However, interviews also indicated that attrition challenges present an
opportunity for learning and growth. Since PHD is a changing organization that must
constantly adapt to emerging technologies and innovative processes, replacing a retiring
workforce can work to the organization’s strategic advantage. An example discussed in
the E&T interview emphasized the need for modeling experts to transition to a new
method of evaluating naval gunfire systems. Developing that skilled worker from within
would likely require a large investment in time, training, and supervision. Hiring a new
worker that matches the requirement for a modeling skill set could alleviate this pressure
on resources. Furthermore, hiring a new worker with a cross-functional intellect could
not only meet the near-term requirement, but provide flexibility in the workforce for
future change.
b. Workforce Development Process While the mandatory attrition previously discussed constrains PHD’s
ability to control the number of workers that can be hired or retained, the line managers
indicated that they have significant control in how they develop their workforce. One of
PHD’s core values is “continual development of our people (NSWC PHD 2005).” PHD
utilizes rotational assignments of technical department employees to encourage cross-
functionality, communication, and collaboration. Additionally, supervisors in technical
departments provide counseling and mentoring through Individual Development Plans
(IDP) and Individual Performance Plans (IPP). These plans link individual goals to
department action plans, which in turn are linked to strategic objectives (NSWC PHD

62
2005). From the author’s perspective, these workforce development actions place focus
squarely on learning and growth within PHD.
The Junior Professional (JP) program “grows” new engineers from the
bottom-up, providing them with an opportunity to gain hands-on experience with
technical departments and possibly long-term employment at PHD. In a similar vein,
PHD collaborates with the Naval Postgraduate School to produce certifications and
degrees in systems engineering and systems analysis. Furthermore, PHD allocates the
largest portion of overhead to training, demonstrating a commitment to developing the
workforce. Resources are also dedicated to training the workforce in Task Force Lean,
which aims to create a culture of efficiency as the workforce recognizes and takes action
on process improvement opportunities. Each of these actions and initiatives encourage a
culture of innovation, promoting a workforce that anticipates and responds to a changing
environment. (NSWC PHD 2005)
c. Task Force Lean Process Lean deserves specific mention in terms of the learning and growth
perspective. Application of the Lean methodology is taken from a strategic perspective at
PHD. The Executive Staff Board at PHD, chaired by the Commanding Officer, holds a
strategic planning session that identifies the best “targets of opportunity” for Lean
savings. These are typically complex processes of significant cost with potential
inefficiencies. When a process is “Lean-ed,” the entire process is mapped out to identify
an extremely detailed resource-to-task allocation. The process is then restructured to
eliminate waste of resources and realize cost savings. The eliminated wastes result in
increased capacity to “redeploy personnel” to perform additional tasks. The estimated
cost savings are reported out upon completion of the Lean event, and then it is up to the
activity that owns the process to realize those cost savings. (NSWC PHD 2005)
d. Communication and Collaboration Processes Line managers indicated that sharing information, building
complementary relationships, and managing knowledge are each critical in sustaining the
ability to change and improve. Although departments vary greatly in terms of the final
products or services they provide, interviews made it clear to the author that there are

63
many opportunities to capture lessons learned and existing tacit knowledge across
departmental lines. The logistics interview provided an excellent example of this in the
lessons learned from a PBL initiative. Instead of starting a new project from ground zero,
departments shared information on other PBL initiatives. This communication across
boundary lines allowed the new PBL project to begin further along the learning curve
(NSWC PHD 2005). The author believes this type of efficiency can be realized in basic
functions such as creating technical manuals, contracting, planning and executing tests,
certifications, and other common functions across PHD.
Interviews made it clear to the author that a system and process that
manages the sharing of information is essential for learning and growth to occur at PHD.
The implementation of a command portal has taken long strides in capturing lessons
learned, requirements and regulations, technical information, existing performance
metrics, and other useful documentation (NSWC PHD 2005). PHD also has
“communities of practice,” which are teams composed of subject matter experts that
compare processes to determine best practices (NSWC PHD 2005). Other venues such as
the Systems Engineering Board and Systems Supportability Board bring together cross-
functional members within projects to share information and encourage adoption of
engineering and logistics best practices (NSWC PHD 2005). The initiatives and
processes that the author observed emphasized the importance of communication and
collaboration at PHD.
As evidenced during interviews with subjects, communication and
collaboration external to PHD are also essential. While the staff of the product area
director (PAD) for Surface Ship Combat Systems is located at PHD, extensive
communication and collaboration are necessary with other WC’s and the PAD’s for Ship
and Ship Systems, Force Level Warfare Systems, Littoral Warfare Systems, Navy
Strategic Weapon Systems, Ordnance, Homeland & Force Protection, and Surface
Warfare Logistics and Maintenance (NSWC PHD 2005). This collaboration supports
NSWC’s strategic objective of “operating as a single, cost-effective enterprise.”
Additionally, relationships with industry, government laboratories, and academia are
critical for awareness of emerging technologies, processes, and standards.

e. Competent Workforce Outcome A competent workforce was consistently articulated by line managers as
critical to success at PHD. Exercising due diligence in technical warrant holder
responsibilities was specifically highlighted. The competent workforce outcome is
directly linked to PHD’s strategic objectives, “Develop and Reward Our Workforce” and
“Embrace New Technology and Develop a Culture of Innovation.”
2. Internal Business Processes Perspective CPV’s within the internal business processes perspective should answer the
question, “To satisfy our shareholders and customers, what business processes must we
excel at (Kaplan and Norton 1992)?” The CPV’s within Figure 18 should answer this
question. The author interprets shareholders in this context as the chain of command and
providers of PHD’s funded workload. Customers include the fleet, program sponsors,
and employees at PHD.
64
Figure 18. Internal Business Processes CPV’s
a. Requirements and Regulations Input Many different requirements and regulations feed into the internal
business processes at PHD. These include technically-oriented items such as weapon
STANDARDIZED PROCESSES OUTCOME
Internal Business Processes Perspective
COMMUNICATION
PROJECT PLANNING
REQUIREMENTS & REGULATIONS
COLLABORATION/KNOWLEDGE MANAGEMENT
PROCESS CPV’s OUTCOME CPV’s INPUT CPV’s
PROJECT EXECUTION
LEADERSHIP & OVERSIGHT
TASK FORCE LEAN
COST, PERFORMANCE, SCHEDULE OUTCOME

65
system operating parameters, fleet maintenance policy and procedures, logistics policy,
acquisition reform, and NAVSEA instructions. They also include administrative items
such as Defense Travel System requirements, purchase card requirements, security
requirements, and facility upkeep requirements (NSWC PHD 2005). These inputs are
essential to PHD in that they establish the constraints within which the organization must
operate. In the author’s opinion, employees that need to manage to these requirements
should have them readily available to examine as necessary.
b. Project Planning Process Interviews indicated that established benchmarks, industry standards,
existing requirements, and future requirements should be considered as entering
arguments into the project planning process. From an internal business processes
perspective, this indicates that PHD should consistently excel at identifying benchmarks
and requirements to support planning efforts.
In terms of cost, interviews indicated that estimations are conducted
utilizing historical project comparisons, life cycle cost projections, and reliability and
supply chain analyses. While cost estimations obviously provide cost information, they
also provide a matching performance standard at the projected cost. As stated in the
customer perspective, line managers emphasized that attributes such as reliability,
maintainability, availability, and supportability should be built within the performance
standard to encourage an accurate projection of the life-cycle cost and effectiveness.
From an internal business processes perspective, planning these attributes into projects
should be a process that PHD excels at.
Line managers indicated that schedule and performance variables are
interrelated, as schedule is determined based on an estimated number of direct and
overhead hours needed to accomplish planned work to specification (NSWC PHD 2005).
From an internal business processes perspective, PHD should excel at accurately
determining required direct and overhead hours within the planning process.
c. Project Execution Process From an internal business processes perspective, the project execution
process is where the “rubber meets the road” at PHD. The output of this process is the

66
basket of products and services that directly impact fleet combat readiness, customer
satisfaction, and achievement of cost, performance, and schedule goals. Similar to
budgeting and execution, line managers stated that they meticulously track contractual
outlays, direct hours, and overhead to ensure projects are executing appropriately.
Additionally, project execution must track performance and schedule for each project
(NSWC PHD 2005). From an internal business processes perspective, PHD should
excel at tracking these variables within project execution.
As discussed in Chapter IV, EVMS is used to track the progression of
cost, performance, and schedule within each project. Line managers indicated that
difficulties arise when changes occur in the baseline for measurement within EVMS.
Interviews indicated that changes often occur in projects for reasons such as changing
requirements, funding issues at the program level, or emerging technologies. Data
collected make it clear to the author that project execution from an internal business
process perspective is very dynamic and challenging to manage.
Interviews also indicated that contracting and project execution go hand-
in-hand, as PHD uses direct citation funding for products and services that do not fall
within their core competencies or capacity (NSWC PHD 2005). From an internal
business perspective, PHD should excel at identifying appropriate circumstances and
sources for contracting.
d. Leadership and Oversight, Communication, and Collaboration
Line managers indicated that the leadership and oversight process
reinforces and validates project planning and project execution processes. Examples of
line manager involvement in projects include oversight of contracts, ensuring technical
authority is not violated, implementing new methods or standards, or performing internal
audits (NSWC PHD 2005).
As discussed in the learning and growth perspective, internal and external
collaboration are necessary within most projects. Line managers indicated that an
integrated effort within projects is necessary to shift from a day-to-day reactive focus to a
more forward-looking, visionary focus. They also cited a great need for standardized

67
processes and common business rules within internal business processes to realize more
productivity from efforts. Interviews reiterated that stakeholders from engineering,
logistics, financial, technical operations, and external functions should be thoroughly
involved in projects utilizing a standard approach. Interviews made it clear to the author
that more integrated involvement reduced risk of estimating errors and potential
oversights.
e. Task Force Lean Process Line managers agreed that establishing a pervasive “Lean mentality” at
PHD should enhance project planning and project execution, as well as lead to
standardized processes. If the workforce gains the ability to systematically identify and
implement process efficiencies, resources should be freed up to relieve pressure on
planning and execution constraints. If everyone at PHD is onboard with this philosophy,
the author believes that Lean will become a standardized process that streamlines
business operations across the entire command
f. Cost, Schedule, Performance Outcome Meeting cost, schedule, and performance targets was a goal mentioned
more than any other goal by line managers. For this reason, the author believes it is the
most deeply rooted outcome within PHD’s internal business processes. As previously
stated, this outcome links directly to PHD’s strategic objective, “Improve the Efficiency,
Delivery and Quality of Our Products…Right Work at the Right Cost.”
g. Standardized Processes Outcome Within internal business processes, line managers indicated that
standardized processes are essential for success at PHD. This outcome links directly to
PHD’s strategic objective, “Operate As a Seamless Organization by Improving Enterprise
Collaboration.”
3. Customer Perspective This perspective seeks to answer the question, “To achieve our vision how should
we appear to customers (Kaplan and Norton 1992)?” The CPV’s within Figure 19 should
answer this question. Customer stakeholders for PHD include the fleet and sponsors of
the funded workload.

68
Figure 19. Customer Perspective CPV’s
a. Fleet Requirements Input Fleet requirements are the genesis of all work performed at PHD. These
requirements can originate from an enlisted technician on a ship who recognizes a
problem with a maintenance procedure, or from PEO IWS as a matter of the Navy’s
future direction. Regardless of the point of origination, these requirements can be stated
as customer needs. In the author’s opinion, awareness of customer needs is an area that
should be within the span of control at PHD. Feedback and communications from the
fleet, program sponsors, and other WC’s should be used to raise and maintain this
awareness.
b. Project Planning Process PHD identifies three core functions as the critical value-generators within
the organization. They are listed as follows:
• Installation – Install new or modernized warfare systems within cost and schedule limits, and meet quality standards.
• Test & Evaluation (T&E) – Determine valid criteria to test and evaluate/analyze weapon systems against established/stated performance/operational objectives.
FLEET COMBAT READINESS
Customer Perspective
CUSTOMER SATISFACTION
PROJECT PLANNING
REQUIREMENTS & REGULATIONS
PROCESS CPV’s OUTCOME CPV’s INPUT CPV’s
PROJECT EXECUTION COST, PERFORMANCE, SCHEDULE OUTCOME

69
• Support – Ensure continued operability, maintainability, capability, and reliability of in-service systems (NSWC PHD 2005).
Line managers indicated that program sponsors are primarily concerned
with cost, schedule, performance, and readiness as they relate to the core functions
described above. In terms of fleet customers, performance and readiness are the key
expectations. Within the planning process, interviews indicated that meeting customer
expectations requires early and accurate planning. This includes planning to meet future
customer needs in a variety of aspects (e.g., logistics, E&T, T&E) (NSWC PHD 2005).
Specifically concerning performance and readiness, interviews indicated that building
reliability, maintainability, availability, and supportability factors into products and
services is critical. This was emphasized as the only way to meet expected life-cycle cost
and effectiveness goals. Line managers also emphasized that managing risk within
project planning is essential to meeting customer safety needs.
c. Project Execution Process Due to PHD’s life-cycle responsibilities for products and services, the
project execution process can continue for many years after fielding an installation,
upgrade, or service. Line managers indicated that reliability, maintainability, availability,
and supportability are the key components that determine how much involvement will be
required by PHD to support customer needs over the life cycle of products and services.
Interviews also indicated that PHD tracks project execution meticulously to assure
customer’s that expectations will be met.
d. Fleet Combat Readiness Outcome Interviews indicated that achieving fleet combat readiness goals is the
primary goal from the customer perspective. While this is linked closely with the cost,
schedule, and performance outcome, line managers indicated that the bottom line goal is
to enhance mission capability for the customer. This outcome links directly to PHD’s
strategic objective, “Improve Combat Systems Readiness.”
e. Cost, Schedule, Performance Outcome As stated within the project planning and execution processes,
achievement of cost, schedule, and performance goals is one of the customer’s primary

expectations. This outcome links directly to PHD’s strategic objective, “Improve the
Efficiency, Delivery and Quality of Our Products…Right Work at the Right Cost.”
f. Customer Satisfaction Outcome Interviews indicated that the customer satisfaction outcome is directly
affected by the project planning and project execution processes, as well as successfully
achieving fleet combat readiness and cost, schedule, performance goals. This outcome is
also directly linked to PHD’s strategic objective, “Improve the Efficiency, Delivery and
Quality of Our Products…Right Work at the Right Cost.”
4. Financial Perspective Within the financial perspective at PHD, CPV’s should address the question “To
succeed financially, how should we appear to shareholders (Kaplan and Norton 1992)?”
The CPV’s within Figure 20 should answer this question. Shareholders in this context
include the chain of command and providers of PHD’s funded workload.
70
Figure 20. Financial Perspective CPV’s
MEET NOR AND CARRYOVER GOALS
Financial Perspective
COMMUNICATION
BUDGETING AND EXECUTION PROCESS
REQUIREMENTS & REGULATIONS COLLABORATION/KNOWLEDGE MANAGEMENT
PROCESS CPV’s INPUT CPV’s OUTCOME CPV’s

71
a. Financial Regulation Input The financial operations at PHD largely fall under constraints of
regulations for NWCF activities. PHD submits an A-11 Budget 18 months in advance of
the budget year. The President’s Budget, typically received in January, assigns the
annual NOR goal for the execution year and the stabilized rates to be used in the
following year. PHD officially receives an operating budget and budget authority
through an “Annual Cost Authority” letter issued by NAVSEA. The only portion of this
budgeting framework that is under the span of control at PHD is the original A-11 Budget
submission. Since this submission likely changes after filtering through the President’s
Budget, metrics associated with the submission will likely provide little benefit.
Achieving NOR is obviously critical from a compliancy standpoint, and should be
monitored closely. (NSWC PHD 2005)
Customer funding regulation is a more complex area that requires
additional management attention. PHD receives funding from customers (e.g., program
sponsors, PEO’s, fleet) on either a reimbursable or direct citation of funds basis.
Reimbursable funds are only available for in-house work, including both direct labor and
overhead. Funds received on a direct citation basis are available for contracting purposes
only. This construct requires continuous management attention as direct hours, overhead,
and the NOR goal must be in balance. (NSWC PHD 2005)
The carryover funding requirement is another NWCF item tracked
extensively by everyone from NSWC Headquarters to Congress. Carryover funding
includes all reimbursable funding that has not yet been costed (i.e., work performed or
material/equipment received). Direct citation funds are not counted as part of carryover.
If carryover is too high, Congress views the program as over funded. If carryover is not
managed properly, the result could be cuts in program funding, which negatively affects
the fleet combat readiness and customer satisfaction outcomes at PHD. (NSWC PHD
2005)
b. Budgeting and Execution Process The budgeting and execution process at PHD is complex due to many
dynamic variables that should always be in proper balance. The first component of this

72
complexity is managing the proportion of reimbursable work against contracted work
executed. On the reimbursable side, the carryover measure safeguards “dumping” of
funds by program sponsors to NWCF activities, claiming that funds have now been
obligated. On the contractual side, NSWC Headquarters performs internal audits on all
divisions to ensure that funded workloads are not executed simply by increasing
contractual outlays (NSWC PHD 2005).
Interviews indicated that the real challenge in budgeting and execution lies
in the balance among direct hours, overhead, and achievement of the NOR goal. If direct
labor costs are greater than budgeted, overhead must go down to compensate for the
finite amount of reimbursable funding. Also, if productive work hours decrease due to
unforeseen circumstances (e.g., leave, command holidays, new federal holidays),
overhead again must go down to compensate for a loss in productivity. The complexity
of this balancing act increases due to the components of overhead, which range from
human capital and training to facilities and utilities. The corporate business office feels
this pressure also as overhead requirements rarely decrease, and services provided are
directly affected by reductions in the amount of overhead that can be allocated.
Changes to the execution year budget exist outside of the unforeseen
circumstances above. For the current execution year, fiscal year 2005, PHD was directed
to change the NOR goal with less than five months remaining in the cycle (NSWC PHD
2005). This directly impacts reimbursable and direct citation funding, as well as direct
hour and overhead allocation. Additionally, PHD was directed to expand a single
stabilized rate to three pay bands of low, medium, and high stabilized rates. This was
directed one month prior to the end of the fiscal year to align all division stabilized rates
across NSWC (NSWC PHD 2005). This could directly affect customer satisfaction as
new funding profiles may have to be negotiated. Furthermore, realized cost savings from
Task Force Lean are a deviation from the budgeted plan, creating a need for further
recalculations.
Specifically for overhead within corporate business, the consideration of
established benchmarks can be difficult if those benchmarks are not readily available.

73
Until benchmarks are identified for overhead within core functions, it is the author’s
opinion that the corporate business office will likely have great difficulty in improving
efficiency and effectiveness.
c. Communication and Collaboration Processes As mentioned in Chapter IV, both the comptroller and corporate business
offices rely heavily on communication and collaboration across WC’s. Interviews
indicated that standardized processes resulting from communication and collaboration
encourage more productive efforts. This streamlines the budgeting and execution process
across NSWC as management attention is placed where it matters most (NSWC PHD
2005).
d. Meeting NOR and Carryover Goals Outcome Interviews indicated that meeting NOR and carryover are essential
outcomes for success at PHD. Interviews also indicated that the intricacies within the
financial regulations input and budgeting and execution process essentially boil down to
achievement of these two outcomes. These outcomes link directly to PHD’s strategic
objective, “Operate as a Seamless Organization by Improving Enterprise Collaboration.”
B. ASSESSMENT OF EXISTING PERFORMANCE METRICS AT PHD This section assesses existing performance metrics at PHD and also provides
recommendations for improvement as appropriate. Existing metrics are again organized
by balanced scorecard perspective in an attempt to match the format of the assessment
with that of the analysis. The author’s perceptions of measurement processes at PHD
were gathered from interviews and face-to-face discussions with line managers, as well
as from documentation provided by PHD. Additionally, existing metrics listed in the
following section were selected by the author based on line management emphasis
throughout the research process. This will likely not be an all-inclusive list, but aims to
capture the existing metrics that receive management attention.
The author precedes the assessment within each perspective with a table which
illustrates existing metrics at PHD, the CPV’s they attempt to capture, and suggestions
for improvement. These suggestions are discussed in more detail within the assessments
that follow.

74
1. Learning and Growth Perspective Table 5 illustrates existing metrics at PHD, the CPV’s they attempt to capture,
and suggestions for improvement. Suggestions are discussed in more detail within the
assessments that follow.
CPV Existing Metric Suggestions for Improvement
Human Capital Input Hiring Plan Achievement None
Demographics None
Civilian End Strength None
Retention Rate % None
Full-Time Equivalents Reduced None
Workforce Development Process
DAWIA Certification % None
IDP Accomplishment % None
# of Degrees/Certifications Achieved
None
# of Awards & Recognition None
# of Mentoring/Rotational Participants
None
# of Mandatory Training Hours None
GENESYS Survey For supplemental use only
Junior Professional progression and retention
Task Force Lean Process Time to Achieve Successful Personnel Redeployment
None
Redeployed work hours resulting from Lean events
Realized vs. Estimated cost savings
Lean metrics within SEAR for risk management
Communication and Collaboration Processes
Number of Collaborative Projects Change to actual collaboration vs. benchmark in “standardization plan”
Number of innovations and best business practices resulting from collaboration
Competent Workforce Outcome
Workforce Reshaping Proportion Refine by implementing a more comprehensive benchmark
Table 5. Existing Metrics and Suggestions (Learning and Growth)

75
a. Human Capital Input Based on data collected, an input metric for human capital within the
learning and growth perspective at PHD should be useful. Looking back at the criteria
established in Chapter II, an input metric should be appropriate since the cost of human
capital is high and quality is important. Interview subjects indicated that skill sets,
education, experience, and salary are critical variables within a hiring and attrition plan.
Metrics associated with these variables are likely objective and complete, although
limited in responsiveness due to hiring limitations and retirement uncertainties. Despite
this limited responsiveness, an input metric using a hiring and attrition plan as a
benchmark should provide PHD with insight as to how well they recruit people with the
necessary skills to innovate and meet the challenges of the 21st century.
PHD implements a detailed hiring and attrition plan that includes input
metrics (NSWC PHD 2005). The hiring plan identifies skill set needs and the status of
hiring to meet those requirements. Attrition uncertainty is mitigated outside of this hiring
plan by tracking civilian end strength within each department. Expected retirements,
resignations, transfers, and other sources of attrition are meticulously tracked to ensure
that requirements within the hiring plan are complete. Trend analyses are performed
within demographic categories to ensure that PHD is aware of potential diversity
challenges within the workforce (NSWC PHD 2005). These input metrics are likely as
complete, objective, and responsive as possible for this CPV.
b. Workforce Development Process Based on data collected, a process metric for workforce development
should be useful for PHD. Applying process metric criteria, the author believes that
many workforce development processes can be observed and measured, cost of
measuring is low, and enhancements in the workforce can result in strategic advantage
for PHD.
As illustrated in Table 6, PHD uses multiple process metrics to track the
development of the workforce. An 85 percent Defense Acquisition Workforce
Improvement Act (DAWIA) certification goal is utilized as a workforce standard based
on federal requirements, with realistic training time requirements built in for personnel

76
shifting positions and responsibilities. PHD also uses IDP accomplishment percentage to
ensure personnel are on track in meeting goals they have committed to. A process metric
for the number of degrees and certifications is used to reflect how well the workforce is
achieving higher education. To measure cross-functionality in the workforce, PHD
measures the number of rotational participants across departments. Additionally, a
mandatory training hour metric is utilized to reflect how well the workforce is receiving
required knowledge to perform within their core competencies. (NSWC PHD 2005) In
the author’s opinion, these metrics are objective and responsive for the workforce
development CPV. To be more complete, the author recommends including a process
metric to measure the effectiveness of the JP program. Measuring the progression and
retention of these junior engineers should provide valuable insight into how well PHD
develops new human capital in accordance with their vision for future needs.
Documentation provided to the author indicates that PHD also uses
surveys to measure workforce development. In 2003, NAVSEA contracted GENESYS
Solutions, LLC to conduct an assessment of how well transformation initiatives are
taking root in the organization. The survey is administered to employees within
NAVSEA, including employees at PHD (Palmer 2004). Within this survey are
workforce development metrics that capture employee perspectives on productivity,
specifically addressing continuous improvement and the ability to change (GENESYS
2004). A numerical rating and color code is assigned based on the alignment of answers
with the direction of transformation initiatives (Palmer 2004, GENESYS 2004). From
the author’s perspective, survey results are easy to read and provide a “ballpark feeling”
for how well PHD is doing in workforce development. Trend and comparative analyses
using these surveys can be useful to PHD management to supplement other process
metrics. The surveys are objective in that they use NAVSEA strategy as a benchmark,
and also complete in that data collected are quite comprehensive. However, the metrics
within GENSYS surveys are not very responsive due to the annual nature of the
assessment. The author believes that existing process metrics discussed in the previous
paragraph are more leading in nature, and better sources of timely management
information within the learning and growth perspective.
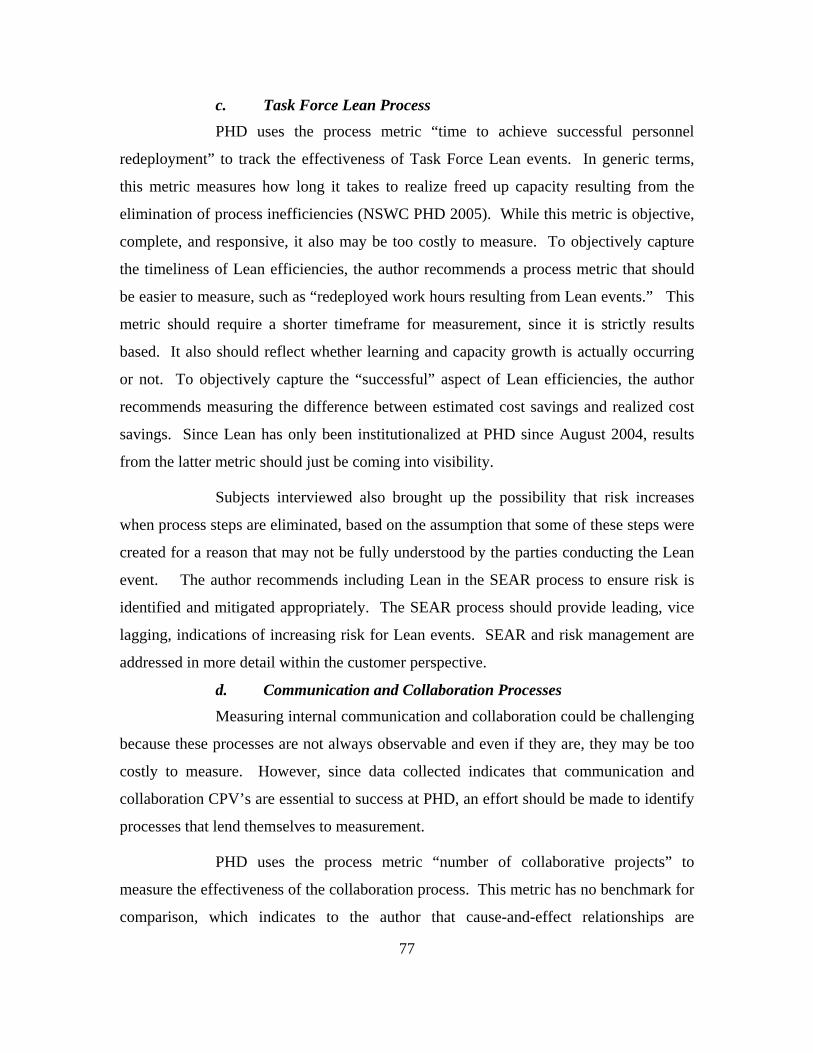
77
c. Task Force Lean Process PHD uses the process metric “time to achieve successful personnel
redeployment” to track the effectiveness of Task Force Lean events. In generic terms,
this metric measures how long it takes to realize freed up capacity resulting from the
elimination of process inefficiencies (NSWC PHD 2005). While this metric is objective,
complete, and responsive, it also may be too costly to measure. To objectively capture
the timeliness of Lean efficiencies, the author recommends a process metric that should
be easier to measure, such as “redeployed work hours resulting from Lean events.” This
metric should require a shorter timeframe for measurement, since it is strictly results
based. It also should reflect whether learning and capacity growth is actually occurring
or not. To objectively capture the “successful” aspect of Lean efficiencies, the author
recommends measuring the difference between estimated cost savings and realized cost
savings. Since Lean has only been institutionalized at PHD since August 2004, results
from the latter metric should just be coming into visibility.
Subjects interviewed also brought up the possibility that risk increases
when process steps are eliminated, based on the assumption that some of these steps were
created for a reason that may not be fully understood by the parties conducting the Lean
event. The author recommends including Lean in the SEAR process to ensure risk is
identified and mitigated appropriately. The SEAR process should provide leading, vice
lagging, indications of increasing risk for Lean events. SEAR and risk management are
addressed in more detail within the customer perspective.
d. Communication and Collaboration Processes Measuring internal communication and collaboration could be challenging
because these processes are not always observable and even if they are, they may be too
costly to measure. However, since data collected indicates that communication and
collaboration CPV’s are essential to success at PHD, an effort should be made to identify
processes that lend themselves to measurement.
PHD uses the process metric “number of collaborative projects” to
measure the effectiveness of the collaboration process. This metric has no benchmark for
comparison, which indicates to the author that cause-and-effect relationships are

78
determined subjectively. To better establish an objective measure, the author
recommends establishing a “standardization plan” as a benchmark. Such a plan could
standardize collaboration requirements and goals, among other things, to focus joint
efforts on cause-and-effect relationships that matter. Based on interviews, the author
believes there is sufficient tacit knowledge within line managers at PHD to identify
internal and external collaboration requirements for standardization. In the author’s
opinion, being able to pinpoint such requirements is what learning and growth are all
about. Instead of subjective relevance assessments, a standardized benchmark would
afford PHD with the ability to measure collaboration objectively. This process metric
would also be more complete and responsive than the existing relevance assessment
methodology. In the author’s opinion, the most challenging aspect of creating a process
metric for collaboration would be the time investment required by line managers to
identify the benchmark discussed here. In the author’s opinion, the investment is
worthwhile if a good process metric for collaboration is the result.
Specifically in terms of external communication and collaboration, the
author also recommends a process metric for “the number of innovations and best
business practices resulting from external collaborative efforts.” This would measure the
effects of formal collaboration with such agencies as industry, government laboratories,
academia, other WC’s, other PAD’s, and so on. This process metric should provide an
objective indication of how well external communication and collaboration creates value
for the PHD enterprise. While this would likely be used as a lagging metric for trend
analysis, it should be as objective, complete, and responsive as possible in terms of
external collaboration.
e. Competent Workforce Outcome In the author’s opinion, an outcome metric should be used to capture
effectiveness within the competent workforce area. This is due to the likelihood that such
a metric should be easy to measure with a benchmark in place, measurement should not
be costly, and process metrics may not provide a complete picture of performance to
management.

PHD utilizes a “workforce reshaping proportion” process metric to
indicate how well the workforce is shaped to meet future challenges. This outcome
metric compares the percentage of the workforce that is composed of engineers and
scientists to the percentage composed of administrative support (NSWC PHD 2005).
While this measure is objective and responsive, the author recommends more fidelity in
the required proportions to improve completeness. Stated differently, the author
recommends a more comprehensive benchmark against which to measure the competent
workforce. This benchmark can be found within PHD’s Human Capital Process,
illustrated in Figure 21 below. From the author’s perspective, the “Understand Future
Work” and “Analyze Workforce/Gap Analysis” components of this process are where the
attributes for a competent workforce should originate from. PHD should be able to
identify the skills required to address future technology development while meeting
NSWC and Navy workload requirements. The “skills assessment” portion of the gap
analysis is the outcome metric, using required skills as the benchmark. The actual
outcome metric could be a percentage “fill-rate” of required skills, or the number and
types of skills that must be hired or acquired to meet skill set needs.
Figure 21. PHD Human Capital Process (NSWC PHD 2005)
2. Internal Business Processes Perspective The internal business process perspective is by far the most complex standpoint as
it encapsulates the core processes of project planning and project execution. Due to the
nature of PHD’s mission, these processes typically extend through the life-cycle of
products and services. Table 6 illustrates existing metrics at PHD, the CPV’s they
attempt to capture, and suggestions for improvement within this perspective.
79

80
CPV Existing Metric Suggestions for Improvement
Requirements Input number of requirements available on web portal vs. identified requirements
Project Planning Process Number of Initiatives Input Refine to “number of initiatives input that result in a fielded service or product”
Percentage project planning compliance using IPT standard as benchmark
Project Execution Process
Earned Value Management System Budget vs. Execution
None
% Objectives executed per Test Event None
% failed test objectives
Contracting Efficiency None
Competitive Sourcing None
Return on Investment None
Percentage existing contracts under favorable CPARS/CSASS evaluations
Communication and Collaboration Processes
Integrated tests executed None
Number of Collaborative Projects Actual collaboration vs. benchmark established in “standardization plan”
Task Force Lean Process Training None
Cost Savings None
Leadership and Oversight Process
Technical Warrant Holder Assessment None
GENESYS Survey For supplemental use only
Standardized Processes Outcome
Number of Standardized Business Processes
None
Environmental standard operating procedures
None
Environmental Training None
Security None
Safety walk-about metrics None
Safety mishaps None
Travel card delinquencies None
Expand standardized compliancy metrics within overhead
Table 6. Existing Metrics and Suggestions(Internal Business Processes)

81
a. Requirements and Regulations Input As discussed in the analysis of internal business processes, multiple
different requirements and regulations feed into the operational processes at PHD. In the
author’s opinion, these inputs should be available in a standardized location to eliminate
time wasted in searching for applicable regulations and requirements. The author
recommends a knowledge management input metric to capture the accessibility and
pervasiveness of these requirements and regulations throughout the PHD workforce. Due
to the importance of safety and quality at PHD, an input metric should be useful. This
metric could be the number of requirements and regulations available on the web portal
in the numerator, with identified requirements and regulations in the denominator.
Due to the large scope of such a metric, the author recommends that
identification of requirements and measurement of compliance be broken down at least to
the department level. While the initial cost of identifying requirements and importing
this data into the web portal may seem prohibitive, a systematic centralization of essential
information should eliminate wasted resources for years to come. This metric would
likely be as objective, complete, and responsive as possible. In the author’s opinion,
internal business requirements benchmarks should fit nicely into the standardization plan
recommended within the learning and growth perspective.
b. Project Planning Process The author assessed that PHD has one existing metric tied specifically to
the project planning process within the internal business processes perspective. The
“number of initiatives input” metric measures how well the organization is proactively
planning compared to expectations and past performance. This metric is probably not
complete because it does not measure the effectiveness of the initiatives. To implement a
more complete metric, the author recommends revising this to “number of initiatives
input that result in a fielded service or product.” The same trend and comparative
analyses can be conducted using this metric, as well as a measure of results versus goals.
Analysis of the project planning CPV indicated that PHD should excel at
planning reliability, maintainability, availability, and supportability attributes into
projects. A useful process metric for integration in project planning could be percentage

82
project planning compliance, using a defined integrated process team (IPT) standard as a
benchmark. Such a metric should provide management with an awareness of how much
tacit knowledge within the organization is being applied to a given project. Applying an
IPT standard should also directly support the standardized processes outcome.
The author also recommends incorporation of a process metric for
integration of stakeholders in the planning process. As suggested in the analysis section,
a useful metric could be percentage project planning compliance, using an IPT as a
benchmark.
c. Project Execution Process Interviews indicated that departments at PHD utilize EVMS to track the
progression of cost, performance, and schedule within contractor management systems.
The American National Standards Institute and DOD both require use of this tool,
validating the process metrics it produces (DOD 2003).
In terms of test and evaluation project execution, PHD utilizes “percentage
test objectives executed per test event” to measure both efficiency and effectiveness. The
author feels this metric is objective, complete, and responsive in terms of executing to a
test plan. A useful process metric that could feed back into the planning process could be
the “percentage test objectives that failed within the test plan.” A trend analysis of this
metric could indicate to management how well test plans are generated in the planning
process.
PHD also utilizes a “Return on Investment” (ROI) metric to capture an
equivalent monetary value created by projects and initiatives. PHD utilizes the Jack
Phillips (Phillips 2005) methodology, where ROI is calculated as illustrated in Figure 22.
While this is a true ROI measure with revenue in the numerator and cost in the
denominator, the cost of equating a monetary value to a project or initiative could be
prohibitive. The author was also made aware that an “NSWC Investment Board” is
standardizing the methodology for ROI measurements across all six divisions (NSWC
PHD 2005). In the interim, the author recommends that PHD continue to apply ROI
measurements if equating projects and initiatives to a monetary value is not too costly. In
terms of ROI, this should be as objective, complete, and responsive as possible.

Monetary valueof project Cost of projectCost of project
−
Figure 22. ROI Methodology (Phillips 2005, NSWC PHD 2005)
d. Contracting Process PHD utilizes process metrics to measure how well they are performing in
terms of competitive sourcing. One metric utilized measures how many cases have been
reviewed in the fiscal year, which provides a trend analysis over time to indicate the level
of effort required to stay abreast of contracting requirements (NSWC PHD 2005).
Another metric is cost savings resulting from competitive sourcing practices (NSWC
PHD 2005). In terms of competitive sourcing, the author believes these process metrics
are objective, complete, and responsive.
In terms of contracting efficiency, PHD also utilizes a process metric to
measure the average days it takes to award contracts (NSWC PHD 2005). While this is a
good efficiency metric, the author recommends incorporating additional process metrics
that measures effectiveness. There are two systems within NAVSEA that can assist PHD
in achieving this. The Contractor Performance Assessment Rating System (CPARS) is a
web tool that provides an automated library of contractor performance evaluations on
systems and non-systems contracts (NAVSEA 2005). The Construction Contractor
Appraisal Support System (CCASS) is another web tool that provides an automated
library of construction contract performance (NAVSEA 2005). A useful metric for
contract effectiveness could be the percentage of existing contracts that are under
contractors with favorable CPARS or CCASS evaluations.
e. Leadership and Oversight, Communication, and Collaboration Processes
PHD performs “technical warrant holder assessments” to ensure they are
exercising due diligence in their responsibilities under delegated technical authority
(NSWC PHD 2005). This leadership and oversight process metric measures percentage
completion of assessment to ensure required oversight is on track. This metric is
objective, complete, and responsive for this specific area of leadership and oversight.
The author recommends that PHD further include process metrics to measure systematic
83

84
interfacing between line managers and subordinates. One such metric could be the
number of corrective actions required by line managers with regard to subordinates. This
metric, while potentially sensitive, could reveal where oversight is most necessary, while
also encouraging subordinates to do work right the first time.
To measure the communication and collaboration processes, PHD again
uses a relevance assessment of the “number of collaborative projects.” As discussed
within the learning and growth perspective, the author feels this is a subjective measure.
The author recommends a standardization plan to provide a benchmark against which
communication and collaboration efforts can be objectively measured. This would likely
be as complete and responsive as possible.
The GENESYS survey provides a wealth of annual metrics with the
leadership and oversight, communication, and collaboration processes. As stated earlier,
the author feels this is good supplemental information, but not timely enough to gauge
the dynamic nature of these processes. The author recommends use of these data only as
a supplement to the metrics discussed above.
In the test and evaluation arena, PHD utilizes a “number of integrated tests
executed” process metric to measure the extent of communication and collaboration.
This is analyzed in a trend analysis, under a results versus goals framework. The author
feels this metric is objective, complete, and responsive for collaborative test and
evaluation.
f. Task Force Lean Process Among the metrics utilized within the Lean program, interviews
emphasized cost savings as the most important to line managers. Training of personnel
ranked second. The author views outcome metrics tied to these as objective, complete,
and responsive from the internal business process perspective. For Lean to be pervasive
at PHD, personnel must be trained. For the program to be effective, cost savings must be
realized. These two critical components of Lean are captured in the process metrics
utilized.

85
g. Standardized Processes Outcome PHD lists the number one metric in this area as the “number of
standardized business processes,” analyzed as results versus goals (NSWC PHD 2005).
The author agrees with this emphasis, and recommends further objectivity by establishing
the recommended standardization plan.
Many compliancy-focused outcome metrics are also utilized at PHD
within the standardized processes outcome. Each of the departments reports on
environmental, safety, and security status in the standardized metrics listed in Table 7
(NSWC PHD 2005). The author recommends expanding this list of standardized metrics
to other overhead components tracked by the corporate business office. This would
ensure that outcome metrics are not only objective and responsive, but also complete.
3. Customer Perspective The customer perspective is centered on fleet combat readiness, customer
satisfaction, and cost, schedule, performance outcomes. Table 7 illustrates existing
metrics at PHD, the CPV’s they attempt to capture, and suggestions for improvement
within this perspective. Suggestions are discussed in more detail within the assessments
that follow.
a. Requirements Input During interviews, line managers frequently emphasized the importance of
understanding current requirements. As discussed in the analysis section, awareness of
requirements, or customer needs, is an area that should be within the span of control at
PHD. Following Chapter II criteria, an input metric should be useful to PHD since safety
and quality are important from the customer perspective. The author recommends an
input metric for capturing how well PHD receives feedback and requirements from
different stakeholders (e.g., test and evaluation, acquisition, contracting, procurement,
overhead). For ease of measurement, the author recommends using this metric for a trend
analysis of the quantity of information received from different customers, indicating how
well PHD is staying abreast of current issues.

CPV Existing Metric Suggestions for Improvement
Requirements Input Quantity of feedback and requirements received from stakeholders
Fleet Combat Readiness Outcome
Cost, Schedule, Performance Outcome
Project Planning Process Project Execution Process
Probability of Capability
(1 – probability of mission failure without equipment reliability failure, computer reliability failure, or human error)
None
Probability of Personnel Capability (1 – probability of mission failure due to human factors)
None
Reliability (Mean Time Between Failures)
None
Maintainability (Mean Time to Repair)
None
Supportability (Mean Logistics Delay Time/ Mean Logistics Time, Time to Assign Support, Time to Close Issue, Support avenues, Distance Support cost avoidance)
Include average time to assign support, average time to close issue, and Distance Support cost avoidance within SEAR
Percentage avenues utilized for support
Average cycle time between deploying engineers and gaining them back within departments
Affordability (PHD program costs,
cost, cost) pP oA
None
Safety (mishap risk assessment values)
None
Fleet Combat Readiness Outcome
Operational Availability
Uptime/(Uptime+Downtime)
Incorporate NAVICP “mean time between demand” into reliability metrics
Customer Satisfaction Outcome
Operational Availability None
Customer surveys
- Task Environment Survey
- GENESYS
For supplemental use only
Table 7. Existing Metrics and Suggestions (Customer Perspective)
86

b. Project Planning and Project Execution Processes Interviews and documentation indicate that PHD uses process metrics
within periodic SEAR reviews to ensure products and services support the fleet combat
readiness, customer satisfaction, and cost, schedule, performance outcomes (NSWC PHD
2003, 2005). In terms of safety, PHD uses “mishap risk assessment values” to identify
safety risks within individual and integrated equipments, systems, or platforms (NSWC
PHD 2003). Figure 23 illustrates the categories of risk for PHD. If a red or yellow risk is
identified, an execution plan is required to identify the risk to personnel or equipment,
steps taken to reduce risks, and a specific timeframe for risk mitigation (NSWC PHD
2003). In the author’s opinion, the systematic review of safety within the SEAR is
objective, complete, and responsive.
SEVERITY CATASTROPHIC CRITICAL MARGINAL NEGLIGIBLE
PROBABILITY
FREQUENT 1 3 7 13 PROBABLE 2 5 9 16 OCCASIONAL 4 6 11 18 REMOTE 8 10 14 19 IMPROBABLE 12 15 17 20
Mishap Risk Assessment
Value Mishap Risk Category
1 – 5 High (Red) 6 – 9 Serious (Red)
10 – 17 Medium (Yellow) 18 – 20 Low (Green)
Figure 23. PHD Risk Assessment Framework (NSWC PHD 2003)
Effectiveness, or performance, is captured within the SEAR using a
variety of process metrics. The Capability of Performance ( ) metric is defined as the
capability to perform a given mission. is an empirical wrap-up of many sub-
probabilities, including such probabilities as radar detection, weapon system engagement,
homing, missile guidance, or warhead damaging or killing the target (NSWC PHD 2003).
is also applied to non-weapons systems, such as the underway replenishment system
developed by PHD to transfer cargo, ammunition, and fuel between ships at sea (NSWC
cP
cP
cP
87

88
PHD 2003). This metric is used in a comparative framework with requirement and
performance documents that state design and operating parameters necessary to achieve
specific missions (NSWC PHD 2003). As such, is objective and responsive within
the project planning and execution processes. This process metric provides the customer
with readiness and assurance that performance requirements are met. However, does
not provide a complete picture of performance. To better establish completeness, other
process metrics are necessary to account for human factor failures, reliability,
maintainability, and supportability.
cP
cP
Since does not take human factor failures into account, PHD utilizes the
metric to capture these factors. is the probability of humans performing all of the
necessary steps on time to properly set up and operate one or more systems and complete
the mission (NSWC PHD 2003). Quantitative data for manning levels, the breakdown of
a sailor’s workday, and scheduled and unscheduled maintenance are used in conjunction
with more subjective experiential data to approximate . These data are collected
primarily from fleet training authorities and PHD interaction with the fleet during
Combined Combat System Qualification Trials (CSSQT) and Combat Systems
Assessments (CSA) (NSWC PHD 2003, 2005). CSSQT’s and CSA’s provide PHD
engineers and scientists with a hands-on opportunity to observe how systems and sailors
interface in an operational environment (NSWC PHD 2005). In the author’s opinion,
data collected and analysis performed to approximate are as objective, complete, and
responsive as possible.
cP
pP pP
pP
pP
Interviews indicated that reliability, maintainability, and supportability
factors should be incorporated into project planning to ensure PHD builds in attributes
that support the highest achievable performance standards during project execution
(NSWC PHD 2005). In the author’s opinion, PHD systematically utilizes process metrics
within the SEAR to capture the drivers behind reliability and maintainability. The top
driver for reliability is mean time between failures (MTBF), which is identified and
tracked within the SEAR. Also identified and tracked is the mean time to repair
(MTTR), which provides an indication of maintainability by measuring the average

corrective maintenance time required to correct a failure. In the author’s opinion, these
process metrics are objective, complete, and responsive within both the project planning
and execution processes.
In terms of supportability within the SEAR, PHD uses mean logistics
delay time (MLDT) metrics to measure how long the fleet waits to receive demand parts
(NSWC PHD 2003). While this is an objective and responsive metric, the author feels
other process metrics incorporated into the SEAR are necessary for completeness. Such
metrics are already in existence at PHD, but are not incorporated in the SEAR. The
author recommends inclusion of “average time to assign support,” “average time to close
issue,” and “Distance Support cost avoidance” metrics. Additionally, a trend analysis of
“percentage avenues utilized for support” (e.g., phone, e-mail, naval message, assist visit)
should provide a different, more complete view of supportability within the SEAR
(NSWC PHD 2005). The author further recommends a process metric for the average
cycle time between deploying engineers for assist visits and receiving them back within
departments. This should provide PHD with a productivity measure for the cost of face-
to-face supportability.
oA , or operational availability, is a metric that indicates how often a
system is available to the user when called upon. As a process metric, is a target that
must be designed to and executed in order to support fleet requirements. As an outcome
metric, is an indicator of actual readiness in the fleet. is defined as follows:
oA
oA oA
oMTBM uptimeA
MTBM MDT uptime downtime= =
+ +(Blanchard 1991)
The reliability, maintainability, and supportability process metrics utilized
by PHD directly feed into . MTBF, the primary driver of reliability, is the
unscheduled portion of mean time between maintenance (MTBM) (Blanchard 1991).
MTTR and MLDT are components of mean downtime (MDT) (NSWC PHD 2003). In
the author’s opinion, the SEAR program does an outstanding job of tracking key metrics
that indicate how well systems should perform, and the impact on fleet combat readiness.
oA
89

PHD defines affordability as the relationship of safe and effective metrics
to cost. Since PHD is an agent for the program sponsor and an advocate for the fleet,
they are in a unique position to collect and analyze metrics, perspectives, and initiatives
for both customers (NSWC PHD 2003). PHD measures PHD program costs, cost,
cost, and cost avoidance and savings initiatives to provide a complete customer
perspective of affordability (NSWC PHD 2003). In the author’s opinion, these metrics
are objective, complete, and responsive for cost from the customer’s perspective.
pP
oA
In the author’s opinion, the metrics existing within the SEAR coupled with
recommended supportability metrics should provide customers with a clear window into
the project planning and project execution processes at PHD. These metrics should be
presentable in whatever venue is chosen, whether it be a program review, supportability
review, or fleet readiness review. In the author’s opinion, the only danger is erroneous
data input into these metrics, which should be mitigated through frequent reviews and
timely communication with stakeholders.
c. Communication and Collaboration Processes As stated in the analysis, the author believes communication between
PHD and project stakeholders is essential. For external projects with program sponsors
and the fleet, the author recommends a process metric to capture the cycle time from
receipt of stakeholder feedback in the planning process to communication through the
chain of command. For internal projects, the author recommends a process metric to
capture the cycle time from identification of internal projects to communication of
direction and intent to employee stakeholders.
d. Fleet Combat Readiness Outcome Improved Combat Systems Readiness is an overarching strategic objective
for PHD (NSWC PHD 2005). For customers, outcome metrics for , reliability,
maintainability, and supportability should provide an indication of how well PHD creates
value. Interviews indicated that PHD tracks these metrics very closely to ensure that they
are indeed creating value. In the author’s opinion, the challenge at the outcome stage is
the latency of data inputs for these metrics. Interviews indicated that it takes about nine
months worth of data collection to yield reliable statistics at Corona Division (NSWC
oA
90

91
PHD 2005). PHD collaborates with Corona to gain visibility into data at the earliest
possible point, but there may be methods to supplement these data in a more timely
fashion. In terms of part support, it is the author’s experience that the fleet will often
request parts needed without transmitting an official Casualty Report (CASREP). A
more timely outcome measure could be the “mean time between demand” for parts that
NAVICP tracks. In general terms, the author recommends using sources closer to the
fleet to gain more timely insight into fleet readiness data.
e. Customer Satisfaction and Cost, Schedule, Performance Outcomes
PHD utilizes surveys to determine how satisfied customers are with the
value that PHD creates. The Task Environment Survey (TES) was conducted four times
since 1991 on primary end-users of PHD products and services to determine the customer
level of satisfaction (NSWC PHD 2005). NAVSEA is moving away from TES towards a
new corporate survey approach that will impact the fleet less (NSWC PHD 2005). The
GENESYS survey, conducted on an annual basis, provides an internally-focused,
NAVSEA customer perspective on the level of satisfaction. These surveys, although
useful, are likely limited due to aggregated data and infrequent observations that make
findings challenging to respond to.
In the author’s opinion, PHD should use the project planning and
execution metrics mentioned in the previous section to discern customer satisfaction.
The only difference should be a focus on actual results versus requirements, rather than
expected results versus requirements. While this may seem fairly obvious, the process
and outcome metrics are likely two distinct perspectives that the customer has when
considering the value of PHD.
4. FINANCIAL PERSPECTIVE Table 8 illustrates existing metrics at PHD, the CPV’s they attempt to capture,
and suggestions for improvement within this perspective. Suggestions are discussed in
more detail within the assessments that follow.

92
CPV Existing Metric Suggestions for Improvement
Budgeting and Execution Process
Business Base/ Reimbursable/Direct Cite Funding
None
NOR/Carryover None
Direct Hours None
Overhead Hours None
Attrition None
Civilian/Military End Strength
None
Civilian/Military Productive Workyear
None
Productivity Ratio None
Overhead Cost None
Military Labor Cost None
Overhead Training Hours
None
Direct Training Hours None
Overhead as Percentage of Total Cost by NSWC Division
None
None
Task Force Lean Process Cost Savings None Table 8. Existing Metrics and Suggestions (Financial Perspective)
a. Financial Regulations Input As discussed in the analysis, the changing nature and lack of control over
budget constraints do not lend themselves to easy and accurate measurement. Although
financial regulations establish the boundaries within which PHD can operate, the cost of
measuring an input metric would likely outweigh the benefit received. The author does
not recommend implementing a financial regulations input metric.
b. Budgeting and Execution Process In the author’s opinion, PHD has the necessary financial process metrics
in place to ensure success within comptroller functions and NWCF constraints. PHD has
existing process metrics in place for reimbursable funding, direct citation funding, NOR
progress, carryover progress, and the major categories of overhead. Based on interviews
with line managers, it is clear to the author that these metrics are pervasive throughout the
organization, and tracked with great frequency and accuracy. These metrics are lagging

93
as they provide a snapshot of events that have already occurred, but are also leading as
they provide information on the likelihood of meeting future financial goals.
Additionally, there is a balance of financial and non-financial metrics, as overhead
components such as productive workyears, end strength, attrition, productivity, and
training hours are measured. These process metrics are assessed as objective, complete,
and responsive for the comptroller office.
As discussed in Chapter IV, the office of corporate business deals with
overhead. Interviews indicated that this office uses the existing metrics in Table 6 in a
fashion similar to the comptroller. However, the author believes they should have more
detailed metrics to capture effectiveness within each of the overhead activities they
supervise within PHD. Interviews indicated that this is especially challenging for
corporate business due to a lack of benchmarks in areas such as information technology,
facilities maintenance, training hours, or utilities. The author recommends a knowledge
management metric to assist the budgeting and execution process within the office of
corporate business. This process metric could be the number of benchmarks identified in
the numerator, and the number of overhead activities in the denominator. This metric
should be easy to measure with a low associated cost. This metric should support the
criticality of standardization within corporate business, and set them on the right track to
improving effectiveness and efficiency. While objective and responsive, this measure is
not complete as it does not directly support the lack of visibility in detailed overhead
activities. This process metric should establish a foundation on which to build detailed
visibility through more accurate overhead metrics.
c. Communication and Collaboration Processes In the author’s opinion, a process metric for collaboration under the
financial perspective would likely provide little useful information to management.
Interviews indicated that the financial community within the NSWC enterprise
communicates and collaborates very frequently with good results. The author believes
establishing standardized collaboration requirements within the financial perspective

94
would be too difficult because the budgeting environment appears very dynamic. The
cost of measuring and difficulty in observing cause-and-effect relationships discourages
utilization of a process metric.
d. Meet NOR and Carryover Goals Outcome Due to the dynamic nature of the processes that determine this outcome, it
is likely more useful to measure NOR and carryover through the components of the
budgeting and execution process. An outcome metric would be lagging in nature while
the process metric provides both lagging and leading indications from the financial
perspective.

VI. ALIGNMENT OF PHD WITH FEDERAL GUIDANCE
The intent of the following chapter is to assess PHD performance measurement in
a comparative framework with the federal guidance discussed in Chapter III. The
approach used in this assessment is a one-on-one comparison between PHD and agencies
in the chain of command. The assessment begins with NSWC Headquarters, and
progresses upward through the President’s Management Agenda (PMA).
To help ensure this comparison is objective, the author selected the strategic
objectives or key elements of performance measurement within each agency and assesses
PHD’s performance within that context. The intent is to highlight the overarching themes
and assess how well PHD aligns within those themes.
A. NSWC HEADQUARTERS The March 2005 NSWC Concept of Operations (CONOPS) document details
strategic objectives for NSWC. Figure 24 illustrates the linkage between these objectives
and the strategic objectives of PHD.
95
Operate as Single Cost-
Effective Enterprise
Improve Warfighting
Effectiveness
Right Work at the Right
Place
Manage Technical
Risk
People, Process, Facility, and
Systems Transformation to SP21 and JV2020
Figure 24. Alignment of PHD and NSWC Strategic Objectives
Enterprise Collaboration
Human Capital Strategy
New Technology
and Innovation
Improve Combat Systems
Readiness
NSWC
Right Work at the Right
Cost PHD

96
In the author’s opinion, PHD is aligned very well with the strategic objectives of
NSWC. In terms of operating as a single cost-effective enterprise, PHD’s “enterprise
collaboration” objective is strikingly similar. Analysis and assessment reveals that PHD
places great emphasis on the collaboration process CPV. This collaboration is dependent
on human capital elements, as illustrated with the link to the human capital strategic
objective above. Within this objective, NSWC also desires that divisions have a metrics-
driven, ROI-focused approach within the single cost-effective enterprise objective
(NSWC 2005). From data collected it is clear to the author that PHD uses metrics
routinely, while striving for constant improvement. Additionally, PHD uses an ROI-
focused approach within the internal business processes perspective as detailed earlier in
Chapter V.
NSWC’s “improve warfighting effectiveness” strategic objective and PHD’s
“improve combat systems readiness” strategic objective are also strikingly similar.
PHD’s rigorous SEAR program incorporates objective, complete, and responsive
measures for effectiveness. Line managers indicated that improving readiness is their
primary goal within the customer perspective.
In the author’s opinion, PHD directly supports the “right work at the right place”
objective for NSWC. The only difference between this objective and PHD’s “right work
at the right cost” objective is the fact that NSWC has the span of control to decide which
division is most appropriate for accomplishment of work, while PHD only has the ability
to decide what department or contractor will perform the work. Other than this
difference, the author sees the objectives as virtually identical. PHD’s “enterprise
collaboration” objective also supports NSWC by ensuring visibility into options and
trade-offs through open communication and collaboration. This communication and
collaboration emphasis is firmly established within the analysis and assessment of PHD
CPV’s.
As indicated by technical warrant holder assessments, focus on execution of due
diligence, and oversight of technical authority, PHD also aligns with NSWC’s “manage
technical risk” objective. The link to human capital strategy stems from the workforce

development process at PHD that ensures a competent workforce safeguards technical
authority. The link to technology and innovation stems from SEAR risk management
embedded in PHD projects.
Lastly, PHD is also aligned with NSWC’s objective for Sea Power 21 and Joint
Vision 2020 transformation. Interviews indicated that in-service engineering initiatives
and technical development within the project planning and execution processes are
conducted in step with the vision of Navy leadership. PHD’s human capital strategy also
provides a detailed shaping plan for the workforce to meet future challenges, further
supporting this objective.
B. NAVSEA The NAVSEA guidance for 2005 details strategic objectives for the organization.
Figure 25 illustrates the linkage between these objectives and the strategic objectives of
PHD.
97
Figure 25. Alignment of PHD and NAVSEA Strategic Objectives
As evidenced in the analysis and assessment sections of this chapter, PHD
emphasizes affordability and cost savings in many process and outcome CPV’s. Task
Force Lean, EVMS, the SEAR program, and competitive sourcing are examples of this.
From this it is the author’s opinion that PHD is aligned with NAVSEA in “capture cost
NAVSEA
PHD
Virtual SYSCOM
Human Capital Strategy
Enterprise Collaboration
Human Capital Strategy
New Technology
and Innovation
Improve Combat Systems
Readiness
Right Work at the Right
Cost
Task Force Lean
Capture Cost Reduction
Improve & Measure
Productivity

98
reduction” and “Task Force Lean” objectives. This linkage is illustrated above in PHD’s
“…right work at the right cost” objective.
The second objective concerns the Virtual SYSCOM. A brief description of the
Virtual SYSCOM follows. The Virtual SYSCOM is a partnership among NAVSEA,
NAVAIR, Space and Naval Warfare Systems Command, Naval Supply Systems
Command, and Naval Facilities Engineering Command. This partnership works to
transform business processes and enhance the delivery of products and services at
reduced costs. Significant goals include increasing productivity, accelerating the process
of innovation, collaborating across functional communities, and shaping human capital
strategy. (Virtual SYSCOM 2005) These goals are recurring themes within process
CPV’s discussed in the analysis and assessment section. PHD aligns with the Virtual
SYSCOM objective through “enterprise collaboration,” “…right work at the right cost,”
and “new technology and innovation” objectives.
In the author’s opinion, PHD is not as well aligned in terms of measuring and
increasing productivity. This is not to say that PHD is lacking in productivity, but rather
that a limited number of existing productivity measures are in use at PHD. This is an
area that is receiving increased management attention due to the Virtual SYSCOM focus
(NSWC PHD 2005). However, to achieve alignment with the “measure and improve
productivity” objective additional work needs to be accomplished.
Lastly, the author believes that PHD is well aligned in terms of human capital
strategy. PHD and NAVSEA have the common vision of structuring and shaping a
workforce that is responsive to the needs of the Navy and Marine Corps warfighter
(NAVSEA 2005, NSWC PHD 2005). Evidence of this is found in the detailed hiring and
attrition plan at PHD, human capital metrics, and line management emphasis on the
criticality of new hiring decisions.
C. CNO The CNO guidance for 2006 details strategic objectives for the Navy. Figure 26
illustrates linkage of these objectives to the strategic objectives of PHD.

99
Human Capital
Strategy
Effects-Based Thinking
GWOT and Current
Readiness
Build Fleet of the Future
Leaders of Change and Innovation
Joint Contribution
and Collaboration
CNO
PHD Human Capital Strategy
Right Work at the Right
Cost
New Technology
and Innovation
Enterprise Collaboration
Improve Combat Systems
Readiness
Figure 26. Alignment of PHD and CNO Strategic Objectives
In terms of human capital strategy the CNO is forward-looking, stating as his
objective to “determine and deliver on the Navy’s future force structure requirements
(CNO 2005).” PHD is aligned with this human capital strategy, as evidenced by line
manager emphasis on identifying emerging technologies and matching hiring decisions to
those technologies. Within human capital strategy, the CNO also desires that technical
authority be assessed and improved (CNO 2005). PHD’s focus on due diligence,
technical authority oversight, and technical warrant holder assessments are further
evidence of alignment with this objective.
In terms of effects-based thinking, the author believes PHD is very well aligned.
The CNO desires that executive management be institutionalized in effects-based
thinking (CNO 2005). It is clear to the author that line management is well-versed in this
mentality. Line managers place significant emphasis on outcomes, and process CPV’s
that determine outcomes over the life-cycle of products and services. Furthermore,
PHD’s strategic objectives “improve the efficiency, delivery and quality of our
products…right work at the right cost” and “improve combat systems readiness” directly
support an effects-based mentality in the author’s opinion.
The CNO’s objective to support the Global War on Terrorism (GWOT) and
current readiness is well aligned with PHD’s objective of improving combat systems
readiness. This is PHD’s primary customer-focused outcome. Additionally, the CNO’s

objective to build the fleet of the future and be leaders of change and innovation is
aligned with PHD’s “embrace new technology and develop a culture of innovation”
objective. The underlying CPV’s discussed in the learning and growth perspective
indicate that line managers embrace change and consistently work toward achieving these
outcomes.
In terms of joint force contribution and collaboration, the author feels that PHD is
somewhat limited do to a primarily Navy focus. However, it is clear to the author from
data collected that internal and external collaboration is embedded in PHD and continues
to grow. In the author’s opinion, this meets the intent of the CNO’s vision to contribute
and collaborate as much as possible.
D. SECNAV AND FMB Figure 27 illustrates the Secretary’s strategic enablers for military effectiveness.
A discussion of PHD’s alignment with these enablers and performance measurement
within FMB follows.
SECNAV
PHD
People Combat Capability
Technology Insertion
Improved Business Practices
Right Work at the Right
Cost
Enterprise Collaboration
Human Capital Strategy
New Technology
and Innovation
Improve Combat Systems
Readiness
Figure 27. Alignment of PHD and SECNAV Strategic Enablers
As illustrated above, it is clear that the strategic objectives at PHD are linked to
the strategic enablers of the Secretary. In terms of people, the Secretary’s primary goals
are to shape the 21st century workforce, improve training and development, and
streamline and align manpower (FMB 2005). From the data collected, it is clear to the
author that each of these goals is supported within PHD’s human capital strategy. Data
100

101
collected indicate that the human capital input, workforce development process, and
competent workforce outcome CPV’s capture the goals within this objective.
In terms of combat capability, the Secretary’s primary goals are executing
GWOT, executing the fleet response plan, and maintaining forward seabasing (FMB
2005). These goals indicate a focus on current readiness to the author. As demonstrated
in the analysis and assessment sections, line managers emphasize many components of
current readiness in the project execution process, which leads to the fleet combat
readiness outcome. In the author’s opinion, PHD is in alignment with this enabler.
The Secretary’s primary goals for technology insertion are accelerated investment
to recapitalize, an emphasis on system survivability, and a robust and balanced R&D
effort. Data collected indicate that PHD focuses on system survivability from the
beginning of the project planning process. The analysis and assessment indicated that
PHD conducts R&D within a balanced framework. While these indicate sound alignment
with the Secretary’s enabler, the author does not have data indicating alignment with
accelerated investment for recapitalization.
Specific goals within the improved business practices enabler are improved
productivity, supporting the BRAC process, and achievement of facility support goals.
As stated in the assessment of alignment with NAVSEA, the author does not believe
PHD is well aligned with measuring improved productivity due to limited productivity
metrics in place. However, the institutionalization of the Lean CPV throughout PHD
should eventually yield such productivity metrics. In the author’s opinion, PHD falls too
far down in the chain of command to align with the “supporting the BRAC process” and
“achievement of facility support” goals. However, in general terms data collected
indicate that PHD is very much aligned with improved business practices. Two powerful
examples are the distance support and SEAR programs, which directly result in both fleet
combat readiness and cost savings.
As discussed in Chapter III, DOD’s balanced scorecard aligns strategy, goals,
objectives, and related performance metrics within the Risk Management Framework
established in the QDR and MID 901. Within the Navy, Major Commands derive their

102
own specific balanced scorecards within this Risk Management Framework, and align
their vision, goals, objectives, and metrics with balanced scorecard perspectives
(Carpenter 2005). It is clear to the author that PHD strategically plans and measures
performance in accordance with this Navy practice. In April 2005, PHD conducted a
“Vision, Mission, Strategy” session that identified each of the components of the
planning and measurement process. While a balanced scorecard was not implemented
for the command, the assessment of existing metrics indicates that balanced measurement
is in effect at PHD. Data collected also indicates that PHD links metrics to their strategic
objectives. This indicates alignment with the basic performance measurement practices
within the Navy.
In the author’s opinion, FMB is focused primarily on budget and performance
integration in the area of performance measurement. Evidence of this is found in the FY
2006/2007 Department of the Navy Budget, where matching of resources with metrics is
highlighted on numerous occasions (FMB 2005). This should be no surprise as great
emphasis is placed on this area within the GPRA, PMA, and PART evaluation. In the
opinion of the author, PHD does an excellent job of matching budget and performance
data. As discussed within the financial perspective at PHD, both financial and non-
financial measures are used to meticulously track execution of the funded workload.
These metrics can be broken down by department or further by project. In the opinion of
the author, the precision of this performance measurement process in terms of budget and
performance integration is optimal. Coupling financial metrics with process and outcome
metrics in other perspectives could provide even more fidelity. The author assesses
PHD’s alignment with Navy and FMB performance measurement practices as effective.
E. DOD As discussed in Chapter III, DOD narrows the performance measurement focus
down to four or five leading outcomes within each risk area in the Risk Management
Framework. These outcomes must be tied to strategy, quantifiable, measurable over
time, relevant to establish an objective level of performance, and tied to specific
measures in line organizations to drive behavior (DOD 2005). In terms of this general
performance measurement approach by DOD, the author believes that PHD is well

103
aligned. Data collected indicate that the predominance of metrics at PHD are objective,
complete, and responsive. Furthermore, each existing input, process, or outcome metric
is quantifiable and measurable over time. Alignment of PHD with DOD’s focus on
PART and PMA improvements is revealed in the following two sections.
F. OFFICE OF MANAGEMENT AND BUDGET As discussed in Chapter III, OMB established PPA’s and the PART evaluation to
aggressively inquire whether GPRA standards are met within the program, placing
emphasis on outcome, output, and efficiency measures. While PHD is not at the program
level and will not receive an actual PART evaluation, the criteria within the PART is
nonetheless applicable to PHD. Funding for work at PHD originates primarily from
customers at the program level, so adherence to PART criteria should only reinforce the
alignment of those program sponsors to PART evaluations and PPA’s that will occur
sometime in the near future.
The following assessment is broken down into the four aspects of program
performance within the PART. A figure listing PART questions within each aspect
precedes the author’s assessment of PHD alignment with PART intent. The author’s
assessment is based on data collected from documents, interviews, and discussions during
the course of research.
PROGRAM PURPOSE AND DESIGN
Question 1.1: Is the program purpose clear?
Question 1.2: Does the program address a specific and existing problem, interest, or need?
Question 1.3: Is the program designed so that it is not redundant or duplicative of any other Federal, State, local or private effort?
Question 1.4: Is the program design free of major flaws that would limit the program’s effectiveness or efficiency?
Question 1.5: Is the program design effectively targeted so that resources will address the program’s purpose directly and will reach intended beneficiaries?
Figure 28. PART Program Purpose and Design Questions

104
1. Program Purpose and Design In the author’s opinion, PHD meets the intent of the program purpose and design
section within the PART. Data collected demonstrate that PHD clearly articulates the
mission, vision, values, and strategic objectives for the organization. Documentation
revealed that this direction is communicated command-wide immediately upon agreeing
on such direction (NSWC PHD 2005).
PHD addresses the specific and existing need to integrate, test, evaluate, and
provide life cycle engineering and logistics for surface warfare systems (NSWC PHD
2005). No other division within NSWC, or in the Navy for that matter, has the in-service
engineering responsibilities or technical warrants for surface warfare systems that PHD
holds. Divisions within NSWC do not compete with one another for work, as they all
serve a specific purpose for the Navy (NSWC PHD 2005).
Lastly, data collected indicate that PHD regularly meets strategic objectives and
performance goals (NSWC PHD 2005). Results from process and outcome metrics
indicate that intended beneficiaries (fleet and program sponsors) are receiving the quality
of products and level of services expected (NSWC PHD 2005). In the author’s opinion
there is no strong evidence that another approach or mechanism would be more efficient
or effective to achieve the intended purpose of appropriations for PHD.
STRATEGIC PLANNING Question 2.1: Does the program have a limited number of specific long-term performance measures that focus on outcomes and meaningfully reflect the purpose of the program? Question 2.2: Does the program have ambitious targets and timeframes for its long-term measures? Question 2.3: Does the program have a limited number of specific annual performance measures that can demonstrate progress toward achieving the program’s long-term goals? Question 2.4: Does the program have baselines and ambitious targets for its annual measures?

105
Question 2.5: Do all partners (including grantees, sub-grantees, contractors, cost-sharing partners, and other government partners) commit to and work toward the annual and/or long-term goals of the program? Question 2.6: Are independent evaluations of sufficient scope and quality conducted on a regular basis or as needed to support program improvements and evaluate effectiveness and relevance to the problem, interest, or need?
Question 2.7: Are Budget requests explicitly tied to accomplishment of the
annual and long-term performance goals, and are the resource needs presented in a complete and transparent manner in the program’s budget?
Question 2.8: Has the program taken meaningful steps to correct its strategic
planning deficiencies?
Figure 29. PART Strategic Planning Questions
2. Strategic Planning In terms of strategic planning, the author assesses PHD as aligned with the intent
of the PART. Data collected indicate that PHD uses a limited amount of outcome
measures that are each linked to strategic objectives. These outcome metrics are long-
term in nature due to the life-cycle focus of PHD in the operations and support phase of
the acquisition cycle. Furthermore, it is clear to the author that PHD is focused on
continuous improvement as evidenced in the SEAR, Task Force Lean, and Distance
Support programs. Each of these programs is associated with ambitious targets and
timeframes within a strategic planning process (NSWC PHD 2005).
In the author’s assessment, PHD has sufficient metrics in place to demonstrate
progress towards achieving long-term goals. Data collected indicate that PHD has
leading metrics within each of the balanced scorecard perspectives. PHD also satisfies
the PART minimum requirement for one efficiency metric, satisfying this with multiple
efficiency metrics within the financial and internal business process perspectives. The
requirement for R&D organizations to track how the program could improve scientific
understanding and its application is satisfied with outcome metrics in the learning and
growth perspective and internal business processes perspective.

106
Data collected indicate that PHD ties performance goals very closely to budget
submissions. This is reinforced by internal audits by line managers, as well as external
program reviews. It is also clear to the author that PHD is increasing the focus on
strategic planning through formal venues (e.g., leadership council, performance
measurement awards submissions). (NSWC PHD 2005)
The author does not have sufficient information to determine the extent to which
all partners (e.g., contractors, cost-sharing partners, other government programs) are
working toward the long-term goals of the program. Based on an increasing business
base and upward trends in almost every metric, the author would believe the answer to be
yes, but no clear evidence obtained in research validates this belief.
Program Management
Question 3.1: Does the agency regularly collect timely and credible performance information, including information from key program partners, and use it to manage the program and improve performance? Question 3.2: Are Federal managers and program partners (including grantees, sub-grantees, contractors, cost-sharing partners, and other government partners) held accountable for cost, schedule and performance results? Question 3.3: Are funds (Federal and partners’) obligated in a timely manner and spent for the intended purpose? Question 3.4: Does the program have procedures (e.g., competitive sourcing/cost comparisons, IT improvements, appropriate incentives) to measure and achieve efficiencies and cost effectiveness in program execution? Question 3.5: Does the program collaborate and coordinate effectively with related programs? Question 3.6: Does the program use strong financial management practices? Question 3.7: Has the program taken meaningful steps to address its management deficiencies?
Figure 30. PART Program Management Questions

107
3. Program Management The author assesses that PHD is strongly aligned with the intent of the program
management section of the PART. Data collected clearly indicates to the author that
PHD excels at financial management practices and obligating funds in a timely manner
for the intended purpose. Metrics within the financial perspective are very objective,
complete, and responsive to financial and non-financial dynamics that change on a daily
basis. Data collected also indicate that PHD collaborates internally and externally to
support outcome CPV’s and realize cost savings.
As previously discussed, PHD has metrics in place for such areas as competitive
sourcing, contract efficiency, Lean cost savings, and combat systems effectiveness.
These metrics are evidence of PHD’s ability to measure and achieve efficiencies and cost
effectiveness in program execution.
PROGRAM RESULTS/ACCOUNTABILITY
Question 4.1: Has the program demonstrated adequate progress in achieving its long-term performance goals? Question 4.2: Does the program (including program partners) achieve its annual performance goals? Question 4.3: Does the program demonstrate improved efficiencies or cost effectiveness in achieving program goals each year? Question 4.4: Does the performance of this program compare favorably to other programs, including government, private, etc., with similar purpose and goals? Question 4.5: Do independent evaluations of sufficient scope and quality indicate that the
program is effective and achieving results?
Figure 31. PART Program Results/Accountability Questions
4. Program Results/Accountability
In terms of this section of the PART, the author is not able to assess actual results
achieved and accountability at PHD due to the scope of this thesis. However, the author
assesses that objective, complete, and responsive metrics are in place for PHD to gain

108
visibility into achievement of long-term performance goals. Furthermore, the author
believes that input, process, and outcome CPV’s are emphasized sufficiently by line
managers, which should lead to improved efficiencies and cost effectiveness over time.
Thus, existing metrics at PHD are assessed as effective in providing the necessary
information to answer the questions above.
G. PRESIDENT’S MANAGEMENT AGENDA The overarching goal of the PMA is to achieve “immediate, concrete, and
measurable results in the near term” in five specific government-wide goals. The first of
these goals is “Strategic Management of Human Capital (OMB 2001).” The President
expects agencies to determine core competencies and execute a human capital strategy
that is linked to the mission, vision, core values, goals, and objectives of the organization
(OMB 2001). Within this context, the author believes that PHD is well-aligned. During
an April 2005 “Vision, Mission, Strategy Session (VMSS),” PHD articulated a new
mission statement, vision, core values, strategic objectives, and goals for the command.
From each interview conducted it was clear to the author that the human capital input,
workforce development process, and competent workforce outcomes were pervasive as
CPV’s throughout the organization. This pervasiveness is reinforced by the causal
performance maps in Chapter IV. In Chapter V, it is clear to the author that PHD
associates performance metrics to human capital and aligns these metrics with the
“Develop and Reward Our Workforce” strategic objective. Furthermore, human capital
metrics are pervasive within the learning and growth, financial, and internal business
processes perspectives in Chapter V.
The second goal of the PMA is “Competitive Sourcing.” The goal of the
administration is to regularly examine commercial activities performed by government,
promote competition through increased participation in OMB Circular A-76 initiatives,
and objectively identify the most efficient means to accomplish tasks whether by the
government or the commercial sector (OMB 2001). In objective terms, PHD has a
“competition advocate” and Contract Strategy Review Board that are responsible for
compliance with federal regulations such as competitive sourcing. One of the items that
the board reviews is competitive sourcing metrics, which indicate how many contracts

109
have been reviewed for compliance, and the resulting cost savings from the competitive
sourcing process. The author believes this is a good example of effects-based thinking,
as well as sufficient evidence of alignment between PHD and this goal of the PMA.
The third goal of the PMA is “Improved Financial Management.” The President
desires achievement of a clean financial audit and the ability to produce accurate and
timely financial information (OMB 2001). In the author’s opinion, PHD is well-aligned
with this goal in terms of comptroller functions. Within the NWCF balancing act, major
aspects of direct costs and overhead are tracked systematically with both leading and
lagging performance metrics. This information has to be timely due to the unexpected
changes discussed in Chapter IV. Based on the author’s observations it is clear that
existing metrics for aggregate data are very timely.
However, the PMA also calls for improved financial systems to measure and
affect performance immediately (OMB 2001). Based on interviews, it is clear to the
author that the financial systems at PHD do not capture many details within overhead
functions. This may be due primarily to a lack of identified benchmarks for certain
overhead functions. In the author’s opinion, the real dilemma is there is no “one-stop
shop” where detailed overhead metrics can be measured and tracked for immediate
visibility. The implementation of the C-ERP system within the next five years should
resolve this dilemma. Until a better information management system is in place, detailed
measurement of overhead will not likely be in alignment with the PMA.
The fourth goal of the PMA is “Expanded Electronic Government.” The
President desires a reduction in the expense and difficulty of doing business with the
government, as well as a reduction in government costs (OMB 2001). In the author’s
opinion, PHD is a champion of this goal. PHD pioneered the Distance Support program,
which allows direct and immediate electronic interface between PHD engineers and the
fleet customer. This system reduces resources dedicated to travel, reduces productive
time lost for engineers at PHD, and reduces downtime of equipment and systems,
translating to increased operational availability. The author feels this is an adequate
illustration of good alignment between PHD and the PMA.

110
The final goal of the PMA is “Budget and Performance Integration.” The
President desires better performance measures within agencies, use of performance
information for program management, and integration of performance measures with
budget submissions (OMB 2001). In the author’s opinion, the SEAR program aligns
PHD with this goal. The SEAR incorporates robust measures of performance within both
the planning and execution process, and links these performance metrics to cost. This
provides excellent budget integration information for not only PHD, but also program
managers during their program reviews. In the author’s assessment, the SEAR, EVMS
techniques, and straight-line budget-execution metrics directly support program sponsors
in the attainment of this PMA goal.

111
VII. CONCLUSIONS
A. EXISTING METRICS Within this thesis, the author assessed 55 existing metrics that PHD uses to
determine how well they are doing within CPV’s. Other metrics are also in existence at
PHD, but the 55 assessed are the metrics that, based upon this research, receive the
majority of management attention. While these data may indicate to the reader that PHD
is trying to track too many variables, the author does not believe this to be the case.
Capturing the complex components and interaction among CPV’s with only a few
metrics is simply not realistic. However, if existing metrics are considered within each of
the balanced scorecard perspectives, and also the appropriate level of the command
hierarchy, then they should be manageable. In the author’s opinion, the key to effectively
managing existing metrics lies in continual improvement of internal collaboration and use
of standardized business processes. All indications are that PHD is realizing this
continual improvement.
PHD is doing a great job at measuring performance. The metrics in place at PHD
are linked to strategy and capture how well they are doing in terms of the CPV’s that
determine their success. PHD maintains an excellent balance within their organization as
demonstrated by an almost equal number of metrics tied to CPV’s within each balanced
scorecard perspective. There is also an excellent balance in the number of input, process,
and outcome metrics used at PHD. Furthermore, the majority of existing metrics are
objective, complete, and responsive. While the author makes suggestions for
improvement, most of these are simple refinements to enhance objectivity, completeness,
and responsiveness of existing metrics. Research did not reveal any serious gaps or
deficiencies, but rather reinforced the adequacy of the performance measurement system
in place.
B. ALIGNMENT WITH FEDERAL GUIDANCE In terms of alignment with federal guidance, the author assesses that PHD is also
doing very well. For a unit level command such as PHD, it is striking to the author how
many of the overarching federal performance measurement goals are directly supported

112
by PHD. There is strong evidence of alignment with the PMA, as PHD directly supports
and measures performance in each of the President’s five goals. This is also true in
comparison with OMB guidance. In the author’s assessment, PHD could answer “yes” to
almost every portion of the PART evaluation. This provides solid support for program
managers, who fund work at PHD, to also align with OMB guidance. For the Navy and
FMB, PHD is very well-aligned in the area of budget and performance integration.
Strong financial and non-financial performance measures in the comptroller’s office,
coupled with the focused measurement in the SEAR program, result in a complete and
transparent picture of value created by PHD. This is the type of outcome that supports
the Navy’s progression towards achieving clean financial statements, matching metrics to
appropriations, and achieving efficiencies across the board.
PHD is also well-aligned within their immediate chain of command. As
illustrated in Chapter VI, there is a strong linkage between strategic objectives at PHD
and the strategic objectives of commanders upward in the chain of command. Since PHD
links metrics to their strategic objectives, PHD’s performance measurement system also
reinforces the objectives of their superiors. It is again striking to the author how clearly
the strategy of PHD matches the strategy of those higher in the chain of command. It is
clear to the author that PHD is part of a common vision for the future of the Navy.
C. POTENTIAL FOR FUTURE RESEARCH The methodology utilized in this thesis to create causal performance maps,
identify and analyze CPV’s, and assess existing metrics can be valuable for any
organization that needs an overarching assessment of their performance measurement
system. Since this thesis serves as such an overarching assessment, there are many
additional opportunities for research building on the findings contained herein.
Additional research questions include the following:
• Are PHD’s existing metrics coupled with information technology to
optimize effectiveness and efficiency?
• Are digital dashboards used by management within PHD appropriate
and effective?

113
• How is ROI best determined for the different elements within an R&D
intensive organization?
• How would effective productivity metrics be defined for PHD?
Fiscal constraints within government are a reality that will likely continue over
the long term. This fact, coupled with the existing emphasis on federal performance
measurement, places a continuing focus on improving effectiveness and efficiency.
Further research in the subject area of performance measurement should prove useful for
the Navy’s leaders in meeting the challenges that lie ahead.

114
THIS PAGE LEFT INTENTIONALLY BLANK

115
LIST OF REFERENCES
Ambrosini, Veronique and Cliff Bowman. 2002. Mapping Strategic Organizational Routines, in Mapping Strategic Knowledge, eds. Anne Huff and Mark Jenkins. Thousand Oaks, CA: Sage Publications
Anonymous, PHD Comptroller Office employee. 2005. Interview by author, 16 August,
Port Hueneme, CA. Tape recording. Anonymous, PHD Office of Corporate Business employee. 2005. Interview by author,
23 September, Port Hueneme, CA. Tape recording. Anonymous, PHD Office of Engineering and Technology employee. 2005. Interview by
author, 16 August, Port Hueneme, CA. Tape recording. Anonymous, PHD Office of Logistics employee. 2005. Interview by author, 16 August,
Port Hueneme, CA. Tape recording. Anonymous, PHD Office of Technical Operations employee. 2005. Interview by author,
16 August, Port Hueneme, CA. Tape recording. Anonymous, PHD Ship Self Defense and Expeditionary Warfare Department employee.
2005. Interview by author, 23 September, Port Hueneme, CA. Tape recording. Balisle, P.M. 2005. NAVSEA Commander’s Guidance 2005, Institutionalizing our
Transformation. Washington D.C. Carpenter, Nancy. 2005. Department of Defense Financial Management Automated
Balanced Scorecard and Department of the Navy Major Command Scorecards, 3 February 2005. Washington D.C.
Chief of Naval Operations, 2005. CNO Guidance for 2006: Meeting the Challenge of a
New Era. Washington D.C. Department of Defense. 2003. Evaluating Performance Measures. Accessed July 27,
2005. Available from http://navweb.secnavy.navy.mil/pubbud/gpra/balanced_scorecard/Evaluating_ Perf_Measures_24Jun03_short.ppt. Internet.
Department of Defense. 2005. PMA: Results for the Department of Defense. Accessed
August 21, 2005. Available from http://www.whitehouse.gov/omb/pma/2004_pma_report.pdf. Internet.

116
Department of the Navy, Office of Budget. 2005. Highlights of the Department of the Navy FY 2006/FY 2007 Budget. Washington D.C.
Eden, C., Jones, S., Sims, D. and Smithin, T. 1981. The intersubjectivity of issues and
issues of intersubjectivity, Journal of Management Studies. Blackwell Publications. Epstein, Marc J., 2002. Measuring the Payoffs of Corporate Actions: The Use of
Financial and Non-Financial Indicators, in Marc J. Epstein and Jean-Francois Manzoni (eds.), Performance Measurement and Management Control: A Compendium of Research. Kidlington, Oxford: Elsevier Science Ltd.
Executive Office of the President, Office of Management and Budget. 2001. The
President’s Management Agenda, Fiscal Year 2002. Washington D.C. Executive Office of the President, Office of Management and Budget. 2004. The Federal
Government is Results-Oriented Report. Accessed August 12, 2005. Available from http://www.whitehouse.gov/omb/pma/2004_pma_report.pdf. Internet.
Executive Office of the President, Office of Management and Budget. 2005. Executive
Branch Quarterly Reporting Scorecard. Accessed August 21, 2005. Available from http://www.whitehouse.gov/results/agenda/scorecard.html. Internet.
Executive Office of the President, Office of Management and Budget. 2005. Department
of Defense PART Assessments. Washington D.C. Available from http://www.whitehouse.gov/omb/budget/fy2006/pma/defense.pdf. Internet.
Executive Office of the President, Office of Management and Budget. 2005. Guidance
for Completing the Program Assessment Rating Tool (PART). Accessed September 21, 2005. Available from http://www.whitehouse.gov/omb/part/fy2005/2005_guidance.doc. Internet.
Government Accountability Office (GAO) High-Risk Series 2005. High-Risk Series: An
Update (GAO-05-207) 2005. Accessed August 2, 2005. Available from http://www.gao.gov/docsearch/featured/highrisk.html. Internet.
Government Performance and Results Act of 1993. Accessed June 21, 2005. Available
from http://navweb.secnav.navy.mil/pubbud/gpra/U_GPRA.HTM. Internet. Kaplan, Robert S. and David P. Norton. 1992. The Balanced Scorecard: Measures that
Drive Performance. Boston: Harvard Business School Press. Kaplan, Robert S. and David P. Norton. 1996. The Balanced Scorecard: Translating
Strategy into Action. Boston: Harvard Business School Press.

117
Lawrence, Jim, 2003. Basics of Technical Authority. NAVSEA briefing on October 27, 2003. Available from http://pbma.hq.nasa.gov/docs/public/pbma/casestudies/Lawrence_NASA_Brief1.ppt. Internet.
Malina, Mary A. and Frank H. Selto. 2001. “Communicating and Controlling Strategy:
An Empirical Study of the Effectiveness of the Balanced Scorecard,” Journal of Management Accounting Research. American Accounting Association.
Manzoni, Jean-Francois, 2002. Management Control: Toward a New Paradigm?, in
Marc J. Epstein and Jean-Francois Manzoni (eds.), Performance Measurement and Management Control: A Compendium of Research. Kidlington, Oxford: Elsevier Science Ltd.
Naval Surface Warfare Center. 2005. NSWC Concept of Operations (CONOPS).
Washington D.C. Naval Surface Warfare Center, Port Hueneme Division. 2003. PHD NSWC Safety,
Effectiveness, and Affordability Review Guide. Port Hueneme, CA. Naval Surface Warfare Center, Port Hueneme Division. 2005. 2005 Application for
California Awards for Performance Excellence, Eureka Award – Government Category. Port Hueneme, CA.
Naval Surface Warfare Center, Port Hueneme Division. 2005. Vision, Mission, Strategy
Session Report Out, 28 April 2005. Port Hueneme, CA. Naval Surface Warfare Center, Port Hueneme Division. 2005. Navy Working Capital
Fund (NWCF) Primer. Port Hueneme, CA. Naval Surface Warfare Center, Port Hueneme Division. 2005. Executive Financial
Review for Period 30 APR 2005. Presented to Executive Staff 19 May 2005. Port Hueneme, CA.
Naval Surface Warfare Center, Port Hueneme Division. 2005. Air Dominance
Department 1-on-1 Brief, May 2005. Port Hueneme, CA. Office of the Assistant Secretary of the Army for Financial Management and
Comptroller, 2005. Army Budget Performance Metrics: Budget and Performance Integration. Presented June 3, 2005 in Salt Lake City, UT for the American Society of Military Comptrollers Professional Development Institute. Accessed September 22, 2005. Available from www.asmconline.org/files/PDI/pdi2005workshop38.ppt. Internet.

118
NAVSEA Warfare Centers Alignment. All Hands Briefing September 2, 2003. Available from www.nswcdc.navy.mil/docs/Alignment.ppt. Internet.
Rating the Performance of Federal Programs. Accessed July 27 2005. Available from
http://www.whitehouse.gov/omb/budget/fy2004/performance.html. Internet. Secretary of the Navy. 2005. Balanced Scorecard. Accessed July 28, 2005. Available
from http://navweb.secnav.navy.mil/pubbud/gpra/balanced_scorecard/SECNAV_Balanced_Scorecard.ppt. Internet.
Simons, Robert. 2000. Performance Measurement and Control Systems for
Implementing Strategy: Text and Cases. Upper Saddle River, NJ. Prentice-Hall Inc.
Virtual SYSCOM Public Affairs. 2005. “Navy’s ‘Virtual SYSCOM’ Transforming
Business Processes,” Article from Navy Newsstand, July 13, 2005. Accessed November 8, 2005. Available from http://www.dau.mil/pubs/dam/11_12_2005/new_nd05.pdf. Internet.
Weick, K.E. and Bougon, M.G. 1986, Organizations as cognitive maps, in H.P. Sims
(ed.), The Thinking Organization. San Francisco: Jossey-Bass.

119
INITIAL DISTRIBUTION LIST
1. Defense Technical Information Center Fort Belvoir, VA
2. Dudley Knox Library Naval Postgraduate School Monterey, CA 3. Naval Surface Warfare Center, Headquarters Washington D.C. 4. CAPT Stephen Huber Naval Surface Warfare Center, Port Hueneme Division Port Hueneme, CA 5. Mr. Michael Sauthoff Naval Surface Warfare Center, Port Hueneme Division Port Hueneme, CA 6. Naval Surface Warfare Center, Dahlgren Division Dahlgren, VA 7. Naval Surface Warfare Center, Carderock Division West Bethesda, MD 8. Naval Surface Warfare Center, Corona Division Corona, CA 9. Naval Surface Warfare Center, Crane Division Crane, IN 10. Naval Surface Warfare Center, Indian Head Division Indian Head, MD 11. Professor Ken Euske Naval Postgraduate School Monterey, CA 12. Professor Mary Malina Naval Postgraduate School Monterey, CA