naval postgraduate school - defense technical … · naval postciraduaa scoo naval postgraduate...
TRANSCRIPT
NAVAL POSTGRADUATE SCHOOL(Monterey, California
N 1;1 STAT
"ZA
SRADC.
THESISTHE EFFECT OF HEAT INPUT AND COMPOSITION
ON WELD METAL MICROSTRUCTURES INTHIN SECTION HY-130 GMAW WELDMENTS
by
Dean M. PedersenDecember 1988
Thesis Advisor: Saeed SabouryCo-advisor: J. M. B. Losz
Approved for public release; distribution is unlimited.
DTICELECTE
APR 1 11H
REPORT DOCUMENTATION PAGE
a %~.: - . -. 5. . : ,, L I
j~r~-~', ,.7O~ * ~Approved for public release;distribution is unlimited.
K2
;C S-Vgco a NJAVE 0;_ VG%17R!%( ORGAM~ZA-!ONjSchol I Of cwoiucaole)
Naval Postciraduaa Scoo Naval Postgraduate School
;k( ADCQE~s ,C'! Stare .3'a ZPC2(oe) lo aDDRESS City, State, and ZIP Code)
Monterey, California 93943-5000 Monterey, California 93943-5000
(if 3co/'caole)
SC D E3 CE Stare a'-o 7,P CO(e) '0 SOc.PCE 3Z ;:-D NC, .MB2
PROGRAM DRO,,ECT A. IA7'ELEMENT NO 1,1 J0 ACCESS Ili
'I7-LE (include Securty Cass flcar'or-
The Effect of Heat input and Composition on Weld Metal Microstructures onThin Section HY-130 c-MAW Weldments.2 PSRSONAL_ A-_TACP(S'
Pedersen, Dean M.M3as e s TTesi Q-. C,-E 142 DATE OP REPORT CYear, Month, Day) 5 P2ACEM3ase' TYPE es~ O 02"2 O',- December 1988 f 9
'6~P A 2 .'C The views expr-esse d in this thesis are those of the aut.-cand do not reflect the official policy or position of the Department of
oees r thne U., S. Government.cC)sA CDDS 8 5.SC TERMVS (Continue on reverse if necessary and identify by block numtoe'l
C-C S i9 _-Z C HY-130, c-MAW, Weld Metal Microstructure
'9 ABSTRACT Continue cn reverse it necmrs'y anoi ijenrfy ov block number)
Th..in section HY-130 is being considered by the U. S. Navy for use in decksand foundations in the SSN-21 design as a weight saving measure. Optimumwelding procedures for thin section HY-130 do not currently exist, but theyare2 z-eng developed by David Taylor Naval Ship Research and DevelopmentCenter (DTNSRDC) . In this study, performed in conjunction with DTNSRDC, tneeffect cf heat input and electrode composition on the weld metal micro-s*tructures and mecn-ani-cal properties of.f:,t:' _._12.7 mm thick HY-130 steel
welmens podued y te cMAW process are reported. Micr-ostructures were
fully chnaracterized by light and electron microscopy. Mechanical propertyresults providced by DTNSRDC were correlated with the microstructure. The.ower heat input produced microstructural refinement and a more uniformha-n.ess. The h1-igher car-bon content electrode lowered the Ms temperature ano4stabilized the austenlte. A mirorodupiex structure of lath maztensite an-4
20 D~5 9' c C% A R9 72 1S~A 1Z .,PAC" SFEC9Q C ASS'F'(.'
"J JC -A 3S O V' D C: :, AE .1- r r UNCLASSIFIED
Saeed Saboury (408) 372-5932 69SbDD FORM 1473, intA CA 2 ~ ,li S' 'l as, S 5T CL ScAINo 2
i UNCLASSIIE

SECURIY CLASSIFICATION OF THIS PAGE
it19 - Continue--
thin 'film int2 ath retained' austenite n,-rornuced a qood com-bination of strength and
touebhness.
Aooos.Mo Por
NTIS GAIDTICL W
Distribution/
AVS1l8hility Codes
Dist oca
SECUP'TY C ASSIFICATION OF T SP& $

>ELZ METkL T 7C F",S TUTR
~EC~iN M-lTGVIAW WELDMENTS
;E-f a1 . p e-: s 1
j~~~~ ~~~ T u Unv:st
1117
0A4
r J a. Les Tes C>1-A
t>C Me-Ild yli
6:1 ~ -

ABSTRACT
Thin section HY-130 is being considered by the U. S. Navy
for use in decks and foundations in the SSN-21 design as a
weight saving measure. Optimum welding procedures for thin
section HY-130 do not currently exist, but they are being
developed by David Taylor Naval Ship Research and Development
Center (DTNSRDC). In this study, performed in conjunction
with DTNSRDC, the effect of heat input and electrode
compcsition on the weld metal microstructures and mechanical
properties of four 12.7 mm thick HY-130 steel weldments
produced by the GMAW process are reported. Microstructures
were fully characterized by light and electron microscopy.
Mechanical property results provided by DTNSRDC were
correlated with the microstructure. The lower heat input
produced microstructural refinement and a more uniform
hardness. The higher carbon content electrode lowered the M.
temperature and stabilized the austenite. A microduplex
structure of lath martensite and thin film interlath retained
austenite produced a good combination of strength and
toughness.
iv

TABLE OF CONTENTS
I. INTRODUCTION ......................................... 1
II . BACKGROUND ........................................... 4
A. MICROCONSTITUENTS ................................ 5
B. MECHANICAL PROPERTIES ............................ 9
C. EFFECT OF HEAT INPUT ............................. 13
D. EFFECT OF COMPOSITION ............................ 15
E. HY-130 MICROSTRUCTURES OBSERVED .................. 17
III. EXPERIMENTAL PROCEDURE ............................... 19
A . MA TER IA L ......................................... 19
B. MACROSAMPLE PREPARATION .......................... 19
C. MECHANICAL PROPERTIES ............................ 24
D. MICROSTRUCTURAL CHARACTERIZATION ................. 25
IV . RE SULT S ................ .............................. 28
A. MECHANICAL TESTING ............................... 2E
B. MICROSTRUCTURAL CHARACTERIZATION ................. 32
V . D ISCU SSION ........................................... 42
A . MICROSTRUCTURE ................................... 42
B. EFFECT OF HEAT INPUT ............................. 45
C. EFFECT OF COMPOSITION ............................ 47
VI . CONCLUSIONS .......................................... 50
VII. RECOMMENDATIONS ...................................... 51
A PP EN D IX ...... .... .. .. . .... .... . ... .. ... .. .. .... ... .. .. ... 52
LIST OF REFERENCES ......................................... 84
INITIAL DISTRIBUTION LIST .................................. 87
V

ACKNOWLEDGEMENTS
I wish to express my appreciation to my thesis advisors,
Dr. J. Mauto Losz and Dr. Saeed Saboury for their guidance
and assistance in completing this work. A special thanks to
Dr. Losz for his many hours of TEM analysis on my behalf and
for sharing his expertise in the areas of TEM and
micrographic analysis.
I wculd also like to express my sincere thanks to my
wife, Pam, for all her help in keeping our house a home
through the turmoil caused by my work. Finally, I dedicate
this work to my children, David and Donna.
vi
I. INTRODUCTION
HY-130 is a 5Ni-Cr-Mo-V steel, required to contain less
than 0.12 wt% carbon and exhibit a minimum yield strength of
130 ksi (896 MPa) [Ref. 13. This hardenable steel was
developed by the U. S. Navy for naval applications where high
strength along with good toughness and weldability are the
major requirements. The combination of high strength with
good resistance to brittle fracture is based on the
development of a tempered martensite-bainite microstructure
produced after a quench and temper heat treatment.
HY-130 can be welded by a variety of processes, including
the multipass Gas Metal Arc Welding (GMAW) process. It is
welded with a filler metal slightly different from the base
metal, the composition of which is designed to produce an as-
deposited weld metal strength and toughness that closely
resembles the heat treated strength and toughness of the base
metal [Ref. 23. No post weld heat treatment is required to
produce the specified mechanical properties across the weld
zone [Ref. 1].
A clean steel making process, possibly with vacuum
degassing, is critical to minimize the introduction of
impurities, thus retaining the desired mechanical properties.
Welding procedures for HY-130 are more stringent than for HY-
80, but a welding system suitable for shipyard fabrication is
currently available for thick plate HY-130. Weldment
1

probiems for HY-130 are very different than for HY-80: HY-80
is prone to heat affected zone (HAZ) cracking while HY-130 is
much more likely to exhibit weld metal cracking and porosity.
Both steels possess good resistance to stress corrosion
cracking and adequate ductility for either cold or hot
forming. [Ref. 1]
Thin section (less than 19 mm thick) HY-130 steel is
being considered for nonpressure hull applications in the
SSN-21 submarine design. A design analysis performed by
Electric Boat [Ref. 3] showed that significant weight savings
could be achieved by replacing HY-100 with HY-130 in the
fabrication of decks and foundations. David Taylor Naal
Ship Research and Development Center (DTNSRDC) is presently
developing welding procedures for HY-13C in thicknesses of
6.4 to 19 mm. Welding variables such as preheat, heat input,
3oint design, welding process, electrode composition, flux,
etc. are being examined to produce strength and toughness
levels similar to the base metal across the weld region and
the heat affected zone [Ref. 41.
The present research was initiated at the Naval
Postgraduate School based on a request by DTNSRDC for
additional information on the microstructure of GMAW
weldments previously fabricated as part of the Center's
analysis of thin section HY-130. This study investigates the
effects of heat input and electrode composition on the
microstructure and mechanical properties Cf four GMAW
2

weldznents in 12.7 Mm thick HY-230 pl.ates. The weld metal
iicrostructures were characterized by light and electron
microscopy techniques and mnecharnical properties were assessed
using Charpy V-Notch (CVN), tensile and hardness tests.

II. BACKGROUND
The strength and hardness of welds is generally high due
to alloying elements working in combination with rapid
cooling rates to promote the formation of low temperature
transformation products, primarily bainite and martensite.
On the other hand, the impact and toughness properties of
steel welds are not usually high because of the inhomogeneity
of the weld metal microstructure resulting from a relatively
coarse columnar solidification structure and due to
segregation. [Ref. 5]
The attainment of both strength and toughness in as-
deposited HY-130 GMAW weldments requires a delicate balance
between composition and cooling rate to produce the required
microstructure in a multipass weld. The location of greatest
concern within the weld metal is generally the final weld
pass. It is expected to exhibit the highest hardness and tne
least refined microstructure due to the lack of thermal
cycling from subsequent weld passes [Ref. 21. Various
microconstituents observed in GMAW weldments, the
relationship between microstructure and mechanical
properties, and the roles of cooling rate and composition in
forming these microstructures are discussed in this chapter.
4

A. MICROCONSTITUENTS
The microstructure of the fusioni zone in weld metals is
dependent upon the welding process, bead size, heat input,
electrode composition, preheat temperature and base metal
thickness [Ref. 2]. The thermal effects of the welding cycle
can cause multi-constituent microstructures to be observed on
a very fine scale in the fusion zone of steel welds,
particularly in multipass welding. The microconstituents
most commonly observed in the fusion zone of weld metals
include lath and twinned martensite, tempered and
autotempered martensite, retained austenite, martensite-
austenite, bainite, acicular ferrite and non-metallic
inclusions.
1. Martensite
Martensite is a low temperature transformaticn
product and as such it requires a very fast cooling rate tc
form. Martensite begins to form at the martensite start (M,,'
temperature and the transformation is completed at the
martensite finish (Mr) temperature. Martensite nucleates and
grows by a diffusionless shear mechanism so it maintains the
same composition as the parent austenite. "Surfaces," such
as grain bounddries or inclusions, are not particularly good
nucleation sites for martensite; it generally prefers to
nucleate within the prior austenite grains on dislocations,
or groups of dislocations, so it can use the strain energy of
the dislocation as an aid to nucleation. Lath martensitE
5

with a very high dislocation density is typically observed in
low carbon steel weld metals; it generally grows in packets
on {lll} habit planes. The high hardness of lath martensite
is due to its high dislocation density along with the carbon
in solid solution. [Ref. 5]
Twinned martensite contains at least 0.5 wt% C and is
generally found only when the carbon content is greater than
0.15 wt% [Refs. 2 and 6]. It may form ia HY-130 weldments
due to carbon segregation [Ref. 2].
2. Tempered and Autotempered Martensite
Martensite is not an equilibrium microstructure so it
can be t,,mpered by heating after formation. Tempered
martensite is softer and more ductile than untempered
martensite due to the precipitation of cementite from the
previousLy untempered martensite. Tempered martensite may be
observed in multipass weld metals due to thermal cycling from
subsequent weld passes [Pef. 7]. Autotempered martensite is
a slightly different morphology that may be seen in higher
heat input welds in which lath martensite forms at a
temperature high enough to allow some tempering during
further cooling without additional heat being supplied.
3. Retained Austenite
As the martensite laths form during cooling after
welding, they surround and isolate small islands of
austenite. The austenite requires more space to transform to
martensite so the existing martensite must crack or the
6

austenite is forced to remain untransformed in the
microstructure as retained austenite [Ref. 71. In weld
metals with high cooling rates, retained austenite may exist
in very thin regions between the martensite laths [Ref. 5].
Interlath films of retained austenite are usually detected
only by transmission electron microscopy (TEM) [Ref. 8].
4. Martensite-Austenite
Martensite-austenite is a microconstituent consisting
of regions of high carbon (about 0.5 wt% C) martensite
surrounded by retained austenite. As austenite transforms to
bainitic ferrite by nucleation and growth, the remaining
austenite is continually enriched in carbon. If the carbon
partitioned to the austenite does not become locally
concentrated sufficiently to cause nucleation of cementite,
martensite-austenite is formed. Microtwins are often
observed within the martensite-austenite constituent. Higher
alloy contents provide greater austenite stability, suppress
cementite precipitation from carbon enriched austenite, and
increase the amount of martensite-austenite formed. [Ref. 9]
5. Lower Bainite
At temperatures just above the M. temperature, lower
bainite laths may nucleate and grow if carbon diffusion at
the austenite grain boundaries is sufficient. The growth of
lower bainite is an interface controlled reaction that relies
on very short range diffusion of carbon to form carbides with
an orientation relationship to the ferrite, concurrent with a
7

t_,.kenlng and lengthening of the plates. At the low growth
temperature of lower bainite, carbon dizfusion is so slow
that the ferrite plates thicken easier by precipitation of
cementite at the interface. Thus, excess carbon is removed
from the austenite and the interface between the austenite
and the growing bainite laths advances [IRef. 5].
6. Acicular Ferrite
Generally considered to be the most desirable
microconstituent in weld metal, acicular ferrite consists of
a series of very fine interlocking ferrite laths (typical
sizes aie 0.1-3.0 p) that generally from within the prior
austenite grains [Ref. 10]. Acicular ferrite is known to
enhance both toughness and strength in weld metals. The
laths are separated by high-angle grain boundaries and often
contain complex second phases at the boundary, such as
retained austenite, martensite and carbides. The nucleation
of acicular ferrite laths is most favorable at austenite
grain boundaries, although non-metallic inclusions have been
identified as the primary nucleation sites [Ref. 11].
Without potent nucleation sites for ferrite (a weld metal
oxygen content <0.01 wt% for instance), the formation of
acicular ferrite may be completely suppressed [Refs. 12 and
13].
7. Non-Metallic Inclusions
Indigenous non-metallic inclusions, primarily glassy,
spherical silicon and manganese oxides, form as a result of
deoxidation reactions in liquid weld metal as it cools [Ref.
12]. When using a consumable electrode, as in GMAW,
oxidation of the alloying elements takes place in the
droplets as they form at the electrode tip so there is very
little reaction in the weld pool [Ref. 141.
Inclusions can exist with diameters up to 10 p,
although weld metal inclusions are normally less than I p in
diameter; volume fractions as high as 1% have been observed
[Ref. 14]. Particle coarsening is primarily due to
coalescence of smaller particles into larger ones. The
average diameter generally increases with aluminum content
(because aluminum is the strongest oxide former commonly used
for deoxidation of steel) and with heat input (due tc an
extended weld pool retention time) [Ref. 121.
Nucleation of acicular ferrite on inclusions is
always more favorable than homogeneous nucleation, but less
favorable than nucleation on austenite grain boundaries,
regardless of the inclusion size. It appears that inclusions
with diameters from 0.4-1.0 p are the most potent nucleation
sites for acicular ferrite [Ref. 12]. Smaller inclusions may
pin the austenite grain boundaries, thus restricting grain
size and providing good nucleation sites for polygonal
ferrite [Ref. 10].
B. MECHANICAL PROPERTIES
The achievement of the specified strength and toughness
properties for HY-130 base plate requires a tempered
9

microstructure of 60 to 75% martensite as a minimum, with the
remainder as fine lower bainite [Ref. 15]. Refinement of the
weld metal microstructure may yield increases in both
strength and toughness which are generally not simultaneously
possible. A refined structure (i.e., a fine grained bainitic
or ferritic structure) generally promotes ductile fracture
and gives the best resistance to environmental embrittlement
in HY-130 weldments [Ref. 16]. Thus by lowering the M.
temperature, nucleation sites for bainite laths are increased
and packet widths are refined producing a lower ductile to
brittle transition temperature and improved toughness.
Conner et al. [Ref. 17] conducted an extensive study of
the mechanical properties of HY-130 GMAW weldments using
several different electrodes, heat inputs, preheat/interpass
temperatures and plate thicknesses including 12.7 mm thin
sections. They reported a good combination of strength and
toughnesq for a 0.08 wt% carbon electrode using a heat input
of 1.46 kJ/mm and a preheat/interpass temperature of 650C.
Glover et al. [Ref. 61, working with C/Mn steel
weldments, observed a higher fracture toughness associated
with a fine acicular ferrite structure and a low inclusion
content, while martensite, martensite-austenite and coarse
upper bainite had a deleterious effect on weld metal
toughness. Sarikaya et al. [Ref. 18] associated inferior
toughness with a high density of large oxide inclusions. The
problem of poor impact toughness in welds may be compounded

by the formation of martensite-austenite or carbides on
ferrite boundaries where they may act as efficient crack
nucleation sites [Ref. 6]. Biss and Cryderman [Ref. 9]
report that martensite-austenite can cause poor impact
properties and lower yield strength in low carbon steels.
A microduplex structure of dislocated-autotempered lath
martensite and thin film interlath retained martensite
produced good combinations of strength and toughness for
Fe/Cr/C base steels [Ref. 183. Significant increase.s in
toughness in particular have been attributed to these
martensite/stable retained austenite structures.
Tempering introduced by thermal cycling in multipass
weldments may produce a significant increase in impact energy
along with an improvement in yield strength due to the
precipitation of very fine, intralath carbides [Ref. 18].
Unfortunately, tempering may also cause tempered martensite
embrittlement due to thermally unstable retained austenite
[Refs. 8 and 18]. Embrittlement often observed near 260 0 C is
due to the precipitation of film-like carbides on prior
austenite grain boundaries and sub-boundaries [Ref. 19].
Segregation of alloying elements, especially manganese and
chromium, to prior austenite grain boundaries can compound
problems with temper embrittlement. Silicon can be added to
postpone the tempering of martensite during thermal cycling
[Ref. 19].
1

Hydrogen embrittlement and stress corrosion cracking
(SCC) are also strong functions of microstructure. Chen et
al. [Ref. 16J report the microstructures most susceptible to
SCC are traisformation twinned martensite and coarse laths of
bainitic ferrite, while fine lath martensite is the most
resistant. HY-130 is particularly susceptible to hydrogen
damage as a result of the high solubility of hydrogen in
nickel alloyed steels, thus the hydrogen content should be
kept below 2 ppm [Ref.15j. Ritchie et al. [Ref. 20] report
that retained austenite reduces SCC crack velocity by
lowering the susceptibility to hydrogen embrittlement. In
sharp contrast, Kim et al. [Ref. 21] conclude, in a study of
5.5 Ni steel, that unstable interlath retained austenite may
increase susceptibility to hydrogen embrittlement. HY-130
plates one inch thick have been welded with a preheat and
interpass temperature of 660 C with no signs of hydrogen-
assisted weld metal cracks [Ref. 17]. Satisfactory
resistance to hydrogen related problems has not been
demonstrated for non-preheated HY-130 weldments.
Multipass welding provides thermal cycling for all weld
passes except the final pass. Challenger et al. [Ref. 2]
postulate that softening occurring during multipass welding
is due to either carbon segregation or precipitation of
carbides on a scale too fine to observe with standard TEM
techniques.
12

C. EFFECT OF HEAT INPUT
The transformation kinetics and the mechanical properties
of weld metal are strongly influenced by the cooling rate.
Increasing the cooling rate is an ideal mechanism for
microstructural refinement, but such an increase may also
result in delayed weld metal cracking or an undesirable
microstructure [Ref. 17]. The cooling rate from 800 to 500 0 C
following welding is considered indicative of the properties
to be anticipated. The Rosenthal equation [Ref. 22] shows
that cooling rate is inversely proportional to heat input
with the same metal, welding velocity and preheat so these
terms can be used interchangeably (i.e., an increase in
cooling rate occurs due to a decrease in heat input).
Higher cooling rates are generally associated with low
temperature transformation products which produce increases
in strength, but decreases in toughness [Ref. 221. At slow
cooling rates in C/Mn steel weldments, Glover et al. [Ref. Ej
show, via a schematic CCT diagram, that austenite should
transform to coarse polygonal ferrite with regions of
pearlite, while intermediate cooling rates cause coarse
ferrite to form along austenite grain boundaries initially
with acicular ferrite forming inside the prior austenite
grains as the transformation temperature decreases. At a
very fast cooling rate (heat input of 0.74 kJ/mm), austenite
should transform to an upper bainitic structure with no
proeutectcid ferrite at the prior austenite grain boundaries;
13

a lower bainite start temperature yields colonies of finer
bainite.
Argon base shielding gases typically produce a central
region of deep penetration known as the papilla [Ref. 231.
Deep papillae exhibit high cooling rates causing low
toughness and low ductility in this region, thus reducing the
benefits of multipass welding [Ref. 2]. High heat inputs are
generally required for depositing large weld beads, thus
increase the rate of welding. Porosity is generally low in
low heat input weldments because the weld pool remains
shallow and allows most of the gas bubblps to escape before
the pool solidifies [Rcf. 17].
Farrar and Harrison [Ref. 10] report that high cooling
rates coupled with basic hardenability produce a true
martensitic transformation in the weld metal of steels
containing manganese and nickel. They conclude that the
ma3or influence of cooling rate is in determining the degree
of supercooling prior to the transformation, hence it needs
to be balanced to the basic hardenability of the austenite
matrix.
Strength generally decreases slightly as the preheat
temperature or the heat input is increased. The yield
strength decrease for a given increase in heat input is
larger than the decrease for a variation in preheat/interpass
temperature [Ref. 23].
14
A minimum cooling rate of 16.7 0 C/sec is specified for HY-
130 weldments [Ref. 241. This minimum cooling rate
requirement limits the maximum allowable preheat temperature,
but necessarily so because slower cooling rates will result
in weld metal with unacceptably low yield strength. Heat
inputs of 1.38 to 1.57 kJ/mm with preheat and interpass
temperatures in the range 52 to 66 0 C have proven optimal for
achieving mechanical properties in the target area for HY-130
welds in plate thicknesses of 9.5 to 16 mm [Refs. 17 and 23].
D. EFFECT OF COMPOSITION
Weld metals are essentially subjected to continuous
cooling during solidification, so the resultant
microstructures should be predictable from CCT diagrams.
Unfortunately, these diagrams are not readily available for
weld metals and would actually be extremely difficult to
develop based on the composition and cooling rate variaticn
just within a single weld pass.
Although individual CCT diagrams for weld metals are
generally not available, the influence of certain features of
welding such as cooling rate and composition on the formation
of microconstituents can be predicted. Austenite stabilizers
(C, N, Mn, Ni, Cu) push transformation to longer times and
enhance the formation of low temperature products such as
bainite and martensite. Microalloying elements such as
niobium, titanium and vanadium may cause grain hardening and
15
reduced toughness due to precipitation reactions during
thermal cycling in multipass welding. [Ref. 5]
Addition of molybdenum seems to delay the polygonal
ferrite reaction, favor the formation of bainitic structures
and increase the amount of acicular ferrite formed [Ref. 10].
Molybdenum may also limit or postpone tempered martensite
embrittlement by providing temper resistance [Ref. 18].
Excessive amounts of carbon, sulfur, phosphorus,
hydrogen, oxygen and nitrogen can cause weld metal cracking
in HY-130 welds [Ref. 24]. On the other hand, weld metal
compositions with high oxygen contents generally exhibit
higher inclusion densities which in turn promote the
formation of acicular ferrite, a microstructure important for
good weld toughness [Ref. 221. Abson and Dolby !Ref. 13]
show the level of oxygen significantly influences the
position of the acicular ferrite phase field in a weld metal
CCT diagram. They report the formation of acicular ferrite
is most favorable with a weld metal oxygen content of 0.03
wt%. From their analyses, Bhatti et al. [Ref. 25] conclude
the formation of acicular ferrite is favored by aluminum rich
rather than manganese rich inclusions.
Carbon has more control of the microstructure in steel
weld metal than any other element; it is responsible for the
amounts of lath martensite and carbides formed and exerts a
significant influence on the solidification substructure. At
a fixed cooling rate, Glover et al. [Ref. 6] report that
16

lowering the carbon level in untransformed austenite via
segregation raises the local M. temperature. This also
decreases the available carbon supersaturation for carbide
nucleation so the formation of martensite-austenite rather
than carbides is favored. Challenger et al. [Ref. 21
reported the same effect of carbon content on M. temperature
in HY-130 weldments. Andrews' empirical product formula
[Ref. 26] gives M. temperature as a function of composition:
M.(°C) = 512 - 453(%C) - 16.9(%Ni) + 15(%Cr) - 9.5(%Mn)
+ 217(%C) 2 - 71.5(%C)(%Mn) - 67.6(%C)(%Cr).
E. HY-130 MICROSTRUCTURES OBSERVED
Employing thin foil transmission electron microscopy,
Challenger et al. [Ref. 2] observed primarily lath martensite
(0.24 p average width) with a high dislocation density and
large spherical carbides in tempered HY-130 base metal. In
HY-130 weld metal with a heat input of 2.05 kJ/mm, they
observed fine lath martensite (about 0.2 p average width) and
wide bainite laths (about 2 p average width) with no carbides
in the martensite. They also observed the presence of
twinned martensite in bainite within HY-130 weld zones due to
carbon segregation [Ref. 2].
Structures of martensite, also twinned and autotempered
martensite, with small amounts of bainite were seen by Chen
et al. [Ref. 16] in a thick section HY-130 weld metal
fabricated by the GMAW process with a heat input of 1.8 kJi'mm
17

and a preheat/interpass temperature of 135-149 0 C. They
observed a mixed bainitic structure with large amounts of
broad lath lower bainite, twinned martensite and some rare
retained austenite in a similar weld with a heat input of 1.6
kJ/mm and a preheat/interpass temperature of 65-1350 C.
18

III. EXPERIMENTAL PROCEDURE
A. MATERIAL
Four HY-130 steel plates 12.7 mm thick, with the chemical
compositions given in Table 1, were welded in the flat
position by the GMAW process. The welding joint design for
each plate was a single beveled 45 degree V-joint with a 6.4
mm thick backing plate tack welded to the base of each plate.
Two different electrode materials were used; their chemical
compositions are given in Table 2. As shown in Table 3, two
of the specimens (Samples W2 and W6) were welded with
electrode Linde 151140 at heat inputs of 0.79 and 1.61 kJ/mm,
while the other two specimens (Samples W58 and W60) were
welded with electrode LTEC 140005 at the same two heat
inputs. The composition of the as-deposited weld metal for
each sample is presented in Table 4.
B. MACROSAMPLE PREPARATION
A 12.7 mm thick slice perpendicular to the welding
direction was cut out of the center of each weldment, ground
and polished for macroetch4ng. The samples were then etched
in a 2% Nital solution for 10 minutes to reveal the details
of each weld pass. Figures 1-4 illustrate the macrostructure
for each weldment (all figures appear in the appendix).
19
TABLE 1CHEMICAL COMPOSITION OF HY-130 BASE PLATE (WT%)
Element Specification Base Plate
Carbon 0.12 Max 0.09
Manganese 0.60 - 0.90 0.71
Phosphorus 0.010 Max 0.008
Sulfur 0.010 Max 0.003
Silicon 0.20 - 0.35 0.28
Copper 0.25 Max 0.15
Nickel 4.75 - 5.25 4.83
Chromium 0.40 - 0.70 0.54
Molybdenum 0.30 - 0.65 0.41
Vanadiipi 0.05 - 0.10 0.08
Titanium 0.02 Max 0.005
20

TABLE 2CHEMICAL COMPOSITION OF HY-130 ELECTRODE WIRES (WT%)
Element Linde 151140 LTEC 140005
Carbon 0.099 0.076
Manganese 1.59 1.55
Phosphorus 0.004 0.004
Sulfur 0.008 0.002
Silicon 0.38 0.39
Copper 0.054 0.031
Nickel 2.67 2.47
Chromium 0.69 0.73
Molybdenum 0.95 0.80
Vanadium 0.003 0.003
Titanium 0.012 0.016
Zirconium 0.004 0.002
Aluminum 0.006 0.005
Oxygen 0.056 0.022
Nitrogen 0.004 0.008
21
TABLE 3WELDING CONDITIONS EMPLOYED
Condition Sample W2 Sample W6 Sample W58 Sample W60
Electrode Wire(1.14 mm diameter) Linde 151140 Linde 151140 LTEC 140005 LTEC 140005
Travel Speed(mm/sec) 8.5 4.2 8.5 4.2
Heat Input(kJ/mm) 0.79 1.61 0.79 1.61
Cooling Rate(oC/sec) 38.6 13.0 38.6 13.0
Current(amps) 260 260 260 260
Voltage(Volts) 26 26 26 26
Preheat/InterpassTemperature (0C) 65 - 93 65 - 93 65 - 93 65 - 93
Shielding Gas M2* M2* M2* M2*
* 98% argon, 2% oxygen
22
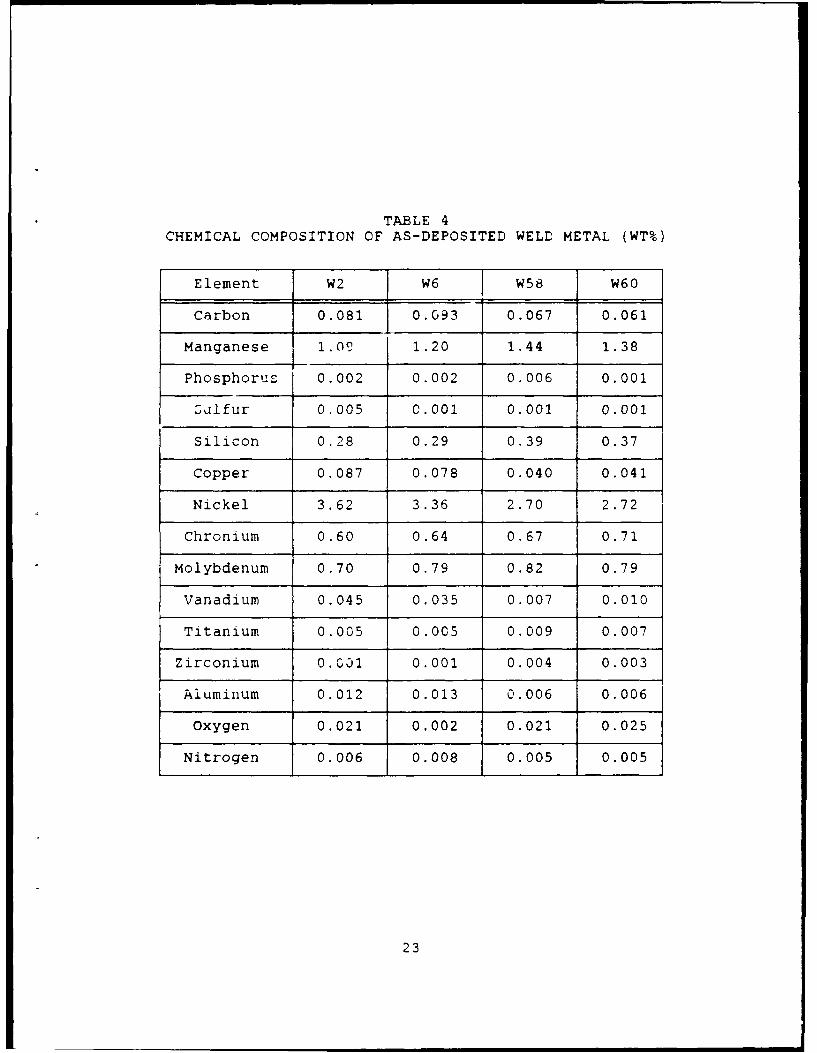
TABLE 4CHEMICAL COMPOSITION OF AS-DEPOSITED WELD METAL (WT%)
Element W2 W6 W58 W60
Carbon 0.081 0.093 0.067 0.061
Manganese l.O? 1.20 1.44 1.38
Phosphorus 0.002 0.002 0.006 0.001
3alfur 0.005 0.001 0.001 0.001
Silicon 0.28 0.29 0.39 0.37
Copper 0.087 0.078 0.040 0.041
Nickel 3.62 3.36 2.70 2.72
Chronium 0.60 0.64 0.67 0.71
Molybdenum 0.70 0.79 0.82 0.79
Vanadium 0.045 0.035 0.007 0.010
Titanium 0.005 0.005 0.009 0.007
Zirconium 0.C0i1 0.001 0.004 0.003
Aluminum 0.012 0.013 0.006 0.006
Oxygen 0.021 0.002 0.021 0.025
Nitrogen 0.006 0.008 0.005 0.005
23

C. MECHANICAL PROPERTIES
1. Hardness Testing
Rockwell C hardness measurements were recorded using
a Wilson Rockwell hardness tester with a 150 kg load and a
brale indentor. Rockwell hardness values are based on the
average of at least three indentations at random locations
within each weld pass.
For microhardness measurements, the macrosample
slices were cut to remove the backing plate and the remainder
of the base metal. A diamond wafering saw was used to cut a
slice about 6 mm thick from each sample perpendicular to the
weld direction. Each slice was mounted in a cylindrical mold
using a fast cure acrylic with the diamond cut side expcsed,
polished by standard metallographic techniques and etched for
15 seconds in 2% Nital to reveal the weld passes. A line was
scribed on each sample as a reference for locating
microhardness marks and identifying location (Figures 1-4).
A Buehler micromet microhardness tester with a 300g load, a
diamond pyramid indeiitor and a 600X optical system was used
to measure the Vickers hardness at 0.2 mm intervals along the
four scribe lines.
2. Tensile and Impact Testing
Tensile and impact testing for the base plate as well
as for the weld metal from each weldment was performed by
DTNSRDC. The tensile properties were determined by duplicate
tests on longitudinal 8.9 mm diameter specimens taken from
24

the weld metal region. The specimens and procedures conform
to type R-3 of MIL-STD-418c (Ref. 31. Standard Charpy V-
notch (CVN) specimens were used to evaluate the impact
toughness of Lht: base pidtt and Lhe weldments at -17.80C and
0°C respectively.
D. MICROSTRUCTURAL CHARACTERIZATION
1. Optical Microscopy
A Zeiss 1CM 405 Photomicroscope was used for optical
analysis. The mounted samples used for microhardness testing
were repolished and etched for 45 seconds in 2% Nital.
Micrographs at 500X and 100OX were taken at the high, low and
average hardness points along the scribe lines. In addition,
optical micrographs at random locations within the last weld
pass were taken at both 50OX and 100OX. Oberhoffer's
solution [Ref. 27] with the following chemical composition:
* FeCI3 30g
* CuCI2 Ig
* SnCl 0.5g
* HCI 50ml
* CHOH 500ml
* H2 0 500ml
was used as an etchant for 1 minute and 15 seconds to reveal
the cellular-dendritic solidification structure. After
repolishing, the grain solidification structures of Samples
W58 and W60 were photographed using 2% Nital for 45 seconds
as the etchant.
25

2. Scanning Electron Microscopy
The specimens were removed from their acrylic mounts
and placed on a tray in the vacuum chamber of a Cambridge
Stereo Scan S4-10 Scanning Electron Microscope (SEM). The
stage was tilted 10 degrees from horizontal to improve
resolution. The microhardness indentations were again used
as reference points to take micrographs at approximately
2000X near the points corresponding to the low, average and
high hardness for each sample.
3. Transmission Electron Microscopy
After the 6 mm slice for microhardness had been
removed from a sample using the diamond wafering saw, a
second cut was made to produce a slice approximately 0.3 mm
thick. This slice was glued to an aluminum block and ground
to a thickness of approximately 0.15 mm using 400 and 600
grade silicon carbide paper. Each thinned slice was etched
about 15 seconds in 2% Nital to reveal the weld passes and 3
mm diameter disks were mechanically punched from the material
of the last weld pass. The last weld pass was selected for
TEM examination because it was expected to be the location of
the most significant differences in the microstructure
between the four samples. The disks were then carefully
ground on 600 grade silicon carbide paper to a thickness of
approximately 0.08 mm to remove any corrosion layer and to
provide a uniform thickness. Final thinning was performed in
a Streurs Tenupoi electropolishing device with a 10'2.
26
perchloric acid - 90% glacial acetic acid solution as
electrolyte at an applied voltage of 50 volts and a current
of 180 mA and a temperature of 130C. The foils were examined
with a JEOL-1K3 CX Transmission Electron Microscope operating
at 120 KV.
27
IV. RESULTS
A. MECHANICAL TESTING
1. Hardness Testing
Values of Rockwell C hardness for each weld pass in
all four samples as identified in Figures 1-4 are listed in
Table 5. These hardness measurements generally increase from
weld pass ti to the highest numbered weld pass; this trend is
very clear for the higher heat input samples, W6 and W60.
The highest hardness corresponds with the highest numbered
weld pass, except in the case of Sample W2. The higher
Rockwell hardness reading measured in pass _13 of Sample W2
as compared to pass #14 indicates that pass :13 was probably
the last pass for this sample, not pass #14 as originally
assumed. The hardness of the base metal was nearly identical
for all weldments, as anticipated, because they were all
fabricated from the same plate. The two welds with the low
heat input, Samples W2 and W58, had a similar average
hardness, while the high heat input welds both had a lower
hardness. The average hardness of Sample W60 was
significantly lower than the other three.
Vickers microhardness measurements from the weld
crown area down toward the root area for the traverses
indicated in Figures 1-4 are illustrated in Figures 5-8. The
distance indicated in Figures 5-8 is measured from the
starting point S. The traverse paths were selected to
28

TABLE 5ROCKWELL C HARDNESS MEASUREMENTS
Weld Pass
Number W2 W6 W58 W60
1 34.8 31.0 34.7 32.0
2 34.0 32.8 34.7 29.7
3 36.0 31.6 34.5 30.3
4 34.0 32.8 34.0 31.3
5 34.3 33.5 34.0 32.7
6 36.3 34.5 34.0 33.0
7 34.5 34.5 34.3 33.0
8 34.5 37.0 34.7 33.5
9 33.5 --- 34.0 ---
10 34.3 --- 35.3 ---
11 34.5 --- 35.0 ---
12 33.0 --- 35.3 ---
13 39.0 --- 34.0 ---
14 33.3 --- 34.3 ---
15 ...... 37 .3 ---
Average 34.7 33.4 34.7 31.9
29

include at least three weld passes, one of which was assumed
to be the last pass completed in the welding process. The
low, average and high hardness indentations for each sample
were recorded and used for microstructural analysis.
Hardness drops of 20 - 60 VHN typically occurred as
the traverse went from the heat affected zone of one pass to
a previous pass. Point A in Figures 5-8 marks the
approximate passage from the heat affected zone of the crown
weld pass to one of the previous passes. Points B and C in
Figures 5-8 likewise indicate the passage from one heat zone
to a previous zone. Point D in Figure 7 is where a fourth
drop in hardness was recorded, due primarily to the fact that
Sample W58 had more weld passes than any other sample.
Sample W58 exhibited the highest average hardness in the
highest numbered weld pass followed by W6, W2 and finally
W60. An identical order was seen for the complete traverse
average hardness. The peak hardness in the highest numbered
weld pass was significantly higher than the peak hardness
recorded in earlier passes, except for Sample W2.
2. Tensile and Impact Testing
The results of the tensile and impact tests performed
by DTNSRDC for the base plate and the weldments are presented
in Table 6. Sample W2 exhibited the highest strength and
impact toughness; both values exceeded the specifications,
although the specification temperature and the experimental
temperature for Sample W2 were not the same. Sample W2
30

TABLE 6MECHANICAL PROPERTIES OF BASE PLATE AND WELDMENTS
Reduction CVN(J)Identification 0.2% offset YS UTS Elongation in Area
(MPa) (MPa) M% W% 0OC -180C
HY-130 PlateSpecifications(MIL-S-24371A) 896 - 14 ---- 81.4
Base Plate 959 1034 23 68.5 - 103.1
W-2 982.5 1041 20 62.5 93.6 --
W-6 923.9 965 24 66.0 79.6 --
W-58944.6 1082 21 62.5 74.1 --
W-60789.5 1069 18 64.0 78.2 --
31

showed a yield strength 2.5% higher than the base plate, but
an impact energy at least 9% less. The other thre- samples
had low impact energy in relation to the specification and
Sample W60 fell short of the strength requirement as well.
All samples had acceptable percent elongation and similar
reduction in area values.
B. MICROSTRUCTURAL CHARACTERIZATION
1. Solidification Microstructure
Figures 9-12 are montages constructed of optical
micrographs taken using Oberhoffer's solution to show the
dendritic solidification structure for each sample. The
coarse beads of Samples W6 and W60 are indicative of the
higher heat input associated with them as compared to the
finer beads of Samples W2 and W58. Figures 9-12 all show
dendritic growth from the fusion line toward the centerlin.e
essentially perpendicular to the maximum temperature gradient
in the weld pool. The solidification structure appears fn
and equiaxed in the papilla and in the corners near the
fusion line where the cooling rate is expected to be the
highest. Growth appears more cellular and primarily vertical
at the centerline, especially visible in Figure 12. Some
banding, probably banding of martensite [Ref. 12], parallel
to the fusion line is also visible, particularly within the
papilla.
A 2% Nital etchant was used in preparing Figures 13
and 14 which are optical m;crograph montages showing the
32

grain scladification structure for Samples W58 and W60,
representative of each heat input. Large columnar grains
growing perpendicular to the fusion line can be seen in both
figures; the grains are finer in the papilla due to a higher
cooling rate. These grains probably formed epitaxially from
the austenite grains just outside the fusion line of the last
weld pass. Some grain refinement in the HAZ (weld metal from
previous passes) is visible, particularly near the papilla in
Figure 13. Some smaller, equiaxed grains are visible right
at the top of the weld pass in Figure 14, possibly due tc the
heterogeneous nucleation of new austenite grains on non-
metalllc inclusions near the surface of the weld [Ref. 121.
In contrast, the nearly vertical grains near the centerline
are wide and very long in both grain structure montages.
2. Optical and Scanning Electron Microscopy
Optical microscopy showed very few differences
between the microstructures of the four samples, hence only
one representative optical micrograph taken near the center
of the highest numbered weld pass for each sample is included
in this report. On the other hand, some refinements in the
microstructure can be seen by SEM so one micrograph at
approximately 2000X for each sample at the low, average and
high hardness is presented.
a. Sample W2
Figure 15 is an optical micrograph of Sample W2
showing the primarily fine martensiti- microstructure of the
33

weld. Some polygonal ferrite (the small white islands) can
be seen and bainite may also be present, but it could not be
readily distinguished by the etching treatment.
SEM analysis revealed the martensitic structure
more clearly with some prior austenite grain boundaries
visible along with a dispersion of carbides throughout the
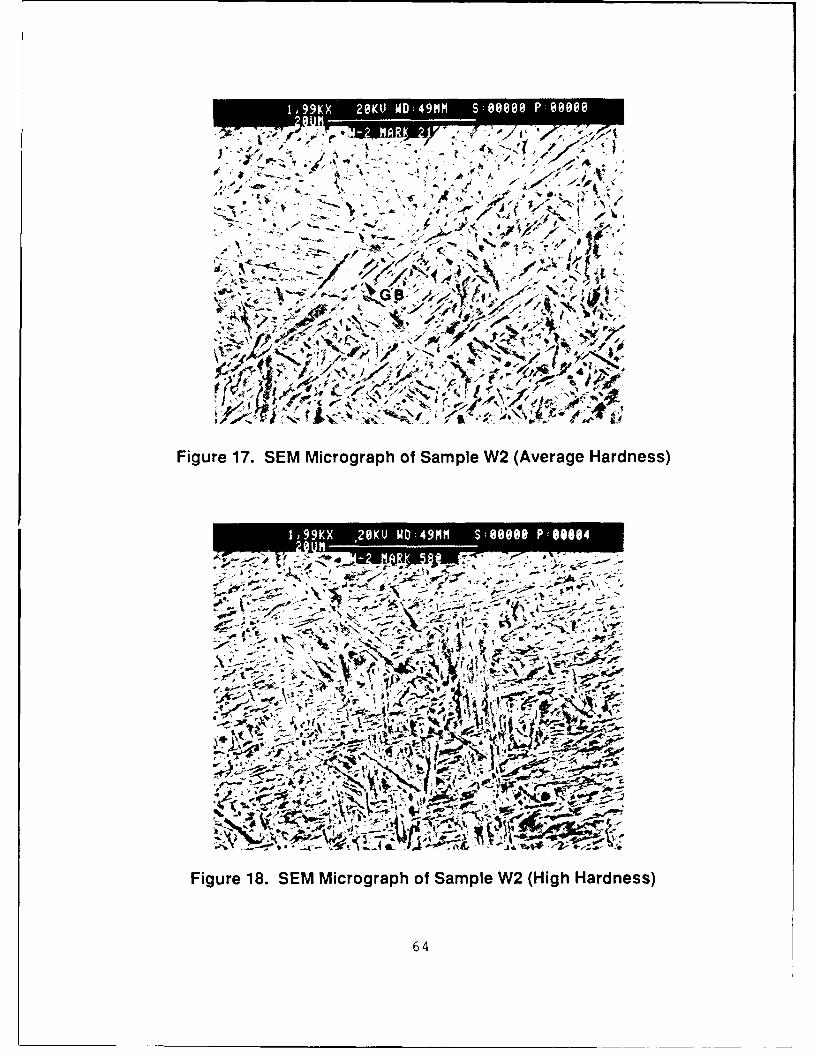
microstructure. Figures 16-18 were taken near the lowest,
average and highest recorded Vickers microhardness
indentations of Sample W2. The matrix in Figure 18 (highest
hardness) appears significantly finer than the matrix in
Figure 16 or 17, while the morphology in Figures 16 and 17
seems to be similar. The arrows and the "GB" in Figures 16
and 27 indicate visible prior austenite grain boundaries.
The triangular shaped regions in Figure 16 are packets
containing parallel laths of martensite. The dark polygonal
regions visible could be polygonal ferrite.
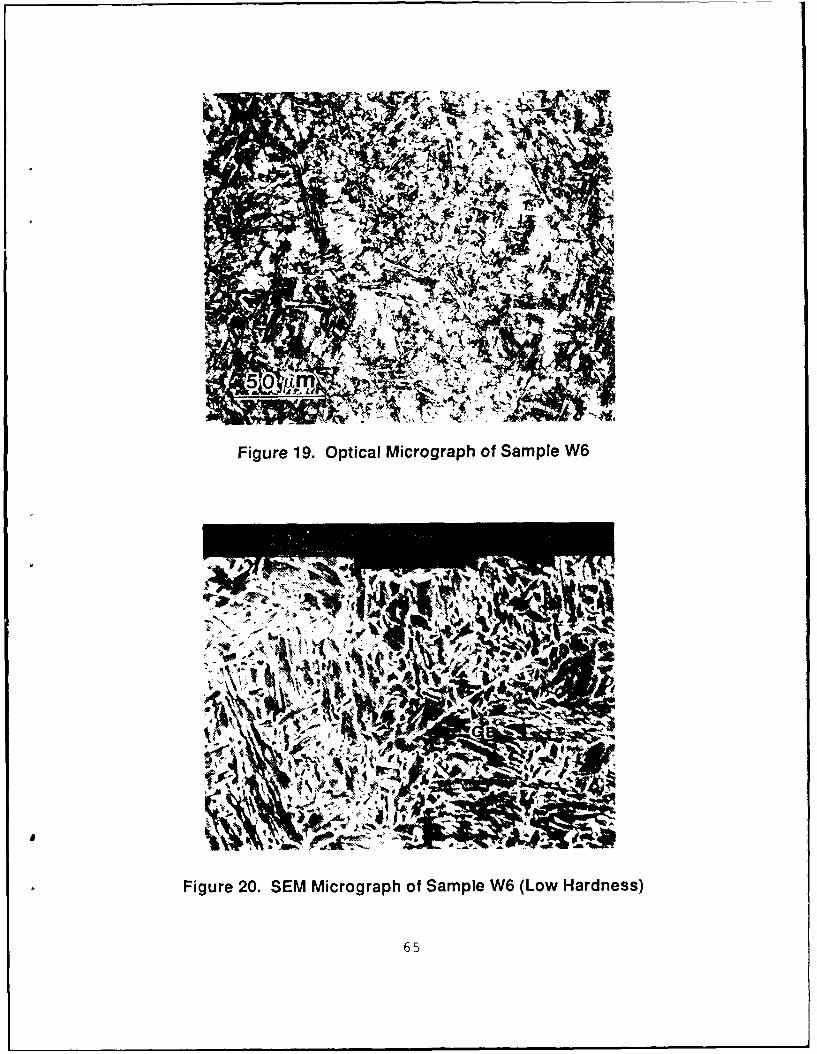
b. Sample W6
The optical micrograph of Sample W6 presented as
Figure 19 shows a coarser microstructure with more polygonal
ferrite than in Figure 15 for Sample W2. The acicular
morphology is not as pronounced as it is in Figure 15.
Figures 20-22 are SEM micrographs similar to the SEM
micrographs for Sample W2, but any microstructural refinement
existing along the low to high hardness range is not as
visible here. An inclusion (I) can be seen in Figure 21.
34

c. Sample W58
Figure 23, an optical micrograph of Sample W58,
is similar to Figure 19 for Sample W6. Again, a primarily
martensitic microstructure with some polygonal ferrite was
observed. SEM micrographs of Sample W58, Figures 23-26, show
refinement of the microstructure corresponding to increases
in microhardness; grain boundaries and inclusions are also
visible in these micrographs. Figure 26 shows very well
defined martensitic laths.
d. Sample W60
No significant differences between Figure 27, an
optical micrograph of Sample W60, and the optical micrographs
for Samples W6 and W58 at 500X are visible. However, Sample
W2 seems to have a finer microstructure and contained less
polygonal ferrite than the other three. The finer morphology
associated with higher microhardness is apparent again in
Figures 28-30. More grain boundaries can be seen and the
largest inclusion observed at 2000X is visible in Figure 29.
3. Transmission Electron Microscopy
TEM analysis was conducted to further understand and
characterize the weld metal microstructures present in the
four samples. The observation and quantification of
microstructural differences relied heavily on TEM because
optical and SEM analyses were inconclusive. The TEM
micrographs at 15,000-54,OOOX presented here are
representative of the microstructures observed.
35

a. Sample W2
Thin foil electron micrographs for weld pass #14
revealed a predominantly martensitic microstructure
(dislocated lath and twinned martensite) with a high density
of non-metallic inclusions and a large amount of retained
austenite located preferentially between the lath boundaries.
Small amounts of bainite, autotempered martensite and
polygonal ferrite along with islands of tempered high carbon
martensite and/or martenite-austenite particles were also
present. An examination of weld pass t13 showed a similar
microstructure, except no islands of tempered high carbon
martensite were observed (this was the last weld pass so it
received no thermal cycling from subsequent weld passes).
Figures 31 and 32 are micrographs from weld pass
=13 of Sample W2. Figure 31 illustrates an island of
polygonal ferrite between highly dislocated
martensite/ferrite laths. The double arrows in Figure 32
point to second phase particles, probably martensite-
austenite or high carbon martensite. These second phase
particles seemed to exist predominantly along lath boundaries
and at triple point junctions in the matrix.
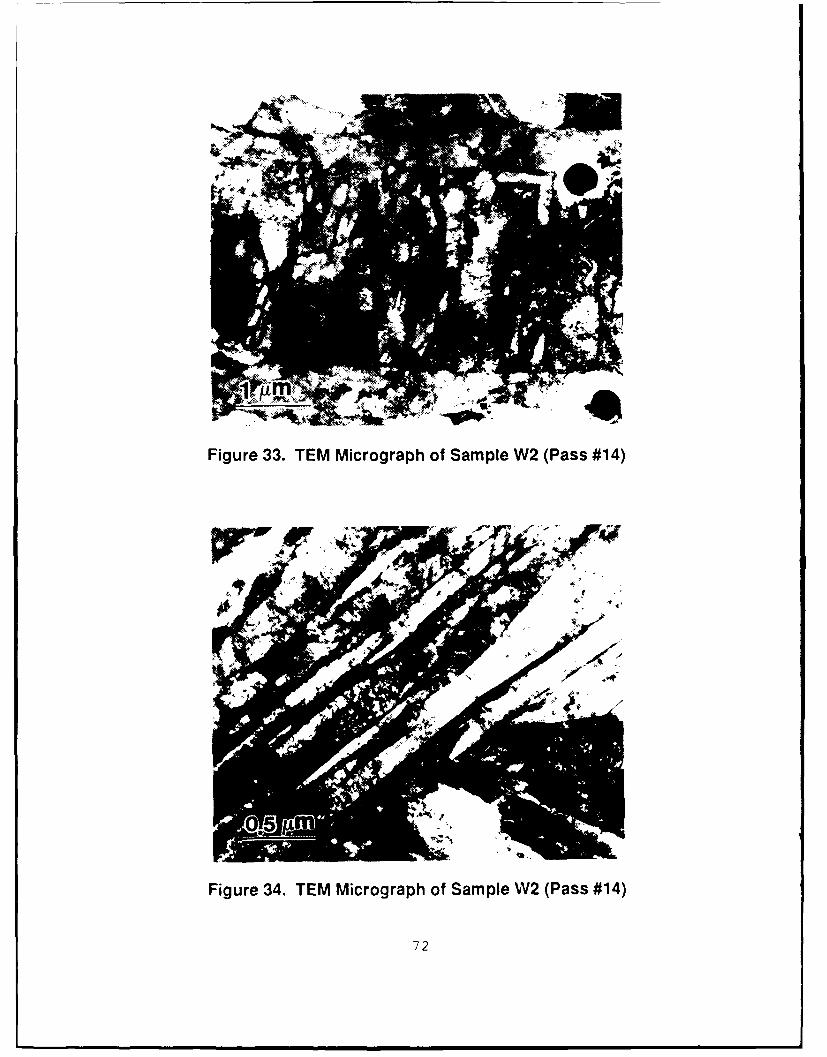
Figures 33-40 are TEM micrographs of various
microstructures observed in weld pass #14. Packets of
parallel, highly dislocated laths of martensite separated by
low angle grain boundaries can be seen in Figure 33. A
second phase, probably retained austenite, was observed
36
between the laths. The ferrite laths perpendicular to the
martensite packet in the center of Figure 33 appear to have
nucleated on the two inclusions near the right. The second
phase between the laths is better resolved in Figure 34 due
to the higher magnification. A cluster of inclusions can be
seen in Figure 35; they are most likely primarily manganese
and silicon oxides formed during the welding process [Ref.
12]. Figure 36 clearly shows lower bainite with the
intragranular cementite (C) particles exhibiting a preferred
crystallographic orientation. The double arrows in the upper
left point to a dark colored second phase region, probably
high carbon tempered martensite (tempered by the thermal
cycling experienced in this weld pass).
Figure 37 illustrates some twinned martensite
(T), more common within the microstructure of Sample W2 than
any other sample. These twins appear to be located on or
near a prior austenite grain boundary. Figure 38 shows a
high magnification view of the carbon rich second phase,
probably tempered martensite, identified previously in Figure
36. Figures 39 and 40 are bright and dark field TEM
micrographs included to confirm the presence of retained
austenite between the ferrite laths.
b. Sample W6
Sample W6 exhibited a predominantly bainitic
microstructure with some large autotempered martensite laths
containing fine cementite particles within the laths and a
37
high density of inclusions. Smaller amounts of martensite-
austenite particles, dislocated lath martensite, retained
austenite and lath ferrite were also observed. Figure 41
shows single ferrite laths essentially perpendicular to
adjacent packets of lath ferrite. Figure 42 illustrates
autotempered martensite with some twinned martensite. The
double arrows in Figure 43 denote the location of a second
phase, probably martensite-austenite. Figure 44 shows
twinned martensite and a large spherical inclusion.
c. Sample W58
The primarily bainitic microstructure observed
for Sample W58 contained a large number of second phase
particles, significant amounts of retained austenite between
the ferrite laths and some lath martensite. The ferrite
laths were decorated with the second phase particles, assumed
to be martensite-austenite or high carbon martensite. Sample
W58 also had a significantly lower inclusion density than
either Sample W2 or W6 and it contained very little
autotempered martensite. Figure 45 depicts a lath ferrite
structure with a high dislocation density and several second
phase particles as marked by the double arrows. Figure 46
shows a stringer of various sized inclusions along with a
rare completely twinned martensite lath. Figures 47 and 48
are bright and dark field micrographs of one location
included to show the presence of retained austenite between
the martensite/ferrite laths.
38

d. Sample W60
Sample W60 had a bainitic microstructure with a
large amount of lath ferrite, coarser than observed for any
other sample. The inclusion density was similar to Sample
W58, but much lower than seen in Samples W2 and W6. Sample
W60 also had more autotempered martensite than Sample W2 or
W58. Parallel ferrite laths separated by small regions of
retained austenite are visible in Figure 49. Some of the
ferrite laths in Figure 50 may have nucleated on the
spherical inclusions shown. Figure 51 clearly illustrates
autotempered martensite, most frequently observed in the
higher heat input weldments (W6 and W58), along with some
twins. Figure 52 illustrates a lower bainite structure on
t'he right side of the micr 'lraph with cementite precipitated
within the lath. However, the lower bainite observed here is
not as clearly defined as in Figure 36 for Sample W2.
e. TEM Microstructure Summary
A relative order of microconstituents observed in
the four samples was determined based on a qualitative TEM
analysis. The results of this analysis are presented as
Table 7. The quantities associated with each sample are
based on a comparison of relative amounts between the samples
using at least five foils for each, not on quantitative
measurements of the fractions of the microconstituents
present. This summary does not provide conclusive evidence
of the microstructure present for the entire weld of each
39

0 E 0 0
V 0
>, >
S E E E 0
E 0 E -
Eo 0
~~0 0 0
~1-J 0 CD
C,, c E
cc Eo (L
0 40

sample, but it does represent an accurate analysis for the
last weld pass of each sample.
4. Inclusion Size
Approximately 100 inclusions, ranging in size from
0.16 - 1.26 .s, were measured for each sample from TEM
micrographs. The values measured were grouped into blocks
0.1 p wide for the histograms presented as Figures 51-54.
The histograms show Sample W2 had the smallest average size
and the smallest size range. Sample W6 exhibited the largest
average sized inclusions, while Sample W58 had the largest
size range.
41
V. DISCUSSION
The primary emphasis of this study was to identify
microstructural differences between the four weldments
examined. Optical microscopy and SEM did not prove
particularly revealing in characterizing the fine
microstructures present in the weld metal. Microstructures
appearing very similar by optical and SEM metallography were
often quite different when observed by TEM. Hence, TEM
observations are heavily relied upon in this analysis of the
results.
A. MICROSTRUCTURE
The microstructure observations for all four samples are
in general agreement with observations of other HY-130
researchers. A lath martensite/ferrite structure with thin
film interlath retained austenite and some twinned martensite
with no carbides between the laths was observed in various
volume fractions in all four weldments (Table 7). This
structure is similar to the HY-130 weld metal microstructures
observed by Challenger et al. [Ref. 2]. Although twinned
martensite is generally seen only when the carbon content is
greater than 0.15 wt%, its presence in these HY-130 weldments
(carbon content <0.10 wt%) can be explained. Challenger et
al. [Ref. 2] attributed twinned martensite observed in HY-130
weld metal to carbon segregation during transformation.
42

Islands of high carbon tempered martensite were observed
only in weld pass #14 (the next to the last pass) of Sample
W2 due to thermal cycling from pass #13. This tempering
should improve ductility and increase toughness as compared
to weld pass #13 (the last pass). Only the final weld pass
of each of the other samples was observed using TEM, so
tempered martensite was not searched for in other samples.
Thin films of interlath retained austenite were detected
in TEM micrographs of all four samples. Thomas [Ref. 8] also
reports observations of retained austenite existing as very
thin films between the martensite laths only by TEM. A
microduplex structure of lath martensite and thin film
interlath retained austenite was reported to produce a good
combination of strength and toughness in Fe/Cr/C base steels
[Ref. 18]. This structure, observed most significantly in
Sample W2 (Table 7), appears to be responsible for the high
strength and toughness recorded for Sample W2 (Table 6).
Analysis of weld pass =14 of Sample W2 showed relatively high
amounts of interlath retained austenite (similar to pass #13)
suggesting that the retained austeni-e present is essentially
stable under significant thermal cycling conditions.
The effect of retained austenite on hydrogen assisted
cracking in martensitic steels is still controversial. Kim
et al. [Ref. 21] associated increased susceptibility to
hydrogen embrittlement with the presence of unstable
interlath retained austenite. Ritchie et al. [Ref. 201
43

report that retained austenite reduces SCC crack velocity by
lowering susceptibility to hydrogen embrittlement. Based on
the higher amounts of retained austenite observed in Samples
W2 and W58 (Table 7), the lower heat input may produce a
lower susceptibility to hydrogen embrittlement, assuming the
retained austenite is stable as indicated above.
Palko et al. [Ref. 15] suggested a tempered
microstructure containing a minimum of 60-75% martensite to
achieve the specified properties for HY-130 steel. Sample W2
contained the highest percentage of martensitic structures
which appears to correlate well with the attainment of the
specified strength and toughness.
Glover et al. [Ref. 6] report that poor impact toughness
in welds may be compounded by the fcrmation of high carbon
martensite-austenite particles on ferrite boundaries where
they can act as efficient crack nucleation sites. Sample W2
exhibited good toughness in spite of the observation of
significant amounts of martensite-austenite particles and
islands of high carbon tempered martensite along lath
boundaries. However, the toughness of Sample W2 might have
been higher if the martensite-austenite particles had
comprised a lower volume fraction.
The observation of higher amounts of twinned martensite
in Sample W2 may be the main area of concern in choosing
Sample W2 as the best weldment of the four studied. Chen et
al. [Ref. 16] have identified twinned martensite as one of
44

the microstructures most susceptible to hydrogen induced
cracking and SCC. Although the strength and impact toughness
of Sample W2 are far superior to the other three samples, the
desirability of this weld in service may be reduced by
possible hydrogen related and SCC problems.
B. EFFECT OF HEAT INPUT
The lower heat input (higher cooling rate) produced finer
microstructures, more low temperature transformation
products, less ferrite and less autotempered martensite
(Table 7). The welds with higher cooling rates (Samples W2
and W581 had significantly more lath martensite and retained
austenite than the other two. This observation is in
agreement with several previous reports [Refs. 6, 10 and 221.
ASTM Publication 494 [Ref. 24] specifies a minimum cooling
rate of 16.7C/sec for HY-130 to provide acceptable yield
strergth in the weld metal. Samples W6 and W60 (cooling rate
of 13.0 0 C/sec) were slightly below the minimum specified
cooling rate which provides one reason for the lower yield
strengths measured for these weldments.
From Table 6, the lower heat input can be associated
directly with higher yield strength. Relatively high amounts
of very hard high carbon martensite and/or martensite-
austenite were observed in the low heat input samples. Biss
and Cryderman [Ref. 9] report that martensite-austenite can
cause poor impact properties and lower yield strength in low
carbon steels. It is not possible to draw a similar
45

conclusion from the results of this analysis since no obvious
trend in toughness was observed and the higher martensite-
austenite volume fractions were associated with higher yield
strengths. However, the presence of higher amounts of
martensite-austenite may explain the relatively high
microhardness values measured for Sample W58.
The larger number of weld beads in a similar cross-
sectional area resulting in additional thermal cycling at the
higher cooling rate contributed to microstructural refinement
and a more uniform hardness in the weld metal for Samples W2
and W58. The refinement and homogenization provided by
thermal cycling should improve mechanical properties and
promote ductile fracture [Ref. 16]. Tempering treatment
provided by multipass welding (most signilficant at lower heat
inputs) may increase impact energy and yield strength
associated with the precipitation of fine, intralath carbides
from the martensite [Ref. 18]. If any carbides existed in
the tempered martensite observed in weld pass z.4 of Sample
W2, they were not resolved by TEM. However, fine intralath
carbides were observed in the autotempered martensite
microstructure most prevalent in Sample W6. Temper
embrittlement often observed near 260 0 C is due to the
precipitation of film-like carbides on prior austenite grain
boundaries and sub-boundaries [Ref. 19]. Although no tests
were conducted to determine temper embrittlement, this may
46
not be a problem in any of the samples because no carbides
were cbserved between the laths.
The higher cooling rate may be responsible for the higher
amounts of retained austenite observed in Samples W2 and W58.
This observation 's based on the findings of Sarikaya et al.
[Ref. 18] who report that multiple heat treatments provided
by thermal cycling from subsequent weld passes can produce a
compositionally homogeneous structure, grain refinement and
increased amounts ci retained austenite.
Conncr et al. [Ref. 17] report lower porosity and lower
hydrogen entrapment as additicnei benefits of a lcwer heat
input based on a shallower weld pocl and shorter diffusion
distances. Porosity and hydrogen content were Pot measured
in this study, but they are assumed lower in Samples W2 and
W58 based on the observations of Conner et al.
C. EFFECT OF COMPOSITION
The carbon and oxygen contents seem to be the most
significant differences between the two electrodes used in
this analysis (Table 2). The higher carbon content of
electrode Linde 151140 is expected to lower the M.
temperature and push the austenite transformation to longer
times. According to Easterling [Ref. 5], austenite
stabilizers (C, N, Mn, Ni, Cu) push transformation to longer
times and enhance the formation of low temperature products
such as bainite and martensite. The M, temperatures, based
47

on the electrode compositions using Andrews' empirically
determined formula [Ref. 26], are as follows:
* Electrode Linde 151140 M. = 403.5 0C
* Electrode LTEC 140005 M. = 421.1 0C
A lower M. temperature enhanced the formation of martensite
and helped stabilize the austenite so more retained austenite
was observed in Samples W2 and W6. The lower M. temperatures
obtained using electrode Linde 151140 should also produce a
finer micrcstructure.
The higher oxygen content of electrode Linde 151140 is
assumed responsible for the significantly higher density of
non-metallic inclusions observed in Samples W2 and W6 as
compared to Samples W58 and W60. Grong and Matlock [Ref. 12]
report that nucleation of acicular ferrite on inclusions is
always more favorable than homogeneous nucleation, regardless
of the inclusion size. The exact effect of this higher
inclusion density is uncertain, but it appears that the
inclusions may have acted as lath nucleation sites. Hence,
microstructural refinement for Sample W2 as compared to
Sample W58 and for Sample W6 as compared to Sample W60 may be
explained.
The weld metal inclusions measured had average diameters
less than 1 micron for all samples. This is similar to an
observation previously reported by Grong and Matlock [Ref.
12]. They also report an increase in inclusion diameter with
increasing heat input. Samples W6 and W60 (higher heat
48

input) had larger inclusions than Samples W2 and W58. Farrar
and Harrison [Ref. 10] observed that smaller inclusions may
pin austenite grain boundaries, thus restricting grain size
and providing good nucleation sites for polygonal ferrite.
Grong and Matlock [Ref. 12] report that inclusions with
diameters from 0.4-1.0 micron are the most potent nucleation
sites for acicular ferrite. No direct correlation of
inclusion diameter with the amounts of acicular ferrite
and/or polygonal ferrite formed were made in this study.
Sarikaya et al. [Ref. 18] associated inferior toughness
properties with a high density of large oxide particles in an
air melted 2 wt% nickel allcy steel. The higher density of
relatively large inclusions observed in Sample W6 acting as
crack nucleation sites may be responsible for the lower
impact toughness in this sample (Table 6).
49

VI. CONCLUSIONS
A microduplex structure of lath martensite and thin filminterlath retained austenite is associated with higherstrength and toughness in the thin section HY-130weldments examined.
The lower heat input (0.79 kJ/mm as compared to 1.61kJ/mm) produced finer weld beads, microstructuralrefinement and a more uniform hardness.
* The electrode with a higher carbon content lowered theM. temperature, assisted in the formation of more lathmartensite and stabilized the austenite.
Sample W2, exhibiting the highest strength and impacttoughness of the four weldments examined, containedlarger amounts of low temperature transformationproducts than the other samples. The lower heat inputin combination with the higher carbon content electrodeproduced more of the microduplex structure than observedin any other sample.
50
VII. RECOMMENDATIONS
This study concentrated on the effects of two welding
variables. In order to develop a complete set of welding
procedures for thin section HY-130 GMAW weldments, additional
studies are needed. A detailed microstructural
characterization of additional thin section HY-130 GMAW
weldments fabricated with electrode Linde 151140 using at
least three different heat inputs between 0.79 and 1.61 kJ/mm
is required. This is particularly important in minimizing
costs since larger weld beads mean fewer weld passes and less
time spent in the welding process. The work performed by
Connor et al. [Ref. 17] would provide significant assistance
in designing additional studies based on the mechanical
property results they have reported for a wide variety of
thin section HY-130 weldments.
Based on the discussion concerning twinned martensite and
retained austenite, several unanswered questions remain about
the susceptibility of Sample W2 to SCC and hydrogen related
problems. Therefore, a further study of the susceptibility
of Sample W2 to hydrogen assisted cracking and SCC as
compared to HY-130 base plate is also recommended. The work
reported by Chen et al. [Ref. 16] would serve as a guide in
planning this study.
51

APPENDIX
FIGURES
52

Figure 1. Macrosample of Weidment W2
B
Figure 2. Macrosample of Weld ment W6
53

Figure 3. Macrosample of Weidment W58
Figure 4. Macrosample of Weidment W60
54

380 -
Heat Input =0.79 kJ/mmCoolinig Rate = 38.6 Osec
_____________________ ______________________C om plete T raverse360 ------ Avg. Hardness =341 VHN
Weld P- ass #4320 (Avg. Hardness =349 VHN
280 -r-*i- r 1
0 2 4 6 8 10 1'2 14 1 6 18Distance (mm)
Figure 5. Microhardness Profile for W2
400- _____ -He at Input =1.61 kJ/mrn
Cooling Rate = 13.0 C/sec____ _____ Complete Traverse
Average Hardness =346 VHNZ
(Average Hardness =370 VHN)-o 340
=t320 _ _ _ _ _
>
V 280 - r C
0 2 4 6 8 10 12 14 16 18Distance (mm)
Figure 6. Microhardness Profile for W6

Heat Input =0.79 kJ/mmCooling Rate = 38.6 C/sec
400 -Complete Traverse_ Average Hardness =370 VHN
i> 380
, 360 Weld Pass'#15 --
(Avg. Hardness =389 VHN) 1'- 340 __ __
320.........
A jB
0 2 4 6 8 1 0 12 1 4 1 6 1 8Distance (mm)
Figure 7. Microhardness Profile for W58
Heat'lnput = 1'.61 kJ/mm
Cooling Rate =13.0 C/sec360__- Complete Traverse
AverageHardness =331 VHN
320 Weld Pass #8(Average Hardness =345 VHN)
>I B
260 ~r--0 2 4 6 8 10 12 14 1 6
Distance (mm)Figure 8. Microhardness Profile for W60
56

&I 3-
Figure 9. Dendritic Solidification Structure of Sample W2
57

Figure 10. Dendritic Solidification Structure of Sample W6
58
iA
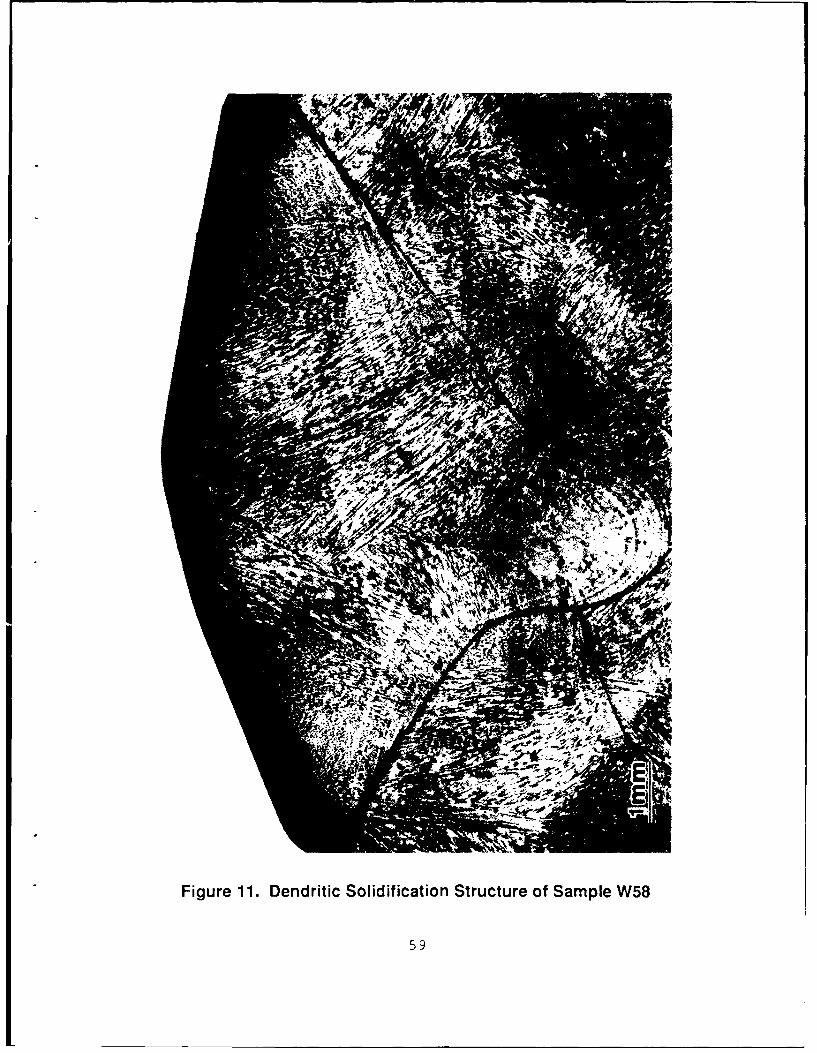
Figure 11. Dendritic Solidification Structure of Sample W58
59

Figure 12. Dendritic Solidification Structure of Sample W60
60

AL'
Figure 13. Grain Solidification Structure of Sample W58
61

•9 !
Figure 14. Grain Solidification Structure of Sample W60
62

AA
Figure 15. Optical Micrograph of Sample W2
1,99KX* 28 VW : M S:0 0 :00
4 4 4
lit%% fJ
,Z
7 eltr' Jtep
Figure~~~~ ~ ~ ~ 16 .irorp fSapeW Lo ades
"'(4 A t~y N '- **t*463
/- M
4 ~ ~ r -_jA- ~''
17,
Pv1 -r 6
-rr
4'-4
Figure 1. SEM Micrograph of Sample W2 (Hierg Hardness)
1464
iz4 44
7%
Figure 19. Optical Micrograph of Sample W6
11
Figure 20. SEM Micrograph of Sample W6 (Low Hardness)
65

Figure 21. SEM Micrograph of Sample W6 (Average Hardness)
2 P2K 20VWD2 S 0000 P 7,40
6- MAR 72 *A
V,'~ ~T>
* w4-
Figure 22. SEM Micrograph of Sample W6 (High Hardness)
66

Figure 23. Optical Micrograph of Sample W58
7igure 24. SEM Micrograph of Sample W58 (Low Hardness)
67

Figure 25. SEM Micrograph of Sample W58 (Average Hardness)
Figure 26. SEM Micrograph of Sample W58 (High Hardness)
68

Figure 27. optical Micrograph of Sample W60
4
Figure 28. SEM Micrograph of Sample W60 (Low Hardness)
69

'41,
.17.h P.
Figure 29. SEM Micrograph of Sample W60 (Average Hardness)
'At,
Figure 30. SEM Micrograph of Sample W60 (High Hardness)
70

Figure 31. TEM Micrograph of Sample W2 (Pass #13)
Figure 32. TEM Micrograph of Sample W2 (Pass #13)
71
Figu3. Tl W
Figure 33. TEM Micrograph of Sample W2 (Pass #14)
Figure 34. TEM Micrograph of Sample W2 (Pass #14)
! 72

Figure 35. TEM Micrograph of Sample W2 (Pass #14)
9C
Figure 36. TEM Micrograph of Sample W2 (Pass #14)
73
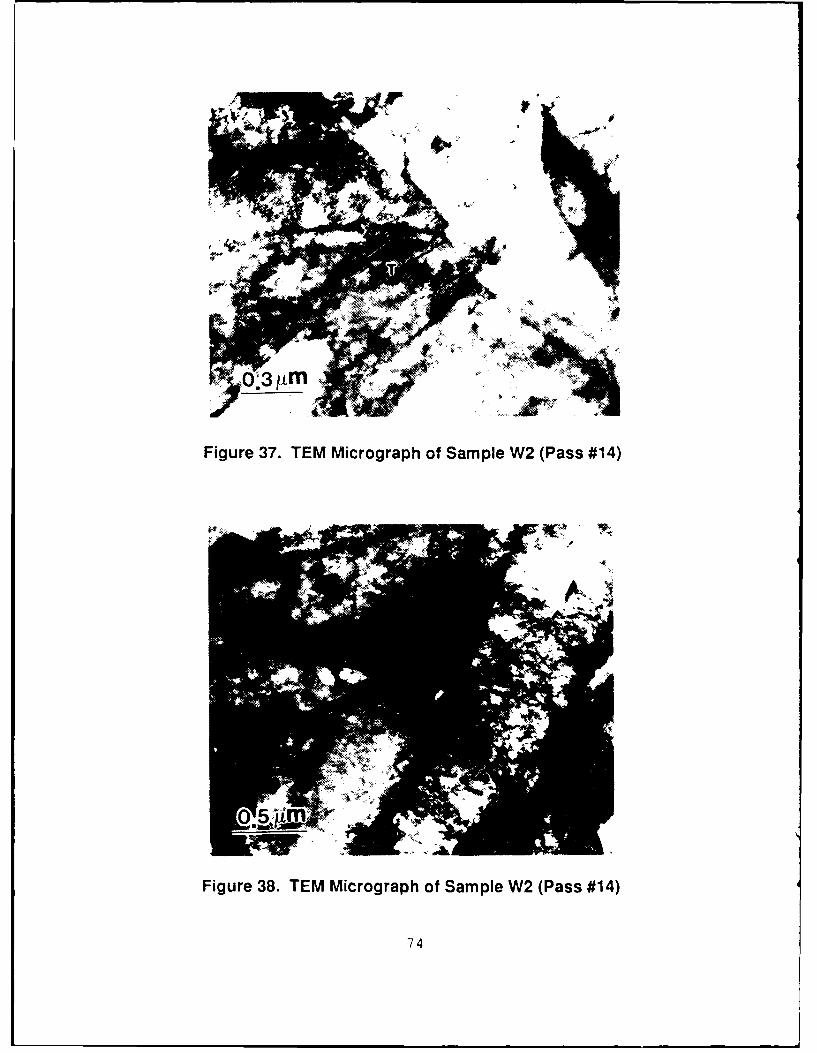
Figure 37. TEM Micrograph of Sample W2 (Pass #14)
Figure 38. TEM Micrograph of Sample W2 (Pass #14)
74
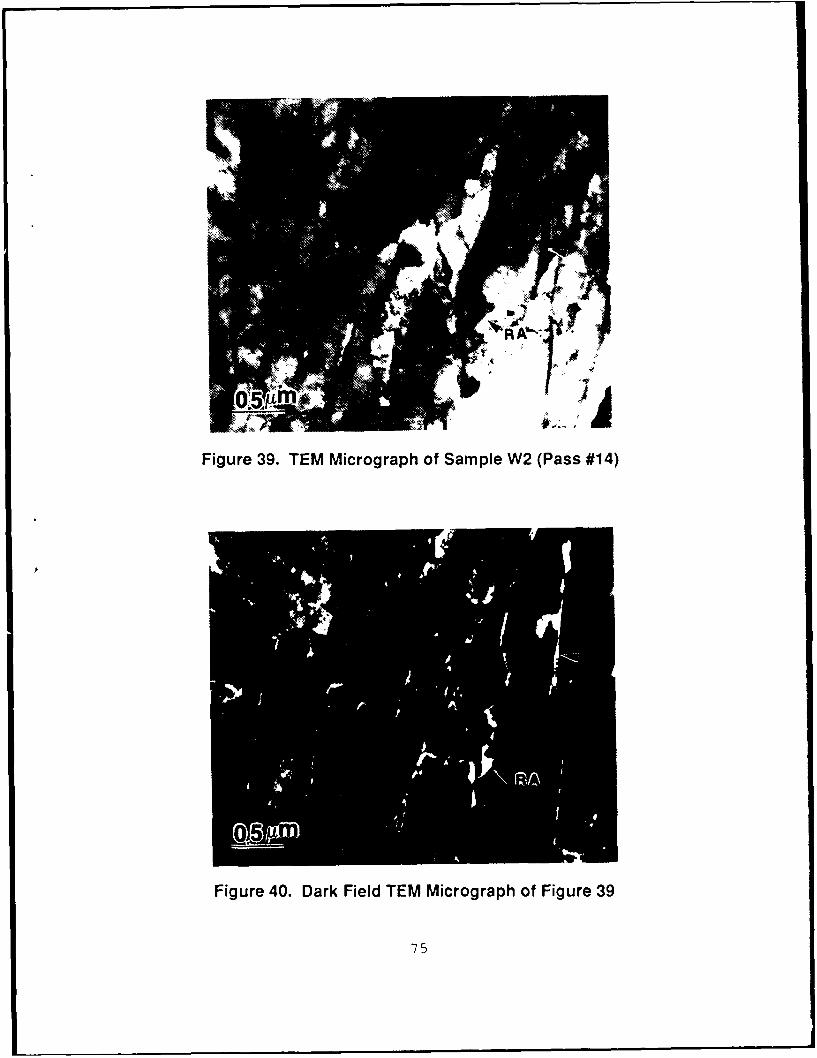
Figure 39. TEM Micrograph of Sample W2 (Pass #14)
p!
Figure 40. Dark Field TEM Micrograph of Figure 39
75
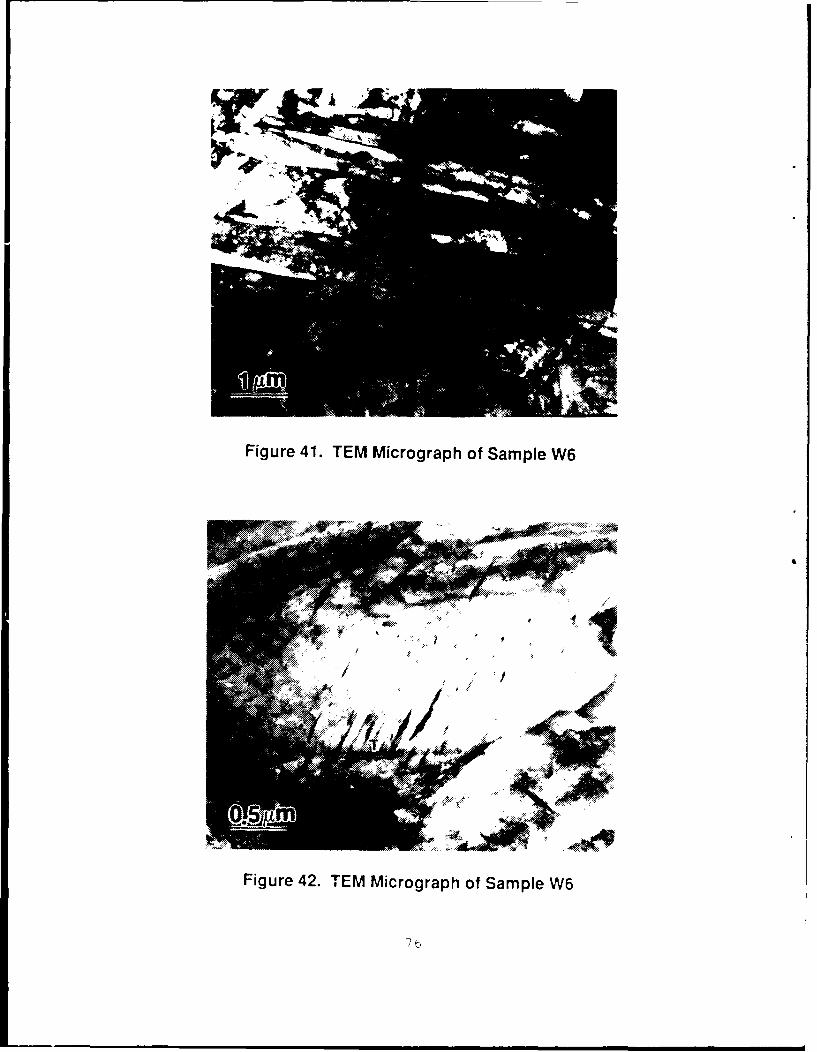
Figure 41. TEM Micrograph of Sample W6
Figure 42. TEM Micrograph of Sample W6
7b

Figure 43. TEM Micrograph of Sample W6
Figure 44. TEM Micrograph of Sample W6

Figure 45. TEM Micrograph of Sample W58
i
Figure 46. TEM Micrograph of Sample W58
78

Figure 47. TEM Micrograph of Sample W58
Figure 48. Dark Field TEM Micrograph of Figure 47
79

Figue 49 TEMMicrgrap oi ~'iLAP W6
Figure 50. TEM Micrograph of Sam ple W60
80

/p,
Figure 51. TEM Micrograph of Sample W60
Figure 52. TEM Micrograph of Sample W60
81

40
C
0
30 Mean Diameter = 0.39 microns0
C Range = 0.19 -0.83 microns
0
20U
0
u 10"6
0LL
00.0 0.2 0.4 0.6 0.8 1.0 1.2
Inclusion Diameter (microns)
Figure 53. Inclusion Size for Sample W2
30-
C
UMean Diameter = 0.58 microns
* 20Range = 0.26 - 1.26 microns
0
10
UC
0
0.0 0.2 0.4 0.6 0.8 1.0 1.2
Inclusion Diameter (microns)
Figure 54. Inclusion Size for Sample W6
82

0
uMean Diameter = 0.41 microns*u 20"
0-- Range 0.16 -1.20 microns
0
10
C.)C
o
0.0 0.2 0.4 0.6 0.8 1.0 1.2
Inclusion Diameter (microns)
Figure 55. Inclusion Size for Sample W58
30 8
tDMean Diameter = 0.47 microns
0 20= Range = 0.21 - 0.90 microns
Co
U0
a-
0.0 0.2 0.4 0.6 0.8 1.0 .
Inclusion Diameter (microns)
Figure 56. Inclusion Size for Sample W60
83

LIST OF REFERENCES
2. U. S. Steel Applied Research Lab Report 40.18-001, TheEffect of Heat Treatment on the Strength and Toughnessof Promising 130 to 150 ksi Yield Strength SubmarineHull Steels, by D. S. Dabkowski, S. J. Mangello, and L.F. Porter, pp. 2-40, March 1963.
2. Challenger, K. D., Brucker, R. B., Elger, W. M., andSorek, M. J., "Microstructure-Thermal HistoryCorrelations for HY-130 Thick Section Weldments,"Welding Journal, Research Supplement, pp. 254s-261s,August 1984.
3. Electric Boat Division, General Dynamics, Task 3.23, N--24-80-C-2021, Potential Weight and Cost Effects of UsingHY-130 Steel in Submarine Nonpressure Hull Structures,by R. Pepin, February 1985.
4. David Taylor Naval Ship Research and Development CenterReport SME-85/109, Welding of Thin Section HY-130 SteelProgress Report, by R. J. Wong, pp. 1-38, January 1986.
5. Easterling, K., Introduction to the Physical Metallurgyof Welding, Butterworths, pp. 80-103, 1983.
6. Glover, A. G., McGrath, J. T., Tinkler, M. J., andWeatherly, G. C., "The Influence of Cooling Rate andComposition on Weld Metal Microstructures in a C/Mn anda HSLA Steel," Welding Journal, Research Supplement, pp.267s-273s, 1976.
7. Askeland, R. A., The Science and Engineering ofMaterials, PW Publishers, pp. 300-364, 1984.
8. Thomas, G., "Retained Austenite and Tempered MartensiteEmbrittlement," Metallurgical Transactions, Volume 9A,pp. 439-450, March 1978.
9. Biss, V., and Cryderman, R. L., "Martensite and RetainedAustenite in Hot-Rolled, Low-Carbon Bainitic Steels,"Metallurgical Transactions, Volume 2, pp. 2267-2276,August 1971.
10. Farrar, R. A., and Harrison, P. L., "Acicular Ferrite inCarbon-Manganese Weld MetalF an Overview," Journal ofMaterials Science 22, pp. 3812-3820, April 1987.
84

11. Ricks, R. A., Howell, P. R., and Barrite, G. S., "TheNature of Acicular Ferrite in HSLA Steel Weld Metals,"Journal of Materials Science 17, pp. 732-740, 1982
12. Grong, 0., and Matlock, D. K., "MinrostructuralDevelopment in Mild and Low-Alloy Steel Weld Metals,"International Metals Reviews, Volume 31, Number 1, pp.27-46, 1986.
13. Abson, D. J., and Dolby, R. E., "MicrostructuralTransformations is Steel Weld Metals - a Reappraisal,"Welding Institute Research Bulletin, pp. 202-206, July1978.
14. Lancaster, J. F., Metallurgy of Welding, Allen & UnwinPublishers Ltd., pp. 148-149, 1987.
15. Byrne, J. P., Palko, W. A., and Zanis, C. A.,"Processing of HY-130 Steel Castings," AmericanFoundrymen's Society Transactions, Volume 84, pp. 193-202, 1976.
16. Chen, C., Thompson, A. W., and Bernstein, I. M., "TheCorrelation of Microstructure and Stress CorrosionFracture of HY-130 Steel Weldments," MetallurgicalTransactions, Volume 11A, pp. 1723-1730, October 1980.
17. Connor, L. P., Rathbone, A. M., and Gross, J. H.,"Development of Procedures for Welding HY-130(T) Steel,"Welding Journal, Research Supplement, Volume 46(7), pp.309s-321s, 1967.
18. Sarikaya, M., Steinberg, B. G., and Thomas, G.,"Optimization of Fe/Cr/C E e Structural Steels forImproved Strength and T-ighness, " MetallurgicalTransactions, Volume 13A, pp. 2227-2237, December 1982.
19. Speich, G. R., and Leslie, W. C., "Tempering of Steel,"Metallurgical Transactions, Volume 3, pp. 1043-1054, May1972.
20. Ritchie, R. 0., Castro Cedeno, M. H., Zackay, V. F., andParker, E. R., "Effects of Silicon Additions andRetained Austenite on Stress Corrosion Cracking inUltrahigh Strength Steels," Metallurgical Transactions,Volume 9A, pp. 35-40, 1978.
21. Kim, Y. H., Kim, H. J., and Morris, J. W., Jr., "TheInfluence of Precipitated Austeni+e on HydrogenEmbrittlement in 5.5 Ni Steel," MetallurgicalTransactions, Volume 17A, pp. 1157-1162, July 1986.
85

22. Deb, P., Challenger, K. D., and Therrien, A. E.,
"Structure-Property Correlation of Submerged-Arc and
Gas-Metal-Arc Weldments in HY-100 Steel," MetallurgicalTransactions, Volume 18A, pp. 987-998, June 1987.
23. Enis, Y. A., and Telford, R. T., "Gas Metal-Arc Weldingof HY-130(T) Steel," Welding Journal, ResearchSupplement, pp. 271s-278s, June 1968.
24. ASTM Special Technical Publication 494, Welding the HYSteels, by R. W. Flax, R. E. Keith, and M. D. Randall,pp. 12-24, April 1971.
25. Bhatti, A. R., Saggese, M. E., Hawkins, D. N., Whiteman,J. A., and Golding, M. S., "Analysis of Inclusions inSubmerged Arc Welds in Microalloyed Steels," WeldingJournal, Volume 63(7), pp. 224s-230s, July 1984.
26. Andrews, K. W., "Empirical Formulae for the Calculationof Some Transformation Temperatures," Journal of theIron and Steel Institute, pp. 721-727, July 196-.
27. Vander Voort, G. F., Metallography - Pranciples andPractices, McGraw-Hill Book Company, p. 534, 1964.
86
INITIAL DISTRIBUTION LIST
1. Defense Technical Information Center 2Cameron StationAlexandria, Virginia 22304-6145
2. Library, Code 0142Naval Postgraduate SchoolMonterey, California 93943-5002
3. Department Chairman, Code 69HyDepartment of Mechanical EngineeringNaval Postgraduate SchoolMonterey, California 93943-5000
4. Dr. S. SabouryP.O. Box 51922Pacific Grove, California 93950
5. Dr. J. M. B. Losz, Code 69LoDepartment of Mechanical EngineeringNaval Postgraduate SchoolMonterey, California 93943-5000
6. Professor T. R. McNelley, Code 69McDepartment of Mechanical EnyiiieeringNaval Postgraduate SchoolMonterey, California 93943-5000
7. Mr. Paul W. Holsberg, Code 2615David Taylor Naval Ship Researchand Development CenterAnnapolis, Maryland 21402-5067
F. Mr. R. J. Wong, Code 2821David Taylor Naval Ship Researchand Development CenterAnnapolis, Maryland 21402-5067
9. LT Dean M. Pedersen 2Assistant Aegis Test Director for DDG-51Operational Test and Evaluation ForceNorfolk, Virginia 23511-6388
10. LT M. H. Heinze, USN, Code N64Commander Naval Surface Force, U. S. Pacific FleetNAB CoronadoSan Diego, California 92155-5035
87