naval postgraduate school · the study also examined the crack propagation from a composite to a...
TRANSCRIPT
NAVAL
POSTGRADUATE SCHOOL
MONTEREY, CALIFORNIA
THESIS
Approved for public release; distribution is unlimited
AN EXPERIMENTAL STUDY OF FIBERGLASS COMPOSITES CONTAINING METAL WIRE
JOINTS
by
Joseph E. Klopfer
September 2009
Thesis Advisor: Young W. Kwon Second Reader: Jarema M. Didoszak
i
REPORT DOCUMENTATION PAGE Form Approved OMB No. 0704-0188 Public reporting burden for this collection of information is estimated to average 1 hour per response, including the time for reviewing instruction, searching existing data sources, gathering and maintaining the data needed, and completing and reviewing the collection of information. Send comments regarding this burden estimate or any other aspect of this collection of information, including suggestions for reducing this burden, to Washington headquarters Services, Directorate for Information Operations and Reports, 1215 Jefferson Davis Highway, Suite 1204, Arlington, VA 22202-4302, and to the Office of Management and Budget, Paperwork Reduction Project (0704-0188) Washington DC 20503.
1. AGENCY USE ONLY (Leave blank)
2. REPORT DATE September 2009
3. REPORT TYPE AND DATES COVERED Master’s Thesis
4. TITLE AND SUBTITLE An Experimental Study of Fiberglass Composites Containing Metal Wire Joints
6. AUTHOR(S) Joseph E. Klopfer
5. FUNDING NUMBERS
7. PERFORMING ORGANIZATION NAME(S) AND ADDRESS(ES) Naval Postgraduate School Monterey, CA 93943-5000
8. PERFORMING ORGANIZATION REPORT NUMBER
9. SPONSORING /MONITORING AGENCY NAME(S) AND ADDRESS(ES) Naval Surface Warfare Center Carderock Division (NSWCCD)
10. SPONSORING/MONITORING AGENCY REPORT NUMBER
11. SUPPLEMENTARY NOTES The views expressed in this thesis are those of the author and do not reflect the official policy or position of the Department of Defense or the U.S. Government.
12a. DISTRIBUTION / AVAILABILITY STATEMENT Approved for public release; distribution is unlimited.
12b. DISTRIBUTION CODE
13. ABSTRACT (maximum 200 words)
The U.S. Navy has been incorporating increasing amounts of composite materials during construction, especially in the areas of submarine sails and surface ship superstructures. The benefit of using composite material with metal wire layers imbedded is that these metal wire layers may be welded to the steel superstructure of a Naval Vessel resulting in maximum joint strength. Joining a composite structure to a metallic structure required the metal-wire layers to be co-cured with composite layers using the Vacuum Assisted Resin Transfer Molding (VARTM). The interface fracture strength was measured for Mode I fracture for various lay-up and interface conditions. The study includes metal-wire to composite, composite to composite, and metal-wire to metal-wire interfaces. Metal-wire lay-up orientations studied were 0 and 90 degrees with varying combinations. The study also examined the crack propagation from a composite to a metal/composite interface. Failure mode was studied by creating a finite element model in ANSYS 12.0. The results suggested that a metal-wire/composite laminate would be effective to connect a composite structure to a metallic structure.
15. NUMBER OF PAGES
55
14. SUBJECT TERMS Vacuum Assisted Resin Transfer, VARTIM, Composite, Fiberglass, Metal Wire, Metal Composite, Mode I, ANSYS 12.0
16. PRICE CODE
17. SECURITY CLASSIFICATION OF REPORT
Unclassified
18. SECURITY CLASSIFICATION OF THIS PAGE
Unclassified
19. SECURITY CLASSIFICATION OF ABSTRACT
Unclassified
20. LIMITATION OF ABSTRACT
UU
NSN 7540-01-280-5500 Standard Form 298 (Rev. 2-89) Prescribed by ANSI Std. 239-18

ii
THIS PAGE INTENTIONALLY LEFT BLANK

iii
Approved for public release; distribution is unlimited
AN EXPERIMENTAL STUDY OF FIBERGLASS COMPOSITES CONTAINING METAL WIRE JOINTS
Joseph E. Klopfer
Lieutenant, United States Navy B.S., Villanova University, 2001
Submitted in partial fulfillment of the requirements for the degree of
MASTER OF SCIENCE IN MECHANICAL ENGINEERING
from the
NAVAL POSTGRADUATE SCHOOL September 2009
Author: Joseph E. Klopfer
Approved by: Young W. Kwon Thesis Advisor
Jarema M. Didoszak Second Reader
Knox T. Millsaps Chairman, Department of Mechanical and Astronautical Engineering

iv
THIS PAGE INTENTIONALLY LEFT BLANK
v
ABSTRACT
The U.S. Navy has been incorporating increasing amounts of composite materials
during construction, especially in the areas of submarine sails and surface ship
superstructures. The benefit of using composite material with metal wire layers
imbedded is that these metal wire layers may be welded to the steel superstructure of a
Naval Vessel resulting in maximum joint strength. Joining a composite structure to a
metallic structure required the metal-wire layers to be co-cured with composite layers
using the Vacuum Assisted Resin Transfer Molding (VARTM). The interface fracture
strength was measured for Mode I fracture for various lay-up and interface conditions.
The study includes metal-wire to composite, composite to composite, and metal-wire to
metal-wire interfaces. Metal-wire lay-up orientations studied were 0 and 90 degrees with
varying combinations. The study also examined the crack propagation from a composite
to a metal/composite interface. Failure mode was studied by creating a finite element
model in ANSYS 12.0. The results suggested that a metal-wire/composite laminate
would be effective to connect a composite structure to a metallic structure.

vi
THIS PAGE INTENTIONALLY LEFT BLANK
vii
TABLE OF CONTENTS
I. INTRODUCTION........................................................................................................1 A. BACKGROUND ..............................................................................................1 B. OBJECTIVES ..................................................................................................3
II. COMPOSITE FABRICATION..................................................................................5 A. MATERIALS ...................................................................................................5 B. APPARATUS ...................................................................................................6 C. PROCEDURE ..................................................................................................9
1. Coupon Preparation ..........................................................................10 2. Vacuum Bag Construction................................................................10 3. Resin Preparation ..............................................................................15 4. Resin Transfer....................................................................................16 5. Cleanup ...............................................................................................17 6. Mode 1 Sample Fabrication ..............................................................17
D. SPECIFIC COUPON JOINT CONFIGURATION ...................................18 1. Case I...................................................................................................19 2. Case IV................................................................................................19 3. Case V .................................................................................................20 4. Case VII ..............................................................................................20 5. Case VIII.............................................................................................21 6. Case IX................................................................................................21
III. TESTING....................................................................................................................23 A. OVERVIEW...................................................................................................23 B. MODE I TENSION TEST ............................................................................23
IV. RESULTS AND DISCUSSION ................................................................................25 A. INTERLAMINAR FRACTURE TOUGHNESS IN MODE I...................25 B. FAILURE MODE ..........................................................................................28
V. CONCLUSIONS AND RECOMMENDATIONS...................................................35
APPENDIX: MODE I DATA ...............................................................................................37
LIST OF REFERENCES......................................................................................................39
INITIAL DISTRIBUTION LIST .........................................................................................41

viii
THIS PAGE INTENTIONALLY LEFT BLANK

ix
LIST OF FIGURES
Figure 1. Stepped-lap joint ................................................................................................2 Figure 2. Scarf Joint ..........................................................................................................2 Figure 3. Hybrid Transition Joint ......................................................................................3 Figure 4. E-Glass (From [9]).............................................................................................6 Figure 5. 3SX Hardwire© (From [9]) ...............................................................................6 Figure 6. Vacuum Assisted Resin Transfer Molding Apparatus (After [9]).....................7 Figure 7. Gauge Board (From [9]) ....................................................................................8 Figure 8. Resin Trap (From [9])........................................................................................9 Figure 9. Resin Infusion Flow Netting............................................................................11 Figure 10. Econolease Release Ply....................................................................................11 Figure 11. Bottom Half Coupon Set-up ............................................................................12 Figure 12. Top Half of Coupon in Place ...........................................................................13 Figure 13. Coupon Ready for Vacuum Bag ......................................................................13 Figure 14. Vacuum Bag Assembly....................................................................................15 Figure 15. Pressure Difference Across Coupon ................................................................15 Figure 16. Mode 1 Sample Preparation.............................................................................17 Figure 17. Mode 1 Sample ................................................................................................18 Figure 18. Critical Areas (From [9]) .................................................................................18 Figure 19. Configuration Legend ......................................................................................19 Figure 20. Case I ...............................................................................................................19 Figure 21. Case IV.............................................................................................................20 Figure 22. Case V..............................................................................................................20 Figure 23. Case VII ...........................................................................................................20 Figure 24. Case VIII..........................................................................................................21 Figure 25. Case IX.............................................................................................................21 Figure 26. Double cantilever beam test for Mode I (i.e., crack opening) fracture............23 Figure 27. Mode I Interlaminar Fracture Toughness ........................................................25 Figure 28. Average Fracture Toughness Cases I and IV...................................................26 Figure 29. Average Fracture Toughness Cases I and IX...................................................27 Figure 30. Average Fracture Toughness Cases V and VII................................................27 Figure 31. Case I Delamination Initiation/Propagation.....................................................28 Figure 32. Case IV Delamination Initiation/Propagation..................................................28 Figure 33. Case V Delamination Initiation/Propagation ...................................................29 Figure 34. Case VIII Delamination Initiation/Propagation ...............................................29 Figure 35. Case VIII Crack Propagation Schematic .........................................................29 Figure 36. ANSYS Model Geometry ................................................................................30 Figure 37. ANSYS Model Crack Tip................................................................................31 Figure 38. Nodal Summary of Von Mises Stresses...........................................................31 Figure 39. Y-component Von Mises Stresses ...................................................................32 Figure 40. X-component Von Mises Stresses ...................................................................32 Figure 41. Case XI Delamination Initiation/Propagation..................................................33

x
THIS PAGE INTENTIONALLY LEFT BLANK
xi
ACKNOWLEDGMENTS
First and foremost, I would like to thank Dr. Young Kwon for his mentorship
during the course of this research, and throughout my graduate studies. I would also like
to thank Dr. Chanman Park for his guidance during the testing phase of this research.
Thank you to Erik Rasmussen, Scott Bartlett, Doug Loup, and Tim Dapp from the
Naval Surface Warfare Center Carderock Division (NSWCCD) team for “Advanced Hull
Materials & Structures Technology (AHM&ST),” who provided crucial funding,
materials, and technical guidance.
Finally, I would like to thank my wife, Rachael, for her understanding and support
throughout my studies.

xii
THIS PAGE INTENTIONALLY LEFT BLANK

1
I. INTRODUCTION
A. BACKGROUND
Fiber composites have been used widely in countless engineering applications
because they are lightweight, have high specific stiffness, high damping, and a low
coefficient of thermal expansion [1]. The United States Navy has been incorporating
increasing amounts of composite materials during construction, especially in the areas of
submarine sails and surface ship superstructures. These composites have been shown to
increase ship performance and lower ownership costs.
Ship superstructures and submarine sails are very large; therefore, construction of
these items in one piece is impossible. The resulting joints are the weakest part of the
structures, so it could be said that the strength of the structure is dependent on the
strength of the joints. The weakest of these joints are the ones that join the composite to
the hull. There are two types of joints in use today: mechanical and adhesive joints [1].
The structural property and efficiency of materials that are adhesively bonded is highly
dependent on the adhesive used, as well as the joining configuration. Compared to
mechanical fasteners, adhesively-bonded joints have many advantages. They distribute
the load more evenly over a larger area without needing holes drilled. In addition, stress
concentrations on bonded joints are much lower, and occur at the edge of an overlap
instead of at a hole. The primary adhesive joint types in use today are the stepped-lap
joint and the scarf joint, shown in Figures 1 and 2. The stepped-lap joint is several lap
joints staggered by layer to form a joining surface with a large surface area. The
increased surface area increases adhesion strength, but it also promotes stress
concentrations at the ends of the overlap. The scarf joint provides less surface area for
the adhesive to bond, but is considered superior to the lap joint because it is free of stress
concentrations [3]. The mechanical joint has several advantages over adhesively bonded
joints. These advantages are that mechanical joints need little surface preparation, are not
affected by the service environment when properly maintained, and can be dismantled
and inspected when in need of repair. However, because the mechanical joint requires
2
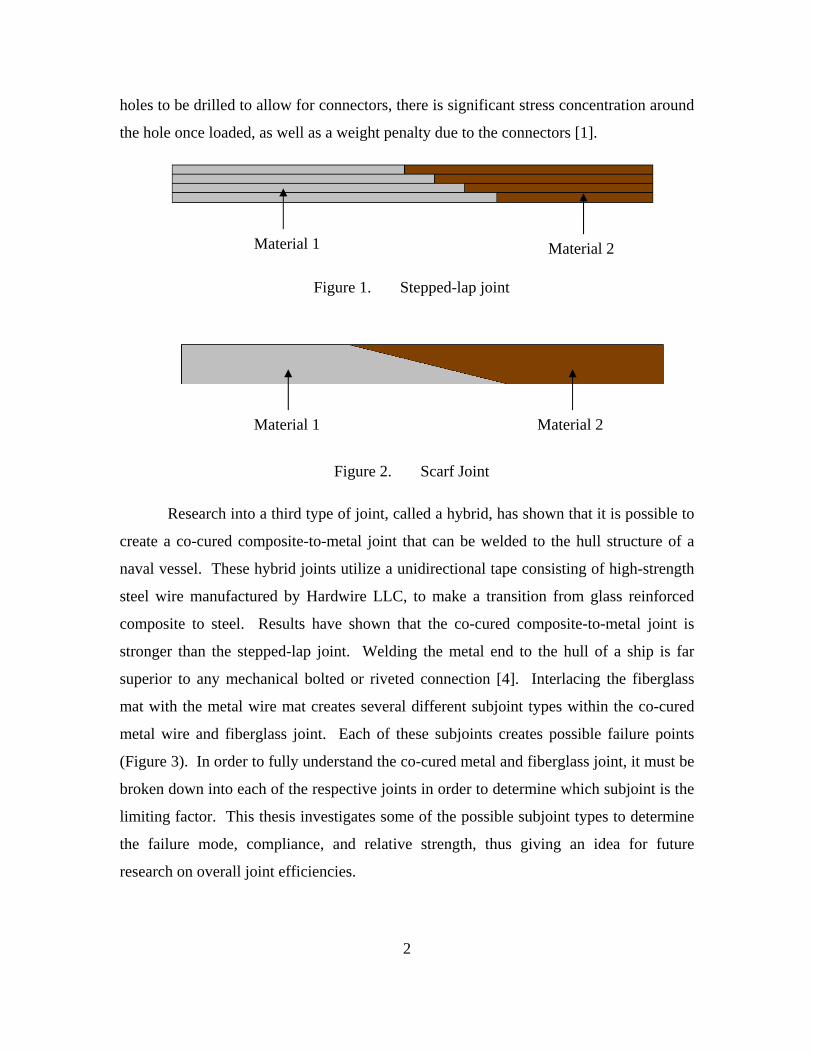
holes to be drilled to allow for connectors, there is significant stress concentration around
the hole once loaded, as well as a weight penalty due to the connectors [1].
Figure 1. Stepped-lap joint
Figure 2. Scarf Joint
Research into a third type of joint, called a hybrid, has shown that it is possible to
create a co-cured composite-to-metal joint that can be welded to the hull structure of a
naval vessel. These hybrid joints utilize a unidirectional tape consisting of high-strength
steel wire manufactured by Hardwire LLC, to make a transition from glass reinforced
composite to steel. Results have shown that the co-cured composite-to-metal joint is
stronger than the stepped-lap joint. Welding the metal end to the hull of a ship is far
superior to any mechanical bolted or riveted connection [4]. Interlacing the fiberglass
mat with the metal wire mat creates several different subjoint types within the co-cured
metal wire and fiberglass joint. Each of these subjoints creates possible failure points
(Figure 3). In order to fully understand the co-cured metal and fiberglass joint, it must be
broken down into each of the respective joints in order to determine which subjoint is the
limiting factor. This thesis investigates some of the possible subjoint types to determine
the failure mode, compliance, and relative strength, thus giving an idea for future
research on overall joint efficiencies.
Material 1 Material 2
Material 1 Material 2
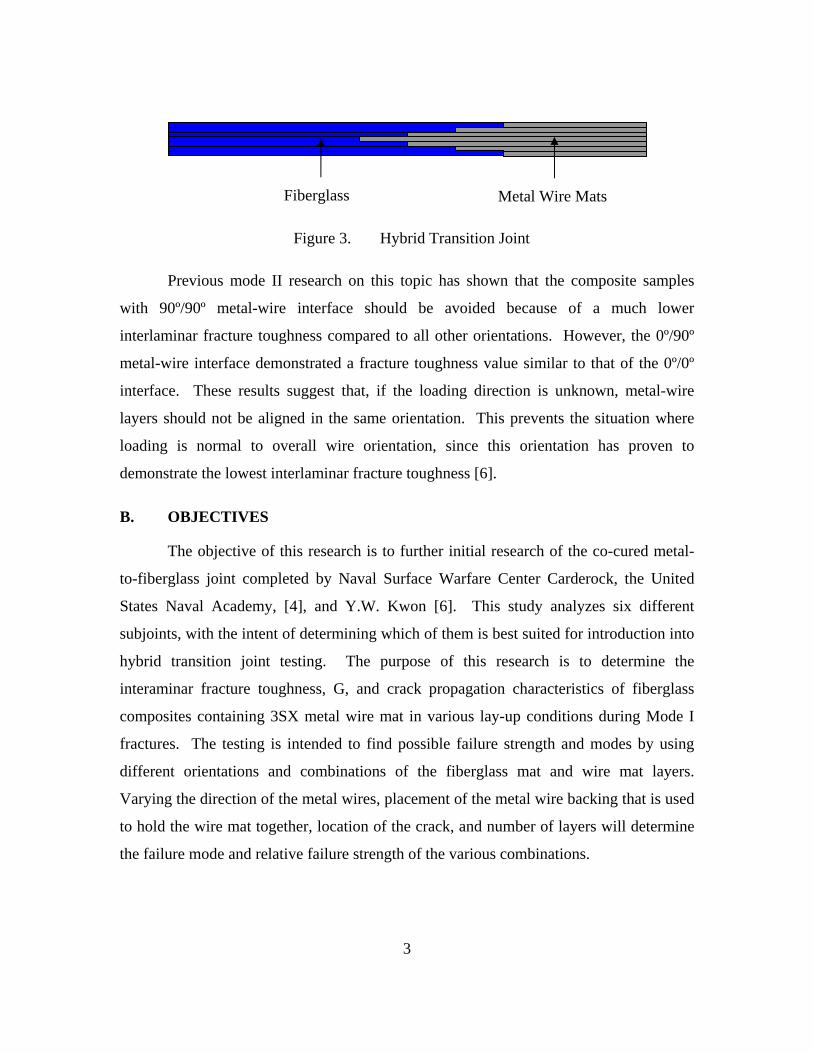
3
Figure 3. Hybrid Transition Joint
Previous mode II research on this topic has shown that the composite samples
with 90º/90º metal-wire interface should be avoided because of a much lower
interlaminar fracture toughness compared to all other orientations. However, the 0º/90º
metal-wire interface demonstrated a fracture toughness value similar to that of the 0º/0º
interface. These results suggest that, if the loading direction is unknown, metal-wire
layers should not be aligned in the same orientation. This prevents the situation where
loading is normal to overall wire orientation, since this orientation has proven to
demonstrate the lowest interlaminar fracture toughness [6].
B. OBJECTIVES
The objective of this research is to further initial research of the co-cured metal-
to-fiberglass joint completed by Naval Surface Warfare Center Carderock, the United
States Naval Academy, [4], and Y.W. Kwon [6]. This study analyzes six different
subjoints, with the intent of determining which of them is best suited for introduction into
hybrid transition joint testing. The purpose of this research is to determine the
interaminar fracture toughness, G, and crack propagation characteristics of fiberglass
composites containing 3SX metal wire mat in various lay-up conditions during Mode I
fractures. The testing is intended to find possible failure strength and modes by using
different orientations and combinations of the fiberglass mat and wire mat layers.
Varying the direction of the metal wires, placement of the metal wire backing that is used
to hold the wire mat together, location of the crack, and number of layers will determine
the failure mode and relative failure strength of the various combinations.
Fiberglass Metal Wire Mats

4
THIS PAGE INTENTIONALLY LEFT BLANK

5
II. COMPOSITE FABRICATION
A. MATERIALS
The co-cured composite samples were fabricated from E-glass, Derakane 510A
vinyl ester resin, and 3SX Hardwire© metal mat. E-glass used for this study is a 24 oz
per square yard, bidirectional fiberglass woven roving (Figure 4). The metal wire mat
seen in Figure 5 was used in all of the samples containing metal. It was a 3SX metal wire
mat with 12 bundles, or cords, per linear inch fabricated by Hardwire LLC. Each metal
cord consists of three individual wires wrapped by a fourth smaller wire.
The Derakane resin was mixed with Methyl Ethyl Ketone Peroxide 9 percent
(MEKP), Cobalt Napthenate 6 percent solution (CoNAP), and N, N- Dimethylaniline
99.5 percent (DMA) to achieve a nominal one-hour curing time. Curing time must be
kept to one hour or less to avoid air bubble formation in the sample. All components are
mixed based on a percent weight for a nominal one-hour cure time per manufacture’s
directions. MEKP was used as the initiator for the curing reaction. If the sample is
prepared at a temperature of 70ºF or greater, the CoNAP alone acts as the reaction
catalyst and is therefore responsible for determining cure time. If the sample must be
prepared at a temperature less than 70ºF, DMA must be added in addition to CoNAP to
achieve a one-hour cure time. The Derakane 510A was measured by volume and
converted to a weight while the MEKP, CoNAP, and DMA were measured by weight.
The amounts of MEKP, CoNAP, and DMA are used only to change the gel time, and
have no effect on the composite strength [5].

6
Figure 4. E-Glass (From [9])
Figure 5. 3SX Hardwire© (From [9])
B. APPARATUS
Knowledge concerning the Vacuum Assisted Resin Transfer Molding (VARTM)
technique for fabricating composite materials was provided by Naval Surface Warfare
Center Carderock Division (NSWCCD). The VARTM apparatus consists of five major
components. They are a vacuum pump, gauge board, resin trap, glass surface, and resin
reservoir (Figure 6).
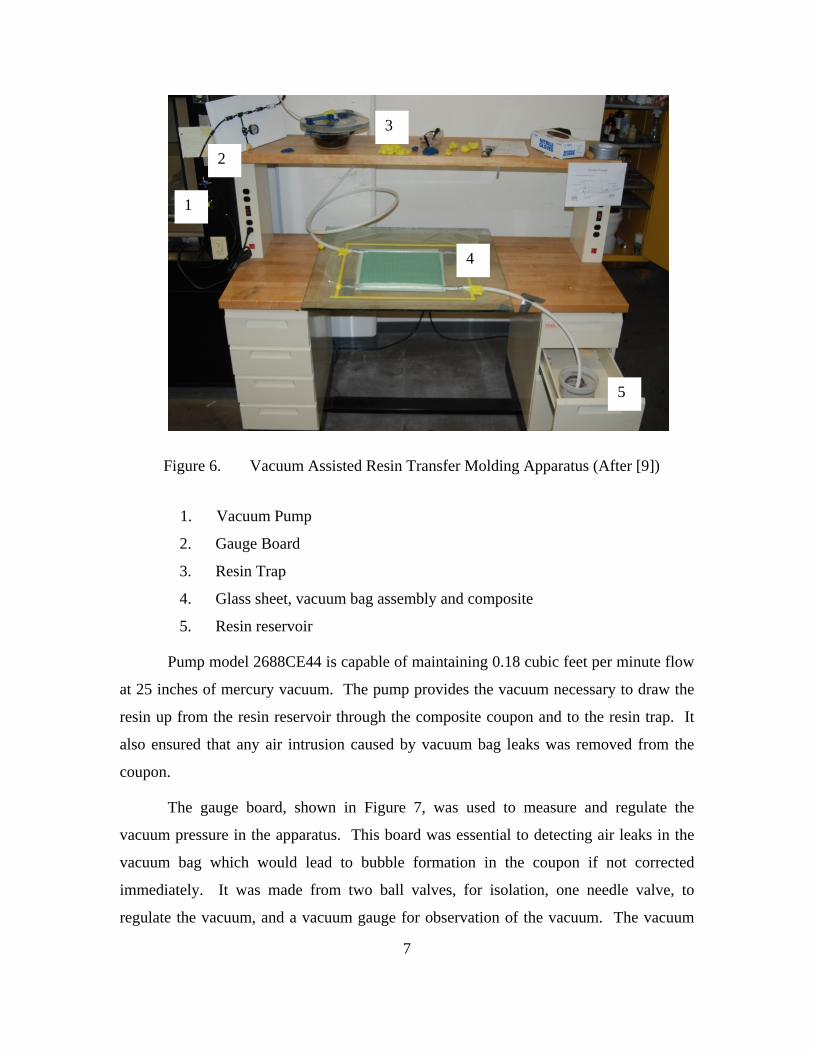
7
Figure 6. Vacuum Assisted Resin Transfer Molding Apparatus (After [9])
1. Vacuum Pump
2. Gauge Board
3. Resin Trap
4. Glass sheet, vacuum bag assembly and composite
5. Resin reservoir
Pump model 2688CE44 is capable of maintaining 0.18 cubic feet per minute flow
at 25 inches of mercury vacuum. The pump provides the vacuum necessary to draw the
resin up from the resin reservoir through the composite coupon and to the resin trap. It
also ensured that any air intrusion caused by vacuum bag leaks was removed from the
coupon.
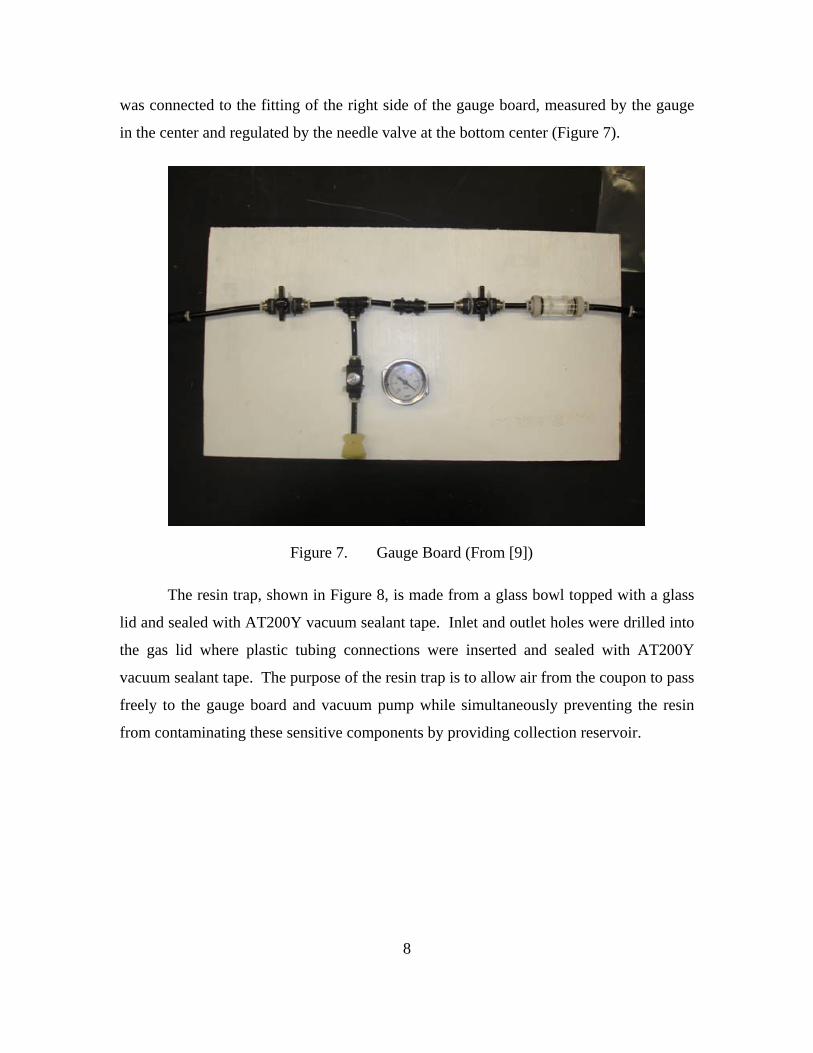
The gauge board, shown in Figure 7, was used to measure and regulate the
vacuum pressure in the apparatus. This board was essential to detecting air leaks in the
vacuum bag which would lead to bubble formation in the coupon if not corrected
immediately. It was made from two ball valves, for isolation, one needle valve, to
regulate the vacuum, and a vacuum gauge for observation of the vacuum. The vacuum
5
3
4
2
1
8
was connected to the fitting of the right side of the gauge board, measured by the gauge
in the center and regulated by the needle valve at the bottom center (Figure 7).
Figure 7. Gauge Board (From [9])
The resin trap, shown in Figure 8, is made from a glass bowl topped with a glass
lid and sealed with AT200Y vacuum sealant tape. Inlet and outlet holes were drilled into
the gas lid where plastic tubing connections were inserted and sealed with AT200Y
vacuum sealant tape. The purpose of the resin trap is to allow air from the coupon to pass
freely to the gauge board and vacuum pump while simultaneously preventing the resin
from contaminating these sensitive components by providing collection reservoir.

9
Figure 8. Resin Trap (From [9])
The working surface was fabricated from a sheet of ½ inch thick tempered glass.
A glass working surface was chosen because of its hardness, durability, and
thermodynamic properties. It provided a firm, thermally stable, platform for the
exothermic reaction to take place. The glass’s smooth surface also provided a rigid
molding surface for the composite coupon, which was optimal to promoting the proper
seal for the vacuum bag, and allowed a rapid clean-up process.
The resin reservoir was simply a plastic bucket. The resin was mixed and
degassed in the bucket and isolated from the system by plugging the polyethylene tubing
with a ball of AT200Y sealant tape while the vacuum was being established and tested.
After a satisfactory vacuum was established and all air leaks in the vacuum bag assembly
were eliminated, the sealant tape ball was removed and the polyethylene tubing was
inserted into the resin reservoir allowing the resin to flow into the composite coupon.
C. PROCEDURE
Each composite coupon was formed by the same method. The only variation was
the individual layers and orientation of the E-glass and metal wire mat layers.
10
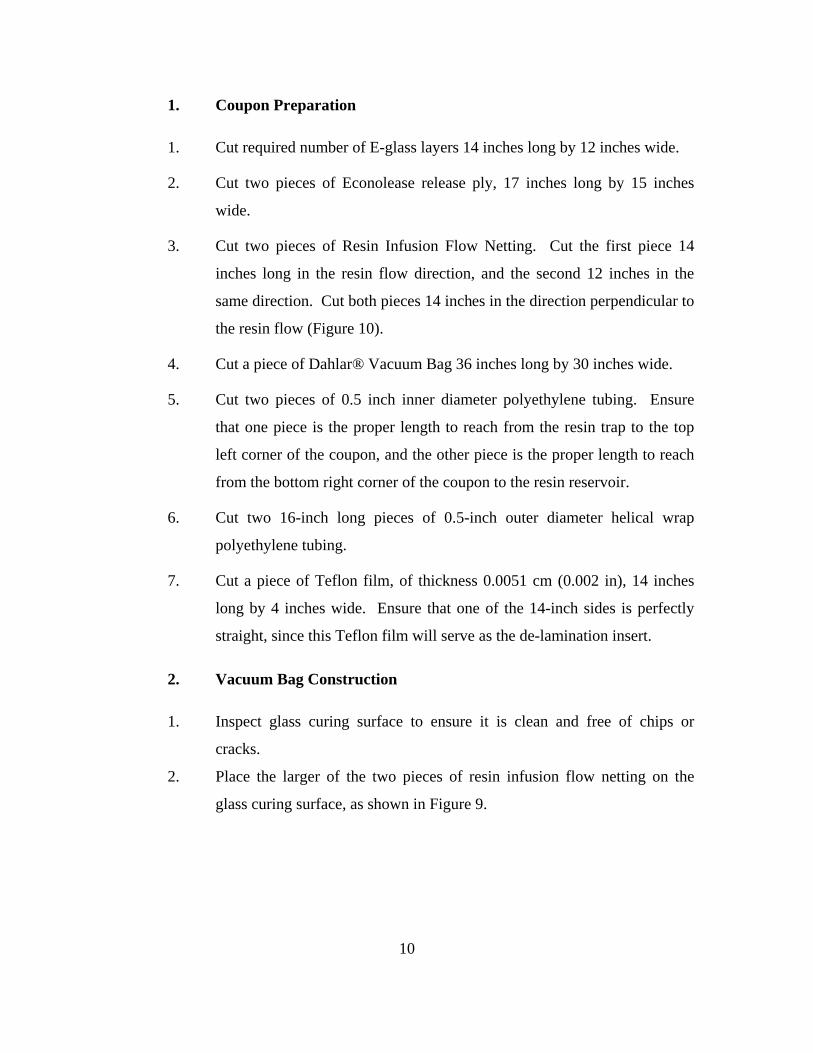
1. Coupon Preparation
1. Cut required number of E-glass layers 14 inches long by 12 inches wide.
2. Cut two pieces of Econolease release ply, 17 inches long by 15 inches
wide.
3. Cut two pieces of Resin Infusion Flow Netting. Cut the first piece 14
inches long in the resin flow direction, and the second 12 inches in the
same direction. Cut both pieces 14 inches in the direction perpendicular to
the resin flow (Figure 10).
4. Cut a piece of Dahlar® Vacuum Bag 36 inches long by 30 inches wide.
5. Cut two pieces of 0.5 inch inner diameter polyethylene tubing. Ensure
that one piece is the proper length to reach from the resin trap to the top
left corner of the coupon, and the other piece is the proper length to reach
from the bottom right corner of the coupon to the resin reservoir.
6. Cut two 16-inch long pieces of 0.5-inch outer diameter helical wrap
polyethylene tubing.
7. Cut a piece of Teflon film, of thickness 0.0051 cm (0.002 in), 14 inches
long by 4 inches wide. Ensure that one of the 14-inch sides is perfectly
straight, since this Teflon film will serve as the de-lamination insert.
2. Vacuum Bag Construction
1. Inspect glass curing surface to ensure it is clean and free of chips or
cracks.
2. Place the larger of the two pieces of resin infusion flow netting on the
glass curing surface, as shown in Figure 9.

11
Figure 9. Resin Infusion Flow Netting
3. Place a piece of Econolease release ply over the resin infusion flow
netting, as shown in Figure 10.
Figure 10. Econolease Release Ply
Resin Flow Direction

12
4. Place one-half of the coupon to be cured on top of the release ply, as
shown in Figure 11, with the Teflon de-lamination insert placed along the
left edge of the coupon (Sample shown is E-Glass only, Case V). Ensure
that the infusion flow netting underneath the release ply extends at least
one inch below the bottom edge of the coupon.
Caution: Ensure that the Metal Wire sheets in the coupon have been
thoroughly degreased, using Acetone or Hydrochloric Acid,
prior to inserting into coupon. This promotes resin bonding on
metal surface.
Figure 11. Bottom Half Coupon Set-up
5. Place top half of the coupon on top of the bottom half, taking extra care to
ensure that the de-lamination insert does not move (Figure 12).
14 inches
Teflon insert E-Glass
≥ 1 inch 3 inches

13
Figure 12. Top Half of Coupon in Place
6. Place the other piece of release ply on lop of the coupon and the remaining
piece of infusion flow netting over the release ply, ensuring that the top
edge of the netting lines up with the top edge of the coupon as shown in
Figure 13.
Figure 13. Coupon Ready for Vacuum Bag
≥ 1 inch

14
7. Create a rectangular shape around the coupon, using the AT–200Y
vacuum bag sealant tape, as seen in Figure 14.
8. Place the end of the polyethylene tube extending from the resin trap at the
top left corner of the coupon, and press the portion of the tube crossing
over the sealant tape down firmly so it adheres to the tape. Do the same at
the bottom right corner of the coupon with the tubing extending from the
resin reservoir (Figure 14).
9. Place one end of the helical polyethylene tubing into the end of the top
tube and adhere it with duct tape. Stretch the tubing across the top edge of
the sample, ensuring that it rests on top of the coupon and infusion flow
netting. Duct tape the end of the helical tube and tape that end to the glass
curing surface so the tube is held firmly in place. Do the same at the
bottom edge of the coupon, ensuring that there is a 0.5-inch gap between
the edge of the coupon and the helical tubing, but that it is still lying
across the bottom layer of infusion flow netting (Figure 14). This setup
ensures that the negative pressure point will occur on the top surface and
edge of the coupon while the atmospheric pressure point will occur on the
bottom surface and edge. Therefore, the resin will be drawn from the
bottom edge to the top edge and bottom surface to top surface of the
coupon ensuring full resin saturation, as shown in Figure 15.
10. Affix the vacuum bag to the sealant tape ensuring that the bag stays
unwrinkled (Figure 14).
11. Plug the end of the tubing that goes in the resin reservoir with vacuum
sealant tape. Turn on the vacuum pump. Once 25 inches of vacuum have
been established, secure the vacuum pump. Carefully listen for air leaks
in the vacuum bag. Fix leaks using sealant tape. If the vacuum bag leak
check is satisfactory, break the vacuum by removing the AT–200Y sealant
tape plug from the end of the polyethylene tubing.

15
Figure 14. Vacuum Bag Assembly
Figure 15. Pressure Difference Across Coupon
3. Resin Preparation
1. The resin was mixed in accordance with the manufacturer’s directions
under a fume hood, [5] to achieve the cure time of 1 hour. Safety glasses
and rubber gloves must be worn for remainder of procedure.
2. Pour 1.25 L Derakane 510A resin into plastic resin reservoir.
Top Helical Tubing
Bottom Helical Tubing
Vacuum Bag Sealant Tape
RESIN FLOW
High Press
Low Press
Resin Flow
0.5 inch

16
3. Add 19.9g of MEKP to the resin. Mix with paint stirrer.
Caution: MEKP must be well mixed into resin before adding CoNAP or
an explosion or violent reaction may result.
4. Mix 3.2g of CoNAP into the resin mixture.
5. If the ambient room temperature is less than 70˚F, then 0.5g of DMA must
be mixed into the resin solution as well. At temperatures greater than
70˚F, DMA is not added.
6. Keep the mixed resin solution under the fume hood for 10 minutes to
allow it to degas. This prevents air bubbles from entering the coupon.
4. Resin Transfer
1. Place the resin reservoir in position 5, as shown in Figure 6.
2. Plug the end of the plastic tubing with a ball of AT–200Y sealant tape,
start the vacuum pump, and draw a full 25 inches of vacuum. Ensure that
the vacuum bag is free of wrinkles and air leaks.
3. Remove the AT–200Y sealant tape plug from the vacuum tubing and
quickly submerge into the resin reservoir, ensuring it touches the bottom
of the reservoir.
4. Observe proper flow across the coupon, as shown in Figures 14 and 15.
5. Once the coupon is visibly saturated with resin, secure the vacuum pump
and break vacuum down to 10 inches by opening the bottom valve on the
gauge board (Figure 7).
Caution: Do not allow resin trap to fill completely. If it overflows, it will
result in gauge board/ vacuum pump contamination.
6. Close the valve on the gauge board at 10 inches of vacuum and leave the
set-up to cure for 24 hours.
17
5. Cleanup
1. Use a putty knife to peel vacuum bag off of glass surface.
2. Disconnect all tubing connections.
3. Remove coupon from glass surface.
4. Clean glass surface thoroughly with Acetone.
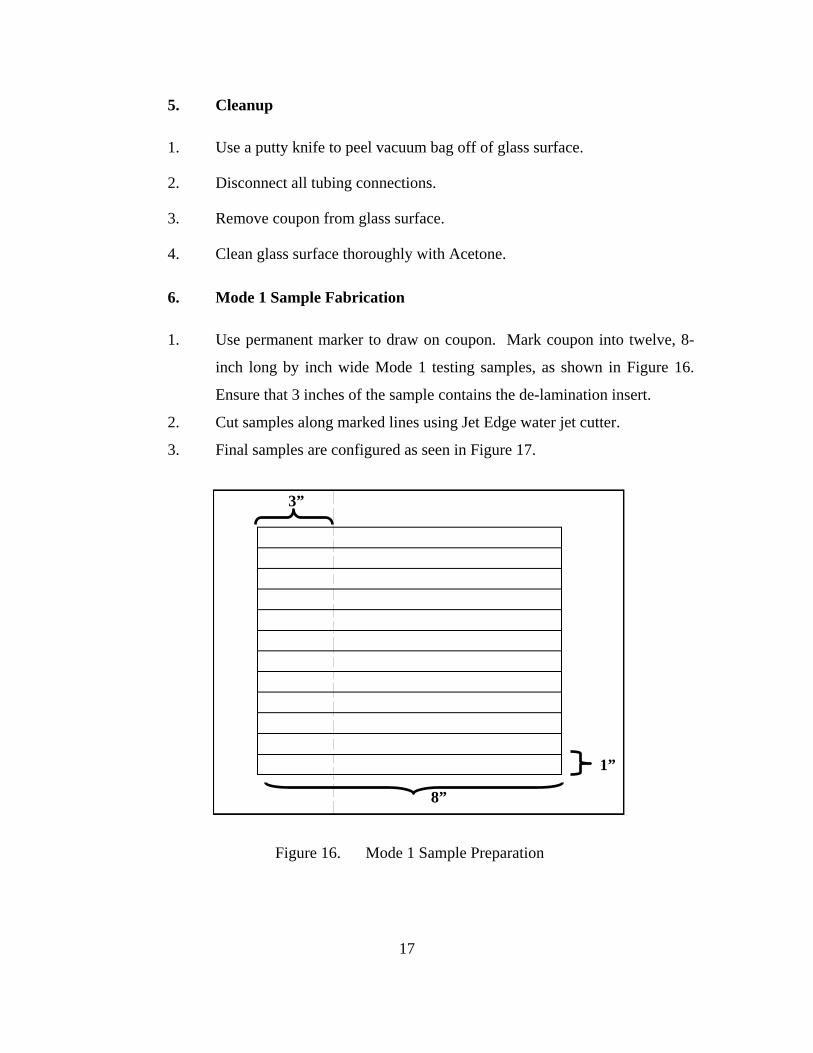
6. Mode 1 Sample Fabrication
1. Use permanent marker to draw on coupon. Mark coupon into twelve, 8-
inch long by inch wide Mode 1 testing samples, as shown in Figure 16.
Ensure that 3 inches of the sample contains the de-lamination insert.
2. Cut samples along marked lines using Jet Edge water jet cutter.
3. Final samples are configured as seen in Figure 17.
Figure 16. Mode 1 Sample Preparation
1”
8”
3”

18
Figure 17. Mode 1 Sample
D. SPECIFIC COUPON JOINT CONFIGURATION
The basic co-cured metal wire fiberglass joint was separated into six individual
subjoint types. Each case was chosen because it represented a possible critical area in the
co-cured metal and fiberglass joint. Metal wire orientations, and placement of the crack
initiation site in reference to the metal wire, were the major variables used to formulate
each of the cases. These areas represent areas that bond metal to metal with resin, bond
fiberglass to metal, or where there are major changes in the stiffness of the structure.
Critical Area One (Figure 18), is located to address the possibility of a crack forming in
manufacturing and propagating into the joint, and to investigate the possibility of de-
lamination of the fiberglass as a load is applied to the structure. Critical Area Two
represents the interface boundary between the fiberglass and wire mat. Lastly, Critical
Area Three investigates the bond between two layers of wire mat [6].
Figure 18. Critical Areas (From [9])
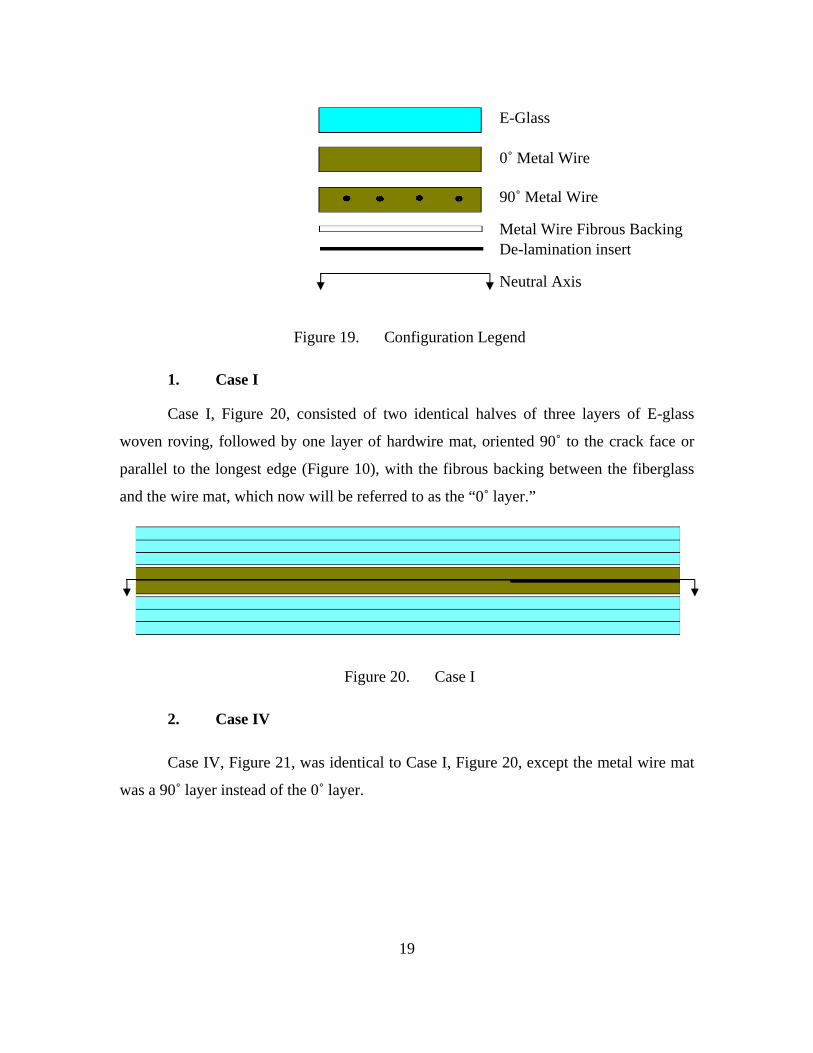
The following figures and descriptions represent the specific configurations
investigated during this study. Figure 19 is a legend corresponding to the materials used
for the coupons. This study builds on research performed during LT William Shultz’s
thesis [9], therefore, case numbering follows his format and is not sequential.
19
Figure 19. Configuration Legend
1. Case I
Case I, Figure 20, consisted of two identical halves of three layers of E-glass
woven roving, followed by one layer of hardwire mat, oriented 90˚ to the crack face or
parallel to the longest edge (Figure 10), with the fibrous backing between the fiberglass
and the wire mat, which now will be referred to as the “0˚ layer.”
Figure 20. Case I
2. Case IV
Case IV, Figure 21, was identical to Case I, Figure 20, except the metal wire mat
was a 90˚ layer instead of the 0˚ layer.
E-Glass
0˚ Metal Wire
90˚ Metal Wire
Metal Wire Fibrous Backing De-lamination insert
Neutral Axis

20
Figure 21. Case IV
3. Case V
Case V consisted of four layers of fiberglass, followed by the de-lamination insert
and then four more layers of fiberglass (Figure 22).
Figure 22. Case V
4. Case VII
Case VII investigated how a crack would propagate into the tip of the co-cured
joint. It consists of four layers of fiberglass followed by a 0˚ layer metal wire mat with
the fibrous backing side down and four more layers of fiberglass. Notice that the wire
mat is oriented 0.24 inches from the de-lamination insert, Figure 23.
Figure 23. Case VII
0.25” space

21
5. Case VIII
Case VIII contains two sheets of wire mat, aligned at 90˚ to each other. The top
wire mat was set with fibrous backing facing up, with the wire bundles at a 90˚
orientation. The second layer of wire mat was set with the fibrous backing side down,
and with the wire mat in a 0˚ layer orientation (Figure 24). The Metal wire layers are
surrounded by three layers of E-glass on top and bottom, as in Case I, Figure 20.
Figure 24. Case VIII
6. Case IX
Case IX was the only asymmetric case tested. It had four layers of fiberglass
followed by the de-lamination insert, then a layer of 0˚ layer wire mat, with the fibrous
backing facing up, and followed by two more layers of fiberglass (Figure 25).
Figure 25. Case IX

22
THIS PAGE INTENTIONALLY LEFT BLANK
23
III. TESTING
A. OVERVIEW
Samples were tested using an Instron Tension/Compression Machine (Model
Number: 4507/4500) with 10 kN load cell. Series IX computer software was used to
control displacement, and record displacement and load values. All tests were performed
at the rate of 2 mm displacement per minute.
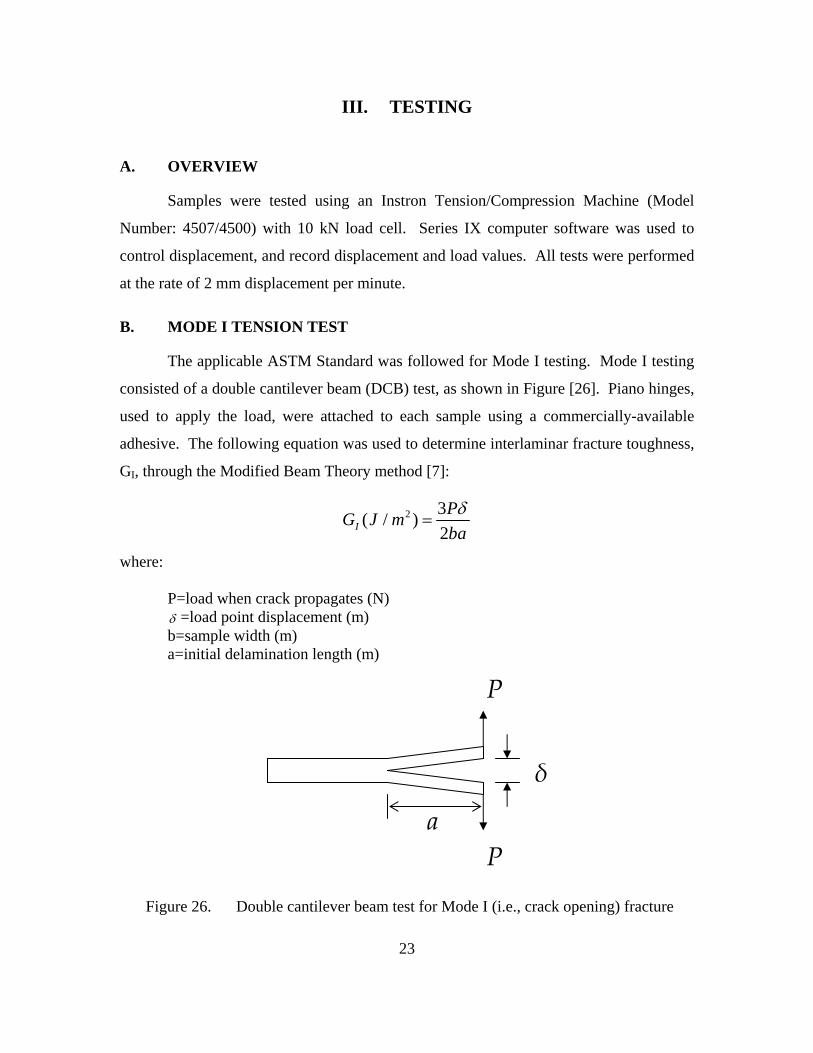
B. MODE I TENSION TEST
The applicable ASTM Standard was followed for Mode I testing. Mode I testing
consisted of a double cantilever beam (DCB) test, as shown in Figure [26]. Piano hinges,
used to apply the load, were attached to each sample using a commercially-available
adhesive. The following equation was used to determine interlaminar fracture toughness,
GI, through the Modified Beam Theory method [7]:
2 3( / )
2I
PG J m
ba
where:
P=load when crack propagates (N) =load point displacement (m) b=sample width (m) a=initial delamination length (m)
Figure 26. Double cantilever beam test for Mode I (i.e., crack opening) fracture
δ
P
P
a

24
THIS PAGE INTENTIONALLY LEFT BLANK

25
IV. RESULTS AND DISCUSSION
Several different subjoints of the co-cured E-glass/metal-wire hybrid interface
were investigated. Each sample was evaluated for mode I interlaminar fracture toughness
(GI), and failure mode (Figure 27). Seven samples were tested for each case and the
fracture toughness values represent an average of at least five samples.
A. INTERLAMINAR FRACTURE TOUGHNESS IN MODE I
Figure 27 shows that Cases IV, VIII, and IX had significantly higher interlaminar
fracture toughness values than the other three subjoint orientations. On the other hand,
Case I, 0º/0º metal-wire orientation, resulted in the lowest value of interlaminar fracture
toughness. It is important to note that for all follow-on discussion and comparisons, only
the average values of interlaminar fracture toughness will be considered.
Figure 27. Mode I Interlaminar Fracture Toughness
Range of Values
Average Value
26
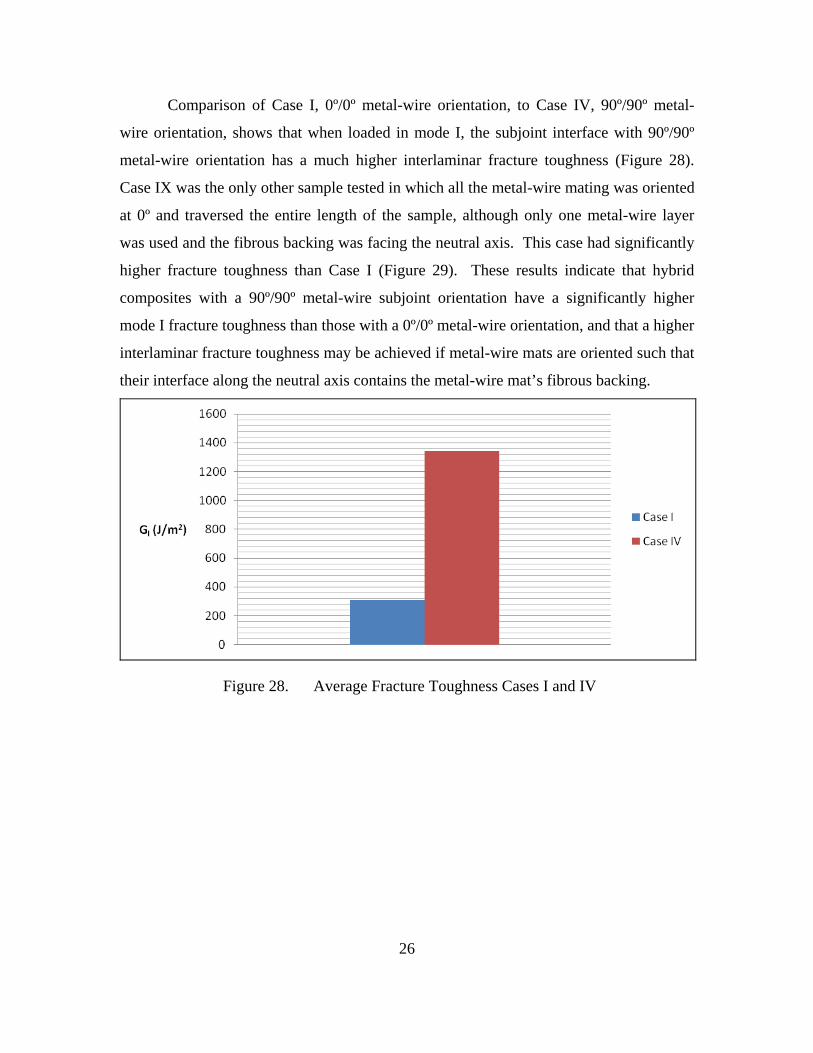
Comparison of Case I, 0º/0º metal-wire orientation, to Case IV, 90º/90º metal-
wire orientation, shows that when loaded in mode I, the subjoint interface with 90º/90º
metal-wire orientation has a much higher interlaminar fracture toughness (Figure 28).
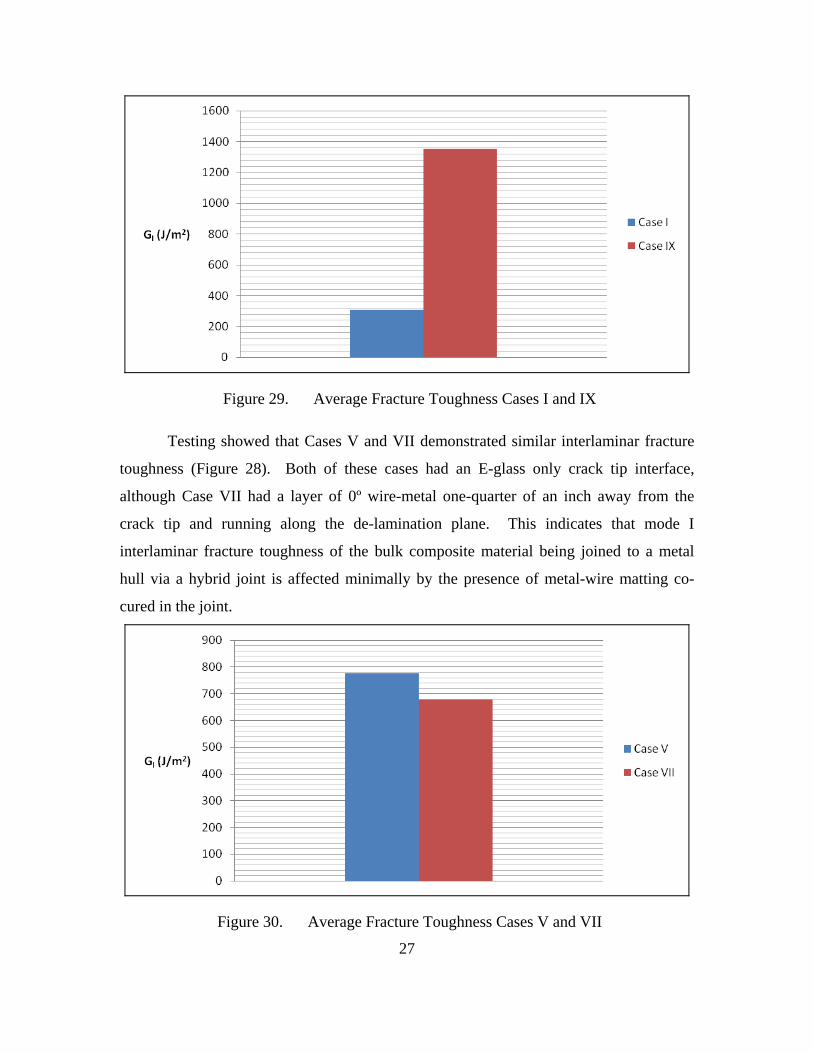
Case IX was the only other sample tested in which all the metal-wire mating was oriented
at 0º and traversed the entire length of the sample, although only one metal-wire layer
was used and the fibrous backing was facing the neutral axis. This case had significantly
higher fracture toughness than Case I (Figure 29). These results indicate that hybrid
composites with a 90º/90º metal-wire subjoint orientation have a significantly higher
mode I fracture toughness than those with a 0º/0º metal-wire orientation, and that a higher
interlaminar fracture toughness may be achieved if metal-wire mats are oriented such that
their interface along the neutral axis contains the metal-wire mat’s fibrous backing.
Figure 28. Average Fracture Toughness Cases I and IV
27
Figure 29. Average Fracture Toughness Cases I and IX
Testing showed that Cases V and VII demonstrated similar interlaminar fracture
toughness (Figure 28). Both of these cases had an E-glass only crack tip interface,
although Case VII had a layer of 0º wire-metal one-quarter of an inch away from the
crack tip and running along the de-lamination plane. This indicates that mode I
interlaminar fracture toughness of the bulk composite material being joined to a metal
hull via a hybrid joint is affected minimally by the presence of metal-wire matting co-
cured in the joint.
Figure 30. Average Fracture Toughness Cases V and VII
28
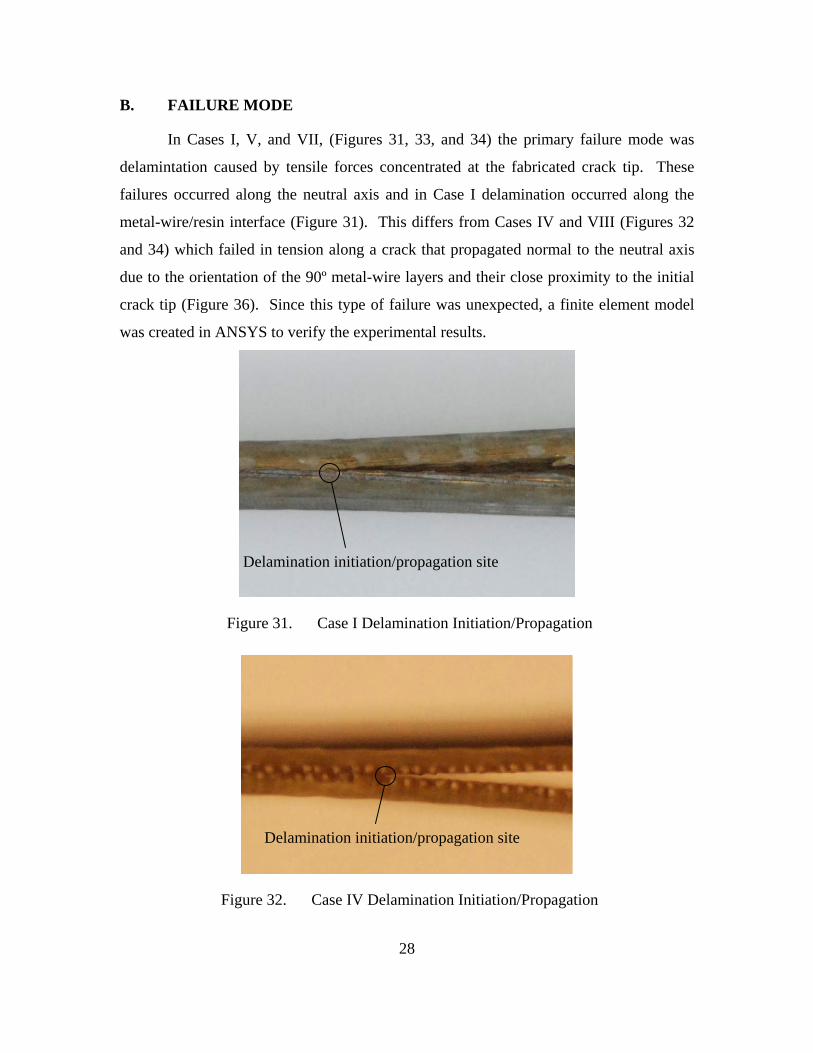
B. FAILURE MODE
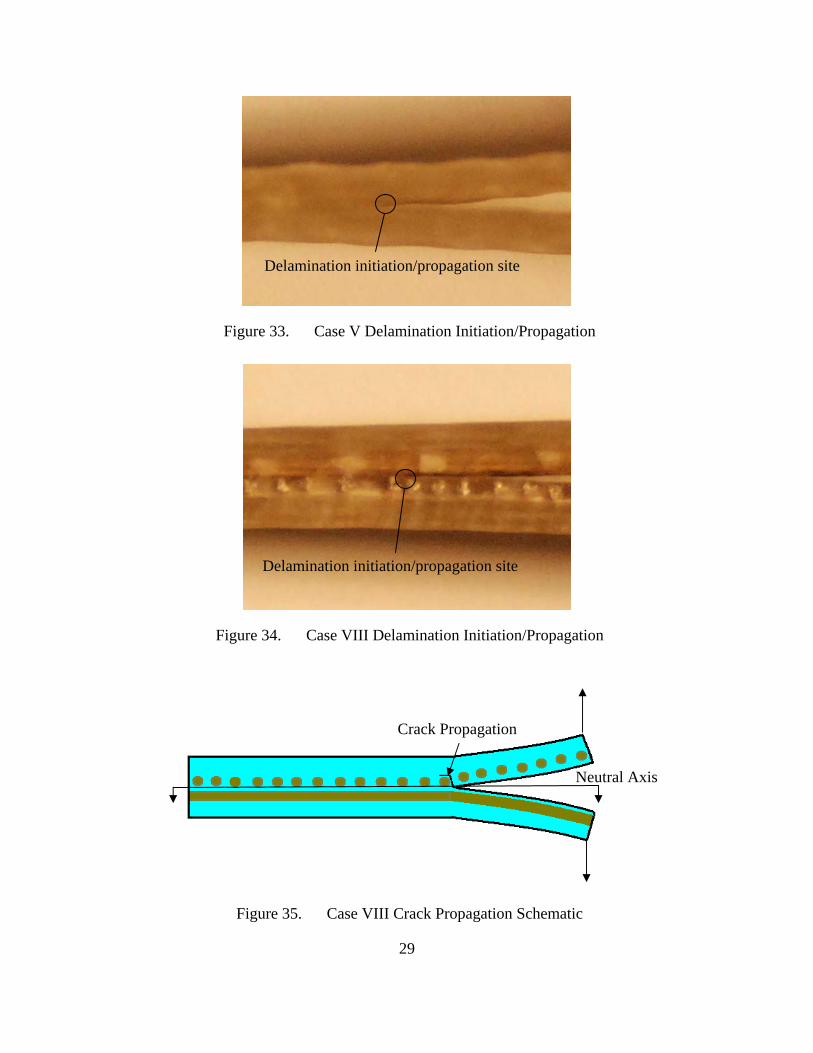
In Cases I, V, and VII, (Figures 31, 33, and 34) the primary failure mode was
delamintation caused by tensile forces concentrated at the fabricated crack tip. These
failures occurred along the neutral axis and in Case I delamination occurred along the
metal-wire/resin interface (Figure 31). This differs from Cases IV and VIII (Figures 32
and 34) which failed in tension along a crack that propagated normal to the neutral axis
due to the orientation of the 90º metal-wire layers and their close proximity to the initial
crack tip (Figure 36). Since this type of failure was unexpected, a finite element model
was created in ANSYS to verify the experimental results.
Figure 31. Case I Delamination Initiation/Propagation
Figure 32. Case IV Delamination Initiation/Propagation
Delamination initiation/propagation site
Delamination initiation/propagation site
29
Figure 33. Case V Delamination Initiation/Propagation
Figure 34. Case VIII Delamination Initiation/Propagation
Figure 35. Case VIII Crack Propagation Schematic
Delamination initiation/propagation site
Delamination initiation/propagation site
Crack Propagation
Neutral Axis

30
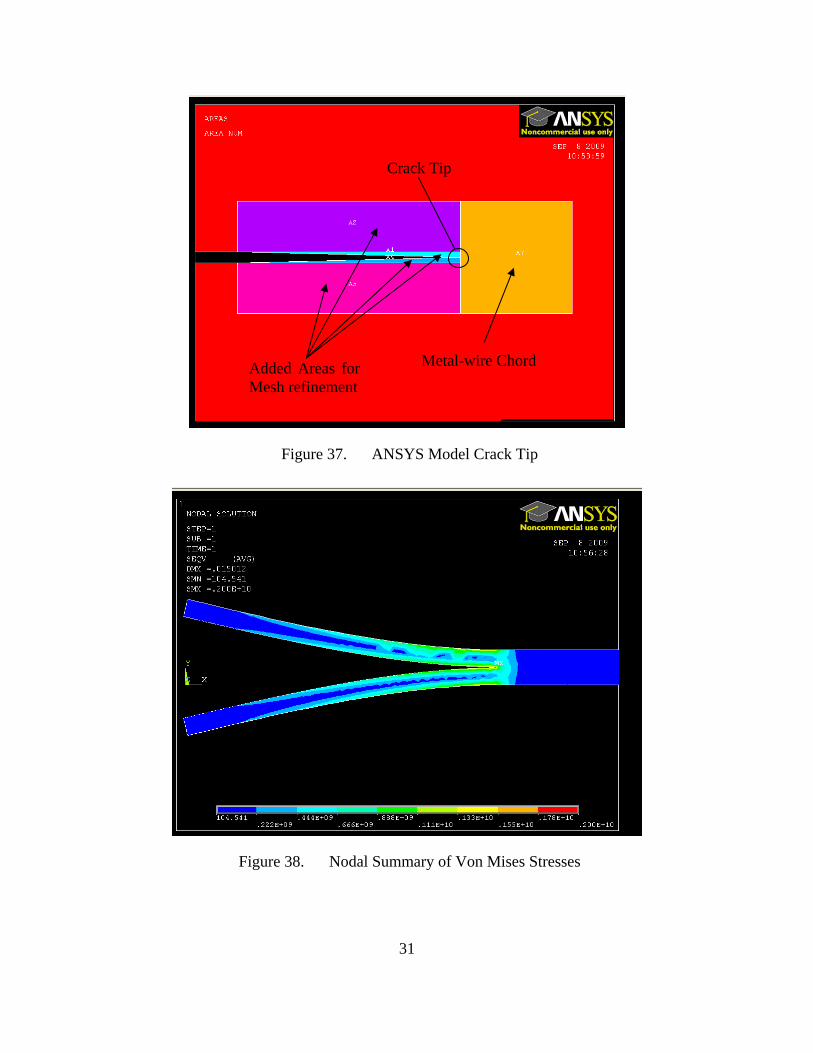
The finite element ANSYS model was created with dimensions of a typical
sample and a 90º metal-wire chord inserted at the crack tip (Figures 36 and 37).
Properties of both E-glass and the metal-wire were defined and the model was meshed
using triangular shapes. The mesh in areas 1, 2, 4, 5, and 7 were refined in order to
obtain more accurate results in the vicinity of the crack tip because force analysis is being
conducted in this area. The right edge was fixed and a displacement force of 0.015m and
-0.015m was applied to the nodes at the top and bottom left corners of the model
respectively. The model was solved under plane strain conditions, and then Von Mises
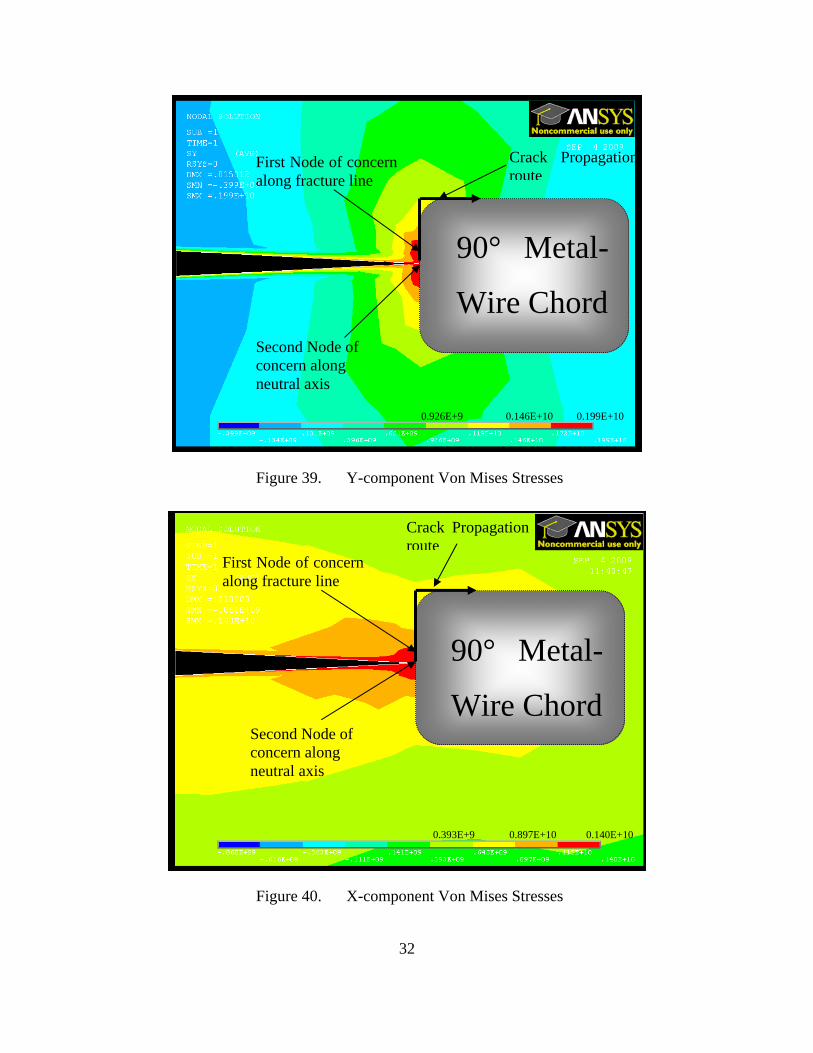
forces were calculated and displayed on contour plots (Figures 38, 39 and 40). Analysis
of the forces in the x and y directions at the two nodes of concern along the crack
propagation route (Figures 39 and 40) show that the sample must have failed in tension
due to forces in the x-direction. This failure occurred as the sample delaminated in a
direction perpendicular to the neutral axis and along the resin/metal-wire chord interface.
This analysis showed that the sample was able to withstand higher loading than those
without a 90º metal-wire chord because the forces in the y-direction, that cause tensile
failure in along the neutral axis in cases I, V, and VII, were not high enough to cause a
tensile failure in the metal-wire chord. Therefore tensile failure occurred normal to the
neutral axis as the bending caused by the applied load caused the forces in the x-direction
to increase above the tensile strength of the resin/wire-mat interface.
Figure 36. ANSYS Model Geometry
31
Figure 37. ANSYS Model Crack Tip
Figure 38. Nodal Summary of Von Mises Stresses
Metal-wire Chord
Crack Tip
Added Areas for Mesh refinement
32
Figure 39. Y-component Von Mises Stresses
Figure 40. X-component Von Mises Stresses
90° Metal-
Wire Chord Second Node of concern along neutral axis
First Node of concern along fracture line
Crack Propagation route
Second Node of concern along neutral axis
First Node of concern along fracture line
Crack Propagation route
90° Metal-
Wire Chord
0.199E+10 0.146E+100.926E+9
0.140E+10 0.897E+100.393E+9

33
Case IX (Figure 41) was of particular interest because it demonstrated high values
for interlaminar fracture toughness, but its metal-wire layer was oriented at 0º. The
difference between this case and Case I is that, its metal-wire mat was oriented such that
the fibrous backing was positioned along the neutral axis. This orientation provided the
same stiffness increase as in a sample oriented with the wire chords along the neutral
axis, but forced de-lamination to occur in a direction nearly perpendicular to the neutral
axis. This caused failure due to tension in a direction normal to the neutral axis. This
shows from Figure 27 that, particularly with 0º layer oriented metal-wire, mode I
interlaminar fracture toughness can be increased dramatically if the metal-wire layers are
oriented such that the fibrous backing is along the neutral axis.
Figure 41. Case XI Delamination Initiation/Propagation
Delamination initiation/propagation site

34
THIS PAGE INTENTIONALLY LEFT BLANK

35
V. CONCLUSIONS AND RECOMMENDATIONS
This study investigated several different subjoints of the co-cured E-glass/metal-
wire hybrid interface. The subjoints consisted of samples with metal-wire mat
orientations of 0º, 90º, and one with both 0º and 90º. Each sample was evaluated for
mode I interlaminar fracture toughness (GI) and failure mode. Seven samples were tested
for each case, and the fracture toughness values represent an average of at least five
samples.
Testing showed that the samples containing at least one 90º metal- wire layer had
the highest interlaminar fracture toughness value. The samples with one layer of 0º
metal-wire mat oriented with the fibrous backing facing the neutral axis also
demonstrated high fracture toughness values. Case I, 0º/0º metal-wire orientation,
resulted in the lowest value of interlaminar fracture toughness. These results indicate that
samples with at least one 90º metal-wire mat, or fibrous backing along the neutral axis
orientation, have the highest values of mode I interlaminar fracture toughness.
Investigation of failure mode showed that delamination began along the neutral
axis in all cases, but propagation of the delamination was dependent on wire-mat
presence and orientation. The samples with the lowest values of interlaminar fracture
toughness failed in tension and delamination propagation occurred along the neutral axis.
Samples with the highest values delaminated around the 90º metal-wire chords or fibrous
backing in a direction perpendicular to the neutral axis. In all cases containing metal-
wire, delamination occurred at the resin/metal wire interface. Two conclusions can be
drawn from this. First, metal-wire layers in a hybrid joint should be oriented in various
directions to promote propagation of cracks in directions normal to the force applied.
Second, further surface treatments should be performed to increase the bonding strength
between the resin and metal wire chords.
Analysis of this study’s results and previous work done by Y.W. Kwon [6] shows
that, with respect to naval applications, where most often the loading direction is random
or unknown, hybrid joints should not use metal-wire layers oriented in the same direction
because these layers produce the weakest interface when loaded in a direction normal to

36
the wire orientation. Rather, metal-wire layers should be oriented in much different
orientations, such as in the 0º/90º samples, which showed high values for interlaminar
fracture toughness in both studies. Future study of this topic should include testing with
90º orientation of metal-wire layers and fibrous backing along the neutral axis. Also,
research should be done to find a surface preparation method that will allow the resin to
bond to the metal-wire mats more effectively.

37
APPENDIX: MODE I DATA
Case I
Sample # P (N) b(m) a(m) δ (m) G (J/m^2)
1 61.557 0.0254 0.064 0.00574 326.0597
2 55.936 0.0254 0.061 0.005421 293.5611
3 55.711 0.0254 0.061 0.005656 305.0549
4 53.5 0.0254 0.062 0.0057 290.4655
5 61.089 0.0254 0.064 0.005869 330.8299
Case IV
Sample # P (N) b (m) a (m) δ (m) G (J/m^2)
1 61.9 0.0254 0.063 0.03389 1966.433
2 49.7 0.0254 0.063 0.0258 1201.969
3 52.7 0.0254 0.063 0.03015 1489.412
4 46.7 0.0245 0.063 0.0237 1075.598
5 45.63 0.0254 0.063 0.0233 996.6057
Case V
Sample # P (N) b (m) a (m) δ (m) G (J/m^2)
1 45.6 0.0254 0.062 0.02074 600.5486
2 50.74 0.0254 0.062 0.02583 832.2417
3 52.7 0.0254 0.062 0.0315 1054.134
4 47.7 0.0254 0.062 0.0237 717.8626
5 45.6 0.0254 0.062 0.0233 674.6761
Case VII
Sample # P (N) b (m) a (m) δ (m) G (J/m^2)
1 51.179 0.0254 0.063 0.01179 565.6172
2 47.955 0.0254 0.063 0.01041 467.9523
3 48.364 0.0254 0.062 0.011266 518.9886
4 58.311 0.0254 0.062 0.01583 879.2194
5 64.41 0.0254 0.062 0.01563 958.9106

38
Case VIII
Sample# P (N) b (m) a (m) δ (m) G (J/m^2)
1 82.694 0.0254 0.064 0.01968 1501.677
2 63.883 0.0254 0.064 0.017035 1004.165
3 76.11 0.0254 0.064 0.02024 1421.444
4 77.71 0.0254 0.064 0.02437 1747.471
5 72.42 0.0254 0.064 0.01978 1321.79
Case IX
Sample # P (N) b (m) a(m) δ (m) G (J/m^2)
1 56.9 0.0254 0.062 0.016 867.1577
2 70.7 0.0254 0.062 0.0231 1555.598
3 73.6 0.0254 0.062 0.024 1682.499
4 70.1 0.0254 0.062 0.0225 1502.334
5 60 0.0254 0.062 0.02016 1152.146
Summary
1 2 3 4 5Hi Lo Avg
Case I 326 293.5 305 290 330.8 330.8 290 309.06
Case IV 1966 1202 1489 1075.5 997 1966 997 1345.9
Case V 600 832 1054 718 675 1054 600 775.8
Case VII 564.6 468 519 879.2 958.9 958.9 468 677.94
Case VIII 1501.7 1004 1421.4 1747.5 1321.8 1747.5 1004 1399.28
Case IX 867 1556 1682 1502 1152 1682 867 1351.8
39
LIST OF REFERENCES
[1] J. H. Oh, “Optimum bolted joints for hybrid composite materials,” Composite Structures, vol. 38, pp. 329–341, May 1997.
[2] T.J. Reinhart, Composites-Engineered Materials Handbook, vol. 1, Metals Park OH, ASM International, 1987, pp. 665–728,
[3] J.H. Kim, “Evaluation of fatigue characteristics for adhesively-bonded composite stepped lap joint,” Composite Structures, vol. 66, New York, NY: Elsevier Science Ltd, 2004, pp. 69–75.
[4] S. M. Graham, “Analysis of a co cured innovative hybrid joint for Marine Composites,” presented at SAMPE 2004, May 16–20, Long Beach Convention Center, Long Beach, CA, 2004.
[5] Ashland Composite Polymers, Composite Polymer Fabrication Tips, Bulletin #2898, Ashland Chemical Corporation, Dublin OH, 2005.
[6] Y. W. Kwon, “Experimental Study of Mode II Fracture of Hybrid Composite and Metal-Wire Joints,” Dept. of Mechanical & Astronautical Engineering, Naval Postgraduate School, Monterey, CA, 2009.
[7] ASTM Standard D 5528–01, “Mode I Interlaminar Fracture Toughness of Unidirectional Fiber-Reinforced Polymer Matrix Composites,” March 2002.
[8] J. G. Williams, “On the calculation of energy release rates for cracked laminates,” International Journal of Fracture, vol. 36, pp. 101–119, 1988.
[9] W. Schultz, “Experimental Study of Composites and Metal-Wire Joints” Master’s thesis, Naval Postgraduate School, Monterey CA, 2008.

40
THIS PAGE INTENTIONALLY LEFT BLANK

41
INITIAL DISTRIBUTION LIST
1. Defense Technical Information Center Ft. Belvoir, Virginia
2. Dudley Knox Library Naval Postgraduate School Monterey, California
3. Professor Young Kwon Naval Postgraduate School Monterey, California
4. Research Assistant Professor Jarema M. Naval Postgraduate School Monterey, California
5. Douglas C. Loup Naval Surface Warfare Center, Carderock Division West Bethesda, Maryland
6. Erik A. Rasmussen Naval Surface Warfare Center Carderock Division West Bethesda, Maryland
7. Scott W. Bartlett Naval Surface Warfare Center Carderock Division West Bethesda, Maryland
8. Engineering and Technology Circular Office, Code 34 Naval Postgraduate School Monterey, California
9. John McWaid
Integrated Composites Inc. Marina California
10. Joseph E. Klopfer Naval Postgraduate School Monterey, California