navigant: north american natural gas market outlook - year-end 2014: a view to 2035
TRANSCRIPT

OilMarket Notes
Gas
Contents1 North American Natural Gas
Market Outlook – Year-End 2014: A View to 2035
9 Natural Gas Market Charts
12 Oil Market Charts
16 Legislative and Regulatory Highlights
17 About Navigant
North American Natural Gas Market Outlook
Year-End 2014: A View to 2035 Following an eventful year, the natural gas industry is poised to enter a new era with the opening of significant liquid natural gas (LNG) export capacity from the United States, which promises to alter the fundamental dynamics of worldwide natural gas markets. The latest edition of Navigant’s North American Natural Gas Market Outlook details the significant challenges facing infrastructure development, particularly the build-out of pipeline capacity and export terminals. The Outlook also examines the culmination of a half-decade of project development in the LNG sector, as Cheniere’s Sabine Pass export project gets set for its first delivery later this year—the epitome of a market transformation as a result of technological breakthroughs and rapid busi-ness shifts.
These and other factors influenced the forecasts and conclusions in the North American Natural Gas Market Outlook, Year-End 2014, which is highlighted below.
2014 Summary
With temperatures 10% below normal in the first quarter in the United States and natural gas prices and demand at all-time highs, 2014 started like a lion. By the end of the year, select natural gas prices were at all-time lows, while U.S. demand and stor-age had returned to more normal levels. But the real story of 2014 was the continued growth in total North American gas production.
U.S. gas production expanded by a full 6.1 billion cubic feet per day (Bcfd), or 9.2%, in 2014. Much of this growth came from shale gas production in the Northeast—particularly from the Marcellus shale formation. Growth in the Marcellus remained exceptionally strong, increasing by more than 27.6% over the course of the year, according to LCI Energy, almost singlehandedly dwarfing all other gas developments in the North American gas sector. Production in the Utica shale basin also increased, starting from a much lower base but growing at an even higher rate, increasing by 190%, with December production peaking at 1.9 Bcfd. Production in this region is expected to continue to grow, as the Marcellus, in particular, shows no signs of letting up anytime soon.

2
March 2015
O&G Market Notes
The transformation of the natural gas market in North America was also driven by important U.S. regulatory developments last year. These changes reflect at least a measure of recognition by the U.S. government that the new market conditions—abundant supply, lower prices, and the potential of natural gas as a practical alterna-tive to address climate change—have fundamental implications for natural gas as a key element of an even broader energy platform in the future. Taking advan-tage of market forces that have already paved the way for fuel-switching from coal to gas, the Environmental Protection Agency (EPA) proposed new carbon regula-tions. Proposed in June 2014, the EPA’s Clean Power Plan (CPP) centers around rules to limit CO2 emissions from existing power plants on a state level.
Although the plan is still at the proposal stage and is likely to face serious legal and political challenges, the CPP—which builds on existing federal regulations aimed at reducing emissions from power plants, such as the Mercury and Air Toxics Standards (MATS)—sets the stage for continued dramatic declines in coal-fired generation capacity through 2025. Those declines are likely to be offset by additional generation from natural gas and renewables.
In fact, the only constraint on future growth appears to be the development of infrastructure to deliver gas from the producing basins, where it is currently stranded, to the surrounding demand regions where it is needed. Coming on top of the displacement of import volumes delivered into the Northeast via the TransCanada mainline, this infrastructure expansion will likely have broad market impacts across North America. While the challenges facing infrastructure development should not be mini-mized, the question is not whether the pipeline network will be reconfigured, but when.
The other major development in 2014 was the continued development of the LNG export sector. Specifically, after a decade of project development, Cheniere’s Sabine Pass project is in its final stages and is likely to start its first deliveries by early next year. This project has set the stage for a new phase of export activity from North America.
Three more applications for LNG exports from the United States were approved in 2014, bringing the total number of approved export projects to non-free trade agreement (FTA) countries to eight. Coming through an LNG export approval process that began with the first approval in 2011, these eight projects encompass seven sites across the country, on the East, Gulf, and West coasts, amounting to a total approved capacity of 10.5 Bcfd. Remaining filed applications for non-trivial projects amount to 17 additional project sites, rep-resenting an additional 27.7 Bcfd of LNG capacity to non-FTA countries.
In Canada, four LNG export applications were approved last year, including two U.S. West Coast applications by the Canadian National Energy Board in Oregon—Jordan Cove LNG and the OLNG export proj-ect. This important new market for natural gas in North America is detailed in the Outlook.
Although the U.S. Department of Energy (DOE) approval process has been streamlined in recent years, a new rule requiring environmental approval from the Federal Energy Regulatory Commission (FERC) prior to the export application issuance could slow future approvals, at least in the near term.
Navigant is recognized for having long-established and widely confirmed assessments as to the abundance of shale gas in North America. Our team has been involved in extensive research and analysis on the commercial and economic impacts of the abundance of supply, even before this abundance was widely acknowledged. This expertise has once again been drawn upon to develop our North American Natural Gas Market Outlook, Year-End 2015.

3
March 2015
O&G Market Notes
Supply Outlook: A Rapidly Changing Market
Fueled by the ongoing develop-ment of North American shale gas resources, the North American natu-ral gas market can only be character-ized as supply-driven. According to LCI, dry natural gas production in the United States grew from 66.6 Bcfd in January 2014 to 72.7 Bcfd in December. The increased produc-tion is a result of higher drilling efficiencies, increased drilling in liquids-rich plays, and infrastruc-ture expansions, especially in the Northeast. Natural gas prices are likely to recover in the coming years, leading to renewed drilling activi-ties in currently dormant dry plays, including Haynesville, Fayetteville, and Barnett.
Offshore areas of the Gulf of Mexico represent another basin that has been affected by prolific shale gas produc-tion but that stands ready to support gas markets in the future. In the near term, the bulk of U.S. dry natural gas production growth is projected to come from the Appalachian basin and from Eagle Ford basin in Texas. Currently, these three basins (Gulf of Mexico, Appalachian, and Eagle Ford) supply 55% of total shale gas production across the country. As shown in Figure 1, shale growth in the United States is expected to more than offset declines in conventional production over the next 20 years.
Figure 2 demonstrates how increased supply has pushed Henry Hub natural gas prices down to levels that have not been seen for a decade. Figure 2 also shows annual average natural gas prices at Henry Hub stabilizing over the near to mid-term and prices over the long term reach-ing only moderate levels compared to the highs seen earlier this century.
FIGURE 1. U.S. NATURAL GAS SUPPLY OUTLOOK
FIGURE 2. HENRY HUB OUTLOOK
Source: Navigant
Source: Navigant, ICE
Non-Shale
Shale
-10
10
30
50
70
90
110
2005
2007
2009
2011
2013
2015
2017
2019
2021
2023
2025
2027
2029
2031
2033
2035
Bcfd
Net LNG Imports
Net Pipe Imports
Net LNG Imports
$0
$2
$4
$6
$8
$10
$12
2001 2005 2009 2013 2017 2021 2025 2029 2033
2014
$/Mm
btu

4
March 2015
O&G Market Notes
In order to illustrate the effect of large production increases in the Marcellus and Utica basins and the subsequent impact of stranded gas on prices, Figure 3 shows the difference in price between the NYMEX Dominion South Point prompt month con-tract and the 12th month-out con-tract. In 2009, the 12th month-out contract traded at a premium to the prompt month contract, indicating that prices were expected to rise in the next year. After mid-2013, however, the premium of the 12th month con-tract disappeared. At that point, except for a spike in early 2014, the market began to price next year’s gas at today’s prices—indicating that the market expects additional production from this region to keep prices low for the year to come.
Production of shale gas in the Appalachian basin has con-tinued to grow at an unprecedented rate, providing the main reason for this price decline. Figure 4 is a graph of the NYMEX January 2015 contract for Dominion South point. As shown in the graph, when the contract first started to be traded, in April, the price was around $4.00 per million BTU (MMBtu). By the end of the summer, the price was down to around $3.00 per MMBtu. When the contract finally closed at the end of December, the price had fallen under $2.00 per MMBtu.
FIGURE 4. JAN 2015 CONTRACT PRICE FOR DOMINION SOUTH POINT
Source: Navigant, New York Mercantile Exchange, Ventyx
FIGURE 3. DOMINION SOUTH POINT NYMEX PROMPT MONTH CONTRACT VS. 12TH MONTH-OUT CONTRACT
Source: Navigant, New York Mercantile Exchange, Ventyx
$1.00
$3.00
$5.00
$7.00
1/1/2009 1/1/2010 1/1/2011 1/1/2012 1/1/2013 1/1/2014 1/1/2015
Prompt Month 12 month
-$2.00
-$1.00
$0.00
$1.00
$2.00
$3.00
Spread
$1.50$2.00$2.50$3.00$3.50$4.00$4.50
$/MMB
tu
Trade Date
Jan-2015 NYMEX Contract Price for Dominion South Point

5
March 2015
O&G Market Notes
Many factors have contributed to the fall of the Dominion price, but one of the main contributing factors is the mismatch of pipeline infrastructure to available supply in the region. The growth in production of Marcellus and Utica shale gas has outpaced the addi-tion of takeaway capacity in the region, leaving gas stranded. As a result, prices are dropping. The Outlook shows addi-tional infrastructure coming online around 2017, allowing the stranded gas to move to market, and prices increas-ing to match the levels in the broader North American gas market, as shown in Figure 5.
The additional forecast takeaway capacity in the Northeast is expected to affect the broader gas market as well. This is particularly true for the East North Central (ENC) Census region of the United States and the Canada East (CAN-E) region of Canada. With the Rover and Atlantic Sunrise pipelines expected to come online in the next few years, the ENC is likely to see an increase in flows from the Appalachian region of about 1 Bcfd, while the CAN-E region will see an increase of about 0.5 Bcfd by year-end 2017.
The potential pipeline build-outs in the Northeast, as well as other capacity additions, have far-reaching implications for prices further upstream and downstream into areas as far as Western Canada, the MidContinent market in Chicago, and back down into the Gulf producing region.
FIGURE 5. YEAR-END 2014 PRICE FORCAST – DOMINION SOUTH POINT
FIGURE 6. CHANGE IN SUPPLY FROM THE APPALACHIAN BASIN TO SELECT CENSUS DIVISIONS
Source: Navigant, Platts
Source: Navigant
$-
$1.00
$2.00
$3.00
$4.00
$5.00
2015 2017 2019 2021 2023 2025
2014
$ / M
MBt
u
Year-End 2014 Price Forecast: Dominion South Point

6
March 2015
O&G Market Notes
Demand Outlook: A More Balanced Market
Again, abundant supply has had a strong impact on prices across the United States and Canada. The Outlook foresees a period of declining natural gas prices in the near term giving way to more stable, less volatile prices over the long term. Natural gas demand from all sectors—including the stagnant residential and commercial markets, the still tepid industrial sector, new LNG exports, the potential spread of natu-ral gas vehicles, and, most importantly, the electricity generation sector—is expected to grow. Over time, increased demand and access to growing gas supplies will result in a relatively more balanced market that exhibits improved reliability and lower price volatility.
Figure 7 shows expected U.S. natu-ral gas demand through 2035. Overall demand is projected to grow signifi-cantly, primarily driven by the electric generation sector.
Figure 8 illustrates the four key areas of gas demand growth: industrial demand recovery in the near term, the emer-gence of North American LNG exports in the mid-term, growth in the natural gas vehicle sector in the long term, and stable growth in the gas-fired generation sector throughout the forecast.
Over the next several years, low natural gas prices are expected to drive indus-trial market growth while increasing overall natural gas demand. Despite concerns about a run-up in natural gas prices (particularly in the more price-sensitive industrial sector), the Outlook does not foresee sudden and dramatic price increases. The North American natural gas resource base is more than adequate, and the history of the gas pipeline industry demonstrates an ability to connect available supply to demand when needed. Those factors will tend to mitigate significant upward price pressure from increasing market demand.
FIGURE 7. U.S. NATURAL GAS DEMAND OUTLOOK
FIGURE 8. U.S. INCREMENTAL NATURAL GAS DEMAND FROM 2014 LEVELS BY SECTOR
Source: Navigant
Source: Navigant
Electric
Industrial
Residential
Commercial
Vehicle
0
20
40
60
80
100
2001
2002
2003
2004
2005
2006
2007
2008
2009
2010
2011
2012
2013
2014
2015
2020
2025
2030
2035
Bcfd
0 5 10 15 20 25 30 35 40
2035
2030
2025
2020
2015
Bcfd
Electric LNG Exports Vehicle Industrial

7
March 2015
O&G Market Notes
While we view the industrial sector as having room for additional growth, the new LNG export sector has even more potential. Figure 9 below provides Navigant’s forecast for North American LNG exports. The largest potential for U.S. LNG exports comes from the Gulf region, while in Canada it from comes the West Coast. Overall, North America is expected to produce a total of 9.3 Bcfd of potential LNG exports by 2021 (up to 7.3 Bcfd from the United States and 2 Bcfd from Canada).
The potential for growth in the LNG export sector is great, but there are still several hurdles to overcome. The LNG market is global in expanse but regionally diverse, which presents many opportuni-ties but can be also be a complicating factor. Regulatory factors, including the slow pace of the U.S. regulatory approvals process, have created unnecessary barriers to entry for new market participants. LNG projects are large and costly, creating uncertainty and complexity due to financial and commercial issues. Finally, competi-tion from multiplying suppliers around the world creates additional challenges as well as rich opportunities for market participants. Those challenges notwithstanding, North America represents the largest, most transpar-ent, and most liquid gas market in the world, with price levels that are likely to remain among the lowest globally over the long term.
Demand Influencers
The outlook for global LNG demand is likely to be strong according to the Outlook, particularly in the Asia Pacific market. In Asia Pacific alone, the gap between supply and demand is expected to grow from 13.0 Bcfd in 2012 to 42.9 Bcfd in 2030, according to BP’s Energy Outlook 2035. This chasm represents 36% of the Asia Pacific market and 9.3% of the global market today. North America is well-positioned to capture a portion of this market, even if the share is less than the volumes pro-posed in LNG export applications currently pending in both the United States and Canada.
The wild card in demand projections is the natural gas vehicle (NGV) fuel sector. While NGVs have great poten-tial, they also face significant challenges, including the need for extensive infrastructure build-outs to compete with an oil-dominated transportation sector. In response
to increasing attention focused on NGVs, the Outlook’s previously conservative view of NGV penetration has increased slightly, with NGV demand growing from 0.1 Bcfd in 2013 to 5.1 Bcfd in 2035. This takes into consid-eration the fact that higher fuel efficiency standards for traditional cars are likely to reduce the price advantage that natural gas may have over gasoline and diesel, particularly in the near term. Government policy direc-tions could also have a large impact on fueling infrastruc-ture requirements and could increase the penetration of NGVs. We believe that more can and should be done by regulators and others to assist the sector.
As shown in previous editions of the Outlook, the larg-est growth in natural gas demand in North America is expected to come from electricity generation. Demand is expected to grow by 24.3 Bcfd from 2014 to 2035. Underlying this increase is a roughly 1% average annual growth rate in U.S. demand for electricity.
A number of factors will likely increase the role of natural gas as the preferred generation option. Recently proposed regulations from the EPA will likely prevent the construc-tion of new coal generation without carbon capture and storage. The cost of new nuclear power plants continues to rise, and they are not currently expected to be economi-cally viable. Thus, electricity load growth will need to be met by alternative energy sources—either renewables, natural gas, or both. The economics of these two gen-eration options will drive their future growth rates, and increasing alliances are likely to be forged across the natu-ral gas and renewable energy sectors.
FIGURE 9. NORTH AMERICAN LNG EXPORT OUTLOOK
Source: Navigant
Sabine
West Coast(U.S. & Can)
Other Gulf
East Coast
0
2
4
6
8
10
12
2015
2017
2019
2021
2023
2025
2027
2029
2031
2033
2035
Bcfd

8
March 2015
O&G Market Notes
Prior to 2020, the increase in natural gas demand in the electric generation sector is expected to come primarily from increased capacity factors of existing combined-cycle natural gas plants. The major contributing factor will be the wave of announced coal plant retirements due to the cost of complying with MATS, competition from low natural gas prices, and the advanced age of the coal generation fleet.
Over the longer term, the growth of gas-fired genera-tion could be moderated by the expansion of renew-able generation in many regions, largely driven by state Renewable Portfolio Standards (RPS) and by the EPA’s proposed carbon regulations.
Conclusions
To summarize, the Outlook suggests that North American natural gas supply will continue to grow, with an increas-ing share coming from shale gas production. The indus-try is likely to focus on four key natural gas demand areas:
» Electricity generation: The shift from coal to gas—driven by new regulations, low natural gas prices, and moderate growth in electricity demand—is expected to continue.
» Industrial: North American industrial activity is expected to be revitalized as a result of near-term low continental natural gas prices that increase competitiveness relative to other global regions.
» LNG exports: Still in the early stages of development, growing export capacity will for the first time in history connect North America to global markets, beginning early next year.
» Transportation: Currently focused on larger trucks and other modes of transportation such as trains and ships, the transportation sector contains large-scale potential for NGVs, including smaller vehicles that may need to be kick-started by technical and regulatory advances, such as access to home refueling.
Robust supply and rising demand leads to an optimistic outlook for North American natural gas, even as indig-enous gas supply moves to globalization, new regulatory challenges emerge, and competitors arise from new—and in some cases unexpected—regions.
— Edward O’Toole and Gordon Pickering
Developed by Navigant’s Global Energy Practice, The North American Natural Gas Market Outlook, Year-End 2014 uses an integrated process and a full suite of commer-cial software and proprietary energy market models to analyze the electric and fossil fuel markets. Navigant’s natural gas and power models are based on key assump-tions driving natural gas prices and consumption from gas-fired generation over the outlook period. The Outlook includes updated forecasts for natural gas prices, dry conventional and shale gas production, natural gas demand, pipeline flows, and gas storage activity.
The information contained in “North American Natural Gas Market Outlook – Year-End 2014” is a summary and reflects Navigant’s current expectations based on market data and trend analysis. Navigant’s market predictions and expectations are inherently uncertain and actual results may differ materially from those contained in this Outlook. Navigant undertakes no obligation to update any of the information contained in the Outlook.
About the Authors » Edward O’Toole is a Managing Consultant and Gordon Pickering is a Director in Navigant’s Global Energy Practice. Other members of Navigant’s modelling team, including Bob Gibb and Jeff Van Horne, provided assistance in this article.

9
March 2015
O&G Market Notes
Natural Gas Market Charts
MONTHLY GAS INDEX PRICE
$0
$2
$4
$6
$8
$10
$12
$14
$16
$18
$20
Feb-13 Jun-13 Oct-13 Feb-14 Jun-14 Oct-14 Feb-15
$/M
MB
tu
Chicago Opal New YorkAECO-C SoCal Gas Henry Hub
Sources: Navigant / ICE
Monthly index gas prices decreased 10% last month, with Henry Hub at $2.87/MMBtu for February versus $3.19/MMBtu for January. The February 2015 price was below the February 2014 price of $5.58/MMBtu by $2.71/MMBtu.
MONTHLY PRICES: OIL AND NATURAL GAS GULF COAST
$0
$2
$4
$6
$8
$10
$12
$14
$16
$18
Mar-11 Mar-12 Mar-13 Mar-14 Mar-15
$/M
MB
tu
WTI (Cushing, OK), Crude Oil
Henry Hub - Natural Gas Sources: Navigant / NYMEX
The most recent gas/oil price ratio rose to 2.8 times, with Henry Hub natural gas price at $2.89 versus WTI crude oil price at $8.01. The ratio one year prior was 3.4 times.
DAILY GAS PRICE
$0
$2
$4
$6
$8
$10
$12
$14
$16
$18
$20
$22
Feb-13 Jun-13 Oct-13 Feb-14 Jun-14 Oct-14 Feb-15$/
MM
Btu
New York ChicagoSo Cal Gas OpalHenry Hub Sources: Navigant / ICE
The daily spot prices ended February up 8% versus the end of Janu-ary, with Henry Hub at $3.11/MMBtu versus $2.88/MMBtu.
NYMEX FUTURES SETTLEMENT PRICES AT CLOSE
$2.50
$3.00
$3.50
$4.00
Jan-15 Apr-15 Jul-15 Oct-15 Jan-16
$/M
MB
tu
Sources: Navigant/NYMEX
Jan
Feb
Mar
The average 12-month strip price increased by 4 cents, or up 1%, to $3.04/MMbtu for the strip starting March 2015.

10
March 2015
O&G Market Notes
Natural Gas Market Charts
U.S. POPULATION-WEIGHTED HDD
0
200
400
600
800
1,000
Nov-14 Dec-14 Jan-15 Feb-15 Mar-15
HD
D
NOAA Normal ActualSources: Navigant / NWS CPC
Degree days for the current month are projected from weekly degree days to date
Frigid weather put heating degree days for February 20% above normal, with the season now 3% cooler than normal.
U.S. GAS STORAGE
500
1,000
1,500
2,000
2,500
3,000
3,500
4,000
4,500
Bcf
Range (2005-2014) 20102011 20122013 20142015
Jan OctSepAugJulJunMayAprMar DecNovFeb
Sources: Navigant / EIA
U.S. storage inventories moved to average levels for February over the prior ten years, at 1,710 Bcf.
MONTHLY U.S. STORAGE ACTIVITY
-1,250
-1,000
-750
-500
-250
0
250
500
750
Nov Dec Jan Feb Mar Apr May Jun Jul Aug Sep OctB
cf
2014/2015 2008/2009 2009/2010 2010/20112011/2012 2012/2013 2013/2014
Sources: Navigant / EIA
Values above zero represent months with net injections. Values below zero represent months with net withdrawals.
Continued cold weather brought February storage withdrawals close to last year’s maximum for the prior six years at this time, at 718 Bcf.
CANADA GAS STORAGE
50
150
250
350
450
550
650
750
850
Bcf
Range (2005-2014) 20102011 20122013 20142015 Sources: Navigant / Enerdata
Jan OctSepAugJulJunMayAprMar DecNovFeb
Canadian storage inventories continued the withdrawal season just above average for the last ten years, at 288 Bcf.

11
March 2015
O&G Market Notes
Natural Gas Market Charts
U.S. DRY GAS PRODUCTION
52
54
56
58
60
62
64
66
68
70
72
74
Jan Feb Mar Apr May Jun Jul Aug Sep Oct Nov Dec
Bcf
/day
2010 2011 2012 2013 2014 2015Sources: Navigant / EIA
U.S. dry gas production continued at all-time high levels, at 72.7 Bcfd.
U.S. WELLHEAD SHALE GAS PRODUCTION
0
5
10
15
20
25
30
35
40
45
Feb-14 Apr-14 Jun-14 Aug-14 Oct-14 Dec-14 Feb-15
Bcf
/day
Utica Marcellus Eagle FordBakken Woodford FayettevilleBarnett Shale Haynesville Other
Sources: Navigant / LCI
U.S. shale gas production continued a slight drop from the Decem-ber all-time high, to 40.2 Bcfd.
U.S. MONTHLY NATURAL GAS DEMAND
40
50
60
70
80
90
100
110
Jan Feb Mar Apr May Jun Jul Aug Sep Oct Nov DecB
cf/d
2010 2011 2012 2013 2014 2015Sources: Navigant / EIA
U.S. gas demand continued at about 3% below last year’s all-time high, at 96 Bcfd.
U.S. TEMPERATURE OUTLOOK
The temperature outlook is for above normal temperatures for the most of the U.S. west of the Rockies, and below normal temperatures for the south-central U.S. and the lower Mississippi River Valley.

12
March 2015
O&G Market Notes
Oil Market Charts
SPOT CRUDE PRICES
-20
0
20
40
60
80
100
120
140
Jan-10 Jan-11 Jan-12 Jan-13 Jan-14 Jan-15
$ / b
bl
Brent WTI Brent-WTI spread Sources: Navigant / U.S. EIA
After three years of relative stability in the $90-110/bbl range, crude prices plunged 60% from June 2014 levels. Prices have since recovered slightly to average $58/bbl (Brent) and $51/bbl (WTI) in February 2015.
OPEC & NON-OPEC OIL PRODUCTION
0
10
20
30
40
50
60
70
80
90
100
Jan-10 Jan-11 Jan-12 Jan-13 Jan-14 Jan-15
Mill
ion
barr
els
per d
ay
OPEC Non-OPEC Sources: Navigant / U.S. EIA / IEA
Global oil production increased from 91.4 million barrels per day a year ago to an estimated 93.7 million barrels per day in January 2015, of which 39% was supplied by OPEC.
ICE BRENT FUTURES CURVE
40
45
50
55
60
65
70
75
80
Feb-15 May-15 Aug-15 Nov-15 Feb-16
$ / b
bl
Jan 2 Feb 2 Mar 2 Sources: Navigant / Bloomberg
The Brent futures curve has tracked spot prices. The average 12-month strip price at the beginning of March was $64/bbl, an in-crease of 6% from the previous month.
YEAR-ON-YEAR CHANGE IN OIL PRODUCTION
-1.5
-0.5
+0.5
+1.5
+2.5
+3.5
+4.5
Jan-11 Jan-12 Jan-13 Jan-14 Jan-15
Mill
ion
barr
els
per d
ay
Non-OPEC OPEC World Sources: Navigant / U.S. EIA / IEA
Oil production growth in recent years has been led by non-OPEC countries, particularly the U.S.

13
March 2015
O&G Market Notes
Oil Market Charts
U.S. OIL PRODUCTION
0
2
4
6
8
10
12
14
Jan-10 Jan-11 Jan-12 Jan-13 Jan-14 Jan-15
Mill
ion
barr
els
per d
ay
Federal GoM Alaska California Texas
Other Lower 48 NGLs Other Sources: Navigant / IEA
In the United States, oil production climbed by 13% over the year to an estimated 12.3 million barrels per day in January 2015. Increas-es have come mainly from crude produced in the lower 48 states (especially Texas) and NGLs.
OIL-DIRECTED RIG COUNT BY REGION
0
200
400
600
800
1,000
1,200
1,400
1,600
1,800
Jan-10 Jan-11 Jan-12 Jan-13 Jan-14 Jan-15
Oil-
dire
cted
rigs
Latin America Europe AfricaMiddle East Asia Pacific CanadaU.S. Sources: Navigant / Baker Hughes
The impact of lower crude prices can be seen in oil-directed rig counts. The U.S. had 922 active oil rigs at the start of March 2015, the lowest since April 2011.
OIL PRODUCTION IN KEY U.S. REGIONS
0
200
400
600
800
1,000
1,200
1,400
1,600
1,800
2,000
Jan-10 Jan-11 Jan-12 Jan-13 Jan-14 Jan-15
Thou
sand
bar
rels
per
day
Bakken Eagle Ford MarcellusNiobrara Permian Utica Sources: Navigant / U.S. EIA
In January 2015, oil production reached an estimated 1.9 million barrels per day in the Permian (+29% YoY), 1.7 million barrels per day in Eagle Ford (+32% YoY) and 1.3 million barrels per day in Bakken (+34% YoY).
U.S. RIG COUNT
0%
20%
40%
60%
80%
100%
0
500
1,000
1,500
2,000
2,500
Jan-10 Jan-11 Jan-12 Jan-13 Jan-14 Jan-15
Oil-
dire
cted
% o
f rig
s
Rig
s
Oil GasMisc % Oil (right) Sources: Navigant / Baker Hughes
While U.S. rig counts for both oil and gas have fallen, oil rigs have decreased more steeply. 77% of U.S. rigs were oil-directed at the start of March.
14
March 2015
O&G Market Notes
Oil Market Charts
OECD & NON-OECD OIL CONSUMPTION
0
10
20
30
40
50
60
70
80
90
100
1Q10 1Q11 1Q12 1Q13 1Q14
Mill
ion
barr
els
per d
ay
OECD Non-OECD Sources: Navigant / IEA
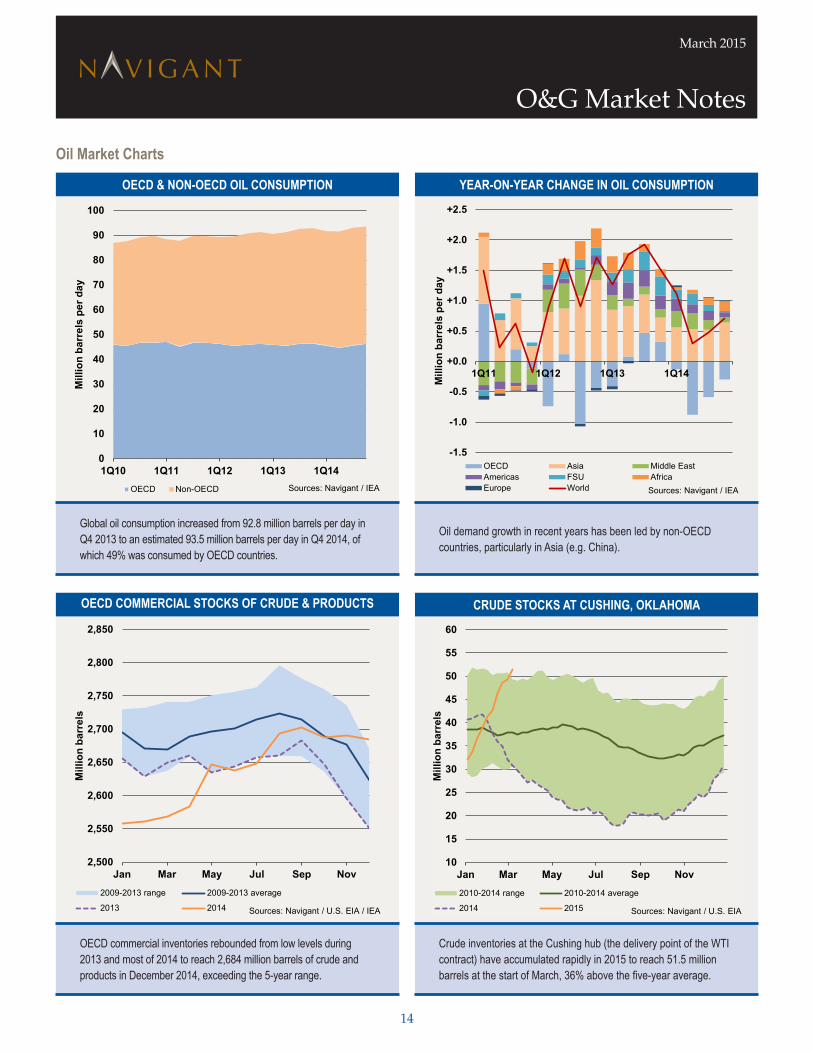
Global oil consumption increased from 92.8 million barrels per day in Q4 2013 to an estimated 93.5 million barrels per day in Q4 2014, of which 49% was consumed by OECD countries.
OECD COMMERCIAL STOCKS OF CRUDE & PRODUCTS
2,500
2,550
2,600
2,650
2,700
2,750
2,800
2,850
Jan Mar May Jul Sep Nov
Mill
ion
barr
els
2009-2013 range 2009-2013 average
2013 2014 Sources: Navigant / U.S. EIA / IEA
OECD commercial inventories rebounded from low levels during 2013 and most of 2014 to reach 2,684 million barrels of crude and products in December 2014, exceeding the 5-year range.
YEAR-ON-YEAR CHANGE IN OIL CONSUMPTION
-1.5
-1.0
-0.5
+0.0
+0.5
+1.0
+1.5
+2.0
+2.5
1Q11 1Q12 1Q13 1Q14
Mill
ion
barr
els
per d
ay
OECD Asia Middle EastAmericas FSU AfricaEurope World Sources: Navigant / IEA
Oil demand growth in recent years has been led by non-OECD countries, particularly in Asia (e.g. China).
CRUDE STOCKS AT CUSHING, OKLAHOMA
10
15
20
25
30
35
40
45
50
55
60
Jan Mar May Jul Sep Nov
Mill
ion
barr
els
2010-2014 range 2010-2014 average
2014 2015 Sources: Navigant / U.S. EIA
Crude inventories at the Cushing hub (the delivery point of the WTI contract) have accumulated rapidly in 2015 to reach 51.5 million barrels at the start of March, 36% above the five-year average.
15
March 2015
O&G Market Notes
Oil Market Charts
INDICATOR REFINING MARGINS
-6
-4
-2
0
2
4
6
8
10
12
14
Jan-10 Jan-11 Jan-12 Jan-13 Jan-14 Jan-15
$ / b
bl
NW Europe Light Sweet CrackingUS Gulf Coast Heavy Sour CokingSingapore Medium Sour Hydrocracking
Sources: Navigant / IEA / KBC
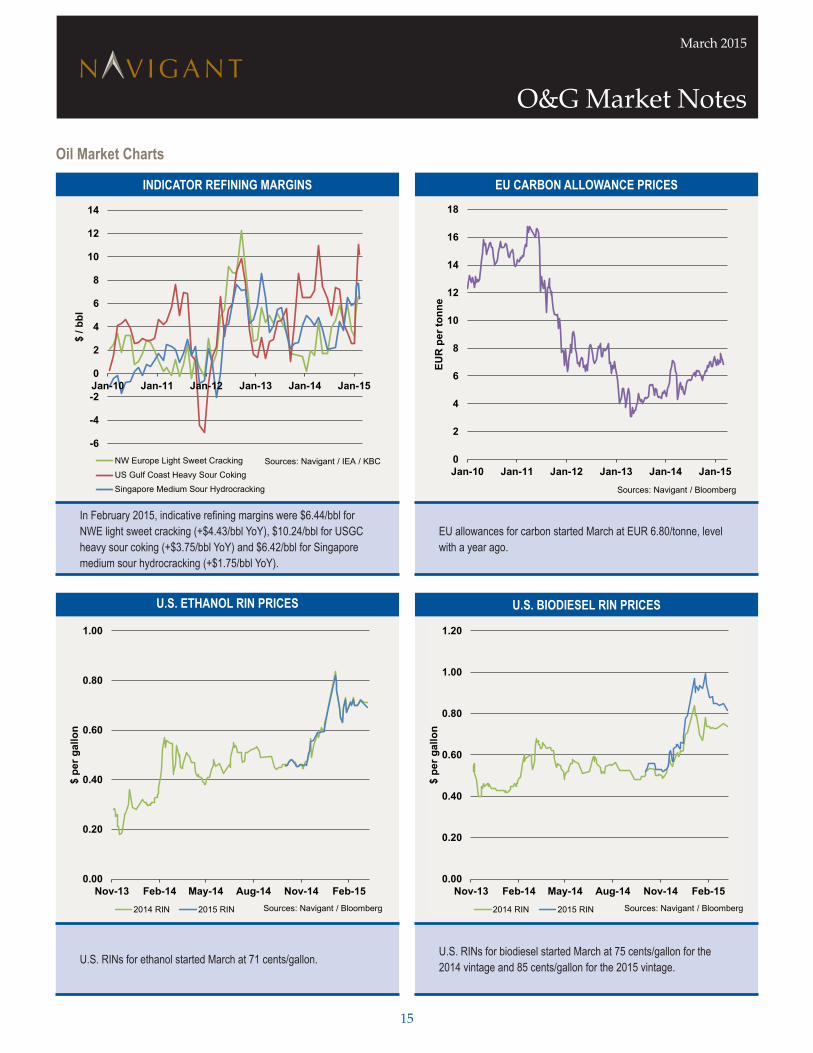
In February 2015, indicative refining margins were $6.44/bbl for NWE light sweet cracking (+$4.43/bbl YoY), $10.24/bbl for USGC heavy sour coking (+$3.75/bbl YoY) and $6.42/bbl for Singapore medium sour hydrocracking (+$1.75/bbl YoY).
U.S. ETHANOL RIN PRICES
0.00
0.20
0.40
0.60
0.80
1.00
Nov-13 Feb-14 May-14 Aug-14 Nov-14 Feb-15
$ pe
r gal
lon
2014 RIN 2015 RIN Sources: Navigant / Bloomberg
U.S. RINs for ethanol started March at 71 cents/gallon.
EU CARBON ALLOWANCE PRICES
0
2
4
6
8
10
12
14
16
18
Jan-10 Jan-11 Jan-12 Jan-13 Jan-14 Jan-15
EUR
per
tonn
e
Sources: Navigant / Bloomberg
EU allowances for carbon started March at EUR 6.80/tonne, level with a year ago.
U.S. BIODIESEL RIN PRICES
0.00
0.20
0.40
0.60
0.80
1.00
1.20
Nov-13 Feb-14 May-14 Aug-14 Nov-14 Feb-15
$ pe
r gal
lon
2014 RIN 2015 RIN Sources: Navigant / Bloomberg
U.S. RINs for biodiesel started March at 75 cents/gallon for the 2014 vintage and 85 cents/gallon for the 2015 vintage.

16
March 2015
O&G Market Notes
Legislative and Regulatory Highlights
Midwest
NEXUS Pipeline Awards EPC Contract to Fluor Corporation
On February 12, Fluor Corporation announced that it was awarded the engineering, procurement, and construction contract for the NEXUX Gas Transmission project. The project will be a 250-mile natural gas pipeline in Ohio and Michigan capable of transporting up to 2 Bcfd of natural gas from the Utica and Marcellus shale plays to end-users in the upper Midwest and Canada.
Rover Pipeline Files Application for CPCN with FERC
On February 20, Energy Transfer Partners’ Rover Pipeline LLC filed an application with FERC for a certificate of public convenience and necessity to build and operate its proposed 711-mile pipeline from Marcellus and Utica shale supply areas in West Virginia, Pennsylvania, and Ohio to an interconnection with the Vector Pipeline in Livingston County, Michigan. The project will consist of 10 supply laterals and three mainlines. Two mainlines, with a total capacity of 3.25 Bcfd, will interconnect at a proposed new Midwest Hub, located in Defiance County, Ohio, with Panhandle Eastern Pipeline (750 MMcfd in precedent agreements) and ANR Pipeline (up to 1.7 Bcfd from Rover). Rover’s northbound mainline from the Midwest Hub, the Market Segment, will have capac-ity rights on the Vector Pipeline of 950 MMcfd, allow-ing deliveries into Canada. Completion is expected by mid-2017.
FERC Issues CPCN for Rockies Express Zone 3 East-to-West Project
On February 27, FERC issued a certificate of public con-venience and necessity to Rockies Express Pipeline LLC, allowing it to modify its facilities to enable bi-directional gas flow on its existing mainline in its Zone 3 between Missouri and Ohio. Zone 3 represents the easternmost segment of the 1,700 mile, 1.8 Bcfd REX pipeline from Colorado to the Clarington Hub in Ohio. This East-to-West Project will allow for 1.2 Bcfd of Appalachian Basin gas to move to Midwest markets. 100% of the project capacity is subject to signed precedent agreements. The project is tar-geted for completion in the second half of 2015.
National
Government Plans Accelerated Capital Cost Recovery for Liquefaction Investments
On February 19, the Canadian Department of Finance announced a government plan to establish an accelerated capital cost allowance of 30% for certain equipment used in liquefaction or in LNG storage for peak shaving, and a 10% allowance for associated buildings. The standard capital cost allowances for the equipment and build-ings are 8% and 6%, respectively. The tax relief would be available for assets acquired from now through 2025.
Nova Scotia
Bear Head LNG Applies for U.S. DOE Export Authorization
On February 25, Bear Head LNG filed an application with the U.S. Department of Energy to export natural gas from the United States to Canada, for purposes of liquefaction at the Bear Head LNG project in Richmond County, Nova Scotia and subsequent export to FTA and non-FTA nations. The DOE application would cover LNG exports of 8 million tons per annum (mtpa), out of the total of 12 mtpa provided for in Bear Head LNG’s appli-cation to Canada’s National Energy Board—meaning that at least 4 mtpa of Bear Head LNG’s exports from Canada would be sourced from Canadian natural gas.

17
March 2015
O&G Market Notes
©2015 Navigant Consulting, Inc. All rights reserved. Navigant Consulting is not a certified public accounting firm and does not provide audit, attest, or public accounting services. See navigant.com/licensing for a complete listing of private investigator licenses.
O&G Market Notes is a publication of Navigant’s Global Oil & Gas Group. Navigant’s O&G Market Notes newsletter focuses on the North American oil and natural gas market—serving utilities and public entities, independent power producers, natural gas producers, pipelines, LNG developers, large industrial end-users, and financial services companies. Navigant’s oil and gas experts provide market intelligence, strategic insight, strategy development and implementation, and operational excellence services for our clients.
About Navigant’s Global Energy Practice Navigant’s Global Energy Practice includes more than 370 experts focused on issues across the entire energy value chain, including renewables, climate change, energy efficiency, demand response, emerging technologies, global oil and gas, generation, resource procurement, transmission, markets, performance improvement, fuel sourcing, rates, and regulation. The Practice also provides energy market research reports in the areas of clean technologies, smart grid, and emerging energy-related markets. More information about Navigant’s Energy Practice can be found at navigant.com/energy.
About Navigant Navigant Consulting, Inc. (NYSE: NCI) is a specialized, global professional services firm dedicated to assisting clients in creating and protecting value in the face of critical business risks and opportunities. Through senior level engagement with clients, Navigant professionals deliver expert and advisory work through implementation and business process management services. The firm combines deep technical expertise in Disputes and Investigations, Economics, Financial Advisory and Management Consulting, with business pragmatism to address clients’ needs in highly regulated industries, including Construction, Energy, Financial Services and Healthcare. More information about Navigant can be found at navigant.com.
Oil & Gas GroupLee Laviolette, Managing Director 713.409.3634 [email protected] 909 Fannin St. Suite 1900 Houston, TX 77010
Gordon Pickering, Director 916.631.3249 [email protected] 35 Iron Point Circle Suite 225 Folsom, CA 95630
Bob Gibb, Associate Director 512.493.5407 [email protected] 98 San Jacinto Suite 900 Austin, TX 78701
navigant.com