navigating the regulatory maze
TRANSCRIPT


2
Jakarta20 July 2016
Navigating the Regulatory Maze
Presented at 1st Asian Financial Leaders ProgramPrasetiya Mulya Executive Learning Institute
Winang Budoyo([email protected])Chief EconomistPT Bank CIMB Niaga Tbk

Navigating Global Uncertainties

4
Increasing Global Market Uncertainty in 2016
Source: Various
Divergence of global
monetary policy:
Fed vs ECB & BoJ
Oil Price:
How low/high can it go?
Chinese Puzzle:
Downside on
Growth and
Fear of
Currency War
Global Capital
Volatility
Slower global
economic recovery

5
More Protectionism?
JapanThe ELDERLY vs The YOUTH
EuropeCompetition among member countries
UKThe New Epicentrum:
1. The RICH vs The POOR2. The ELDERLY vs The YOUTH
3. Among countries
USThe RICH vs The POOR
Higher Protectionism
Donald Trump

6
External Factors Remain the Main Risk PotentialDownward adjustments for IMF’s growth estimates in 2015 due to global headwinds
3.3 3.43.8
3.5 3.53.3
3.1 3.1
2013 2014 EO Oct 2014 WEO Jan 2015 WEO Apr 2015 WEO Jul 2015 WEO Oct 2015 WEO Jan 2016
IMF-WEO revised 2015 growth estimates downward
Source: IMF
(1) yoy growth comparing 3Q15 and 3Q14 real GDP
IMF’s Global Growth Estimates Project Downward Trends for 2015
GDP Growth Comparison among Major Global Economies
Advanced Economies Performance. US showssome improvements, but Japan and Europe arestill in low recovery stage Policy Uncertainties in Developed Countries.
The Fed normalization, BoJ and ECB stimuluspackages Global Commodity Market. Volatile with
tendency to weaken China Growth Slowdown. Hard or soft landing? Yuan Devaluation Policy. Exerting pressure to
other Asian Currencies
2015 Global Risks Sources

7
GDP Growth (yoy)
4.92
0
1
2
3
4
5
6
7
1Q12 2Q12 3Q12 4Q12 1Q13 2Q13 3Q13 4Q13 1Q14 2Q14 3Q14 4Q14 1Q15 2Q15 3Q15 4Q15 1Q16
2012 GDP Growth:6.0% 2013 GDP Growth:
5.6% 2014 GDP Growth:5.0% 2015 GDP Growth:
4.8%
%
4.71 4.674.73
5.04
1Q15 2Q15 3Q15 4Q15
Recovery Point
2015 marks the turning point forIndonesia’s growth acceleration
Indonesia’s Economy on a Stable PathGovernment Spending and Investment as the main contributors to Growth and supported by robust HH Consumption, made the 3Q15 as the turning point
Source: Central Bureau of Statistics (CBS)
Expenditure Component (%)
2013 2014 2015 2016
Yearly Yearly Q1 Q2 Q3 Q4 Yearly Q1
HH Cons 5.4 5.1 5.0 5.0 5.0 4.9 5 4.9
Non Profit Cons 8.2 12.4 -8.3 -7.9 6.4 8.3 -0.6 6.4
Government Cons 6.9 1.9 2.2 2.3 6.6 7.3 5.4 2.9
Investment 5.3 4.1 4.4 3.6 4.6 6.9 5.1 5.6
Export 4.2 1.0 -0.9 -0.1 -0.7 -6.4 -2.0 -3.9
Import 1.9 2.2 -2.3 -6.8 -6.1 -8.1 -5.8 -4.2
GDP 5.6 5.0 4.7 4.7 4.7 5.0 4.8 4.9
GDP Growth by Sector2013 2014 2015 2016
Yearly Yearly Q1 Q2 Q3 Q4 Yearly Q1
Agriculture, Forestry, and Fishery 4.2 4.2 4.0 6.9 3.3 1.6 4.0 1.9
Mining Industry 1.7 0.6 -1.3 -5.2 -5.7 -7.9 -5.1 -0.7
Industrial Processing 4.5 4.6 4.0 4.1 4.5 4.4 4.2 4.6
Construction 6.1 7.0 6.0 5.4 6.8 8.2 6.6 7.9
Big Traders and Wholesale and Retail; Automotive Repair
4.7 4.8 4.1 1.7 1.4 2.8 2.5 4.0
Transportation and Warehousing 8.4 8.0 5.8 5.9 7.3 7.7 6.7 7.7
Information and Communication 10.4 10.0 10.1 9.7 10.7 9.7 10.1 8.3
Other Services (10 sectors) 6.5 5.5 5.7 5.9 5.9 7.0 6.1 6.6
GDP 5.6 5.0 4.7 4.7 4.7 5.0 4.8 4.9

Shifting from Commodity-based economy• In 4Q15, Indonesia booked 5.0% GDP growth yoy, making FY 2015 GDP growth at 4.8% yoy (the lowest level since 2010).• However, several regions expanded higher than national. These regions were benefited from strong USD episode and gave positive impacts to
Tourism industry in Bali and Nusa Tenggara and also to Fishery Product industry in Sulawesi.• While growth in resource-rich regions such as Sumatra and Kalimantan were still subdued• Indonesia continues to drive growth in resource-based industrialization to shift from commodity-based economy
Spatial GDP Growth Contribution
Source: CBS
SumateraGDP Growth2014: 4.7%2015: 3.5%
JavaGDP Growth2014: 5.6%2015: 5.5%
KalimantanGDP Growth2014: 3.2%2015: 1.3%%
SulawesiGDP Growth2014: 6.9%2015: 8.2%
Bali & Nusa TenggaraGDP Growth2014: 5.9%2015: 10.3%
Maluku & PapuaGDP Growth2014: 4.3%2015: 6.6%
2015 Regional GDP GrowthStrong USD benefited some regions and grew faster than national

9Source: BI & BPS
2015 GDP Growth per ProvinceMain engines of growth –i.e. Java & Sumatera- have revived, while the commodity-driven provinces still face setbacks. Regions with local content products , such as Sulawesi (sea products), were benefited from Rupiah depreciation

10Source: BI & BPS
1Q 2016 GDP Growth per ProvinceSlower growth across the country
11
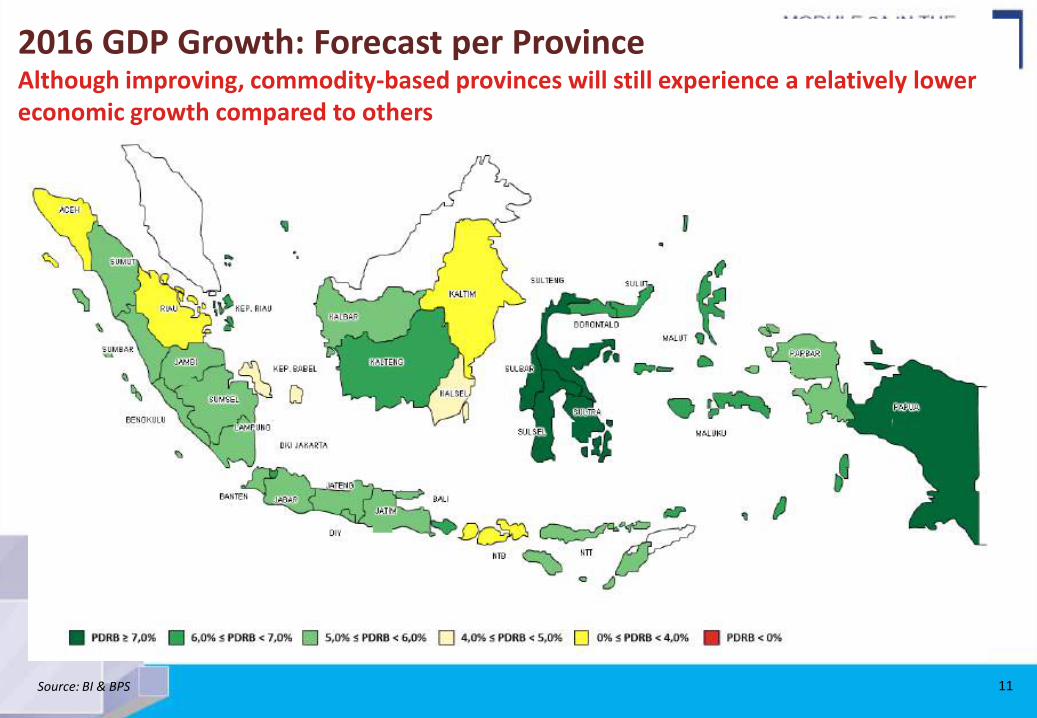
2016 GDP Growth: Forecast per ProvinceAlthough improving, commodity-based provinces will still experience a relatively lower economic growth compared to others
Source: BI & BPS
12
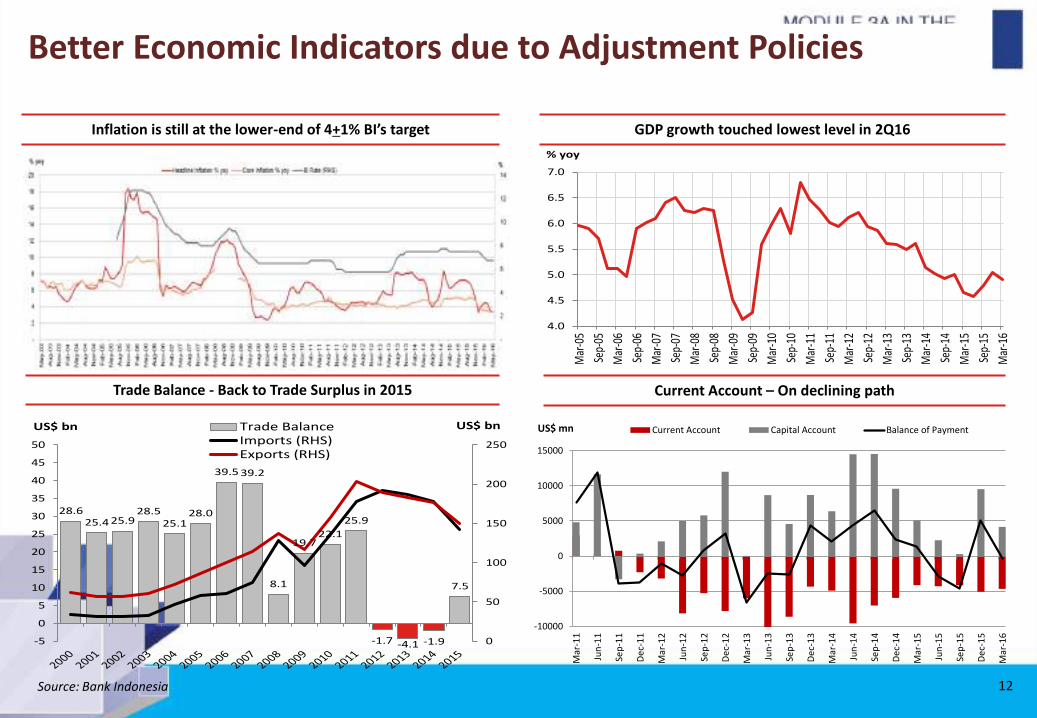
Better Economic Indicators due to Adjustment Policies
Inflation is still at the lower-end of 4+1% BI’s target GDP growth touched lowest level in 2Q16
Trade Balance - Back to Trade Surplus in 2015 Current Account – On declining path
Source: Bank Indonesia
28.625.4 25.9
28.525.1
28.0
39.5 39.2
8.1
19.722.1
25.9
-1.7 -4.1 -1.9
7.5
0
50
100
150
200
250
-5
0
5
10
15
20
25
30
35
40
45
50
Trade BalanceImports (RHS)Exports (RHS)
US$ bn US$ bn
4.0
4.5
5.0
5.5
6.0
6.5
7.0
Mar
-05
Sep-
05
Mar
-06
Sep-
06
Mar
-07
Sep-
07
Mar
-08
Sep-
08
Mar
-09
Sep-
09
Mar
-10
Sep-
10
Mar
-11
Sep-
11
Mar
-12
Sep-
12
Mar
-13
Sep-
13
Mar
-14
Sep-
14
Mar
-15
Sep-
15
Mar
-16
% yoy
-10000
-5000
0
5000
10000
15000
Mar
-11
Jun
-11
Sep
-11
De
c-1
1
Mar
-12
Jun
-12
Sep
-12
De
c-1
2
Mar
-13
Jun
-13
Sep
-13
De
c-1
3
Mar
-14
Jun
-14
Sep
-14
De
c-1
4
Mar
-15
Jun
-15
Sep
-15
De
c-1
5
Mar
-16
Current Account Capital Account Balance of PaymentUS$ mn

13
Financial System Stability was Maintained, but Both LoanGrowth and Deposit Growth are still Low
CAR (Capital Adequacy Ratio) NPL (Non Performing Loan)
Loan Growth (yoy) Deposit Growth (yoy)
Source: OJK 2016
14
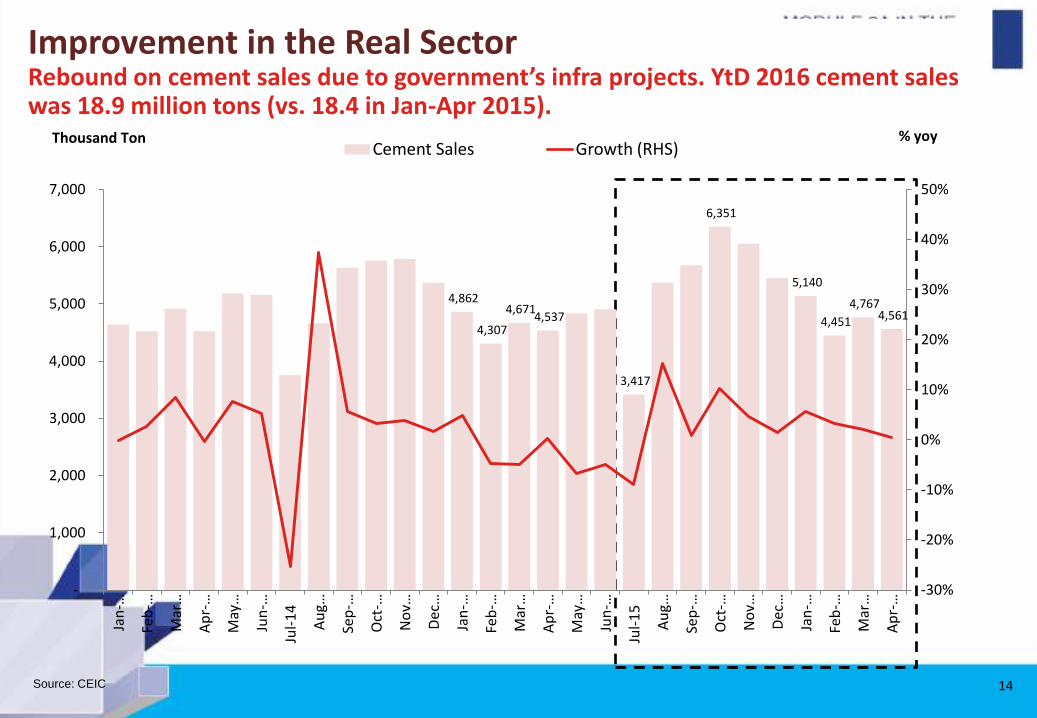
Improvement in the Real SectorRebound on cement sales due to government’s infra projects. YtD 2016 cement sales was 18.9 million tons (vs. 18.4 in Jan-Apr 2015).
Source: CEIC
4,862
4,307
4,671 4,537
3,417
6,351
5,140
4,451
4,767 4,561
-30%
-20%
-10%
0%
10%
20%
30%
40%
50%
-
1,000
2,000
3,000
4,000
5,000
6,000
7,000
Jan
-…
Feb
-…
Mar
…
Ap
r-…
May
…
Jun
-…
Jul-
14
Au
g…
Sep
-…
Oct
-…
No
v…
Dec
…
Jan
-…
Feb
-…
Mar
…
Ap
r-…
May
…
Jun
-…
Jul-
15
Au
g…
Sep
-…
Oct
-…
No
v…
Dec
…
Jan
-…
Feb
-…
Mar
…
Ap
r-…
Cement Sales Growth (RHS)Thousand Ton % yoy
15
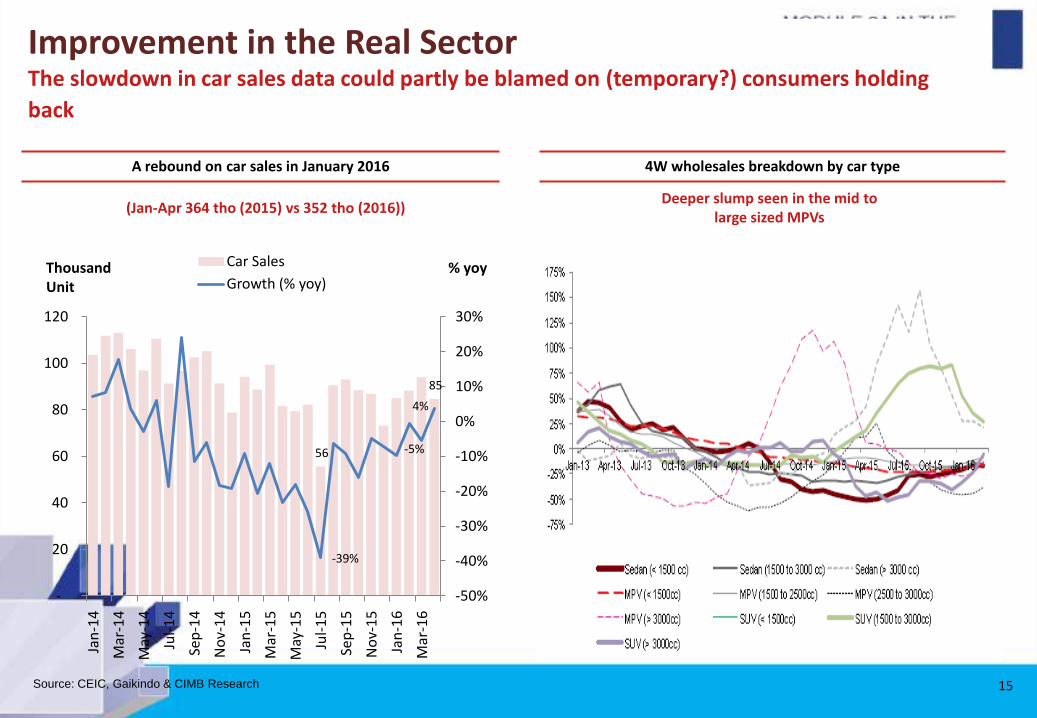
Improvement in the Real SectorThe slowdown in car sales data could partly be blamed on (temporary?) consumers holding
back
Source: CEIC, Gaikindo & CIMB Research
56
85
-39%
-5%
4%
-50%
-40%
-30%
-20%
-10%
0%
10%
20%
30%
-
20
40
60
80
100
120
Jan
-14
Mar
-14
May
-14
Jul-
14
Sep
-14
No
v-1
4
Jan
-15
Mar
-15
May
-15
Jul-
15
Sep
-15
No
v-1
5
Jan
-16
Mar
-16
Car Sales
Growth (% yoy)Thousand Unit
% yoy
A rebound on car sales in January 2016 4W wholesales breakdown by car type
Deeper slump seen in the mid tolarge sized MPVs
(Jan-Apr 364 tho (2015) vs 352 tho (2016))

16
Improving Consumer Confidence Index since Sep 2015
Source: CEIC
Consumer Confidence Index (CCI) has been on increasing trend since Sep 15, showing that there is animprovement of people to their life prospect.
The increase in the CCI indicates an increase in consumer purchasing power ahead CCI has risen to a level similar to the average of the last 8 years
107.5
112.6
110
70
80
90
100
110
120
130
Consumer Confidence Index
Fuel Price Hike 1
Fuel Price Hike 2
Food Price HikeFlood
Fuel Price Hike 3
Fuel Price Decline
Fuel Price Decline
Food Price Hike
Food Price Hike Fuel Price Hike 4
Fuel Price Hike 5

Fiscal Policies

18
Fiscal Policy: Budget Re-AllocationAllocation of Energy Subsidy Spending to Education, Infrastructure and Regional Development for Sustainable Economic Growth
2016 Budget Allocation Plan Compared to 2015 Revised Budget
Energy-12%
Education+4%
Infrastructure+8%
Transfer to Regional+17.5%
2016 Key Budget Policy:Central Government Expenditure: Continue budget efficiency framework
Subsidy Policies• Fuel Subsidy Policy: Continue “Fixed Subsidy” scheme to
Diesel and “Price Subsidy” for Kerosene and 3 kg LPG• Electricity Subsidy Policy: Switch to direct subsidy scheme
given to small households (450 VA and part of 900 VA)• Food Subsidy: Rice for targeted household (15.5 million
households)• Subsidy for Fertilizer: Production price close to economic
price targeted volume of 9.55 million ton, with retail price to be adjusted to close price gap
• Interest Subsidy for SME credit: For selected sectors such as agriculture, fishery, manufacturing and trade and including for migrant worker
Regional Transfer Policy• Formulate Transfer Fund nomenclature• Enhance Special Transfer Fund (DTK)• Optimize the implementation of reward and punishment to
regional Government
Village Fund Policy• Significantly Increase allocation compared to 2015• To support growth equality and empowerment in village area
Source: Ministry of Finance
19
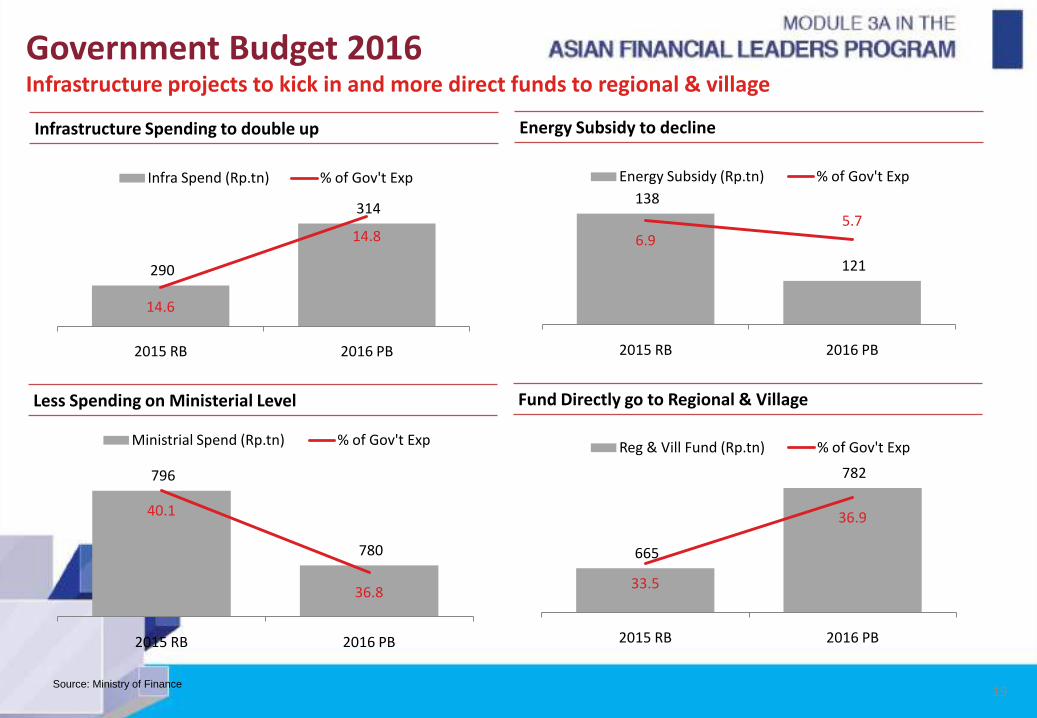
Government Budget 2016Infrastructure projects to kick in and more direct funds to regional & village
Infrastructure Spending to double up
290
314
14.6
14.8
2015 RB 2016 PB
Infra Spend (Rp.tn) % of Gov't Exp
138
121
6.95.7
2015 RB 2016 PB
Energy Subsidy (Rp.tn) % of Gov't Exp
796
780
40.1
36.8
2015 RB 2016 PB
Ministrial Spend (Rp.tn) % of Gov't Exp
665
782
33.5
36.9
2015 RB 2016 PB
Reg & Vill Fund (Rp.tn) % of Gov't Exp
Energy Subsidy to decline
Less Spending on Ministerial Level Fund Directly go to Regional & Village
Source: Ministry of Finance

20
The Government is focusing on basic infrastructureBetter connectivity for remote areas to reduce costs
Source: Ministry of Finance

21
o Financing Breakdown (2015 – 2019)
Indonesia Infrastructure Projects and Financing SchemesPPP, SOEs and Private Sector as Alternatives to Direct Budgetary Spending
o Establishment of PPP Unit
Total Financing Needs:
~US$345.1 bn
Govt & Local Budget (41.3%)
Financing Gap
SOE(22.2%)
PPP(36.5%)
~US$142.4 Bn
~US$76.7 Bn
~US$126.0 Bn
Broad Objective
• Champion project preparation and acceleration of the PPP agenda in Indonesia
Core Mandates
• Improve quality of project selection under KKPPI – OBC criteria• Support project preparation through PDF support and use a high quality Transaction
Advisor• Act on behalf the Minister of Finance in providing government support approvals for
projects
AdditionalMandates
• Coordinate all public finance instruments• Provide input for PPP Policy Development and Regulations• Implement capacity building program to GCA• One stop shop for PPP promotion & Information
Sea Port New Sea Ports 24
Sea port developments 59
Roads New Roads 2650 km
Highway 1000 km
Road maintenance 46770 km
Bus Corridors 2
Railways Railway lines 24
Intra City Rail Lines 59
Airport New Airports 24
Airplanes for new routes 59
Budget
• Central & Regional Budget (SpecialAllocation Fund & Rural Transfer)
• Mainly to support basic infrastructure projects:
- Food Security: Irrigation, dams etc.
- Maritime: Seaports, shipyards etc.
- Connectivity: Village roads, public transportation etc.
Public Private Partnership
• Certain infrastructure projects to be funded and operated through a partnership between the Indonesian government and private sector companieso Projects Ready for Auction under PPP scheme:o Toll roads projects such as Balikpapan-Samarinda and
Manado-Belitungo Railway projects such as an Express Line into Soekarno-
Hatta International Airporto Water supply such as West Semarang water supply project
• Government to support the PPP via initiatives:o Land Fundo Project Development Facility (PDF)o Indonesia Infrastructure Guarantee Fund (IIGF)o Viability Gap Fund (VGF)o Infrastructure Fundo Availability Payment (AP)
State Owned Enterprise & Private Sector
• Government to inject capital into SOEs –Intention is that through a multiplier effect, more infrastructure projects can be developed
• Key focus areas:o Infrastructure and
maritime developmento Transportation and
connectitvityo Food security
• Medium term infrastructure developments in focus:o Water Supplyo Airportso Seaportso Electricity and power
plantso Housingo Mining
Source: Ministry of Finance

22
Alternative Source of Infrastructure FinancingSOEs and PPP become alternative source of funding to supplement Government Budget
2015 – 2019 Infrastructure Plan
• New Roads – 2650 km• Highway – 1000 km• Road Maintenance – 46,770 km• Bus Corridors - 2
• New Sea ports – 24• Sea Port Development – 59• Pioneer Cargo Ships
• New Airports – 24• Airport Infrastructure Development
Airplanes - 20
• Rail Lines – 2,159 km• Intra City Rail Lines – 1099 km
Infrastructure Financing Needs 2015 - 2019 Scenario 1 (full Scenario)
Scenario 2 (PartialScenario)
Baseline (Baseline)
Roads 1,274 851 637
Rail System 278 222 140
Urban Transportation 155 115 75
Sea Transportation 563 424 282
Ferry and Other Waster Transportation 91 80 60
Air Transportation 182 165 100
Electricity 1,080 762 714
Other Energy dan Gas 535 420 268
Water Resources 1,091 845 645
Water and Sanitation 666 450 330
Public Housing 384 247 180
Information and Communication Technology
242 200 130
Total 6,541 4,781 3,561
SOEs and PPP Become Alternative Source of Funding as Government Budget Could only Support ~20% of our Infrastructure Needs
Bu
dge
t
Pu
blic
Pri
vate
P
artn
ers
hip
an
d p
riva
te
sect
or
• Central & Regional Budget (Special Allocation Fund & Rural Transfer)• Mainly to support basic infrastructure projects:o Food Security: Irrigation, dams etc.o Maritime: Seaports, shipyards etc.o Connectivity: Village roads, public transportation etc
• Government support for PPP:o Land Fund: Modification and simplification of land acquisition processo Project Development Facility:through PT Sarana Multi Infrastructureo Indonesia Infrastructure Guarantee Fund (IIGF)o Viability Gap Fund (VGF)o Infrastructure Fund & Availability Payment (AP)
• Projects Ready for Auction under PPP Scheme:o Toll roads projects such as Balikpapan-Samarinda, Manado-Bitungo Railway projects such as Halim-Soetta Airport Express Railwayo Water supply such as West Semarang water supply project
Stat
e O
wn
ed
En
terp
rise
s
• Government to inject capital to SOEs – with leveraging process a multiplier effect, more infrastructure projects can be developed
• Key Focus areas:o For commercial and/or complex projects
• Medium term infrastructure developments focus: electricity and power plants, toll road
Source: Ministry of Finance

Economic Policy Package I – XIIFocusing on investment climate-incentive
Source: Bank Indonesia and Ministry of Finance

Source: Bank Indonesia and Ministry of Finance
Economic Policy Package XIIFocusing on improving the ease of doing business and targeting Indonesia to be ranked 40 on Ease of Doing Business in 2017
Through 10 points of policy, streamlining was pursued in procedures to start business, completion time for establishing business, and number of required permits

Stimuli to Maintain Purchasing Power and Promote Investments
Stimuli to maintain Purchasing Power Stimuli to promote Investments
Source: Ministry of Finance

Key Reforms in Negative Foreign Investment List
Cold Storage Sports Center;Film Processing Lab; Crumb Rubber
Restaurant; Bars Pharmaceutical Raw Material Manufacturing
Toll Road Operator;Telecommunication Testing Company
Revision of “Partnership” category to refer to partnership with Micro, Small and Medium
Enterprise (MSMEs)
Professional Training; Golf Course Management; Air Transport Support
Services; Travel Bureau
Consultancy for Construction1 Telecommunication Provider with Integrated Service
Distribution; Warehousing
Private Museum; Catering; Apparel Manufacturing; Exhibitions &
Conventions
Strengthen implementation of Negative Investment Law through
active roles from Ministries, Agencies and Regional
Government
Grandfather Law: If a particular sector is tightened in
future, existing foreign investor does not need to comply with
tighter stake
1. For total project value of Rp10 billion and aboveAllowed foreign stake (%)
Increase in Allowed Foreign Stake (Before and After Relaxation)
100%49% 49%
95%
51%
51% 85%100% 100% 100%
100%67% 67%
67% 67% 67%55%
51%33%
65%
Relaxation of Negative Foreign Investment List will Promote Healthy Competition
Source: Ministry of Finance

Government’s Investment strategy 2015-2019
Power Generation35 GW new
projects
7 GW projects in
the pipeline
Labor-intensive industry TextileFood &
BeveragesFurniture Toys
Import-substitution industry
Chemical & Pharmaceutical
Iron & Steel
Export-oriented industry
ElectronicsCPO &
derivative products
Wood products, pulp & paper
Automotive
MachineryRubber
products
Fish & derivative products
Shrimp
Downstream industry of natural resources
Cacao Sugar Smelter
Maritime Shipping Ship building Sea port Cold storage ICT for maritime
TourismStrategic tourism
areasMICE
Source: Ministry of Finance

28
Business Sector Investment Priorities: 1. Power Generation
To sustain economic growth of 6.9 per year (RPJMN 2015-2019), with 8.8% growth in electricity demand and electrification ratio 97.2%
Additional electricity infrastructure 2015 - 2019Development of electricity infrastructure 2015 -2019: 42 GW (7 GW Construction, 35 GW Pre-Construction)
By PLN (State Electricity Company):Generator: 17.4 GWTransmission: 50 thousand KMSSubstation: 743 location
By Prviate:Generator: 24.9 GWTransmission: 360 kms
Needs of Capital Expenditure:Rp 545 Tn
Needs of Capital Expenditure:Rp 545 Tn
Gas23%
Coal65%
Water5%
Geothermal5% Fuel
2%
2019
Gas
Coal
Water
Geothermal
Fuel
Gas25%
Coal54%
Water6%
Geothermal5% Fuel
10%
2014
Gas
Coal
Water
Geothermal
Fuel
Source: PLN, 2014
29
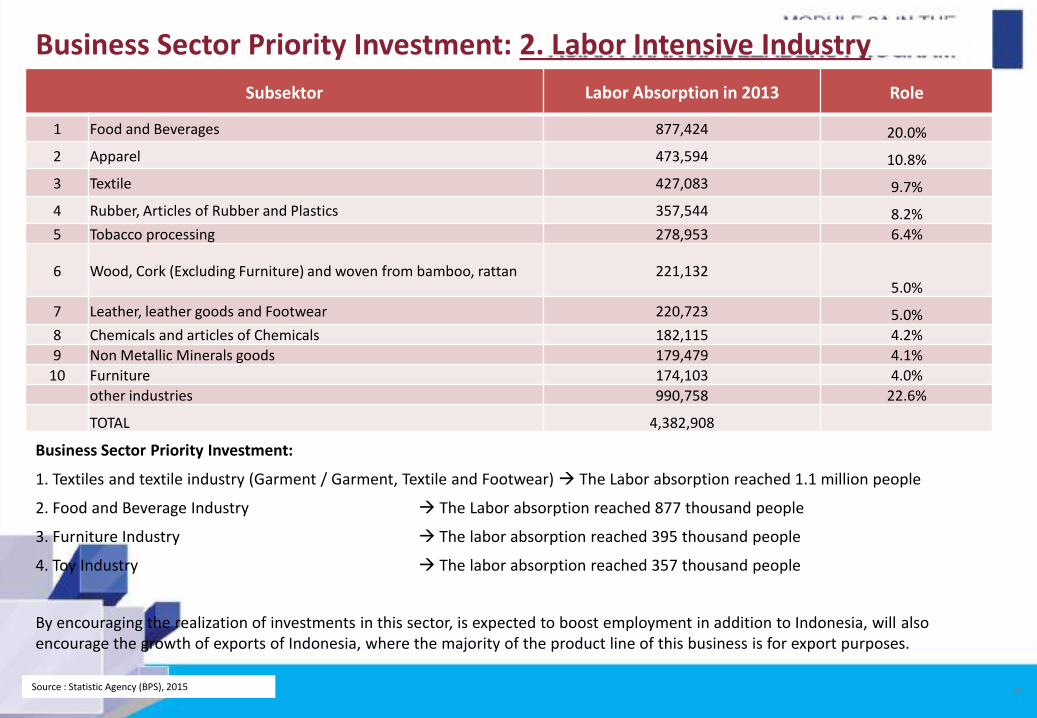
Business Sector Priority Investment: 2. Labor Intensive Industry
Business Sector Priority Investment:
1. Textiles and textile industry (Garment / Garment, Textile and Footwear) The Labor absorption reached 1.1 million people
2. Food and Beverage Industry The Labor absorption reached 877 thousand people
3. Furniture Industry The labor absorption reached 395 thousand people
4. Toy Industry The labor absorption reached 357 thousand people
By encouraging the realization of investments in this sector, is expected to boost employment in addition to Indonesia, will also encourage the growth of exports of Indonesia, where the majority of the product line of this business is for export purposes.
Subsektor Labor Absorption in 2013 Role
1 Food and Beverages 877,424 20.0%
2 Apparel 473,594 10.8%
3 Textile 427,083 9.7%
4 Rubber, Articles of Rubber and Plastics 357,544 8.2%
5 Tobacco processing 278,953 6.4%
6 Wood, Cork (Excluding Furniture) and woven from bamboo, rattan 221,132 5.0%
7 Leather, leather goods and Footwear 220,723 5.0%
8 Chemicals and articles of Chemicals 182,115 4.2%
9 Non Metallic Minerals goods 179,479 4.1%
10 Furniture 174,103 4.0%
other industries 990,758 22.6%
TOTAL 4,382,908
Source : Statistic Agency (BPS), 2015

30
Business Sector Investment Priorities: 3. Import Substitution Industry
NO Business Filed 2010 2011 2012 2013
1Basic Chemical Industry, Chemical Products, and Pharmaceutical
(22,7) (34,5) (39,5) (39,0)
2Basic Metal Industry, Metal Products, Machinery & Electronics
(21,6) (27,6) (37,1) (35,8)
3Industrial Transport Equipment & Other Transportation
(10,3) (11,8) (14,5) (8,5)
4Industrial Transport Equipment & Other Transportation
(1,1) (1,2) (1,5) (1,7)
5 Non Metallic Minerals Industry 0,3 0,2 (0,4) (0,4)6 Other industries 2,5 2,3 2,4 2,4
7Paper Industry, Manufactures of Paper, & Printing
3,0 2,5 2,5 2,5
8 Leather, leather goods & Shoes 1,9 2,3 2,5 2,89 Wood industry 2,6 3,0 3,0 3,210 Textile Industry 6,1 6,5 5,8 5,7
11 Rubber Industry, Manufactures of Rubber & Plastics
8,2 12,7 8,3 7,3
12 Food Industry 14,5 17,6 17,5 16,2
INDUSTRIAL SECTOR (16,6) (28,0) (51,0) (45,3)
The development of trade balance 12 industry groups the highest trade balance deficit(Export Import)
(Source: Ministry of Trade)
Business Sector Priority of Investment:1. Basic Chemical Industries (Petrochemical, Pharmaceutical, and Oil Refinery)
2. Iron and Steel Industry
Source: Ministry of Trade, 2015

31
Business Sector Investment Priorities: 4. Export-Oriented IndustryTop 10 Traditional Commodity Indonesia
NO Commodity 5 Main Destination Countries
1. TPT United States, Japan, Germany, Turkey, South Korea,
2. Electronic Singapore, United States, Japan, Hongkong, China
3. Rubber and Rubber Products United States, Japan, China, South Korea, Singapore,
4. Palm Oil Hong Kong, India, Vietnam, China
5. Forest Products Indian, China, Malaysia, Bangladesh, the Netherlands,
6. Foot Wear Japan, China, United States, South Korea, Australia,
7. Automotive United States, Belgium, Germany, England, Holland,
8. Shrimp Thailand, Japan, Saudi Arabia, Philippines, Malaysia
9. Cocoa United States, Japan, China, Britain, Belgium,
10. Coffee Malaysia, USA, Singapore, North Korea, Spain
Business Sector Priority Investment:1. Rubber2. Palm Oil3. Forest Products4. Shrimp5. Cocoa6. CoffeeSource: Ministry of Trade, 2015

32
Business Sector Priority Investment: 5. Agroindustry
Business Sector Priority for Agroindustry (processed products):
1. Crude Palm Oil (CPO): oleofood industry, oleochemical, energy (Biodiesel) and pharmaceutical
2. Cocoa: cocoa liquor, cocoa cake, cocoa butter, cocoa powder, food and baverages
3. Furniture: wood working, wood furniture, pulp paper industry
4. Sugar: White sugar, refined crystal sugar
Sources: Ministry of Industry, 2014 (Processed)
Examples:

33
Business Sector Priority Investment : 6. Maritime Industry
THREE MAIN BOOSTER MARITIME INDUSTRY
1. Developing Investment in BUSINESS SECTORS AND SERVICE PROVIDER: Shipping Industry Fishing Industry
2. Developing Investment in LOGISTIC INFRASTRUCTURE SECTORS: Development of the port / sea toll Developing Investment in INFORMATION TECHNOLOGY AND COMMUNICATION Appling ICT
Source: RPJMN, 2015
34
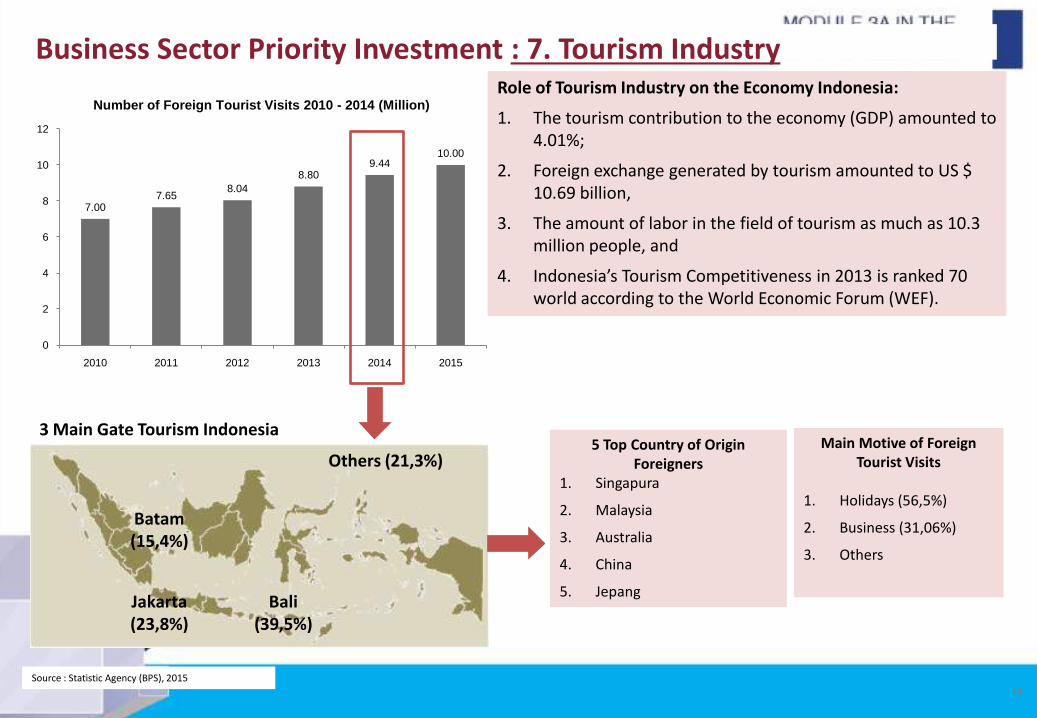
Business Sector Priority Investment : 7. Tourism Industry
3 Main Gate Tourism Indonesia
Jakarta(23,8%)
Bali(39,5%)
Batam(15,4%)
Others (21,3%)5 Top Country of Origin
Foreigners1. Singapura
2. Malaysia
3. Australia
4. China
5. Jepang
Main Motive of Foreign Tourist Visits
1. Holidays (56,5%)
2. Business (31,06%)
3. Others
Role of Tourism Industry on the Economy Indonesia:
1. The tourism contribution to the economy (GDP) amounted to 4.01%;
2. Foreign exchange generated by tourism amounted to US $ 10.69 billion,
3. The amount of labor in the field of tourism as much as 10.3 million people, and
4. Indonesia’s Tourism Competitiveness in 2013 is ranked 70 world according to the World Economic Forum (WEF).
Source : Statistic Agency (BPS), 2015
7.007.65
8.048.80
9.4410.00
0
2
4
6
8
10
12
2010 2011 2012 2013 2014 2015
Number of Foreign Tourist Visits 2010 - 2014 (Million)

35
Development Way of Tourism Industry Investment in Indonesia
Preparation of investment property, infrastructure, vehicle attractions, tourism services and facilities in 16 National Tourism Strategic Area:
Development of investment in the sector "Meetings, incentives, conferences, and exhibitions (MICE)" in the Main Large Cities Indonesia, that is in Medan, Padang, Batam, Jakarta, Yogyakarta, Surabaya, Bali, Makassar, Manado
Development of "connectivity" with the international world of Indonesian tourism

36
Recapitulation Business Sectors for Investment Priorities 2015-2019
Business Sector Priorities Category Business Fields
Electricity Power 1. 35 GW Electricity Power Project
Labor-Intensive Industries2. Textile and Its Product Industry (Garment, Textile and Footwear) 3. Food and Beverage Industry4. Furniture Industry5. Toys Industry
Impor Substitution Industry 6. Basic Chemical Industry (Petrochemical, Pharmaceutical, and Oil Refineries)7. Iron and Steel Industry
Export Oriented Industry 8. Rubber Commodity9. Crude Palm Oil10. Forest Product11. Shrimp12. Cocoa Commodity13. Coffee Commodity
Agro Industry 14. Processed Crude Palm Oil15. Processed Cocoa16. Furniture17. Processed Sugar
Maritime Industry 18. Shipping Industry19. Fishing Industry20. Port/Sea toll21. ICT Maritime Sector
Tourism 22. 16 National Tourism Strategic Area23. Meetings, incentives, conferences, and exhibitions (MICE)
Source: Ministry of Finance

The Future of Indonesia

Long Term Strategies to Achieve Sustainable Growth Key focus to strengthen Indonesia’s economic development fundamentals
Maintain Purchasing
Power
• Maintain price stability • Provide social security for workers • Improve basic needs services to the poor : Health services, Education,
Conditional cash transfer • Provide better employment climate, particularly related to min. wage
policy
• Promote Public Private Partnership (PPP) as infrastructure development financing scheme
• Develop fiscal and non-fiscal incentive and investment facilities to attract direct investment
• Improve the role of SOE and private in Infrastructure development• Develop the alternative infrastructure financing such as infrastructure
bank, trust fund, and infrastructure bond
• Develop downstream industries particularly on primary sectors (agricultural and mining sector)
• Increase the supply of high value added and competitive goods • Increase export quality, determine competitive price and develop
international standard services • Participate in the global value chain and the global production network
to enhance export performance • Improve quantity and quality of exports in manufacturing and services
sector • Develop a more efficient trade facility, particularly related to permit
process • More effective import management
Accelerate Infrastructure Development
State Owned Enterprise
& Private Sector
Strategies & Policy Formulations to Boost Investments
1. Maintain economic stability to promote strong business and investment climate
2. Simplify licensing and investment procedures
3. Harmonize investment regulations between central government and local governments
4. Consistently improve the involvement of state owned enterprise (SOE) in infrastructure development
5. Increase the role of banking institutions in lending rate development, especially for working capital and investment credits
6. Expand the role of non-bank financial institutions in the development of infrastructure financing alternative
Source: Ministry of Finance

Conducive environment underpinning growth fundamentalsThe fundamental long term growth drivers for Indonesia remain strong – equipped with abundant naturalresources, a young and technically trained workforce and a large consumer base with a fast growing spendingpower
The largest economy in South-East Asia
According to McKinsey, Indonesia is projected to be the 7th largest economy in the world by 2030 5.9% average real GDP growth over
the period 2008-2013 Exports are 23.7% of GDP for the
year of 2013, one of the lowest in Asia, creating low volatility in GDP Foreign direct investment grew at
an average rate of 21.1% from 2010-2013
Male Female
A large, culturally diverse, young and vibrant workforce
4th most populous country in the world 66.6% of the population is of
working age(1)and 68.5% were 39 years and younger as of 2012 Working population projected to
grow at 0.7% compared to 0.5% CAGR for total population from 2012-2017 A high literacy rate of more than
90%
Large consumer base with fast growing spending power
~7mn people are expected to join the middle class each year Consumer expenditure has grown
at a 12.3% CAGR from 2007-2012 and is expected to continue at a 9.1% rate from 2012-2017 Disposable incomes are projected
to grow at 12.1% from 2012-2017 According to McKinsey, 135-
170mn people will join the consuming class by 2030
Increase in infrastructure investment to improve overall efficiency
Announced an expansion of fiscal spending on infrastructure by 19.2% CAGR from2012 to2014 Infrastructure investments are spread
over Indonesia’s 6 economic corridors Encompass various sectors such as
seaports, roads, railways, airports, energy and many others Government continues to align
regional and national regulations to attract further private sector investors

Thank You

Important Notice
This presentation has been prepared by CIMB Group exclusively for the benefit and internal use of the recipient in order toindicate, on a preliminary basis, the feasibility of possible transactions. Terms contained in this presentation are intended fordiscussion purposes only and are subject to a definitive agreement. All information contained in this presentation belongs toCIMB Group and may not be copied, distributed or otherwise disseminated in whole or in part without the written consent ofCIMB Group.
This presentation has been prepared on the basis of information that is believed to be correct at the time the presentation wasprepared, but that may not have been independently verified. CIMB Group makes no express or implied warranty as to theaccuracy or completeness of any such information.
CIMB Group is not acting as an advisor or agent to any person to whom this presentation is directed. Such persons must maketheir own independent assessment of the contents of this presentation, should not treat such content as advice relating tolegal, accounting, taxation or investment matters and should consult their own advisers.
CIMB Group or its affiliates may act as a principal or agent in any transaction contemplated by this presentation, or any othertransaction connected with any such transaction, and may as a result earn brokerage, commission or other income. Nothing inthis presentation is intended to be, or should be construed as an offer to buy or sell, or invitation to subscribe for, anysecurities.
Neither CIMB Group nor any of its their directors, employees or representatives are to have any liability (including liability toany person by reason of negligence or negligent misstatement) from any statement, opinion, information or matter (express orimplied) arising out of, contained in or derived from or any omission from the presentation, except liability under statute thatcannot be excluded.