navy federal credit union 2019 annual report
TRANSCRIPT

NAVY FEDERAL CREDIT UNION
2019 Annual Report

To our members and Board of Directors,
This Navy Federal Annual Report describes how the credit union performed in 2019. We typically present the report at our annual in-person meeting in April. However, due to the unexpected arrival of COVID-19 and the need to adhere to social distancing rules, we had to postpone the event.
During this challenging time, we’ve been able to keep branches open and ensure members have 24/7 service through our website, mobile app, ATM network and call center. Throughout, members have continued to be able to manage accounts, apply for loans, make transfers, seek personal assistance and conduct other transactions. Plus, with our security, card and account notifications, they have more insight into their finances and more money management tools.
The number of members who can attend the rescheduled annual meeting will be limited according to state and federal guidelines and the need to practice social distancing. Although we can’t predict precisely how the future economy will look, we’re committed to continuing to focus on meeting member needs as we navigate through it together.
Mary McDuffie President/CEO Navy Federal Credit Union
John A. Lockard Chairman Board of Directors
Vision Statement: Be the most preferred and trusted financial institution
serving the military and their families.

Report of the Chairman and President Navy Federal Credit Union was founded during a period of tremendous economic
crisis, and since 1933, we’ve weathered all types of financial conditions. Our
focus on maintaining strength and stability and providing best-in-class member
service has been the hallmark of our success for 86 years. We know that a strong
performance during good economic times like we experienced in 2019 and the
past few years fuel our ability to invest in our members and our technology in
all economic climates. Our members’ needs come first, which is why we say,
“Our Members Are the Mission.”
Financial Summary
As of December 31
(dollars in millions)
2018 2019
Assets $ 96,962.4 $ 111,986.1
Loans Outstanding $ 75,059.2 $ 83,919.9
Savings, Checking, MMSAs, IRAs $ 50,626.6 $ 56,733.7
Share Certificates $ 19,790.9 $ 29,299.6
Members’ Equity $ 11,404.7 $ 13,763.6
Gross Income $ 6,818.6 $ 7,993.2
Non-Interest Expense $ 2,844.1 $ 3,430.8
Dividends $ 642.6 $ 1,016.4
Mortgage Loans Serviced $ 68,697.7 $ 77,307.3
Members 8,232,022 8,959,665
1Navy Federal Credit Union • 2019 Annual Report

Deposit, Loan and Asset Comparisons
2018 2019
Deposits (dollars in billions)
$70.4
$86.0
Loans (dollars in billions)
$75.1
$83.9
Assets (dollars in billions)
$97.0
$112.0
A Solid Foundation Overall, we saw strong and steady growth last year. Our total assets increased by $15 billion to $112.0 billion, and membership increased 9 percent to 9.0 million—249,000 of whom were veterans and their families. We kept our loan and savings rates among the best in the industry, our fees remained low and we offered valuable rebates and discounts. And, both US News & World Report and The Military Wallet recognized us as Best Military Banks and Credit Unions.
Having nearby branches is especially important to those members who want in-person assistance. So, in keeping with our dedication to serving members where they need us, we opened 20 new branches, for a total of 342 worldwide. Many of these new branches were on or near military installations or in areas with a large veteran population. By year’s end, branch visits increased 6 percent, reaching 26.5 million.
Navy Federal Credit Union • 2019 Annual Report2
2018 2019 2018 2019

Navy Federal Credit Union • 2019 Annual Report 3
Partners in Security Because protecting members’ accounts and information continues to be a top priority, in addition to security features already available like 24/7 account monitoring, we offered two more fraud-combatting tools.
2-Step Verification. After entering sign-in credentials, members receive a one-time security code to use as an additional identity verification step. We automatically enrolled all new accounts and rolled out the feature to existing account holders.
Voice ID. Members can now securely access their accounts by phone, through voice identification.
Digital Trends and Support Our mission is to ensure that members have flexibility in how and when they bank and to make those transactions secure and easy to accomplish. So, in addition to our traditional channels like branches, ATMs and call center, we invested in expanding their digital self-service options, so they can manage their finances remotely. Members responded enthusiastically, with 69 percent of them using a digital channel last year.
Three of our new self-service enhancements are highlighted below.
Electronic signatures. We launched a simple new process to enable members to sign promissory notes for all consumer loans electronically.
Account and security notifications.1
This popular feature helps members track their spending and account activity and is a significant defense against fraud. They can customize which notifications they want to receive, like security, balance, withdrawal and deposit notifications, and how they want to receive them. We expanded the types of notifications members can set up, and by the end of the year, we sent one billion notifications, a 108 percent increase over 2018.
New online mortgage and home equity application. We were excited to launch HomeSquad, our new online mortgage and equity application. HomeSquad provides step-by-step guidance and enables members to easily apply, upload documents, track their application status, receive notices of key milestones and more.
24/7 support. We’ve made sure members can continue to contact us around the clock through 24/7 telephone access to stateside member representatives, eMessages, chat, social media and notifications. Member Service Representatives handled 38.7 million calls assisting 4.9 million unique members, surpassing 2018 by 8.9 percent.
Member support initiatives. We also introduced an initiative to help members build and improve credit and one that identified career paths that match the values that matter most to servicemembers.
Member and Employee Satisfaction Our corporate road map is rooted in our commitment to always providing an outstanding member experience and creating and maintaining a positive, employee-centric work environment. As a result, our members’ and employees’ satisfaction remains high, which is reflected in the ratings we receive in national surveys.
Strength and Innovation The military community is characterized by its strength, and we’re proud to serve them throughout all economic conditions. Our members are cut from an amazing cloth— they’re a community and a family. It’s why we strive to continually improve our service, products, processes, tools and technology— to make their interactions with us easier and to give them a better handle on their finances. Because, above all, our members are the mission.®
We’re pleased to present this report to you and thank our members for the opportunity to be their trusted financial partner.

2019 United States and Cuba Locations
ALABAMAEnterpriseMontgomery
ARIZONAChandlerGoodyearGlendaleMesaPhoenix (2)Sierra VistaYuma (2)*
CALIFORNIAChula Vista (2)CoronaCoronadoEl CajonFountain ValleyHawthorneLake ElsinoreLa MesaLemoore*Long BeachMonterey*MurrietaNational CityOceansideOntarioPort HuenemeRidgecrestSan Diego (14)*
San MarcosSanta AnaSanteeTemeculaTwentynine PalmsVacavilleWest Covina
COLORADOAuroraCentennialColorado Springs (2)Fountain
CONNECTICUTGroton (2)*New London*
DISTRICT OF COLUMBIAPentagon*Washington
Navy Yard*
FLORIDAAltamonte SpringsAtlantic BeachClearwaterFleming IslandGulf BreezeJacksonvilleKissimmeeLutzMary Esther
Mayport*Miami*OrlandoPacePanama City Beach*PensacolaRiverviewSatellite BeachTampaWinter Park
GEORGIAAlbany*AugustaBuckheadBufordColumbusConyersGrovetownHinesvilleKennesawKings Bay*MariettaMcDonoughMiltonRichmond HillSandy SpringsSavannahSnellvilleSt MarysStockbridge
HAWAIIHonolulu*KailuaKapoleiMililani
ILLINOISGreat Lakes (2)*GurneeO’Fallon
KANSASJunction CityLeavenworthManhattan
KENTUCKYElizabethtownOak GroveRadcliff
LOUISIANALeesvilleNew Orleans*
MARYLANDAccokeekAnnapolis (3)*Bel AirBethesda (2)*Bowie (2)Capitol HeightsFort Meade* Frederick Gaithersburg
GambrillsGermantown Glen BurnieGlenardenIndian Head*LaurelLexington ParkOdentonRockvilleSuitland*Upper Marlboro Waldorf
MISSISSIPPID’IbervilleGulfport (2)*Meridian*
MISSOURISt. Robert
NEBRASKABellevue
NEVADAFallon*HendersonLas Vegas (3)
NEW JERSEYCherry HillColts Neck*
NEW MEXICOAlbuquerque
NEW YORKEvans MillsHighland FallsKings Point*Saratoga Springs*
NORTH CAROLINACameronElizabeth City*Fayetteville (2)GarnerHavelockJacksonville (2)Midway ParkMoyockRaleigh (2)Richlands Swansboro
OHIOCleveland*
OKLAHOMALawtonMidwest City
PENNSYLVANIACarlisle*Horsham
RHODE ISLANDNewport*
(continued)
4 Navy Federal Credit Union • 2019 Annual Report
WASHINGTON
ARIZONA
COLORADO
UTAH
WYOMING
MONTANA
IDAHO
NEVADA
OREGON
CALIFORNIA
OKLAHOMA
TEXAS
MINNESOTA
IOWA
NORTH DAKOTA
SOUTH DAKOTA
NEBRASKA
KANSAS
NEW MEXICO
WISCONSIN
INDIANA
KENTUCKY
LOUISIANA
ARKANSAS
ILLINOIS
VIRGINIA
NORTHCAROLINA
SOUTHCAROLINA
GEORGIA
ALABAMA
MISSISSIPPI
NEW JERSEY
MARYLAND
DELAWARE
DISTRICT OF COLUMBIA
WESTVIRGINIA
PENNSYLVANIA
OHIO
ILLINOIS
TENNESEE
RHODE ISLANDNEW YORK
MASSACHUSETTS
VERMONT
CONNECTICUT
FLORIDA
NEW HAMPSHIRE
MICHIGAN
MAINE
HAWAII
CUBA
KOREA
JAPAN
OKINAWA
GUAM
SINGAPORE
ASIA
AFRICA, EUROPE & THE MIDDLE EAST
SPAIN
BAHRAIN
DJBOUTI
ITALY
GREECE
★ New Branches ★ Existing Branches

SOUTH CAROLINABeaufortCharleston Columbia (2)North CharlestonParris Island*Summerville (2)
TENNESSEEClarksville (2)Millington
TEXASAllen Arlington
Copperas CoveCorpus ChristiCypressDallasEl Paso (4)Fort Worth (2)*GarlandHarker HeightsHelotesHoustonHumble Katy Killeen (2)Kingsville* Pearland
Round RockSan Antonio (3)Spring Sugar LandThe ColonyUniversal CityWebster Westworth Village
VIRGINIAAlexandria (3)AnnandaleArlington (3)AshburnBurke
CentrevilleChesapeake (5)Colonial HeightsFairfaxFredericksburg (3)GainesvilleHampton (2)Lake RidgeManassasMidlothian MontclairNewport News (2)Norfolk (5)*North Richmond
Portsmouth (3)*RestonSpringfieldStafford (2)Sterling SuffolkViennaVirginia Beach (11)*WilliamsburgWinchester (3)Woodbridge Yorktown*
WASHINGTONBremertonEverett*LaceyLakewoodMarysville*Oak Harbor (2)*PoulsboPuyallupSilverdaleTacoma
2019 Overseas Locations (All On-Base)
AFRICA Djibouti*
BAHRAIN Manama*
CUBA Guantanamo Bay*
GREECE Crete*
GUAM Santa Rita*
ITALY Caserta* Sigonella*
JAPAN Ayase* Camp Zama* Iwakuni* Misawa* Sasebo* Yokosuka* Yokota*
KOREA Chilgok-Gun* Daegu* Pyongtaek* Osan*
OKINAWA Camp Courtney Camp Foster Camp Hansen Camp Kinser Camp Schwab Futenma
SINGAPORE
SPAIN Rota*
5Navy Federal Credit Union • 2019 Annual Report
AFRICA, EUROPE & THE MIDDLE EAST
ASIA
KOREA
JAPAN
OKINAWA
GUAM
SINGAPORE
SPAIN ITALYGREECE
BAHRAIN
DJIBOUTI

2019 Board of Directors
John A. Lockard Chairman of the Board
Bruce B. Engelhardt First Vice Chairman
Edward R. Cochrane Jr. Second Vice Chairman
Mary A. McDuffie Treasurer
Kenneth R. Burns Secretary
6 Navy Federal Credit Union • 2019 Annual Report

Annie B. Andrews Kirk A. Foster Neil W. T. Hogg
William P. Mizerak
7Navy Federal Credit Union • 2019 Annual Report

8 Navy Federal Credit Union • 2019 Annual Report
Supervisory Committee Input for the 2019 Annual Report
The Supervisory Committee provides the membership with an independent appraisal of the safety and soundness of Navy Federal’s operations and activities. It does so in compliance with the Federal Credit Union Act and Navy Federal’s bylaws. The Committee reviews all audit reports and meets quarterly to discuss audit results, Internal Audit recommendations for strengthening internal controls, and the status of management’s action on all prior Internal Audit recommendations. The Supervisory Committee ensures that Navy Federal’s financial statements provide a fair and accurate presentation of its financial condition and that management establishes and maintains sound internal controls to protect the assets of your credit union.
The Supervisory Committee employs the independent accounting firm of PricewaterhouseCoopers LLP (PwC) to assist in meeting its responsibilities. The Committee meets regularly with PwC to evaluate audit results and to plan future audit work. PwC conducts quarterly
procedures related to selected operations, and performs a comprehensive audit of the credit union’s year-end financial statements. PwC’s year-end audit, the Independent Auditor’s Report, appears in this Annual Report.
Throughout the year, the committee reviews and responds in writing to letters and emails it receives from the membership. Both the membership and the management of Navy Federal benefit from this open communication because your individual concerns are addressed on a personal basis and your comments help to ensure that Navy Federal maintains the highest level of service to its members.
The National Credit Union Administration (NCUA), the regulatory agency for all federally chartered credit unions, also performs periodic supervisory examinations.
Based on the results of the Annual Report of Independent Auditors and the Examination Report of the NCUA, it is the opinion of your Supervisory Committee that Navy Federal continues to be financially strong and well managed, with sound policies and programs.
Michael C. Wholley Chairman

Navy Federal Credit Union • 2019 Annual Report 9
Supervisory Committee
Kirk A. Foster Patrick J. McClanahan Caral E. Spangler
Pasquale M. Tamburrino Jr. Michael C. Wholley Chairman, Supervisory Committee

10 Navy Federal Credit Union • 2019 Annual Report
Other Committee Members
John R. Edwards Trent H. Edwards Anthony M. Kurta
Brian E. Luther James L. Moser Daniel L. Nega

Navy Federal Credit Union • 2019 Annual Report 11
Diane M. Randon Paul Severs Jennifer E. Shaar
Mark R. Taylor Karin A. Vernazza David P. Walt

Volunteer Officials
Board of Directors
John A. Lockard Vice Admiral, USN (Ret.) Chairman of the Board Executive Committee
Bruce B. Engelhardt Rear Admiral, USN (Ret.) First Vice Chairman Executive Committee Financial Strategy and Investment Committee Technology Committee
Edward R. Cochrane Jr. Second Vice Chairman Executive Committee Financial Strategy and Investment Committee Planning and Strategic Direction Committee
Mary A. McDuffie Treasurer Executive Committee Financial Strategy and Investment Committee Planning and Strategic Direction Committee Technology Committee
Kenneth R. Burns Colonel, USMC (Ret.) Secretary Executive Committee Financial Strategy and Investment Committee
Annie B. Andrews Rear Admiral, USN (Ret.) Planning and Strategic Direction Committee Technology Committee
Kirk A. Foster Rear Admiral, USN (Ret.) Supervisory Committee Technology Committee
Neil W. T. Hogg Captain, USN (Ret.) Financial Strategy and Investment Committee
William P. Mizerak Colonel, USMC (Ret.) Financial Strategy and Investment Committee Planning and Strategic Direction Committee
Committee Members
John R. Edwards Colonel, USAF Technology Committee
Trent H. Edwards Brigadier General, USAF (Ret.) Financial Strategy and Investment Committee
Anthony M. Kurta Rear Admiral, USN (Ret.) Planning and Strategic Direction Committee
Brian E. Luther Rear Admiral, USN (Ret.) Planning and Strategic Direction Committee
Patrick J. McClanahan Captain, SC, USN (Ret.) Supervisory Committee
James L. Moser Technology Committee
Daniel L. Nega Planning and Strategic Direction Committee
Diane M. Randon Financial Strategy and Investment Committee
Paul Severs Captain, USN (Ret.) Planning and Strategic Direction Committee
Jennifer E. Shaar Colonel, USMC Planning and Strategic Direction Committee
Caral E. Spangler Financial Strategy and Investment Committee Supervisory Committee
Pasquale M. Tamburrino Jr. Supervisory Committee Technology Committee
Mark R. Taylor Colonel, USA Technology Committee
Karin A. Vernazza Captain, USN (Ret.) Technology Committee
David P. Walt Captain, USN Technology Committee
Michael C. Wholley Brigadier General, USMC (Ret.) Chairman, Supervisory Committee
12 Navy Federal Credit Union • 2019 Annual Report

Navy Federal Credit Union • 2019 Annual Report 13
Navy Federal Credit Union
Consolidated Financial Statements and Report of Independent Auditors
December 31, 2019 and 2018

14 Navy Federal Credit Union • 2019 Annual Report
NAVY FEDERAL CREDIT UNIONCONSOLIDATED FINANCIAL STATEMENTS AND REPORT OF INDEPENDENT AUDITORS
DECEMBER 31, 2019 AND 2018 TABLE OF CONTENTS
Report of Independent Auditors…………………………….………………………………………..…15
Financial Statements
Consolidated Statements of Financial Condition…………………………………………....……...16
Consolidated Statements of Income…………………………………………….………………….…17
Consolidated Statements of Comprehensive Income…………….….………………….………..18
Consolidated Statements of Changes in Members' Equity………………………………………..18
Consolidated Statements of Cash Flows………………………………………….…………….….…19
Notes to Consolidated Financial Statements……………………………………….………………..20

PricewaterhouseCoopers LLP, 1800 Tysons Blvd, McLean, VA 22102 T: (703) 918 3000, F: (703) 918 3100, www.pwc.com/us
Report of Independent Auditors
To the Board of Directors and Supervisory Committee of Navy Federal Credit Union
We have audited the accompanying consolidated financial statements of Navy Federal Credit Union and its subsidiaries (“the Company”), which comprise the consolidated statements of financial condition as of December 31, 2019 and 2018, and the related consolidated statements of income, comprehensive income, changes in members’ equity and of cash flows for the years then ended.
Management's Responsibility for the Consolidated Financial Statements
Management is responsible for the preparation and fair presentation of the consolidated financial statements in accordance with accounting principles generally accepted in the United States of America; this includes the design, implementation, and maintenance of internal control relevant to the preparation and fair presentation of consolidated financial statements that are free from material misstatement, whether due to fraud or error.
Auditor’s Responsibility
Our responsibility is to express an opinion on the consolidated financial statements based on our audits. We conducted our audits in accordance with auditing standards generally accepted in the United States of America. Those standards require that we plan and perform the audit to obtain reasonable assurance about whether the consolidated financial statements are free from material misstatement.
An audit involves performing procedures to obtain audit evidence about the amounts and disclosures in the consolidated financial statements. The procedures selected depend on our judgment, including the assessment of the risks of material misstatement of the consolidated financial statements, whether due to fraud or error. In making those risk assessments, we consider internal control relevant to the Company's preparation and fair presentation of the consolidated financial statements in order to design audit procedures that are appropriate in the circumstances, but not for the purpose of expressing an opinion on the effectiveness of the Company's internal control. Accordingly, we express no such opinion. An audit also includes evaluating the appropriateness of accounting policies used and the reasonableness of significant accounting estimates made by management, as well as evaluating the overall presentation of the consolidated financial statements. We believe that the audit evidence we have obtained is sufficient and appropriate to provide a basis for our audit opinion.
Opinion
In our opinion, the consolidated financial statements referred to above present fairly, in all material respects, the financial position of Navy Federal Credit Union and its subsidiaries as of December 31, 2019 and 2018, and the results of its operations and its cash flows for the years then ended in accordance with accounting principles generally accepted in the United States of America.
March 20, 2020
Navy Federal Credit Union • 2019 Annual Report 15

16 Navy Federal Credit Union • 2019 Annual Report
20
CONSOLIDATNED AV
STYA FEDER
TEMENTAL
S CREDOF FIN
IT UANC
NIONIAL COND
ITION
Consolidated Statements of Financial Condition
As of December 31, (dollars in thousands) 2019 2018 ASSETS Cash and cash equivalents $ 5,035,143 $ 1,362,428 Available-for-sale debt securities 18,772,834 16,574,816 Held-to-maturity securities 351,708 400,831 Equity securities - 194,426 Mortgage loans awaiting sale 2,477,253 1,193,288 Loans to members, net of allowance for loan losses of $1,631,851 and $1,475,942, respectively 79,810,777 72,389,939 Accounts receivable and accrued interest 1,037,763 824,890 Property, plant and equipment, net 2,275,394 1,930,167 Investments in FHLB 451,026 569,975 NCUSIF deposit 741,134 635,843 Mortgage servicing rights 505,298 479,638 Goodwill 58,905 58,905 Other assets 468,843 347,300 Total assets $ 111,986,078 $ 96,962,446 LIABILITIES AND MEMBERS’ EQUITY Deposit accounts Checking $ 15,321,607 $ 13,531,358 Savings 18,561,158 16,664,659 Money market savings 15,424,405 14,344,397 Certificates 29,299,556 19,790,889 Individual retirement accounts 7,426,545 6,086,231 Total deposit accounts 86,033,271 70,417,534 Liabilities Borrowed funds 10,259,439 13,308,239 Accounts payable and accrued expenses 1,360,429 1,304,400 Other liabilities 569,316 527,591 Total deposit accounts and liabilities 98,222,455 85,557,764 Members’ equity Equity 13,819,544 12,149,541 Accumulated other comprehensive loss (55,921) (744,859) Total members’ equity 13,763,623 11,404,682 Total liabilities and members’ equity $ 111,986,078 $ 96,962,446
The accompanying notes are an integral part of these consolidated financial statements.

Navy Federal Credit Union • 2019 Annual Report 17
CONSOLIDATED STATEMENTS OF INCOME
For the Years Ended December 31, (dollars in thousands) 2019 2018 Interest income Loans to members $ 5,689,296 $ 4,939,073 Investment securities 487,326 420,946 Other investments 90,748 38,314 Total interest income 6,267,370 5,398,333 Dividends and interest expense Dividends on deposits 1,016,393 642,614 Interest on borrowed funds 355,212 340,006 Total dividends and interest expense 1,371,605 982,620 Net interest income 4,895,765 4,415,713 Provision for loan losses (1,520,844) (1,446,604) Net interest income after provision for loan losses 3,374,921 2,969,109 Non-interest income Net gain on mortgage loans 249,517 167,632 Net gain/(loss) on investments 42,054 (9,519) Mortgage servicing revenue 153,794 132,594 Interchange income 528,606 461,918 Fee and other income 751,906 667,649 Total non-interest income 1,725,877 1,420,274 Non-interest expense Salaries and employee benefits 1,721,539 1,394,426 Office operations and equipment 430,189 382,229 Servicing expense 284,678 290,867 Professional and outside services 277,666 211,667 Marketing 177,894 165,432 Depreciation and amortization 215,304 224,134 Other 323,525 175,357 Total non-interest expense 3,430,795 2,844,112 Net income $ 1,670,003 $ 1,545,271
The accompanying notes are an integral part of these consolidated financial statements.

18 Navy Federal Credit Union • 2019 Annual Report
CONSOLIDATED STATEMENTS OF COMPREHENSIVE INCOME
For the Years Ended December 31, (dollars in thousands) 2019 2018 Net income $ 1,670,003 $ 1,545,271 Other comprehensive income/(loss) Change in unrecognized pension and postretirement amounts 35,890 (81,024) Change in net unrealized gains/(losses) on AFS debt securities 793,555 (291,831) Change in unrecognized losses on derivatives (140,507) (13,100) Total other comprehensive income/(loss) 688,938 (385,955) Total comprehensive income $ 2,358,941 $ 1,159,316
The accompanying notes are an integral part of these consolidated financial statements.
CONSOLIDATED STATEMENTS OF CHANGES IN MEMBERS’ EQUITY
(dollars in thousands) Equity
Accumulated Other Comprehensive (Loss)/Income Total Members' Equity
Balance at December 31, 2017 $ 10,551,156 $ (320,528) $ 10,230,628 Cumulative effects from adoption of new accounting standards 53,114 (38,376) 14,738 Other comprehensive loss - (385,955) (385,955) Net income 1,545,271 - 1,545,271 Balance at December 31, 2018 $ 12,149,541 $ (744,859) $ 11,404,682 Other comprehensive income - 688,938 688,938 Net income 1,670,003 - 1,670,003 Balance at December 31, 2019 $ 13,819,544 $ (55,921) $ 13,763,623
The accompanying notes are an integral part of these consolidated financial statements.

Navy Federal Credit Union • 2019 Annual Report 19
CONSOLIDATED STATEMENTS OF CASH FLOWS
For the Years Ended December 31, (dollars in thousands) 2019 2018 Operating activities
Net income $ 1,670,003 $ 1,545,271 Adjustments to reconcile net income to net cash provided by operating activities
Provision for loan losses 1,520,844 1,446,604 Depreciation and amortization 215,304 224,134 Non-cash adjustments and loss/(gain) on disposal of property, plant and equipment 5,498 (91,924) Loss on valuation of equity securities - 8,677 (Gain)/loss on sale of securities (41,271) 1,013 Loss on extinguishment of debt 26,865 -Amortization of loan origination fees and costs 14,951 13,728 Loss on valuation of mortgage servicing rights 114,321 46,909 Mortgage loans originated for sale (9,215,730) (7,667,792) Gain on sale of mortgages (249,517) (167,632) Mortgage loan sales proceeds 8,066,483 7,714,985 Accretion and amortization of investment securities 56,612 50,875 Change in accounts receivable and accrued interest (212,052) (61,333) Change in mortgage servicing rights (139,981) (134,014) Change in other assets (63,507) (145,523) Change in accounts payable and accrued expenses 77,320 182,849 Change in other liabilities (139,338) 67,958 Net cash provided by operating activities 1,706,805 3,034,785
Investing activities Purchase of AFS debt securities (4,630,494) (3,456,124) Purchase of HTM securities (201,336) -Proceeds from maturities, paydowns and calls of AFS debt securities 1,769,747 1,129,531 Proceeds from sales of AFS debt securities 1,459,481 844,762 Proceeds from maturities, paydowns and calls of HTM securities 250,544 1,022 Proceeds from sales of equity securities 225,179 -Issuance of loan receivable - (750) Net redemptions of FHLB stock 118,949 105,235 Proceeds from sale of loans originated for investment 993,591 -Net increase in loans to members (9,929,144) (9,230,193) Purchases of property, plant and equipment (592,913) (422,995) Increase in NCUSIF deposit (105,291) (76,002) Proceeds from sale of real estate owned and other assets 77,041 42,009 Net cash used in investing activities (10,564,646) (11,063,505)
Financing activities Net increase in deposit accounts 15,615,737 7,410,791 Net decrease in securities sold under repurchase agreements (250,000) -Proceeds from borrowed funds 7,240,202 28,085,002 Repayments of borrowed funds (10,065,867) (30,556,702) Payments of capital lease and financing obligations (9,516) (20,312) Net cash provided by financing activities 12,530,556 4,918,779 Net increase/(decrease) in cash and cash equivalents and restricted cash 3,672,715 (3,109,941)
Cash and cash equivalents and restricted cash at beginning of year 1,367,414 4,477,355 Cash and cash equivalents and restricted cash at end of year $ 5,040,129 $ 1,367,414 Supplemental cash flow information:
Interest paid $ 1,383,161 $ 955,685 Non-cash activities:
Transfers of loans to other assets $ 77,961 $ 28,182 Loans securitization 48,299 356,859 Accrued additions and improvements of property, plant and equipment 22,367 17,367 Financed property, plant and equipment 10,689 6,327 Transfer of land held for sale to other assets 20,486 -Transfer of mortgage loans awaiting sale to loans to members 81,267 -Transfer of loans from members to mortgage loans awaiting sale 975,818 -
The following table provides a reconciliation of Cash and cash equivalents and restricted cash from the Consolidated Statements of Financial Condition to the Consolidated Statements of Cash Flows.
As of December 31, (dollars in thousands) 2019 2018 Cash and cash equivalents on the Consolidated Statements of Financial Condition $ 5,035,143 $ 1,362,428 Restricted cash included in other assets on the Consolidated Statements of Financial Condition (1) 4,986 4,986 Total Cash and cash equivalents and restricted cash in the Consolidated Statements of Cash Flows $ 5,040,129 $ 1,367,414 (1) Refer to Note 2 for additional details.
The accompanying notes are an integral part of these consolidated financial statements.

20 Navy Federal Credit Union • 2019 Annual Report
FOR THE YEARS ENDED DECEMBER 31, 2019 AND 2018 NOTES TO CONSOLIDATED FINANCIAL STATEMENTS
Note 1: Summary of Significant Accounting Policies
Organization
Navy Federal Credit Union is a member-owned, not-for-profit financial institution formed in 1933 under the provisions of the Federal Credit Union Act (FCUA) to provide a variety of financial services to those individuals in its field of membership, which includes active duty, veterans and retired military and civilian personnel who are or were employed by the Department of Defense, and their families. Navy Federal is headquartered in Vienna, Virginia with branch locations around the country and abroad.
Navy Federal Financial Group (NFFG), a subsidiary of Navy Federal Credit Union, is a credit union service organization that provides investment, insurance and other financial services. Navy Federal Brokerage Services is a wholly owned subsidiary of NFFG. Navy Federal Credit Union and its consolidated entity are referred to as "Navy Federal" herein.
Basis of Presentation and Use of Estimates
The consolidated financial statements have been prepared in accordance with accounting principles generally accepted in the United States of America (GAAP). The preparation of financial statements in accordance with GAAP requires management to make estimates and assumptions that affect the amounts reported in the consolidated financial statements and accompanying notes. These estimates are based on information available at the time the consolidated financial statements are prepared. Actual amounts or results could differ from these estimates.
Principles of Consolidation
The consolidated financial statements include the accounts of Navy Federal Credit Union and its wholly owned subsidiary. All significant intercompany accounts and transactions have been eliminated in consolidation.
Business Combinations
The Financial Accounting Standards Board (FASB) Accounting Standards Codification (ASC) 805, Business Combinations, requires all business combinations be accounted for by applying the acquisition method. Accordingly, Navy Federal allocates the acquisition price of assets obtained and liabilities assumed in a business combination at fair value on the acquisition date. Any excess of the acquisition price over the fair value of net assets acquired is recognized as goodwill, and transaction costs are expensed as incurred.
Reclassifications
Certain amounts in the prior year consolidated financial statements have been reclassified to conform to current year presentation.
Cash and Cash Equivalents
Cash and cash equivalents include cash on hand and balances due from other financial institutions, including minimum cash reserves required and cash in excess of minimum reserves held at the Federal Reserve Bank (FRB), federal funds sold and securities purchased under agreements to resell. Cash and cash equivalents exclude restricted cash, which is included in Other assets on the Consolidated Statements of Financial Condition. See Note 2: Restrictions on Cash for details.
Investments
Navy Federal's investments in debt securities are classified as available-for-sale (AFS) or held-to-maturity (HTM) in accordance with ASC 320, Investments—Debt Securities. Debt securities classified as AFS are carried at fair value, with any unrealized gains and losses recorded in accumulated other comprehensive income (AOCI). Debt securities classified as HTM are carried at cost, adjusted for the amortization of premiums and accretion of discounts. Management has the ability and intent to hold these securities until maturity. Gains and losses on dispositions are computed using the specific identification method and are included in Net gain/(loss) on investments in the Consolidated Statements of Income. For both AFS and HTM debt securities, interest income is recognized on an accrual basis, and premiums and discounts are amortized or accreted as an adjustment to interest income using the effective interest method. See Note 3: Investments for details.

Navy Federal Credit Union • 2019 Annual Report 21
Navy Federal evaluates its debt securities in an unrealized loss position for other-than-temporary impairment in accordance with ASC 320. Navy Federal assesses whether it (a) has the intent to sell the debt security, (b) is more likely than not that it will be required to sell the debt security before recovering its amortized cost basis or (c) does not expect to recover the entire amortized cost basis of the debt security even if it does not intend to sell the debt security. In order to determine whether the entire amortized cost basis of the debt security can be recovered, Navy Federal compares the present value of cash flows expected to be collected from the debt security with its amortized cost basis and considers (1) the amount, and length of time, fair value has been less than amortized cost, (2) adverse conditions specifically related to the debt security or specific industry, (3) the volatility of the debt security and its expected cash flows, and (4) changes in ratings of the issuer. Declines in fair value that are other-than-temporary are recognized in earnings.
Navy Federal's investments in equity securities are classified as Equity securities on the Consolidated Statements of Financial Condition in accordance with ASC 321, Investments—Equity Securities. Equity securities are carried at fair value, with any unrealized gains and losses recorded in earnings and included in Net gain/(loss) on investments in the Consolidated Statements of Income. See Note 3: Investments for details.
Navy Federal has stock in the Federal Home Loan Bank (FHLB) of Atlanta with maturities of three months or less. Accordingly, the carrying amounts are considered a reasonable estimate of fair value. FHLB stock is a restricted investment that is included in Investments in FHLB on the Consolidated Statements of Financial Condition and is evaluated for impairment annually. There was no impairment for the years ended December 31, 2019 and 2018.
In accordance with ASC 860, Transfers and Servicing, repurchase agreements and reverse repurchase agreements are recorded at historical cost and accounted for as secured financings or investments. Navy Federal transfers title to the collateral sold or purchased under repurchase and reverse repurchase agreements, respectively, and monitors the fair value of the underlying financial assets, which are primarily U.S. government and federal agency securities.
Loans to Members
Navy Federal's loan portfolio consists of consumer, credit card and real estate loans. Consumer loans consist of auto loans, signature loans, checking lines of credit and education loans. Real estate loans consist of mortgage and equity loans. At origination, all consumer, credit card and equity loans are classified as held for investment. Mortgage loans are classified as either mortgage loans held for investment or mortgage loans awaiting sale (MLAS) based on management's intent and ability to hold the loans for the foreseeable future or until maturity/payoff, or to sell the loans.
In accordance with ASC 310, Receivables, loans to members are carried at the amount of unpaid principal balance (UPB) adjusted for net loan origination fees and certain direct origination costs, less an allowance for loan losses. Interest is accrued on loans using the effective interest method on a daily basis except for credit card loans, for which interest is calculated by applying the periodic rate to the average daily balance outstanding.
Loans are determined to be delinquent based on the contractual terms and are considered delinquent when they are 30 days past due. When a loan becomes 90 days past due, accrued interest is reversed and the loan is placed into non-accrual status. Interest received on non-accrual status loans is accounted for on a cash basis. Loans are returned to accrual status when all the principal and interest amounts contractually due are brought current and future payments are reasonably assured.
In accordance with ASC 310-20, Receivables—Nonrefundable Fees and Other Costs, loan origination fees and certain direct origination costs are deferred and amortized over the life of the loans using the effective interest method (effective yield) for all products except for credit card loans, where fees and costs are netted and deferred and amortized on a straight-line basis over 12 months.
A loan is considered impaired when, based on current information and events, it is probable that Navy Federal will be unable to collect all amounts due from the borrower in accordance with the original contractual term. Navy Federal measures and recognizes impairment in accordance with ASC 310. All loans subject to a troubled debt restructuring (TDR) are individually evaluated for impairment. Interest income on restructured loans that return to accrual status is recognized on an accrual basis.
NOTES TO CONSOLIDATED FINANCIAL STATEMENTS FOR THE YEARS ENDED DECEMBER 31, 2019 AND 2018

22 Navy Federal Credit Union • 2019 Annual Report
Allowance for Loan Losses
Navy Federal accrues estimated losses in accordance with ASC 450, Contingencies. The allowance for loan losses is a reserve against loans to members established through a provision for loan losses charged to earnings. Loan losses are charged against the allowance when management believes the collectability of the loan amount is unlikely. Recoveries on previously charged-off loans are credited to the allowance.
Navy Federal's loan portfolio consists mainly of large groups of smaller-balance homogeneous loans that are collectively evaluated for impairment. The allowance for loan losses is maintained at a level that, in management’s judgment, is sufficient to absorb losses inherent in the portfolio based on monthly evaluations of the portfolio's collectability. Collectability is determined by historical experience, overall delinquency and delinquencies by loan product, and current economic conditions and trends that may adversely affect a borrower’s ability to pay. The allowance for loan losses is subject to estimates and uncertainties associated with factors and processes used in determining the amount. Actual loan losses may differ from the estimates. Loans that are not in foreclosure, undergoing a modification or subject to a repayment plan are generally charged off to the allowance at 180 days past due.
Navy Federal also maintains an allowance for unfunded commitments at a level that is appropriate to absorb estimated probable credit losses. The allowance for unfunded commitments is derived in a manner similar to the methodology used for determining the allowance for loan losses. The allowance for unfunded commitments is recorded in Other liabilities on the Consolidated Statements of Financial Condition and the related provision expense is included in Provision for loan losses in the Consolidated Statements of Income.
Mortgage Loans Awaiting Sale
The initial loan level basis for MLAS is equal to UPB adjusted for net loan origination fees and certain direct origination costs. Interest income on MLAS is recorded as earned and is reported in Interest income—Loans to members in the Consolidated Statements of Income. ASC 825, Financial Instruments, permits entities to irrevocably elect to measure many financial instruments at fair value. Navy Federal has elected the fair value option for MLAS, and subsequent changes to estimated fair value are recognized in Net gain on mortgage loans in the Consolidated Statements of Income. Loans are removed from the Consolidated Statements of Financial Condition when sold and sales treatment is applied when, in accordance with ASC 860, Transfers and Servicing, the conditions for sale of financial assets are met. See Note 5: Loan Sales and Continuing Involvement in Assets Transferred for details.
Mortgage Servicing Rights
Navy Federal recognizes mortgage servicing rights (MSR) when mortgage loans are sold and Navy Federal retains the right to service those loans. Navy Federal recognizes MSR at fair value with changes in fair value recognized in Other in the Consolidated Statements of Income. Nave Federal recognizes revenue from servicing mortgage loans as such fees are earned based on specific contractual terms. See Note 5: Loan Sales and Continuing Involvement in Assets Transferred for details.
Troubled Debt Restructurings
A TDR is a loan for which Navy Federal has granted a concession it would not have otherwise considered because a member is experiencing financial difficulty. The types of concessions Navy Federal grants in a TDR primarily include term extensions and/or interest rate reductions. TDR loans are accounted for in accordance with ASC 310-40, Receivables—Troubled Debt Restructurings by Creditors. See Note 4: Loans and Allowance for Loan Losses for details.
Property, Plant and Equipment
Land held for use is carried at cost. Buildings, furniture, fixtures, equipment, computer software and capitalized information technology (IT) assets are carried at cost less accumulated depreciation and amortization, which are computed on a straight-line basis over the assets' estimated useful lives. The cost and related accumulated depreciation and amortization are eliminated from accounts when assets are disposed. Gains or losses upon disposition are included in Other in the Consolidated Statements of Income. Expenditures for repairs and maintenance are charged to earnings as incurred. Improvements that extend the useful life of an asset are capitalized and depreciated over the extended useful life. Navy Federal purchases, as well as internally develops and customizes, certain software to enhance or perform internal business functions. Software development costs incurred in the planning and post-development project stages are charged to non-interest expense, and costs
NOTES TO CONSOLIDATED FINANCIAL STATEMENTS FOR THE YEARS ENDED DECEMBER 31, 2019 AND 2018

Navy Federal Credit Union • 2019 Annual Report 23
incurred in the application development stage are capitalized and amortized using the straight-line method over a five-year period. Leasehold improvements are carried at cost less accumulated amortization and are amortized over the lesser of the useful life or the remaining fixed non-cancelable lease term. Useful lives for each asset category are estimated as follows:
Useful Life Buildings 40 years Equipment, furniture and fixtures 5 to 7.5 years Computer equipment 2 to 3 years Computer software and capitalized IT assets 5 years
Navy Federal uses the straight-line method to account for its operating leases. Under this method, Navy Federal divides the total contractual rent by the total term of the lease. The average monthly rent is recorded as rent expense, and the remaining rent amount is deferred. Navy Federal reviews its operating leases at inception, and subsequently on an ongoing basis, for the existence of asset retirement obligations that are accrued, when material, pursuant to ASC 410-20, Asset Retirement Obligations.
NCUSIF Deposit
The deposit in the National Credit Union Share Insurance Fund (NCUSIF) is in accordance with the FCUA and the National Credit Union Administration (NCUA) regulations, which require the maintenance of a deposit by each credit union in an amount equal to 1% of its insurable shares. The deposit would be refunded to Navy Federal if its insurance coverage is terminated, the operations of the fund are transferred from the NCUA Board or if NCUA decides to make a distribution to credit unions based on the equity ratio's excess over the net operating level.
Goodwill
Goodwill represents the excess of purchase price over the fair value of assets acquired and liabilities assumed in business combinations. In accordance with ASC 350-20, Intangibles—Goodwill and Other, intangible assets with finite useful lives are amortized and goodwill and intangible assets with indefinite lives are evaluated at least annually for impairment. Navy Federal evaluates goodwill for impairment annually as of September 30, or more frequently should events or changes in circumstances occur, that would more likely than not reduce the fair value of Navy Federal below its carrying value. Impairment exists when the carrying amount of goodwill exceeds its implied fair value. Navy Federal assesses qualitative factors including, but not limited to, the general economic environment, industry and market considerations and overall financial performance of Navy Federal. See Note 9: Goodwill for details.
Derivative Financial Instruments
Derivative financial instruments are financial contracts that derive their value from underlying changes in assets, rates or indices. Derivatives are used to protect or hedge against changes in prices or interest rate movements that could adversely affect the value of certain assets or liabilities and future cash flows.
Navy Federal accounts for its derivative financial instruments in accordance with ASC 815, Derivatives and Hedging, which requires all derivative instruments to be carried at fair value on the Consolidated Statements of Financial Condition. Navy Federal executes certain derivative contracts over-the-counter and clears these transactions through a derivative clearing organization. Some of Navy Federal’s derivatives are subject to legally enforceable master netting agreements, which allow Navy Federal to settle positive and negative positions held with the same counterparty on a net basis. As such, Navy Federal reports these positions on a net basis on the Consolidated Statements of Financial Condition. All derivative financial instruments are recognized at fair value and classified as Other assets or Other liabilities on the Consolidated Statements of Financial Condition. See Note 6: Derivative Instruments and Hedging Activities for details.
Economic Hedges
Navy Federal enters into mortgage loan commitments, also called interest rate lock commitments (IRLCs), in connection with its mortgage banking activities to fund residential mortgage loans at specified times in the future. The IRLCs are considered derivative instruments under applicable accounting guidance and expose Navy Federal to the risk that the price of the loans underlying the commitments may decline between the inception of the rate lock and the funding date of the loan. Navy Federal is exposed to further price risk after the funding date until the mortgage loan is sold. To protect against price risk, Navy Federal enters into forward sales contracts with
NOTES TO CONSOLIDATED FINANCIAL STATEMENTS FOR THE YEARS ENDED DECEMBER 31, 2019 AND 2018

24 Navy Federal Credit Union • 2019 Annual Report
counterparties. Changes in the fair value of economic hedges are included in Net gain on mortgage loans in the Consolidated Statements of Income.
Accounting Hedges
Under the provisions of ASC 815, Derivatives and Hedging, derivative instruments can be designated as fair value hedges or cash flow hedges. Fair value hedges are used to protect against changes in the value of assets and liabilities as a result of interest rate volatility. Navy Federal uses interest rate swaps as fair value hedges to offset the change in value of its fixed-rate AFS debt securities. Changes in the fair value of fair value hedges are recorded in the same Consolidated Statements of Income line item as the related hedged item. Cash flow hedges are used to minimize the variability in cash flows resulting from interest rate fluctuations. Navy Federal uses interest rate swaps to hedge against the variability in cash flows of its floating-rate debt payments. Changes in fair value of cash flow hedges are reported as a component of AOCI and reclassified into earnings in the same period when the hedged transaction affects earnings, and in the same Consolidated Statements of Income line as the hedged item.
At the inception of a hedge relationship, Navy Federal formally documents the hedged item, the particular risk management objective, the nature of the risk being hedged, the derivative being used, how effectiveness of the hedge will be assessed and how ineffectiveness of the hedge will be measured. Navy Federal utilizes a regression analysis at the inception of a hedge and a qualitative analysis for each reporting period thereafter to assess whether the derivative is expected to be, and has been, highly effective in offsetting changes in the fair value or cash flows of a hedged item.
Navy Federal discontinues hedge accounting when it is determined the derivative is not expected to be or has ceased to be a highly effective hedge; the derivative expires or is sold, terminated or exercised; the derivative is de-designated; or in the case of a cash flow hedge, it is no longer probable that the forecasted transaction will occur by the end of the originally specified time frame. Subsequent to discontinuing a fair value or cash flow hedge, the derivative will continue to be recorded on the Consolidated Statements of Financial Condition at fair value, with changes in fair value included in earnings. For a discontinued fair value hedge, the previously hedged item is no longer adjusted for changes in fair value. If the forecasted transaction is no longer probable to occur, Navy Federal discontinues hedge accounting designation and immediately recognizes the previously unrealized gain or loss in AOCI into earnings. For other discontinuing type events, the unrealized gain or loss continues to be deferred in AOCI until the forecasted transaction affects earnings. Navy Federal did not discontinue hedge accounting for any hedges for the years ended December 31, 2019 and 2018.
Pension Accounting and Retirement Benefit Plans
Navy Federal has a defined benefit pension plan, 401(k) defined contribution and 457(b) savings plans, and a non-qualified supplemental retirement plan. Navy Federal also provides a postretirement medical plan for certain retired employees. Navy Federal accounts for its defined benefit pension plans in accordance with ASC 715, Compensation––Retirement Benefits. See Note 12: Retirement Benefit Plans for details.
Fair Value Measurement
Navy Federal measures certain financial assets and liabilities at fair value in accordance with ASC 820, Fair Value Measurement, which defines fair value as the price that would be received to sell an asset or paid to transfer a liability in an orderly transaction between willing market participants at the measurement date. Navy Federal employs various valuation approaches to measure fair value including market and income approaches. The market approach uses prices or relevant information generated by market transactions involving identical or comparable assets or liabilities. The income approach involves discounting future amounts to a single present amount and is based on current market expectations about those future amounts. Valuation techniques and parameters used for measuring assets and liabilities are reviewed and validated by Navy Federal on an annual basis. In measuring fair value, Navy Federal maximizes the use of quoted prices and observable inputs. A description of the fair value hierarchy is as follows:
• Level 1 – Valuation is based on unadjusted quoted prices in an active market for identical instruments.
• Level 2 – Valuation is based on observable inputs such as quoted prices for similar instruments in active markets, quoted prices for identical or similar instruments in markets that are not active and model-based valuation techniques for which all significant assumptions (rates, volatilities, credit spreads) for financial instruments are observable.
NOTES TO CONSOLIDATED FINANCIAL STATEMENTS FOR THE YEARS ENDED DECEMBER 31, 2019 AND 2018

Navy Federal Credit Union • 2019 Annual Report 25
• Level 3 – Valuation is generated from techniques that use significant assumptions that are not observable in the market. Valuation techniques include pricing models, discounted cash flow methodologies or similar techniques.
See Note 16: Fair Value Measurement for additional information.
Revenue Recognition
In the ordinary course of business, Navy Federal recognizes two types of revenue in its Consolidated Statements of Income: Interest income and Non-interest income.
Navy Federal's principal source of revenue is interest income from Loans to members and Investment securities, which is recognized on an accrual basis using the effective interest method. For information on Navy Federal's policies for recognizing Interest income on investments and loans, refer to "Investments", "Loans to Members" and "Mortgage Loans Awaiting Sale" sections within this Note.
Non-interest income includes revenue from various types of transactions and services provided to members and customers. For information on Navy Federal’s policies for recognizing Net gain on mortgage loans, Net gain/(loss) on investments, and Mortgage servicing revenue, refer to "Mortgage Loans Awaiting Sale", “Investments” and “Mortgage Servicing Rights” sections within this Note.
Non-interest income also includes Interchange income and Fee and other income which are accounted for in accordance with ASC 606, Revenue from Contracts with Customers (ASC 606). Navy Federal adopted ASC 606 beginning January 1, 2019 using the retrospective method. Revenue and interest income earned on financial instruments, such as loans, investments and derivatives are not in the scope of the amended revenue recognition accounting guidance and are accounted for under other GAAP. Thus, the adoption of this amended guidance did not have a material impact on Navy Federal’s consolidated financial statements.
Revenue from contracts with customers comprises of non-interest income earned by Navy Federal in exchange for services provided to customers and recognized when services are completed or as they are rendered and based on agreed-upon rates. Majority of the contracts with customers are short-term by nature and can be terminated by our members or customers at any time.
Interchange income consists of credit and debit cards fees for standing ready to authorize and provide settlement on card transactions processed through the payment networks. Interchange fees are recognized upon settlement with the payment networks. Interchange rates are set by the payment network and are based on transaction volumes and other factors.
Interchange income is reported net of the cost of rewards programs based on card usage. The rewards cost totaled $339.3 million and $293.7 million for the years ended December 31, 2019 and 2018.
Majority of Fee and other income relates to service charges on deposit accounts for account maintenance and various transaction-based services such as overdrafts, ATM usage, returned items fees and other deposit related fees. The revenue from these fees is recognized when services or transactions are completed and are based on the type of services provided and agreed-upon rates. Payments for services provided are either withdrawn from the member’s account as services are rendered or in the billing period following the completion of the service.
The adoption of ASC 606 resulted in an immaterial impact on the consolidated financial statements.
Advertising Costs
Advertising costs are expensed as incurred and are included in Marketing in the Consolidated Statements of Income.
Income Taxes
Pursuant to the FCUA, Navy Federal is exempt from federal and state income taxes.
Dividends
Dividend rates on deposit accounts are set by Navy Federal’s Board of Directors. Dividends are charged to Dividends on deposits in the Consolidated Statements of Income and paid to members monthly.
NOTES TO CONSOLIDATED FINANCIAL STATEMENTS FOR THE YEARS ENDED DECEMBER 31, 2019 AND 2018

26 Navy Federal Credit Union • 2019 Annual Report
New Accounting Pronouncements
The following accounting pronouncements have been issued by the FASB, but are not yet effective:
In February 2016, the FASB issued ASU 2016-02, Leases (Topic 842), which requires a lessee to recognize assets and liabilities on financing and operating leases with terms exceeding 12 months. This is a change from current GAAP, which requires only capital leases to be recognized on the balance sheet. The ASU will also require additional disclosures to help financial statement readers better understand the amount, timing and uncertainty of cash flows arising from leases. The following ASUs comprise Topic 842, which collectively allow entities to elect a simplified transition approach:
• ASU 2018-01, Practical Expedient for Transition to Topic 842 • ASU 2018-10, Codification Improvements to Topic 842, Leases • ASU 2018-11, Leases (Topic 842): Targeted Improvements • ASU 2019-01, Leases (Topic 842): Codification Improvements • ASU 2019-10, Financial Instruments: Credit Losses (Topic 326), Derivatives and Hedging (Topic 815), and
Leases (Topic 842)
These ASUs are effective for the annual reporting periods beginning after December 15, 2020. Navy Federal is currently evaluating these ASUs to determine the impact on its consolidated financial statements.
In June 2016, the FASB issued ASU 2016-13, Financial Instruments—Credit Losses (Topic 326): Measurement of Credit Losses on Financial Instruments, which replaces the incurred loss impairment methodology in current GAAP with a methodology that reflects lifetime expected credit losses of assets carried at amortized cost. The following ASUs comprise Topic 326, which collectively allow entities to elect a simplified transition approach:
• ASU 2018-19, Codification Improvements to Topic 326, Financial Instruments—Credit Losses • ASU 2019-04, Topic 1, Topic 2 and Topic 5, Codification Improvements to Topic 326, Financial
Instruments—Credit Losses • ASU 2019-05, Financial Instruments: Credit Losses (Topic 326): Targeted Transition Relief • ASU 2019-10, Financial Instruments: Credit Losses (Topic 326), Derivatives and Hedging (Topic 815), and
Leases (Topic 842): Effective Date • ASU 2019-11, Codification Improvements to Topic 326, Financial Instruments: Credit Losses
These ASUs are effective for the annual reporting periods beginning after December 15, 2022. While it is expected that the adoption of these ASUs will increase the provision for credit losses, Navy Federal is currently assessing the impact of these ASUs on its consolidated financial statements.
In January 2017, the FASB issued ASU 2017-04, Intangibles—Goodwill and Other (Topic 350): Simplifying the Test for Goodwill Impairment, effective for annual reporting periods beginning after December 15, 2021. This ASU simplifies the subsequent measurement of goodwill by eliminating Step 2 from the goodwill impairment test. The amendments require an entity to perform its annual, or interim, goodwill impairment test by comparing the fair value of a reporting unit with its carrying amount. An impairment charge should be recognized for the amount by which a reporting unit's carrying amount exceeds its fair value, but the loss recognized should not exceed the total amount of goodwill allocated to that reporting unit. The ASU must be applied on a prospective basis. Navy Federal believes this guidance will not have a material impact on its consolidated financial statements.
In March 2017, the FASB issued ASU 2017-08, Receivables—Refundable Fees and Other Costs (Subtopic 310-20): Premium Amortization on Purchased Callable Debt Securities, effective for annual reporting periods beginning after December 15, 2019, which shortens the amortization period for certain callable debt securities held at a premium. The amendment does not require a change for securities held at a discount. Navy Federal believes this guidance will not have a material impact on its consolidated financial statements.
In August 2018, the FASB issued ASU 2018-13, Fair Value Measurement (Topic 820): Disclosure Framework— Changes to the Disclosure Requirements for Fair Value Measurement, effective for annual reporting periods beginning after December 15, 2019. The amendments in this ASU either removed or modified disclosure requirements related to fair value measurements in accordance with Topic 820. Navy Federal believes this guidance will not have a material impact on its consolidated financial statements.
NOTES TO CONSOLIDATED FINANCIAL STATEMENTS FOR THE YEARS ENDED DECEMBER 31, 2019 AND 2018

Navy Federal Credit Union • 2019 Annual Report 27
In August 2018, the FASB issued ASU 2018-14, Compensation—Retirement Benefits—Defined Benefit Plans— General (Subtopic 715-20): Disclosure Framework—Changes to the Disclosure Requirements for Defined Benefit Plans, effective for annual reporting periods ending after December 15, 2021. The amendments in this ASU remove disclosures that no longer are considered cost beneficial, clarify the specific requirements of disclosures, and add disclosure requirements identified as relevant for employers that sponsor defined benefit pension or other postretirement plans. Navy Federal is currently evaluating this guidance to determine the impact on its consolidated financial statements.
In October 2018, the FASB issued ASU 2018-16, Derivatives and Hedging (Topic 815): Inclusion of the Secured Overnight Financing Rate (SOFR) Overnight Index Swap (OIS) Rate as a Benchmark Interest Rate for Hedge Accounting Purposes, effective for annual reporting periods beginning after December 15, 2019. This ASU permits the use of the OIS rate based on SOFR as a U.S. benchmark interest rate for hedge accounting purposes under Topic 815. This will provide entities more lead time to prepare for changes to interest rate risk hedging strategies for both risk management and hedge accounting purposes. Navy Federal believes this guidance will not have a material impact on its consolidated financial statements.
Note 2: Restrictions on Cash
Navy Federal had $5.0 million in restricted cash as of December 31, 2019 and 2018. Restricted cash amounts are included in Other assets on the Consolidated Statements of Financial Condition.
Note 3: Investments
Equity Securities
Navy Federal sold its equity securities portfolio in 2019, which consisted of investments in a mutual fund and redeemable common stock. Navy Federal recognized $30.8 million of realized gains from the sale of equity securities for the year ended December 31, 2019. Navy Federal recognized $8.7 million of unrealized losses on equity securities during the year ended December 31, 2018.
HTM and AFS Debt Securities
The amortized cost of Navy Federal's HTM debt securities as of December 31, 2019 and 2018 was $351.7 million and $400.8 million, respectively. Substantially all of the HTM debt securities are U.S. government and federal agency securities.
Navy Federal’s AFS debt securities as of December 31, 2019 and 2018 were as follows:
December 31, 2019
(dollars in thousands) Amortized
Cost Unrealized
Gains Unrealized
Losses Fair
Value
Available-for-sale debt securities U.S. government and federal agency securities $ 7,151,567 $ 142,848 $ (25,973) $ 7,268,442 Residential mortgage-backed securities 6,890,999 67,605 (16,577) 6,942,027 Commercial mortgage-backed securities 473,741 12,433 (90) 486,084 Bank notes and corporate bonds 3,326,532 173,161 (611) 3,499,082 Municipal securities 321,882 17,936 (2,239) 337,579 Non-U.S. government securities 232,422 7,198 - 239,620
Total available-for-sale debt securities $ 18,397,143 $ 421,181 $ (45,490) $ 18,772,834
NOTES TO CONSOLIDATED FINANCIAL STATEMENTS FOR THE YEARS ENDED DECEMBER 31, 2019 AND 2018

28 Navy Federal Credit Union • 2019 Annual Report
December 31, 2018
(dollars in thousands) Amortized
Cost Unrealized
Gains Unrealized
Losses Fair
Value Available-for-sale debt securities
U.S. government and federal agency securities $ 6,204,036 $ 10,599 $ (169,764) $ 6,044,871 Residential mortgage-backed securities 6,658,838 16,654 (136,417) 6,539,075 Commercial mortgage-backed securities 475,075 76 (13,404) 461,747 Bank notes and corporate bonds 3,202,482 6,441 (123,117) 3,085,806 Municipal securities 244,755 2,103 (2,264) 244,594 Non-U.S. government securities 207,808 - (9,085) 198,723
Total available-for-sale debt securities $ 16,992,994 $ 35,873 $ (454,051) $ 16,574,816
Navy Federal sold AFS debt securities with a carrying value of $1,448.2 million and $846.5 million for cash proceeds of $1,459.5 million and $844.8 million for the years ended December 31, 2019 and 2018, respectively. Gross realized gains of $11.5 million and gross realized losses of $0.2 million were included in earnings for the year ended December 31, 2019. Gross realized gains of $5.0 million and gross realized losses of $6.7 million were included in earnings for the year ended December 31, 2018.
The contractual maturities of Navy Federal's HTM debt securities as of December 31, 2019 were as follows:
December 31, 2019 (dollars in thousands) Amortized Cost Held-to-maturity debt securities
Due in one year or less $ 99,849 Due after one year through five years 251,859
Total held-to-maturity debt securities $ 351,708
The contractual maturities of Navy Federal's AFS debt securities as of December 31, 2019 were as follows:
December 31, 2019 (dollars in thousands) Amortized Cost Fair Value Available-for-sale debt securities
Due in one year or less $ 938,617 $ 943,781 Due after one year through five years 3,704,995 3,777,804 Due after five years through ten years 4,995,058 5,147,520 Due after ten years 8,758,473 8,903,729
Total available-for-sale debt securities $ 18,397,143 $ 18,772,834
Navy Federal held 3 HTM and 114 AFS debt securities in an unrealized loss position at December 31, 2019. All securities in an unrealized loss position were reviewed individually to determine whether those losses were caused by an other-than-temporary decline in fair value. Navy Federal makes a determination of whether unrealized losses are other-than-temporary based on the following factors: whether Navy Federal intends to sell or hold the security until its costs can be recovered, the nature of the security, the portion of unrealized losses that are attributable to credit losses and the financial condition of the issuer of the security. Navy Federal does not intend to sell nor would Navy Federal be, more likely than not, required to sell these securities before recovering their amortized cost basis. The unrealized losses associated with these investments are not a result of changes in the credit quality of the issuers; rather, the losses are reflective of changing market interest rates. Navy Federal expects to recover the entire cost basis of these securities as there were no declines in the fair value that were considered other-than-temporary during the years ended December 31, 2019 and 2018.
NOTES TO CONSOLIDATED FINANCIAL STATEMENTS FOR THE YEARS ENDED DECEMBER 31, 2019 AND 2018

Navy Federal Credit Union • 2019 Annual Report 29
The following tables present HTM and AFS debt securities at fair value and their associated gross unrealized losses broken down by the amount of time the investments have been in a loss position:
December 31, 2019
(dollars in thousands)
Less than 12 Months 12 Months or Longer Total
Fair Value
Gross Unrealized
Losses Fair
Value
Gross Unrealized
Losses Fair
Value
Gross Unrealized
Losses Held-to-maturity debt securities $ 200,255 $ (778) $ - $ - $ 200,255 $ (778) Available-for-sale debt securities
U.S. government and federal agency securities 1,007,291 (24,175) 148,689 (1,798) 1,155,980 (25,973) Residential mortgage- backed securities 1,109,796 (6,246) 885,431 (10,331) 1,995,227 (16,577) Commercial mortgage-backed securities 26,944 (90) - - 26,944 (90) Bank notes and corporate bonds 105,499 (611) - - 105,499 (611) Municipal securities 55,025 (2,216) 8,698 (23) 63,723 (2,239)
Total available-for-saledebt securities 2,304,555 (33,338) 1,042,818 (12,152) 3,347,373 (45,490) Total debt securities $ 2,504,810 $ (34,116) $ 1,042,818 $ (12,152) $ 3,547,628 $ (46,268)
December 31, 2018
(dollars in thousands)
Less than 12 Months 12 Months or Longer Total
Fair Value
Gross Unrealized
Losses Fair
Value
Gross Unrealized
Losses Fair
Value
Gross Unrealized
Losses Held-to-maturity debt securities $ 220 $ - $ 396,309 $ (3,232) $ 396,529 $ (3,232) Available-for-sale debt securities
U.S. government and federal agency securities 199,496 (340) 4,535,410 (169,424) 4,734,906 (169,764) Residential mortgage-backed securities 83,450 (1,009) 4,710,523 (135,408) 4,793,973 (136,417) Commercial mortgage-backed securities 125,057 (960) 311,600 (12,444) 436,657 (13,404) Bank notes andcorporate bonds 1,282,662 (32,857) 1,525,358 (90,260) 2,808,020 (123,117) Municipal securities 16,924 (284) 114,254 (1,980) 131,178 (2,264) Non-U.S. governmentsecurities 54,173 (592) 144,549 (8,493) 198,722 (9,085)
Total available-for-saledebt securities 1,761,762 (36,042) 11,341,694 (418,009) 13,103,456 (454,051) Total debt securities $ 1,761,982 $ (36,042) $ 11,738,003 $ (421,241) $ 13,499,985 $ (457,283)
As of December 31, 2019 and 2018, Navy Federal had pledged $152.0 million and $62.8 million, respectively, of investment securities as collateral with counterparties for derivative transactions under master netting agreements. As of December 31, 2019 and 2018, Navy Federal pledged zero and $258.1 million, respectively, of U.S. Treasury and federal agency securities as collateral for borrowed funds under repurchase agreements. For securities sold under agreements to repurchase, Navy Federal would be obligated to provide additional collateral in the event of a significant decline in fair value of the collateral pledged. The risk is managed by monitoring the liquidity and credit quality of the collateral, as well as the maturity profile of the transactions. See Note 11: Borrowed Funds for maturity information of the associated liabilities.
NOTES TO CONSOLIDATED FINANCIAL STATEMENTS FOR THE YEARS ENDED DECEMBER 31, 2019 AND 2018
30 Navy Federal Credit Union • 2019 Annual Report
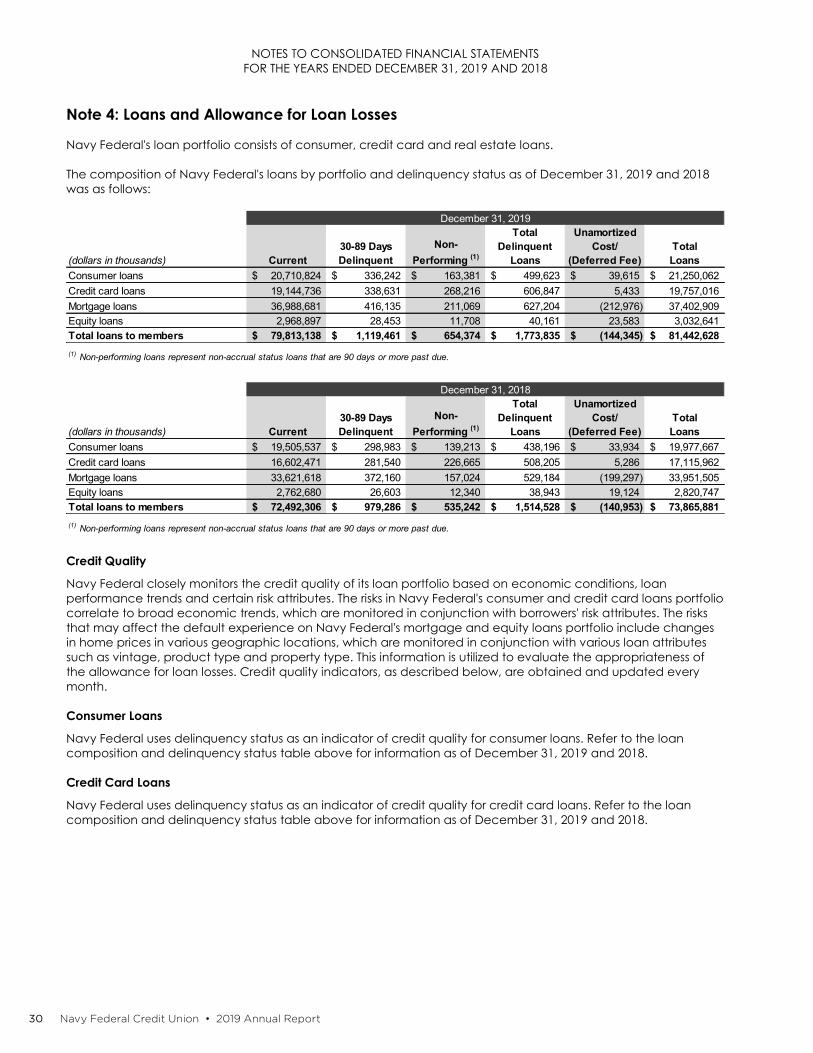
Note 4: Loans and Allowance for Loan Losses
Navy Federal's loan portfolio consists of consumer, credit card and real estate loans.
The composition of Navy Federal's loans by portfolio and delinquency status as of December 31, 2019 and 2018 was as follows:
December 31, 2019
(dollars in thousands) Current 30-89 Days Delinquent
Non-Performing (1)
Total Delinquent
Loans
Unamortized Cost/
(Deferred Fee) Total Loans
Consumer loans $ 20,710,824 $ 336,242 $ 163,381 $ 499,623 $ 39,615 $ 21,250,062 Credit card loans 19,144,736 338,631 268,216 606,847 5,433 19,757,016 Mortgage loans 36,988,681 416,135 211,069 627,204 (212,976) 37,402,909 Equity loans 2,968,897 28,453 11,708 40,161 23,583 3,032,641 Total loans to members $ 79,813,138 $ 1,119,461 $ 654,374 $ 1,773,835 $ (144,345) $ 81,442,628 (1) Non-performing loans represent non-accrual status loans that are 90 days or more past due.
December 31, 2018
(dollars in thousands) Current 30-89 Days Delinquent
Non-Performing (1)
Total Delinquent
Loans
Unamortized Cost/
(Deferred Fee) Total Loans
Consumer loans $ 19,505,537 $ 298,983 $ 139,213 $ 438,196 $ 33,934 $ 19,977,667 Credit card loans 16,602,471 281,540 226,665 508,205 5,286 17,115,962 Mortgage loans 33,621,618 372,160 157,024 529,184 (199,297) 33,951,505 Equity loans 2,762,680 26,603 12,340 38,943 19,124 2,820,747 Total loans to members $ 72,492,306 $ 979,286 $ 535,242 $ 1,514,528 $ (140,953) $ 73,865,881 (1) Non-performing loans represent non-accrual status loans that are 90 days or more past due.
Credit Quality
Navy Federal closely monitors the credit quality of its loan portfolio based on economic conditions, loan performance trends and certain risk attributes. The risks in Navy Federal's consumer and credit card loans portfolio correlate to broad economic trends, which are monitored in conjunction with borrowers' risk attributes. The risks that may affect the default experience on Navy Federal's mortgage and equity loans portfolio include changes in home prices in various geographic locations, which are monitored in conjunction with various loan attributes such as vintage, product type and property type. This information is utilized to evaluate the appropriateness of the allowance for loan losses. Credit quality indicators, as described below, are obtained and updated every month.
Consumer Loans
Navy Federal uses delinquency status as an indicator of credit quality for consumer loans. Refer to the loan composition and delinquency status table above for information as of December 31, 2019 and 2018.
Credit Card Loans
Navy Federal uses delinquency status as an indicator of credit quality for credit card loans. Refer to the loan composition and delinquency status table above for information as of December 31, 2019 and 2018.
NOTES TO CONSOLIDATED FINANCIAL STATEMENTS FOR THE YEARS ENDED DECEMBER 31, 2019 AND 2018

Navy Federal Credit Union • 2019 Annual Report 31
Mortgage Loans
Navy Federal uses FICO score as an indicator of credit quality for mortgage loans held for investment, which consisted of the following as of December 31, 2019 and 2018:
December 31, (dollars in thousands) FICO 2019 (1) 2018 (2)
Greater than or Equal to 610 $ 35,035,074 $ 32,569,252 Less than 610 2,576,927 1,594,278 Total $ 37,612,001 $ 34,163,530
(1) Excludes deferred fee, net of $(213.0) million, other adjustments of $(36.9) million and loans in process of $40.8 million. (2) Excludes deferred fee, net of $(199.3) million, other adjustments of $(37.6) million and loans in process of $24.9 million.
Equity Loans
Navy Federal uses delinquency status and FICO score as indicators of credit quality for equity loans, which consisted of the following as of December 31, 2019 and 2018:
December 31, 2019 (dollars in thousands) FICO Score
Delinquency Status Less than 610 Greater than or
Equal to 610 Total (1)
Performing $ 109,874 $ 2,889,531 $ 2,999,405
60+ days and foreclosure 12,451 6,049 18,500
Total $ 122,325 $ 2,895,580 $ 3,017,905 (1) Excludes unamortized cost of $23.6 million, loans in process of $2.7 million and other adjustments of $(11.5) million.
December 31, 2018 (dollars in thousands) FICO Score
Delinquency Status Less than 610 Greater than or
Equal to 610 Total (1)
Performing $ 98,576 $ 2,690,861 $ 2,789,437
60+ days and foreclosure 14,662 4,283 18,945
Total $ 113,238 $ 2,695,144 $ 2,808,382 (1) Excludes unamortized cost of $19.1 million, loans in process of $3.8 million and other adjustments of $(10.6) million.
Allowance for Loan Losses
Changes in the allowance for loan and lease losses during the years ended December 31, 2019 and 2018 were as follows:
December 31, 2019 (dollars in thousands) Consumer Credit Cards Real Estate Total Allowance for credit losses:
Balance, beginning of year $ 499,784 $ 896,635 $ 79,523 $ 1,475,942 Provision expense 500,272 1,005,188 15,384 1,520,844 Loans charged off (602,365) (928,285) (17,745) (1,548,395) Recoveries 111,131 71,020 8,481 190,632 Net change in allowance for unfunded commitments 119 (7,291) - (7,172)
Balance, end of year $ 508,941 $ 1,037,267 $ 85,643 $ 1,631,851 Ending balance: loans individually evaluated for impairment $ 165,305 $ 221,711 $ 64,192 $ 451,208 Ending balance: loans collectively evaluated for impairment $ 342,800 $ 815,556 $ 19,300 $ 1,177,656 Ending balance: loans acquired with deteriorated credit quality $ 836 $ - $ 2,151 $ 2,987 Loan amount (excluding allowance): Ending balance: loans individually evaluated for impairment $ 851,820 $ 614,503 $ 1,137,299 $ 2,603,622 Ending balance: loans collectively evaluated for impairment $ 20,396,349 $ 19,142,513 $ 39,285,371 $ 78,824,233 Ending balance: loans acquired with deteriorated credit quality $ 1,893 $ - $ 12,880 $ 14,773
NOTES TO CONSOLIDATED FINANCIAL STATEMENTS FOR THE YEARS ENDED DECEMBER 31, 2019 AND 2018

32 Navy Federal Credit Union • 2019 Annual Report
December 31, 2018 (dollars in thousands) Consumer Credit Cards Real Estate Total Allowance for credit losses:
Balance, beginning of year $ 485,152 $ 693,150 $ 107,397 $ 1,285,699 Provision expense 503,510 956,438 (13,344) 1,446,604 Loans charged off (579,473) (794,758) (24,311) (1,398,542) Recoveries 90,726 50,358 9,781 150,865 Net change in allowance for unfunded commitments (131) (8,553) - (8,684)
Balance, end of year $ 499,784 $ 896,635 $ 79,523 $ 1,475,942 Ending balance: loans individually evaluated for impairment $ 178,113 $ 181,968 $ 63,628 $ 423,709 Ending balance: loans collectively evaluated for impairment $ 319,274 $ 714,667 $ 13,328 $ 1,047,269 Ending balance: loans acquired with deteriorated credit quality $ 2,397 $ - $ 2,567 $ 4,964 Loan amount (excluding allowance): Ending balance: loans individually evaluated for impairment $ 899,728 $ 514,202 $ 1,248,089 $ 2,662,019 Ending balance: loans collectively evaluated for impairment $ 19,074,164 $ 16,601,760 $ 35,508,196 $ 71,184,120 Ending balance: loans acquired with deteriorated credit quality $ 3,775 $ - $ 15,967 $ 19,742
Changes in the allowance for unfunded commitments during the years ended December 31, 2019 and 2018 were as follows:
(dollars in thousands) 2019 2018 Balance, beginning of year $ 47,453 $ 38,769 Net change in allowance for unfunded commitments 7,172 8,684 Balance, end of year $ 54,625 $ 47,453
Troubled Debt Restructurings
TDRs are individually evaluated for impairment beginning in the month of restructuring. For loans that have not been approved for foreclosure or discharged under Chapter 7 bankruptcy, impairment is measured as the difference between the net carrying amount of the loan, less any fees received to affect the restructuring, and the modified future expected cash flows discounted at the loan’s original effective interest rate. For real estate loans approved for foreclosure, impairment is measured by the difference between the recorded investment and the collateral value, net of costs to sell. Chapter 7 bankruptcy TDRs are considered to be dependent solely on the collateral for repayment. The loans are measured based on the estimated fair value of the collateral less estimated cost to sell and a charge-off is recorded if the carrying value exceeds the fair value of the collateral.
The following tables summarize the financial impact, by concession type, of loans that became TDRs during the years ended December 31, 2019 and 2018:
2019 (1)
(1) Excludes loans that were classified as TDRs in prior years and re-modified during the year.
(dollars in thousands)
Interest Rate Reduction and
Term Extension Interest Rate
Reduction Term Extension Other (2) Total Consumer $ 27,183 $ 24,174 $ 34,589 $ 8,848 $ 94,794 Credit card - 143,477 - 4,225 147,702 Real estate 7,130 110 8,767 790 16,797 Total $ 34,313 $ 167,761 $ 43,356 $ 13,863 $ 259,293
(2) Includes TDR loans resulting from actions taken by a bankruptcy court, such as the reduction of the loan's contractual principal or interest, or where the borrower has been released from personal liability.
NOTES TO CONSOLIDATED FINANCIAL STATEMENTS FOR THE YEARS ENDED DECEMBER 31, 2019 AND 2018
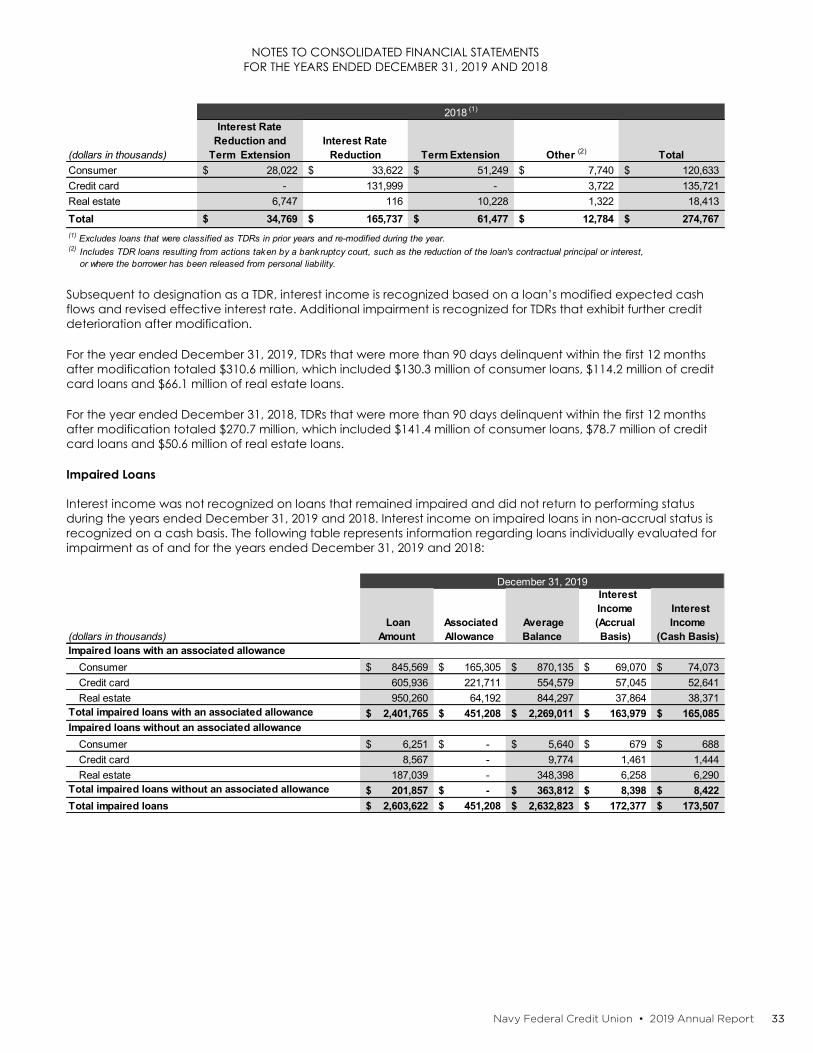
Navy Federal Credit Union • 2019 Annual Report 33
2018 (1)
(1) Excludes loans that were classified as TDRs in prior years and re-modified during the year.
(dollars in thousands)
Interest Rate Reduction and
Term Extension Interest Rate
Reduction Term Extension Other (2) Total Consumer $ 28,022 $ 33,622 $ 51,249 $ 7,740 $ 120,633 Credit card - 131,999 - 3,722 135,721 Real estate 6,747 116 10,228 1,322 18,413 Total $ 34,769 $ 165,737 $ 61,477 $ 12,784 $ 274,767
(2) Includes TDR loans resulting from actions taken by a bankruptcy court, such as the reduction of the loan's contractual principal or interest, or where the borrower has been released from personal liability.
Subsequent to designation as a TDR, interest income is recognized based on a loan’s modified expected cash flows and revised effective interest rate. Additional impairment is recognized for TDRs that exhibit further credit deterioration after modification.
For the year ended December 31, 2019, TDRs that were more than 90 days delinquent within the first 12 months after modification totaled $310.6 million, which included $130.3 million of consumer loans, $114.2 million of credit card loans and $66.1 million of real estate loans.
For the year ended December 31, 2018, TDRs that were more than 90 days delinquent within the first 12 months after modification totaled $270.7 million, which included $141.4 million of consumer loans, $78.7 million of credit card loans and $50.6 million of real estate loans.
Impaired Loans
Interest income was not recognized on loans that remained impaired and did not return to performing status during the years ended December 31, 2019 and 2018. Interest income on impaired loans in non-accrual status is recognized on a cash basis. The following table represents information regarding loans individually evaluated for impairment as of and for the years ended December 31, 2019 and 2018:
December 31, 2019
(dollars in thousands) Loan
Amount Associated Allowance
Average Balance
Interest Income (Accrual Basis)
Interest Income
(Cash Basis) Impaired loans with an associated allowance
Consumer $ 845,569 $ 165,305 $ 870,135 $ 69,070 $ 74,073 Credit card 605,936 221,711 554,579 57,045 52,641 Real estate 950,260 64,192 844,297 37,864 38,371
Total impaired loans with an associated allowance $ 2,401,765 $ 451,208 $ 2,269,011 $ 163,979 $ 165,085 Impaired loans without an associated allowance
Consumer $ 6,251 $ - $ 5,640 $ 679 $ 688 Credit card 8,567 - 9,774 1,461 1,444 Real estate 187,039 - 348,398 6,258 6,290
Total impaired loans without an associated allowance $ 201,857 $ - $ 363,812 $ 8,398 $ 8,422 Total impaired loans $ 2,603,622 $ 451,208 $ 2,632,823 $ 172,377 $ 173,507
NOTES TO CONSOLIDATED FINANCIAL STATEMENTS FOR THE YEARS ENDED DECEMBER 31, 2019 AND 2018

34 Navy Federal Credit Union • 2019 Annual Report
December 31, 2018
(dollars in thousands) Loan
Amount Associated Allowance
Average Balance
Interest Income (Accrual Basis)
Interest Income
(Cash Basis) Impaired loans with an associated allowance
Consumer $ 894,700 $ 178,113 $ 847,413 $ 69,659 $ 76,384 Credit card 503,222 181,968 442,731 43,403 40,002 Real estate 738,333 63,628 706,013 30,135 29,805
Total impaired loans with an associated allowance $ 2,136,255 $ 423,709 $ 1,996,157 $ 143,197 $ 146,191 Impaired loans without an associated allowance
Consumer $ 5,028 $ - $ 4,406 $ 1,110 $ 923 Credit card 10,980 - 8,301 2,088 1,968 Real estate 509,756 - 474,764 17,650 17,193
Total impaired loans without an associated allowance $ 525,764 $ - $ 487,471 $ 20,848 $ 20,084 Total impaired loans $ 2,662,019 $ 423,709 $ 2,483,628 $ 164,045 $ 166,275
Note 5: Loan Sales and Continuing Involvement in Assets Transferred
In the normal course of business, Navy Federal originates and transfers qualifying residential mortgage loans in securitization or sales transactions in which it has continuing involvement. Loans are sold to Federal National Mortgage Association and Federal Home Loan Mortgage Corporation, collectively Government Sponsored Enterprises (GSEs), and Government National Mortgage Association (GNMA). The GSEs and the GNMA generally securitize loans into mortgage-backed securities that are sold to third-party investors in the secondary market or retained by Navy Federal for investment purposes. Navy Federal may also sell loans that were previously retained for investment purposes to private third-party investors.
Navy Federal originated $18.5 billion and $15.3 billion, and sold/securitized $8.9 billion and $8.1 billion, of first mortgage loans during the years ended December 31, 2019 and 2018, respectively. The following table provides a summary of the cash flows exchanged between Navy Federal and transferees on all loans transferred during the years ended December 31:
(dollars in thousands) 2019 2018 Cash from sale of mortgage loans and mortgage-backed securities $ 9,060,074 $ 7,714,985 Repurchase of previously transferred loans 25,828 37,800 Contractual servicing fees received 153,794 132,594
During the year ended December 31, 2019, Navy Federal reclassified $975.8 million of mortgage loans from held for investment to MLAS. Navy Federal transferred these loans to MLAS at fair value and subsequently sold them for cash proceeds of $993.6 million and recognized MSR assets of $13.1 million for the year ended December 31, 2019. During the year ended December 31, 2018, Navy Federal did not reclassify any loans from held for investment to MLAS.
Gains on the sale of MLAS are included in Net gain on mortgage loans in the Consolidated Statements of Income and totaled $185.7 million and $180.5 million for the years ended December 31, 2019 and 2018, respectively. Navy Federal recorded $63.5 million of fair value gains and $12.9 million of fair value losses for the years ended December 31, 2019 and 2018, respectively, in Net gain on mortgage loans in the Consolidated Statements of Income.
Navy Federal's continuing involvement in loans transferred includes ongoing servicing, repurchasing previously transferred loans under certain conditions, loss-sharing agreements, holding of mortgage-backed securities issued by securitization and obligations related to standard representations and warranties. Navy Federal may also incur incremental obligations related to various forms of credit enhancements afforded to third-party investors for securities partially backed by the transferred loans.
NOTES TO CONSOLIDATED FINANCIAL STATEMENTS FOR THE YEARS ENDED DECEMBER 31, 2019 AND 2018

Navy Federal Credit Union • 2019 Annual Report 35
Servicing
Navy Federal retains MSR on loans transferred in sale transactions and loans securitized by the GSEs and GNMA. MSR assets are recognized at fair value on the date of sale or securitization. Actual and expected loan constant prepayment rates (CPR), discount rates, servicing costs and other economic factors are considered in determining the MSR fair value. The MSR valuation is sensitive to interest rate and prepayment risk. The sensitivity analysis of the hypothetical effect on fair value of MSR as a result of a 10% and 20% adverse change in the CPR and option adjusted spread at December 31 is presented below:
(dollars in thousands) 2019 2018 Weighted-average life (years) 6.64 7.10 Weighted-average CPR 9.59% 8.52%
Decline in fair value from 10% adverse change $ 17,289 $ 14,164 Decline in fair value from 20% adverse change 33,392 27,436
Option adjusted spread 9.41% 9.00% Decline in fair value from 10% adverse change $ 16,120 $ 14,882 Decline in fair value from 20% adverse change 31,202 28,834
See Note 16: Fair Value Measurement for further details.
Navy Federal earns servicing and other ancillary fees for its role as servicer. Navy Federal's servicing fees are priced based on parameters set by the GSEs and GNMA. Navy Federal's servicing revenue is included in Mortgage servicing revenue in the Consolidated Statements of Income. During the years ended December 31, 2019 and 2018, Navy Federal received $3.1 million and $2.5 million, respectively, of late charges and miscellaneous fees, which is included in Fee and other income in the Consolidated Statements of Income.
Navy Federal’s responsibilities as servicer typically include collecting and remitting monthly principal and interest payments, maintaining escrow deposits, performing loss mitigation and foreclosure activities, and in certain instances, funding servicing advances that have not yet been collected from the borrower. Navy Federal recognizes servicing advances in Accounts receivable and accrued interest on the Consolidated Statements of Financial Condition. Servicing advances as of December 31, 2019 and 2018 totaled $33.0 million and $32.0 million, respectively.
The following table provides the outstanding and delinquent loan balances of transferred loans for which Navy Federal retains servicing rights at December 31:
(dollars in thousands) 2019 2018
Principal balances of loans serviced (1) $ 37,426,413 $ 33,458,117
Delinquent loans (1), (2) 243,872 212,215 (1) Includes loans that are in the GNMA early pool buyback program of $141.3 million and $108.8 million at December 31, 2019 and 2018, respectively. (2) Serviced delinquent loans are 60 days or more past due.
Retained Investment in GNMA Securities
GNMA securities backed by Navy Federal loans may be retained as investments by Navy Federal and classified as AFS debt securities. See Note 3: Investments for details.
In accordance with ASC 860-30, Secured Borrowing and Collateral, the effect of two negative changes in each of the key assumptions used to determine the fair value of Navy Federal’s investment in GNMA securities must be disclosed. The negative effect of each key assumption change must be calculated independently, holding all other assumptions constant. The table below details the key assumptions used in Navy Federal's analysis, specifically, CPR, anticipated credit losses and weighted-average life.
NOTES TO CONSOLIDATED FINANCIAL STATEMENTS FOR THE YEARS ENDED DECEMBER 31, 2019 AND 2018

36 Navy Federal Credit Union • 2019 Annual Report
(dollars in thousands) 2019 2018 Weighted-average CPR 13.97% 12.49% Anticipated credit losses (1) $ - $ -Weighted-average life (years) 4.49 5.02 (1) GNMA securities are fully collateralized by government-insured loans and as such, there are no anticipated significant credit losses.
The sensitivity analysis of the hypothetical effect on fair value of GNMA securities as a result of a 10% and 20% adverse change in the CPR at December 31 is presented below:
(dollars in thousands) 2019 2018 Weighted-average CPR
Decline in fair value from 10% adverse change $ 1,150 $ 344 Decline in fair value from 20% adverse change 2,438 728
The sensitivities in the table above are hypothetical and may not be indicative of actual results. The effect of a variation in a particular assumption on the fair value is calculated independently of changes in other assumptions. Further, changes in fair value based on variations in assumptions generally cannot be extrapolated because the relationship of the change in assumption on the fair value may not be linear.
The fair value of GNMA securities held by Navy Federal was $778.5 million and $927.1 million as of December 31, 2019 and 2018, respectively.
GNMA Early Pool Buyback Program
Navy Federal has the option to repurchase pooled loans out of GNMA securities when members fail to make payments for three consecutive months. As Navy Federal has the unilateral ability to repurchase these loans, effective control over the loans has been regained. Navy Federal recognizes an asset in MLAS and a corresponding liability in Other liabilities on the Consolidated Statements of Financial Condition regardless of whether it has the intent to repurchase the loan. At December 31, 2019 and 2018, UPB associated with the Early Pool Buyback Program recognized in MLAS and Other liabilities totaled $141.3 million and $108.8 million, respectively.
Financial Guarantees Related to Recourse Provided in Assets Transferred
Representations and Warranties
For mortgage loans transferred in sale transactions or securitizations to the GSEs, GNMA and other investors, Navy Federal has made representations and warranties that the loans meet specified requirements. These requirements typically relate to collateral, underwriting standards, validation of certain borrower representations in connection with the loan and the use of standard legal documentation. In connection with the sale of loans to the GSEs, GNMA and other investors, Navy Federal may be required to repurchase the loan or indemnify the respective entity for losses due to breaches of these representations and warranties.
Navy Federal recognizes a liability for estimated losses related to representations and warranties from the inception of the obligation when the loans are sold. This liability is included in Other liabilities on the Consolidated Statements of Financial Condition. In the Consolidated Statements of Income, the related expense is included as an offset to Net gain on mortgage loans for loans sold during the current period, or in Servicing expense for re-measurement of the liability related to loans sold in prior periods. Navy Federal’s estimated representations and warranties liability at December 31, 2019 and 2018 was $24.1 million and $33.6 million, respectively.
Management believes the liability for representations and warranties appropriately reflects the estimated probable losses on indemnification and repurchase claims for all loans sold and outstanding as of December 31, 2019 and 2018. In making these estimates, Navy Federal considers the losses expected to be incurred over the weighted average life of the sold loans. While management seeks to obtain all relevant information in estimating this liability, the estimation process is inherently uncertain and imprecise and, accordingly, it is reasonably possible future losses could be more or less than Navy Federal's established liability. At December 31, 2019 and 2018, Navy Federal estimates it is reasonably possible it could incur additional losses in excess of its accrued liability of up to approximately $47.6 million and $82.0 million, respectively.
NOTES TO CONSOLIDATED FINANCIAL STATEMENTS FOR THE YEARS ENDED DECEMBER 31, 2019 AND 2018

Navy Federal Credit Union • 2019 Annual Report 37
The total UPB subject to representations and warranties was $36.4 billion and $32.5 billion as of December 31, 2019 and 2018, respectively.
Loss-Sharing Agreements
Navy Federal sold mortgage loans to the GSEs under loss-sharing agreements dated from 2006 to 2019. Navy Federal must indemnify the GSEs for losses related to loans with higher loan-to-value (LTV) ratios through the life of the loans or loans with higher LTV and no private mortgage insurance that occur during a period of three to four years from the applicable settlement date. The following table summarizes the outstanding balance of loans sold and payments made for losses under these agreements during the years ended December 31, 2019 and 2018:
(dollars in thousands) UPB of Loans Sold
as of 12/31 Maximum Future Exposure Losses Paid During the
Year Ended 12/31 Carrying Value of Liability
as of 12/31 2019 $ 809,131 $ 94,209 $ 1,486 $ 9,114 2018 1,048,310 115,163 4,000 17,292
The liability recognized for estimated losses related to these loss-sharing agreements is included in Other liabilities on the Consolidated Statements of Financial Condition. In the Consolidated Statements of Income, the related expense is included as an offset to Net gain on mortgage loans for loans sold during the current period, or in Servicing expense for any re-measurement of the liability related to loans sold in prior years.
Note 6: Derivative Instruments and Hedging Activities
Navy Federal’s risk management strategies include the use of derivatives as economic hedges and derivatives designated as qualifying accounting hedges. The goal of these strategies is to mitigate market risk so that movements in interest rates do not adversely affect the value of Navy Federal’s assets or liabilities, earnings or future cash flows. The fair value of derivative instruments in a gain or loss position, net of legally enforceable master netting agreements, are reported in Other assets and Other liabilities, respectively, on the Consolidated Statements of Financial Condition as of December 31, 2019 and 2018.
The following table presents the notional amount and fair value of derivative instruments on a gross basis:
(dollars in thousands)
December 31, 2019 December 31, 2018
Notional Amount
Derivatives at Fair Value Notional Amount
Derivatives at Fair Value Asset Liability Asset Liability
Derivatives not designated as accounting hedges: Interest rate lock commitments $ 981,751 $ 22,178 $ 162 $ 750,621 $ 19,937 $ 2 Forward sales contracts (1) 2,890,000 1,958 5,297 1,496,500 160 21,788
Total derivatives not designated as accounting hedges $ 3,871,751 $ 24,136 $ 5,459 $ 2,247,121 $ 20,097 $ 21,790 Derivatives designated as accounting hedges:
Interest rate contracts: Fair value interest rate contracts $ 10,000 $ 2 $ - $ 10,000 $ - $ 13 Cash flow interest rate contracts 2,950,000 2,335 - 2,950,000 - 11,227
Total derivatives designated as accounting hedges $ 2,960,000 $ 2,337 $ - $ 2,960,000 $ - $ 11,240 Total derivative instruments, gross $ 6,831,751 $ 26,473 $ 5,459 $ 5,207,121 $ 20,097 $ 33,030 Less: Legally enforceable master netting agreements (1,958) (1,958) (160) (160) Total derivative instruments, net $ 24,515 $ 3,501 $ 19,937 $ 32,870 (1) As of December 31, 2019, the notional amount related to forward contracts in assets and liabilities was $90.0 million and $3.0 billion, respectively. As of December 31, 2018, the notional amount related to forward contracts in assets and liabilities was $15.0 million and $1.5 billion, respectively.
NOTES TO CONSOLIDATED FINANCIAL STATEMENTS FOR THE YEARS ENDED DECEMBER 31, 2019 AND 2018

38 Navy Federal Credit Union • 2019 Annual Report
NOTES TO CONSOLIDATED FINANCIAL STATEMENTS FOR THE YEARS ENDED DECEMBER 31, 2019 AND 2018
Offsetting Derivative Financial Instruments
As discussed in Note 1: Summary of Significant Accounting Policies, some of Navy Federal’s derivative instruments are subject to legally enforceable master netting agreements, which allow Navy Federal to settle positive and negative positions held with the same counterparty on a net basis. As such, Navy Federal reports these positions on the Consolidated Statements of Financial Condition on a net basis.
The following tables present total gross derivative assets and liabilities at December 31, 2019 and 2018, which are adjusted to reflect the effects of legally enforceable master netting agreements. The following tables also include financial instruments or cash collateral related to legally enforceable master netting agreements that represent securities or cash collateral received or pledged with the same counterparty. These amounts are not offset on the Consolidated Statements of Financial Condition, but are shown as a reduction to total derivative assets and liabilities to derive net derivative assets and liabilities.
December 31, 2019
(dollars in thousands)
Gross Amounts
Recognized
Gross Amounts
Offset in Statement of
Financial Condition (1)
Net Amounts Presented in Statement of
Financial Condition
Gross Amounts Not Offset in Statement of Financial
Condition
Net Amount
Financial Instruments Collateral (2)
Cash Collateral (2)
Financial Assets Derivative instruments not subject to master netting agreements $ 22,178 $ - $ 22,178 $ - $ - $ 22,178
Derivative instruments subject to master netting agreements 4,295 (1,958) 2,337 - - 2,337
Total derivative assets $ 26,473 $ (1,958) $ 24,515 $ - $ - $ 24,515 Financial Liabilities
Derivative instruments not subject to master netting agreements $ (162) $ - $ (162) $ - $ - $ (162)
Derivative instruments subject to master netting agreements (5,297) 1,958 (3,339) 3,116 223 -
Total derivative liabilities (5,459) 1,958 (3,501) 3,116 223 (162) Total $ 21,014 $ - $ 21,014 $ 3,116 $ 223 $ 24,353
(1) Includes offset by same counterparty where legally enforceable under master netting agreements. (2) Amounts are limited to the derivative asset/liability balance and, accordingly, do not include excess collateral received/pledged.

Navy Federal Credit Union • 2019 Annual Report 39
NOTES TO CONSOLIDATED FINANCIAL STATEMENTS FOR THE YEARS ENDED DECEMBER 31, 2019 AND 2018
December 31, 2018
(dollars in thousands)
Gross Amounts
Recognized
Gross Amounts
Offset in Statement of
Financial Condition (1)
Net Amounts Presented in Statement of
Financial Condition
Gross Amounts Not Offset in Statement of Financial
Condition
Net Amount
Financial Instruments Collateral (2)
Cash Collateral (2)
Financial Assets Derivative instruments not subject to master netting agreements $ 19,937 $ - $ 19,937 $ - $ - $ 19,937
Derivative instruments subject to master netting agreements 160 (160) - - - -
Total derivative assets $ 20,097 $ (160) $ 19,937 $ - $ - $ 19,937 Financial Liabilities
Derivative instruments not subject to master netting agreements $ (2) $ - $ (2) $ - $ - $ (2)
Derivative instruments subject to master netting agreements (33,028) 160 (32,868) 11,240 19,216 (2,412)
Total derivative liabilities (33,030) 160 (32,870) 11,240 19,216 (2,414) Total $ (12,933) $ - $ (12,933) $ 11,240 $ 19,216 $ 17,523
(1) Includes offset by same counterparty where legally enforceable under master netting agreements. (2) Amounts are limited to the derivative asset/liability balance and, accordingly, do not include excess collateral received/pledged.
Derivatives Accounted For as Economic Hedges
Navy Federal is an active participant in the production of mortgage loans that are sold to investors in the secondary market. At origination, these loans are classified as MLAS on the Consolidated Statements of Financial Condition. Prior to origination, the corresponding IRLCs related to MLAS mortgage loans exposes Navy Federal to the risk of adverse changes in interest rates between the time of the loan commitment and the time Navy Federal funds the loan at origination. Navy Federal is also exposed to the risk of adverse changes in value after funding the loan up until the time when the loan is delivered to the investor. To offset this exposure, Navy Federal enters into forward sales contracts to deliver mortgage loans to investors at specified prices in the “To Be Announced” market (TBA securities). These forward sales contracts act as an economic hedge against the risk of changes in the value of both the IRLCs and the funded loans. Navy Federal accounts for these derivatives as economic hedges in accordance with ASC 815, Derivatives and Hedging.
The table below presents gains and losses resulting from derivatives accounted for as economic hedges for the years ended December 31:
(dollars in thousands)
Derivative Instruments Location of Gain/(Loss) Recognized in Earnings
2019 2018
Interest rate lock commitments Net gain on mortgage loans $ (2,080) $ 2,596 Forward sales contracts Net gain on mortgage loans $ (18,289) (18,764) Total $ (20,369) $ (16,168)
Derivatives Accounted For as Qualifying Accounting Hedges
Under the provisions of ASC 815, Derivatives and Hedging, derivative instruments may be designated as a qualifying fair value or cash flow hedge.
Fair Value Accounting Hedges
Navy Federal uses qualifying fair value hedges to protect certain fixed-rate investments against adverse changes in fair value attributable to changes in interest rates. For derivative instruments that are designated and qualify as a fair value hedge, the gain or loss on the derivative instrument and the gain or loss on the hedged item attributable to the hedged risk are recognized in current earnings. When interest rate fluctuations result in changes in the fair value of fixed-rate investments, the gains or losses on the derivative instruments are highly effective in offsetting the change in fair value.

40 Navy Federal Credit Union • 2019 Annual Report
NOTES TO CONSOLIDATED FINANCIAL STATEMENTS FOR THE YEARS ENDED DECEMBER 31, 2019 AND 2018
The table below summarizes recognized gains and losses related to derivatives designated as fair value hedges during the years ended December 31:
(dollars in thousands)
Changes in Fair Value Location of Changes in Fair Value
Recognized in Earnings
2019 2018
Interest rate swaps hedging fixed-rate investments Fee and other income $ (231) $ 116 Hedged fixed-rate investments attributable to risk being hedged Fee and other income 473 130
As of December 31, 2019, the following amounts were recorded on the Consolidated Statements of Financial Condition related to cumulative basis adjustments for fair value hedges: (dollars in thousands)
Line Item on Statements of Financial Condition Which Hedged Item is Included
Carrying Amount of Hedged Asset
Cumulative Fair Value Hedging Adjustments Included in Carrying
Amount of Hedged Asset
Available-for-sale debt securities $ 9,926 $ (19)
Cash Flow Accounting Hedges
Navy Federal funds a portion of its operations with variable rate debt obligations. Navy Federal uses pay-fixed interest rate swaps to hedge the variability in cash flows related to existing and anticipated replacement funding that reprices based on the London Inter-bank Offered Rate. For derivative instruments that are designated and qualify as cash flow hedges, the gain or loss on the derivative instrument is reported in AOCI and reclassified into earnings in the same period during which the hedged transaction affects earnings and is presented in the same Consolidated Statements of Income line item as the earnings effect of the hedged item.
The table below summarizes gains and losses on cash flow hedges for the years ended December 31:
(dollars in thousands)
2019 2018
Location of (Loss) Reclassified from AOCI into Earnings
2019 2018
(Loss) Recognized in AOCI
Amount of (Loss) Reclassified from AOCI into Earnings
Interest rate contracts $ (149,942) $ (21,654) Interest on borrowed funds $ (9,435) $ (8,554)
During the next 12 months, net losses in AOCI of approximately $29.8 million on derivative instruments that qualify as cash flow hedges are expected to be reclassified into earnings.
For open or future cash flow hedges, the maximum length of time over which forecasted transactions are or will be hedged is approximately 13 years.
Note 7: Commitments and Contingencies
Commitments
In the normal course of business, Navy Federal enters into conditional commitments to extend credit and makes financial guarantees to help meet the financing needs of its members. Unfunded loan commitments are amounts Navy Federal has agreed to lend to a member generally as long as the member remains in good standing on existing loans. Commitments generally have fixed expiration dates or other termination clauses. Navy Federal uses the same credit policies in making commitments as it does for all loans to members, and accordingly, at December 31, 2019 and 2018, the potential credit risk related to these commitments could be similar to existing loans, if these commitments became funded loans.

Navy Federal Credit Union • 2019 Annual Report 41
NOTES TO CONSOLIDATED FINANCIAL STATEMENTS FOR THE YEARS ENDED DECEMBER 31, 2019 AND 2018
Commitment balances as of December 31, 2019 and 2018 were as follows:
(dollars in thousands) 2019 2018 Credit cards $ 27,239,340 $ 22,703,476 Home equity lines of credit 1,560,282 1,407,564 Checking lines of credit 1,165,123 1,170,453 Pre-approved auto loans 578,220 569,186 Other 85,060 106,193 Total $ 30,628,025 $ 25,956,872
Contingencies
Navy Federal is party to various legal and regulatory actions normally associated with financial institutions, the aggregate effect of which, in the opinions of management and legal counsel, would not be material to Navy Federal's consolidated financial statements.
Note 8: Property, Plant and Equipment
The following is a summary of Navy Federal's property, plant and equipment as of December 31:
(dollars in thousands) 2019 2018 Land and buildings $ 1,881,083 $ 1,677,281 Equipment, furniture and fixtures 647,286 477,989 Computer software and capitalized IT assets 796,088 679,527 Leasehold improvements 184,026 169,618 Subtotal 3,508,483 3,004,415 Less: Accumulated depreciation/amortization (1,233,089) (1,074,248) Total $ 2,275,394 $ 1,930,167
Navy Federal has obligations under a number of non-cancelable operating leases. The future minimum payments under the terms of the leases as of December 31, 2019 were as follows:
(dollars in thousands) Amount 2020 $ 29,035 2021 26,336 2022 21,225 2023 17,053 2024 13,164 Thereafter 34,334 Total $ 141,147
Rent expense was $33.9 million and $30.5 million for the years ended December 31, 2019 and 2018, respectively, and is included in Office operations and equipment in the Consolidated Statements of Income.
Note 9: Goodwill
Navy Federal completed its annual impairment assessment as of September 30, 2019 and 2018 using a qualitative assessment and concluded there was no impairment. Navy Federal did not have any goodwill adjustment activities during the years ended December 31, 2019 and 2018.

42 Navy Federal Credit Union • 2019 Annual Report
NOTES TO CONSOLIDATED FINANCIAL STATEMENTS FOR THE YEARS ENDED DECEMBER 31, 2019 AND 2018
Note 10: Deposit Accounts
Navy Federal's deposit accounts consist of demand and time deposits. The aggregate amount of time deposits that meet or exceed the $250,000 NCUA insurance limit, which is reported at the members' applicable account ownership category, was $8.8 billion and $6.3 billion at December 31, 2019 and 2018, respectively.
As of December 31, 2019, scheduled maturities of time deposits for each of the next five years were as follows:
(dollars in thousands) Amount 2020 $ 18,575,618 2021 8,147,308 2022 2,478,092 2023 2,037,499 2024 3,495,344
Overdrafts on demand deposits of $83.7 million and $72.6 million at December 31, 2019 and 2018, respectively, have been reclassified to Loans to members on the Consolidated Statements of Financial Condition.
Interest rates on deposit accounts are set by the Board of Directors and are based on an evaluation of current and future market conditions. Interest on deposit accounts is based on available earnings for each interest period and is not guaranteed by Navy Federal. In claims against the assets of Navy Federal, such as in the event of its liquidation, amounts in deposit accounts that exceed the $250,000 NCUA insurance limit are subordinate to other liabilities of Navy Federal.
Note 11: Borrowed Funds
Navy Federal’s borrowings as of December 31, 2019 and 2018 were as follows:
December 31, 2019
(dollars in thousands) Amount
Outstanding Coupon Fixed/Float Payment Maturities FHLB borrowing $ 1,890,000 2.76% - 4.72% Fixed Monthly 2020 - 2037 FHLB borrowing 3,869,439 1.83% - 4.62% Fixed Quarterly 2020 - 2033 FHLB borrowing 4,500,000 1.74% - 2.08% Float Quarterly 2020 - 2022 Total FHLB borrowings $ 10,259,439
December 31, 2018
(dollars in thousands) Amount
Outstanding Coupon Fixed/Float Payment Maturities FHLB borrowing $ 500,000 2.31% Fixed At Maturity 2019 FHLB borrowing 2,688,800 2.41% - 4.72% Fixed Monthly 2019 - 2037 FHLB borrowing 4,419,439 1.01% - 4.62% Fixed Quarterly 2019 - 2036 FHLB borrowing 5,450,000 2.44% - 2.98% Float Quarterly 2019 - 2022 Total FHLB borrowings $ 13,058,239 Securities sold under repurchase agreements $ 50,000 1.88% Fixed Quarterly 2019
Securities sold under repurchase agreements 200,000 3.25% Float Quarterly 2019
Total securities sold under repurchase agreements $ 250,000 Total borrowed funds $ 13,308,239

Navy Federal Credit Union • 2019 Annual Report 43
NOTES TO CONSOLIDATED FINANCIAL STATEMENTS FOR THE YEARS ENDED DECEMBER 31, 2019 AND 2018
The following table displays the amount of borrowed funds by maturity for each of the next five years and thereafter as of December 31, 2019:
(dollars in thousands) Amount 2020 $ 4,414,439 2021 500,000 2022 565,000 2023 50,000 2024 500,000 Thereafter 4,230,000 Total $ 10,259,439
During 2019, Navy Federal prepaid $1.2 billion of its borrowings with the FHLB. In connection with this prepayment, Navy Federal incurred $26.9 million of debt extinguishment costs which is included in Other non-interest expense in the Consolidated Statements of Income. Navy Federal did not make any prepayment of its borrowings during the year ended December 31, 2018.
As of December 31, 2019, Navy Federal pledged $27.2 billion of consumer and credit card loans to the FRB as collateral for the ability to borrow up to $20.9 billion. As of December 31, 2019, Navy Federal pledged $30.6 billion in mortgage loans held for investment and $0.8 billion in investment securities to the FHLB as collateral for the ability to borrow up to $27.0 billion. As of December 31, 2018, Navy Federal pledged $26.9 billion of consumer and credit card loans to the FRB as collateral for the ability to borrow up to $20.7 billion. As of December 31, 2018, Navy Federal pledged $27.7 billion in mortgage loans and $0.9 billion in investment securities to the FHLB as collateral for the ability to borrow up to $23.7 billion.
Navy Federal had the following unused lines of credit as of December 31:
(dollars in thousands) 2019 2018 Federal Reserve Bank $ 20,997,758 $ 20,726,595 FHLB 16,539,321 10,528,967 Fed Funds 250,000 272,500 Total $ 37,787,079 $ 31,528,062
Note 12: Retirement Benefit Plans
Navy Federal Credit Union Employees’ Retirement Plan
Navy Federal Credit Union Employees’ Retirement Plan (the Plan) is a defined benefit retirement plan with benefits based on set formulas. Navy Federal transitioned to a Cash Balance design as of January 1, 2001, but retained the Traditional design for those employees who opted to remain under the Traditional formula. The following describes how the benefits are calculated:
• Cash Balance – This design provides either a single sum payment upon retirement or a monthly annuity. The annuity option is available for each Cash Balance Plan participant who has a benefit value of more than $5,000.
• Traditional – This design provides a lifetime of monthly retirement benefits, determined by a set formula. The formula is based on the final average earnings (an average of the three highest consecutive years of income) multiplied by 2%, times the length of employee service.
Retiree Medical Plan
Navy Federal provides to employees hired prior to January 1, 2009, postretirement benefits to offset the cost of medical insurance premiums or out-of-pocket medical expenses. The plan provides a lump sum, notionally credited, to a health reimbursement account equal to $75 or $100 (depending on the retiree’s age on September 1, 2008), multiplied by the number of years of continuous service the retiree provided to Navy Federal, multiplied by a lump sum factor.

44 Navy Federal Credit Union • 2019 Annual Report
NOTES TO CONSOLIDATED FINANCIAL STATEMENTS FOR THE YEARS ENDED DECEMBER 31, 2019 AND 2018
The pension assets are recognized in Other assets and the retiree medical plan liabilities are recognized in Other liabilities on the Consolidated Statements of Financial Condition. The following table provides key balances and transaction amounts of the pension and retiree medical plans as of and for the year ended December 31:
(dollars in thousands) Pension Retiree Medical
2019 2018 2019 2018 Accumulated benefit obligation at year end $ 1,313,775 $ 1,114,899 N/A N/A Projected benefit obligation at year end 1,467,650 1,238,325 66,246 57,097 Fair value of plan assets at year end 1,682,982 1,406,909 - -Over/(under) funded 215,332 168,584 (66,246) (57,097) Employer contributions 25,000 25,000 2,985 2,684 Plan participants' contributions - - 184 141 Benefits paid (53,725) (47,123) (3,169) (2,824) Net periodic benefit cost 21,653 2,547 4,625 4,989
Navy Federal reports service cost and other components of net periodic benefit cost in Salaries and employee benefits in the Consolidated Statements of Income. The weighted-average assumptions used to determine the projected benefit obligation and net periodic benefit costs for the pension and retiree medical benefit plans for the years ended December 31 were as follows:
Pension Retiree Medical 2019 2018 2019 2018
Discount rate Projected benefit obligation 3.35% 4.35% 3.35% 4.35% Net periodic benefit cost 4.35% 3.70% 4.35% 3.70%
Rate of compensation increase 4.43% 4.42% N/A N/A Expected long-term rate of return 7.00% 6.50% N/A N/A
The long-term rate of return assumption represents the expected average rate to be earned on plan assets and future plan contributions to meet benefit obligations. The assumption is based on several factors, including the anticipated long-term asset allocation of plan assets, historical market index and plan returns and a forecast of future expected asset returns.
The amounts in AOCI that have not yet been recognized as components of net periodic benefit cost as of December 31 are:
(dollars in thousands) Pension Retiree Medical
2019 2018 2019 2018 Accumulated other comprehensive loss
Net prior service cost $ 21,805 $ 27,090 $ 831 $ 1,070 Net loss 221,658 259,774 16,468 8,718
Accumulated other comprehensive loss $ 243,463 $ 286,864 $ 17,299 $ 9,788
The amounts recognized in AOCI for the years ended December 31, 2019 and 2018 consist of:
(dollars in thousands) Pension Retiree Medical
2019 2018 2019 2018 Amounts amortized during the year
Net prior service cost $ (5,284) $ (5,284) $ (239) $ (239) Net loss (14,331) (3,324) (253) (617)
Amounts arising during the year Net prior service cost - - - -Net (gain)/loss (23,786) 93,816 8,003 (3,328)
Total recognized in other comprehensive (income)/loss $ (43,401) $ 85,208 $ 7,511 $ (4,184)

Navy Federal Credit Union • 2019 Annual Report 45
NOTES TO CONSOLIDATED FINANCIAL STATEMENTS FOR THE YEARS ENDED DECEMBER 31, 2019 AND 2018
The amounts in AOCI expected to be recognized as components of net periodic benefit cost in 2020 are as follows:
(dollars in thousands) Pension Retiree Medical Net loss $ 5,079 $ 853 Prior service cost 4,171 239 Total expected amortization $ 9,250 $ 1,092
The following table discloses the benefits expected to be paid in the next 10 years:
(dollars in thousands) Pension Retiree Medical 2020 $ 66,484 $ 3,128 2021 70,459 3,176 2022 74,697 3,226 2023 79,119 3,289 2024 82,752 3,342 2025-2029 465,976 17,597
The anticipated employer contribution for 2020 is $25.0 million for the pension plan and $3.1million for the retiree medical benefit plan. The measurement date for the pension and retiree medical benefit plan for 2019 and 2018 was December 31.
The investment strategy of the Plan is to employ an investment approach, whereby a mix of equity and fixed-income investments are used to maximize the long-term return of plan assets at a prudent level of risk that includes consideration of benefit obligation volatility. The intent of this strategy is to keep the Plan well-funded over the long run. Risk tolerance is established through careful consideration of plan liabilities and plan-funded status. Investment risk is measured and monitored on an ongoing basis through annual liability measurements, periodic asset/liability studies and regular investment portfolio reviews.
As of December 31, 2019, the target allocation of plan assets was 25% U.S. equity securities, 40% global equity securities and 35% fixed-income securities. Most of the U.S. equity assets are invested in a large company index fund and in defensive equity funds with the balance in small- and mid-sized company equity securities. Most of the global equity allocation is in developed markets around the world, with the balance in emerging markets. The fixed-income allocation is comprised of a small allocation to cash to provide liquidity for benefit and expense payments, with the balance invested in intermediate and long-term bonds, the majority of which are investment-grade.
The tables below present the Plan's assets within the fair value hierarchy as described in Note 1: Summary of Significant Accounting Policies as of December 31:
December 31, 2019 (dollars in thousands) Asset Category Level 1 Level 2 Level 3 Total U.S. equity securities $ 85,398 $ - $ - $ 85,398 Global equity securities 679,208 - - 679,208 Fixed-income securities 319,839 186,213 - 506,052 Cash and cash equivalents 25,419 - - 25,419
Total assets in the fair value hierarchy $ 1,109,864 $ 186,213 $ - $ 1,296,077 Investments measured at net asset value: 386,906 Total investments $ 1,682,983
December 31, 2018 (dollars in thousands) Asset Category Level 1 Level 2 Level 3 Total U.S. equity securities $ 62,850 $ - $ - $ 62,850 Global equity securities 547,675 - - 547,675 Fixed-income securities 275,224 136,181 - 411,405 Cash and cash equivalents 23,673 - - 23,673
Total assets in the fair value hierarchy $ 909,422 $ 136,181 $ - $ 1,045,603 Investments measured at net asset value: 361,306 Total investments $ 1,406,909
46 Navy Federal Credit Union • 2019 Annual Report
NOTES TO CONSOLIDATED FINANCIAL STATEMENTS FOR THE YEARS ENDED DECEMBER 31, 2019 AND 2018
The following is a description of the valuation methodologies used to value fixed income securities that are classified within Level 2 of the fair value hierarchy. Municipal bonds, corporate bonds and corporate notes are valued based on yields currently available on comparable securities of issuers with similar credit ratings. Asset-backed securities are priced based on specific characteristics of the security, prepayment speeds, underlying collateral, and cash flows. Non-agency collateralized mortgage obligation securities are based on specific characteristics of the security, prepayment speeds, underlying collateral and cash flows.
Certain investments are measured at net asset value (NAV) per share, or its equivalent, as a practical expedient and therefore are not classified within the fair value hierarchy. These investments are valued at NAV, which is calculated based on the underlying investments and is provided by the respective investment managers as a practical expedient to estimate fair values. Most of the underlying investments are traded in markets that are considered to be active. For those underlying investments that are not considered to be actively traded, the fair values are based on quoted market prices of similar assets, dealer quotations, or valuations from pricing sources supported by observable inputs.
The preceding methods may produce a fair value calculation that may not be indicative of net realized value or reflective of future fair values. Although Navy Federal believes its valuation methods are appropriate and consistent with other market participants, the use of different methodologies or assumptions to determine the fair value of certain financial instruments could result in a different fair value measurement at the reporting date.
Interest in the investments measured at NAV can be purchased or redeemed at specified times during the month with advance notice of two to five days. For one investment, settlement of redemptions of more than $1.0 million will occur 10 business days following the trade date. There were no other significant redemption terms or conditions for the other investments measured at NAV.
Navy Federal 401(k) Savings Plan
The Navy Federal 401(k) savings plan is a defined contribution plan where employees can contribute up to the statutory limits to a 401(k) retirement account and receive employer matching contributions. The matching contribution percentage is based on the formula the employee receives in the defined benefit retirement plan. Employees eligible for the Cash Balance benefit receive a 100% employer match on the first 7% of pay they contribute to their 401(k) account up to IRS limits and are vested after completing two years of service. The employees eligible for the Traditional benefit receive an employer match of 50% on the first 7% of pay they contribute to their 401(k) account up to IRS limits.
The expense recognized for the 401(k) Plan, including matching contributions and administrative costs, was $68.1 million and $58.7 million for the years ended December 31, 2019 and 2018, respectively.
Deferred Compensation Plan
The Navy Federal 457(b) deferred compensation plan is a non-qualified plan that offers a before-tax savings opportunity to highly compensated employees. The annual deferral amount allowed mirrors the 401(k) Plan limits, and contributions held by Navy Federal earn monthly interest based on Navy Federal’s monthly gross income divided by average earning assets (loans and investments).
Non-Qualified Supplemental Retirement Plans
The non-qualified supplemental retirement plans are primarily designed to “make up” for benefits not paid through the qualified retirement plans as a result of IRS limitations. Internal Revenue Code Section 401(a)(17) limits the amount of compensation that can be used in a qualified retirement plan calculation, and Internal Revenue Code Section 415 limits the amount of monthly annuity that can be paid from a defined benefit plan.
All benefits are paid from Navy Federal's assets and are in compliance with all federal laws and regulations. As of December 31, 2019 and 2018, total liability related to these plans was $8.1 million and $9.4 million, respectively.

Navy Federal Credit Union • 2019 Annual Report 47
NOTES TO CONSOLIDATED FINANCIAL STATEMENTS FOR THE YEARS ENDED DECEMBER 31, 2019 AND 2018
Note 13: Related Party Transactions
In the normal course of business, Navy Federal extends loans to and receives deposits from credit union officials. Credit union officials are defined as volunteer members of the Board of Directors and board committees, and employees with the title of Vice President and above. The total outstanding loan balances extended to credit union officials as of December 31, 2019 and 2018 were $52.0 million and $43.7 million, respectively. Total deposit balances of credit union officials as of December 31, 2019 and 2018 were $27.5 million and $26.0 million, respectively. Loans to credit union officials are made under similar terms as loans entered into by all members. Deposit accounts held by credit union officials earn interest at the same rates provided to all other members.
Note 14: Accumulated Other Comprehensive Income/(Loss)
Details of AOCI as of and for the years ending December 31 were as follows:
December 31, 2019
(dollars in thousands)
Unrecognized Net Pension and Postretirement
Amounts
Unrealized Net Gain/(Losses) on Available-for-
Sale Debt Securities
Unrealized Net Gains/(Losses)
on Cash Flow Derivatives Total
Balance, beginning of year $ (296,652) $ (417,842) $ (30,365) $ (744,859) OCI before reclassifications 15,782 804,831 (149,942) 670,671 Amounts reclassified from AOCI to:
Salaries and employee benefits 20,108 - - 20,108 Net (gain)/loss on investments - (11,276) - (11,276) Interest on borrowed funds - - 9,435 9,435
Net change in AOCI 35,890 793,555 (140,507) 688,938 Balance, end of year $ (260,762) $ 375,713 $ (170,872) $ (55,921)
December 31, 2018
(dollars in thousands)
Unrecognized Net Pension and Postretirement
Amounts
Unrealized Net Losses on
Available-for-Sale Debt Securities
Net Gains/(Losses) on Cash Flow Derivatives Total
Balance, beginning of year $ (215,628) $ (87,639) $ (17,261) $ (320,528) Cumulative effects from adoption of new accounting standards - (38,372) (4) (38,376) OCI before reclassifications (90,489) (286,484) (21,654) (398,627) Amounts reclassified from AOCI to:
Salaries and employee benefits 9,465 - - 9,465 Net (gain)/loss on investments - (5,347) - (5,347) Interest on borrowed funds - - 8,554 8,554
Net change in AOCI (81,024) (330,203) (13,104) (424,331) Balance, end of year $ (296,652) $ (417,842) $ (30,365) $ (744,859)
Note 15: Regulatory Matters
Navy Federal is subject to regulatory capital requirements administered by the NCUA. Failure to meet minimum capital requirements can initiate certain mandatory and possible additional discretionary actions by regulators that, if undertaken, could have a direct material effect on Navy Federal’s consolidated financial statements. Under capital adequacy regulations and the regulatory framework for prompt corrective action, Navy Federal must meet specific capital requirements that involve quantitative measures of Navy Federal’s assets, liabilities and certain commitments as calculated under GAAP. Navy Federal’s capital amounts and net worth classification are also subject to qualitative judgments by its regulators about components, risk weightings and other factors.

48 Navy Federal Credit Union • 2019 Annual Report
NOTES TO CONSOLIDATED FINANCIAL STATEMENTS FOR THE YEARS ENDED DECEMBER 31, 2019 AND 2018
Quantitative capital adequacy regulations require Navy Federal to maintain minimum capital balances and ratios of net worth to total assets. Credit unions are also required to calculate a risk-based net worth (RBNW) that establishes whether the credit union will be considered “complex” under the regulatory framework. A credit union is defined as “complex” if the credit union’s quarter-end total assets exceed $50.0 million and its RBNW requirement exceeds 6%. Navy Federal’s RBNW requirement as of December 31, 2019 and 2018 was 6.08% and 6.37%, respectively. Based on the RBNW requirement, Navy Federal is considered "complex" as of December 31, 2019. There is no impact to Navy Federal based on the complex designation because its statutory net worth ratio qualifies Navy Federal as "well capitalized" by NCUA standards. Navy Federal is categorized as “well capitalized” under the NCUA regulatory framework for prompt corrective action as a result of a net worth-to-assets ratio of 12.34% and 12.53% as of December 31, 2019 and 2018, respectively. To be categorized as “well capitalized,” Navy Federal must maintain a minimum net worth ratio of 7%. The components of Navy Federal’s capital are stable, and the occurrence of factors that could significantly affect capital adequacy is considered to be remote as they are limited to extraordinary regulatory or economic events. There are no conditions or events that have occurred since December 31, 2019 that management believes would have changed Navy Federal’s categorization.
The FRB requires Navy Federal to maintain a minimum average reserve balance during a 14-day maintenance period. As of December 31, 2019 and 2018, Navy Federal met the reserve requirement set by the FRB.
Note 16: Fair Value Measurement
Navy Federal measures certain financial assets and liabilities at fair value in accordance with ASC 820, Fair Value Measurement, through various valuation approaches as described in Note 1: Summary of Significant Accounting Policies. Management has not made significant changes in the valuation techniques and parameters used for the fair value measurement of its financial assets and liabilities during the years ended December 31, 2019 and 2018.
Financial Assets and Liabilities Accounted For at Fair Value on a Recurring Basis
The following are the valuation methodologies and inputs used by Navy Federal in estimating the fair value of assets and liabilities measured on a recurring basis and classified as Level 2 and Level 3 in the fair value hierarchy.
Available-for-Sale Debt Securities
Navy Federal receives pricing for AFS debt securities from a third-party pricing service provider. Below includes the valuation methodologies used for AFS debt securities classified as Level 2 in the fair value hierarchy.
• U.S. Government and Federal Agency Securities, Bank Notes and Corporate Bonds, Municipal Securities and Non-U.S. Government Securities – These financial instruments are valued based on similar assets in the marketplace or derived from model-based valuation techniques for which all significant assumptions are observable.
• Residential and Commercial Mortgage-Backed Securities – These financial instruments include agency and non-agency securities, and are valued based on similar assets in the marketplace and the vintage of the underlying collateral.
Mortgage Loans Awaiting Sale
Navy Federal elects the fair value option for MLAS at origination or when a firm sale commitment is executed for loans that had been previously classified as held for investment. The fair value of MLAS is determined based on an evaluation of best execution forward sales contract prices sourced from the TBA market by agency. As such, MLAS are classified as Level 2 in the fair value hierarchy.
Mortgage Servicing Rights
MSR assets do not trade in an active, open market with readily observable prices. The fair value of MSR is determined by discounting projected net servicing cash flows. Actual and expected loan prepayment rate, discount rate, servicing costs and other economic factors are all considered in measuring the MSR fair value. The valuation model and underlying assumptions are corroborated by values received from independent third parties and through comparisons to market transactions. The fair value of Navy Federal's MSR portfolio is primarily affected by changes in mortgage interest rates resulting in loan prepayment acceleration factors to increase or

Navy Federal Credit Union • 2019 Annual Report 49
NOTES TO CONSOLIDATED FINANCIAL STATEMENTS FOR THE YEARS ENDED DECEMBER 31, 2019 AND 2018
decrease. As the MSR valuation is based on unobservable inputs, MSR assets are classified as Level 3 in the fair value hierarchy.
Derivative Assets and Liabilities
Fair values of interest rate swaps designated as cash flow and fair value hedges are determined based on third-party models that calculate the net present value of future cash flows discounted using the OIS rate. Counterparty non-performance risk is considered by discounting future cash flows using the OIS rates adjusted for credit quality. As the inputs utilized in the valuation are observable in the market, interest rate swaps are classified as Level 2 in the fair value hierarchy.
Fair values of forward sales contracts on TBA securities are determined based on an evaluation of best execution forward contract prices sourced from the TBA market, by agency. As such, forward sales contracts are classified as Level 2 in the fair value hierarchy.
Fair values of IRLCs are determined based on an evaluation of best execution forward contract prices sourced from the TBA market, adjusted by a factor that represents the probability it will settle and become a MLAS. As there are significant unobservable inputs in the fair value measurement, IRLCs are classified as Level 3 in the fair value hierarchy.
The tables below present certain information regarding assets and liabilities measured at fair value on a recurring basis on the Consolidated Statements of Financial Condition as of December 31:
December 31, 2019
(dollars in thousands) Level 1 Level 2 Level 3 Netting
Adjustments (1) Total Available-for-sale debt securities
U.S. government and federal agency securities $ - $ 7,268,442 $ - $ - $ 7,268,442 Residential mortgage-backed securities - 6,942,027 - - 6,942,027 Commercial mortgage-backed securities - 486,084 - - 486,084 Bank notes and corporate bonds - 3,499,082 - - 3,499,082 Municipal securities - 337,579 - - 337,579 Non-U.S. government securities - 239,620 - - 239,620
Total available-for-sale debt securities - 18,772,834 - - 18,772,834 Mortgage loans awaiting sale - 2,477,253 - - 2,477,253 Mortgage servicing rights - - 505,298 - 505,298 Derivatives (2) - 4,295 22,178 (1,958) 24,515 Total assets at fair value on a recurring basis $ - $ 21,254,382 $ 527,476 $ (1,958) $ 21,779,900 Derivatives (2) $ - $ 5,297 $ 162 $ (1,958) $ 3,501 Total liabilities at fair value on a recurring basis $ - $ 5,297 $ 162 $ (1,958) $ 3,501 (1) Amounts represent the impact of legally enforceable master netting agreements with the same counterparties. (2) Derivative assets are included in Other assets and derivative liabilities are included in Other liabilities on the Consolidated Statements of Financial Condition.

50 Navy Federal Credit Union • 2019 Annual Report
NAVY FEDERAL CREDIT UNION NOTES TO CONSOLIDATED FINANCIAL STATEMENTS
FOR THE YEARS ENDED DECEMBER 31, 2019 AND 2018
55
December 31, 2018
(dollars in thousands) Level 1 Level 2 Level 3 Netting
Adjustments (1) Total Available-for-sale debt securities
U.S. government and federal agency securities $ - $ 6,044,871 $ - $ - $ 6,044,871 Residential mortgage-backed securities - 6,539,075 - - 6,539,075 Commercial mortgage-backed securities - 461,747 - - 461,747 Bank notes and corporate bonds - 3,085,806 - - 3,085,806 Municipal securities - 244,594 - - 244,594 Non-U.S. government securities - 198,723 - - 198,723
Total available-for-sale debt securities - 16,574,816 - - 16,574,816 Equity securities 194,426 - - - 194,426 Mortgage loans awaiting sale - 1,193,288 - - 1,193,288 Mortgage servicing rights - - 479,638 - 479,638 Derivatives (2) - 160 19,937 (160) 19,937 Total assets at fair value on a recurring basis $ 194,426 $ 17,768,264 $ 499,575 $ (160) $ 18,462,105 Derivatives (2) $ - $ 33,028 $ 2 $ (160) $ 32,870 Total liabilities at fair value on a recurring basis $ - $ 33,028 $ 2 $ (160) $ 32,870 (1) Amounts represent the impact of legally enforceable master netting agreements with the same counterparties. (2) Derivative assets are included in Other assets and derivative liabilities are included in Other liabilities on the Consolidated Statements of Financial Condition.
The following tables summarize the changes in fair value for items measured as Level 3 in the fair value hierarchy on a recurring basis during 2019 and 2018:
2019 (dollars in thousands) Mortgage Servicing Rights Derivatives, Net Balance, beginning of year $ 479,638 $ 19,935
Realized/unrealized (losses)/gains included in earnings (52,395) 43,672 Issuances/purchases 139,981 282,463 Settlements/sales (61,926) (324,055)
Balance, end of year $ 505,298 $ 22,015
2018 (dollars in thousands) Mortgage Servicing Rights Derivatives, Net Balance, beginning of year $ 392,533 $ 17,339
Realized/unrealized gains included in earnings 2,026 10,196 Issuances/purchases 134,014 174,258 Settlements/sales (48,935) (181,858)
Balance, end of year $ 479,638 $ 19,935
Net unrealized losses related to MSR assets still held at December 31, 2019 and 2018 were $61.9 million and $13.8 million, respectively which were recognized in Other non-interest expense in the Consolidated Statements of Income. Net unrealized gains on IRLC derivative instruments still held at December 31, 2019 and 2018 were $22.0 million and $19.9 million, respectively, which were recognized in Net gain on mortgage loans in the Consolidated Statements of Income.
Transfers into or out of Level 3 are made if the significant inputs used in the pricing models measuring the fair values of the assets and liabilities become unobservable or observable, respectively. Transfers are considered to be effective as of the end of the reporting period. There were no transfers into or out of Level 3 for the years ended December 31, 2019 and 2018.

Navy Federal Credit Union • 2019 Annual Report 51
NOTES TO CONSOLIDATED FINANCIAL STATEMENTS FOR THE YEARS ENDED DECEMBER 31, 2019 AND 2018
Note 17: Subsequent Events
Navy Federal evaluated subsequent events through March 20, 2020, the date these financial statements were issued, and concluded that no subsequent events existed that are material to the consolidated financial statements.
The recent outbreak of the coronavirus has spread across the world, causing disruption to financial markets and overall economic conditions. The effects of the virus are rapidly evolving and, while Navy Federal is taking active risk mitigation efforts, the full impact and duration of the emergency is uncertain and the financial condition and results of operations could be adversely affected.

52 Navy Federal Credit Union • 2019 Annual Report
1Message and data rates may apply. Visit navyfederal.org for more information. 2Forrester Research does not endorse any company included in any CX Index™ report and does not advise any person to select the products or services of any particular company based on the ratings included in such reports.

This page has been intentionally left blank.

P.O. Box 3000, Merrifield, VA 22119 -3000 • navyfederal.org Navy Federal Credit Union is federally insured by NCUA. © 2020 Navy Federal NFCU 8010 (7 -20)