naxs nordic access buyout fund ab (publ) interim report january-june 2015 … · 2015-07-16 ·...
TRANSCRIPT

Interim Repor Jan-June, 2015 Page 1 of 18
NAXS Nordic Access Buyout Fund AB (publ) Interim Report January-June 2015
First half-year 2015
x Net profit/loss for the first half-year amounted to MSEK 58.4 (44.7). x Earnings per share amounted to SEK 3.92 (3.00). x Net asset value amounted to MSEK 774 (SEK 52.06 per share) at June 30, 2015,
compared to MSEK 751 (SEK 50.53 per share) at year-end 2014. x Net cash amounted to MSEK 249 (SEK 16.74 per share) at June 30, 2015, compared to
MSEK 167 (SEK 11.26 per share) at year-end 2014.
Second quarter 2015
x Net profit/loss for the quarter amounted to MSEK 34.6 (10.9). x Earnings per share amounted to SEK 2.33 (0.73). x NAXS paid a dividend of SEK 2.30 per share for the fiscal year 2014.
Comments by the CEO
NAXS continued to deliver a steady performance during the first half-year 2015, with the net asset value per share increasing by 7.6% during the period and by 21.2% over 12 months (including the dividend paid).
The highlight of the reporting period was the payment in June of a dividend of SEK 2.30 per share for FY 2014, representing 4.6% of the net asset value per share at December 31, 2014. This also represents an increase of 15% in comparison to the dividend paid for FY 2013.
Divestment activity was high in NAXS’ portfolio during the second quarter, with 3 full exits and a number of partial exits (including 2 initial public offerings), while 1 new acquisition was made, bringing the total number of portfolio companies acquired by NAXS’ underlying funds since inception to 107.
Lennart Svantesson

Interim Repor Jan-June, 2015 Page 2 of 18
Financial summary
2015 1/1–6/30
2014 1/1–6/30
2015 4/1–6/30
2014 4/1–6/30
Net profit/loss for the period, KSEK 58 362 44 656 34 585 10 876 2015
06/30 2014 12/31
Private equity fund investments, KSEK 525 691 587 105 Private equity fund investments in % of equity 68 78 Remaining commitments, KSEK 123 102
137 019 Total exposure to private equity fund investments, KSEK 658 049 724 124 Net cash, KSEK 248 866 167 447 Private equity fund investments per share, SEK 35.35 39.48 Net cash per share, SEK 16.74 11.26 Net asset value per share, SEK 52.06 50.53 Share price, SEK 49.50 49.90

Interim Report Jan-June, 2015
Page 3 of 18
Operations
NAXS Nordic Access Buyout Fund AB (publ) (“NAXS” or the “Company”) is an investment company listed on the NASDAQ OMX Stockholm exchange and focusing on investments in Nordic buyout funds. The objective is to make the Nordic private equity market accessible for a broader range of investors, while offering liquidity through the Company’s publicly traded shares. Operations commenced on April 17, 2007, and the Company was listed on First North on May 14, 2007, where it traded until its change of listing to NASDAQ Stockholm on June 8, 2010. NAXS is the Group’s parent company and is headquartered in Stockholm. In addition to the parent company, the Group consists of an operational Danish subsidiary, NAXS Nordic Access Buyout A/S, headquartered in Copenhagen, and a Norwegian subsidiary, NAXS Nordic Access Buyout AS, headquartered in Oslo. The Danish subsidiary operates as the holding company for the Group’s private equity fund investments. Naccess Partners AB has been contracted as the investment advisor to the Danish subsidiary.
Market review A number of monetary and political factors contributed to an increase in volatility in the European financial markets during the second quarter of 2015. Private equity activity nevertheless remained at a good level, with an emphasis on divestment activities and in particular on initial public offerings, echoing the trends seen in the first quarter of the year.
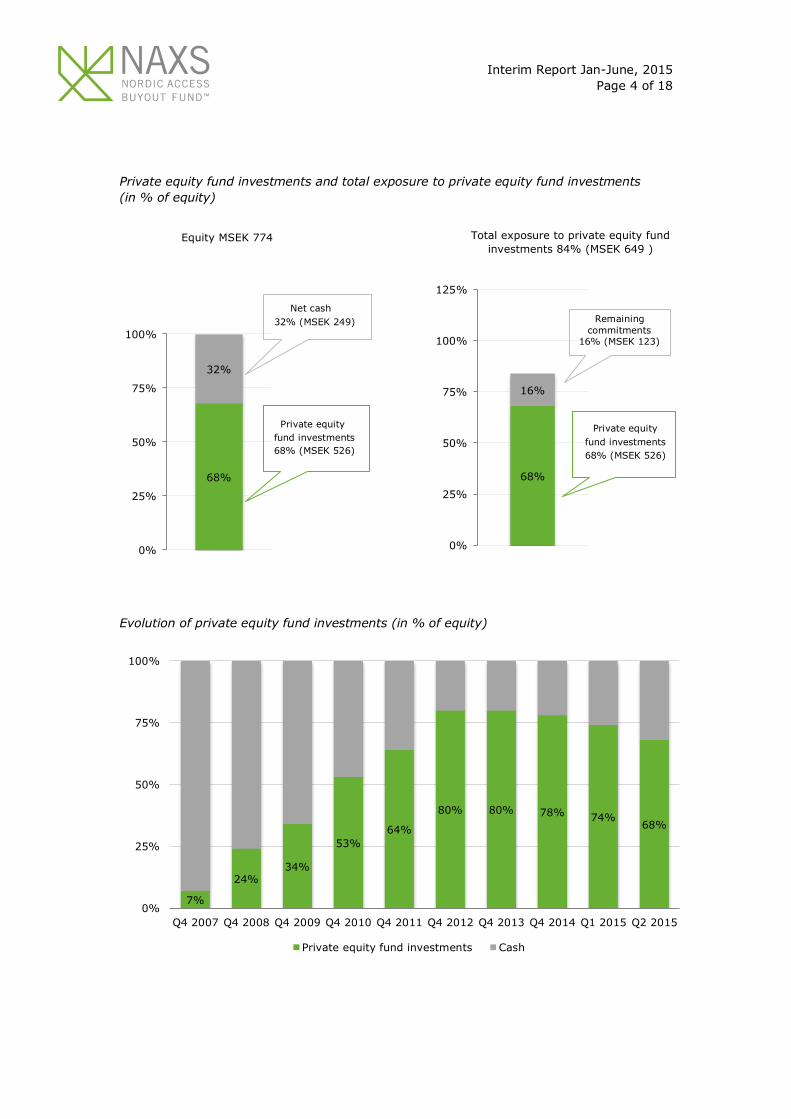
Fund portfolio As of June 30, 2015, NAXS had commitments to 8 underlying funds. At the end of the reporting first quarter:
x private equity fund investments amounted to MSEK 526, which corresponds to 68 percent of the Company’s equity;;
x remaining commitments amounted to MSEK 123, which can be used by the underlying funds for new investments;
x total exposure to private equity fund investments amounted to MSEK 649, which corresponds to 84 percent of the Company’s equity.
Interim Report Jan-June, 2015
Page 4 of 18
Private equity fund investments and total exposure to private equity fund investments (in % of equity) Evolution of private equity fund investments (in % of equity)
7%
24% 34%
53% 64%
80% 80% 78% 74% 68%
0%
25%
50%
75%
100%
Q4 2007 Q4 2008 Q4 2009 Q4 2010 Q4 2011 Q4 2012 Q4 2013 Q4 2014 Q1 2015 Q2 2015
Private equity fund investments Cash
68%
16%
0%
25%
50%
75%
100%
125%
68%
32%
0%
25%
50%
75%
100%
Total exposure to private equity fund investments 84% (MSEK 649 )
Equity MSEK 774
Remaining commitments
16% (MSEK 123)
Net cash 32% (MSEK 249)
Private equity fund investments 68% (MSEK 526)
Private equity fund investments 68% (MSEK 526)

Interim Report Jan-June, 2015
Page 5 of 18
The net asset value (NAV) per share increased by 7.6 % during the first half-year 2015 and by 21.2 % over 12 months (including the dividend paid).
NAV per share in SEK
Acquisitions and liquidity events Acquisitions As part of the transaction related to the divestment of its portfolio company Animagi, Intera Fund II made an investment in Evidensia, the leading veterinary clinic chain in the Nordic region, controlled by EQT.
Portfolio Company Sector Country Fund Evidensia Veterinary clinics Nordic region Intera II In addition, several add-ons acquisitions were made during the quarter. Liquidity events 3 full exits were announced during the quarter:
x FSN Capital III signed an agreement for the divestment of HusCompagniet, a Danish pre-fabricated house retailer;
x Herkules Private Equity III signed an agreement for the divestment of Espresso House, the largest coffee chain in the Nordic region;
x Intera II exited Animagi, Finland’s leading veterinary clinics chain.
37,51
40,83
43,92 46,09
44,86
48,85 50,53
51,94 52,06
0,4
0,4
0,4 0,4
0,4
0,4 0,4 0,4
0,5
0,5 0,5
0,5
0,5 0,5 0,5
2
2
2 2 2
2,3
35
40
45
50
55
60
Q4 2011 Q4 2012 Q4 2013 Q1 2014 Q2 2014 Q3 2014 Q4 2014 Q1 2015 Q2 2015
NAV Dividend paid 2012 Dividend paid 2013 Dividend paid 2014 Dividend paid 2015

Interim Report Jan-June, 2015
Page 6 of 18
Portfolio Company Sector Year of initial investment Fund
HusCompagniet Building & Construction 2011 FSN III
Espresso House Retail & Consumer 2012 Herkules III
Animagi Veterinary clinics 2012 Intera II
A number of partial exits were also announced during the quarter:
x Europris, a discount retailer owned by Nordic Capital Fund VII, was listed on the Oslo stock exchange;
x Apax Europe VII listed Sophos Group, a IT security provider, on the London Stock Exchange;
x Nordic Capital Fund VII signed an agreement for the divestment of Brink, a spin-off from the Thule Group;
x Apax Europe VII and Intera II each completed the refinancing of a respective portfolio company acquired in 2011.
As of June 30, 2015, NAXS underlying funds had acquired a total of 107 companies, 31 of which had been fully divested. These 31 exits have generated an average gross IRR of 24%. No. of portfolio companies acquired per year (exited companies in grey)
2007
2008
2009
2010
2011
2012
2013 2014 2015 Total No of new portfolio companies
12 16 12 18 16 15 9 7 2 107
No of exits during the year 4 4 11 9 3 31
No of companies acquired in the year that are now fully exited
7 9 4 5 3 3
31
5 7 8
13 13 12 9
7
2
7
9 4
5 3
3
02468
101214161820
2007 2008 2009 2010 2011 2012 2013 2014 2015
x 107 portfolio companies acquired since inception; x 31 companies fully exited; x Average holding period of the remaining 76 portfolio companies is approx. 3.75 years.
Interim Report Jan-June, 2015
Page 7 of 18
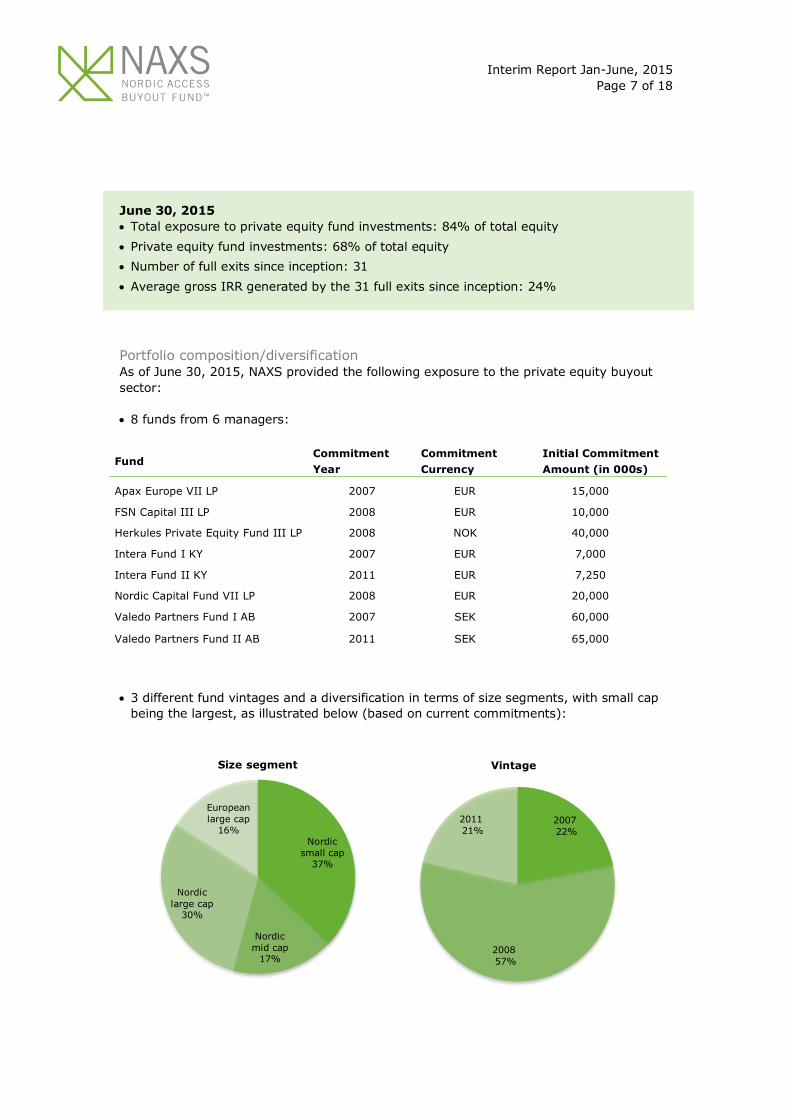
June 30, 2015 x Total exposure to private equity fund investments: 84% of total equity x Private equity fund investments: 68% of total equity x Number of full exits since inception: 31 x Average gross IRR generated by the 31 full exits since inception: 24%
Portfolio composition/diversification As of June 30, 2015, NAXS provided the following exposure to the private equity buyout sector: x 8 funds from 6 managers:
Fund Commitment Year
Commitment Currency
Initial Commitment Amount (in 000s)
Apax Europe VII LP 2007 EUR 15,000
FSN Capital III LP 2008 EUR 10,000
Herkules Private Equity Fund III LP 2008 NOK 40,000
Intera Fund I KY 2007 EUR 7,000
Intera Fund II KY 2011 EUR 7,250
Nordic Capital Fund VII LP 2008 EUR 20,000
Valedo Partners Fund I AB 2007 SEK 60,000
Valedo Partners Fund II AB 2011 SEK 65,000 x 3 different fund vintages and a diversification in terms of size segments, with small cap
being the largest, as illustrated below (based on current commitments):
Nordic small cap
37%
Nordic mid cap
17%
Nordic large cap
30%
European large cap
16%
Size segment
2007 22%
2008 57%
2011 21%
Vintage
Interim Report Jan-June, 2015
Page 8 of 18
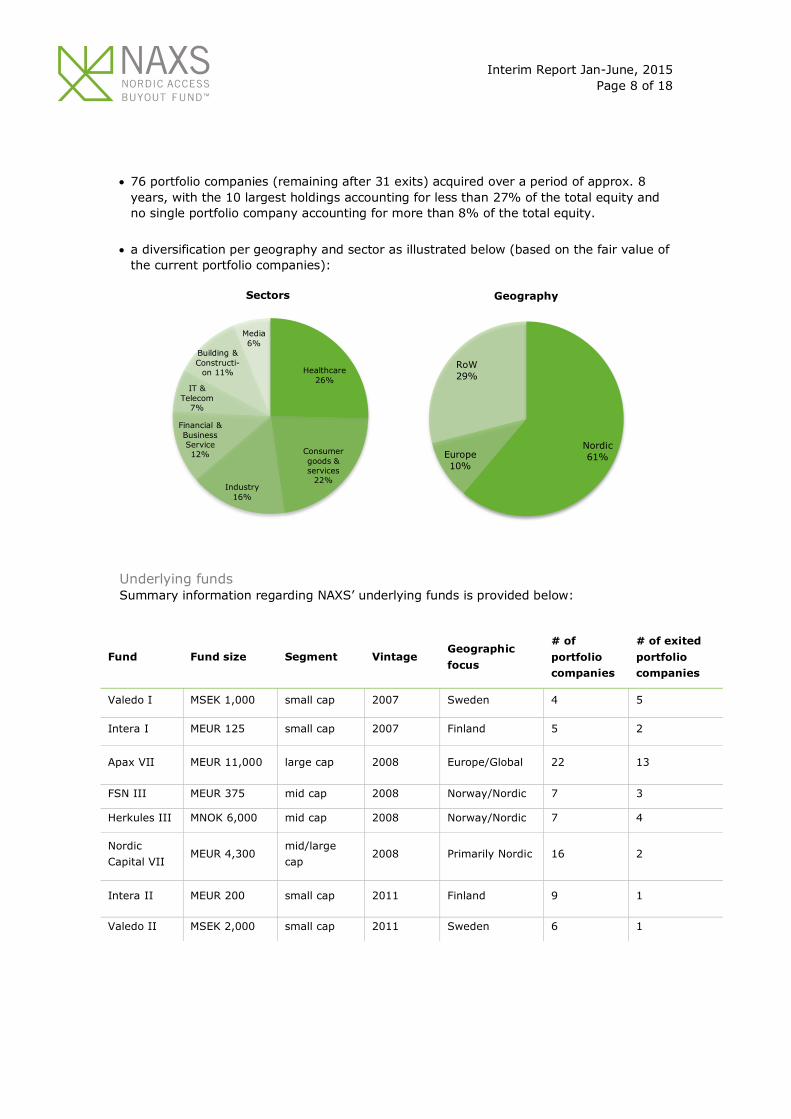
x 76 portfolio companies (remaining after 31 exits) acquired over a period of approx. 8 years, with the 10 largest holdings accounting for less than 27% of the total equity and no single portfolio company accounting for more than 8% of the total equity.
x a diversification per geography and sector as illustrated below (based on the fair value of
the current portfolio companies):
Underlying funds Summary information regarding NAXS’ underlying funds is provided below:
Fund Fund size Segment Vintage Geographic focus
# of portfolio companies
# of exited portfolio companies
Valedo I MSEK 1,000 small cap 2007 Sweden 4 5
Intera I MEUR 125 small cap 2007 Finland 5 2
Apax VII MEUR 11,000 large cap 2008 Europe/Global 22 13
FSN III MEUR 375 mid cap 2008 Norway/Nordic 7 3
Herkules III MNOK 6,000 mid cap 2008 Norway/Nordic 7 4
Nordic Capital VII
MEUR 4,300 mid/large cap
2008 Primarily Nordic 16 2
Intera II MEUR 200 small cap 2011 Finland 9 1
Valedo II MSEK 2,000 small cap 2011 Sweden 6 1
Healthcare 26%
Consumer goods & services
22% Industry
16%
Financial & Business Service 12%
IT & Telecom
7%
Building & Constructi-
on 11%
Media 6%
Sectors
Nordic 61% Europe
10%
RoW 29%
Geography
Interim Report Jan-June, 2015
Page 9 of 18
Group
Financial performance, Second quarter 2015
Operating profit The operating profit amounted to KSEK 34,632 (10,829) for the quarter. The operating profit includes a change in value of KSEK 37,721 (14,442). Operating expenses amounted to KSEK 3,089 (3,613).
Financial performance, First half-year 2015
Operating profit/loss The operating profit/loss amounted to KSEK 58,280 (44,116) for the first half-year. The operating profit/loss includes a change in value of private equity fund investments of KSEK 64,373 (50,240). The currency effects are included in the changes in value, and amounted to KSEK -9,896 (-12,321) for the first half-year. Operating expenses amounted to KSEK 6,093 (6,124).
January 1 – June 30, 2015 Changes in value of private equity fund investments: KSEK 64,373, whereof currency effects on private equity fund investments KSEK -9,896.
Financial items Financial items net totaled KSEK 82 (324) for the first half-year. The net interest income amounted to KSEK 137 (422). Exchange rate profit/loss amounted to KSEK -55 (-98).
Tax and net profit The Group’s profit/loss after financial items for the first half-year amounted to KSEK 58,362 (44,440). Income taxes amounted to KSEK 0 (216). Net profit/loss after tax amounted to KSEK 58,362 (44,656). Earnings per share were SEK 3.92 (3.00).
Investments, financing and liquidity
Private Equity Fund Investments During the first half-year, net repayments from private equity funds amounted to KSEK 24,147 (12,174). As of June 30, 2015, private equity fund investments amounted to KSEK 525,691 (537,832).
June 30, 2015 Private equity fund investments per share: SEK 35.35

Interim Report Jan-June, 2015
Page 10 of 18
Financing The Group is financed with shareholders’ equity. Shareholders’ equity amounted to KSEK 774,073 (751,319) at the end of the interim period, corresponding to SEK 52.06 (50.53) per share and an equity/asset ratio of 100 (100) percent. June 30, 2015 Equity per share: SEK 52.06
Net cash At the end of the interim period, net cash amounted to KSEK 248,866 (167,447), which corresponds to SEK 16.74 (11.26) per share. During the first half-year, cash and cash equivalents were invested in interest-bearing instruments or held on interest-bearing bank accounts, in accordance with the Company’s policy.
June 30, 2015 Net cash per share: SEK 16.74
Significant risks and uncertainty factors Significant risks and uncertainty factors are described in the Annual Report 2014. There has been no significant change in relation to risks and uncertainty factors since the publication of the Annual Report.
Future prospects While it is difficult to assess the potential future impact of the latest developments in the Eurozone, NAXS still expects that, in the Nordic region, market conditions for the remaining of 2015 will remain largely favorable to private equity activity, as during the first half of the year.
Parent company The parent company has not had any sales during the first half-year. The profit/loss after financial items amounted to KSEK -2,379 (60,464). During the first half-year, dividends from subsidiaries amounting to KSEK 0 (61,470) were received. The net interest income amounted to KSEK 303 (457) and exchange rate profit/loss amounted to KSEK -815 (670). Income tax amounted to KSEK 0 (216). The net profit/loss amounted to KSEK -2,379 (60,680).
Organization The Company’s CEO is Lennart Svantesson. The Board of Directors consists of John D. Chapman (chairman), Tony Gardner-Hillman, Ramanan Raghavendran and Andrew Wignall.
Interim Report Jan-June, 2015
Page 11 of 18
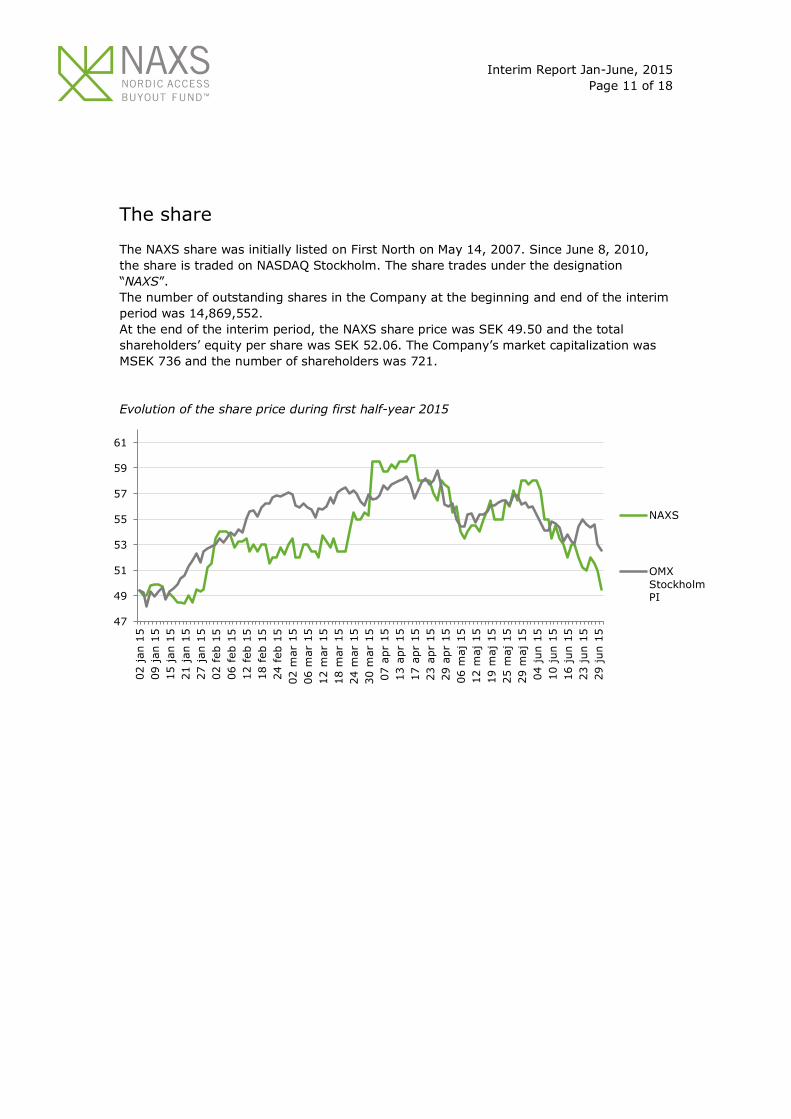
The share
The NAXS share was initially listed on First North on May 14, 2007. Since June 8, 2010, the share is traded on NASDAQ Stockholm. The share trades under the designation “NAXS”. The number of outstanding shares in the Company at the beginning and end of the interim period was 14,869,552. At the end of the interim period, the NAXS share price was SEK 49.50 and the total shareholders’ equity per share was SEK 52.06. The Company’s market capitalization was MSEK 736 and the number of shareholders was 721. Evolution of the share price during first half-year 2015
47
49
51
53
55
57
59
61
02 j
an 1
509
jan
15
15 j
an 1
521
jan
15
27 j
an 1
502
feb
15
06 f
eb 1
512
feb
15
18 f
eb 1
524
feb
15
02 m
ar 1
506
mar
15
12 m
ar 1
518
mar
15
24 m
ar 1
530
mar
15
07 a
pr 1
513
apr
15
17 a
pr 1
523
apr
15
29 a
pr 1
506
maj
15
12 m
aj 1
519
maj
15
25 m
aj 1
529
maj
15
04 j
un 1
510
jun
15
16 j
un 1
523
jun
15
29 j
un 1
5
NAXS
OMXStockholmPI

Interim Report Jan-June, 2015
Page 12 of 18
Accounting principles
The condensed consolidated financial statements have been established in accordance with the International Financial Reporting Standards (IFRS), as recognized by the EU. This report has been prepared in accordance with IAS 34 Interim Financial Reporting and the Swedish Annual Reporting legislation. The accounting principles applied in this report are described in the Annual Report 2014. The Parent Company follows the Swedish Annual Reporting legislation and the Swedish Financial Reporting Board RFR 2 for legal entities, which provides that the IFRS principles shall apply.
Financial information Contact persons
Interim Report (9 months): October 22, 2015 Lennart Svantesson, CEO +46 73 311 00 11 [email protected]
Ticker codes NAXS SS in Bloomberg NAXS.ST in Reuters
Gösta Lundgren, CFO +46 70 710 47 88 [email protected]
NAXS Nordic Access Buyout Fund AB discloses the information provided herein pursuant to the Swedish Securities Markets Act. The report was submitted for publication at 8:30 CET on July 17, 2015. This report is an in-house translation of the original report in Swedish

Interim Report Jan-June, 2015
Page 13 of 18
The undersigned declare that the half-year report provides a true and fair overview of the Parent Company’s and the Group’s operations, their financial position and performance, and describes material risks and uncertainties facing the Parent Company and other companies in the Group.
Stockholm, July 17, 2015 John D. Chapman Chairman
Tony Gardner-Hillman Director
Ramanan Raghavendran Director
Andrew Wignall Director
Lennart Svantesson Chief Executive Officer
This report has not been subject to review by the Company’s auditors. This report and other information are available on www.naxs.se NAXS Nordic Access Buyout Fund AB (publ) Corp. Reg. No. 556712-2972 Grev Turegatan 10 114 46 Stockholm, Sweden Tel: +46 8 611 33 25, E-mail: [email protected]

Interim Report Jan-June, 2015
Page 14 of 18
Consolidated Income Statement Amounts in SEK 000s
2015 2014 2015 2014
1/1-6/30 1/1-6/30 4/1-6/30 4/1–6/30 Change in value 64 373 50 240 37 721 14 442 Operating costs Note 1 -6 093 -6 124 -3 089 -3 613 Operating profit/loss 58 280 44 116 34 632 10 829 Net financial items 82 324 -47 -1 Profit/loss after financial items 58 362 44 440 34 585 10 828 Income taxes - 216 - 48 Net profit/loss 58 362 44 656 34 585 10 876
Earnings per share, SEK* 3.92 3.00 2.33 0.73 Average number of shares, 000s* 14 870 14 880 14 870 14 877 * Basic and diluted
Consolidated Statement of Comprehensive Income Amounts in SEK 000s
2015 2014 2015 2014
1/1-6/30 1/1-6/30 4/1-6/30 4/1–6/30 Net income 58 362 44 656 34 585 10 876 Other comprehensive income Items which will be reversed to the income statement
Exchange differences -1 408 -809 1 436 104 Total comprehensive income 56 954 43 847 36 021 10 980
Consolidated Balance Sheet Amounts in SEK 000s
2015 2014
6/30 12/31 Assets Private equity fund investments 525 691 587 105 Total non-current assets 525 691 587 105
Other receivables 372 201 Cash and cash equivalents 248 866 167 447 Total current assets 249 238 167 648 Total assets 774 929 754 753
Equity 774 073 751 319 Current liabilities 856 3 434 Total equity and liabilities 774 929 754 753
Interim Report Jan-June, 2015
Page 15 of 18
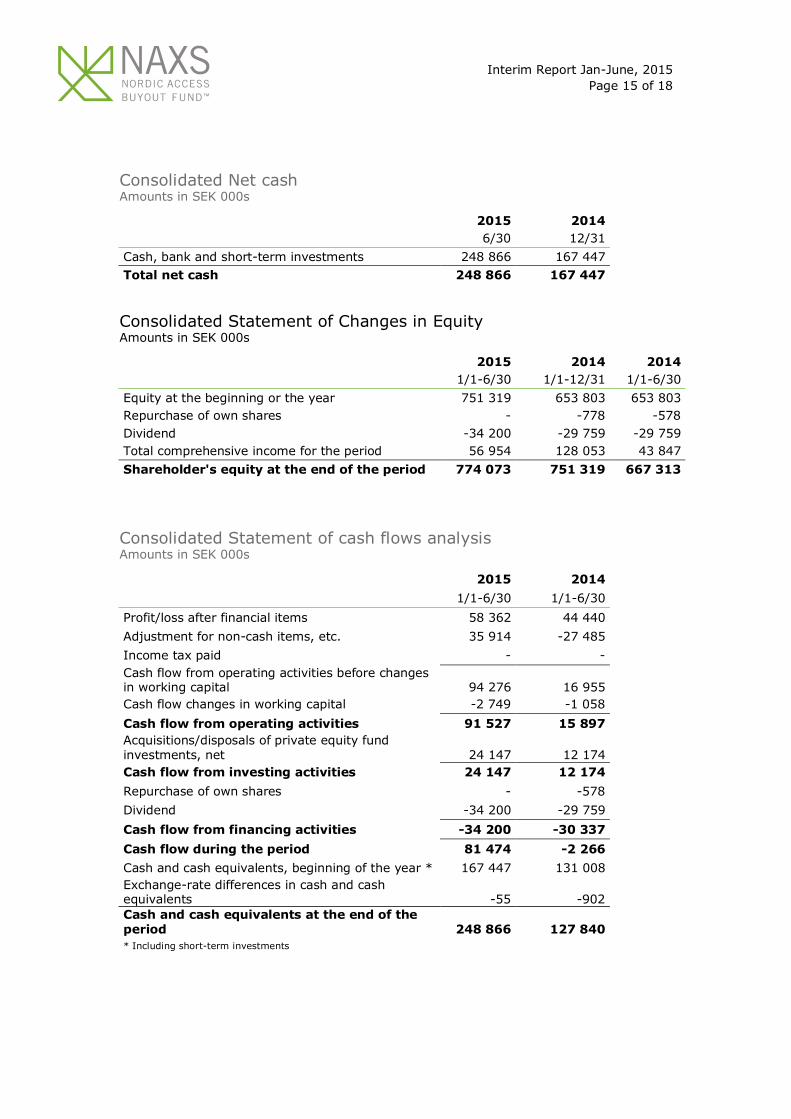
Consolidated Net cash Amounts in SEK 000s
2015 2014
6/30 12/31 Cash, bank and short-term investments 248 866 167 447 Total net cash 248 866 167 447
Consolidated Statement of Changes in Equity Amounts in SEK 000s
2015 2014 2014
1/1-6/30 1/1-12/31 1/1-6/30 Equity at the beginning or the year 751 319 653 803 653 803 Repurchase of own shares - -778 -578 Dividend -34 200 -29 759 -29 759 Total comprehensive income for the period 56 954 128 053 43 847 Shareholder's equity at the end of the period 774 073 751 319 667 313
Consolidated Statement of cash flows analysis Amounts in SEK 000s
2015 2014 1/1-6/30 1/1-6/30 Profit/loss after financial items 58 362 44 440 Adjustment for non-cash items, etc. 35 914 -27 485 Income tax paid - - Cash flow from operating activities before changes in working capital 94 276 16 955 Cash flow changes in working capital -2 749 -1 058 Cash flow from operating activities 91 527 15 897 Acquisitions/disposals of private equity fund investments, net 24 147 12 174 Cash flow from investing activities 24 147 12 174 Repurchase of own shares - -578 Dividend -34 200 -29 759 Cash flow from financing activities -34 200 -30 337 Cash flow during the period 81 474 -2 266 Cash and cash equivalents, beginning of the year * 167 447 131 008 Exchange-rate differences in cash and cash equivalents -55 -902 Cash and cash equivalents at the end of the period 248 866 127 840 * Including short-term investments

Interim Report Jan-June, 2015
Page 16 of 18
Parent Company Income Statement Amounts in SEK 000s
2015 2014 2015 2014 1/1-6/30 1/1-6/30 4/1-6/30 4/1–6/30 Operating costs -1 867 -2 133 -823 -1 105 Operating profit/loss -1 867 -2 133 -823 -1 105 Income from shares in group companies - 61 470 - 61 470 Net financial items -512 1 127 -38 878 Profit /loss after financial items -2 379 60 464 -861 61 243 Income taxes - 216 - 48 Net profit/loss for the period -2 379 60 680 -861 61 291
Parent Company Statement of Comprehensive Income Amounts in SEK 000s
2015 2014 2015 2014 1/1-6/30 1/1-6/30 4/1-6/30 4/1–6/30 Net profit/loss for the period -2 379 60 680 -861 61 291 Total comprehensive income for the period -2 379 60 680 -861 61 291
Parent Company Balance Sheet Amounts in SEK 000s
2015 2014
6/30 12/31 Assets Shares in subsidiaries 481 802 481 802 Receivables on group companies 23 640 24 455 Total non-current assets 505 442 506 257
Other receivables 373 201 Cash and cash equivalents 64 501 100 616 Total current assets 64 874 100 817 Total assets 570 316 607 074
Equity 569 877 606 456 Current liabilities 439 618 Total equity and liabilities 570 316 607 074
Interim Report Jan-June, 2015
Page 17 of 18
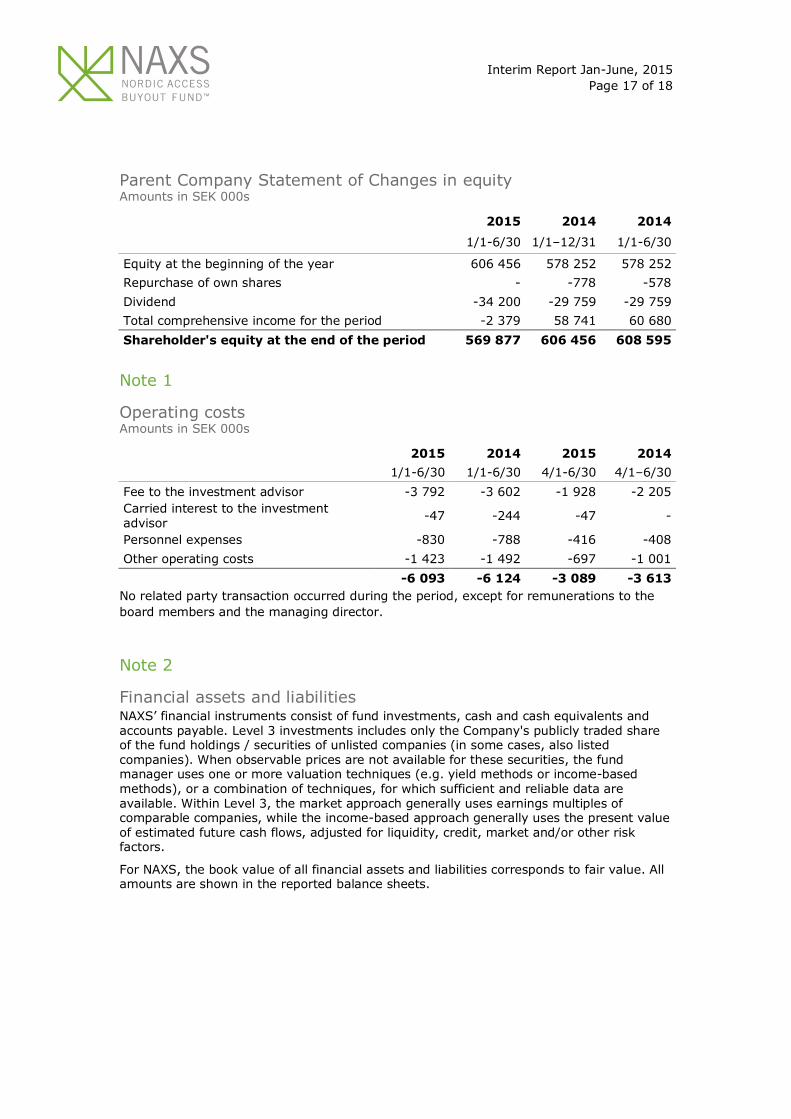
Parent Company Statement of Changes in equity Amounts in SEK 000s
2015 2014 2014
1/1-6/30 1/1–12/31 1/1-6/30
Equity at the beginning of the year 606 456 578 252 578 252 Repurchase of own shares - -778 -578 Dividend -34 200 -29 759 -29 759 Total comprehensive income for the period -2 379 58 741 60 680 Shareholder's equity at the end of the period 569 877 606 456 608 595
Note 1
Operating costs Amounts in SEK 000s
2015 2014 2015 2014
1/1-6/30 1/1-6/30 4/1-6/30 4/1–6/30 Fee to the investment advisor -3 792 -3 602 -1 928 -2 205 Carried interest to the investment advisor -47 -244 -47 -
Personnel expenses -830 -788 -416 -408 Other operating costs -1 423 -1 492 -697 -1 001
-6 093 -6 124 -3 089 -3 613 No related party transaction occurred during the period, except for remunerations to the board members and the managing director.
Note 2
Financial assets and liabilities NAXS’ financial instruments consist of fund investments, cash and cash equivalents and accounts payable. Level 3 investments includes only the Company's publicly traded share of the fund holdings / securities of unlisted companies (in some cases, also listed companies). When observable prices are not available for these securities, the fund manager uses one or more valuation techniques (e.g. yield methods or income-based methods), or a combination of techniques, for which sufficient and reliable data are available. Within Level 3, the market approach generally uses earnings multiples of comparable companies, while the income-based approach generally uses the present value of estimated future cash flows, adjusted for liquidity, credit, market and/or other risk factors.
For NAXS, the book value of all financial assets and liabilities corresponds to fair value. All amounts are shown in the reported balance sheets.
Interim Report Jan-June, 2015
Page 18 of 18
Definitions
Cash & cash equivalents Cash, bank and short-term investments
Cash per share Cash & cash equivalents in relation to the number of shares
Commitment The maximum amount that a limited partner agrees to invest in a fund
Current commitments Acquisition cost for private equity fund investments, plus remaining commitments to private equity funds
Gross IRR The internal rate of return generated annually at the underlying private equity funds’ level, before the deduction of the management fees and carried interest
Net asset value The fair value of total assets, less net debt (corresponds to equity)
Net cash/Net debt Cash and cash equivalents, short-term investments and interest-bearing current and long-term receivables, less interest-bearing current and long-term liabilities
Private equity fund investments Fair value of investments in private equity funds
Total assets All assets and liabilities not included in net debt or net cash, which is the same as the balance sheet total, less asset items included in net debt or net cash and less non-interest-bearing liabilities
Total exposure to private equity fund investments Private equity funds investments and remaining commitments to private equity funds