nber working paper series water, water … · water, water everywhere: municipal finance and water...
TRANSCRIPT

NBER WORKING PAPER SERIES
WATER, WATER EVERYWHERE:MUNICIPAL FINANCE AND WATER SUPPLY
IN AMERICAN CITIES
David CutlerGrant Miller
Working Paper 11096http://www.nber.org/papers/w11096
NATIONAL BUREAU OF ECONOMIC RESEARCH1050 Massachusetts Avenue
Cambridge, MA 02138January 2005
This paper was prepared for the National Bureau of Economics Research's Corruption and ReformConference held in Salem, MA on July 30 and 31, 2004. We thank conference participants for helpfulcomments and suggestions. Michael Edelstein, Claudia Goldin, and Sukkoo Kim graciously made historicaldata available to us. Research support from National Institute on Aging grant number T32 AG00186 throughthe National Bureau of Economic Research (NBER) is gratefully acknowledged. All errors are our own. Theviews expressed herein are those of the author(s) and do not necessarily reflect the views of the NationalBureau of Economic Research.
© 2005 by David Cutler and Grant Miller. All rights reserved. Short sections of text, not to exceed twoparagraphs, may be quoted without explicit permission provided that full credit, including © notice, is givento the source.

Water, Water, Everywhere: Municipal Finance and Water Supply in American CitiesDavid Cutler and Grant MillerNBER Working Paper No. 11096January 2005JEL No. N4, I1, H4
ABSTRACT
The construction of municipal water systems was a major event in the history of American cities –
bringing relief from disease, providing resources to combat fires, attracting business investment, and
promoting development generally. Although the first large-scale municipal water system in the
United States was completed in 1801, many American cities lacked waterworks until the turn of the
twentieth century. This paper investigates the reason for the century-long delay and the subsequent
frenzy of waterworks construction from 1890 through the 1920s. We propose an explanation that
emphasizes the development of local public finance. Specifically, we highlight the importance of
municipal bond market growth as a facilitator of debt finance. We argue that this explanation is
superior to others put forward in the literature, including disease knowledge, the presence of
externalities, municipal population density, natural monopoly, contracting difficulties, corruption
costs, and growth in the supply of civil engineers.
David CutlerDepartment of EconomicsHarvard UniversityCambridge, MA 02138and [email protected]
Grant MillerNBER1050 Massachusetts AvenueCambridge, MA [email protected]

1
Introduction
Samuel Taylor Coleridge wrote about an ancient mariner stranded at sea, but he might as
well have been writing about nineteenth century American cities.1 Although large-scale
municipal water supplies first emerged in the U.S. at the beginning of the nineteenth century,
water resource development and provision in many American cities remained abysmal many
decades later. A large share of households continued to rely on private wells and privies, which
generally resulted in “circular water systems” that re-circulated household waste and perpetuated
disease (Melosi 2000). Some larger cities and wealthier neighborhoods had initially enjoyed an
escape from this vicious cycle. However, rapid urban growth, a weak understanding of disease
transmission, and rudimentary sanitary engineering resulted in the deterioration of water
provision and sewage removal to the point that they became large-scale circular water systems
(Duffy 1990). Massive fires still wreaked havoc as early water systems failed to meet the needs
of unprecedented urban growth (Anderson 1988), and corruption in water contracting was
widespread (Blake 1956).
By the 1930s, however, Coleridge was definitely out of place. The scientific
understanding of disease had made unprecedented strides. A large core of technocrats and
municipal engineers had assumed important roles in city governments, and municipal water
systems had enjoyed tremendous growth and development. Major conflagrations were no longer
the scourge they had once been (Melosi 2000). Clean water technologies (filtration and
chlorination) were responsible for about half of the enormous health gains in the early twentieth
century – prior to the revolution of new drugs and the advent of modern medicine (Cutler and
Miller 2004).
What led to this dramatic transformation of water provision? Clearly there are multiple
dimensions of a “good” water system – and potentially different explanations for improvements
in each. This paper focuses on radical increases in the quantity of water supplied in the late
nineteenth and early twentieth centuries.2 In the case of water system expansions, at least part of
the answer appears to lie with municipal ownership. Case histories of municipal water systems
suggest that cities tapped new water supplies or greatly improved existing ones when private
1 The title of our paper comes from the famous verse of Coleridge, “Water, water, every where/ And all the boards did shrink; / Water, water, every where, / Nor any drop to drink.” The Rime of the Ancient Mariner, 1797. 2 Cutler and Miller (2004) examines water quality and health.

2
suppliers failed to perform well. Major investments in water systems coincided with the rapid
rise in public ownership between 1890 and the 1920s.3
What was so unique about the public sector that led it to achieve these gains, and why did
local governments suddenly get involved when they did? We discuss two major types of
explanations for municipally-led improvements in water systems. The first is changes in the
value (or perceived value) of water systems. The late nineteenth and early twentieth centuries
were times of major advances in the understanding of disease. It is possible that the public goods
nature of clean water became clear during this era. But this explanation does not seem right; the
link between dirty water and disease was apparent long before the acceptance of germ theory,
even if the biological mechanism underlying the link was not well understood. Alternatively,
increases in the population density of cities may have increased the need for clean water as
public health conditions deteriorated. However, there do not appear to have been sharp changes
in population density that coincided with waterworks expansion and public ownership.
The second type of explanation is that the costs of water systems were changing. Water
systems are a natural monopoly, so private firms that win contracts for them have incentives to
under-provide services (and charge a high price). As cities grew, welfare losses may have also
grown. We suspect this cannot be the whole explanation, however. Other utilities like the gas
industry were predominantly private even though they were also natural monopolies.
Contracting between the public and private sector in the era prior to municipal ownership may
also have been difficult. Contracting costs between cities and private water companies were
presumably rising, but the timing and pattern of public ownership across big and small cities
suggests this is not the primary explanation. Private companies may have also feared
expropriation by municipal authorities after making costly infrastructure investments (Troesken
and Geddes 2003). However, private water companies were actually more likely to have
expensive filtration plants than public ones (Troesken 1999), and no similar pattern of public
ownership emerged in other utilities that required large investments. Other explanations such as
reductions in corruption costs due to administrative reforms and the rise of a cadre of skilled
municipal engineers also appear unsatisfactory.
We propose an alternative explanation for the rapid growth of water systems that
emphasizes the costs of capital and the development in local public finance. In the late
3 It is not clear that public ownership conferred other benefits such as health improvement (Troesken 1999).

3
nineteenth century, there was enormous latent demand for the expansion of waterworks – to
serve neglected neighborhoods, to find clean water for drinking, and to ensure sufficient water
supplies for fighting fires. The cost of building sufficiently large water systems was also
enormous. Modern water systems frequently required transporting water from far away and
investing in filtration plants. These costs were too large for private firms and sufficiently large
that only the largest cities or cities with access to sophisticated municipal finance techniques
could afford them.4 While the largest cities invested in water systems prior to the late nineteenth
century, we propose that the development of municipal bond markets was key to providing an
adequate volume of water in many American cities. We present some evidence for this
explanation using data on the cost of municipal water systems, the development of means of
financing them, the time pattern of investment in water resources, and a time series of historical
municipal bond yields.
In this paper, our approach is informal; we provide some selected trends, illustrations,
and case studies to support our contention that the development of local public finance was
primarily responsible for water system improvements. The second section presents a snapshot of
how American cities typically addressed their water and sanitation needs before the adoption of
modern water and sewage systems. The third section presents case histories of Boston and New
York, suggesting that city governments intervened to provide water when existing private ones
failed to perform well. The fourth section examines the development of local public finance and
its importance in the construction and expansion of water systems. The fifth and sixth sections
review alternative explanations for local government ownership and control of water supplies
and provide evidence refuting each; the seventh section concludes.
4 Early in the nineteenth century before the development of municipal finance, private companies were perhaps better suited to building water systems.

4
A Snapshot of Municipal Water and Sewer Systems in the Late Nineteenth and Early
Twentieth Centuries
Household Wells and Privies
Households not connected to municipal water and sewer systems generally provided
these services for themselves by digging wells and privies on their lots. Dry privies were
generally used only for human waste and were generally placed a distance from homes.
Cesspools received human and other types of wet waste and were generally placed in basements
or immediately adjacent to homes, into which household drainage was emptied. (The terms
privy and cesspool have come to be used interchangeably.) Privies and cesspools were generally
constructed by digging a hole about 3 or 4 feet in diameter and at least 5 feet deep. Cesspool
overflow was very common, saturating the earth around them with filth. Privy vaults were
generally lined with brick, stone, or wood. Over a period of time, vaults would rot or begin to
disintegrate; even in their prime, they were porous enough to allow contaminants to escape. The
common result was the tainting of nearby groundwater into which household wells generally
drew (Duffy 1990, Melosi 2000).
Not all waste material made its way directly into household water supplies or the
surrounding soil. In many other cases, it journeyed to the streets in front of private lots. Liquid
wastes were allowed to run into the open gutters of the alleys and into the streets. Here they
mixed with cesspool contents removed from privies by hand and bucket and dead animals and
refuse (Duffy 1990). City governments would sporadically send horse-drawn carts through
residential areas to remove the buildup of waste that collected in the streets and gutters.
Removed waste known as “night soil” was used as a fertilizer through the turn of the twentieth
century, when an overwhelming preponderance of scientific evidence had demonstrated such
practices to be unhealthy. Cities gradually began to introduce a new suction method of emptying
privies using airtight hoses and cart removal, although these services were not often provided on
a sufficiently regular basis. The prevalence of cobblestone streets also exacerbated the problems
of festering garbage and waste dumped onto streets. Cobblestone surfaces did not wash or drain
well, and they made waste removal considerably more difficult and less effective (Duffy 1990).

5
The Requirements of Constructing Water Systems
The challenges of constructing large municipal water systems were quite formidable
during the nineteenth century (indeed they are not trivial today). A variety of complex decisions
had to be made; each one involved extensive research and planning together with a precarious
balancing act in volatile political environments. An appropriate water source had to be
identified. For most cities, there were generally many candidates, including surface water
(streams, rivers and lakes) and ground water sources of various sorts. Survey work by geologists
and engineers was a difficult and time-consuming task, and their findings were often
controversial and subject to political pressure. Each potential source required estimates of
supply volume and purity (particularly difficult before science elucidated what “purity” meant).
Engineers would then attempt to estimate how water from each source could be delivered to city
populations. This involved acquiring water using pumps and dams, transporting it via large
aqueducts, raising it to sufficient elevation to facilitate flow by means of gravity, and storing
sufficient quantities of water in large city reservoirs to smooth water consumption across periods
of high and low demand (Blake 1956).
With this information, each potential water source would then require rough cost
estimates. Not surprisingly, these estimates were often quite inaccurate. Private interests also
commonly exerted considerable influence over these estimates and surveys. In most cases, the
expense of such waterworks projects were staggering regardless of the source chosen, totaling
many times annual municipal revenue in some cases (Blake 1956). Given the amount of
information required, the uncertainty surrounding it, the sheer size of the financial commitment,
uncertainty about future city needs, and strong political pressures from various directions, it is
not surprising that many decades of debate often preceded significant waterworks projects.
Sanitary Problems Linked to Municipal Water and Sewer Systems
During the 1870s and 1880s, major cities expanded or built new water and sewer,
systems, instituted systematic garbage collection, and began paving cobblestone roads with
smoother materials like granite and occasionally asphalt. Clearly these services –municipal

6
water and sewers in particular – held promise for addressing the woes caused by household wells
and privies. But their promise was not to be immediately realized.
Sanitary engineering was developing as a field during the 1870s and 1880s, which meant
that many of the eastern cities with sewers and drains constructed in earlier years were done so in
a haphazard and inadequate manner (Melosi 2000). A considerable amount of waste continued
to be dumped into city streets, and these wastes were generally swept or washed down drains and
into sewers. Water systems generally provided inadequate water or inadequate water pressure to
wash streets and flush sewers on a regular basis. Moreover, because most sewer systems were
only designed to carry storm water, they often became clogged because they lacked the sufficient
capacity (many were not more than 2.5 or 3 feet in diameter) (Duffy 1990). Rapid population
growth during the nineteenth century greatly exacerbated the capacity problems of existing
systems and often negated the benefits of investments made to improve existing systems. In
addition to a large amount of waste introduced into sewers from city streets, the advent of water
closets in the US in the 1870s added considerable strain to already overburdened sewers. The
end result was often backflow from sewers into streets and gutters; some observers began
referring to sewers as “elongated cesspools” (Duffy 1990).
Perhaps the worst sort of backflow was the emptying of sewer systems directly into
drinking water supplies. In the late nineteenth century, the primary sewer outfalls of many
American cities emptied upstream of river water intakes or directly into large water bodies (like
the Great Lakes) in close proximity to water intakes. The few cities that addressed this problem
early on also suffered from the dumping of untreated sewage by upstream communities. This
phenomenon essentially reproduced the household circular water systems on the municipal level
(Duffy 1990).
Service Provision at the Household Level
Household water and sewer connections were often poorly constructed, resulting in waste
and the continued spreading of filth. Annual flat fees were paid for piped water, giving
households no incentive to fix leaky connections. Not until early in the twentieth century did
many cities make efforts to meter household water, charging rates per volume of water used (or
wasted) rather than flat fees. Water pressure, turgidity, and taste varied greatly from moment to

7
moment, and isolated reports of other irregularities emerged from time to time (for example, fish
being delivered through infrastructure pipes into bathtubs). As water closets began replacing
simple privies and chamber pots after 1870, many of them resulted in more unsanitary conditions
than the use of privies and cesspools. Many were not properly installed (permits to install water
closets were trivial to obtain) and resulted in considerable sewage leakage (Melosi 2000).
Water Systems and Fires
The importance of water systems to combat major fires was an issue that emerged early
in the nineteenth century. The growth of population and structures meant growth in the
consequences of uncontrolled fires. Bucket brigades and water wagons were clearly inadequate
to manage large conflagrations. In areas of cities served by water supplies, water for
extinguishing fires was tapped in several ways. The most rudimentary method was to drill holes
in wooden water pipes; these holes could be corked or opened as desired. A more sophisticated
approach was the installation of fire hydrants. Arrangements for use of water ranged from cities
paying hydrant rental fees to private water companies to water being made freely available for
purposes of putting out fires. However, water pressure was inadequate to effectively combat
fires with some regularity. Even in cities with well-developed water systems, they often did not
extend to outlying areas, poor neighborhoods, and regions of high elevation. These areas were
clearly particularly vulnerable to the destruction of fires, and fire insurance was more costly by
several orders of magnitude (Anderson 1988).
Public Takeovers of Private Water Systems
Cities wishing to increase their involvement in the delivery of water essentially had two
choices: build a water system if one did not exist or take control of existing private water
systems. Municipal takeovers of existing private water systems generally involved either the
outright purchase of private companies or the introduction of a municipal competitor to a private
water company (essentially bankrupting the private company). The specifics of how this was
done depended on the private company’s charter. For example, if a private company had
exclusive legal rights to provide water to residents of a city, these rights would generally have to
8
be purchased. If a private company had exclusive legal rights to a given water source, a
municipal water company could either buy this right or find another source. City governments
could also petition state legislatures to revoke private water company charters under extreme
circumstances.
Once a water company was municipally owned, it had to be operated. This usually
required the establishment of a standing municipal water board that wasn’t subject to changes
with every electoral cycle (although appointment to boards was of course political), as opposed
to being operated directly by a city council. Water boards would manage systems in conjunction
with hired engineers and contractors. Rates would be set and collected from citizens and firms.
Improvements or expansions would often begin with surveys and draft proposals prepared by
engineers retained by the board. The board would decide which ones it preferred to pursue and
would seek political permission and financing from the city council or other relevant municipal
government authority. Once political permission was obtained and financing was approved, the
water board would solicit bids for municipal contracts to actually conduct the work.
The Changing Landscape of Water Provision in Subsequent Years
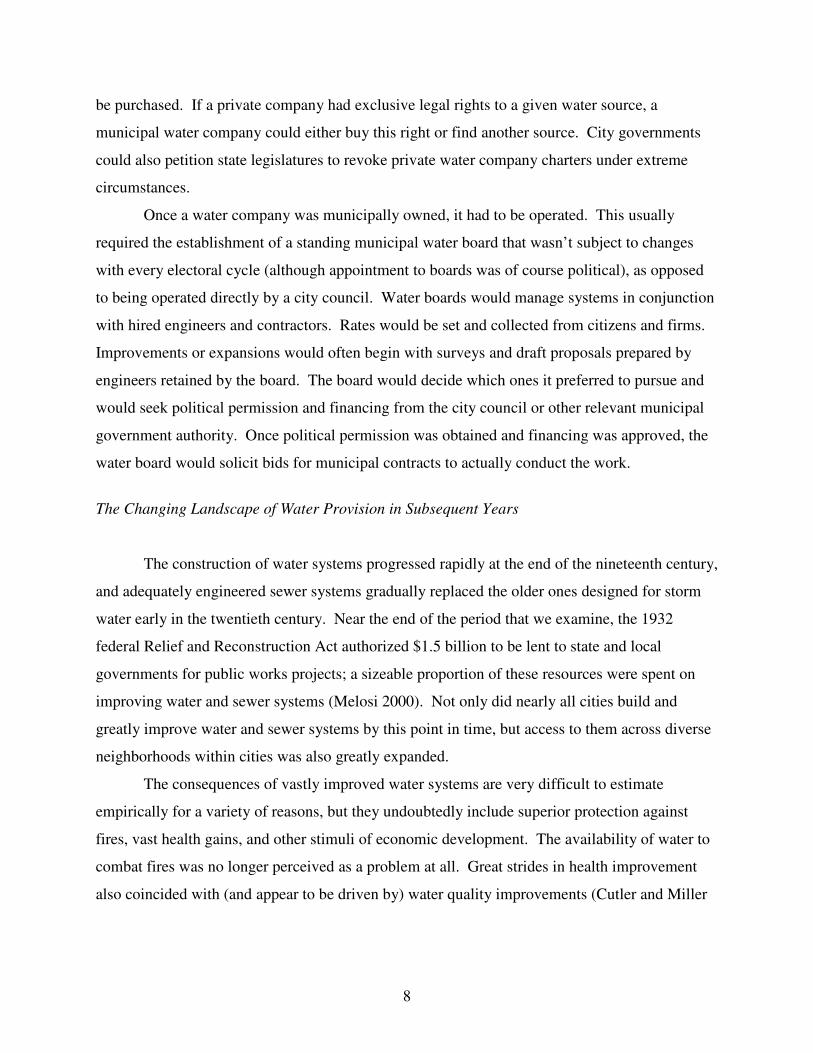
The construction of water systems progressed rapidly at the end of the nineteenth century,
and adequately engineered sewer systems gradually replaced the older ones designed for storm
water early in the twentieth century. Near the end of the period that we examine, the 1932
federal Relief and Reconstruction Act authorized $1.5 billion to be lent to state and local
governments for public works projects; a sizeable proportion of these resources were spent on
improving water and sewer systems (Melosi 2000). Not only did nearly all cities build and
greatly improve water and sewer systems by this point in time, but access to them across diverse
neighborhoods within cities was also greatly expanded.
The consequences of vastly improved water systems are very difficult to estimate
empirically for a variety of reasons, but they undoubtedly include superior protection against
fires, vast health gains, and other stimuli of economic development. The availability of water to
combat fires was no longer perceived as a problem at all. Great strides in health improvement
also coincided with (and appear to be driven by) water quality improvements (Cutler and Miller

9
2004). In the short span of five or six decades, the sanitary environment of many American
cities was transformed from one of filth to one that resembles a modern city.
Case Histories of Boston and New York
The evolution of waterworks construction and ownership was different in every city.
Keeping this in mind, we present case histories of Boston and New York below.5 In both cases,
waterworks were clearly used to further private interests in a variety of ways, both legitimate and
otherwise. Boston and New York were reluctant to make the initial investments necessary to
build water systems and preferred that private investors instead lead the way. The water supplies
of both cities began with small-scale private ventures that proved to be inadequate to meet the
needs of growing cities. In the end, the governments of both cities intervened to purse grander
projects than private companies were willing to embrace in order to increase the available supply
of water. Both examples illustrate the enormous scale of water projects.
Boston
In 1794 a group of entrepreneurs submitted a petition to the Massachusetts legislature to
be incorporated to deliver water from Jamaica Pond to residents of Boston. The City of
Roxbury, in which Jamaica Pond is located, opposed this proposal to no end. The following year
the state legislature approved the application and incorporated The Aqueduct Corporation; the
City of Boston passed a resolution approving the project as well. The company’s charter gave it
the right to obtain water from anywhere in Roxbury and deliver it to any part of Boston. It also
contained two important restrictions: both Roxbury and Boston reserved the right to draw water
for free to combat fires, and water rates were subject to court regulation.
The Aqueduct Corporation project proceeded quickly; it had obtained pine logs and
awarded a contract for laying wooden pipes within months. Although historical accounts are
unclear, customers appear to have been served with water by the middle of 1798. But the project
failed to produce returns for its investors for 12 years. When its first dividends were paid, rates-
5 Both case histories are drawn from Blake (1956).

10
of-return were only about 1.5 percent. Business gradually improved, however, and over the next
thirty years, stock in the company yielded about a 4 percent annual return.
Although successful, this first water system only served about 800 families, and its pipes
were small and were too shallow, causing them to freeze during the winter. Movement toward
supplying most of the city with water had its origins in a fire in 1825 that destroyed 53 houses
and stores and caused half a million dollars in damage. The city council responded by beginning
serious debate on how an adequate water supply for the city might be obtained. The debate
would continue for nearly 25 more years.
Boston’s mayor at the time, Mayor Quincy Sr., assembled a committee to investigate the
matter. An engineer conducting surveys for the city reported that two sources would be most
suitable: the Charles River above the falls at Watertown and Spot Pond in Stoneham. Spot Pond
would not require the complications of pumping or reservoir storage because of its elevation. On
the issue of ownership, the committee was split. Mayor Quincy also sought advice from the
chairman of the Philadelphia Watering Committee (the success and scale of the Philadelphia
waterworks was of course renowned); the chairman’s answer both questioned the adequacy of
the Spot Pond supply during dry months and strongly encouraged municipal ownership of any
water system that Boston might pursue. On this advice, the mayor began denying petitions from
entrepreneurs to establish private water company. His own efforts were frustrated as well,
however, and his tenure ended without further progress.
Several years later a new mayor named Theodore Lyman again brought the water issue to
the forefront – and went on record favoring municipal ownership. Jamaica Pond was clearly too
small a source to serve the entire city, so new surveys were begun. These new surveys were
completed in 1834 and recommended larger, more distant sources over Spot Pond and the
Charles River primarily because of concerns about volume. Farm and Shakum Ponds in
Framingham as well as Long Pond were touted as the most suitable alternative water sources.
Mayor Armstrong, elected in 1835, frowned upon seeking water as far away as
Framingham, so he assembled yet another committee to study the matter. He also charged the
committee to make a recommendation for either public or private waterworks ownership. Their
report favored building a more modest system than did earlier ones, making allowances for
expansion as the city’s population grew rather than investing in a larger system at the outset. It
promoted Spot Pond with the proviso that if this supply became inadequate, the City of Boston

11
could also draw water from Mystic Pond. Interestingly, attached to the report was the charter of
the Boston Hydraulic Company, which had recently been incorporated by the Massachusetts
legislature but was still subject to approval by the city council. Its charter gave it the authority to
take water from any source north of the Charles River within twelve miles of Boston. It also
gave the city the option of purchasing a considerable share of the new company’s stock. The city
council approved the charter but declined to buy any of its shares.
More mayors were elected, and more committees to study how to supply the city with
water were appointed. In 1837, three city commissioners were appointed to develop a concrete
water supply plan for the city. It considered four of the usual suspects: Spot Pond, Mystic Pond,
Long Pond, and the Charles River. The Charles River was the most unattractive of the options
because it would require more mechanical pumping – and was thought to be dirtier – than the
others. The real choice was essentially between Long Pond and Spot Pond (which could be
supplemented with water from Mystic Pond if necessary). The three commissioners could not
agree amongst themselves; two of them recommended Spot Pond, and the mayor attempted to
act on it.
In 1838, what was now the standing committee on water and the city board of aldermen
approved a plan to draw water from Spot Pond under municipal ownership. Not surprisingly, the
two private water companies strenuously objected and even pleaded that competition between
them would best serve the city’s interests. Small townships around Boston also vehemently
protested, fearing that local interests would be hurt and that land for the project would be seized
by condemnation. Investors in the Middlesex Canal (chartered in 1793 to build a waterway
connecting the Merrimac River with Boston Harbor) also protested that water flow for their canal
project would be diminished. The result of these objections was a series of protracted hearings.
In 1840 Mayor Jonathan Chapman was elected, and he frowned on the city’s present
water initiative because of the massive outlays required in light of the rapid growth of the city’s
debt in recent years. As the municipal effort was halted, private efforts were reinvigorated. In
1840, the rights of the Aqueduct Corporation were expanded to include Brookline and Brighton.
The company also began modest expansions of its works and replaced its wooden pipes with
more durable iron ones. But it also knew that it could never supply all sections of Boston from
Jamaica Pond. Fearing a municipally-owned water system, it began fostering other private
interests in complementary systems that would supply other areas of the city.

12
In early 1843, a member of the city council whose family owned Spot Pond for many
years resigned together with colleagues to form a company to serve Boston from the pond.
Several months later the Spot Pond Aqueduct Company was incorporated. The company had
exclusive rights to Spot Pond, and it would provide Boston with free water to fight fires. The
City of Boston was entitled to purchase up to one third of the company’s stock or to seize the
franchise and company property at any time at a price set by a pre-determined formula. Because
of an unusual feature of the charter that made stockholders individually liable for company debts,
the city decided not to purchase any shares of the Spot Pond Aqueduct Company.
In 1844 a city initiative to tap water in Long Pond (the only source now considered by the
city administration to possess adequate supply for the entire city) was revived. Additional costs
of supplementing Spot Pond water with Mystic Pond water reportedly made Long Pond the most
appealing source in light of Boston’s continued rapid population growth. The two
commissioners who originally constituted a majority in favoring Spot Pond had now changed
their minds; Long Pond was now the unanimous choice recommended by a new commission
report. After considerable wrangling in the legislature and a few compromise amendments, in
1845 Boston was given approval by the legislature to construct a municipal water supply that
tapped Long Pond. However, supporters of the private companies campaigned vigorously
against it, and it was defeated by popular vote in the referendum.
The Spot Pond Aqueduct Corporation attempted to fill the vacuum, and it submitted a
proposal to the city council offering to sell the city its water rights and Spot Pond itself. In
considering the company’s offer, the city once again reconsidered all of its options for water and
once again sought outside help in assessing both the city’s future water needs and the quality of
each potential source. John Jervis, the chief engineer of the Croton Aqueduct Project, was
chosen to conduct the new surveys. While awaiting the Jervis report, parties favoring each
source were attempting to position themselves as well as possible. Promoters of Spot Pond
invited members of the city council to an extravagant reception and viewing of the pond, but the
viewing had precisely the opposite effect of what was intended because the pond happened to be
at its lowest level for the occasion. (The small quantity of water available from Spot Pond was
of course its primary drawback.) The group later claimed that the Long Pond faction had placed
large stones to obstruct the flow of water into the pond at the time of the event.

13
In the end, the report headed by John Jervis strongly supported the Long Pond proposal.
Shortly afterwards Josiah Quincy Jr., son of the mayor who had initially explored the
construction of a municipal waterworks, was elected mayor and promised to pursue water from
Long Pond. Under Mayor Quincy, the City of Boston had to obtain new authority from the state
legislature again to pursue its project. It was virtually unopposed (save only by the township of
Lowell), and in 1846 the legislature passed a new water act. A groundbreaking ceremony
marked the beginning of the project shortly afterwards. In 1848, Boston celebrated the arrival of
its new water with a tremendous festival and a large fountain gushing in the center of Frog Pond
in the Boston Common.
As a small side matter, there was discontent that the city’s future water source had such a
mundane name. A little research uncovered the pond’s previous Indian name: Cochituate.
Miraculously, the word’s etymology was discovered to mean “an ample supply of pure and soft
water, of a sufficient elevation to carry into the City of Boston, at a moderate expense” (Blake
1956). The mayor’s proposal that Long Pond should subsequently be known as Lake Cochituate
was enthusiastically embraced.
The completion of Boston’s municipally-owned water system created obvious problems
for the private companies that still existed. In late 1848 the old Aqueduct Corporation asked that
the city purchase its water rights and property, pleading that the city remember that private
shareholders had made great sacrifice for the public good. The mayor originally planned to offer
the corporation $100,000, but the city council knew that the old Aqueduct Corporation had no
alternative but to sell its rights and property to the city. The council was therefore willing to go
along with a purchase for $20,000, a price at which the company took great offense. The city
and the Aqueduct Corporation failed to reach an agreement, and the company continued serving
about 400 people who preferred water from Jamaica Pond to Cochituate water. In 1851, a new
city body administering the waterworks negotiated to purchase the company for $45,000, and the
company accepted the offer. This was effectively the end of private water in Boston, although
some years later the city did sell the rights to supply the City of Roxbury with water from
Jamaica Pond to a new private entity named the Jamaica Pond Aqueduct Corporation.

14
New York
Had it not been for the impediment of the Revolutionary War, a man named Christopher
Colles may have succeeded in building a water system in New York late in the eighteenth
century. After the war, numerous citizen movements pressed the city council to construct
waterworks for the city. In 1798, a proposal by a physician, scientist, and engineer named
Joseph Browne to dam and tap water from the Bronx River was seriously entertained. However,
Joseph Browne also proposed that a private entity carry the proposed project forward. The city
council considered it undesirable to place a private company in such a powerful position, so it
instead decided to request authority from the state legislature to build a water system itself.
Through clever maneuvering of state Assemblyman Aaron Burr, however, the bill that the state
legislature produced authorized a charter for a private water company instead. Ironically, it was
Alexander Hamilton whose advocacy then persuaded the city council to accept the bill as
produced by the state legislature. One of the main points that furthered its case was the
avoidance of enormous expense and taxpayer burden.
The Manhattan Company was then quickly incorporated; its new charter placed far fewer
requirements on it than did other contemporary private water company charters of the day (again,
courtesy of the efforts of Aaron Burr). The charter did stipulate, however, that if the company
did not provide a continuous source of “pure and wholesome” water for all citizens desiring it
within ten years, it would be dissolved. The other noteworthy feature of the charter was a
carefully hidden section that gave the company the legal right to use all “surplus” capital for
other purposes unrelated to water.
This obscure section of the charter opened the door for Aaron Burr to pursue banking
through the Manhattan Company, which had been his intention from the beginning. Bank
charters of the day were difficult to obtain through protracted political processes and were
limited in duration; the Manhattan Company’s charter had crept into existence below the
political radar and was unlimited in duration. Although some other members of the state
legislature apparently knew about the scheme, there was outrage when it was publicly
discovered. Burr lost his position in a subsequent election, but the company lived on despite
attempts of his political adversaries to undermine it.
15
To maintain its good-standing, it was clear that the Manhattan Company had to provide
water to some degree. The real question remained how adequate it would be. Despite serious
concerns about its purity, the company decided to tap groundwater with the use of wells and
pumps. Some water was flowing as early as 1800. Ironically, Joseph Browne was the lead
engineer of the project. Problems and complaints about irregular and unpredictable service
began almost immediately. The quantity of water provided was also inadequate for street
washing and gutter flushing, forcing the city to rely on older wells for this purpose. The
company provided free water to the city to fight fires, although its adequacy is unclear.
By 1804, the city council decided that the Manhattan Company’s supply was inadequate
to keep pace with city growth and began revisiting other proposals to draw water from more
distant sources such as the Bronx River. The company’s banking business was booming, so its
interest in water was waning even further. (Incidentally, by this time political and financial
troubles had forced Aaron Burr to sell most of his stock in the company, and he had been
removed from its board.) De Witt Clinton, mayor of New York at the time, proclaimed in 1808
that the company had not fulfilled the requirement of its charter (that it provide “pure and
wholesome” water for all citizens desiring it) and thought that given the difficulties and low
profitability of its water operations, it might be willing to sell its waterworks to the city. This
would of course require the state legislature to amend the original charter for it to continue with
its banking activities. Interestingly, De Witt Clinton was also one of the Manhattan Company
bank’s directors. One of the points upon which negotiations hinged was the price to be paid to
the Manhattan Company to acquire its waterworks. Many on the city council believed that it
operated at a loss, although its books suggested that it earned an annual return of just under 7
percent on its original investment.
With this issue unsettled, the city council made an application to the state legislature to
alter the Manhattan Company’s charter and to receive authority to purchase the waterworks.
Amazingly enough, in addition to serving as mayor and as a bank director, De Witt Clinton was
also a prominent state senator representing a southern district of New York. The legislature
acquiesced to these requests. The Manhattan Company was given the right to lease or sell its
waterworks and rights, the length of time it had to provide “pure and wholesome” water for all
citizens desiring it was extended to 20 years, and its new charter gave it the right to continue
with its banking and other activities even after divesting itself of its waterworks. Additionally,

16
the charter would continue to be perpetual until the company sold the waterworks, at which point
it would last for 30 years following the sale. The company therefore naturally tried to postpone
the sale as long as possible.
Complaints about the company’s water service were constant. Portions of the city (the
ones with pipe infrastructure) received no water at all for prolonged periods of time. Repairs
were made only to stave off crises of public outrage. Water availability to fight fires was so poor
that public funding was used to build cisterns for collecting rain water to be used to combat fires.
Fires and disease epidemics (despite a poor understanding of the basis of disease) continued to
push the inadequacy of water supply to the political forefront; public opinion was squarely
opposed to the service provided by the company.
In subsequent years, the alliance between the Manhattan Company and the city
government deteriorated. The city was highly indebted to the bank, and to meet its obligations it
eventually resorted to selling off its stock in the company. De Witt Clinton himself also slowly
sold his company stock, and in 1813 he declined to be re-elected as a bank director. By 1820, De
Witt Clinton was governor of New York, and both he and the state legislature supported drawing
water for New York City from upland rivers. But the city council continued to be conflicted
about how to proceed.
In 1823, after several years of surveys and considering its options, the city council
supported another private initiative to charter the New York and Sharon Canal Company to build
a waterway from Sharon, CT to the Hudson River to join with a proposed canal to be built from
Sharon to the Housatonic River. The state legislature approved the measure. Another private
proposal to charter the New York Waterworks Company also gained momentum, alarming both
the Manhattan Company and the Sharon Canal Companies. Although its charter was eventually
approved, it was believed to be flawed because the Manhattan Company held exclusive rights to
groundwater under Manhattan and the Sharon Canal Company held exclusive rights to surface
water in Westchester County. The Manhattan Company clearly had the most to lose because of
its profitable banking activities. Although it was unwilling to invest in drawing water from
distant rivers, it did begin to seek new groundwater supplies by drilling a new well and began
replacing its wooden pipes with iron ones.
To add to the confusion, a new report claimed that the water supplies of Rye Pond and
the Bronx River, upon which both the New York Waterworks Company and Sharon Canal

17
Company projects depended, was inadequate to meet the needs of New York City. After 1830,
the water demand in New York had grown so much that serious attention began shifting from the
Bronx River to the Croton River. Previous consideration of the Croton was limited by the
daunting expense required to reach it.
With its eye on mounting a challenge to the Manhattan company, that year the city
council appointed a committee to investigate whether or not the company had the right to
discontinue providing water for fire plugs at will or any obligation to pay for its damage to
streets and sidewalks – and more generally, if it had met the conditions of its original charter.
The committee found that water was available to only one-third of the paved and built city and
that its failure to seek more copious sources was inexcusable – in short, that it had not met its
obligations. An additional blow to the Manhattan Company was a communication to the city
council by a body of well-known and respected doctors and chemists. It concluded that all of the
groundwater in Manhattan was horribly contaminated with filth from graveyards and privies.
By 1833 it was clear that the city was going to build its own waterworks, and after a
considerable amount of debate and conflicting geological surveys and engineering reports, the
Croton was agreed upon as the most promising source. The Manhattan Company therefore
offered to sell all of its water rights to the city, leaving the price open to negotiation. After a
devastating fire in 1836, the city opened negotiations with the company to obtain a temporary
supply for fighting fires while the Croton Aqueduct was under construction. No agreement was
ever reached, however. At the same time, the state legislature found that the company had
violated its charter.
In the end the Manhattan Company’s rights were never purchased because with the
opening of the Croton Aqueduct in 1842, they were essentially not needed. The company had
some legal claim to the groundwater in Manhattan, but the new source did not draw on
Manhattan groundwater at all. When Croton water began flowing into the city, the company
simply lost its customers. Ironically, it retained its wells for decades afterwards – not because it
was actively providing water from them, but because it feared future challenges to its charter.

18
Municipal Finance and Public Ownership of Water Systems: History and Evidence
In the cases of Boston and New York, city government intervened to provide water when
existing private companies failed to perform well – which generally meant failure to provide a
sufficient supply to meet growing water demand. But Boston and New York were pre-eminent
population centers in early America that were probably not representative of the typical
American city. Growth in water quantity in the typical city occurred later and coincided with the
sharpest rise in public waterworks ownership. One city in which this transformation occurred
after the turn of the century – New Orleans – followed a course similar to that in Boston and
New York (Troesken and Geddes 2003). A private company began providing New Orleans with
water in 1878, but the company refused to extend its pipes to outlying areas of the city.
Moreover, the water it did actually deliver was turgid and unfiltered. The city subsequently
petitioned the Louisiana legislature to revoke the company’s charter and eventually acquired the
water system in 1908. Shortly afterwards the system was expanded dramatically, and filtration
plants were constructed.
Figure 1 and Table 1 show that public ownership had been increasing throughout most of
the nineteenth century, but that this trend accelerated from 1890 (when 43 percent of waterworks
were publicly owned) through the 1920s (when 70 percent were publicly owned) – which
coincides precisely with rapid growth in the number and adequacy of water systems. In
particular, the period of fastest public ownership growth (ignoring the first few decades of the
nineteenth century, when the absolute number of waterworks was very small) was the 1890s.
Figure 2 and Table 1 show that the number of waterworks in the United States accelerated
around 1890. During 1890-1900 decade, the number of miles of water mains in major cities with
existing water systems also nearly doubled (Figure 3).6 This section first provides a brief
overview of the development of local public finance during the nineteenth century and then
presents suggestive evidence that it was the emergence of municipal bond markets that made
water system improvements possible.
6 This is true in major cities for which data is readily available.

19
Local Public Finance during the Nineteenth Century
Although the precise date of the first municipal bond issuance in the United States is
unknown, there were very few in the early nineteenth century. New York City issued its first
securities around 1812, and bonds to support the construction of the Croton Aqueduct were
issued in 1837 and 1838. Between 1830 and 1850, municipal indebtedness grew rapidly in both
total and per capita terms (see Table 2 and Figure 4) – but almost exclusively in the largest cities.
As Table 3 shows, at least 93 percent of all city debt on record in 1843 (the first year for which
these statistics are available for all cities) was issued by major population centers (Hillhouse
1936).
The explosive growth of municipal debt in the middle of the century was probably
attributable to restrictions placed on state debt. Following financial difficulties during the
depression of 1837 and a series of state defaults around 1840, the landscape of local public
finance changed radically. Many state legislatures amended their constitutions to prohibit state
borrowing for costly canals, turnpikes, railroads, and other improvements. As states were
increasingly constrained by pay-as-you-go financing, municipal debt arose to fill the gap
between what could be afforded and what was thought to be needed. (Not until after World War
I were many state constitutional restrictions on debt officially relaxed.) A large share of
municipal debt during this period was for railroad construction. This era of expansion peaked in
the late 1860s and early 1870s. Between 1868 and 1873, the net bonded debt of New York
tripled; between 1867 and 1873 the bonded debt of Chicago also tripled. Debt tripled in Boston
from 1868 to 1874; Cincinnati’s debt grew by five times from 1868 to 1876, and Cleveland’s
debt grew by twelve times from 1867 to 1877 (Griffith 1974).
After these years of unchecked borrowing and spending, local economies turned sour
during the panic of 1873. What ensued was the largest series of municipal bond defaults to that
date. (Earlier economic slumps had caused states to default on their obligations, but
municipalities generally did not have much debt during these downturns - see Grinath, Wallis,
and Sylla, 1997). The number of bond issues held void rose from 35 in 1870 to 101 in 1880
(Hillhouse 1936).7 An estimated one-fifth of all municipal obligations could not be met
following this depression; many of these municipal defaults during the 1870s were associated
7 Data on the total number of bond issues in these years is not readily available.

20
with railroads. The panic of 1873 and its ensuing debt problems were especially severe in
southern cities struggling under Reconstruction. Some renegotiated their debt, while others gave
up their charters or went into receivership (Griffith 1974).
Following the panic of 1873 and unprecedented revelations of widespread government
corruption, many states and cities introduced new municipal debt limitations as a percentage of
total property assessments. New York's bonded debt peaked in 1876 and fell by a quarter during
the next decade (Teaford 1984). Other cities followed a similar pattern. Strikingly, Detroit's net
debt fell from $961,000 in 1875 to $12,000 in 1885 (Teaford 1984). In subsequent years,
however, these restrictions were circumvented in several ways. One was the passage of state
constitutional amendments that one historian attributes to the municipal capture of state
legislatures (Teaford 1984). These amendments allowed exceptions for a variety of special
ventures including “self-supporting” municipal enterprises like waterworks (Griffith 1974).
Another was the creation of special districts that were not technically a part of city government.
Many local water authorities were incorporated in this way to be exempt from debt restrictions
(Monkkonen 1995).
The panic of 1893 also contributed to the development of municipal bond markets and
their ability to fund public waterworks. Businesses were hit the hardest, while municipal
governments suffered less (Griffith 1974). Consequently, municipal bonds became relatively
more attractive to investors. Interest rates fell, and cities were able to borrow large amounts to
continue financing their growth. To quote one financial historian, “[m]unicipalities never
enjoyed such a favorable market for their securities, for by the 1890s no investment was as sound
as a municipal bond” (Teaford 1984). The granting of “home rule” to city governments by state
legislatures also broadened their ability to borrow and spend. However, very little of this
occurred before the turn of the century (Griffith 1974).
Evidence on Local Public Finance and the Supply of Water
One explanation for rapid water system expansion at the end of the nineteenth and
beginning of the twentieth centuries is the development and growing sophistication of local
public finance. Private water companies could not afford to build systems to serve entire
municipal populations. Only the largest cities could afford adequate water supplies until the

21
means for substantial borrowing were developed. Waterworks were exorbitantly expensive,
even in comparison with other municipal utilities. In 1915, the mean value of municipal
waterworks exceeded annual city government revenue, as shown in Table 4. Mindful of the fact
that many water systems were built long before 1915, the expenses of constructing a water
system relative to annual municipal receipts were undoubtedly larger than shown here.
Available statistics suggest that in 1905, waterworks were the largest debt line item of municipal
government (US Bureau of the Census 1907).
Several different strands of evidence support this view. The timing of municipal
investments in water provision by city size provides a first piece of evidence. Figure 5 shows
municipal ownership over time by city size among all cities with publicly-owned water systems
in 1915. In general, large cities municipalized their waterworks earlier than smaller ones. For
example, all of these cities with over 500,000 people in 1915 had a public water system by the
end of the 1850s, while the share of smaller cities with public water systems at that time was
below 20 percent.8
If the municipal finance explanation were correct, one would also expect to see rapid
growth in debt and revenue among small cities relative to large cities at the end of the nineteenth
century (when Figure 5 suggests that public ownership was rising faster among the smaller
cities). Figures 6 and 7 show that this is exactly what occurred. In the period from 1880 to
1902, debt in small cities grew by about one-third while debt in the largest cities fell by more
than 10 percent.9
Of course this growth in municipal debt could have been due to either supply or demand
factors. Our supply-side explanation is that financial innovation and investor interest made it
possible for smaller cities to borrow much more at this time than earlier. Alternatively, it may
have been that cities suddenly decided that they needed to borrow more and thus demanded
additional debt. Although not readily available by city size, municipal bond yields during the
late nineteenth century provide some means of distinguishing between supply and demand
explanations for growth in municipal debt. The supply explanation implies that yields should 8 It is possible that city size responded to public investments in water, but readily available statistics do not allow for the bi-directionality of this relationship to be disentangled. See subsequent paragraphs for further discussion. 9 The cities used to construct Figures 6 and 7 were selected as follows. First, states with major population centers were chosen: California, Connecticut, Georgia, Illinois, Indiana, Kentucky, Louisiana, Maryland, Massachusetts, Michigan, Minnesota, Missouri, Nebraska, New Jersey, New York, Ohio, Pennsylvania, Rhode Island, Tennessee, Texas, and Wisconsin. All cities with a population of 15,000 or more in 1900 and with debt statistics in 1880, 1890, and 1902 were then chosen within these states.

22
have fallen with the increase in borrowing, while the demand explanation implies that yields
should have increased.
Figure 8 shows mean nominal and real municipal bond yields in New England from 1857
to 1913.10 In general, real bond yield fluctuations coincided with the business cycle. Real yields
rose and then fell dramatically following the panic of 1873 and did not return to this level by the
end of the century. Although there was a smaller increase in the middle of the 1890s, this is
presumably related to the panic of 1893. With the exception of business cycle fluctuations, real
yields were low during the late 1890s and early twentieth century as municipal borrowing
increased and municipal involvement in water accelerated. Lower yields during this period are
generally consistent with a supply-side explanation that emphasizes the development of
municipal bond markets. Evidence on alternative demand-oriented explanations is examined in
the next section, but these factors should be reflected in the time series of municipal bond yields
as well. The absence of high and rising real yields during this period of growing debt and
increasing public involvement in water does not support them.
The decline in municipal ownership of water systems in the 1880s also lends some
support to the municipal finance view. In the wake of the depression of 1873, the corruption
scandals exposed at roughly the same time, and the subsequent rise in municipal bond issues held
void, borrowing declined in all cities (shown in Figures 6 and 7 for 1880 to 1890) as states
imposed tight restrictions on municipal indebtedness. Although these indebtedness restrictions
were only temporary obstacles, they were accompanied by the only decline in public waterworks
ownership during the entire nineteenth century (see the decline from 1880 to 1890 shown in
Figure 1).
Alternative Explanations: Changes in Value (or Perceived Value)
One set of alternative explanations for the rapid expansion of water systems and increase
in municipal ownership is that the value (or perceived value) of water systems increased. This
10 Nominal municipal bond yields shown in Figure 8 are taken from Macaulay (1938) and can also be found in NBER's Macro History Data Series #13020. Real bond yields were calculated using the implicit GNP deflator provided in Balke and Gordon (1989).
23
would have increased demand for water services, and particularly in the presence of positive
externalities, local governments may have been the appropriate providers of water.
Externalities and New Knowledge about Disease
There are clearly large external benefits of water supplies not captured by private water
companies. The most obvious ones are disease reduction and improved capabilities of
combating fires (a less-clear one is that water systems were an economic stimulus through other
pathways). On the surface, it is unclear why the existence of externalities would explain a sharp
rise in municipal waterworks ownership beginning around 1890. Fires and epidemic infectious
diseases had been serious problems in cities for as long as cities have existed. It is possible,
however, that the bacteriological revolution of the 1870s and 1880s may have provided a new
impetus for concerns about disease externalities. As knowledge of the basis of waterborne
diseases became clearer, concerns about the socially-inefficient incentives of private companies
may have intensified.
But there are several reasons that call this line of reasoning into question. One is that
dirty water was believed to be causally linked to disease long before the bacteriological
revolution. The first demonstration of the link between unclean water and disease was John
Snow’s famous demonstration of how cholera spread from a single water pump in London in the
1850s. Snow had premonitions of the germ theory, but it took several more decades for the
theory to be fully articulated.
The prevailing theory at the time, the miasma theory of disease, held that a variety of
illnesses are the result of poisonous, malevolent vapors (“miasmas”) that are offensive to the
smell (Anderson 1984, Duffy 1990). The widespread acceptance of the miasma theory might
have been based on Pavlovian learning. People exposed to foul odors were more likely to get
sick, foul-smelling areas tended to have more sick people, and more people seemed to get sick
during the summer seasons during which offensive odors were more common. The leap of logic
from correlation to causation led to misdirected sanitary interventions – and some successful
ones as well.
The externality argument is also generally difficult to reconcile with the empirical
observation that private water companies were more likely to possess expensive water filtration

24
plants than were publicly-owned companies early in the twentieth century (Troesken and Geddes
2003). And private water companies were ostensibly legally liable for damages attributable to
large waterborne disease outbreaks (Troesken and Geddes 2003), although it is not clear how
enforceable this liability was in practice.
Population Density
As large numbers of Americans migrated to urban areas from the countryside, the
population density of cities may have increased. Urban slums certainly emerged in the late
nineteenth and early twentieth centuries. If the population density of cities grew rapidly,
deteriorating public health conditions may have increased the demand for water. Similarly, the
positive externalities of municipal water systems may have grown, giving local governments
stronger reasons for getting involved.
Although reliable statistics on municipal population density before the 1890s are
generally not available, there appears to have been no abrupt increase that coincided with water
system growth. Data from a consistent panel of 119 cities from 1890 to 1950 suggests that the
only large increase in municipal population density occurred between 1910 and 1920 (Kim 2002)
– 20 to 30 years after major waterworks improvements began.
Alternative Explanations: Changes in Costs
Natural Monopoly
The cost structure of public utility provision is generally characterized by declining
marginal costs. Hence, one firm could in principle serve an entire market most efficiently.
Monopoly power held by a profit-maximizing firm of course commonly leads to inefficient
service provision. As will all monopolists, a monopoly water supplier will raise prices to the
profit-maximizing level and will restrict quantity to support those prices. Public ownership may
be the natural response in the view of local governments.

25
However, a natural monopoly explanation fails to account for either the timing of the
increase in municipal waterworks ownership or for why waterworks were increasingly city-
owned while gas and electrical utilities were not. On the timing, it is not clear why either
welfare losses or local government losses should have suddenly accelerated around 1890,
producing the observed increase in municipal waterworks ownership. Additionally, the cost
structures of gas and electricity provision were similar, but these utilities were rarely privatized.
Table 5 shows that gas companies were almost exclusively private from 1890 to 1920 when
public waterworks ownership was rising most rapidly. Fewer statistics for electric companies are
available, but around the turn of the century, nearly 70 percent of the 952 electric companies in
the United States were privately owned (U.S. Commissioner of Labor 1899).
Contracting Failures
Although some dimensions of water provision can easily be observed and monitored, or
stipulated ex ante in a contract (e.g., water pressure, rates, etc.), many others cannot. For
example, it is difficult to specify in advance that certain new population centers not yet in
existence should be served or what new water sources should be tapped to meet future demand
growth. As the provision of water became increasingly complex and regulatory requirements
became more onerous, contracting costs may have reduced the profitability of the water business,
making it less attractive to private firms.
There are some suggestive findings that litigation against private water companies was
positively related to municipal take-over during the period of rapid waterworks municipalization
(Troesken and Geddes 2003). It is unclear why contract incompleteness would have become
more problematic at the end of the nineteenth century, but there is some historical suggestion that
contracts became more elaborate – and potentially more costly – shortly before 1900. For
example, the National Municipal League's model Municipal Corporation Act was drafted in 1899
and subsequently adopted by many cities (Webber and Wildavsky 1986). However, a
contracting cost explanation does not square with the continuation of predominantly private
ownership in gas and electricity.
Hold-up is another potential contracting difficulty. City governments may have had
difficulty credibly committing not to expropriate the enormous infrastructure investments made

26
by private water companies. Following the bacteriological revolution as technological
innovations to combat waterborne disease were developed (such as filtration), the investments
required to build and operate water systems increased substantially. Hence losses (or fears of
losses) due to municipal expropriation could have potentially grown near at the end of the
nineteenth and beginning of the twentieth centuries.
There is some evidence that municipal takeovers of private water systems were positively
related to the extensiveness of a water system and negatively related to financial difficulties of
private water companies (Troesken and Geddes 2003). One interpretation of this correlation is
that cities were more likely to seize private waterworks that promised greater rents. Fear of
expropriation could have also induced private companies to rationally under-invest in their water
systems, resulting in inadequate service provision and an additional rationale for municipal
ownership.
Countering this hypothesis is the fact that private water companies were more likely than
public ones to own expensive filtration facilities. According to an 1899 federal government
survey of water companies, 19 percent of the private companies had filters while only 6 percent
of the public ones did (Troesken 1999). It is also unclear why municipal seizures or fear of
expropriation would have risen in the 1890s and early twentieth century if it was truly a period in
which corruption in municipal government was actually falling while contracts were growing
more sophisticated. Moreover, the absence of municipal takeovers of other public utilities (gas
and electricity) during this period also seems to contradict this view.
Finally, a recent analysis cites a positive cross-sectional correlation between population
density and public ownership as evidence that contract evasion and appropriation problems were
responsible for municipal control (Masten 2004). However, this would also be consistent with
larger cities (which were typically denser) having greater financial means to build or expand
municipal water systems.
Corruption Costs and Administrative Reform
Administrative reform that began at the very end of the nineteenth century may have
reduced the corruption costs associated with municipal ownership of waterworks. As a number
of city government scandals were exposed in the 1870s, cities began experimenting with

27
administrative reforms that aimed to reduce corruption. These reforms appear to have been at
least partially responsible for the creation of standing boards to perform specialized functions
like operating water systems. Board members were surely corruptible, but probably less so than
city council members (who operated municipal water systems before professional boards
emerged). It is not clear if delegation of authority to city boards was actually purposeful (to
reduce corruption) or coincidental (driven by the increasingly technical and complex nature of
city functions).
The problem with a corruption costs and administrative reform explanation is that the
sharpest rise in public waterworks ownership occurred in the 1890s. Much of the effective
administrative reforms came in the early decades of the twentieth century at the dawn of the
Progressive Era. This was a primary objective of the National Municipal League's model
Municipal Corporation Act that was first drafted in 1899 (Webber and Wildavsky 1986).
Although corruption was surely present in historical water supply and management (McCarthy
1987), it seems to have relatively little direct bearing on public ownership or the expansion of
water systems.
Growth in the Supply of Municipal Engineers
A final possibility is that exogenous growth in the supply of municipal engineers made it
possible for cities to operate water systems on their own. City governments may have desired to
do so much earlier (either out of self-interest or public interest), but they simply lacked the
human resources to do so.
The primary piece of evidence against this explanation is the fact that the public sector
was in large part responsible for engineering and applied science training in the late nineteenth
century. This means that increases in the number of engineers were probably not exogenous
with respect to major public works projects.11 The Morrill Land Grant Act provided large tracts
of federal land to states to endow and support institutions of higher education specializing in
agriculture and mechanical arts (Goldin and Katz 1999). During the 1870s and 1880s, the largest
11 An exogenous increase in the supply of engineers that accelerated the construction of waterworks would also be reflected in rising municipal bond yields as cities demanded additional debt. Figure 8 shows no clear evidence of this.

28
number of new engineering programs were established at land grant institutions (Edelstein
2002).
Historical data on the output of new engineers in the United States by area of
specialization are not readily available. Data on the output of civil engineers in New York State
(shown in Table 6) suggests that the largest surge in the production of engineers occurred after
the turn of the twentieth century. If the training of engineers in New York over time is
representative of the national trend, growth in the supply of engineers does not hold much
promise for explaining the rapid expansion and increasing public ownership of waterworks.12
Conclusion
The quantity of piped water supplied in American cities grew dramatically near the turn
of the twentieth century, and local government ownership seems to have been a driving force
behind this surge in water system construction and expansion. Governments may have wanted to
be involved earlier – and in fact were in the largest cities – but financial constraints appear to
have prevented them from doing so. As innovation in local public finance made it easier for
smaller cities to borrow, many American cities did in fact purchase or build waterworks. Even
larger cities that already owned water systems were able to finance massive expansions to
previously unserved neighborhoods. In an era of rampant corruption in local government
(Steffens 1957), it is striking that government involvement in such a costly sector as water seems
to have advanced the public interest considerably (if not the private interests of politicians as
well). This observation is consistent with those of others that corruption – although undesirable
and inefficient – can in fact go hand-in-hand with policies that improve public welfare as corrupt
politicians seek both political support and a robust economy to exploit (Menes 2003).
12 New York State most likely led many of the other states.

29
References Anderson, Letty. 1984. “Hard Choices: Supplying Water to New England Towns.” Journal of Interdisciplinary History 15, no. 2: 211-234. Anderson, Letty. 1988. “Fire and Disease: The Development of Water Supply Systems in New England, 1870-1900.” In Joel Tarr and Gabriel Dupuy (eds.), Technology and the Rise of the Networked City in Europe and America. Philadelphia, PA: Temple University Press. Baker, M. N. 1948. The Quest for Pure Water: The History of Water Purification from the Earliest Records to the Twentieth Century. New York, NY: The American Water Works Association. Balke, Nathan S. and Robert J. Gordon. 1989. “The Estimation of Prewar Gross National Product: Methodology and New Evidence.” Journal of Political Economy 97, no. 1: 38-92. Blake, Nelson Manfred. 1956. Water for the Cities: A History of the Urban Water Supply Problem in the United States. Syracuse, NY: Syracuse University Press. Bordo, Michael and William G. Dewald. 2001. “Bond Market Inflation Expectations in Industrial Countries: Historical Comparisons.” NBER Working Paper #8582. Bordo, Michael and Anna Schwartz. 1997. “Monetary Policy Regimes and Economic Performance: The Historical Record.” NBER Working Paper #6201. Carter, Susan, Scott Gartner, Michael Haines, Alan Olmstead, Richard Sutch, and Gavin Wright, eds. 2005 (forthcoming). Historical Statistics of the United States: Millennial Edition. New York: Cambridge University Press. Cutler, David and Grant Miller. 2004. “The Role of Public Health Improvements in Health Advances: The 20th Century United States.” NBER Working Paper #10511. Duffy, John. 1990. The Sanitarians. Urbana and Chicago, IL: University of Illinois Press. Edelstein, Michael. 2002. “The Production of Engineers in New York Colleges and Universities, 1800-1950: Some New Data.” Unpublished manuscript, City University of New York. Galishoff, Stuart. 1980. “Triumph and Failure: The American Response to the Urban Water Supply Problem, 1860-1923.” In Martin Melosi (ed.), Pollution and Reform in American Cities, 1870-1930. Austin, TX and London: University of Texas Press. Goldin, Claudia and Lawrence F. Katz. 1998. “The Shaping of Higher Education: The Formative Years in the United States, 1890 to 1940.” NBER Working Paper #6537.

30
Goldin, Claudia and Lawrence F. Katz. 1999. “The Shaping of Higher Education: The Formative Years in the United States, 1890 to 1940.” Journal of Economic Perspectives 13, no.1: 37-62. Griffith, Ernest S. 1974. A History of American City Government: The Conspicuous Failure, 1870-1900. New York, NY: Praeger Publishers. Grinath, Arthur, John Wallis, and Richard Sylla. 1997. “Debt, Default, and Revenue Structure.” NBER Historical Working Paper #97. Hillhouse, A. M. 1936. Municipal Bonds: A Century of Experience. New York, NY: Prentice-Hall. Kim, Sukkoo. 2002. “The Reconstruction of the American Urban Landscape in the Twentieth Century.” NBER Working Paper #8857. Macaulay, F. R. 1938. The Movements of Interest Rates, Bond Yields, and Stock Prices in the United States since 1856. New York: National Bureau of Economic Research. Masten, Scott E. 2004. “Public Utility Ownership in 19th Century America: The 'Aberrant' Case of Water.” Mimeo, University of Michigan Business School. McCarthy, Michael P. 1987. Typhoid and the Politics of Public Health in Nineteenth Century Philadelphia. Philadelphia, PA: American Philosophical Society. Melosi, Martin. 2000. The Sanitary City: Urban Infrastructure in America from Colonial Times to the Present. Baltimore, MD and London: The Johns Hopkins University Press. Menes, Rebecca. 2003. “Corruption in Cities: Graft and Politics in American Cities at the Turn of the Twentieth Century.” NBER Working Paper #9990. Monkkonen, Eric H. 1995. The Local State: Public Money and American Cities. Stanford, CA: Stanford University Press. Steffens, L. 1957. The Shame of the Cities. Reprint, New York, NY: Hill and Wang. Teaford, J. 1984. The Unheralded Triumph: City Government in America, 1870-1900. Baltimore, MD: Johns Hopkins University Press. Troesken, Werner. 1997. “The Sources of Public Ownership: Historical Evidence from the Gas Industry.” Journal of Law, Economics, and Organization 13, no. 1: 1-25. Troesken, Werner. 1999. “Typhoid Rates and the Public Acquisition of Private Waterworks, 1880-1920.” The Journal of Economic History 59, no. 4: 927-948.

31
Troesken, Werner and Rick Geddes. 2003. “Municipalizing American Waterworks, 1897-1915.” Journal of Law, Economics, and Organization 19, no. 2: 373-400. United States Bureau of the Census. 1907. Statistics of Cities Having a Population over 30,000: 1905 (Special Reports). Washington, DC: United States Government Printing Office. United States Bureau of the Census. 1907b. Wealth, Debt, and Taxation. Washington, DC: United States Government Printing Office. United States Bureau of the Census. 1975. Historical Statistics of the United States: Colonial Times to 1970, Part 2. Washington, D.C.: United States Government Printing Office. United States Commissioner of Labor. 1899. Water, Gas, and Electric-Light Plants Under Private and Municipal Ownership. Washington, D.C.: United States Government Printing Office. Webber, Carolyn and Aaron Wildavsky. 1986. A History of Taxation and Expenditure in the Western World. New York, NY: Simon and Schuster.

Year Total Public Private Percent Public1830 45 9 36 201840 65 23 42 351850 84 33 51 391860 137 57 80 421870 244 116 128 481880 599 293 306 491890 1,879 806 1,073 431896 3,180 1,690 1,490 531924 9,850 6,900 2,950 70
Period Total Public Private Percent Public1830-1840 2.0 1.4 0.6 1.541840-1850 1.9 1.0 0.9 0.391850-1860 5.3 2.4 2.9 0.231860-1870 10.7 5.9 4.8 0.591870-1880 35.5 17.7 17.8 0.141880-1890 128.0 51.3 76.7 -0.601890-1896 216.8 147.3 69.5 1.711896-1924 238.2 186.1 52.1 0.60
Sources: Galishoff (1980), Melosi (2000)
Number of Waterworks
Mean Annual Change
TABLE 1The Evolution of Waterworks and Municipal Ownership
in American Cities, 1830 to 1924

Year Total Municipal Debt (Millions) Change Per Capita Municipal Debt Change1843 $625 -- $265 --1853 $4,208 $3,582 $963 $6991860 $4,055 -$152 $652 -$3111870 $6,629 $2,574 $669 $171880 $13,547 $6,917 $959 $2891890 $17,126 $3,579 $775 -$1841902 $31,899 $14,773 $979 $2041912 $60,310 $28,412 $1,355 $3761922 $77,678 $17,368 $1,357 $21932 $186,924 $109,245 $2,660 $1,303
Sources: Hillhouse (1936), Carter et. al. (2005), and authors' calculations
TABLE 2Growth of Real Municipal Debt, 1843 to 1932 (in 2000 Dollars)

City DebtNew York, NY $295,922,345Philadelphia, PA $70,915,707New Orleans, LA $39,982,622Boston, MA $33,757,045Baltimore, MD $29,989,809Cincinnati, OH $25,927,297Charleston, SC $24,097,285Savannah, GA $12,445,467Mobile, AL $11,667,284Albany, NY $9,909,959Troy, NY $8,210,311Detroit, MI $5,424,264Nashville, TN $2,642,424Rochester, NY $2,228,838Buffalo, NY $1,466,939Vicksburg, MS $1,137,162Providence, RI $507,652
All Other Cities $45,486,486
Sources: Hillhouse (1936), Carter et. al. (2005),and authors' calculations
TABLE 3Debt in Selected Cities, January 1843
(in 2000 Dollars)

Value of Water System Total Municipal Revenue Value/RevenueAll Cities Over 500,000 $569,727,688 $462,077,044 1.23
New York $350,004,152 $206,010,937 1.70Chicago $52,557,484 $80,622,887 0.65Philadelphia $30,000,000 $45,242,379 0.66
All Cities 300,000 - 500,000 $149,222,136 $146,467,942 1.02Buffalo $15,702,219 $15,184,834 1.03Los Angeles $36,058,144 $24,405,199 1.48Cincinatti $17,366,561 $13,785,166 1.26
All Cities 100,000 - 300,000 $186,574,699 $171,787,677 1.09Jersey City $12,448,453 $6,792,713 1.83Kansas City $8,967,124 $10,296,283 0.87Rochester $9,768,056 $7,408,794 1.32
All Cities 50,000 - 100,000 $93,665,860 $89,950,262 1.04Ft. Worth $3,937,893 $1,694,390 2.32Somerville $1,017,365 $1,916,006 0.53Harrisburg $2,487,150 $1,481,848 1.68
Sources: US Bureau of the Census (1907), US Bureau of the Census (1975)
TABLE 4 The Value of Water Systems and Annual Revenue in Selected
American Cities, 1915 (in 1915 dollars)

Year Number of Companies Number Publicly Owned Percent Publicly Owned1890 871 8 0.91900 896 15 1.71910 1282 122 9.51920 1008 45 4.5
Source: Troesken (1997)
TABLE 5Public Ownership of Gas Companies, 1890 to 1920

Decade Number of Civil Engineering Degrees Change1830-39 61 --1840-49 88 271850-59 124 361860-69 523 3991870-79 605 821880-89 712 1071890-99 973 2611900-09 2,001 1,0281910-19 3,330 1,3291920-29 2,446 -8841930-39 3,026 5801940-49 2,760 -266
Source: Edelstein (2002)
TABLE 6First Civil Engineering Degrees in New York State
by Decade, 1830-1949

Figure 1: Public Waterworks Ownership In American Cities During the Nineteenth and Early Twentieth Centuries
0%
10%
20%
30%
40%
50%
60%
70%
80%
1830 1840 1850 1860 1870 1880 1890 1900 1910 1920
Per
cent
of W
ater
Sys
tem
s P
ublic
ly O
wne
d
Note: Data available on the decade from 1830 to 1890 and for 1896 and 1924; all points in between are obtained by linear interpolation Sources: Galishoff (1980), Melosi (2000)
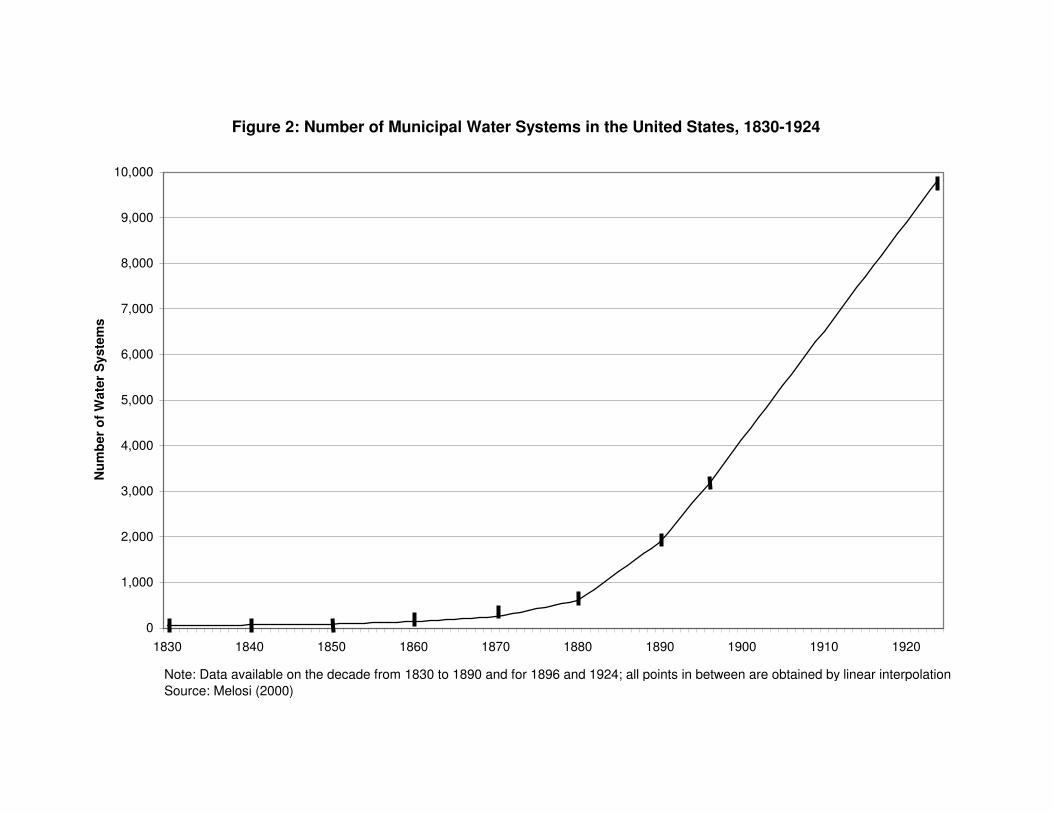
Figure 2: Number of Municipal Water Systems in the United States, 1830-1924
0
1,000
2,000
3,000
4,000
5,000
6,000
7,000
8,000
9,000
10,000
1830 1840 1850 1860 1870 1880 1890 1900 1910 1920
Num
ber
of W
ater
Sys
tem
s
Note: Data available on the decade from 1830 to 1890 and for 1896 and 1924; all points in between are obtained by linear interpolation Source: Melosi (2000)

Figure 3: Water System Growth in Selected Cities from 1889-92 to 1902
0
500
1,000
1,500
2,000
2,500
New York Chicago Philadelphia St. Louis Boston Baltimore Cleveland
Mile
s of
Wat
er M
ains
1889-1892
1902
Source: Teaford (1984)

Figure 4: Per Capita Municipal Debt in the United States, 1843 to 1932 (in 2000 Dollars)
$0
$500
$1,000
$1,500
$2,000
$2,500
$3,000
1843 1853 1860 1870 1880 1890 1902 1912 1922 1932
Per
Cap
ita M
unic
ipal
Deb
t (in
200
0 D
olla
rs)
Source: Hillhouse (1936), historical census populations 1840-1940 (http://www.census.gov/population/censusdata/table-4.pdf), and authors' calculations

Figure 5: Cumulative Share of Cities with Public Water Systems among Those with Public Systems in 1915 by Population and Decade
0%
10%
20%
30%
40%
50%
60%
70%
80%
90%
100%
1800s 1810s 1820s 1830s 1840s 1850s 1860s 1870s 1880s 1890s 1900s 1910-1915
Sha
re M
unic
ipal
ly-O
wne
d
>500,000300,000-500,000100,000-300,00050,000-100,00030,000-50,000
Source: United States Commissioner of Labor (1899)

Figure 6: Mean Per Capita Debt, 1880-1902, by City Size in 1902
$0
$10
$20
$30
$40
$50
$60
1880 1890 1902
Deb
t Per
Cap
ita
15,000-25,000 in 190225,000-50,000 in 190250,000-100,000 in 1902>100,000 in 1902
Source: United States Bureau of the Census (1907b)

Figure 7: Percent Change in Mean Per Capita Debt, 1880-1902, by City Size in 1902
-40%
-30%
-20%
-10%
0%
10%
20%
30%
40%
50%
60%
70%
1880-1890 1890-1902 1880-1902
Per
cent
Cha
nge
in P
er C
apita
Deb
t
15,000-25,000 in 190225,000-50,000 in 190250,000-100,000 in 1902>100,000 in 1902
Source: United States Bureau of the Census (1907b)

Figure 8: Nominal and Real Mean Annual Municipal Bond Yields in New England Cities, 1869-1913
0%
1%
2%
3%
4%
5%
6%
7%
1869
1871
1873
1875
1877
1879
1881
1883
1885
1887
1889
1891
1893
1895
1897
1899
1901
1903
1905
1907
1909
1911
1913
Per
cent
Yie
ld
nominalreal, $1870
Source: NBER's Macro History Data Series #13020; Balke and Gordon (1989)