n.c. department of transportation - connect ncdot · transportation, ferry, bicycle and pedestrian,...
TRANSCRIPT

Report to theJoint Legislative TransportationOversight Committee
December 14, 2010Lacy D. Love, PE
Condition Assessment and Funding Needsfor North Carolina’s Highway System
N.C. Department of Transportation

Biennial Report on Maintenance Requirements
G.S. 136-44.3
Requires NCDOT to:• Establish Performance Standards
• Project an annual cost to meet and sustain the performance
standards for routine maintenance and operations
• Develop a cost for Pavement and Bridge Preservation
• Develop a cost for Pavement and Bridge Rehabilitation
• Project System Condition at optimal funding for 7 years

• 79,185 road miles
• 160,630 paved lane miles
• 4,592 miles of unpaved roads
• 18,205 structures
• 88.1 M square feet bridge deck area
• 8,900 signals
North Carolina State Highway System 2009

North Carolina Freight Movement
In 2007:• 281 million tons moved across N.C.
annually
• 770,000 tons per day
In 2030:• Expect more than 324 million tons to
be moved across N.C. annually
• 15% increase
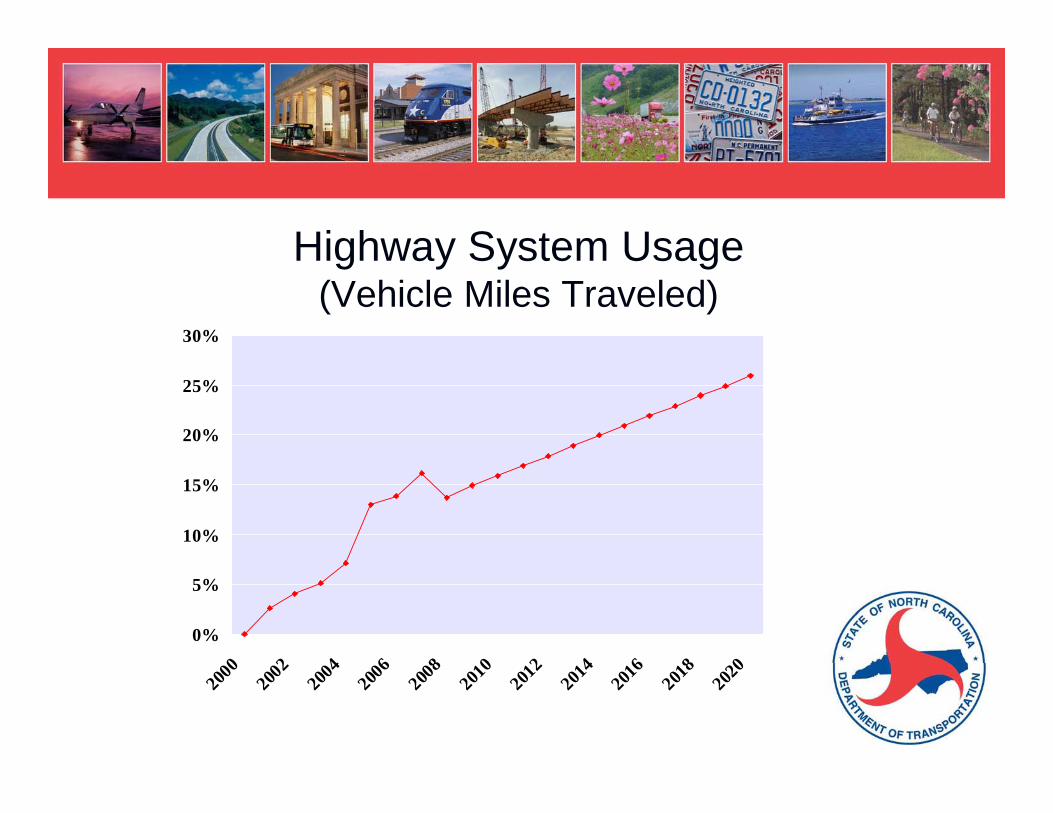
Highway System Usage(Vehicle Miles Traveled)
Gro
wth
0%
5%
10%
15%
20%
25%
30%
2000
2002
2004
2006
2008
2010
2012
2014
2016
2018
2020

History of Routine Maintenance Funding
Mill
ion
s
$0
$100
$200
$300
$400
$500
$600
$700
$800
2000 2001 2002 2003 2004 2005 2006 2007 2008 2009 2010
Year
Allocation CPI Adjusted
$292.0 million$83.0 million

History of Resurfacing Funding
$0
$50
$100
$150
$200
$250
$300
$350
2000 2001 2002 2003 2004 2005 2006 2007 2008 2009 2010
Year
Allocation CPI Adjusted
Mill
ion
s
$186.0 million$86.0 million
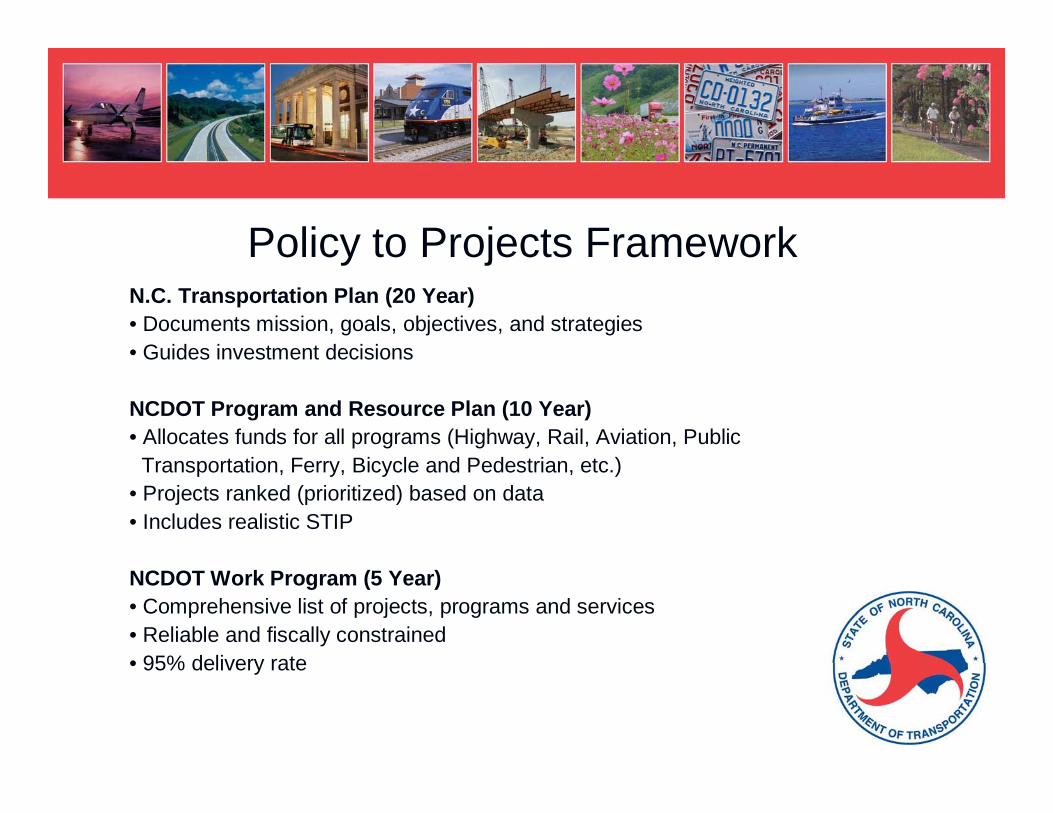
Policy to Projects FrameworkN.C. Transportation Plan (20 Year)• Documents mission, goals, objectives, and strategies• Guides investment decisions
NCDOT Program and Resource Plan (10 Year)• Allocates funds for all programs (Highway, Rail, Aviation, Public
Transportation, Ferry, Bicycle and Pedestrian, etc.)• Projects ranked (prioritized) based on data• Includes realistic STIP
NCDOT Work Program (5 Year)• Comprehensive list of projects, programs and services• Reliable and fiscally constrained• 95% delivery rate

Performance Based Management
Benefits include:• Moving towards uniformly constructed, maintained and
operated Highway System • Data driving decision making
• Increased focus on preventive maintenance• Targeting Level Of Service by system• Highest and best use of resources
• Challenging and rewarding workplace• Accountability

Performance MeasuresSets clearly defined outcomes such as:• No unsealed cracks in pavements • Bridge decks rating in good condition• No pipes blocked or damaged
• Pavement markings visible at night
Since 2008:• Reviewed targets to ensure accuracy • Made modifications as necessary• Simplified and streamlined

Transportation Reform:Measuring Performance

Rating the Condition of the Highway System
Pavement Condition Survey
Bridge Condition
Maintenance ConditionSurvey
Survey

Maintenance Condition Survey Results2010
State Average 2010
State Average 2010
State Average
FEATURE ELEMENT PERFORMANCE MEASURE Target Score Target Score Target Score
Unpaved ShouldersNo drop-offs greater than 3" and no shoulder higher than 2" 95 91 90 89 85 91
Ditches No blocked or eroded ditches 95 98 90 94 85 94
Crossline Pipe (Blocked) Greater than 50% diameter open 95 87 90 78 85 74
Crossline Pipe (Damaged) No damage or structural deficiency 95 93 90 95 85 91
Curb & Gutter (Blocked) No obstruction > 2" for 2 feet 95 97 90 96 85 96
Boxes (Blocked or Damaged) Not blocked > 50%, damaged or broken 95 82 90 87 85 85
Vegetation (Brush & Tree)Cleared to Freeway and Non-Freeway standards 90 90 85 85 80 80
Vegetation (Turf Condition) Areas free of erosion 95 84 90 83 85 86
Stormwater Devices (NPDES) Functioning as designed 90 94 90 94 90 94
Landscape Plant Beds Minimum condition score of 2 90 90 80 90 N/A N/A
Rest Areas & Welcome Ctrs Condition rating of 90 90 96 90 95 N/A N/A
Long Line Pavement Markings Present, visible 90 93 85 90 80 81
Words and Symbols Present, visible 90 73 85 85 80 77
Pavement Markers Present and reflective 90 84 85 59 N/A N/A
Ground Mounted Signs Visible and legible 90 94 85 91 85 85
Overhead Signs Visible and legible 92 93 85 80 85 100
NBIS Culverts Condition rating ≥ 6 85 86 85 86 85 89
Non-NBIS Culverts Condition rating = Good 80 84 80 74 80 56
Overhead Sign Structure Condition rating = Good 95 95 95 93 95 88
Totals 91.27 89.79 87.28 86.04 84.49 85.04
Interstate Primary SecondaryRoadway
DRAINAGE
ROADSIDE
TRAFFIC
BRIDGE

Performance Measure Trends(Maintenance Condition Survey Results)

Pavements

Pavement Preservation
• Seals off pavement surface
• Reconditions underlying asphalt
• Refreshes driving surface
Treatments include:• Crack sealing
• Chip seals• Slurry pavement
• Micro-surfacing

Contract Resurfacing
• Provides renewed
driving surface
• Improves ride quality• Reduces patching and
frequent maintenance

Pavement Rehabilitation
• Restores pavement condition
• Increases pavement structure
Treatments include:
• Mill and replace• Overlay with thicker lifts

Pavement Condition2000 - 2010
0
10
20
30
40
50
60
70
80
90
2000 2002 2004 2006 2008 2010
Per
cen
t
Target PCT_GOOD PCT_FAIR PCT_POOR
Interstate Primary
0
10
20
30
40
50
60
70
80
90
2000 2002 2004 2006 2008 2010
Per
cen
t
Target PCT_GOOD PCT_FAIR PCT_POOR
0
10
20
30
40
50
60
70
80
2000 2002 2004 2006 2008 2010
Per
cen
t
Target PCT_GOOD PCT_FAIR PCT_POOR
0
10
20
30
40
50
60
70
80
90
2000 2002 2004 2006 2008 2010
Year
Per
cen
t
Target PCT_GOOD PCT_FAIR PCT_POOR
Secondary Total

Bridges

Bridge Management Comprehensive Strategy
• Bridge PreservationFor bridges in good to fair condition
• Bridge RehabilitationFor bridges in fair to poor condition
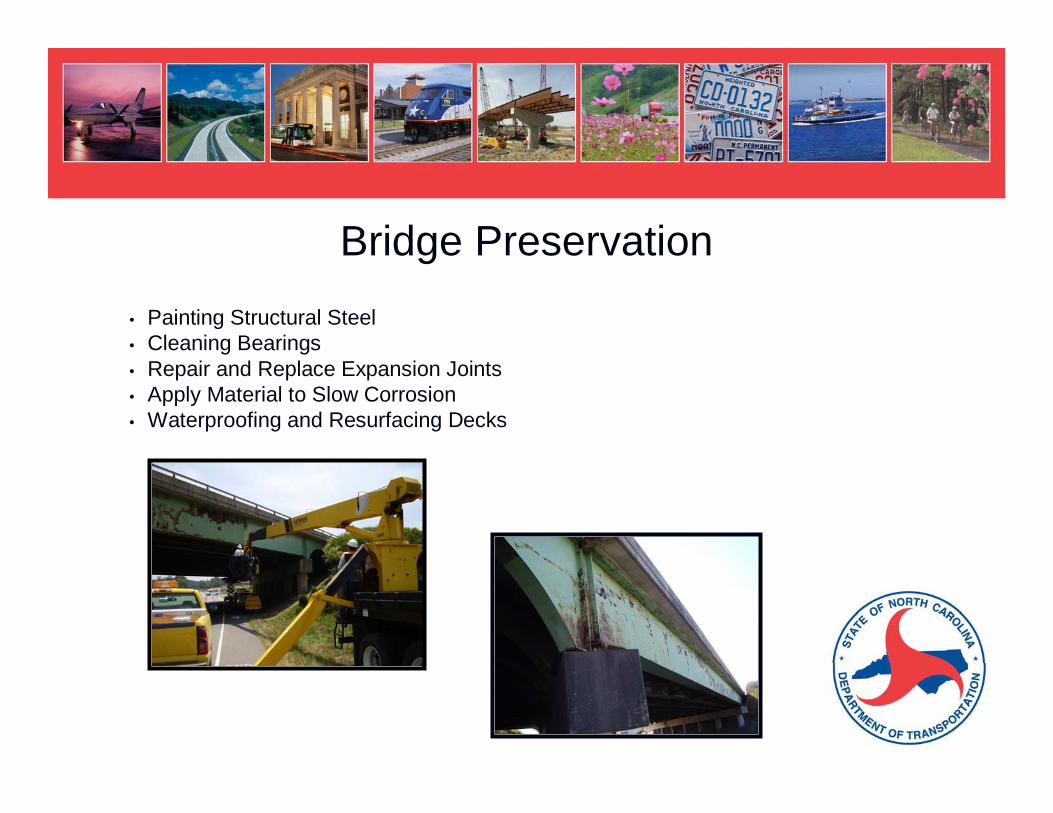
Bridge Preservation
• Painting Structural Steel• Cleaning Bearings• Repair and Replace Expansion Joints• Apply Material to Slow Corrosion• Waterproofing and Resurfacing Decks
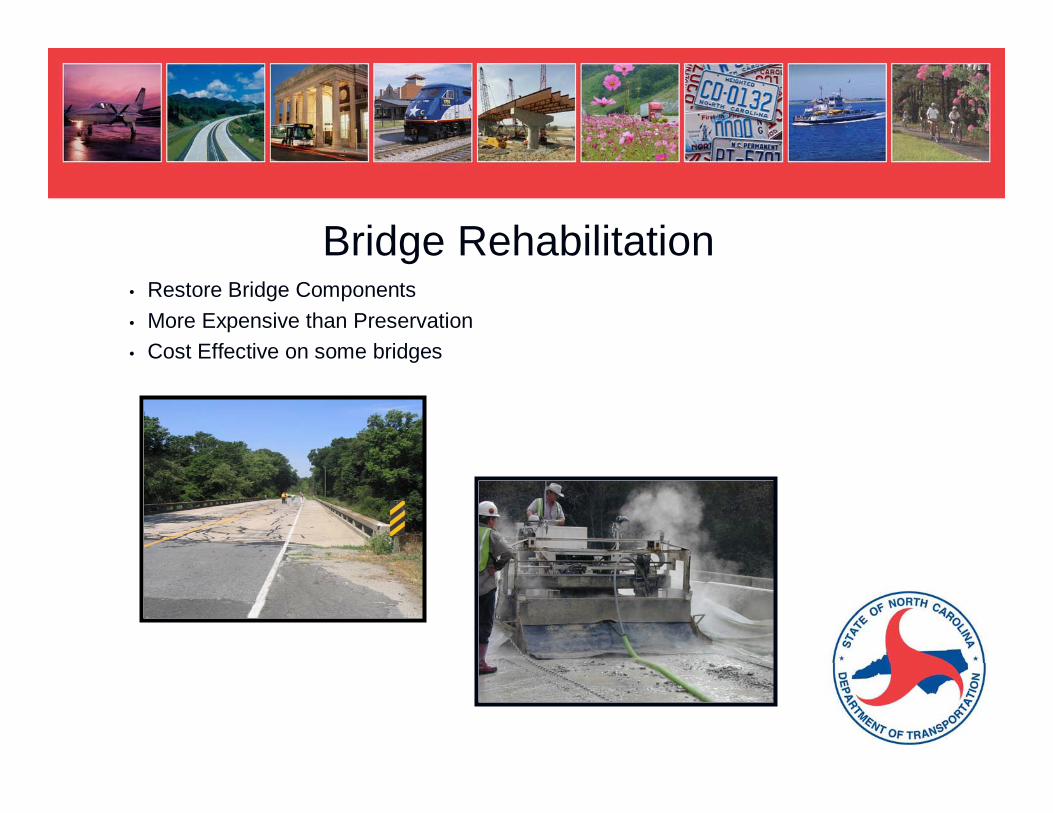
Bridge Rehabilitation• Restore Bridge Components
• More Expensive than Preservation• Cost Effective on some bridges
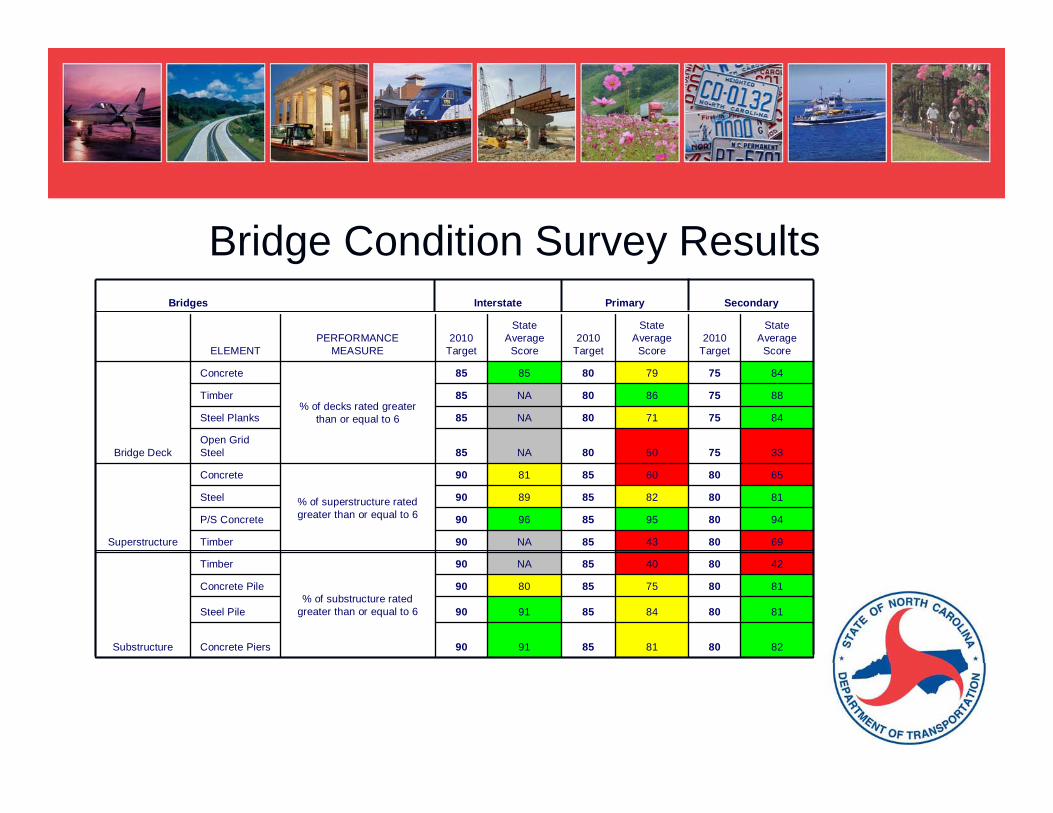
Bridge Condition Survey Results
828081859190Concrete Piers
818084859190Steel Pile
818075858090Concrete Pile
42804085NA90
% of substructure rated greater than or equal to 6
Timber
Substructure
69804385NA90Timber
948095859690P/S Concrete
818082858990Steel
658060858190
% of superstructure rated greater than or equal to 6
Concrete
Superstructure
33755080NA85Open Grid Steel
84757180NA85Steel Planks
88758680NA85Timber
847579808585
% of decks rated greater than or equal to 6
Concrete
Bridge Deck
State Average
Score2010
Target
State Average
Score2010
Target
State Average
Score2010
TargetPERFORMANCE
MEASUREELEMENT
SecondaryPrimaryInterstateBridges

0
10
20
30
40
50
60
70
80
2000 2002 2004 2006 2008 2010
Per
cen
t
TARGET PCT_GOOD
0
10
2 0
3 0
4 0
5 0
6 0
7 0
8 0
2 0 0 0 2 0 0 2 2 0 0 4 2 0 0 6 2 0 0 8 2 0 10
TARGET PCT_GOOD
Bridge Condition2000 – 2010Interstate
Secondary Total0
10
2 0
3 0
4 0
50
6 0
70
8 0
9 0
10 0
2 0 0 0 2 0 0 2 2 0 0 4 2 0 0 6 2 0 0 8 2 0 10
TARGET PCT_GOOD
0
10
2 0
3 0
4 0
5 0
6 0
7 0
8 0
9 0
2 0 0 0 2 0 0 2 2 0 0 4 2 0 0 6 2 0 0 8 2 0 10
TARGET PCT_GOOD
Secondary All Systems
Primary

Highway Operations
•8900 Traffic Signals Statewide
• Signal maintenance provides:
Improved safety
Reduction in delays
Reduced fuel consumption
Improved air quality

Highway Operations
• Overhead dynamic message boards
• Camera systems
• Speed detection devices
• Motorist Assistance Patrol

Infrastructure Health Index • Calculates an overall system score
• Measures NCDOT’s success for maintaining andimproving the health of the highway network
Weights asset categories• 25% for roadsides features• 35% for bridges
• 40% for pavements

Infrastructure Health Index
0.0
10.0
20.0
30.0
40.0
50.0
60.0
70.0
80.0
90.0
100.0
INTERSTATE PRIMARY SECONDARY COMPOSITE
System
Sco
re
Target Actual

American Reinvestment & Recovery Act of 2009 (ARRA)
• $735 million for North Carolina Highways and bridges
• Required to obligate 50% of funds within 120 days• Required to obligate remainder of funds within 1 year• $584 million of projects affect roadway and bridge maintenance
Expended $393 million to date
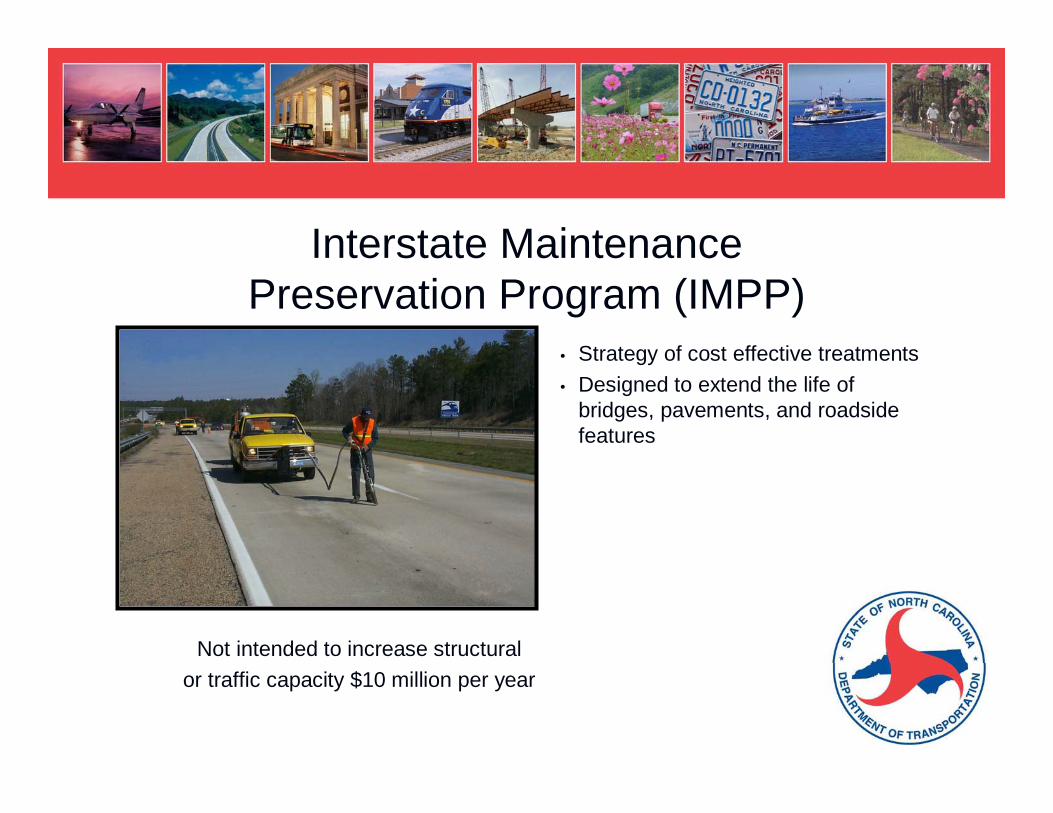
Interstate Maintenance Preservation Program (IMPP)
• Strategy of cost effective treatments
• Designed to extend the life of bridges, pavements, and roadside features
Not intended to increase structural
or traffic capacity $10 million per year

Alternate Funding(millions)
TIP Funds•Signal Preventive Maint. Program $ 20.0•Intelligent Trans. Sys./Incident Resp. $ 18.0
•Positive Guidance $ 6.0
•Bridge Preventive Maint. Program $ 5.0
•Interstate Maintenance $ 10.0
HB 1825 (Secondary Roads) estimate $ 70.0
Total $ 129.0

Maintenance Operational Improvements
• 47% of M&O Expenditures spent in the
private sector• LED replacement for signal bulbs• Signal preventive maintenance
• ITS (IMAP) initiatives• DOC litter pickup program• Winter anti-icing operations
• Low growing turf

Maintenance Funding NeedsFY 2011-2012 (millions)
Needs• Maintenance Operations $ 814.6• Disasters $ 15.0• Contract Resurfacing $ 330.0
• Pavement and Bridge Preservation $ 233.2Total Maintenance and Preserv. Needs $1,392.9
Alternate Maintenance Funds - $ 129.0Adjusted Maintenance Funding Needs $1,263.9
System Rehabilitation Needs $ 340.0
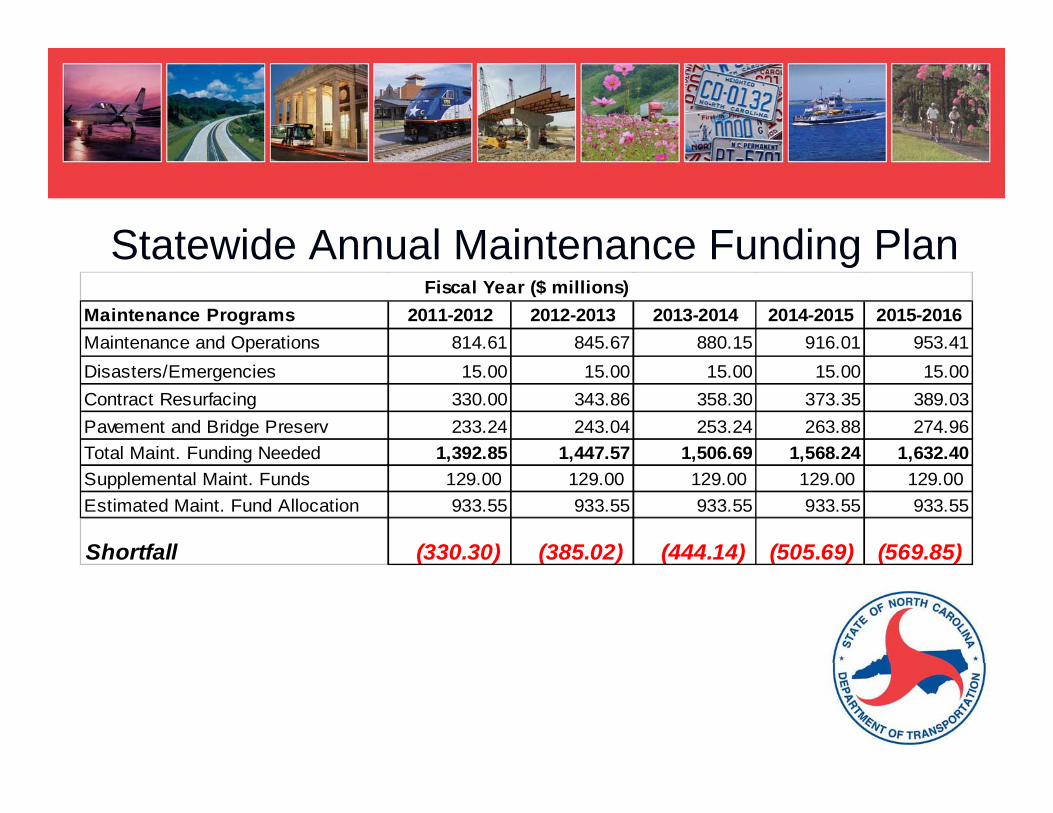
Statewide Annual Maintenance Funding Plan
Maintenance Programs 2011-2012 2012-2013 2013-2014 2014-2015 2015-2016
Maintenance and Operations 814.61 845.67 880.15 916.01 953.41
Disasters/Emergencies 15.00 15.00 15.00 15.00 15.00
Contract Resurfacing 330.00 343.86 358.30 373.35 389.03
Pavement and Bridge Preserv 233.24 243.04 253.24 263.88 274.96
Total Maint. Funding Needed 1,392.85 1,447.57 1,506.69 1,568.24 1,632.40Supplemental Maint. Funds 129.00 129.00 129.00 129.00 129.00
Estimated Maint. Fund Allocation 933.55 933.55 933.55 933.55 933.55
Shortfall (330.30) (385.02) (444.14) (505.69) (569.85)
Fiscal Year ($ millions)

LOS at Current Funding Level
Infr
astr
uct
ure
Hea
lth
Ind
ex
0.0
10.0
20.0
30.0
40.0
50.0
60.0
70.0
80.0
90.0
2011 2012 2013 2014 2015 2016 2017
Year

Estimated Dollars to MaintainCurrent LOS
Mill
ion
s
$0
$200
$400
$600
$800
$1,000
$1,200
$1,400
2011 2012 2013 2014 2015 2016 2017
Y ear
`
Year
Mill
ion
s

$0
$200
$400
$600
$800
$1,000
$1,200
$1,400
$1,600
$1,800
$2,000
2011 2012 2013 2014 2015 2016 2017
Year
Funding Needed to Meet Target LOS
Mill
ion
s

Questions?