ncaa men's college world series records - fs.ncaa.org...
TRANSCRIPT

2009 Guide

NCAA Men’s
College World Series
Records
1947-2008
The History of the Men’s College World Series,
Including Single-Game, Series, Career Records,
Championships Game and Championship Series Records,
Coaching Records, College World Series Brackets and
All-Time District/Regional Results.
THE NATIONAL COLLEGIATE ATHLETIC ASSOCIATION
P.O. Box 6222
Indianapolis, Indiana 46206-6222
317/917-6222
May 2008
Researched and Compiled By: Gary Johnson, Associate Director of Statistics,
Jim Wright, Director of Statistics, David Worlock, former Assistant Director of Statistics
and J.D. Hamilton, Assistant Director of Statistics.
Editorial Assistance By: Jeff Williams, Assistant Director of Statistics and Kevin Buerge,
NCAA Statistics Assistant
Additional Information Compiled By: Lou Spry, Larry Gerlach and Dave Yeast

2
2009 MEN’S COLLEGE WORLD SERIES RECORDS BOOK
TABLE OF CONTENTS
GENERAL RECORDS Format History and Tournament Structure ............................................................................................................... 7 Championship Results (Top Four Finishers) ............................................................................................................ 8-9 Profile of National Champions ................................................................................................................................. 10-11 National Champions by Title, Runners-Up, Championship Game Won-Lost Records ............................................ 12 CWS Team Win, Percentage Leaders ...................................................................................................................... 13 Year-By-Year Combined Won-Lost of CWS Field.................................................................................................. 14 Team Appearance, Win Leaders .............................................................................................................................. 15-16 All-Time CWS Won-Lost Records and Finishes (All Teams) ................................................................................. 17-19 Division I Baseball Championship Team Selections by Conference (1993-2008) ................................................... 20-21 All-Time Won-Lost by Conference .......................................................................................................................... 22 Year-By-Year Standings .......................................................................................................................................... 23-26 National Champion's Team Statistics ....................................................................................................................... 27-30 Year-By-Year CWS Batting Totals .......................................................................................................................... 31-32 Year-By-Year CWS Pitching Totals ........................................................................................................................ 33-34 Year-By-Year CWS Fielding Totals ........................................................................................................................ 35-36 Division I Baseball Statistical Trends (1970-2008) ................................................................................................. 37-38 Year-By-Year Individual Batting Leaders ................................................................................................................ 39 Year-By-Year Individual Pitching Leaders .............................................................................................................. 40 Jack Diesing Sr. Most Outstanding Player Award .................................................................................................... 41-42 All-Tournament Teams ............................................................................................................................................ 43-49 All-Time Teams ....................................................................................................................................................... 50 All-Decade Teams .................................................................................................................................................... 51 Average Game Times ............................................................................................................................................... 52 All-Time Extra Inning Games .................................................................................................................................. 53-55 All-Time Extra-Inning Won-Lost Records ............................................................................................................... 55 CWS Games Won In Last At Bat, All-Time One-Run Games ................................................................................. 56 Year-By-Year Scoring .............................................................................................................................................. 57 All Time Grand Slam Home Runs ............................................................................................................................ 58-59 All-Time Shutouts .................................................................................................................................................... 60-63 All-Time Low-Hit Games......................................................................................................................................... 64 Attendance Records .................................................................................................................................................. 65-68 Top 10 2007-08 NCAA Championship Attendance ................................................................................................. 68 Top 10 2007-08 NCAA Championship Gross Receipts ........................................................................................... 68 CWS Television Ratings .......................................................................................................................................... 69-72 2008 Conference Alignments ................................................................................................................................... 73-74 Former CWS Participants on Current MLB Rosters ................................................................................................ 75
SINGLE-GAME RECORDS Individual Batting ..................................................................................................................................................... 79-80 Individual Pitching ................................................................................................................................................... 80-82 Individual Fielding ................................................................................................................................................... 82 Team Batting ............................................................................................................................................................ 82-84 Team Pitching .......................................................................................................................................................... 84-86 Team Fielding .......................................................................................................................................................... 86-87 Team Batting - Both Teams ..................................................................................................................................... 87-88 Team Pitching - Both Teams .................................................................................................................................... 89-90 Team Fielding - Both Teams .................................................................................................................................... 90-91 Miscellaneous Records ............................................................................................................................................. 91-93
SERIES RECORDS Individual Batting ..................................................................................................................................................... 97-99 Individual Pitching ................................................................................................................................................... 99-102 Individual Fielding ................................................................................................................................................... 102 Team Batting ............................................................................................................................................................ 103-105 Team Pitching .......................................................................................................................................................... 105-107 Team Fielding .......................................................................................................................................................... 107-108

3
2009 MEN’S COLLEGE WORLD SERIES RECORDS BOOK
TABLE OF CONTENTS
CAREER RECORDS Individual Batting ..................................................................................................................................................... 111-113 Individual Pitching ................................................................................................................................................... 113-116 Individual Fielding ................................................................................................................................................... 116-117 Miscellaneous Records ............................................................................................................................................. 117
CHAMPIONSHIP GAME RECORDS Individual Batting ..................................................................................................................................................... 121-122 Individual Pitching ................................................................................................................................................... 122-124 Individual Fielding ................................................................................................................................................... 124 Team Batting ............................................................................................................................................................ 124-126 Team Pitching .......................................................................................................................................................... 126-127 Team Fielding .......................................................................................................................................................... 127-128 Team Batting - Both Teams ..................................................................................................................................... 128-129 Team Pitching - Both Teams .................................................................................................................................... 129-130 Team Fielding - Both Teams .................................................................................................................................... 131 Miscellaneous Records ............................................................................................................................................. 131-132
CHAMPIONSHIP FINALS RECORDS Individual Batting ..................................................................................................................................................... 135-137 Team Batting ............................................................................................................................................................ 137-139 Individual Pitching ................................................................................................................................................... 139-140 Team Pitching .......................................................................................................................................................... 140-142 Individual Fielding ................................................................................................................................................... 142 Team Fielding .......................................................................................................................................................... 142-143 Team Batting - Both Teams ..................................................................................................................................... 143-144 Team Pitching - Both Teams .................................................................................................................................... 145-146 Team Fielding - Both Teams .................................................................................................................................... 146 Miscellaneous Records ............................................................................................................................................. 146-147
CWS TIDBITS CWS Umpires (Championship Game Only) ............................................................................................................. 151-152 All-Time Umpire History ......................................................................................................................................... 153-155 Last Time At The CWS ............................................................................................................................................ 156-160
ALL-TIME COACHING RECORDS Listed Alphabetically By Team ................................................................................................................................ 163-169 All-Time Coaching Records (Alphabetical) ............................................................................................................. 170-173 Coaching Leaders By Category ................................................................................................................................ 174-175
DISTRICT/REGIONAL/SUPER REGIONAL SUMMARY All-Time District/Regional Team Won-Lost Records .............................................................................................. 179-188 Year-By-Year District/Regional Results and Seeding .............................................................................................. 188-233 Top Eight National Seeds Advancing to the MCWS (since 1999) ........................................................................... 234-236 Year-By-Year Super Regional Records ................................................................................................................... 237-238 Regional Team Appearance, Win Leaders ............................................................................................................... 239 Year-By-Year Regional/Super Regional Home Field Success ................................................................................. 240 Year-By-Year Regional/Super Regional Comparison .............................................................................................. 241 Regional/Super Regional Rankings by Attendance, Net Receipts ............................................................................ 242 Site-By-Site Regional Breakdown (1975-2008) ....................................................................................................... 243-246 Site-By-Site Super Regional Breakdown (1999-2008) ............................................................................................ 247
COLLEGE WORLD SERIES BRACKETS 1947-2008, Including Game Dates and Team Won-Lost Records ........................................................................... 251-283


GENERAL
RECORDS


7
MCWS FORMAT HISTORY
1947 Eight teams were divided into two, four-team, single-elimination playoffs. The two winners then met in a best-of-three
final in Kalamazoo, Michigan.
1948 Similar to 1947, but the two, four-team playoffs were changed to double-elimination tournaments. Again in the finals,
the two winners met in a best-of-three format in Kalamazoo.
1949 The final was expanded to a four team, double-elimination format and the site changed to Wichita, Kansas. Eight
teams began the playoffs with the four finalists decided by a best-of-three district format.
1950-1987 An eight-team, double-elimination format coincided with the move to Omaha in 1950.
1988-1998 The eight regional champions are seeded into two, four-team brackets. Those two brackets play double-elimination with
the bracket winners then meeting in a one-game championship.
1999-2002 While the CWS format remains the same, the expanded field means the eight super regional champions advance and the
64-team bracket is set at the beginning of the championship and teams are not reseeded for the CWS.
2003 The eight super regional champions advance into two, four-team brackets. The eight super-regional winners are not
reseeded for the CWS. Those two brackets play double-elimination with the bracket winners then meeting in a best two-
of-three championship series.
TOURNAMENT STRUCTURE
Year
Size of
Field
Automatic
Berths
At-Large
Selections
Div. I
Teams
2009 64 30 34 286
2008 64 30 34 286
2007 64 30 34 283
2006 64 30 34 285
2005 64 30 34 283
2004 64 30 34 283
2003 64 30 34 285
2002 64 30 34 283
2001 64 30 34 291
2000 64 29 35 281
1999 64 29 35 274
1998 48 19(5)* 24 273
1997 48 19(5)* 24 273
1996 48 18(6)* 24 275
1995 48 18(6)* 24 276
1994 48 18(6) 24 276
1993 48 24 24 274
1992 48 24 24 274
1991 48 25 23 271
1990 48 25 23 269
1989 48 27 21 270
1988 48 27 21 270
1987 48 26 22 270
1986 40 25 15 265
1985 38 25 13 260
1984 36 25 11 256
1983 36 24 12 253
1982 36 24 12 254
1981 34 20 14 248
1980 34 21 13 249
1979 34 21 13 246
1978 34 21 13 239
1977 34 20 14 228
1976 34 18 16 219
Year
Size of
Field
Automatic
Berths
At-Large
Selections
Div. I
Teams
1975 32 15 17 220
1974 28 15 13 221
1973 32 13 19 216
1972 28 13 15 211
1971 23 10 13 208
1970 26 11 15 207
1969 23 9 12 207
1968 27 10 17 --
1967 25 11 14 --
1966 28 11 17 --
1965 23 10 13 --
1964 21 8 13 --
1963 23 8 15 --
1962 27 8 19 --
1961 25 9 16 --
1960 26 10 16 --
1959 22 10 12 --
1958 27 13 14 --
1957 23 12 11 166
1956 23 12 11 --
1955 25 12 13 --
1954 23 12 11 --
1953 8 -- -- --
1952 8 -- -- --
1951 8 -- -- --
1950 8 -- -- --
1949 8 -- -- --
1948 8 -- -- --
1947 8 -- -- -- *18 or 19 qualify automatically, 10 or 12 take part in a play-in. From 1950 to 1953, the baseball committee chose one team from each of the
eight NCAA districts to compete at the CWS.
8
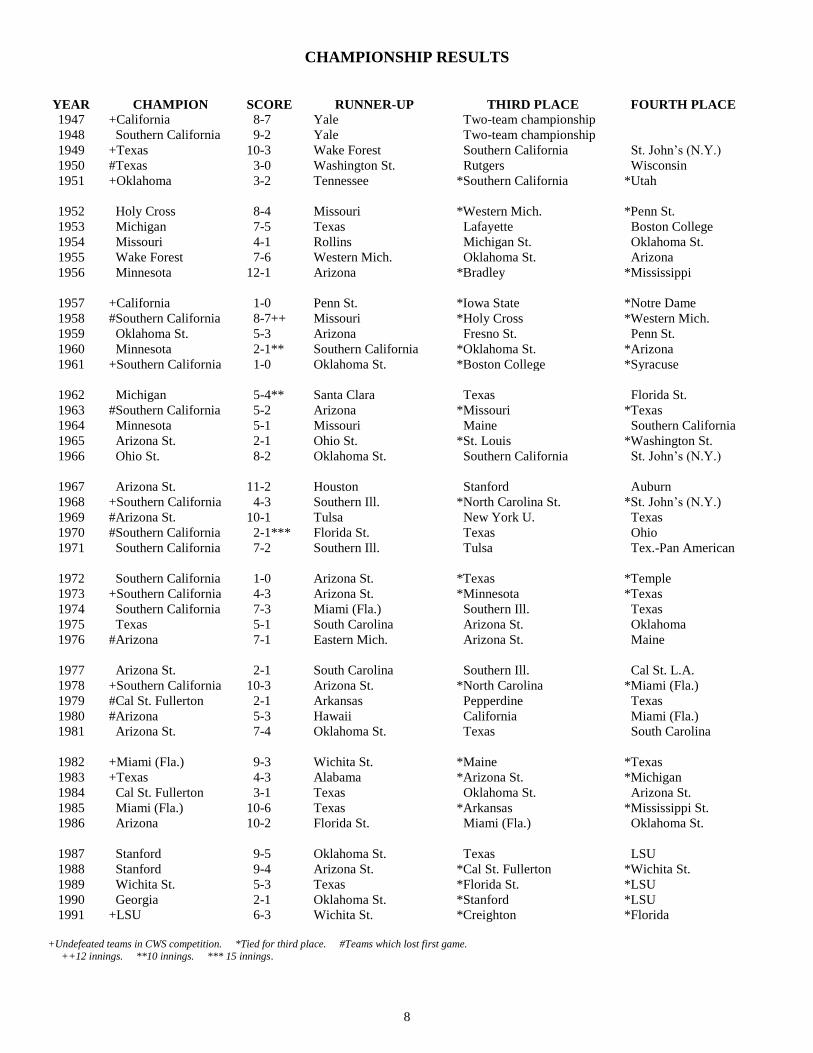
CHAMPIONSHIP RESULTS
YEAR CHAMPION SCORE RUNNER-UP THIRD PLACE FOURTH PLACE
1947 +California 8-7 Yale Two-team championship
1948 Southern California 9-2 Yale Two-team championship
1949 +Texas 10-3 Wake Forest Southern California St. John’s (N.Y.)
1950 #Texas 3-0 Washington St. Rutgers Wisconsin
1951 +Oklahoma 3-2 Tennessee *Southern California *Utah
1952 Holy Cross 8-4 Missouri *Western Mich. *Penn St.
1953 Michigan 7-5 Texas Lafayette Boston College
1954 Missouri 4-1 Rollins Michigan St. Oklahoma St.
1955 Wake Forest 7-6 Western Mich. Oklahoma St. Arizona
1956 Minnesota 12-1 Arizona *Bradley *Mississippi
1957 +California 1-0 Penn St. *Iowa State *Notre Dame
1958 #Southern California 8-7++ Missouri *Holy Cross *Western Mich.
1959 Oklahoma St. 5-3 Arizona Fresno St. Penn St.
1960 Minnesota 2-1** Southern California *Oklahoma St. *Arizona
1961 +Southern California 1-0 Oklahoma St. *Boston College *Syracuse
1962 Michigan 5-4** Santa Clara Texas Florida St.
1963 #Southern California 5-2 Arizona *Missouri *Texas
1964 Minnesota 5-1 Missouri Maine Southern California
1965 Arizona St. 2-1 Ohio St. *St. Louis *Washington St.
1966 Ohio St. 8-2 Oklahoma St. Southern California St. John’s (N.Y.)
1967 Arizona St. 11-2 Houston Stanford Auburn
1968 +Southern California 4-3 Southern Ill. *North Carolina St. *St. John’s (N.Y.)
1969 #Arizona St. 10-1 Tulsa New York U. Texas
1970 #Southern California 2-1*** Florida St. Texas Ohio
1971 Southern California 7-2 Southern Ill. Tulsa Tex.-Pan American
1972 Southern California 1-0 Arizona St. *Texas *Temple
1973 +Southern California 4-3 Arizona St. *Minnesota *Texas
1974 Southern California 7-3 Miami (Fla.) Southern Ill. Texas
1975 Texas 5-1 South Carolina Arizona St. Oklahoma
1976 #Arizona 7-1 Eastern Mich. Arizona St. Maine
1977 Arizona St. 2-1 South Carolina Southern Ill. Cal St. L.A.
1978 +Southern California 10-3 Arizona St. *North Carolina *Miami (Fla.)
1979 #Cal St. Fullerton 2-1 Arkansas Pepperdine Texas
1980 #Arizona 5-3 Hawaii California Miami (Fla.)
1981 Arizona St. 7-4 Oklahoma St. Texas South Carolina
1982 +Miami (Fla.) 9-3 Wichita St. *Maine *Texas
1983 +Texas 4-3 Alabama *Arizona St. *Michigan
1984 Cal St. Fullerton 3-1 Texas Oklahoma St. Arizona St.
1985 Miami (Fla.) 10-6 Texas *Arkansas *Mississippi St.
1986 Arizona 10-2 Florida St. Miami (Fla.) Oklahoma St.
1987 Stanford 9-5 Oklahoma St. Texas LSU
1988 Stanford 9-4 Arizona St. *Cal St. Fullerton *Wichita St.
1989 Wichita St. 5-3 Texas *Florida St. *LSU
1990 Georgia 2-1 Oklahoma St. *Stanford *LSU
1991 +LSU 6-3 Wichita St. *Creighton *Florida
+Undefeated teams in CWS competition. *Tied for third place. #Teams which lost first game.
++12 innings. **10 innings. *** 15 innings.

9
CHAMPIONSHIP RESULTS
YEAR CHAMPION SCORE RUNNER-UP THIRD PLACE FOURTH PLACE
1992 +Pepperdine 3-2 Cal St. Fullerton *Miami (Fla.) *Oklahoma St.
1993 LSU 8-0 Wichita St. *Long Beach St. *Oklahoma St.
1994 +Oklahoma 13-5 Georgia Tech *Arizona St. *Cal St. Fullerton
1995 +Cal St. Fullerton 11-5 Southern California *Miami (Fla.) *Tennessee
1996 +LSU 9-8 Miami (Fla.) *Clemson *Florida
1997 +LSU 13-6 Alabama *Miami (Fla.) *Stanford
1998 #Southern California 21-14 Arizona St. Long Beach St. *LSU
1999 +Miami (Fla.) 6-5 Florida St. *Alabama *Stanford
2000 +LSU 6-5 Stanford *Florida St. *La.-Lafayette
2001 +Miami (Fla.) 12-1 Stanford *Cal St. Fullerton *Tennessee
2002 +Texas 12-6 South Carolina *Clemson *Stanford
2003 Rice 14-2 Stanford *Texas *Cal St. Fullerton
2004 Cal St. Fullerton 3-2 Texas *South Carolina *Georgia
2005 +Texas 6-2 Florida *Arizona St. *Baylor
2006 #Oregon St. 3-2 North Carolina *Cal St. Fullerton *Rice
2007 +Oregon St. 9-3 North Carolina *UC Irvine *Rice
2008 Fresno St. 6-1 Georgia *North Carolina *Stanford +Undefeated teams in CWS competition. *Tied for third place. #Teams which lost first game.
++12 innings. **10 innings. *** 15 innings

10
PROFILE OF NATIONAL CHAMPIONS
Year Champion Conf. Head Coach Regular
Season
Pct. Regional CWS Finished
1947 California CIBL Clint Evans 27-10 .730 2-0 2-0 31-10 .756
1948 Southern California CIBL Sam Barry 21-3 .875 3-0 2-1 26-4 .867
1949 Texas SWC Bib Falk 18-7 .720 2-0 3-0 23-7 .767
1950 Texas SWC Bib Falk 20-4 .833 2-1 5-1 27-6 .818
1951 Oklahoma Big 8 Jack Baer 15-9 .625 -- 4-0 19-9 .679
1952 Holy Cross Indep. Jack Barry 15-2 .882 -- 6-1 21-3 .875
1953 Michigan Big 10 Ray Fisher 17-8 .680 -- 4-1 21-9 .700
1954 Missouri Big 8 Hi Simmons 17-3 .850 -- 5-1 22-4 .846
1955 Wake Forest ACC Taylor Sanford 20-5 .800 4-1 5-1 29-7 .806
1956 Minnesota Big 10 Dick Siebert 24-7 .774 4-1 5-1 33-9 .786
1957 California CIBL George Wolfman 28-9 .757 2-1 5-0 35-10 .778
1958 Southern California CIBL Rod Dedeaux 22-3 .880 2-0 5-1 29-3 .906
1959 Oklahoma St. Big 8 Toby Greene 20-4 .833 2-0 5-1 27-5 .844
1960 Minnesota Big 10 Dick Siebert 26-6-1 .803 3-0 5-1 34-7-1 .821
1961 Southern California CIBL Rod Dedeaux 27-6 .818 4-1 5-0 36-7 .837
1962 Michigan Big 10 Don Lund 23-11 .676 4-1 4-1 31-13 .705
1963 Southern California CIBL Rod Dedeaux 28-8 .778 2-1 5-1 35-10 .778
1964 Minnesota Big 10 Dick Siebert 25-11 .694 2-0 4-1 31-12 .721
1965 Arizona St. WAC Bob Winkles 47-7 .870 2-0 5-1 54-8 .871
1966 Ohio St. Big 10 Marty Karow 19-5-1 .780 3-0 5-1 27-6-1 .809
1967 Arizona St. WAC Bob Winkles 46-10 .821 2-1 5-1 53-12 .815
1968 Southern California Pac-10 Rod Dedeaux 36-11-1 .760 2-1 5-0 43-12-1 .777
1969 Arizona St. WAC Bob Winkles 49-10 .831 2-0 5-1 56-11 .836
1970 Southern California Pac-10 Rod Dedeaux 39-12 .765 2-0 4-1 45-13 .776
1971 Southern California Pac-10 Rod Dedeaux 39-10 .796 2-0 5-1 46-11 .807
1972 Southern California Pac-10 Rod Dedeaux 40-12-1 .764 2-0 5-1 47-13-1 .779
1973 Southern California Pac-10 Rod Dedeaux 42-11 .792 4-0 5-0 51-11 .823
1974 Southern California Pac-10 Rod Dedeaux 41-17 .707 4-2 5-1 50-20 .714
1975 Texas SWC Cliff Gustafson 49-5 .907 3-0 4-1 56-6 .903
1976 Arizona WAC Jerry Kindall 48-16 .750 3-0 5-1 56-17 .767
1977 Arizona St. WAC Jim Brock 49-11 .817 3-0 5-1 57-12 .826
1978 Southern California Pac-10 Rod Dedeaux 46-9 .836 3-0 5-0 54-9 .857
1979 Cal St. Fullerton SCBA Augie Garrido 51-12-1 .805 4-1 5-1 60-14-1 .807
1980 Arizona Pac-10 Jerry Kindall 37-20-1 .647 3-0 5-1 45-21-1 .679
1981 Arizona St. Pac-10 Jim Brock 47-12 .797 3-0 5-1 55-13 .809
1982 Miami (Fla.) Indep. Ron Fraser 46-18-1 .715 3-0 5-0 54-18-1 .747
1983 Texas SWC Cliff Gustafson 56-13 .812 5-1 5-0 66-14 .825
1984 Cal St. Fullerton SCBA Augie Garrido 58-18 .763 3-1 5-1 66-20 .767
1985 Miami (Fla.) Indep. Ron Fraser 56-14 .800 3-1 5-1 64-16 .800
1986 Arizona Pac-10 Jerry Kindall 41-18 .695 4-0 4-1 49-19 .721
1987 Stanford Pac-10 Mark Marquess 44-16 .733 4-0 5-1 53-17 .757
1988 Stanford Pac-10 Mark Marquess 37-21 .638 4-1 5-1 46-23 .667
1989 Wichita St. MVC Gene Stephenson 58-14 .806 5-1 5-1 68-16 .810
NOTE: CIBL was California Intercollegiate Baseball Association. SCBA was Southern California Baseball Association.

11
PROFILE OF NATIONAL CHAMPIONS
Year
Champion
Conf.
Head Coach
Regular
Season
Pct.
Reg.
Super
Regional
CWS
Finished
1990 Georgia SEC Steve Webber 44-17 .721 4-1 -- 4-1 52-19 .732
1991 LSU SEC Skip Bertman 47-18 .723 4-0 -- 4-0 55-18 .753
1992 Pepperdine WCC Andy Lopez 40-10-1 .794 4-1 -- 4-0 48-11-1 .808
1993 LSU SEC Skip Bertman 45-15-1 .746 4-1 -- 4-1 53-17-1 .754
1994 Oklahoma Big 8 Larry Cochell 42-17 .712 4-0 -- 4-0 50-17 .746
1995 Cal St. Fullerton Big West Augie Garrido 49-9 .845 4-0 -- 4-0 57-9 .864
1996 LSU SEC Skip Bertman 44-15 .746 4-0 -- 4-0 52-15 .776
1997 LSU SEC Skip Bertman 48-12 .800 5-1 -- 4-0 57-13 .814
1998 Southern California Pac-10 Mike Gilespie 40-15 .727 4-1 -- 5-1 49-17 .742
1999 Miami (Fla.) Indep. Jim Morris 41-13 .756 3-0 2-0 4-0 50-13 .794
2000 LSU SEC Skip Bertman 43-17 .717 3-0 2-0 4-0 52-17 .754
2001 Miami (Fla.) Indep. Jim Morris 44-12 .786 3-0 2-0 4-0 53-12 .815
2002 Texas Big 12 Augie Garrido 48-14 .774 3-0 2-1 4-0 57-15 .792
2003 Rice WAC Wayne Graham 48-10 .828 3-0 2-1 5-1 58-12 .829
2004 Cal St. Fullerton Big West George Horton 36-20 .643 4-1 2-0 5-1 47-22 .681
2005 Texas Big 12 Augie Garrido 45-14 .763 4-1 2-1 5-0 56-16 .778
2006 Oregon St. Pac-10 Pat Casey 39-14 .736 3-0 2-0 6-2 50-16 .758
2007 Oregon St. Pac-10 Pat Casey 38-17 .691 4-1 2-0 5-0 49-18 .731
2008 Fresno St. WAC Mike Batesole 37-27 .578 3-1 2-1 5-2 47-31 .603

12
COLLEGE WORLD SERIES NATIONAL CHAMPIONS (23 Teams)
TEAM TITLES (Years Won) Southern California .................................................................................................12 (48,58,61,63,68,70,71,72,73,74,78,98)
Texas .......................................................................................................................6 (49,50,75,83,02,05)
Arizona St. ..............................................................................................................5 (65,67,69,77,81)
LSU .........................................................................................................................5 (91,93,96,97,00)
Miami (Fla.) ............................................................................................................4 (82,85,99,01)
Arizona ...................................................................................................................3 (76,80,86)
Cal St. Fullerton ......................................................................................................4 (79,84,95,04)
Minnesota ...............................................................................................................3 (56,60,64)
California ................................................................................................................2 (47,57)
Michigan .................................................................................................................2 (53,62)
Oklahoma ................................................................................................................2 (51,94)
Stanford ..................................................................................................................2 (87,88)
Oregon St. ...............................................................................................................2 (06, 07)
Fresno St. ................................................................................................................1 (08)
Georgia ...................................................................................................................1 (90)
Holy Cross ..............................................................................................................1 (52)
Missouri ..................................................................................................................1 (54)
Ohio St. ...................................................................................................................1 (66)
Oklahoma St. ..........................................................................................................1 (59)
Pepperdine ..............................................................................................................1 (92)
Rice .........................................................................................................................1 (03)
Wake Forest ............................................................................................................1 (55)
Wichita St. ..............................................................................................................1 (89)
COLLEGE WORLD SERIES RUNNERS-UP (32 Teams)
TEAM TIMES
RUNNER-UP
TEAM TIMES
RUNNER-UP
TEAM TIMES
RUNNER-UP
Arizona St. 5 *North Carolina 2 *Houston 1
Oklahoma St. 5 Southern California 2 Ohio St. 1
Texas 5 *Southern Ill. 2 *Penn St. 1
Arizona 3 *Yale 2 *Rollins 1
*Florida St. 3 *Arkansas 1 *Santa Clara 1
Missouri 3 Cal St. Fullerton 1 *Tennessee 1
*South Carolina 3 *Eastern Mich. 1 *Tulsa 1
Stanford 3 *Florida 1 Wake Forest 1
Wichita St. 3 Georgia 1 *Washington St. 1
*Alabama 2 *Georgia Tech 1 *Western Mich. 1
Miami (Fla.) 2 *Hawaii 1
*Has Never Won CWS (19)
COLLEGE WORLD SERIES CHAMPIONSHIP GAME RECORDS (42 Teams)
TEAM RECORD TEAM RECORD TEAM RECORD
LSU 5-0 Arizona St. 5-5 Hawaii 0-1
Minnesota 3-0 Arizona 3-3 Penn St. 0-1
California 2-0 Georgia 1-1 Rollins 0-1
Michigan 2-0 Ohio St. 1-1 Santa Clara 0-1
Oklahoma 2-0 Wake Forest 1-1 Tennessee 0-1
Oregon St. 2-0 Stanford 2-3 Tulsa 0-1
Fresno St. 1-0 Missouri 1-3 Washington St. 0-1
Holy Cross 1-0 Wichita St. 1-3 Western Mich. 0-1
Pepperdine 1-0 Oklahoma St. 1-5 Alabama 0-2
Rice 1-0 Arkansas 0-1 North Carolina 0-2
Southern California 12-2 Eastern Mich. 0-1 Southern Ill. 0-2
Cal St. Fullerton 4-1 Florida 0-1 Yale 0-2
Miami (Fla.) 4-2 Georgia Tech 0-1 Florida St. 0-3
Texas 6-5 Houston 0-1 South Carolina 0-3

13
COLLEGE WORLD SERIES TEAM WIN/PERCENTAGE LEADERS
MOST WINS ENTERING CWS
TEAM YEAR WINS W-L (FINISH)
Wichita St. 1982 70 3-2 (2nd)
Wichita St. 1989 63 5-1 (1st)
Wichita St. 1991 63 3-1 (2nd)
Arizona St. 1976 62 3-2 (3rd)
Oklahoma 1976 62 0-2 (7th)
Texas 1983 61 5-0 (1st)
Cal St. Fullerton 1984 61 5-1 (1st)
Arizona St. 1972 60 4-2 (2nd)
Miami (Fla.) 1981 60 1-2 (5th)
Texas 1985 60 4-2 (2nd)
Clemson 1991 60 0-2 (7th)
FEWEST WINS ENTERING CWS
TEAM YEAR WINS W-L (FINISH)
Boston College 1953 11 2-2 (4th)
New Hampshire 1956 12 1-2 (5th)
Connecticut 1957 13 1-2 (5th)
Holy Cross 1963 13 0-2 (7th)
Penn St. 1963 13 1-2 (5th)
Boston College 1967 13 1-2 (5th)
Rutgers 1950 14 3-2 (3rd)
Massachusetts 1954 14 1-2 (5th)
Springfield 1955 14 0-2 (7th)
Notre Dame 1957 14 2-2 (3rd)
Boston College 1960 14 1-2 (5th)
HIGHEST WINNING PERCENTAGE ENTERING CWS
TEAM YEAR W-L PCT. CWS W-L (FINISH)
Penn St. 1957 19-0 1.000 3-2 (2nd)
Ithaca 1962 17-0 1.000 1-2 (5th)
Oklahoma St. 1955 24-1 .960 3-2 (3rd)
Oklahoma St. 1961 24-1 .960 3-2 (2nd)
Connecticut 1959 20-1 .952 0-2 (7th)
Tennessee 1951 16-1 .941 4-2 (2nd)
Arizona St. 1972 60-4 .938 4-2 (2nd)
Utah 1951 15-1 .938 2-2 (3rd)
Wake Forest 1949 29-2 .935 2-2 (2nd)
Texas 1982 57-4 .934 2-2 (3rd)
Tulsa 1969 36-3 .923 3-2 (2nd)
Northern Colo. 1955 24-2 .923 1-2 (5th)
South Carolina 1975 47-4 .922 4-2 (2nd)
Harvard 1973 35-3 .921 0-2 (7th)
Texas 1975 52-5 .912 4-1 (1st)
Texas 1973 48-5 .906 2-2 (3rd)
Arizona St. 1973 56-6 .903 3-2 (2nd)
Texas 1979 53-6 .898 2-2 (4th)
Texas 1974 52-6 .897 2-2 (4th)
Arizona St. 1964 43-5 .896 1-2 (5th)
LOWEST WINNING PERCENTAGE ENTERING CWS
TEAM YEAR W-L PCT. CWS W-L (FINISH)
Bradley 1950 17-14 .548 0-2 (7th)
Texas 1963 19-15-1 .557 2-2 (3rd)
Wyoming 1956 17-13 .567 1-2 (5th)
Seton Hall 1971 16-12 .571 0-2 (7th)
California 1992 35-26 .574 0-2 (7th)
Ohio St. 1967 25-18-3 .576 0-2 (7th)
Fresno St. 2008 37-27 .578 5-2 (1st)

14
COMBINED WON-LOST RECORD OF COLLEGE WORLD SERIES FIELD
(Entering CWS)
YEAR WINS LOSSES TIES PCT.
(Two Teams)
1947 48 18 0 .727
1948 44 10 1 .809
(Four Teams)
1949 106 25 1 .807
(Eight Teams)
1950 152 48 1 .759
1951 154 59 0 .723
1952 153 45 0 .773
1953 #145 54 5 .723
1954 164 50 1 .765
1955 195 #39 1 .832
1956 190 56 1 .771
1957 154 48 0 .762
1958 175 52 1 .770
1959 198 44 0 .818
1960 205 56 1 .784
1961 170 40 2 .807
1962 183 50 0 .785
1963 180 70 1 .719
1964 217 52 0 .807
1965 210 56 2 .787
1966 203 65 2 .756
1967 212 69 7 .748
1968 210 77 0 .732
1969 264 61 0 .812
1970 260 66 1 .797
1971 260 76 0 .774
1972 277 85 1 .764
1973 322 64 2 *.832
1974 326 78 1 .806
1975 358 75 1 .826
1976 359 101 0 .789
YEAR WINS LOSSES TIES PCT.
1977 326 89 1 .785
1978 331 102 2 .763
1979 379 101 0 .790
1980 348 121 3 .740
1981 379 102 1 .787
1982 408 108 2 .790
1983 347 106 1 .765
1984 397 *148 0 .728
1985 413 120 0 .775
1986 394 122 0 .764
1987 395 127 1 .756
1988 386 125 3 .754
1989 408 122 1 .769
1990 389 130 0 .750
1991 *414 130 0 .761
1992 366 125 1 .745
1993 383 121 1 .759
1994 371 132 0 .738
1995 383 120 0 .761
1996 391 119 0 .767
1997 384 126 1 .752
1998 359 141 1 .718
1999 403 112 0 .783
2000 373 142 0 .724
2001 385 124 0 .756
2002 402 123 0 .766
2003 368 137 2 .728
2004 365 145 1 #.715
2005 382 133 0 .742
2006 387 125 0 .755
2007 366 136 1 .729
2008 374 137 4 .730
* Eight-team high # Eight-team low

15
TEAM APPEARANCE, WIN LEADERS
LEADERS BY MCWS APPEARANCES
(Through 2008)
TEAM APP.
Texas 32
Miami (Fla.) 23
Southern California 21
Arizona St. 20
Florida St. 19
Oklahoma St. 19
Stanford 16
Arizona 15
Cal St. Fullerton 15
LSU 14
Clemson 11
Northern Colo. 10
Oklahoma 9
Mississippi St. 8
South Carolina 8
Maine 7
Michigan 7
North Carolina 7
Rice 7
Wichita St. 7
Georgia 6
Missouri 6
St. John’s (N.Y.) 6
Western Mich. 6
Alabama 5
Arkansas 5
California 5
Connecticut 5
Florida 5
Minnesota 5
Penn St. 5
Southern Ill. 5
14 teams have appeared in four CWS 3 teams have appeared in three CWS
18 teams have appeared in two CWS 39 teams have appeared one CWS
ALL-TIME CONSECUTIVE
MEN’S COLLEGE WORLD SERIES APPEARANCES
(Through 2008)
APP. TEAMS YEARS
7 Oklahoma St. 1981-1987
6 Northern Colo. 1957-1962
6 Miami (Fla.) 1994-1999
5 Southern California 1970-1974
5 Oklahoma 1972-1976
5 Miami (Fla.) 1978-1982
5 Texas 1981-1985
5 Stanford 1999-2003
4 Texas 1972-1975
4 Arizona St. 1975-1978
4 Maine 1981-1984
4 Texas 2002-2005
MOST MCWS TEAMS FROM ONE STATE
4, California, 1988 (CSUF, California, Fresno St., Stanford)
3, California, 1992 (Cal St. Fullerton, California, Pepperdine)
3, California, 1995 (CSUF, Stanford, Southern California)
3, Florida, 1996 (Florida, Florida St., Miami)
3, Florida, 1998 (Florida, Florida St., Miami)
3, California, 2000 (San Jose St., Stanford, USC)
3, California, 2001 (Cal St. Fullerton, Stanford, USC)
MOST MCWS TEAMS FROM ONE CONFERENCE
4, Southeastern, 1997 (Alabama, Auburn, LSU, Miss. St.)
4, Southeastern, 2004 (Arkansas, Georgia, LSU, S. Carolina)
4, ACC, 2006 (Clemson, Georgia Tech, Miami, N. Carolina)
3, Pacific-10, 1988 (Arizona St., California, Stanford)
3, Southeastern, 1990 (Georgia, LSU, Mississippi St.)
3, Southeastern, 1996 (Alabama, Florida, LSU)
3, Southeastern, 1998 (Florida, LSU, Mississippi St.)
3, Big 12, 2005 (Baylor, Nebraska, Texas)
3, ACC, 2008 (Florida St, Miami , North Carolina)
LEADERS BY MCWS WINS
(Through 2008)
Texas 78
Southern California 74
Arizona St. 59
Miami (Fla.) 47
Oklahoma St. 38
Stanford 40
Cal St. Fullerton 34
Arizona 33
LSU 30
Florida St. 25
LEADERS BY MCWS GAMES
(Through 2008)
Texas 131
Southern California 100
Arizona St. 93
Miami (Fla.) 85
Oklahoma St. 74
Stanford 69
Florida St. 63
Arizona 60
Cal St. Fullerton 59
LSU 49
LEADERS BY MCWS
WINNING PERCENTAGE
(Minimum 20 Games)
(Through 2008)
Southern California 74-26 .740
Minnesota 17-7 .708
Arizona St. 59-34 .634
Missouri 18-11 .621
LSU 30-19 .612
Texas 78-53 .595
Wichita St. 16-11 .593
Stanford 40-29 .580
Cal St. Fullerton 34-25 .576
Miami 47-38 .553

16
ALL-TIME MCWS APPEARANCES BY STATE
STATE TEAMS APP.
Alabama 2 9
Alaska No Division I Teams
Arizona 2 35
Arkansas 1 5
California 13 74
Colorado 2 11
Connecticut 2 7
Delaware 1 1
Florida 4 48
Georgia 3 11
Hawaii 1 1
Idaho No Division I Teams
Illinois 2 7
Indiana 2 3
Iowa 2 3
Kansas 2 8
Kentucky 1 1
Louisiana 4 18
Maine 1 7
Maryland 0 0
Massachusetts 7 18
Michigan 4 16
Minnesota 1 5
Mississippi 2 12
Missouri 3 8
Montana No Division I Teams
STATE TEAMS APP.
Nebraska 2 4
Nevada 0 0
New Hampshire 2 2
New Jersey 4 7
New Mexico 0 0
New York 5 11
North Carolina 4 13
North Dakota No Division I Teams
Ohio 2 5
Oklahoma 4 31
Oregon 2 5
Pennsylvania 3 11
Rhode Island 0 0
South Carolina 3 20
South Dakota No Division I Teams
Tennessee 1 4
Texas 6 49
Utah 2 3
Vermont 0 0
Virginia 1 1
Washington 1 4
West Virginia 0 0
Wisconsin 1 1
Wyoming 1 1
TOTALS 106 472
LAST MCWS FIELD WITH TEAMS FROM EIGHT DIFFERENT STATES
2004
MCWS FIELD WITH NO CALIFORNIA OR FLORIDA TEAMS (4)
1950, 1952, 1956, 1976
MCWS FIELD WITH NO CALIFORNIA TEAMS (9)
1950, 1952, 1954, 1956, 1965, 1976, 1981, 1996, 2005
LAST MCWS FIELD WITH NO FLORIDA TEAM
2007
LAST MCWS FIELD WITH NO TEXAS TEAM
2001
17
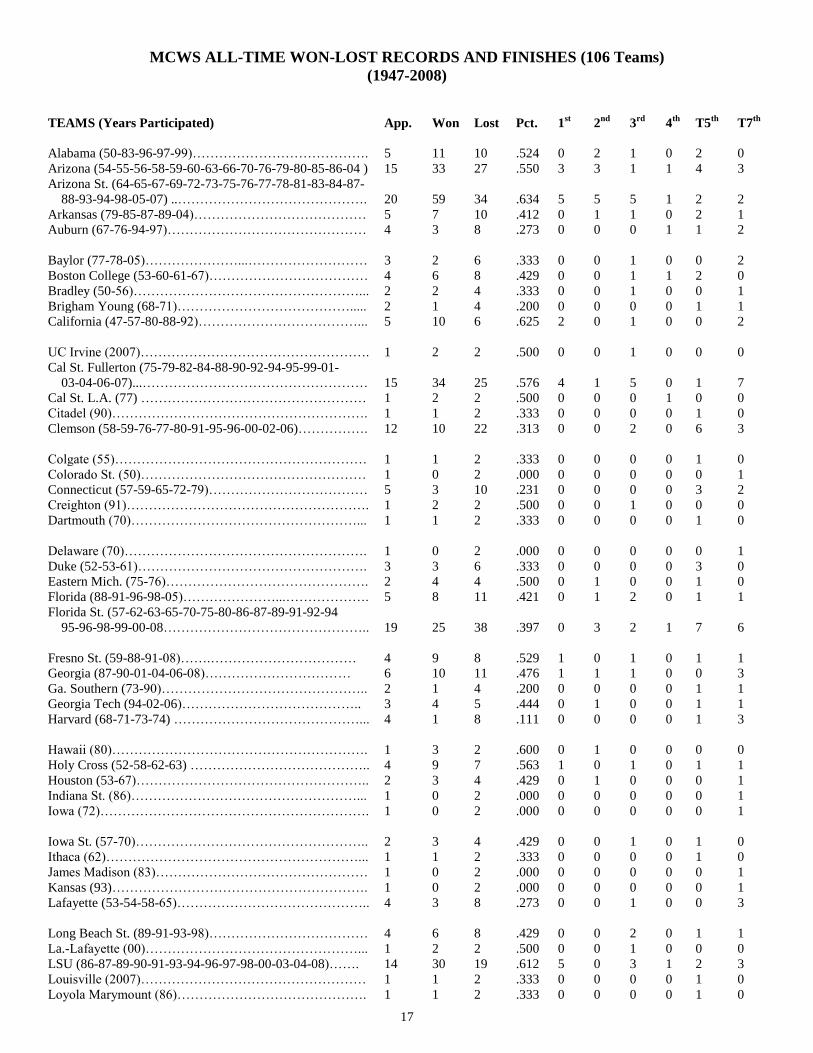
MCWS ALL-TIME WON-LOST RECORDS AND FINISHES (106 Teams)
(1947-2008)
TEAMS (Years Participated) App. Won Lost Pct. 1st 2
nd 3
rd 4
th T5
th T7
th
Alabama (50-83-96-97-99)…………………………………. 5 11 10 .524 0 2 1 0 2 0
Arizona (54-55-56-58-59-60-63-66-70-76-79-80-85-86-04 ) 15 33 27 .550 3 3 1 1 4 3
Arizona St. (64-65-67-69-72-73-75-76-77-78-81-83-84-87-
88-93-94-98-05-07) ..…………………………………….
20
59
34
.634
5
5
5
1
2
2
Arkansas (79-85-87-89-04)………………………………… 5 7 10 .412 0 1 1 0 2 1
Auburn (67-76-94-97)……………………………………… 4 3 8 .273 0 0 0 1 1 2
Baylor (77-78-05)…………………...……………………… 3 2 6 .333 0 0 1 0 0 2
Boston College (53-60-61-67)……………………………… 4 6 8 .429 0 0 1 1 2 0
Bradley (50-56)……………………………………………... 2 2 4 .333 0 0 1 0 0 1
Brigham Young (68-71)…………………………………..... 2 1 4 .200 0 0 0 0 1 1
California (47-57-80-88-92)………………………………... 5 10 6 .625 2 0 1 0 0 2
UC Irvine (2007)……………………………………………. 1 2 2 .500 0 0 1 0 0 0
Cal St. Fullerton (75-79-82-84-88-90-92-94-95-99-01-
03-04-06-07)...……………………………………………
15
34
25
.576
4
1
5
0
1
7
Cal St. L.A. (77) …………………………………………… 1 2 2 .500 0 0 0 1 0 0
Citadel (90)…………………………………………………. 1 1 2 .333 0 0 0 0 1 0
Clemson (58-59-76-77-80-91-95-96-00-02-06)……………. 12 10 22 .313 0 0 2 0 6 3
Colgate (55)………………………………………………… 1 1 2 .333 0 0 0 0 1 0
Colorado St. (50)…………………………………………… 1 0 2 .000 0 0 0 0 0 1
Connecticut (57-59-65-72-79)……………………………… 5 3 10 .231 0 0 0 0 3 2
Creighton (91)………………………………………………. 1 2 2 .500 0 0 1 0 0 0
Dartmouth (70)……………………………………………... 1 1 2 .333 0 0 0 0 1 0
Delaware (70)………………………………………………. 1 0 2 .000 0 0 0 0 0 1
Duke (52-53-61)……………………………………………. 3 3 6 .333 0 0 0 0 3 0
Eastern Mich. (75-76)………………………………………. 2 4 4 .500 0 1 0 0 1 0
Florida (88-91-96-98-05)…………………...………………. 5 8 11 .421 0 1 2 0 1 1
Florida St. (57-62-63-65-70-75-80-86-87-89-91-92-94
95-96-98-99-00-08………………………………………..
19
25
38
.397
0
3
2
1
7
6
Fresno St. (59-88-91-08)…….…………………………… 4 9 8 .529 1 0 1 0 1 1
Georgia (87-90-01-04-06-08)…………………………… 6 10 11 .476 1 1 1 0 0 3
Ga. Southern (73-90)……………………………………….. 2 1 4 .200 0 0 0 0 1 1
Georgia Tech (94-02-06)………………………………….. 3 4 5 .444 0 1 0 0 1 1
Harvard (68-71-73-74) ……………………………………... 4 1 8 .111 0 0 0 0 1 3
Hawaii (80)…………………………………………………. 1 3 2 .600 0 1 0 0 0 0
Holy Cross (52-58-62-63) ………………………………….. 4 9 7 .563 1 0 1 0 1 1
Houston (53-67)…………………………………………….. 2 3 4 .429 0 1 0 0 0 1
Indiana St. (86)……………………………………………... 1 0 2 .000 0 0 0 0 0 1
Iowa (72)……………………………………………………. 1 0 2 .000 0 0 0 0 0 1
Iowa St. (57-70)…………………………………………….. 2 3 4 .429 0 0 1 0 1 0
Ithaca (62)…………………………………………………... 1 1 2 .333 0 0 0 0 1 0
James Madison (83)………………………………………… 1 0 2 .000 0 0 0 0 0 1
Kansas (93)…………………………………………………. 1 0 2 .000 0 0 0 0 0 1
Lafayette (53-54-58-65)…………………………………….. 4 3 8 .273 0 0 1 0 0 3
Long Beach St. (89-91-93-98)……………………………… 4 6 8 .429 0 0 2 0 1 1
La.-Lafayette (00)…………………………………………... 1 2 2 .500 0 0 1 0 0 0
LSU (86-87-89-90-91-93-94-96-97-98-00-03-04-08)……. 14 30 19 .612 5 0 3 1 2 3
Louisville (2007)…………………………………………… 1 1 2 .333 0 0 0 0 1 0
Loyola Marymount (86)……………………………………. 1 1 2 .333 0 0 0 0 1 0

18
TEAMS (Years Participated) App. Won Lost Pct. 1st 2
nd 3
rd 4
th T5
th T7
th
Maine (64-76-81-82-83-84-86)…………………………….. 7 7 14 .333 0 0 2 1 0 4
Massachusetts (54-69)……………………………………… 2 2 4 .333 0 0 0 0 2 0
Miami (Fla.) (74-78-79-80-81-82-84-85-86-88-89-92-94
95-96-97-98-99-01-03-04-06-08……………………….
23
47
38
.553
4
2
5
1
10
1
Michigan (53-62-78-80-81-83-84)…………………………. 7 12 12 .500 2 0 1 0 2 2
Michigan St. (54)…………………………………………… 1 3 2 .600 0 0 1 0 0 0
Minnesota (56-60-64-73-77)……………………………….. 5 17 7 .708 3 0 1 0 1 0
Mississippi (56-64-69-72)………………………………….. 4 3 8 .273 0 0 1 0 1 2
Mississippi St. (71-79-81-85-90-97-98-07)………………… 8 7 16 .304 0 0 1 0 5 2
Missouri (52-54-58-62-63-64)……… ……………………... 6 18 11 .621 1 3 1 0 0 1
Missouri St. (03) …………………………………………… 1 0 2 .000 0 0 0 0 0 1
Nebraska (01-02-05)…………………………...…………… 3 1 6 .167 0 0 0 0 1 2
New Hampshire (56)………………………………………... 1 1 2 .333 0 0 0 0 1 0
New Orleans (84)…………………………………………… 1 1 2 .333 0 0 0 0 1 0
New York U. (56-69)……………………………………….. 2 3 4 .429 0 0 1 0 0 1
North Carolina (60-66-78-89-2006-07-08)…………………. 7 13 15 .464 0 2 2 0 0 3
North Carolina St. (68)……………………………………... 1 2 2 .500 0 0 1 0 0 0
Northeastern (66)…………………………………………… 1 0 2 .000 0 0 0 0 0 1
Northern Colo. (52-53-55-57-58-59-60-61-62-74)………… 10 3 20 .130 0 0 0 0 3 7
Notre Dame (57-02)………………………………………… 2 3 4 .429 0 0 1 0 1 0
Ohio (70)……………………………………………………. 1 2 2 .500 0 0 0 1 0 0
Ohio St. (51-65-66-67)……………………………………... 4 9 7 .563 1 1 0 0 0 2
Oklahoma (51-72-73-74-75-76-92-94-95)…………………. 9 14 14 .500 2 0 0 1 4 2
Oklahoma St. (54-55-59-60-61-66-67-68-81-82-83-84
85-86-87-90-93-96-99)…………………………………...
19
38
36
.514
1
5
4
2
4
3
Oral Roberts (78)…………………………………………… 1 1 2 .333 0 0 0 0 1 0
Oregon (54)…………………………………………………. 1 0 2 .000 0 0 0 0 0 1
Oregon St. (52-05-06-07)..……………...………………….. 4 11 6 .647 2 0 0 0 0 2
Penn St. (52-57-59-63-73)………………………………….. 5 8 10 .444 0 1 1 1 1 1
Pepperdine (79-92)…………………………………………. 2 7 2 .778 1 0 1 0 0 0
Princeton (51)………………………………………………. 1 0 2 .000 0 0 0 0 0 1
Rice (97-99-02-03-06-07-08..………………………………. 7 10 13 .435 1 0 2 0 1 3
Rider (67)…………………………………………………… 1 1 2 .333 0 0 0 0 1 0
Rollins (54)…………………………………………………. 1 3 2 .600 0 1 0 0 0 0
Rutgers (50)………………………………………………… 1 3 2 .600 0 0 1 0 0 0
St. John’s (N.Y.) (49-60-66-68-78-80)……………………... 6 6 12 .333 0 0 1 2 2 1
St. Louis (65)……………………………………………….. 1 2 2 .500 0 0 1 0 0 0
San Jose St. (00)……………………………………………. 1 0 2 .000 0 0 0 0 0 1
Santa Clara (62)…………………………………………….. 1 4 2 .667 0 1 0 0 0 0
Seton Hall (64-71-74-75)…………………………………… 4 2 8 .200 0 0 0 0 2 2
South Carolina (75-77-81-82-85-02-03-04)………………... 8 17 16 .515 0 3 1 1 1 2
Southern California (48-49-51-55-58-60-61-63-64-66
68-70-71-72-73-74-78-95-98-00-01)……………………..
21
74
26
.740
12
2
3
1
2
1
Southern Ill. (68-69-71-74-77)……………………………... 5 12 10 .545 0 2 2 0 0 1
Springfield (51-55)…………………………………………. 2 1 4 .200 0 0 0 0 1 1
Stanford (53-67-82-83-85-87-88-90-95-97-99-00-01-02-03
-08)
16 40 29 .580 2 3 6 0 5 0
Syracuse (61)……………………………………………….. 1 2 2 .500 0 0 1 0 0 0
Temple (72-77)……………………………………………... 2 2 4 .333 0 0 1 0 0 1

19
TEAMS (Years Participated) App. Won Lost Pct. 1st 2
nd 3
rd 4
th T5
th T7
th
Tennessee (51-95-01-05)………...…………………………. 4 8 8 .500 0 1 2 0 0 1
Texas (49-50-52-53-57-61-62-63-65-66-68-69-70-72-73
74-75-79-81-82-83-84-85-87-89-92-93-00-02-03-04-05)..
32
78
53
.595
6
5
10
3
5
3
Texas A&M (51-64-93-99)…………………………………. 4 2 8 .200 0 0 0 0 2 2
Tex.-Pan American (71)……………………………………. 1 2 2 .500 0 0 0 1 0 0
Tufts (50)…………………………………………………… 1 1 2 .333 0 0 0 0 1 0
Tulane (01-05)……………………………..……………….. 2 2 4 .333 0 0 0 0 2 0
Tulsa (69-71)……………………………………………….. 2 6 4 .600 0 1 1 0 0 0
UCLA (69-97)……………………………………………… 2 0 4 .000 0 0 0 0 0 2
Utah (51)……………………………………………………. 1 2 2 .500 0 0 1 0 0 0
Wake Forest (49-55)………………………………………... 2 7 3 .700 1 1 0 0 0 0
Washington St. (50-56-65-76)……………………………… 4 6 8 .429 0 1 1 0 1 1
Western Mich. (52-55-58-59-61-63)……………………….. 6 9 12 .429 0 1 2 0 2 1
Wichita St. (82-88-89-91-92-93-96)………………………... 7 16 11 .593 1 3 1 0 0 2
Wisconsin (50)……………………………………………… 1 2 2 .500 0 0 0 1 0 0
Wyoming (56)………………………………………………. 1 1 2 .333 0 0 0 0 1 0
Yale (47-48)………………………………………………… 2 1 4 .200 0 2 0 0 0 0
TOTALS 480 872 872 .500 62 62 *97 23 118 118
* Includes tied for third.

DIVISION I BASEBALL CHAMPIONSHIP TEAM SELECTIONS BY CONFERENCE
CONFERENCE 1993 1994 1995 1996 1997 1998 1999 2000 2001 2002 2003 2004
America East 1 1 1 1 1 1 1 1
Atlantic Coast 5 4 4 5 4 6 5 5 4 5 5 6
Atlantic Sun 1 1 2 2 3 1 2 3 3 3 3 2
Atlantic 10 1 1 1 1 1 1 1 1 1 2 1 1
Big East 2 1 2 2 1 1 3 3 3 1 2 2
Big South 1 1 1 1 1 1 1 1 2 2 1 2
Big Ten 2 2 1 1 1 2 3 3 2 1 2 1
Big 12 4 5 6 5 5 5 5 6
Big West 2 3 2 4 3 2 3 2 3 3 3 3
Colonial 2 1 3 1 1 2 3 2 3 2 2 2
Conference USA 2 2 2 3 2 3 5 4 4
Horizon 1 1 1 1 1 1 1 1
Ivy 1 1 1 1 1 1 1 1 1 1 1
Metro Atlantic 1 1 1 1 1 1
Mid-American 1 2 1 1 1 1 1 1 1 1 1 1
Mid-Eastern 1 1 1 1 1 1
Missouri Valley 1 2 3 2 2 1 3 3 1 2 2 1
Mountain West 1 1 1 1
Northeast 1 1 1 1 1 1 1 1 1
Ohio Valley 1 1 1 1 1 1 1 1 1 1
Pacific-10 4 4 3 3 5 4 4 4 4 4 4 5
Patriot 1 1 1 1 1 1 1 1
Southeastern 6 4 6 6 6 7 6 6 8 7 8 9
Southern 1 2 1 1 1 1 1 1 2 1 1 2
Southland 1 2 1 1 1 1 2 3 1 1 2 1
Southwestern 1 1 1 1 1 1
Summit 1 1 1 1 1 1 1 1 1 1 1
Sun Belt 2 2 3 2 2 2 3 4 3 4 3 2
West Coast 1 1 1 1 1 2 1 1 1 2 1
Western Athletic 3 2 1 2 2 1 1 3 2 2 1 1
Independents 1 1 1 1 1 1 1 1 1 1 1 1
Big Eight 2 3 2 2
Southwest 3 2 4 3
Metro 2 2 1
ECAC 1
North Atlantic 1 1 1
Great Midwest 1
Size of field 48 48 48 48 48 48 64 64 64 64 64 64

DIVISION I BASEBALL CHAMPIONSHIP TEAM SELECTIONS BY CONFERENCE
CONFERENCE 2005 2006 2007 2008 2009 2010 2011 2012 2013 2014 2015 2016
America East 1 1 1 1
Atlantic Coast 7 7 7 6
Atlantic Sun 2 2 2 1
Atlantic 10 1 1 1 1
Big East 2 1 3 2
Big South 2 2 1 1
Big Ten 2 1 3 1
Big 12 5 7 6 6
Big West 2 2 4 4
Colonial 1 1 1 2
Conference USA 4 4 4 5
Horizon 1 1 1 1
Ivy 1 1 1 1
Metro Atlantic 1 1 1 1
Mid-American 1 1 1 1
Mid-Eastern 1 1 1 1
Missouri Valley 2 2 2 1
Mountain West 1 1 1 1
Northeast 1 1 1 1
Ohio Valley 1 1 1 1
Pacific-10 5 4 4 5
Patriot 1 1 1 1
Southeastern 9 8 5 9
Southern 2 2 2 1
Southland 2 1 1 1
Southwestern 1 1 1 1
Summit 1 1 1 1
Sun Belt 2 2 3 2
West Coast 1 3 2 2
Western Athletic 1 2 1 1
Independents 0 0 0 1
Size of field 64 64 64 64

22
ALL-TIME MCWS WON-LOST BY CONFERENCE
(Using Current Conference Membership)
CONFERENCE TEAMS APP. WON LOST PCT. 1
ST 2
ND 3
RD 4
TH T5
TH T7
TH
America East 1 7 7 14 .333 0 0 2 1 0 4
Atlantic Coast 9 73 117 137 .461 5 9 13 3 29 14
Atlantic Sun 0 0 0 0 -- 0 0 0 0 0 0
Atlantic 10 3 5 6 10 .375 0 0 2 0 2 1
Big East 6 19 18 38 .321 0 0 3 2 9 5
Big South 0 0 0 0 -- 0 0 0 0 0 0
Big Ten 6 23 49 40 .551 6 2 4 1 4 6
Big 12 8 77 153 136 .529 10 13 16 6 16 16
Big West 3 20 42 35 .545 4 1 8 0 2 5
Colonial 3 3 0 6 .000 0 0 0 0 0 3
Conference USA 3 11 15 21 .417 1 1 2 0 3 7
Horizon 0 0 0 0 -- 0 0 0 0 0 0
Ivy 4 8 3 16 .158 0 2 0 0 2 4
Metro Atlantic 1 1 1 2 .333 0 0 0 0 1 0
Mid-American 2 3 6 6 .500 0 1 0 1 1 0
Mid-Continent 1 1 1 2 .333 0 0 0 0 1 0
Mid-Eastern 0 0 0 0 -- 0 0 0 0 0 0
Missouri Valley 6 17 32 31 .508 1 5 5 0 0 6
Mountain West 2 3 3 6 .333 0 0 1 0 1 1
Northeast 0 0 0 0 -- 0 0 0 0 0 0
Ohio Valley 0 0 0 0 -- 0 0 0 0 0 0
Pacific-10 8 87 233 140 .625 26 14 17 3 14 13
Patriot 2 8 12 15 .444 1 0 2 0 1 4
Southeastern 10 63 104 117 .471 6 9 13 3 15 17
Southern 2 3 2 6 .250 0 0 0 0 2 1
Southland 0 0 0 0 -- 0 0 0 0 0 0
Southwestern 0 0 0 0 -- 0 0 0 0 0 0
Sun Belt 2 2 3 4 .429 0 0 1 0 1 0
West Coast 3 4 12 6 .667 1 1 1 0 1 0
Western Athletic 5 12 21 23 .477 1 2 3 0 3 3
Independents 2 11 5 22 .185 0 0 0 1 3 7
No Longer Division I 5 6 8 12 .400 0 1 0 1 3 1
No Longer Sponsor Baseball 10 13 19 26 .422 0 1 4 1 4 3
TOTALS 106 480 872 872 .500 62 62 *97 23 118 118
*Includes ties for third
ALL-TIME NATIONAL CHAMPIONSHIPS BY CONFERENCE
(Using Actual Conference Membership For Each Season)
Pacific-10 15
Big Ten 6
CIBA 6
Southeastern 6
Independents 5
Western Athletic 5
Big Eight 4
Southwest 4
Big 12 2
Big West SCBA 2
Big West 2
Western Athletic 2
Atlantic Coast 1
Missouri Valley 1
West Coast 1
NOTE: CIBA was California Intercollegiate Baseball Association, SCBA was Southern California Baseball Association.

23
YEAR-BY-YEAR STANDINGS
(1947 – 1963)
1947
California 2-0
Yale 0-2
1948
Southern California 2-1
Yale 1-2
1949
Texas 3-0
Wake Forest 2-2
Southern California 1-2
St. John’s (N.Y.) 0-2
1950
Texas 5-1
Washington St. 3-2
Rutgers 3-2
Wisconsin 2-2
Alabama 1-2
Tufts 1-2
Colorado St. 0-2
Bradley 0-2
1951
Oklahoma 4-0
Tennessee 4-2
Southern California 2-2
Utah 2-2
Texas A&M 1-2
Springfield 1-2
Ohio St. 0-2
Princeton 0-2
1952
Holy Cross 6-1
Missouri 3-2
Penn St. 2-2
Western Mich. 2-2
Duke 1-2
Texas 1-2
Oregon St. 0-2
Northern Colo. 0-2
1953
Michigan 4-1
Texas 4-2
Lafayette 3-2
Boston College 2-2
Stanford 1-2
Duke 1-2
Northern Colo. 0-2
Houston 0-2
1954
Missouri 5-1
Rollins 3-2
Michigan St. 3-2
Oklahoma St. 2-2
Arizona 1-2
Massachusetts 1-2
Lafayette 0-2
Oregon 0-2
1955
Wake Forest 5-1
Western Mich. 3-2
Oklahoma St. 3-2
Arizona 2-2
Northern Colo. 1-2
Colgate 1-2
Springfield 0-2
Southern California 0-2
1956
Minnesota 5-1
Arizona 4-2
Bradley 2-2
Mississippi 2-2
New Hampshire 1-2
Wyoming 1-2
Washington St. 0-2
New York U. 0-2
1957
California 5-0
Penn St. 3-2
Iowa St. 2-2
Notre Dame 2-2
Connecticut 1-2
Texas 1-2
Northern Colo. 0-2
Florida St. 0-2
1958
Southern California 5-1
Missouri 4-2
Holy Cross 2-2
Western Mich. 2-2
Clemson 1-2
Northern Colo. 1-2
Arizona 0-2
Lafayette 0-2
1959
Oklahoma St. 5-1
Arizona 3-2
Fresno St. 3-2
Penn St. 2-2
Clemson 1-2
Western Mich. 1-2
Connecticut 0-2
Northern Colo. 0-2
1960
Minnesota 5-1
Southern California 4-2
Arizona 2-2
Oklahoma St. 2-2
St. John’s (N.Y.) 1-2
Boston College 1-2
Northern Colo. 0-2
North Carolina 0-2
1961
Southern California 5-0
Oklahoma St. 3-2
Boston College 2-2
Syracuse 2-2
Western Mich. 1-2
Duke 1-2
Northern Colo. 0-2
Texas 0-2
1962
Michigan 4-1
Santa Clara 4-2
Texas 3-2
Florida St. 2-2
Ithaca 1-2
Holy Cross 1-2
Missouri 0-2
Northern Colo. 0-2
1963
Southern California 5-1
Arizona 4-2
Missouri 2-2
Texas 2-2
Penn St. 1-2
Florida St. 1-2
Holy Cross 0-2
Western Mich. 0-2

24
YEAR-BY-YEAR STANDINGS
(1964 – 1978)
1964
Minnesota 4-1
Missouri 4-2
Maine 3-2
Southern California 2-2
Arizona St. 1-2
Seton Hall 1-2
Mississippi 0-2
Texas A&M 0-2
1965
Arizona St. 5-1
Ohio St. 4-2
St. Louis 2-2
Washington St. 2-2
Florida St. 1-2
Connecticut 1-2
Lafayette 0-2
Texas 0-2
1966
Ohio St. 5-1
Oklahoma St. 3-2
Southern California 3-2
St. John’s (N.Y.) 2-2
Arizona 1-2
Texas 1-2
North Carolina 0-2
Northeastern 0-2
1967
Arizona St. 5-1
Houston 3-2
Stanford 3-2
Auburn 2-2
Rider 1-2
Boston College 1-2
Ohio St. 0-2
Oklahoma St. 0-2
1968
Southern California 5-0
Southern Ill. 3-2
North Carolina St. 2-2
St. John’s (N.Y.) 2-2
Oklahoma St. 1-2
Texas 1-2
Brigham Young 0-2
Harvard 0-2
1969
Arizona St. 5-1
Tulsa 3-2
New York U. 3-2
Texas 2-2
Massachusetts 1-2
Mississippi 1-2
Southern Ill. 0-2
UCLA 0-2
1970
Southern California 4-1
Florida St. 4-2
Texas 3-2
Ohio 2-2
Dartmouth 1-2
Iowa St. 1-2
Arizona 0-2
Delaware 0-2
1971
Southern California 5-1
Southern Ill. 3-2
Tulsa 3-2
Tex.-Pan American 2-2
Brigham Young 1-2
Harvard 1-2
Mississippi St. 0-2
Seton Hall 0-2
1972
Southern California 5-1
Arizona St. 4-2
Temple 2-2
Texas 2-2
Oklahoma 1-2
Connecticut 1-2
Iowa 0-2
Mississippi 0-2
1973
Southern California 5-0
Arizona St. 3-2
Minnesota 2-2
Texas 2-2
Ga. Southern 1-2
Oklahoma 1-2
Harvard 0-2
Penn St. 0-2
1974
Southern California 5-1
Miami (Fla.) 3-2
Southern Ill. 3-2
Texas 2-2
Oklahoma 1-2
Northern Colo. 1-2
Harvard 0-2
Seton Hall 0-2
1975
Texas 4-1
South Carolina 4-2
Arizona St. 3-2
Oklahoma 2-2
Eastern Mich. 1-2
Seton Hall 1-2
Florida St. 0-2
Cal St. Fullerton 0-2
1976
Arizona 5-1
Eastern Mich. 3-2
Arizona St. 3-2
Maine 2-2
Clemson 1-2
Washington St. 1-2
Auburn 0-2
Oklahoma 0-2
1977
Arizona St. 5-1
South Carolina 3-2
Southern Ill. 3-2
Cal St. L.A. 2-2
Clemson 1-2
Minnesota 1-2
Baylor 0-2
Temple 0-2
1978
Southern California 5-0
Arizona St. 3-2
North Carolina 2-2
Miami (Fla.) 2-2
Oral Roberts 1-2
Michigan 1-2
St. John’s (N.Y.) 0-2
Baylor 0-2

25
YEAR-BY-YEAR STANDINGS
(1979 – 1993)
1979
Cal St. Fullerton 5-1
Arkansas 3-2
Pepperdine 3-2
Texas 2-2
Arizona 1-2
Mississippi St. 1-2
Miami (Fla.) 0-2
Connecticut 0-2
1980
Arizona 5-1
Hawaii 3-2
California 3-2
Miami (Fla.) 2-2
St. John’s (N.Y.) 1-2
Michigan 1-2
Florida St. 0-2
Clemson 0-2
1981
Arizona St. 5-1
Oklahoma St. 3-2
Texas 3-2
South Carolina 2-2
Miami (Fla.) 1-2
Mississippi St. 1-2
Maine 0-2
Michigan 0-2
1982
Miami (Fla.) 5-0
Wichita St. 3-2
Maine 2-2
Texas 2-2
Stanford 1-2
Oklahoma St. 1-2
South Carolina 0-2
Cal St. Fullerton 0-2
1983
Texas 5-0
Alabama 3-2
Arizona St. 2-2
Michigan 2-2
Oklahoma St. 1-2
Stanford 1-2
Maine 0-2
James Madison 0-2
1984
Cal St. Fullerton 5-1
Texas 3-2
Oklahoma St. 3-2
Arizona St. 2-2
Miami (Fla.) 1-2
New Orleans 1-2
Michigan 0-2
Maine 0-2
1985
Miami (Fla.) 5-1
Texas 4-2
Arkansas 2-2
Mississippi St. 2-2
Oklahoma St. 1-2
Stanford 1-2
Arizona 0-2
South Carolina 0-2
1986
Arizona 4-1
Florida St. 4-2
Miami (Fla.) 3-2
Oklahoma St. 2-2
LSU 1-2
Loyola Marymount 1-2
Indiana St. 0-2
Maine 0-2
1987
Stanford 5-1
Oklahoma St. 3-2
Texas 3-2
LSU 2-2
Arkansas 1-2
Florida St. 1-2
Georgia 0-2
Arizona St. 0-2
1988
Stanford 5-1
Arizona St. 4-2
Cal St. Fullerton 2-2
Wichita St. 2-2
Miami (Fla.) 1-2
Florida 1-2
Fresno St. 0-2
California 0-2
1989
Wichita St. 5-1
Texas 3-1
Florida St. 2-2
LSU 2-2
Arkansas 1-2
Miami (Fla.) 1-2
Long Beach St. 0-2
North Carolina 0-2
1990
Georgia 4-1
Oklahoma St. 3-1
Stanford 3-2
LSU 2-2
Citadel 1-2
Mississippi St. 1-2
Cal St. Fullerton 0-2
Ga. Southern 0-2
1991
LSU 4-0
Wichita St. 3-1
Creighton 2-2
Florida 2-2
Fresno St. 1-2
Long Beach St. 1-2
Clemson 0-2
Florida St. 0-2
1992
Pepperdine 4-0
Cal St. Fullerton 4-2
Miami (Fla.) 2-2
Texas 2-2
Florida St. 1-2
Oklahoma 1-2
California 0-2
Wichita 0-2
1993
LSU 4-1
Wichita St. 3-1
Long Beach St. 3-2
Oklahoma St. 2-2
Texas 1-2
Texas A&M 1-2
Arizona St. 0-2
Kansas 0-2

26
YEAR-BY-YEAR STANDINGS
(1994 – 2007)
1994
Oklahoma 4-0
Georgia Tech 3-1
Arizona St. 2-2
Cal St. Fullerton 2-2
Florida St. 1-2
Miami (Fla.) 1-2
Auburn 0-2
LSU 0-2
1995
Cal St. Fulleton 4-0
Southern California 4-2
Miami (Fla.) 2-2
Tennessee 2-2
Florida St. 1-2
Stanford 1-2
Clemson 0-2
Oklahoma 0-2
1996
LSU 4-0
Miami (Fla.) 3-1
Clemson 2-2
Florida 2-2
Alabama 1-2
Florida St. 1-2
Oklahoma St. 0-2
Wichita St. 0-2
1997
LSU 4-0
Alabama 4-2
Miami (Fla.) 2-2
Stanford 2-2
Auburn 1-2
Mississippi St. 1-2
Rice 0-2
UCLA 0-2
1998
Southern California 5-1
Arizona St. 3-1
Long Beach St. 2-2
LSU 2-2
Miami (Fla.) 1-2
Mississippi St. 1-2
Florida 0-2
Florida St. 0-2
1999
Miami (Fla.) 4-0
Florida St. 4-2
Alabama 2-2
Stanford 2-2
Cal St. Fullerton 1-2
Rice 1-2
Oklahoma St. 0-2
Texas A&M 0-2
2000
LSU 4-0
Stanford 3-1
Florida St. 2-2
La.-Lafayette 2-2
Clemson 1-2
Southern California 1-2
San Jose St. 0-2
Texas 0-2
2001
Miami (Fla.) 4-0
Stanford 3-1
Cal St. Fullerton 2-2
Tennessee 2-2
Southern California 1-2
Tulane 1-2
Georgia 0-2
Nebraska 0-2
2002
Texas 4-0
South Carolina 4-2
Clemson 2-2
Stanford 2-2
Georgia Tech 1-2
Notre Dame 1-2
Nebraska 0-2
Rice 0-2
2003
Rice 5-1
Stanford 5-3
Texas 2-2
Cal St. Fullerton 2-2
Miami (Fla.) 1-2
South Carolina 1-2
Missouri St. 0-2
LSU 0-2
2004
Cal St. Fullerton 5-1
Texas 3-2
South Carolina 3-2
Georgia 2-2
Arizona 1-2
Miami (Fla.) 1-2
Arkansas 0-2
LSU 0-2
2005
Texas 5-0
Florida 3-3
Arizona St. 3-2
Baylor 2-2
Nebraska 1-2
Tulane 1-2
Oregon St. 0-2
Tennessee 0-2
2006
Oregon St. 6-2
North Carolina 4-2
Cal St. Fullerton 2-2
Rice 2-2
Clemson 1-2
Miami (Fla.) 1-2
Georgia 0-2
Georgia Tech 0-2
2007
Oregon St. 5-0
North Carolina 4-3
Rice 2-2
UC Irvine 2-2
Arizona St. 1-2
Louisville 1-2
Cal St. Fullerton 0-2
Mississippi St. 0-2
2008
Fresno St. 5-2
Georgia 4-2
North Carolina 3-2
Stanford 2-2
LSU 1-2
Miami 1-2
Florida St. 0-2
Rice 0-2

27
NATIONAL CHAMPION’S TEAM BATTING STATISTICS
Year Team W-L AB R H BA 2B 3B HR TB SLG RBI BB SO SB
1947 California 2-0 73 25 27 .370 0 1 0 29 .397 - 5 12 5
1948 Southern California 2-1 106 15 27 .255 1 1 0 30 .283 11 19 12
1949 Texas 3-0 114 25 40 .351 4 2 2 54 .474 16 - - 0
1950 Texas 5-1 199 42 60 .302 9 2 3 82 .412 29 46 31 0
1951 Oklahoma 4-0 148 23 47 .318 7 3 1 63 .426 22 35 32 7
1952 Holy Cross 6-1 250 52 72 .288 7 7 2 99 .396 43 30 22 4
1953 Michigan 4-1 169 33 47 .278 5 0 1 55 .325 27 43 27 3
1954 Missouri 5-1 197 29 50 .254 9 7 4 85 .431 27 16 36 9
1955 Wake Forest 5-1 194 30 44 .227 7 2 0 55 .284 26 35 46 9
1956 Minnesota 5-1 213 44 62 .291 9 6 4 95 .446 36 24 39 7
1957 California 5-0 161 30 39 .242 9 4 3 65 .404 - 29 38 10
1958 Southern California 5-1 212 37 56 .264 7 5 0 73 .344 34 35 27 5
1959 Oklahoma St. 5-1 196 34 58 .296 7 3 4 83 .423 28 16 37 0
1960 Minnesota 5-1 212 36 51 .241 5 2 1 63 .297 29 45 32 5
1961 Southern California 5-0 172 27 49 .285 9 2 3 71 .413 25 22 29 1
1962 Michigan 4-1 188 29 42 .223 6 4 3 65 .346 24 14 42 6
1963 Southern California 5-1 199 36 46 .231 3 4 6 75 .399 30 16 45 4
1964 Minnesota 4-1 160 31 42 .263 8 5 0 60 .375 18 43 33 4
1965 Arizona St. 5-1 217 47 65 .300 12 2 5 96 .442 39 26 35 9
1966 Ohio St. 5-1 180 28 45 .250 7 5 0 62 .344 23 29 38 5
1967 Arizona St. 5-1 215 35 57 .265 6 2 3 76 .353 31 29 42 10
1968 Southern California 5-0 163 24 36 .221 8 2 2 54 .331 21 23 51 2
1969 Arizona St. 5-1 207 31 55 .265 7 3 4 80 .386 25 18 34 11
1970 Southern California 4-1 197 24 41 .208 6 2 1 54 .274 21 35 57 8
1971 Southern California 5-1 214 34 60 .280 5 5 3 84 .393 28 22 31 1
1972 Southern California 5-1 202 21 42 .208 7 1 2 57 .282 16 22 43 0
1973 Southern California 5-0 161 23 37 .230 5 1 1 47 .292 19 30 43 3
1974 Southern California 5-1 206 36 56 .271 15 1 1 76 .369 32 24 37 8
1975 Texas 4-1 181 40 53 .293 8 3 4 79 .436 36 27 37 1
1976 Arizona 5-1 226 49 65 .288 9 5 6 102 .451 43 30 34 11
1977 Arizona St. 5-1 222 38 77 .347 10 5 8 121 .545 36 10 30 6
1978 Southern California 5-0 182 38 60 .330 5 4 2 79 .434 35 31 21 3
1979 Cal St. Fullerton 5-1 209 48 69 .330 8 1 4 95 .455 39 25 31 11
1980 Ariaona 5-1 210 36 62 .295 12 4 5 97 .462 31 27 26 8
1981 Arizona St. 5-1 231 54 75 .325 8 3 9 116 .502 49 30 41 9
1982 Miami (Fla.) 5-0 158 32 47 .297 8 2 5 74 .468 30 21 25 7
1983 Texas 5-0 175 32 52 .297 8 2 1 67 .383 27 26 42 4
1984 Cal St. Fullerton 5-1 194 44 56 .289 10 2 3 79 .407 38 24 36 10
1985 Miami (Fla.) 5-1 207 41 62 .300 12 4 7 103 .498 35 24 44 13
1986 Arizona 4-1 173 36 49 .283 10 1 8 85 .491 33 21 27 13
1987 Stanford 5-1 206 35 54 .262 4 4 2 72 .350 28 18 43 11
1988 Stanford 5-1 193 37 48 .249 6 3 7 81 .420 31 20 43 11
1989 Wichita St. 5-1 195 37 51 .262 10 1 6 81 .415 31 27 39 2

28
NATIONAL CHAMPION’S TEAM BATTING STATISTICS
Year Team W-L AB R H BA 2B 3B HR TB SLG RBI BB SO SB
1990 Georgia 4-1 176 28 46 .261 11 0 1 60 .341 22 14 47 1
1991 LSU 4-0 146 48 48 .329 5 4 9 88 .603 44 26 21 1
1992 Pepperdine 4-0 132 21 34 .258 9 0 6 61 .462 19 10 21 4
1993 LSU 4-1 168 42 52 .310 7 1 6 79 .470 37 29 30 5
1994 Oklahoma 4-0 147 28 48 .327 7 1 5 72 .490 28 16 17 8
1995 Cal St. Fullerton 4-0 145 39 54 .372 5 1 11 94 .648 39 13 15 1
1996 LSU 4-0 138 29 42 .304 6 1 6 68 .493 27 20 31 7
1997 LSU 4-0 137 41 45 .328 7 0 10 82 .599 40 23 31 7
1998 Southern California 5-1 233 62 88 .378 11 1 17 152 .652 61 31 39 12
1999 Miami (Fla.) 4-0 125 27 39 .312 5 0 4 56 .448 25 23 25 5
2000 LSU 4-0 133 35 40 .301 8 0 9 75 .564 35 18 27 2
2001 Miami (Fla.) 4-0 142 49 53 .373 11 0 9 91 .641 46 30 30 13
2002 Texas 4-0 135 28 37 .274 7 2 5 63 .467 26 17 26 2
2003 Rice 5-1 201 42 56 .279 10 1 2 74 .368 37 31 28 1
2004 Cal St. Fullerton 5-1 197 24 48 .244 6 1 1 59 .299 21 18 42 5
2005 Texas 5-0 162 24 45 .278 5 0 7 71 .438 21 9 33 1
2006 Oregon St. 6-2 249 38 70 .281 12 4 4 102 .410 33 27 51 9
2007 Oregon St. 5-0 177 42 61 .345 8 3 8 99 .559 36 20 31 8
2008 Fresno St. 5-2 249 62 77 .309 13 2 14 136 .546 61 36 49 7

NATIONAL CHAMPION’S TEAM PITCHING AND FIELDING STATISTICS
Year Team W-L Sv ERA ShO CG IP H R ER BB SO PO A E DP FA
1947 California 2-0 -- -- 0 0 18 16 11 -- 13 9 54 26 3 0 .964
1948 Southern California 2-1 0 -- 0 2 27 26 11 -- 8 12 81 33 11 1 .912
1949 Texas 3-0 1 -- 0 2 27 24 5 -- -- -- 81 -- 3 0 --
1950 Texas 5-1 0 -- 2 4 53 38 5 -- 21 65 159 50 10 3 .954
1951 Oklahoma 4-0 0 -- 0 4 37 27 12 -- 13 18 111 37 8 5 .949
1952 Holy Cross 6-1 0 -- 0 7 62 47 17 -- 25 41 186 65 8 4 .969
1953 Michigan 4-1 0 1.80 1 3 45 40 18 9 30 33 135 58 15 8 .928
1954 Missouri 5-1 0 2.04 0 5 53 40 15 12 13 33 159 60 7 8 .969
1955 Wake Forest 5-1 1 2.33 3 3 54 41 22 14 35 42 162 66 9 5 .962
1956 Minnesota 5-1 0 2.00 1 5 54 34 20 12 35 49 162 60 13 7 .945
1957 California 5-0 0 0.60 3 5 45 25 3 3 14 30 135 45 7 4 .963
1958 Southern California 5-1 0 1.74 2 3 57 39 13 11 23 47 171 62 11 8 .947
1959 Oklahoma St. 5-1 1 1.70 1 3 53 40 19 10 17 48 159 68 9 4 .962
1960 Minnesota 5-1 0 2.83 0 3 57.1 49 25 18 36 33 172 64 12 10 .952
1961 Southern California 5-0 3 2.15 1 1 46 30 14 11 15 65 138 38 7 1 .962
1962 Michigan 4-1 1 3.53 0 1 51 46 23 20 29 43 153 69 11 10 .953
1963 Southern California 5-1 2 3.50 0 2 54 49 25 21 33 39 162 67 6 2 .974
1964 Minnesota 4-1 0 1.43 1 3 44 34 13 7 18 36 132 47 9 3 .952
1965 Arizona St. 5-1 1 2.55 0 0 53 36 18 15 28 53 159 -- 12 2 --
1966 Ohio St. 5-1 2 2.33 1 2 54 41 18 14 31 58 162 -- 10 5 --
1967 Arizona St. 5-1 0 1.37 0 5 59 46 14 9 24 77 177 -- 6 7 --
1968 Southern California 5-0 1 2.00 1 2 45 33 17 10 15 36 135 66 11 5 .948
1969 Arizona St. 5-1 1 1.45 0 3 56 41 12 9 15 54 167 58 6 8 .974
1970 Southern California 4-1 1 1.61 0 1 56 42 14 10 22 51 168 76 8 8 .968
1971 Southern California 5-1 0 3.67 0 4 54 53 23 22 18 33 162 80 6 9 .976
1972 Southern California 5-1 1 1.93 1 2 56 52 17 12 21 42 168 75 10 7 .960
1973 Southern California 5-0 1 2.40 0 3 45 38 13 12 10 33 135 60 7 3 .965
1974 Southern California 5-1 1 2.00 0 3 54 43 20 12 24 39 162 68 8 9 .966
1975 Texas 4-1 3 3.80 0 1 45 40 24 19 24 34 135 60 9 5 .956
1976 Arizona 5-1 0 3.11 0 3 55 49 23 19 18 35 165 71 4 7 .983
1977 Arizona St. 5-1 2 1.50 1 3 54 37 17 9 17 39 162 60 12 4 .949
1978 Southern California 5-0 0 2.40 0 1 45 36 13 12 25 27 135 68 7 3 .967
1979 Cal St. Fullerton 5-1 3 3.91 0 2 53 49 28 23 31 27 159 88 8 2 .969

NATIONAL CHAMPION’S TEAM PITCHING AND FIELDING STATISTICS
Year Team W-L Sv ERA ShO CG IP H R ER BB SO PO A E DP FA
1980 Arizona 5-1 2 2.89 1 1 56 55 26 18 22 33 168 86 13 4 .951
1981 Arizona St. 5-1 2 3.45 0 1 57.1 51 30 22 38 48 172 74 11 7 .957
1982 Miami (Fla.) 5-0 3 2.72 0 0 43 35 13 13 20 32 135 49 5 4 .974
1983 Texas 5-0 0 2.25 1 3 48 36 14 12 8 47 144 53 12 5 .943
1984 Cal St. Fullerton 5-1 3 2.55 0 1 53 49 19 15 21 48 159 71 7 6 .970
1985 Miami (Fla.) 5-1 1 3.23 0 0 53 45 24 19 27 40 159 69 8 3 .966
1986 Arizona 4-1 0 3.89 0 2 44 41 23 19 11 35 132 68 10 5 .952
1987 Stanford 5-1 2 2.95 0 1 55 60 22 18 19 44 165 65 11 12 .954
1988 Stanford 5-1 1 2.38 0 2 53 49 19 14 13 36 159 78 11 9 .956
1989 Wichita St. 5-1 3 3.17 0 1 54 49 25 19 18 33 162 88 14 3 .947
1990 Georgia 4-1 1 1.40 1 4 45 26 8 7 11 39 135 47 5 6 .973
1991 LSU 4-0 1 3.50 0 0 36 33 15 14 13 27 108 39 1 3 .993
1992 Pepperdine 4-0 2 1.00 2 0 36 20 6 4 14 20 108 57 5 4 .971
1993 LSU 4-1 0 3.68 1 3 44 42 24 18 24 45 132 49 11 2 .943
1994 Oklahoma 4-0 2 2.37 0 1 38 39 13 10 12 33 114 61 5 5 .972
1995 Cal St. Fullerton 4-0 1 2.00 1 0 36 33 11 8 8 20 1.08 43 4 6 .974
1996 LSU 4-0 3 3.50 0 0 36 42 21 14 23 31 108 37 12 2 .924
1997 LSU 4-0 1 5.00 0 0 36 42 24 20 10 40 108 38 4 5 .973
1998 Southern California 5-1 2 6.27 0 0 56 67 44 39 19 56 168 52 5 1 .978
1999 Miami (Fla.) 4-0 3 2.25 0 0 36 27 12 9 21 37 108 32 6 3 .959
2000 LSU 4-0 1 4.25 0 0 36 38 17 17 13 24 108 45 2 3 .987
2001 Miami (Fla.) 4-0 1 5.75 0 0 36 44 23 23 15 22 108 47 2 5 .987
2002 Texas 4-0 4 4.25 0 0 36 32 19 17 12 27 108 33 9 5 .940
2003 Rice 5-1 1 2.83 0 1 54 39 21 17 21 43 162 63 6 3 .974
2004 Cal St. Fullerton 5-1 2 2.17 2 3 54 45 14 13 16 59 162 54 4 2 .982
2005 Texas 5-0 2 1.40 1 0 45 30 8 7 21 41 135 50 3 6 .984
2006 Oregon St. 6-2 3 3.30 2 0 71 61 28 26 23 45 213 98 4 8 .987
2007 Oregon St. 5-0 2 3.00 0 0 45 39 16 15 16 34 135 57 4 5 .980
2008 Fresno St. 5-2 2 4.13 0 0 61 77 31 28 25 47 183 71 9 11 .966

YEAR-BY-YEAR CWS BATTING TOTALS (1947-1979)
Year Avg G AB R H 2B 3B HR RBI TB SLG% BB HBP SF SH SB ATT SB%
1947 .314 2 137 36 43 2 1 0 -- 47 .343 18 2 -- 5 9 -- --
1948 .262 3 202 26 53 4 1 1 20 62 .307 27 3 -- 0 5 -- --
1949 .270 6 429 52 116 11 5 3 35 146 .340 44 9 -- 5 11 -- --
1950 .218 15 988 135 215 29 12 4 104 280 .283 158 8 -- 13 27 -- --
1951 .235 14 933 125 219 28 14 11 111 308 .330 152 9 -- 23 24 -- --
1952 .252 15 1029 173 259 31 16 14 144 364 .354 123 13 -- 21 22 -- --
1953 .226 15 998 135 226 29 8 11 109 304 .305 175 11 -- 28 23 -- --
1954 .238 15 1041 130 248 39 17 13 114 360 .346 130 10 -- 38 34 -- --
1955 .199 15 951 126 189 28 3 4 101 235 .247 180 10 2 39 36 -- --
1956 .247 15 1000 153 247 34 21 14 122 365 .365 132 9 5 18 23 -- --
1957 .231 14 923 127 213 31 10 9 96 291 .315 150 3 11 11 20 -- --
1958 .231 15 1019 132 235 33 16 8 117 324 .318 143 12 5 29 16 -- --
1959 -- -- -- 129 -- -- -- -- -- -- -- -- 14 -- -- -- -- --
1960 .202 15 1007 127 203 23 13 5 121 267 .265 194 14 2 18 15 -- --
1961 .244 14 958 128 234 30 15 17 120 345 .360 128 9 10 12 13 -- --
1962 .240 15 1003 159 241 34 22 7 139 340 .339 152 14 13 24 30 -- --
1963 .239 15 1025 133 245 23 14 10 114 326 .318 121 6 3 9 16 -- --
1964 .218 15 987 107 215 30 10 1 80 268 .272 147 9 5 15 14 -- --
1965 .237 15 1034 132 245 32 9 -- 102 295 .285 140 5 9 18 36 -- --
1966 .232 15 948 111 220 18 18 2 105 280 .295 126 4 9 16 13 -- --
1967 .231 15 1044 113 241 33 18 7 97 331 .317 127 6 7 12 38 -- --
1968 .219 14 963 118 211 32 7 12 99 293 .304 97 6 10 10 15 -- --
1969 .226 15 1000 115 226 28 13 10 97 310 .310 110 12 2 15 15 -- --
1970 .229 15 1076 130 246 32 12 4 112 314 .292 147 5 5 14 30 -- --
1971 .266 15 1021 137 272 30 19 12 122 376 .368 116 5 6 12 27 -- --
1972 .215 15 1039 107 223 25 10 6 92 286 .275 112 7 2 17 14 -- --
1973 .222 14 926 98 206 22 9 8 91 270 .292 93 5 4 13 16 -- --
1974 .227 15 1000 133 227 33 8 8 127 300 .300 136 6 8 12 40 -- --
1975 .249 15 1015 133 253 35 12 12 113 348 .343 118 9 6 15 27 -- --
1976 .261 15 1024 150 267 30 10 21 130 380 .371 124 9 6 32 34 -- --
1977 .284 14 952 144 270 43 16 18 125 399 .419 105 9 6 12 22 -- --
1978 .256 14 956 156 245 39 13 13 139 349 .365 130 8 10 8 21 -- --
1979 .285 15 1031 174 294 46 8 15 153 401 .389 148 5 13 15 35 -- --

YEAR-BY-YEAR CWS BATTING TOTALS (1980-2008)
Year Avg G AB R H 2B 3B HR RBI TB SLG% BB HBP SF SH SB ATT SB%
1980 .284 15 1039 166 295 40 14 17 139 414 .398 137 5 14 21 32 48 .667
1981 .287 15 1130 199 324 52 13 26 197 480 .425 143 6 9 8 37 46 .804
1982 .263 14 955 159 251 41 8 16 144 356 .373 233 6 13 16 36 55 .655
1983 .254 14 954 127 242 38 7 19 126 351 .368 106 1 7 17 25 33 .758
1984 .296 15 1049 228 310 53 9 24 204 453 .432 147 13 12 19 42 56 .750
1985 .267 15 1051 179 281 58 10 23 158 428 .407 145 7 12 15 36 44 .818
1986 .256 15 992 148 254 50 9 22 127 388 .391 84 10 10 8 36 60 .600
1987 .270 15 1033 150 279 40 13 19 133 402 .389 117 14 9 12 40 63 .635
1988 .272 15 1056 155 287 48 8 24 135 423 .401 82 12 9 7 34 55 .618
1989 .258 14 922 148 238 45 5 19 134 350 .380 109 8 10 19 17 28 .607
1990 .267 14 993 143 265 42 6 15 126 364 .367 77 11 11 7 26 36 .722
1991 .271 13 912 164 247 38 11 24 153 379 .416 111 14 16 9 33 43 .767
1992 .252 14 936 129 236 34 4 24 113 350 .374 133 18 3 18 32 41 .780
1993 .261 14 957 154 250 38 2 26 136 370 .387 130 14 7 14 28 37 .757
1994 .262 13 930 142 244 40 4 29 129 379 .408 108 15 9 15 28 53 .528
1995 .303 14 972 171 295 39 3 48 161 484 .498 93 17 7 16 24 34 .706
1996 .299 13 919 175 275 43 5 35 162 433 .471 119 13 16 10 36 48 .750
1997 .282 14 985 174 278 40 5 30 165 418 .424 118 24 9 12 26 32 .813
1998 .318 14 1028 225 327 39 3 62 212 558 .543 129 24 11 22 28 37 .757
1999 .282 14 976 164 275 50 4 35 150 438 .449 145 23 12 10 30 44 .682
2000 .278 13 884 161 246 45 2 40 150 415 .469 98 24 9 16 21 31 .677
2001 .314 13 918 200 288 49 6 43 190 478 .521 97 29 14 11 36 51 .706
2002 .286 14 992 178 284 59 7 33 165 456 .460 114 26 12 9 24 31 .774
2003 .265 16 1066 185 283 57 5 32 164 446 .418 127 36 14 26 14 25 .560
2004 .290 15 1033 165 300 45 7 17 150 410 .397 113 24 9 29 32 45 .711
2005 .251 15 1000 124 251 42 0 24 112 365 .365 105 13 8 28 15 28 .536
2006 .269 16 1099 143 296 50 8 20 132 422 .384 99 29 11 27 22 35 .629
2007 .289 15 1070 185 309 53 5 37 171 483 .451 103 53 12 23 15 23 .652
2008 .303 16 1125 206 341 53 8 38 198 524 .466 141 24 10 17 21 33 .636
Totals .258 872 58635 8931 15098 2238 571 1101 7787 21781 .372 7466 779 464 990 1547 -- --

YEAR-BY-YEAR CWS PITCHING TOTALS (1947-1978)
Year ERA G CG SHO/CBO SV IP H R ER BB SO WP HBP BK
1947 -- 2 0 0 -- 36.0 43 36 -- 18 21 2 2 0
1948 -- 3 4 0 -- 54.0 53 26 -- 27 24 0 3 0
1949 -- 6 4 0 -- 115.0 116 52 -- 44 51 3 9 0
1950 -- 15 15 2 -- 261.0 215 135 -- 158 184 5 8 1
1951 -- 14 18 1 -- 249.0 219 125 -- 152 129 11 9 2
1952 -- 15 15 1 -- 262.0 259 173 -- 123 156 4 13 3
1953 2.86 15 9 1 -- 271.0 226 135 86 175 216 15 11 3
1954 3.58 15 13 0 -- 279.0 248 130 111 130 216 13 10 0
1955 2.81 15 15 6 -- 269.0 189 126 84 180 209 4 10 1
1956 3.57 15 19 5 -- 262.0 247 153 104 132 207 9 9 0
1957 3.35 14 16 6 -- 247.0 213 127 92 150 339 6 3 1
1958 3.58 15 19 3 -- 273.7 235 132 109 143 301 10 12 1
1959 -- 15 -- 3 -- -- --- 129 -- -- -- -- 14 --
1960 2.92 15 15 2 -- 277.7 203 127 90 194 192 1 14 1
1961 3.96 14 12 3 -- 247.7 234 128 109 128 220 9 9 3
1962 4.32 15 11 1 -- 277.0 241 159 133 152 264 11 14 3
1963 3.44 15 14 2 -- 269.3 245 133 103 121 213 9 6 2
1964 2.28 15 11 3 -- 264.7 215 107 67 147 215 7 9 0
1965 3.61 15 10 1 -- 267.0 245 132 107 140 225 5 5 1
1966 3.10 15 7 2 -- 261.0 220 111 90 126 198 1 4 1
1967 2.73 15 15 2 -- 267.0 241 113 81 127 255 10 6 1
1968 2.98 14 7 4 -- 256.7 211 118 85 97 221 9 6 0
1969 4.12 15 9 3 3 268.7 226 115 123 110 211 13 12 2
1970 3.45 15 8 3 4 287.0 246 130 110 147 259 15 5 1
1971 3.76 15 14 1 2 263.3 272 137 110 116 182 11 5 0
1972 2.76 15 11 5 3 241.3 223 107 74 112 232 16 7 4
1973 2.51 14 12 4 3 244.3 206 98 68 93 189 14 5 0
1974 3.16 15 10 0 2 265.0 227 133 93 136 192 16 6 2
1975 3.35 15 13 3 3 266.0 253 133 99 118 192 17 9 1
1976 3.75 15 10 1 3 266.3 267 150 111 124 184 20 9 1
1977 4.08 15 13 2 5 273.3 270 144 124 105 192 18 9 2
1978 4.78 14 6 2 2 245.0 245 156 130 130 141 13 8 0

YEAR-BY-YEAR CWS PITCHING TOTALS (1979-2008)
Year ERA G CG SHO/CBO SV IP H R ER BB SO WP HBP BK
1979 4.62 15 8 0 4 265.0 294 174 136 148 142 20 5 1
1980 4.35 15 5 1 4 252.3 295 166 122 137 138 13 5 3
1981 5.09 15 4 1 5 281.3 324 199 159 143 177 18 6 1
1982 4.58 14 7 2 4 236.0 251 159 120 233 165 9 6 3
1983 3.78 14 7 3 4 257.0 242 127 108 106 199 17 1 6
1984 6.17 15 3 0 4 259.7 310 228 178 147 217 11 13 0
1985 4.84 15 7 1 3 271.3 281 179 146 145 202 11 7 1
1986 4.02 15 3 1 6 261.7 254 148 117 84 203 16 10 2
1987 4.16 15 6 1 3 270.7 279 150 125 117 225 14 14 5
1988 4.18 15 9 0 5 269.3 287 155 125 82 196 16 12 1
1989 4.68 14 5 0 6 244.0 238 148 127 109 194 16 8 1
1990 4.30 14 8 1 1 255.3 265 143 122 77 204 15 11 0
1991 5.31 13 5 1 3 234.0 247 164 138 111 165 14 14 2
1992 4.17 14 2 3 7 252.7 236 129 117 133 144 12 18 0
1993 4.59 14 5 1 0 243.3 250 154 124 130 160 17 14 1
1994 3.87 13 3 2 3 242.0 244 142 104 108 164 18 15 1
1995 5.76 14 7 1 4 223.3 295 171 143 93 149 17 17 3
1996 6.01 14 0 0 8 229.0 275 175 153 119 205 19 13 2
1997 5.19 14 1 0 4 248.0 278 174 143 118 199 21 24 0
1998 7.24 14 0 0 9 251.0 327 225 202 129 210 20 24 2
1999 4.93 14 2 0 5 250.3 275 164 137 145 212 17 23 2
2000 5.34 13 2 0 5 226.0 246 161 134 98 150 16 24 4
2001 7.14 13 1 0 5 228.0 288 200 181 97 170 21 29 11
2002 5.87 14 3 1 6 246.7 284 178 161 114 178 13 26 4
2003 5.02 16 3 1 4 283.0 283 185 158 127 186 21 36 5
2004 4.52 15 3 2 6 263.0 300 165 132 113 221 21 24 5
2005 3.44 15 1 1 5 267.0 251 124 102 105 195 6 13 1
2006 4.14 16 2 3 8 289.0 296 143 133 99 222 15 29 3
2007 5.26 15 0 0 6 272.0 309 185 159 103 200 15 53 8
2008 5.76 32 0 0 5 278.1 341 206 178 141 243 26 24 1
Totals 3.91 888 467 99 172 15237.1 15098 8931 6677 7466 11665 782 779 116

35
YEAR-BY-YEAR CWS FIELDING TOTALS (1947-1990)
YEAR C PO A E FLD% DPs PB CI
1947 166 108 47 11 .934 1 1 0
1948 251 162 70 19 .924 2 0 0
1949 367 345 -- 22 .940 10 0 0
1950 1164 783 320 61 .948 25 6 0
1951 1098 747 293 58 .947 23 5 0
1952 1182 786 325 71 .940 25 9 0
1953 1178 813 288 77 .935 28 5 0
1954 1195 837 311 47 .961 21 3 0
1955 1182 807 310 65 .945 25 8 0
1956 1190 786 344 60 .950 30 4 0
1957 1065 741 274 50 .953 17 5 0
1958 1199 821 322 56 .953 28 7 0
1959 -- -- -- 54 -- 32 -- --
1960 1241 833 344 64 .948 30 11 0
1961 1071 743 282 46 .957 16 2 0
1962 1229 831 336 62 .950 26 6 0
1963 1169 808 308 53 .955 23 11 1
1964 1127 794 272 61 .946 23 7 0
1965 1162 801 298 63 .946 20 10 0
1966 828 783 -- 45 .946 25 3 0
1967 1164 801 300 63 .946 26 6 0
1968 1127 770 310 47 .958 19 12 1
1969 1153 806 301 46 .960 26 3 0
1970 1273 861 355 57 .955 30 8 0
1971 1189 790 339 60 .950 30 3 0
1972 1085 724 313 48 .956 23 3 0
1973 1104 733 311 60 .946 35 5 0
1974 1208 795 363 50 .959 21 8 0
1975 1178 798 322 58 .951 25 4 0
1976 1210 799 358 53 .956 39 10 0
1977 1231 820 360 51 .959 31 6 0
1978 1129 735 345 49 .957 22 5 0
1979 1263 795 412 56 .956 33 5 0
1980 1190 757 368 65 .945 31 7 0
1981 1305 844 394 67 .949 37 3 1
1982 1076 708 314 54 .950 27 3 0
1983 1141 771 331 39 .966 31 3 0
1984 1151 779 313 59 .949 24 3 0
1985 1241 814 373 54 .956 29 8 1
1986 1209 785 383 41 .966 33 2 0
1987 1194 812 337 45 .962 36 6 0
1988 1212 808 353 51 .958 24 2 0
1989 1086 732 312 42 .961 22 3 0
1990 1128 766 309 53 .953 33 3 0

36
YEAR-BY-YEAR CWS FIELDING TOTALS (1991-2008)
YEAR C PO A E FLD% DPs PB CI
1991 1044 702 303 39 .963 27 6 0
1992 1125 758 343 24 .979 26 2 0
1993 1097 730 320 47 .957 32 0 0
1994 1123 726 348 49 .956 31 2 1
1995 1047 700 309 38 .964 43 1 0
1996 990 687 258 45 .955 25 0 0
1997 1080 744 298 38 .965 39 5 0
1998 1086 753 297 36 .967 28 8 0
1999 1069 752 272 45 .958 32 3 1
2000 982 678 271 33 .966 21 2 0
2001 980 684 268 28 .971 24 4 0
2002 1030 740 257 33 .968 19 3 0
2003 1214 849 330 35 .971 26 5 0
2004 1141 789 313 39 .966 23 3 0
2005 1178 801 342 35 .970 24 5 0
2006 1262 867 366 29 .977 28 6 0
2007 1196 816 345 35 .971 33 2 0
2008 1186 835 318 33 .972 37 3 0
Totals 67977 45743 18478 2974 .956 1635 284 6

Division I Baseball Statistics Trends
(1970-1999) Averages are per game for each team.
Avg. Batting Home Runs Stolen Bases Earned-Run Strikeouts Fielding
Year Teams† Games% Average Scoring Per Game Per Game Average Per 9 Innings Percentage
1970 181 # 32.8 # .262 # 4.96 # 0.40 1.15 # 3.34 6.77 .948
1971 192 34.4 .267 5.28 0.46 1.16 3.47 6.92 .948
1972 202 34.1 .266 5.01 0.44 # 1.09 3.35 6.69 .949
1973 203 34.0 .266 5.07 0.42 1.13 3.46 6.60 .949
1974¢ 187 38.4 .274 5.33 0.49 1.24 3.79 5.94 .949
1975 168 39.0 .273 5.38 0.50 1.30 3.76 6.13 .950
1976 194 41.9 .282 5.65 0.55 1.45 3.91 6.02 .950
1977 210 42.5 .286 5.83 0.62 1.34 4.22 6.11 .948
1978 213 42.9 .288 6.08 0.66 1.39 4.37 5.97 .947
1979 220 43.6 .289 6.09 0.62 1.49 4.42 5.72 .948
1980 211 44.6 .295 6.22 0.66 1.36 4.59 5.60 .948
1981 237 48.4 .300 6.52 0.74 1.49 5.05 # 5.51 # .946
1982 222 46.8 .298 6.39 0.69 * 1.52 4.95 5.56 .948
1983 225 44.8 .297 6.44 0.76 1.48 5.02 5.73 .948
1984 240 48.3 .295 6.41 0.78 1.42 5.06 5.94 .948
1985 250 51.9 .306 6.94 0.92 1.47 5.51 5.96 .948
1986 254 50.0 .301 6.79 0.89 1.48 5.42 6.10 .947
1987 263 48.9 .299 6.72 0.89 1.45 5.38 6.19 .949
1988 266 51.2 .297 6.53 0.84 1.38 5.29 6.28 .950
1989 259 49.9 .289 6.15 0.67 1.40 4.94 6.22 .953
1990 256 52.0 .290 6.07 0.66 1.41 4.88 6.09 .952
1991 262 52.6 .294 6.30 0.73 1.36 5.11 6.21 .952
1992 268 50.8 .291 6.18 0.68 1.36 5.10 6.23 .954
1993 271 50.1 .288 6.08 0.72 1.37 5.10 6.27 .953
1994 273 51.9 .290 6.24 0.69 1.36 5.16 6.36 .952
1995 271 53.1 .289 6.20 0.70 1.30 5.19 6.49 .953
1996 271 52.3 .294 6.48 0.77 1.30 5.47 6.66 .952
1997 273 53.1 .304 7.00 0.96 1.26 5.93 6.94 .951
1998 273 52.4 * .306 * 7.12 * 1.06 1.29 * 6.12 7.07 .952
1999 274 54.9 .303 6.93 0.95 1.30 5.94 * 7.12 .952

Division I Baseball Statistics Trends
(2000-2008) Averages are per game for each team.
Avg. Batting Home Runs Stolen Bases Earned-Run Strikeouts Fielding
Year Teams† Games% Average Scoring Per Game Per Game Average Per 9 Innings Percentage
2000 281 54.8 .297 6.53 0.80 1.29 5.56 6.79 .954
2001 280 54.9 .296 6.44 0.81 1.24 5.50 6.85 .955
2002 282 55.1 .296 6.45 0.83 1.22 5.49 6.84 .955
2003 284 53.8 .291 6.11 0.74 1.15 5.23 6.79 .958
2004 285 55.3 .291 6.17 0.77 1.14 5.29 6.86 .959
2005 283 55.1 .290 6.14 0.70 1.19 5.13 6.75 .959
2006 285 * 56.2 .291 6.15 0.68 1.17 5.14 6.62 .960
2007 282 55.7 .291 6.10 0.68 1.15 5.12 6.63 *.961
2008 * 286 55.6 .296 6.57 0.84 1.14 5.59 6.84 .961
† Teams reporting statistics, not necessarily the total number of teams in the division; % Average numbers of games played by each team that year. ¢ First year of aluminum bat; * Record high;
# Record low.

39
COLLEGE WORLD SERIES INDIVIDUAL BATTING LEADERS (Minimum: 15 plate appearances)
YEAR PLAYER, POSITION, SCHOOL AVG. G AB R H RBI 2B 3B HR
1970 Jerry Lundin, ss, Iowa St. .533 3 15 3 8 6 1 1 0
1971 Larry Calufetti, c, Southern Ill. .533 5 15 2 8 4 2 0 0
1972 Bobby Jack, 1b-3b, Oklahoma .461 3 13 2 6 1 0 0 1
1973 Keith Moreland, 3b, Texas .471 4 17 2 8 3 0 0 1
1974 Keith Moreland, 3b, Texas .500 4 18 3 9 7 2 0 1
1975 Kelly Snider, 1b, Oklahoma .471 4 17 2 8 2 1 0 0
1976 Pete Van Horne, rf, Arizona .520 6 25 8 13 6 3 1 1
1977 Mike Henderson, ss, Arizona St. .462 6 26 7 12 3 3 0 0
1978 Tim Tolman, lf, Southern California .535 5 15 6 8 2 0 1 0
1979 Kevin Shannon, c, Texas .625 4 8 3 5 3 1 0 0
1980 Tom Colburn, c, California .500 5 18 7 9 9 1 0 2
1981 Jim Curl, 1b, South Carolina .500 4 18 4 9 4 1 0 2
1982 Spike Owen, ss, Texas .529 4 17 6 9 0 4 2 0
1983 Dave Magadan, 1b, Alabama .550 5 20 3 11 5 1 0 1
1984 Mike Day, c, Oklahoma St. .545 5 22 9 12 2 2 1 0
1985 Jeff King, 3b, Arkansas .500 4 18 6 9 2 1 0 1
1986 Robin Ventura, 3b, Oklahoma St. .600 3 15 3 9 5 3 0 0
1987 Jimmy Barragan, 1b, Oklahoma St. .500 5 20 3 10 2 0 0 1
1988 Mark Standiford, 2b, Wichita St. .563 4 16 4 9 5 1 0 2
1989 Craig Newkirk, 3b, Texas .500 4 16 7 8 7 2 0 2
1990 Bobby Carlsen, 3b, Oklahoma St. .500 4 14 7 7 4 3 1 0
1991 Kevin Polcovich, ss, Florida .538 4 13 3 7 0 0 0 0
1992 Phil Nevin, 3b, Cal St. Fullerton .526 4 19 7 10 11 2 0 2
1993 Jeff Liefer, dh, Long Beach St. .500 4 18 5 9 4 0 0 2
1994 Rick Gutierrez, 2b, Oklahoma .563 4 16 2 9 6 2 0 0
1995 Mark Kotsay, of-p, Cal St. Fullerton .563 4 16 7 9 10 2 0 3
1996 Rudy Gomez, 2b, Miami (Fla.) .529 4 17 6 9 4 3 0 0
1997 Tom Bernhardt, rf, LSU .615 4 13 5 8 5 2 0 1
1998 Jason Lane, dh-p, Southern California .517 6 29 9 15 9 4 0 4
1999 John Gall, 1b, Stanford .611 4 18 5 11 6 1 0 2
2000 Damien Alvarado, c, Stanford .500 4 14 6 7 3 1 0 0
Joe Borchard, rf, Stanford .500 4 14 5 7 4 0 0 1
Jarvis Larry, dh, La.-Lafayette .500 4 12 3 6 3 2 0 1
2001 Danny Matienzo, dh, Miami (Fla.) .588 4 17 7 10 9 1 0 3
2002 Victor Menocal, ss, Georgia Tech .562 3 16 6 9 2 0 1 0
2003 P.J. Pilittere, dh, Cal St. Fullerton .500 4 12 4 6 3 1 1 1
2004 Steve Pearce, 1b, South Carolina .571 5 21 5 12 5 1 0 1
2005 David Maroul, 3b, Texas .500 5 16 3 8 8 2 0 2
2006 David Cooper, dh, Cal St. Fullerton .533 4 15 2 8 5 0 0 1
2007 Scott Santschi, rf, Oregon St. .538 5 13 3 7 5 0 0 1
2008 Gordon Beckham, ss, Georgia .523 6 23 7 12 5 1 0 2

40
COLLEGE WORLD SERIES INDIVIDUAL PITCHING LEADERS (Minimum: 10 innings)
YEAR PLAYER, SCHOOL G CG W-L ERA IP H R ER BB SO
1970 Pat Osborn, Florida St. 2 1 1-0 0.00 13.0 8 0 0 2 18
1971 Mark Sogge, Southern California 2 2 2-0 1.50 18.0 15 3 3 7 12
1972 Russ McQueen, Southern California 4 0 3-0 0.00 14.0 4 0 0 2 14
Jackson Todd, Oklahoma 2 1 1-0 0.00 14.0 8 3 0 1 15
1973 Jim Otten, Arizona St. 2 1 1-0 0.59 15.1 8 5 1 7 12
1974 Rick Floyd, Miami (Fla.) 3 0 0-1 0.00 10.2 8 3 1 1 2
1975 John Poloni, Arizona St. 1 1 1-0 0.00 11.0 4 0 0 1 8
Bob Owchinko, Eastern Mich. 2 1 1-0 0.00 11.0 8 1 0 4 8
1976 Mitch Dean, Arizona St. 2 0 0-0 0.82 11.0 7 3 1 2 7
1977 Jerry Vasquez, Arizona St. 3 2 2-0 2.02 22.2 17 10 5 2 13
1978 Augie Ruiz, Miami (Fla.) 2 0 1-1 1.54 11.2 4 2 2 11 8
1979 Tony Hudson, Cal St. Fullerton 4 0 0-0 0.00 11.1 4 1 0 4 9
1980 Craig Lefferts, Arizona 2 1 2-0 0.57 15.2 15 3 1 3 9
1981 Don Mundie, Mississippi St. 2 2 1-1 1.00 18.0 16 6 2 4 2
1982 Roger Clemens, Texas 2 2 1-1 1.06 17.0 12 3 2 9 12
1983 Calvin Schiraldi, Texas 2 1 2-1 0.63 14.1 8 1 1 3 6
1984 Eddie Delzer, Cal St. Fullerton 2 0 2-0 1.22 14.2 7 4 2 6 16
1985 Ric Raether, Miami (Fla.) 5 0 2-0 1.50 12.0 9 2 2 4 13
1986 Kevin Ryan, Miami (Fla.) 2 0 1-0 0.87 10.1 4 2 1 2 3
1987 Gregg Patterson, LSU 2 1 2-0 1.96 18.1 11 4 4 3 11
1988 Brian Dodd, Arizona St. 2 0 0-0 0.00 11.1 4 1 0 6 7
1989 Kirk Dressendorfer, Texas 2 1 2-0 1.20 15.0 11 5 2 11 13
1990 Mike Rebhan, Georgia 2 2 2-0 1.00 18.0 11 3 2 3 13
1991 Chad Ogea, LSU 3 0 2-0 1.74 10.1 5 3 2 4 7
1992 Patrick Ahearne, Pepperdine 2 0 2-0 0.00 14.0 6 1 0 5 12
1993 Marc Barcelo, Arizona St. 1 1 0-1 0.82 11.0 9 4 1 0 8
1994 Dan Ricabal, Cal St. Fullerton 3 0 2-0 0.00 11.0 3 0 0 1 8
1995 Randy Flores, Southern California 2 1 2-0 2.87 15.2 19 7 5 4 8
1996 John Kaufman, Florida 2 0 1-1 2.08 13.0 9 4 3 6 12
1997 Jeff Austin, Stanford 2 0 1-0 0.00 10.1 8 0 0 2 10
1998 Aaron Kramer, Arizona St. 4 0 0-0 4.38 12.1 11 11 6 3 6
1999 Chris Chavez, Florida St. 3 1 2-0 1.26 14.1 9 3 2 4 13
2000 Jon McDonald, Florida St. 2 1 1-0 0.87 10.1 5 3 1 4 7
2001 Tom Farmer, Miami (Fla.) 2 0 2-0 4.22 10.2 10 5 5 4 8
2002 Steven Bondurant, South Carolina 2 1 1-0 2.31 11.2 13 3 3 4 7
2003 John Hudgins, Stanford 3 1 3-0 1.88 24.0 17 6 5 6 15
2004 J.P. Howell, Texas 2 0 1-0 0.77 11.2 8 4 1 8 13
2005 J. Brent Cox, Texas 5 0 1-0 0.00 10.1 3 0 0 5 12
2006 Jonah Nickerson, Oregon St. 3 0 2-0 0.80 21.1 12 4 2 4 19
2007 Joe Paterson, Oregon St. 5 0 0-0 1.74 10.1 8 3 2 1 10
2008 Justin Wilson, Fresno St. 3 0 2-0 2.21 20.1 18 5 5 11 20

41
JACK DIESING SR. MOST OUTSTANDING PLAYER AWARD (60)
YEAR PLAYER TEAM CLASS POSITION
1949 Tom Hamilton Texas Sr. 1b
1950 *Ray VanCleef Rutgers Jr. of
1951 *Sidney Hatfield Tennessee Jr. 1b-p
1952 James O'Neill Holy Cross Sr. p
1953 *J.L. Smith Texas Jr. p
1954 *Tom Yewcic Michigan St. Sr. c
1955 *Tom Borland Oklahoma St. Sr. p
1956 Jerry Thomas Minnesota Jr. p
1957 *Cal Emery Penn St. So. lb-p
1958 Bill Thom Southern California Jr. p
1959 Jim Dobson Oklahoma St. So. 3b
1960 John Erickson Minnesota Sr. 2b
1961 *Littleton Fowler Oklahoma St. So. p
1962 *Bob Garibaldi Santa Clara So. p
1963 Bud Hollowell Southern California Jr. c
1964 *Joe Ferris Maine So. p
1965 Sal Bando Arizona St. Sr. 3b
1966 Steve Arlin Ohio St. Jr. p
1967 Ron Davini Arizona St. Jr. c
1968 Bill Seinsoth Southern California Jr. 1b
1969 John Dolinsek Arizona St. Jr. of
1970 *Gene Ammann Florida St. Jr. p
1971 *Jerry Tabb Tulsa Fr. 1b
1972 Russ McQueen Southern California So. p
1973 *Dave Winfield Minnesota Sr. of-p
1974 George Milke Southern California So. p
1975 Mickey Reichenbach Texas So. 1b
1976 Steve Powers Arizona Sr. dh-p
1977 Bob Horner Arizona St. So. 2b
1978 Rod Boxberger Southern California Jr. p
1979 Tony Hudson Cal St. Fullerton So. p
1980 Terry Francona Arizona Jr. of
1981 Stan Holmes Arizona St. Sr. of
1982 Dan Smith Miami (Fla.) Jr. p
1983 Calvin Schiraldi Texas Jr. p
1984 John Fishel Cal St. Fullerton Jr. of
1985 Greg Ellena Miami (Fla.) Jr. dh
1986 Mike Senne Arizona Sr. of
1987 Paul Carey Stanford Fr. Of
1988 Lee Plemel Stanford Sr. p
1989 Greg Brummett Wichita St. Sr. p
1990 Mike Rebhan Georgia Sr. p

42
JACK DIESING SR. MOST OUTSTANDING PLAYER AWARD
YEAR PLAYER TEAM CLASS POSITION
1991 Gary Hymel LSU Sr. c
1992 *Phil Nevin Cal St. Fullerton Jr. 3b
1993 Todd Walker LSU So. 2b
1994 Chip Glass Oklahoma Sr. of
1995 Mark Kotsay Cal St. Fullerton So. of-p
1996 *Pat Burrell Miami (Fla.) Fr. 3b
1997 Brandon Larson LSU Jr. ss
1998 Wes Rachels Southern California Sr. 2b
1999 *Marshall McDougall Florida St. Jr. 2b
2000 Trey Hodges LSU Sr. p
2001 Charlton Jimerson Miami (Fla.) Sr. of
2002 Huston Street Texas Fr. p
2003 *John Hudgins Stanford Jr. p
2004 Jason Windsor Cal St. Fullerton Sr. p
2005 David Maroul Texas Sr. 3b
2006 Jonah Nickerson Oregon St. Jr. p
2007 Jorge Reyes Oregon St. Fr. P
2008 Tommy Mendonca Fresno St. So. 3b
* Not on national championship team.
MOST OUTSTANDING PLAYER BY TEAM
Southern California 7 Arizona 3
Texas 6 Minnesota 3
Arizona St. 5 Oklahoma St. 3
Cal St. Fullerton 5 Stanford 3
LSU 4 Florida St. 2
Miami (Fla.) 4 Oregon St. 2
(13 teams have one each)
MOST OUTSTANDING PLAYER BY CLASS
Freshmen 5
Sophomores 13
Juniors 22
Seniors 20

43
ALL TOURNAMENT TEAMS (1958-1965)
1958
Sonny Siebert, Missouri, 1b
Mike Castanon, Southern California, 2b, Jr.
Ken Komodzinski, Holy Cross, 3b, So.
Fred Scott, Southern California, ss, Jr.
Martin Toft, Missouri, of
Marvin Winegar, Western Mich., of, Sr.
Ron Fairly, Southern California, of, So.
Hank Kuhlmann, Missouri, c
Bill Thom, Southern California, p, Jr.
Doug Gulick, Missouri, p, (jr or sr.)
1959
Bob Wilson, Arizona, 1b, Sr.
Bruce Andrew, Oklahoma St., 2b, So.
Jim Dobson, Oklahoma St., 3b, So.
Charles Shoemaker, Arizona, ss, So.
Doug Hoffman, Clemson, of
Bailey Hendley, Clemson, of
Connie McIlvoy, Oklahoma St., of, Sr.
Alan Hall, Arizona, c, Jr.
Hal Stowe, Clemson, p
Joel Horlen, Oklahoma St., p, Sr.
1960
William Ryan, Southern California, 1b, So.
John Erickson, Minnesota, 2b
Cal Rolloff, Minnesota, 3b
Dave Pflepsen, Minnesota, ss
Bob Levingston, Southern California, of, So.
Mickey McNamee, Southern California, of, Jr.
Art Ersepke, Southern California, of, Jr.
Bill Heath, Southern California, c, Sr.
Bruce Gardner, Southern California, p, Sr.
Bob Wasko, Minnesota, p
Jim Ward, Arizona, p, Sr.
1961
William Ryan, Southern California, 1b, Jr.
Bruce Andrew, Oklahoma St., 2b, Sr.
Dave Sarette, Syracuse, 3b, Sr.
Don Wallace, Oklahoma St., ss, Jr.
Bill Tomb, Western Mich., of, So.
Don Davis, Duke, of, So.
Art Ersepke, Southern California, of, Sr.
Larry Himes, Southern California, c, Jr.
Littleton Fowler, Oklahoma St., p, So.
Jim Withers, Southern California, p, Sr.
Larry Hankhammer, Southern California, p, Sr.
1962
Dave Campbell, Michigan, 1b, So.
Pat Rigby, Texas, 2b, Sr.
Harvey Chapman, Michigan, 3b, So.
Ernie Fazio, Santa Clara, ss
Ron Tate, Michigan, of, So.
Ken Flanagan, Santa Clara, of
Mickey McDermott, Santa Clara, of
Joe Merullo, Michigan, c, Sr.
Tom Belcher, Texas, p, Sr.
Bob Garibaldi, Santa Clara, p
1963
Gary Holman, Southern California, 1b, So.
Ron Theobald, Arizona, 2b, So.
Dale Harvey, Missouri, 3b
William Woodward, Florida St., ss, Jr.
Kenny Washington, Southern California, of, Sr.
Craig Morrison, Arizona, of, Sr.
Hector Barnetche, Arizona, of, So.
Bud Hollowell, Southern California, c, Jr.
Walt Peterson, Southern California, p, So.
Doug Holliker, Arizona, p, So.
1964
Bill Davis, Minnesota, 1b
Dewey Markus, Minnesota, 2b
Dave Thompson, Maine, 3b, Sr.
Gary Sutherland, Southern California, ss, So.
Dan Hoffman, Minnesota, of
Gary Woods, Missouri, of
Willie Brown, Southern California, of, Sr.
Ron Wojciak, Minnesota, c
Joe Ferris, Maine, p, So.
Joe Pollack, Minnesota, p
1965
Arnold Chonko, Ohio St., 1b, Sr.
Luis Lagunas, Arizona St., 2b, Sr.
Sal Bando, Arizona St., 3b, Jr.
Bo Rein, Ohio St., ss, So.
Rick Monday, Arizona St., of, So.
Bob Fry, Washington St., of, Sr.
Jim Dix, St. Louis, of, Sr.
Chuck Brinkman, Ohio St., c, Jr.
Steve Arlin, Ohio St., p, So.
Doug Nurnberg, Arizona St., p, So.

44
ALL TOURNAMENT TEAMS (1966-1973)
1966
Russ Nagelson, Ohio St., 1b, Sr.
Matt Galante, St. John's (N.Y.), 2b, Jr.
Bob Toney, Oklahoma St., 3b
Joe Russo, St. John's (N.Y.), ss, Sr,
Ray Shoup, Ohio St., of, Jr.
Wayne Weatherly, Oklahoma St., of, So.
Bo Rein, Ohio St., of, Jr.
Chuck Brinkman, Ohio St., c, Sr.
Steve Arlin, Ohio St., p, Jr.
John Stewart, Southern California, p, Sr.
1967
Mark Marquess, Stanford, 1b, So.
Dick Swan, Stanford, 2b, Sr.
Dave Grangaard, Arizona St., 3b, Fr.
Jack Lind, Arizona St., ss, Jr.
Ike Lucas, Houston, of
Tom Paciorek, Houston, of
Scott Reid, Arizona St., of, Jr.
Ron Davini, Arizona St., c, Fr.
Gary Gentry, Arizona St., p, Jr.
Q.V. Lowe, Auburn, p, Sr.
1968
Bill Seinsoth, Southern California, 1b, Jr.
Lou Bagwell, Texas, 2b, So.
Barry O'Sullivan, Southern Ill., 3b, Jr.
Danny Thompson, Oklahoma St., ss, Jr.
Wayne Weatherly, Oklahoma St., of, Sr.
Jerry Bond, Southern Ill., of, So.
Mike Rogodzinski, Southern Ill., of, So.
Ralph Addonizio, St. John's (N.Y.), c, Sr.
Bill Lee, Southern California, p, Sr.
Tom Sowinski, St. John's (N.Y.), p, Sr.
1969
Steve Caves, Tulsa, 1b
Lou Bagwell, Texas, 2b, Jr.
Les Rogers, Tulsa, 3b
Roger Detter, Arizona St., ss, , Sr.
John Dolinsek, Arizona St., of, Jr.
Paul Powell, Arizona St., of, Jr.
Jim Cardasis, New York U., of, Sr.
Billy Cotton, Arizona St., c, Jr.
Larry Gura, Arizona St., p, Sr.
Burt Hooton, Texas, p, Fr.
1970
John Langerhans, Texas, 1b, So.
Frank Alfano, Southern California, 2b, Jr.
Dan Stoligrosz, Southern California, 3b, Sr.
Jerry Lundin, Iowa St., ss, Jr.
John Grubb, Florida St., of, Jr.
Gary Shade, Ohio, of, Jr.
Mike Markl, Texas, of, So.
Tommy Harmon, Texas, c, Jr.
Gene Ammann, Florida St., p, Jr.
Jim Barr, Southern California, p, Sr.
1971
Jerry Tabb, Tulsa, 1b, Fr.
Frank Alfano, Southern California, 2b, Sr.
Mike Eden, Southern Ill., 3b, Jr.
Dan Radison, Southern Ill., ss, Jr.
Fred Lynn, Southern California, of, Fr.
Steve Bowling, Tulsa, of, Fr.
Jim Dwyer, Southern Ill., of, Jr.
Larry Calufetti, Southern Ill., c, So.
Mark Sogge, Southern California, p, Jr.
Steve Rogers, Tulsa, p, Sr.
1972
Daryl Arenstein, Southern California, 1b, Jr.
Ken Reed, Arizona St., 2b, Sr.
David Chalk, Texas, 3b, Sr.
Steve Dillard, Mississippi, ss, So.
Bump Wills, Arizona St., of, So.
Tim Steele, Southern California, of, Sr.
Gary Atwell, Arizona St., of, Jr.
Sam Ceci, Southern California, c, Sr.
Russ McQueen, Southern California, p, So.
Craig Swan, Arizona St., p, Sr.
1973
Clay Westlake, Arizona St., 1b, Fr.
Bill Berger, Arizona St., 2b, Sr.
Keith Moreland, Texas, 3b, Fr.
Roy Smalley, Southern California, ss, Jr.
Terry Pyka, Texas, of, Jr.
Carl Person, Ga. Southern, of, Jr.
Ken Huizenga, Southern California, of, So.
Clint Meyers, Arizona St., c, Jr.
Dave Winfield, Minnesota, p
Eddie Bane, Arizona St., p, Jr.
Randy Scarbery, Southern California, p, Jr.
Bob Shirley, Oklahoma, p, Fr.

45
ALL TOURNAMENT TEAMS (1974-1981)
1974
Orlando Gonzalez, Miami (Fla.), 1b, Sr.
Rob Adolph, Southern California, 2b, Sr.
Rich Dauer, Southern California, 3b, Sr.
Marvin Cobb, Southern California, ss, Jr.
Manny Trujillo, Miami (Fla.), of, Sr.
Bob Mitchell, Southern California, of, Fr.
Tom Ball, Texas, of, Sr.
Ron Scott, Miami (Fla.), c, Jr.
George Milke, Southern California, p, So.
Mark Barr, Southern California, p, Sr.
Stan Jakubowski, Miami (Fla.), p, So.
1975
Mickey Reichenbach, Texas, 1b, So.
Mark Van Bever, South Carolina, 2b, So.
Gary Allenson, Arizona St., 3b, Jr.
Blair Stouffer, Texas, ss, Jr.
Bob Pate, Arizona St., of, Jr.
Steve Cook, South Carolina, of, Jr.
Rick Bradley, Texas, of, Jr.
Rick Cerone, Seton Hall, c, Jr.
Earl Bass, South Carolina, p, Jr.
Richard Wortham, Texas, p, Jr.
1976
Ken Phelps, Arizona St., 1b, Sr.
Dan Schmitz, Eastern Mich., 2b, Jr.
Brian Petroff, Eastern Mich., 3b, Fr.
Russ Quetti, Maine, ss, So.
Dave Stegman, Arizona, of, Sr.
Ken Landreaux, Arizona St., of, Jr.
Pete Van Horne, Arizona, of, Jr.
Ron Hassey, Arizona, c, Sr.
Steve Powers, Arizona, dh, Sr.
Bob Owchinko, Eastern Mich., p, Sr.
Bob Chaulk, Arizona, p, Jr.
1977
Chris Nyman, Arizona St., 1b, Sr.
Bob Horner, Arizona St., 2b, So.
Brandt Humphry, Arizona St., 3b, Jr.
Mike Henderson, Arizona St., ss, Sr.
Chuck McLean, South Carolina, lf, Jr.
Mookie Wilson, South Carolina, cf, Jr.
David Caldwell, Clemson, rf, Jr.
Steve Stieb, Southern Ill., c, Jr.
Jamie Allen, Arizona St., dh, Fr.
Jerry Vasquez, Arizona St., p, Jr.
Randy Martz, South Carolina, p, Jr.
1978
Dave Hostetler, Southern California, 1b, Sr.
Mike Fox, North Carolina, 2b, Sr.
Bob Horner, Arizona St., 3b, Jr.
Doug Stokke, Southern California, ss, Sr.
Tim Tolman, Southern California, lf, Sr.
John Wells, Southern California, cf, Jr.
Steve Michael, Arizona St., rf, Jr.
Chris Bando, Arizona St., c, Sr.
Randy Guerra, Miami (Fla.), dh, Jr.
Rod Boxberger, Southern California, p, Jr.
Casey Lindsey, Arizona St., p, Jr.
1979
Tim Wallach, Cal St. Fullerton, 1b, Sr.
Mike Gates, Pepperdine, 2b, Sr.
Dan Hanggie, Cal St. Fullerton, 3b, So.
Larry Wallace, Arkansas, ss, Sr.
Marc Brumble, Arkansas, lf, Sr.
Kevin McReynolds, Arkansas, cf, Fr.
Matt Vejar, Cal St. Fullerton, rf, Jr.
Kurt Kingsolver, Cal St. Fullerton, c, Jr.
Keith Walker, Texas, dh, Jr.
Tony Hudson, Cal St. Fullerton, p, So.
Steve Krueger, Arkansas, p, Jr.
1980
Wes Clements, Arizona, 1b, Sr.
Paul Hundhammer, Miami (Fla.), 2b, Sr.
Kimo Perkins, Hawaii, 3b, Jr.
Eric Tokunaga, Hawaii, ss, Jr.
Terry Francona, Arizona, lf, Jr.
Lyle Brackenridge, California, cf, Sr.
Jim Paciorek, Michigan, rf, So.
Collin Tanabe, Hawaii, c, Jr.
Paul Maruffi, St. John's (N.Y.), dh, Jr.
Craig Lefferts, Arizona, p, Sr.
Greg Barger, Arizona, p, Jr.
1981
Alvin Davis, Arizona St., 1b, Jr.
Ray Etchebarren, Oklahoma St., 2b
Mike Sodders, Arizona St., 3b, Sr.
Rod Carraway, South Carolina, ss, Sr.
Stan Holmes, Arizona St., of, Sr.
Mickey Tettleton, Oklahoma St., of, Jr.
Mark Gillaspie, Mississippi St., of, Sr.
Burk Goldthorn, Texas, c, Sr.
Lemmie Miller, Arizona St., dh, Jr.
Kevin Dukes, Arizona St., p, Sr.
Don Mundie, Mississippi St., p, Sr.
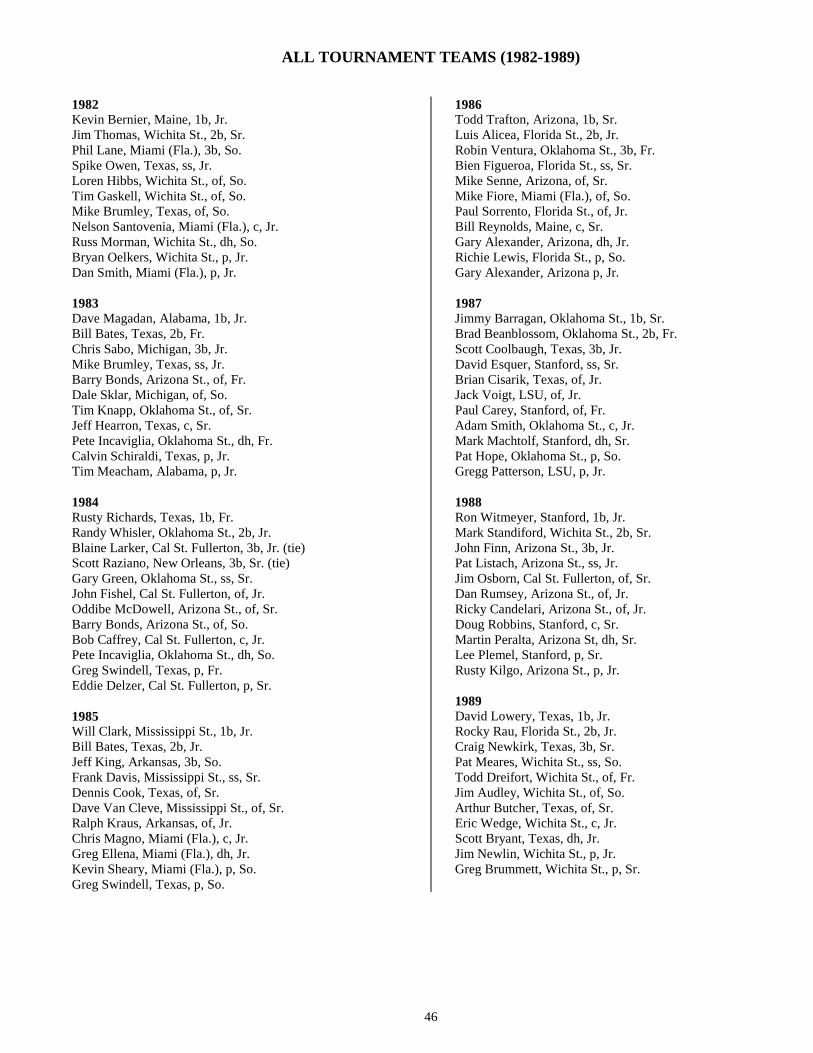
46
ALL TOURNAMENT TEAMS (1982-1989)
1982
Kevin Bernier, Maine, 1b, Jr.
Jim Thomas, Wichita St., 2b, Sr.
Phil Lane, Miami (Fla.), 3b, So.
Spike Owen, Texas, ss, Jr.
Loren Hibbs, Wichita St., of, So.
Tim Gaskell, Wichita St., of, So.
Mike Brumley, Texas, of, So.
Nelson Santovenia, Miami (Fla.), c, Jr.
Russ Morman, Wichita St., dh, So.
Bryan Oelkers, Wichita St., p, Jr.
Dan Smith, Miami (Fla.), p, Jr.
1983
Dave Magadan, Alabama, 1b, Jr.
Bill Bates, Texas, 2b, Fr.
Chris Sabo, Michigan, 3b, Jr.
Mike Brumley, Texas, ss, Jr.
Barry Bonds, Arizona St., of, Fr.
Dale Sklar, Michigan, of, So.
Tim Knapp, Oklahoma St., of, Sr.
Jeff Hearron, Texas, c, Sr.
Pete Incaviglia, Oklahoma St., dh, Fr.
Calvin Schiraldi, Texas, p, Jr.
Tim Meacham, Alabama, p, Jr.
1984
Rusty Richards, Texas, 1b, Fr.
Randy Whisler, Oklahoma St., 2b, Jr.
Blaine Larker, Cal St. Fullerton, 3b, Jr. (tie)
Scott Raziano, New Orleans, 3b, Sr. (tie)
Gary Green, Oklahoma St., ss, Sr.
John Fishel, Cal St. Fullerton, of, Jr.
Oddibe McDowell, Arizona St., of, Sr.
Barry Bonds, Arizona St., of, So.
Bob Caffrey, Cal St. Fullerton, c, Jr.
Pete Incaviglia, Oklahoma St., dh, So.
Greg Swindell, Texas, p, Fr.
Eddie Delzer, Cal St. Fullerton, p, Sr.
1985
Will Clark, Mississippi St., 1b, Jr.
Bill Bates, Texas, 2b, Jr.
Jeff King, Arkansas, 3b, So.
Frank Davis, Mississippi St., ss, Sr.
Dennis Cook, Texas, of, Sr.
Dave Van Cleve, Mississippi St., of, Sr.
Ralph Kraus, Arkansas, of, Jr.
Chris Magno, Miami (Fla.), c, Jr.
Greg Ellena, Miami (Fla.), dh, Jr.
Kevin Sheary, Miami (Fla.), p, So.
Greg Swindell, Texas, p, So.
1986
Todd Trafton, Arizona, 1b, Sr.
Luis Alicea, Florida St., 2b, Jr.
Robin Ventura, Oklahoma St., 3b, Fr.
Bien Figueroa, Florida St., ss, Sr.
Mike Senne, Arizona, of, Sr.
Mike Fiore, Miami (Fla.), of, So.
Paul Sorrento, Florida St., of, Jr.
Bill Reynolds, Maine, c, Sr.
Gary Alexander, Arizona, dh, Jr.
Richie Lewis, Florida St., p, So.
Gary Alexander, Arizona p, Jr.
1987
Jimmy Barragan, Oklahoma St., 1b, Sr.
Brad Beanblossom, Oklahoma St., 2b, Fr.
Scott Coolbaugh, Texas, 3b, Jr.
David Esquer, Stanford, ss, Sr.
Brian Cisarik, Texas, of, Jr.
Jack Voigt, LSU, of, Jr.
Paul Carey, Stanford, of, Fr.
Adam Smith, Oklahoma St., c, Jr.
Mark Machtolf, Stanford, dh, Sr.
Pat Hope, Oklahoma St., p, So.
Gregg Patterson, LSU, p, Jr.
1988
Ron Witmeyer, Stanford, 1b, Jr.
Mark Standiford, Wichita St., 2b, Sr.
John Finn, Arizona St., 3b, Jr.
Pat Listach, Arizona St., ss, Jr.
Jim Osborn, Cal St. Fullerton, of, Sr.
Dan Rumsey, Arizona St., of, Jr.
Ricky Candelari, Arizona St., of, Jr.
Doug Robbins, Stanford, c, Sr.
Martin Peralta, Arizona St, dh, Sr.
Lee Plemel, Stanford, p, Sr.
Rusty Kilgo, Arizona St., p, Jr.
1989
David Lowery, Texas, 1b, Jr.
Rocky Rau, Florida St., 2b, Jr.
Craig Newkirk, Texas, 3b, Sr.
Pat Meares, Wichita St., ss, So.
Todd Dreifort, Wichita St., of, Fr.
Jim Audley, Wichita St., of, So.
Arthur Butcher, Texas, of, Sr.
Eric Wedge, Wichita St., c, Jr.
Scott Bryant, Texas, dh, Jr.
Jim Newlin, Wichita St., p, Jr.
Greg Brummett, Wichita St., p, Sr.

47
ALL TOURNAMENT TEAMS (1990-1997)
1990 Doug Radziewicz, Georgia, 1b, Jr.
Troy Paulsen, Stanford, 2b, Jr.
Bobby Carlsen, Oklahoma St., 3b, Sr.
Brad Beanblossom, Oklahoma St., ss, Sr.
Tim Clark, LSU, of, Jr.
Jeff Hammonds, Stanford, of, Fr.
Jason Rychlick, Citadel, of, Jr.
Michael Daniel, Oklahoma St., c, Jr.
Lyle Mouton, LSU, dh, Jr.
Dave Fleming, Georgia, p, Jr.
Mike Rebhan, Georgia, p, Sr.
1991 John Tellechea, LSU, 1b, Sr.
Mike McCafferty, Creighton, 2b, Sr.
Jason Giambi, Long Beach St., 3b, So.
Kevin Polcovich, Florida, ss, Jr.
Lyle Mouton, LSU, of, Sr.
Jim Audley, Wichita St., of, Sr.
Steve Hinton, Creighton, of, Jr.
Gary Hymel, LSU, c, Sr.
Mario Linares, Florida, dh, Sr.
Kennie Steenstra, Wichita St., p, So.
Chad Ogea, LSU, p, Jr.
1992
Dan Melendez, Pepperdine, 1b, Jr.
Steve Rodriguez, Pepperdine, 2b, Jr.
Phil Nevin, Cal St. Fullerton, 3b, Jr.
Nate Rodriquez, Cal St. Fullerton, ss, Jr.
Byron Mathews, Oklahoma, of, Jr.
Chris Powell, Cal St. Fullerton, of, Sr.
Johnathen Smith, Miami (Fla.), of, Sr.
Scott Vollmer, Pepperdine, c, Jr.
Brooks Kieschnick, Texas, dh, So.
Patrick Ahearne, Pepperdine, p, Sr.
James Popoff, Cal St. Fullerton, p, Sr.
1993
Hunter Triplett, Oklahoma St., 1b, Sr.
Todd Walker, LSU, 2b, So.
Casey Blake, Wichita St., 3b, Fr.
Jason Adams, Wichita St., ss, So.
Jim Greely, LSU, of, Sr.
Jason Heath, Oklahoma St., of, Sr.
Amanda Rios, LSU, of, Sr.
Adrian Antonini, LSU, c, Jr.
Jeff Liefer, Long Beach St., dh, Fr.
Brett Laxton, LSU, p, Fr.
Mike Sirotka, LSU, p, Sr.
1994
Ryan Minor, Oklahoma, 1b, So.
Rick Gutierrez, Oklahoma, 2b, Sr.
Antone Williamson, Arizona St., 3b, Jr.
Nomar Garciaparra, Georgia Tech, ss, Jr.
Mark Kotsay, Cal St. Fullerton, of, Fr.
Darvin Traylor, Oklahoma, of, Sr.
Chip Glass, Oklahoma, of, Sr.
Jason Varitek, Georgia Tech, c, Sr.
Todd Walker, LSU, dh, Jr.
Mark Redman, Oklahoma, p, So.
Brad Rigby, Georgia Tech, p, Jr.
1995 Doug Mientkiewicz, Florida St., 1b, Jr.
Wes Rachels, Southern California, 2b, Fr.
Tony Martinez, Cal St. Fullerton, 3b, Jr.
Alex Cora, Miami (Fla.), ss, So.
J.D. Drew, Florida St., of, Fr.
Geoff Jenkins, Southern California, of, Jr.
Mark Kotsay, Cal St. Fullerton, of, So.
Brian Loyd, Cal St. Fullerton, c, So.
Scott Schroeffel, Tennessee, dh, Jr.
Randy Flores, Southern California, p, So.
Ted Silva, Cal St. Fullerton, p, Jr.
1996
Chris Moller, Alabama, 1b, Sr.
Rudy Gomez, Miami (Fla.), 2b, Jr.
Pat Burrell, Miami (Fla.), 3b, Fr.
Alex Cora, Miami (Fla.), ss, Jr.
Justin Bowles, LSU, of, Sr.
Michael DeCelle, Miami (Fla.), of, Jr.
Brad Wilkerson, Florida, of, Fr.
Tim Lanier, LSU, c, Sr.
Chuck Hazzard, Florida, dh, So.
J.D. Arteaga, Miami (Fla.), p, Jr.
Eddie Yarnall, LSU, p, Jr.
1997 Eddie Furniss, LSU, 1b, Jr.
Joe Caruso, Alabama, 2b, Sr.
Andy Phillips, Alabama, 3b, So.
Brandon Larson, LSU, ss, Jr.
Mike Koerner, LSU, of, Jr.
Tom Bernhardt, LSU, of, Sr.
G.W. Keller, Alabama, of, So.
Matt Frick, Alabama, c, Jr.
Mark Peer, Alabama, dh, Jr.
Jeff Austin, Stanford, p, So.
Jarrod Kingrey, Alabama, p, Jr.

48
ALL TOURNAMENT TEAMS (1998-2005)
1998 k Robb Gorr, Southern California, 1b, Jr.
Wes Rachels, Southern California, 2b, Sr.
Andrew Beinbrink, Arizona St., 3b, Jr.
Michael Collins, Arizona St., ss, Jr.
Rudy Arguellas, Arizona St., of, Sr.
Cedrick Harris, LSU, of, Fr.
Brad Ticehurst, Southern California, of, Jr.
Eric Munson, Southern California, c, So.
Jason Lane, Southern California, dh, Jr.
Alex Santos, Miami (Fla.), p, So.
Jack Krawczyk, Southern California, p, Sr.
1999 John Gall, Stanford, 1b, Jr.
Marshall McDougall, Florida St., 2b, Jr.
Lale Esquivel, Miami (Fla.), 3b, Jr.
Bobby Hill, Miami (Fla.), ss, Jr.
Matt Diaz, Florida St., of, So.
G.W. Keller, Alabama, of, Sr.
Manny Crespo, Miami (Fla.), of, So.
Jeremiah Klosterman, Florida St., c, Sr.
Sam Scott, Florida St., dh, Jr.
Chris Chavez, Florida St., p, Sr.
Michael Neu, Miami (Fla.), p, Jr.
2000
Craig Thompson, Stanford, 1b
Mike Fontenot, LSU, 2b, Fr.
Blair Barbier, LSU, 3b, Sr.
Ryan Theriot, LSU, ss, So.
Steven Feehan, La.-Lafayette, of, Sr.
Edmund Muth, Stanford, of, Sr.
Joe Borchard, Stanford, of, Jr.
Beau Craig, Southern California, c, So.
Brad Hawpe, LSU, dh, Jr.
Jon McDonald, Florida St., p, Jr.
Trey Hodges, LSU, p, Sr.
2001
Kevin Brown, Miami (Fla.), 1b, Sr.
David Bacani, Cal St. Fullerton, 2b, Sr.
Kris Bennett, Tennessee, 3b, Sr.
Chris Burke, Tennessee, ss, Jr.
Jeff Christensen, Tennessee, of, Sr.
Sam Fuld, Stanford, of, Fr.
Charlton Jimerson, Miami (Fla.), of, Sr.
Ryan Garko, Stanford, c, So.
Danny Matienzo, Miami (Fla.), dh, So.
Jeff Bruksch, Stanford, p, Jr.
Tom Farmer, Miami (Fla.), p, Sr.
2002
Michael Johnson, Clemson, 1b, Jr.
Tim Moss, Texas, 2b, So.
Omar Quintanilla, Texas, 3b, So.
Victor Menocal, Georgia Tech, ss, Sr.
Justin Harris, South Carolina, of, Jr.
Sam Fuld, Stanford, of, So.
Dustin Majewski, Texas, of, Jr.
Landon Powell, South Carolina, c, So.
Steve Stanley, Notre Dame, dh, Sr.
Justin Simmons, Texas, p, So.
Huston Street, Texas, p, Fr.
2003
Ryan Garko, Stanford, c, Sr.
Curtis Thigpen, Texas, 1b, So.
Enrique Cruz, Rice, 2b, Jr.
Jonny Ash, Stanford, 3b, Jr.
Justin Turner, Cal State Fullerton, ss, Fr.
Carlos Quentin, Stanford, of, Jr.
Danny Putnam, Stanford, of, So.
Chris Kolkhorst, Rice, of, Jr.
P.J. Pilittere, Cal State Fullerton, dh, Jr.
John Hudgins, Stanford, p, Jr.
Jeff Niemann, Rice, p, So.
2004
Landon Powell, South Carolina, c, Sr.
Steve Pearce, South Carolina, 1b, Jr.
Seth Johnston, Texas, 2b, Jr.
Bryan Triplett, South Carolina, 3b, Sr.
Roger Tomas, Miami (Fla.), ss, Fr.
Jon Jay, Miami (Fla.), of, Fr.
Trevor Crowe, Arizona, of, So.
Brian Barton, Miami (Fla.), of, Jr.
Felipe Garcia, Cal St. Fullerton, dh, Jr.
Jason Windsor, Cal St. Fullerton, p, Sr.
Ricky Romero, Cal St. Fullerton, p, So.
2005
Taylor Teagarden, Texas, c, Jr.
Jeff Larish, Arizona St., 1b, Sr.
Joey Hooft, Arizona St., 2b, Sr.
David Maroul, Texas, 3b, Sr.
Seth Johnston, Texas, ss, Sr.
Colin Curtis, Arizona St., of, So.
Travis Buck, Arizona St., of, Jr.
Andy Gerch, Nebraska, of, Fr.
Will Crouch, Texas, dh, Sr.
Kyle McCulloch, Texas, p, So.
J. Brent Cox, Texas, p, Jr.

49
ALL TOURNAMENT TEAMS (2006-2008)
2006
Tim Federowicz, North Carolina, c, Fr.
Bill Rowe, Oregon St., 1b, Sr.
Justin Turner, Cal St. Fullerton, 2b, Sr.
Shea McFeely, Oregon St., 3b, Sr.
Josh Horton, North Carolina, ss, So.
Danny Dorn, Cal St. Fullerton, of, Sr.
Cole Gillespie, Oregon St., of, Jr.
Jay Cox, North Carolina, of, Jr.
David Cooper, Cal St. Fullerton, of, Fr.
Jonah Nickerson, Oregon St., p, Jr.
Kevin Gunderson, Oregon St., p, Jr.
2007
Mitch Canham, Oregon St., c, Jr.
Dustin Ackley, North Carolina, 1b, Fr.
Joey Wong, Oregon St., 2b, Fr.
Diego Seastrunk, Rice, 3b, Fr.
Darwin Barney, Oregon St., ss, Fr.
Bryan Petersen, UC Irvine, of, Jr.
Tim Fedroff, North Carolina, of, Fr.
Scott Santschi, Oregon St., of, Sr.
Mike Lissman, Oregon St., dh, Sr.
Jorge Reyes, Oregon St., p, Fr.
Andrew Carignan, North Carolina, p, Jr.
2008
Jason Castro, Stanford, c, Jr.
Dustin Ackley, North Carolina, 1b, So.
Erik Wetzel, Fresno St., 2b, Jr.
Tommy Mendonca, Fresno St., 3b, So.
Gordon Beckham, Georgia, ss, Jr.
Tim Fedroff, North Carolina, of, So.
Steve Susdorf, Fresno St., of, Sr.
Steve Detwiler, Fresno St., of, So.
Ryan Peisel, Georgia, dh, Sr.
Alex White, North Carolina, p, So.
Justin Wilson, Fresno St., p, Jr.

50
COLLEGE WORLD SERIES ALL-TIME TEAM (1947-1995)
Mike Day, Catcher
Oklahoma St., 1982,83,84,85
Will Clark, First Base
Mississippi St., 1985
Todd Walker, Second Base
LSU, 1993,94
Robin Ventura, Third Base
Oklahoma St., 1986,87
Spike Owen, Shortstop
Texas, 1981,82
Barry Bonds, Outfield
Arizona St., 1983,84
Mark Kotsay, Outfield
Cal St. Fullerton, 1994,95
Dave Winfield, Outfield
Minnesota, 1973
Pete Incaviglia, Designated Hitter
Oklahoma St., 1983,84,85
Steve Arlin, Pitcher
Ohio St., 1965,66
Burt Hooton, Pitcher
Texas, 1969,70
Rod Dedeaux, Head Coach
Southern California, 1951,55,58,60,61,63,
64,66,68,70,71,72,73,74,78
Note: Team selected by readers of the Omaha World-Herald as part of 50th CWS celebration in 1996.
COLLEGE WORLD SERIES ALL-TIME TEAM (1947-1970)
First Team
John Boccabella, First Base
Santa Clara, 1962
Dewey Markus, Second Base
Minnesota, 1964
Sal Bando, Third Base
Arizona St., 1965
Woody Woodward, Shortstop
Florida St., 1963
Ron Fairley, Outfield
Southern California, 1958
Tom Paciorek, Outfield
Houston, 1968
John Dolinsek, Outfield
Airzona St., 1969
Bud Hollowell, Catcher
Southern California, 1963
Steve Arlin, Pitcher
Ohio St., 1965, 66
Burt Hooton, Pitcher
Texas, 1969, 70
Second Team
Bill Seinsoth, First Base
Southern California, 1968
Frank Quilici, Second Base
Western Mich., 1961
Bob Lillis, Third Base
Southern California, 1951
Don Kessinger, Shortstop
Mississippi, 1964
John Turco, Outfield
Holy Cross, 1952
Jim Morris, Outfield
Notre Dame, 1957
Bob Fry, Outfield
Washington St., 1965
Tom Yewcic, Catcher
Michigan St., 1954
Jim O'Neill, Pitcher
Holy Cross, 1952
Bob Garibaldi, Pitcher
Santa Clara, 1962 Note: Team selected by blue-ribbon committee chaired by Abe Chanin as part of the 25th CWS celebration in 1971.

51
COLLEGE WORLD SERIES ALL-DECADE TEAMS
1940-50s
P Tom Borland, Oklahoma St., 54-55
P James O'Neill, Holy Cross, 52
C Alan Hall, Arizona, 58-59-60
1B Sonny Siebert, Missouri, 58
2B Stanley Charnofsky, Southern California, 51
SS Charles Shoemaker, Arizona, 59-60
3B Ken Komodzinski, Holy Cross, 58
OF Jim Morris, Notre Dame, 57
OF John Turco, Holy Cross, 52
OF Ray VanCleef, Rutgers, 50
1960s
P Steve Arlin, Ohio St., 65-66
P Burt Hooton, Texas, 69-70
C Chuck Brinkman, Ohio St., 65-66
1B Bill Seinsoth, Southern California, 68
2B Lou Bagwell, Texas, 68-69-70
SS Danny Thompson, Oklahoma St., 68
3B Sal Bando, Arizona St., 64-65
OF John Dolinsek, Arizona St., 69
OF Scott Reid, Arizona St., 67
OF Wayne Weatherly, Oklahoma St., 66-67-68
1970s
P Eddie Bane, Arizona St., 72-73
P Russ McQueen, Southern California, 72-73
C Chris Bando, Arizona St., 77-78
1B Jerry Tabb, Tulsa, 71
2B Bob Horner, Arizona St., 76-77-78
SS Roy Smalley, Southern California, 72-73
3B Keith Moreland, Texas, 73-74-75
OF Fred Lynn, Southern California, 71-72-73
OF Kevin McReynolds, Arkansas, 79
OF Dave Winfield, Minnesota, 73
DH Steve Powers, Arizona, 76
1980s
P Greg Brummett, Wichita St., 88-89
P Craig Lefferts, Arizona, 79-80
C Mike Day, Oklahoma St., 82-83-84-85
1B Will Clark, Mississippi St., 85
2B Bill Bates, Texas, 83-84-85
SS Spike Owen, Texas, 81-82
3B Robin Ventura, Oklahoma St., 86-87
OF Barry Bonds, Arizona St., 83-84
OF Terry Francona, Arizona, 79-80
OF Stan Holmes, Arizona St., 81
DH Pete Incaviglia, Oklahoma St., 83-84-85
1990s (Through 1995)
P Patrick Ahearne, Pepperdine, 92
P Mike Rebhan, Georgia, 90
C Gary Hymel, LSU, 90-91
1B Doug Mientkiewicz, Florida St., 95
2B Todd Walker, LSU, 93-94
SS Nomar Garciaparra, Georgia Tech, 94
3B Phil Nevin, Cal St. Fullerton, 92
OF J.D. Drew, Florida St., 95
OF Geoff Jenkins, Southern California, 95
OF Mark Kotsay, Cal St. Fullerton, 94-95
DH Lyle Mouton, LSU, 90-91
HEAD COACHES
Jim Brock, Arizona St.
72-73-75-76-77-78-81-83-84-87-88-93-94
Rod Dedeaux, Southern California
51-55-58-60-61-63-64-66-68-70-71-72-73-74-78
Augie Garrido, Cal St. Fullerton
75-79-82-84-92-94-95
Cliff Gustafson, Texas
68-69-70-72-73-74-75-79-81-82-83-84-85-87-
89-92-93
Gene Stephenson, Wichita St.
82-88-89-91-92-93
Note: Teams selected as part of 50th CWS celebration in 1996 by a panel of 60 voters representing CWS head coaches, media who covered the event and chairs of the Division I Baseball Committee.

52
COLLEGE WORLD SERIES GAME TIMES (1967-2008)
GAMES GAMES
AVERAGE LONGEST SHORTEST *CHAMPIONSHIP OVER FOUR UNDER TWO
YEAR GAME TIME GAME GAME GAME HOURS HOURS
1967 2:40 3:58 2:01 2:45 0 0
1968 2:28 3:32 1:45 2:25 0 1
1969 2:09 2:48 1:39 1:39 0 5
1970 2:42 4:00 2:09 3:56 1 0
1971 2:34 3:13 1:53 2:44 0 1
1972 2:34 3:48 1:45 2:05 0 3
1973 2:19 3:07 1:57 2:28 0 2
#1974 2:25 2:46 1:55 2:41 0 1
1975 2:24 3:03 1:13 2:20 0 1
1976 2:24 3:28 1:58 2:06 0 1
1977 2:18 2:59 1:35 1:35 0 2
1978 2:29 3:00 2:01 2:32 0 0
1979 2:42 3:36 1:57 1:57 0 1
1980 2:44 4:15 2:10 2:41 1 0
1981 3:08 5:00 1:57 3:03 2 1
1982 2:52 3:46 2:04 2:48 0 0
1983 2:46 3:48 2:16 2:20 0 0
1984 3:01 4:01 2:18 2:24 1 0
1985 3:02 3:51 2:18 2:41 0 0
1986 2:52 3:45 2:22 2:44 0 0
1987 2:56 3:33 2:19 3:04 0 0
1988 2:51 3:46 2:19 2:55 0 0
1989 2:57 3:41 2:16 2:59 0 0
1990 2:48 3:31 2:07 2:53 0 0
1991 3:08 3:57 2:31 2:54 0 0
1992 3:02 4:03 2:27 2:56 1 0
1993 3:09 3:58 2:25 2:52 0 0
1994 2:54 3:50 2:19 2:50 0 0
1995 2:52 3:58 2:06 3:01 0 0
1996 3:20 3:54 2:48 3:19 0 0
1997 3:02 4:42 2:24 3:15 1 0
1998 3:17 4:17 2:38 3:59 1 0
1999 3:09 4:35 2:42 2:50 1 0
2000 3:02 3:42 2:17 3:42 0 0
2001 3:25 4:21 2:34 3:09 2 0
2002 3:02 4:01 2:41 3:19 1 0
2003 2:58 3:57 2:02 2:57 0 0
2004 3:08 3:46 2:43 2:52 0 0
2005 3:09 4:07 2:41 2:50 1 0
2006 3:07 4:53 2:15 3:09 2 0
2007 3:18 5:40 2:38 3:29 1 0
2008 3:20 4:11 2:55 2:56 1 0
# First year for designated hitter and aluminum bat.
* Includes the final game of the Championship Series, which began in 2003.
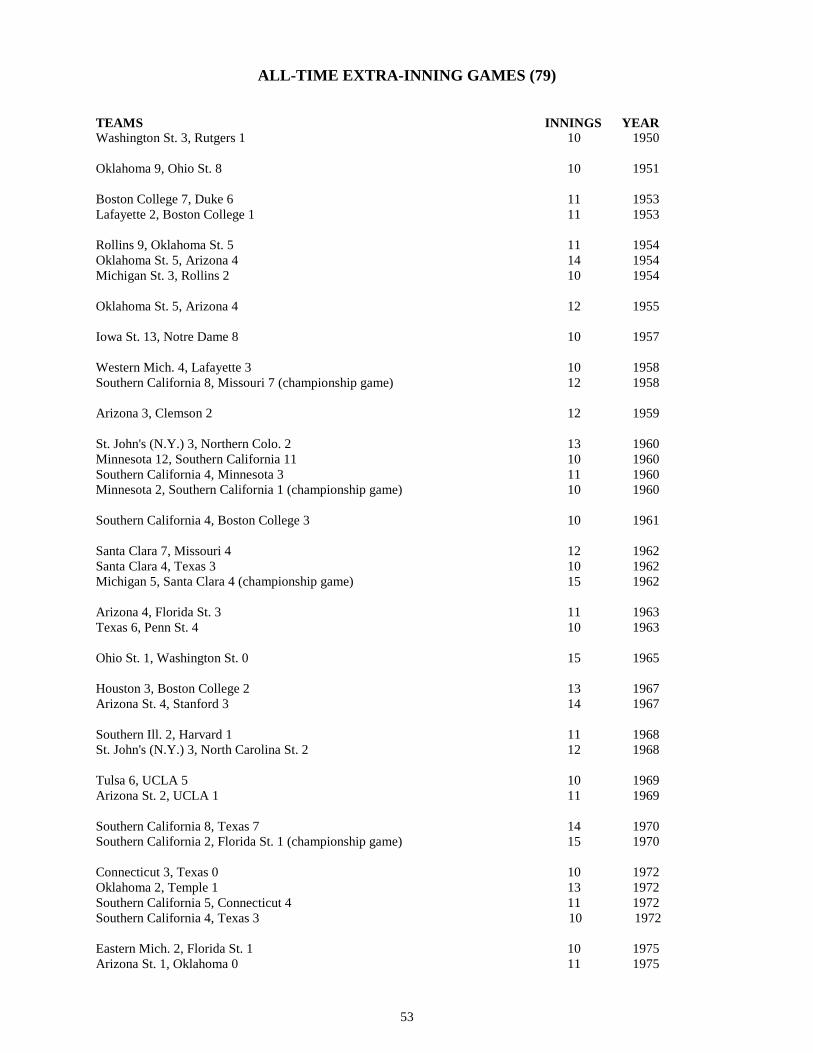
53
ALL-TIME EXTRA-INNING GAMES (79)
TEAMS INNINGS YEAR
Washington St. 3, Rutgers 1 10 1950
Oklahoma 9, Ohio St. 8 10 1951
Boston College 7, Duke 6 11 1953
Lafayette 2, Boston College 1 11 1953
Rollins 9, Oklahoma St. 5 11 1954
Oklahoma St. 5, Arizona 4 14 1954
Michigan St. 3, Rollins 2 10 1954
Oklahoma St. 5, Arizona 4 12 1955
Iowa St. 13, Notre Dame 8 10 1957
Western Mich. 4, Lafayette 3 10 1958
Southern California 8, Missouri 7 (championship game) 12 1958
Arizona 3, Clemson 2 12 1959
St. John's (N.Y.) 3, Northern Colo. 2 13 1960
Minnesota 12, Southern California 11 10 1960
Southern California 4, Minnesota 3 11 1960
Minnesota 2, Southern California 1 (championship game) 10 1960
Southern California 4, Boston College 3 10 1961
Santa Clara 7, Missouri 4 12 1962
Santa Clara 4, Texas 3 10 1962
Michigan 5, Santa Clara 4 (championship game) 15 1962
Arizona 4, Florida St. 3 11 1963
Texas 6, Penn St. 4 10 1963
Ohio St. 1, Washington St. 0 15 1965
Houston 3, Boston College 2 13 1967
Arizona St. 4, Stanford 3 14 1967
Southern Ill. 2, Harvard 1 11 1968
St. John's (N.Y.) 3, North Carolina St. 2 12 1968
Tulsa 6, UCLA 5 10 1969
Arizona St. 2, UCLA 1 11 1969
Southern California 8, Texas 7 14 1970
Southern California 2, Florida St. 1 (championship game) 15 1970
Connecticut 3, Texas 0 10 1972
Oklahoma 2, Temple 1 13 1972
Southern California 5, Connecticut 4 11 1972
Southern California 4, Texas 3 10 1972
Eastern Mich. 2, Florida St. 1 10 1975
Arizona St. 1, Oklahoma 0 11 1975

54
ALL-TIME EXTRA-INNING GAMES
TEAMS INNINGS YEAR Arizona St. 7, Arizona 6 10 1976
Eastern Mich. 3, Clemson 2 10 1976
South Carolina 3, Baylor 2 10 1977
Minnesota 4, Baylor 3 11 1977
Pepperdine 5, Mississippi St. 4 10 1979
Michigan 9, California 8 11 1980
Arizona 6, Hawaii 4 11 1980
Oklahoma St. 8, South Carolina 5 10 1981
Oklahoma St. 11, Arizona St. 10 13 1981
Texas 15, Oklahoma St. 8 13 1981
Texas 8, Stanford 6 12 1982
Alabama 6, Arizona St. 5 11 1983
Texas 6, Oklahoma St. 5 11 1983
Texas 6, Alabama 4 10 1983
Oklahoma St. 8, New Orleans 7 10 1984
Arkansas 1, South Carolina 0 14 1985
Texas 8, Arkansas 7 10 1985
LSU 6, Florida St. 2 10 1987
Texas 6, Florida St. 4 10 1987
Stanford 6, LSU 5 10 1987
Miami (Fla.) 8, Fresno St. 4 12 1988
Arizona St. 4, Wichita St. 3 10 1988
Stanford 5, Ga. Southern 4 10 1990
Citadel 8, Cal St. Fullerton 7 12 1990
Wichita St. 3, Creighton 2 12 1991
Miami (Fla.) 4, California 3 13 1992
Wichita St. 4, Arizona St. 3 11 1993
Georgia Tech 12, Florida St. 4 10 1994
Oklahoma 4, Arizona St. 3 11 1994
Georgia Tech 3, Cal St. Fullerton 2 12 1994
Clemson 8, Oklahoma St. 5 10 1996
Miami (Fla.) 7, UCLA 3 12 1997
Southern California 12, Florida 10 11 1998
Florida St. 14, Stanford 11 13 1999

55
ALL-TIME EXTRA-INNING GAMES
TEAMS INNINGS YEAR
Stanford 5, Cal St. Fullerton 2 10 2001
Stanford 7, Cal St. Fullerton 5 10 2003
Rice 4, Stanford 3 10 2003
Baylor 4, Oregon St. 3 10 2005
Arizona St. 8, Nebraska 7 11 2005
North Carolina 7, Cal St. Fullerton 5 13 2006
UC Irvine 5, Cal St. Fullerton 4 13 2007
UC Irvine 8, Arizona St. 7 10 2007
BREAKDOWN BY INNINGS: 15 inn. - 3 12 inn. - 11
14 inn. - 4 11 inn. - 18
13 inn. - 9 10 inn. - 34
ALL-TIME EXTRA INNING WON-LOST RECORDS (60 teams)
Alabama 1-1
Arizona 3-3
Arizona St. 6-5
Arkansas 1-1
Baylor 1-2
Boston College 1-3
California 0-2
UC Irvine 2-0
Cal St. Fullerton 0-6
Citadel 1-0
Clemson 1-2
Connecticut 1-1
Creighton 0-1
Duke 0-1
Eastern Mich. 2-0
Florida 0-1
Florida St. 1-6
Fresno St. 0-1
Ga. Southern 0-1
Georgia Tech 2-0
Harvard 0-1
Hawaii 0-1
Houston 1-0
Iowa St. 1-0
Lafayette 2-0
Louisiana St. 1-1
Miami (Fla.) 3-0
Michigan 2-0
Michigan St. 1-0
Minnesota 3-1
Mississippi St. 0-1
Missouri 0-2
Nebraska 0-1
New Orleans 0-1
North Carolina 1-0
North Caro. St. 0-1
Northern Colo. 0-1
Notre Dame 0-1
Ohio St. 1-1
Oklahoma 3-1
Oklahoma St. 5-4
Oregon St. 0-1
Penn St. 0-1
Pepperdine 1-0
Rice 1-0
Rollins 1-1
Rutgers 0-1
St. John's (N.Y.) 2-0
Santa Clara 2-1
South Carolina 1-2
Southern California 8-2
Southern Ill. 1-0
Stanford 4-4
Temple 0-1
Texas 7-4
Tulsa 1-0
UCLA 0-3
Washington St. 1-1
Western Mich. 0-1
Wichita St. 2-1
TOTAL 79-79

56
CWS GAMES WON IN LAST AT BAT (71)
9th
EXTRA
YEAR INNING INNING
1947 0 0
1948 0 0
1949 0 1
1950 0 0
1951 1 1
1952 0 0
1953 0 0
1954 2 1
1955 1 1
1956 1 0
1957 0 0
1958 0 *1
1959 1 1
1960 1 *3
1961 1 1
1962 0 0
1963 0 1
1964 1 0
1965 0 0
1966 0 0
1967 1 2
1968 *1 0
1969 0 1
1970 0 *1
1971 1 0
1972 0 2
1973 2 0
1974 0 0 1975 0 0
1976 0 1
1977 0 1
9th
EXTRA
YEAR INNING INNING
1978 0 0
1979 0 0
1980 2 0
1981 0 2
1982 0 0
1983 0 2
1984 0 1
1985 1 2
1986 1 0
1987 2 1
1988 1 0
1989 0 0
1990 0 1
1991 1 0
1992 0 1
1993 1 0
1994 0 0
1995 1 0
1996 *2 0
1997 1 0
1998 0 0
1999 1 1
2000 *3 0
2001 0 0
2002 2 0
2003 1 1
2004 0 0
2005 2 1
2006 0 0
2007 0 2
2008 1 0
Bottom of 9th
wins: 37
Extra inning home wins: 34
*Includes National Championship game
COLLEGE WORLD SERIES ONE-RUN GAMES (234)
ONE-RUN
YEAR GAMES
1947 1
1948 0
1949 2
1950 1
1951 6
1952 3
1953 6
1954 5
1955 5
1956 3
1957 2
1958 2
1959 3
1960 6
1961 5
1962 5
ONE-RUN
YEAR GAMES
1963 4
1964 5
1965 6
1966 2
1967 5
1968 7
1969 3
1970 3
1971 4
1972 *8
1973 4
1974 1
1975 2
1976 5
1977 6
1978 3
ONE-RUN
YEAR GAMES
1979 3
1980 5
1981 5
1982 2
1983 6
1984 1
1985 7
1986 5
1987 5
1988 4
1989 0
1990 3
1991 3
1992 5
1993 6
1994 3
ONE-RUN
YEAR GAMES 1995 2
1996 4
1997 2
1998 3
1999 2
2000 3
2001 3
2002 5
2003 4
2004 3
2005 4
2006 5
2007 4
2008 4 * Record

57
COLLEGE WORLD SERIES SCORING (1947-2008)
(Average Is Both Teams Combined Per Game)
YEAR GAMES RUNS AVG. PER GAME
1947 2 36 18.0
1948 3 26 8.7
1949 6 52 8.7
1950 15 135 9.0
1951 14 125 8.9
1952 15 173 11.5
1953 15 135 9.0
1954 15 130 8.7
1955 15 126 8.4
1956 15 153 10.2
1957 14 127 9.1
1958 15 132 8.8
1959 15 129 8.6
1960 15 127 8.5
1961 14 128 9.1
1962 15 159 10.6
1963 15 133 8.9
1964 15 107 7.1
1965 15 132 8.8
1966 15 111 7.4
1967 15 113 7.5
1968 14 118 8.4
1969 15 115 7.7
1970 15 130 8.7
1971 15 137 9.1
1972 15 107 7.1
1973 14 **98 **7.0
#1974 15 133 8.9
1975 15 133 8.9
1976 15 150 10.0
1977 15 144 9.6
YEAR GAMES RUNS AVG. PER GAME 1978 14 156 11.1
1979 15 174 11.6
1980 15 166 11.1
1981 15 199 13.3
1982 14 159 11.4
1983 14 127 9.1
1984 15 *228 15.2
1985 15 179 11.9
1986 15 148 9.9
1987 15 150 10.0
1988 15 155 10.3
1989 14 148 10.6
1990 14 143 10.2
1991 13 164 12.6
1992 14 129 9.2
1993 14 154 11.0
1994 13 142 10.9
1995 14 171 12.2
1996 13 175 13.5
1997 14 174 12.4
1998 14 225 *16.1
1999 14 164 11.7
2000 13 161 12.4
2001 13 200 15.4
2002 14 178 12.7
2003 16 185 11.6
2004 15 165 11.0
2005 15 124 8.3
2006 16 143 8.9
2007 15 185 12.3
2008 16 206 12.9
TOTALS: 62 872 8,931 10.2 * Record high for eight-team format. ** Record low for eight-team format.
# First year for designated hitter and aluminum bat.
SCORING BY DECADE
YEARS GAMES-RUNS AVG. PER GAME
1947 – 1949 11 – 114 10.4
1950 – 1959 148 – 1365 9.2
1960 – 1969 148 – 1243 8.4
1970 – 1979 148 – 1362 9.2
1980 – 1989 147 – 1659 11.3
1990 – 1999 137 – 1641 12.0
2000 – 2008 133 – 1547 11.6

58
CWS ALL-TIME GRAND SLAM HOME RUNS (45)
(1947-2008)
GAME DATE PLAYER (Pos.), TEAM vs. OPPONET INNING FINAL
N0. SCORE
1950 (1)
12 June 20 Kal Segrist (1b), Texas vs. Washington St. B3rd 12-1
(first grand slam in CWS history)
1954 (1)
1 June 10 Tom Yewcic (c), Michigan St. vs. Massachusetts T4th 16-5
1955 (1)
13 June 14 Freed Messner (ph), Western Mich. vs. Wake Forest T8th 7-10
(only pinch-hit grand slam in CWS history, Messner’s only hit in CWS [1-12].)
1961 (1)
7 June 11 Paul Mersch (1b), Oklahoma St. vs. Syracuse B5th 12-9
1962 (1)
8 June 12 Don Fazio (3b), Ithaca vs. Florida St. B8th 4-5
1965 (2)
7 June 8 Russell Nagelson (cf), Ohio St. vs. Washington St. B7th 14-1
8 June 8 Sal Bando (3b), Arizona St. vs. St. Louis T8th 13-3
1968 (1)
11 June 13 Dan Colombo (3b), St. John’s vs. Southern California B6th 6-7
1974 (1)
6 June 10 Mickey Reichenbach (dh), Texas vs. Seton Hall T1st 12-2
1978 (2)
8 June 4 Bill Springman (2b), Oral Roberts vs. Arizona St. T1st 6-7
8 June 4 Bob Horner (3b), Arizona St. vs. Oral Roberts B3rd 7-6
1979 (1)
13 June 6 Dan Hanggie (3b), Cal St. Fullerton vs. Arkansas B2nd 13-10
1980 (1)
13 June 4 Scott Stanley (dh), Arizona vs. Hawaii T8th 6-4
1982 (1)
6 June 6 John Sullivan (3b), South Carolina vs. Oklahoma St. B5th 8-10
1983 (3)
9 June 8 Pete Incaviglia (dh), Oklahoma St. vs. Arizona St. B9th 5-6
10 June 8 Casey Close (dh), Michigan vs. Stanford T9th 11-4
13 June 10 Mike Brumley (ss), Texas vs. Michigan B5th 4-2
1984 (2)
3 June 2 Darren Mandel (dh), Miami (Fla.) vs. Arizona St. T1st 6-9
5 June 3 Mark Higgins (1b), New Orleans vs. Michigan B4th 11-3
1985 (2)
6 June 2 Mike DeBenon (dh), Stanford vs. Arizona B8th 9-2
12 June 8 Bobby Thigpen (rf/p), Mississippi St. vs. Miami (Fla.) T6th 5-6

59
GAME DATE PLAYER (Pos.), TEAM vs. OPPONET INNING FINAL
N0. SCORE
1986 (1)
11 June 6 Paul Sorrento (rf), Florida St. vs. Arizona T2nd 5-9
1987 (1)
12 June 5 Paul Carey (rf), Stanford vs. LSU B10th 6-5
(only “walk-off” grand slam in CWS history)
1988 (1)
4 June 4 Jim Osborn (rf), Cal St. Fullerton vs. Miami (Fla.) T9th 9-3
1991 (1)
2 May 31 Lyle Mouton (rf), LSU vs. Florida B7th 8-1
1992 (2)
2 May 29 Phil Nevin (3b), Cal St. Fullerton vs. Florida St. B6th 7-2
12 June 4 Steve Rodriguez (2b), Pepperdine vs. Texas B7th 5-4
1993 (1)
6 June 6 Todd Walker (2b), LSU vs. Texas A&M B8th 13-8
1994 (2)
5 June 5 Matt Saier (rf), Georgia Tech vs. Florida St. T10th 12-4
9 June 7 Mark Kotsay (lf/rf), Cal St. Fullerton vs. Florida St. T8th 10-3
1995 (2)
7 June 5 Mark Kotsay (cf/rf), Cal St. Fullerton vs. Tennessee T2nd 11-1
12 June 8 Brian Loyd (c), Cal St. Fullerton vs. Tennessee B1st 11-0
1996 (3)
3 June 1 Brad Wilkerson (rf/p), Florida vs. Florida St. B7th 5-2
4 June 1 Tim Lanier (c), LSU vs. Wichita St. T3rd 9-8
9 June 4 Brett Taft (ss), Alabama vs. Clemson B7th 13-14
1997 (1)
11 June 4 Josh Hochgesang (3b), Stanford vs. LSU T5th 9-13
1998 (4)
1 May 29 Jeremy Salazar (c), Florida St. vs. Arizona St. B6th 10-11
3 May 30 Robb Gorr (1b), Southern California vs. LSU B6th 10-12
14 (Ch) June 6 Michael Collins (ss), Arizona St. vs. Southern California B2nd 14-21
14 (Ch) June 6 Jason Lane (dh/p), Southern California vs. Arizona St. T9 21-14
1999 (1)
13 June 18 John Gall (1b), Stanford vs. Florida St. T7th 11-14
2000 (2)
11 June 15 Andy Topham (lf), Stanford vs. La-Lafayette B2nd 19-9
13 (Ch) June 17 Craig Thompson (1b), Stanford vs. LSU T4th 5-6
2001 (1)
7 June 11 David Coffey (dh), Georgia vs. Tennessee B5th 12-19
2008 (1)
10 *June 20 Tim Federowicz (c), North Carolina vs. LSU T9th 7-3
*Game started on June 19 but was suspended because of rain; Grand slam was hit on June 20

60
COLLEGE WORLD SERIES SHUTOUTS (98)
1950 (2)
Jim Ehrler, Texas vs. Tufts, 6-19-50 (7-0)
Jim Ehrler & Murray Wall, Texas vs. Washington St., 6-23-50 (3-0)
1951 (1)
Sid Hatfield, Tennessee vs. Springfield, 6-15-51 (2-0)
1952 (1)
Dick Atkinson, Missouri vs. Holy Cross, 6-13-52 (1-0)
1953 (1)
Marvin Wisniewski, Michigan vs. Stanford, 6-11-53 (4-0)
1955 (6)
Jack McGinley, Wake Forest vs. Colgate, 6-10-55 (1-0)
Carl Thomas, Arizona vs. Springfield, 6-12-55 (6-0)
Lowell Davis, Wake Forest vs. Northern Colo., 6-12-55 (10-0)
Benny Rincon, Arizona vs. Northern Colo., 6-13-55 (20-0)
Jim Smith & Gerald Sposito, Western Mich. vs. Wake Forest, 6-13-55 (9-0)
John Stokoe, Wake Forest vs. Oklahoma St., 6-15-55 (2-0)
1956 (4)
Don Lee, Arizona vs. New York U., 6-9-56 (3-0)
Ronald Craven, Minnesota vs. Wyoming, 6-9-56 (4-0)
Buddy Wittichen, Mississippi vs. Bradley, 6-10-56 (4-0)
Ernest Oosterveen, Arizona vs. New Hampshire, 6-11-56 (1-0)
1957 (6)
Harry Taylor, Texas vs. Connecticut, 6-8-57 (3-0)
Doug Weiss, California vs. Northern Colo., 6-8-57 (4-0)
Ed Drapcho, Penn St. vs. Florida St., 6-8-57 (7-0)
Chuck Symeon, Notre Dame vs. Texas, 6-10-57 (9-0)
Kim Elliott, California vs. Penn St., 6-10-57 (8-0)
George Sterling, California vs. Penn St., 6-12-57 (1-0)
1958 (3)
Harold Deitz, Holy Cross vs. Southern California, 6-14-58 (3-0)
Bruce Gardner, Southern California vs. Arizona, 6-15-58 (4-0)
Bill Thom, Southern California vs. Missouri, 6-18-58 (7-0)
1959 (3)
Ron Riese, Penn St. vs. Clemson, 6-15-59 (7-0)
Leroy Gregory, Fresno St. vs. Arizona, 6-16-59 (2-0)
Roy Peterson, Oklahoma St. vs. Fresno St., 6-17-59 (4-0)
1960 (2)
Jim Wixson, Oklahoma St. vs. North Carolina, 6-15-60 (7-0)
George Scott, Oklahoma St. vs. Boston College, 6-17-60 (1-0)
1961 (3)
Dave Giusti, Syracuse vs. Western Mich., 6-12-61 (6-0)
Littleton Fowler, Oklahoma St. vs. Syracuse, 6-13-61 (8-0)
Jim Withers, Southern California vs. Oklahoma St., 6-15-61 (1-0)
1962 (1)
Tom Belcher, Texas vs. Michigan, 6-14-62 (7-0)

61
COLLEGE WORLD SERIES SHUTOUTS
1963 (2)
Keith Weber, Missouri vs. Holy Cross, 6-10-63 (3-0)
Dick Noe, Penn St. vs. Western Mich., 6-11-63 (3-0)
1964 (3)
Keith Weber, Missouri vs. Arizona St., 6-9-64 (7-0)
Skip Hancock, Arizona St. vs. Mississippi, 6-11-64 (5-0)
Frank Brosseau, Dan Howard & Dick Mielke, Minnesota vs. Maine, 6-12-64 (12-0)
1965 (1)
Steve Arlin, Ohio St. vs. Washington St., 6-10-65 (1-0, 15 inn.)
1966 (2)
Walter Witowski, St. John's (N.Y.) vs. Texas, 6-14-66 (2-0)
Steve Arlin, Ohio St. vs. Southern California, 6-17-66 (1-0)
1967 (2)
Q.V. Lowe, Auburn vs. Ohio St., 6-12-67 (1-0)
Rick Brewer, Houston vs. Arizona St., 6-16-67 (3-0)
1968 (4)
Tom Sowinski, St. John's (N.Y.) vs. Harvard, 6-10-68 (2-0)
Larry Hardy, Texas vs. Brigham Young , 6-12-68 (7-0)
Howard Nickason, Southern Ill. vs. St. John's (N.Y.), 6-14-68 (15-0)
Robert Vaughn, Southern California vs. North Carolina St., 6-14-68 (2-0)
1969 (3)
Burt Hooton, Texas vs. Arizona St., 6-13-69 (4-0)
John Kitchen, Massachusetts vs. Southern Ill., 6-14-69 (2-0)
Reggie Rowe & Jay Weinheimer, Tulsa vs. New York U., 6-17-69 (2-0)
1970 (3)
Gene Ammann, Florida St. vs. Arizona, 6-13-70 (4-0)
Pat Osburn, Florida St. vs. Dartmouth, 6-14-70 (6-0)
Tom Henson & Mac Scarce, Florida St. vs. Ohio, 6-16-70 (2-0)
1971 (1)
Andre Rabouin, Tex.-Pan American vs. Harvard, 6-14-71 (1-0)
1972 (5)
Jim Jachym & Augie Garbatini, Connecticut vs. Texas, 6-9-72 (3-0, 10 inn.)
Eddie Bane, Arizona St. vs. Oklahoma, 6-11-72 (1-0)
Jim Crawford, Arizona St. vs. Southern California, 6-12-72 (3-0)
Craig Swan, Arizona St. vs. Temple, 6-14-72 (1-0)
Mark Sogge & Russ McQueen, Southern California vs. Arizona St., 6-16-72 (1-0)
1973 (4)
Dave Winfield, Minnesota vs. Oklahoma, 6-8-73 (1-0)
Bob Shirley, Oklahoma vs. Penn St., 6-9-73 (6-0)
Tom Bigwood, Ga. Southern vs. Harvard, 6-10-73 (8-0)
Eddie Bane, Arizona St. vs. Minnesota, 6-10-73 (3-0)
1975 (3)
Todd Heimer, Seton Hall vs. Florida St., 6-8-75 (11-0)
Marty Kunkler, Oklahoma vs. Eastern Mich., 6-9-75 (7-0)
John Poloni, Arizona St. vs. Oklahoma, 6-12-75 (1-0, 11 inn.)

62
COLLEGE WORLD SERIES SHUTOUTS
1976 (1)
Tom Van Der Meersche, Arizona St. vs. Maine, 6-16-76 (7-0)
1977 (2)
Mike Sutherland, Cal St. L.A. vs. Clemson, 6-14-77 (1-0)
Darrell Jackson, Arizona St. vs. Southern Ill., 6-17-77 (10-0)
1978 (2)
Steve Howe, Michigan vs. Baylor, 6-2-78 (4-0)
Ron Meridith, Oral Roberts vs. North Carolina, 6-3-78 (11-0)
1980 (1)
Craig Lefferts, Arizona vs. Michigan, 6-2-80 (8-0)
1981 (1)
Don Mundie, Mississippi St. vs. Michigan, 5-30-81 (4-0)
1982 (2)
Bryan Oelkers, Wichita St. vs. Cal St. Fullerton, 6-4-82 (7-0)
Joe Johnson, Maine vs. Cal St. Fullerton, 6-6-82 (6-0)
1983 (3)
Calvin Schiraldi, Texas vs. James Madison, 6-3-83 (12-0)
Doug Henry, Arizona St. vs. Maine, 6-5-83 (7-0)
Alan Dunn & Tim Meacham, Alabama vs. Arizona St., 6-10-83 (6-0)
1985 (1)
Howard Hilton, Tim Deitz & Fred Farwell, Arkansas vs. South Carolina, 5-31-85 (1-0, 14 inn.)
1986 (1)
Rob Walton & Gordie Dillard, Oklahoma St. vs. Indiana St., 6-1-86 (4-0)
1987 (1)
Chris Pollack, Florida St. vs. Arizona St., 5-31-87 (3-0)
1990 (1)
Dave Fleming, Georgia vs. Mississippi St., 6-1-90 (3-0)
1991 (1) Marc Valdes, Florida vs. Florida St., 6-1-91 (5-0)
1992 (3)
Patrick Ahearne & Steve Montgomery, Pepperdine vs. Wichita St., 5-30-92 (6-0)
Derek Wallace & Steve Montgomery, Pepperdine vs. Texas, 6-1-92 (7-0)
Mike Parisi & Paco Chavez, Cal St. Fullerton vs. Florida St., 6-2-92 (6-0)
1993 (1)
Brett Laxton, LSU vs. Wichita St., 6-12-93 (8-0)
1994 (2)
Brad Rigby, Georgia Tech vs. Cal St. Fullerton, 6-3-94 (2-0)
Bill Neal & Noah Peery, Arizona St. vs. Miami (Fla.), 6-4-94 (4-0)
1995 (1)
Tim Dixon & Mark Chavez, Cal St. Fullerton vs. Tennessee, 6-8-95 (11-0)
2002 (1)
Kyle Bakker & Brian Burks, Georgia Tech vs. South Carolina, 6-14-02 (11-0)
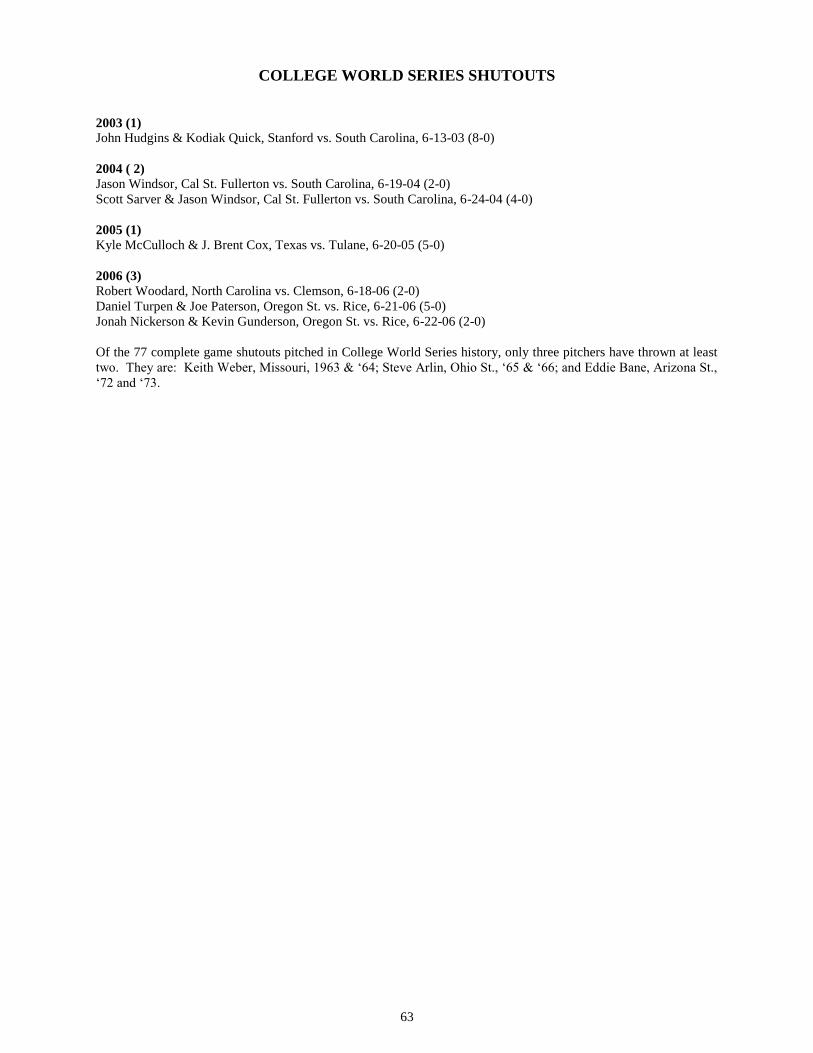
63
COLLEGE WORLD SERIES SHUTOUTS
2003 (1)
John Hudgins & Kodiak Quick, Stanford vs. South Carolina, 6-13-03 (8-0)
2004 ( 2)
Jason Windsor, Cal St. Fullerton vs. South Carolina, 6-19-04 (2-0)
Scott Sarver & Jason Windsor, Cal St. Fullerton vs. South Carolina, 6-24-04 (4-0)
2005 (1)
Kyle McCulloch & J. Brent Cox, Texas vs. Tulane, 6-20-05 (5-0)
2006 (3)
Robert Woodard, North Carolina vs. Clemson, 6-18-06 (2-0)
Daniel Turpen & Joe Paterson, Oregon St. vs. Rice, 6-21-06 (5-0)
Jonah Nickerson & Kevin Gunderson, Oregon St. vs. Rice, 6-22-06 (2-0)
Of the 77 complete game shutouts pitched in College World Series history, only three pitchers have thrown at least
two. They are: Keith Weber, Missouri, 1963 & ‘64; Steve Arlin, Ohio St., ‘65 & ‘66; and Eddie Bane, Arizona St.,
‘72 and ‘73.

64
COLLEGE WORLD SERIES LOW-HIT GAMES
No-Hitters (2) Jim Ehrler, Texas vs. Tufts, 6-19-50 (7-0)
Jim Wixson, Oklahoma St. vs. North Carolina, 6-15-60 (7-0)
One-Hitters (11)
Rod Keogh, Washington St. vs. Rutgers, 6-19-50 (3-1, 10 inn.)
Jackie Lonergan, Holy Cross vs. Missouri, 6-13-52 (0-1)
Buddy Wittichen, Mississippi vs. Bradley, 6-10-56 (4-0)
Littleton Fowler, Oklahoma St. vs. Syracuse, 6-13-61 (8-0)
Keith Weber & Jim Nelson, Missouri vs. Minnesota, 6-15-64 (4-1)
Frank Brosseau, Dan Howard & Dick Mielke, Minnesota vs. Maine, 6-12-64 (12-0)
Larry Hardy, Texas vs. Brigham Young, 6-12-68 (7-0)
Bob Shirley, Oklahoma vs. Penn St., 6-9-73 (6-0)
Steve Howe, Michigan vs. Baylor, 6-2-78 (4-0)
Doug Henry, Arizona St. vs. Maine, 6-5-83 (7-0)
Alan Dunn & Tim Meacham, Alabama vs. Arizona St., 6-10-83 (6-0)
Two-Hitters (26)
James Waldrip, Oklahoma vs. Springfield, 6-14-51 (7-1)
Junior Wren, Missouri vs. Penn St., 6-14-52 (3-2)
Tom Cole, Western Mich. vs. Duke, 6-14-52 (5-1)
Lawrence Bossidy, Colgate vs. Wake Forest, 6-10-55 (0-1)
Carl Thomas, Arizona vs. Springfield, 6-12-55 (6-0)
Ken Kinnamon & Don Anderson, Oklahoma St. vs. Western Mich., 6-12-55 (4-5)
Sam Frankel & Lawrence Bossidy, Colgate vs. Oklahoma St., 6-13-55 (2-4)
Don Lee, Arizona vs. New York U., 6-9-56 (3-0)
Ronald Craven, Minnesota vs. Wyoming, 6-9-56 (4-0)
Robert Blakeslee, Southern California vs. Northern Colo., 6-16-58 (12-1)
Dave Baldwin, Arizona vs. Fresno St., 6-14-59 (5-1)
Skip Hancock, Arizona St. vs. Mississippi, 6-11-64 (5-0)
Dennis Musgraves, Missouri vs. Maine, 6-17-64 (2-1)
Steve Arlin, Ohio St. vs. Southern California, 6-17-66 (1-0)
Bill Dobbs, Richard Schmidt & Bob Richardson, Oklahoma St. vs. Texas, 6-11-68 (8-5)
Ken Crosby & Fred Caviglia, Brigham Young vs. Southern California, 6-11-68 (3-5)
Steve Rogers & Cliff Butcher, Tulsa vs. Texas, 6-16-69 (4-2)
Gene Ammann, Florida St. vs. Arizona, 6-13-70 (4-0)
Craig Swan, Arizona St. vs. Temple, 6-14-72 (1-0)
Tom Bigwood, Ga. Southern vs. Harvard, 6-10-73 (8-0)
Jim Gideon & Jimmy Brown, Texas vs. Seton Hall, 6-10-74 (12-2)
Greg Ward, South Carolina vs. Eastern Mich., 6-8-75 (5-1, 6 inn., rain)
Brad Gore & Ritchie Moody, Oklahoma St. vs LSU, 6-4-90 (7-1)
Mike Fontana, Long Beach St. vs. Kansas, 6-6-93 (6-1)
John Hudgins & Kodiak Quick, Stanford vs. South Carolina, 6-13-03 (8-0)
J.P. Howell, J. Brent Cox & Buck Cody, Texas vs. Arkansas, 6-18-04 (13-2)

65
COLLEGE WORLD SERIES ATTENDANCE RECORDS
Following are the attendance figures for the years the College World Series has been played in Omaha, plus the two years in
Kalamazoo, Michigan and one year in Wichita, Kansas. The total attendance in the 62-year history of the CWS is 6,897,835. The 59-
year Omaha total is 6,875,691 spectators, an average of 116,537 per year. For the last five years (2004-08) the average is 292,323.
AVERAGE
YEAR SESSIONS TOTAL ATT. SESSION 1947 2 3,792 1,896
1948 2 3,352 1,676
1949 4 15,000 3,750
1950 10 17,805 1,781
1951 9 27,789 3,088
1952 10 38,731 3,873
1953 10 31,990 3,199
1954 10 35,403 3,540
1955 10 21,843 2,184
1956 10 29,940 2,994
1957 9 26,609 2,957
1958 10 25,931 2,593
1959 10 33,607 3,361
1960 10 35,222 3,522
1961 9 24,778 2,753
1962 10 39,307 3,391
1963 10 52,757 5,276
1964 10 61,871 6,187
1965 10 45,894 4,589
1966 10 63,376 6,338
1967 10 63,906 6,391
1968 9 58,373 6,486
1969 10 63,265 6,327
1970 10 74,683 7,468
1971 10 77,460 7,746
1972 10 80,214 (1) 8,021
1973 9 65,356 6,262
1974 10 71,105 7,111
1975 10 78,052 7,805
1976 10 83,455 8,346
1977 10 90,117 9,012
1978 9 79,654 8,850
AVERAGE
YEAR SESSIONS TOTAL ATT. SESSION 1979 10 87,070 8,707
1980 10 95,406 9,541
1981 10 120,535 12,054
1982 9 106,144 11,794
1983 9 115,700 (2) 12,856
1984 10 120,456 12,046
1985 10 125,970 12,597
1986 10 124,958 12,496
1987 10 130,659 13,066
1988 9 132,698 14,744
1989 9 132,865 14,763
1990 9 138,426 15,381
1991 9 133,763 (3) 14,863
1992 10 154,216 15,422
1993 10 173,296 17,330
1994 9 161,638 17,960
1995 10 182,759 18,276
1996 9 182,430 20,270
1997 10 204,309(4) 20,431
1998 10 204,361 20,436
1999 10 206,639 20,664
2000 9 200,917 22,324
2001 9 196,515 21,835
2002 10 223,762 (5) 22,376
2003 12 260,091 21,674
2004 11 256,730 23,339
2005 11 263,475 #23,952
2006 14 310,609 (6) 22,186
2007 13 300,702 23,131
2008 16 +330,099 20,631
(1) One millionth fan
(2) Two millionth fan
(3) Three millionth fan
(4) Four millionth fan (5) Five millionth fan
(6) Six millionth fan
#Average per session record +Total attendance record

66
2008 CWS ATTENDANCE SESSION CUMULATIVE
NUMBER DAY AND DATE GAMES ATTENDANCE TOTAL
1 Saturday, June 14 1 21,714 18,807
2 Saturday, June 14 2 23,243 44,957
3 Sunday, June 15 3 19,937 64,894
4 Sunday, June 15 4 23,616 88,510
5 Monday, June 16 5 17,913 106,423
6 Monday, June 16 6 21,787 128,210
7 Tuesday, June 17 7 19,454 147,664
8 Tuesday, June 17 8 23,436 171,100
9 Wednesday, June 18 9 22,957 194,057
10 Friday, June 20 10 30,553 224,610
11 Saturday, June 21 11 15,581 240,191
12 Saturday, June 21 12 19,069 259,260
13 Sunday, June 22 13 15,125 274,385
Final 1 Monday, June 23 14 19,559 293,944
Final 2 Tuesday, June 24 15 17,223 311,167
Final 3 Wednesday, June 25 16 18,932 330,099
SESSION ATTENDANCE RECORDS SESSION RECORD
NUMBER ATTENDANCE YEAR GAMES PARTICIPANTS
1 24,711 2002 No. 1 Georgia Tech 11, South Carolina 0
No. 2 Clemson 11, Nebraska 10
2 24,904 2005 No. 2 Nebraska 5, Arizona St. 3
3 24,067 2002 No. 4 Texas 2, Rice 1
4 26,559 2007 No. 4 Oregon St. 3, Cal St. Fullerton 2
5 26,813 2005 No. 5 Arizona St. 4, Tennessee 2
No. 6 Florida 7, Nebraska 4
6 24,941 2005 No. 7 Baylor 4, Oregon St. 3 (10 inn.)
No. 8 Texas 5, Tulane 0
7 26,220 2005 No. 9 Arizona St. 8, Nebraska 7 (11 inn.)
No. 10 Baylor 8, Tulane 7
8 28,216 2004 No. 11 Texas 7, Georgia 6
No. 12 South Carolina 5, Cal St. Fullerton 3
9 29,034 2007 No. 9 North Carolina 3, Louisville 1
No. 10 UC Irvine 8, Arizona St. 7
10 30,553 2008 No. 11 North Carolina 7, LSU 3
11 22,344 2007 No. 13 North Carolina 7, Rice 4
12 19,069 2008 No. 12 North Carolina 4, Fresno St. 3
13 15,125 2008 No. 13 Fresno St. 6, North Carolina 1

67
SESSION RECORD
NUMBER ATTENDANCE YEAR GAMES PARTICIPANTS
Championship Series
1 26,887 2007 No. 14 Oregon St. 11, North Carolina 4
2 25,046 2006 No. 15 Oregon St. 11, North Carolina 7
3 18,565 2006 No. 16 Oregon St. St. 3, North Carolina 2
Championship Game Only
25,012 2007 No. 15 Oregon St. 9, North Carolina 3
TOP 30 ALL-TIME SESSIONS
ATTENDANCE PARTICIPANTS GAMES DATE
1. 30,553 North Carolina 7, LSU 3 No. 10 6-20-08
2. 30,335 North Carolina 6, Cal St. Fullerton 5 No. 11 6-21-06
Oregon St. 5, Rice 0 No. 12
3. 29,921 North Carolina 6, Rice 1 No. 11 6-20-07
Oregon St. 7, UC Irvine 1 No. 12
4. 29,034 North Carolina 3, Louisville 1 No. 9 6-19-07
UC Irvine 8, Arizona St. 7 No. 10
5. 28,216 Texas 7, Georgia 6 No. 11 6-23-04
South Carolina 5, Cal St. Fullerton 3 No. 12
6. 27,452 Arizona St. 6, Florida 1 No. 11 6-22-05
Texas 4, Baylor 3 No. 12
7. 26,941 Baylor 4, Oregon St. 3 (10 inn.) No. 7 6-20-05
Texas 5, Tulane 0 No. 8
8. 26,887 Oregon St. 11, North Carolina 4 No. 14 6-23-07
9. 26,813 Arizona St. 4, Tennessee 2 No. 5 6-19-05
Florida 7, Nebraska 4 No. 6
10. 26,808 North Carolina 4, Oregon St. 3 No. 14 (Ch. 1) 6-24-06
11. 26,641 Texas 5, Baylor 1 No. 4 6-18-05
12. 26,604 Cal St. Fullerton 6, Texas 4 No. 14 (Ch. 1) 6-26-04
13. 26,559 Oregon St. 3, Cal St. Fullerton 2 No. 4 6-16-07
14. 26,530 Miami (Fla.) 9, LSU 5 No. 4 6-19-04
15. 26,480 Arizona 7, Arkansas 2 No. 5 6-20-04
Texas 9, Georgia 3 No. 6
16. 26,327 Texas 13, Miami (Fla.) 2 No. 4 6-14-03
17. 26,241 Cal St. Fullerton 7, Clemson 6 No. 9 6-20-06
Oregon St. 5, Miami 3 No. 10
18. 26,220 Arizona St. 8, Nebraska 7 (11 inn.) No. 9 6-21-05
Baylor 8, Tulane 7 No. 10

68
ATTENDANCE PARTICIPANTS GAMES DATE
19. 25,958 Texas 4, Florida 2 No. 14 (Ch. 1) 6-25-05
20. 25,581 South Carolina 10, Nebraska 8 No. 5 6-16-02
Clemson 9, Georgia Tech 7 No. 6
21. 25,417 Miami (Fla.) 11, Oregon St. 1 No. 4 6-17-06
22. 25,240 Georgia 3, Arizona 1 No. 9 6-22-04
South Carolina 15, Miami (Fla.) 11 No. 10
23. 25,046 Oregon St. 11, North Carolina 7 No. 15 (Ch. 2) 6-25-06
24. 25,012 Oregon St. 9, North Carolina 3 No. 15 (Ch. 2) 6-24-07
25. 24,971 Notre Dame 5, Rice 3 No. 7 6-17-02
Texas 8, Stanford 7 No. 8
26. 24,904 Nebraska 5, Arizona St. 3 No. 2 6-17-05
27. 24,859 Miami (Fla.) 8, Alabama 1 No. 5 6-13-99
Rice 7, Oklahoma St. 2 No. 6
28. 24,857 South Carolina 15, LSU 4 No. 7 6-21-04
Cal St. Fullerton 6, Miami (Fla.) 3 No. 8
29. 24,842 Miami (Fla.) 7, Missouri St. 5 No. 7 6-16-03
Rice 12, Texas 2 No. 8
30. 24,740 Arizona St. 9, Miami (Fla.) 2 No. 5 5-31-98
Long Beach St. 7, Florida St. 4 No. 6
2007-08 NCAA DIVISION I CHAMPIONSHIPS
Top 10 Total Paid Attendance
1. Men's Basketball.......................................................................................................................... 660,368
2. Baseball ....................................................................................................................................... 650,033
3. Women's Basketball .................................................................................................................... 202,905
4. Football (FCS) ............................................................................................................................. 178,006
5. Softball ........................................................................................................................................ 122,394
6. Men’s Lacrosse ............................................................................................................................ 118,085
7. Women’s Volleyball .................................................................................................................... 107,902
8. Wrestling ..................................................................................................................................... 95,382
9. Men’s Ice Hockey ....................................................................................................................... 88,971
10. Men’s Soccer ............................................................................................................................... 79,523
2007-08 NCAA DIVISION I CHAMPIONSHIPS
Top 10 Gross Receipts
1. Men’s Basketball ......................................................................................................................... $42,123,150
2. Baseball ....................................................................................................................................... 9,001,254
3. Men’s Ice Hockey ....................................................................................................................... 6,794,898
4. Women’s Basketball .................................................................................................................... 3,210,934
5. Football (FCS) ............................................................................................................................. 2,951,719
6. Men’s Lacrosse ............................................................................................................................ 2,292,350
7. Wrestling ..................................................................................................................................... 2,107,466
8. Softball ........................................................................................................................................ 1,210,543
9. Volleyball .................................................................................................................................... 1,158,725
10. Men’s Soccer ............................................................................................................................... 619,906

69
CWS TELEVISION RATINGS (1997-1999)
1997 NETWORK US AA CABLE RATINGS SHARE HOUSEHOLDS
1 ESPN 0.6 0.8 2 566,000
2 ESPN 0.6 0.8 2 570,000
3 CBS 1.7 n/a 5 1,660,000
4 ESPN 0.9 1.2 2 848,000
5 ESPN 0.9 1.2 3 857,000
6 ESPN2 0.3 0.5 1 256,000
7 ESPN 0.6 0.9 2 625,000
8 ESPN 0.9 1.2 2 883,000
9 ESPN 0.5 0.7 2 508,000
10 ESPN2 0.3 0.5 1 262,000
11 ESPN2 0.3 0.5 1 253,000
12 ESPN 0.6 0.8 3 588,000
13 ESPN 0.8 1.0 3 732,000
Ch CBS 2.0 n/a 7 1,940,000
Total Households: 10,548,000
1998 NETWORK US AA CABLE RATINGS SHARE HOUSEHOLDS
1 ESPN 0.6 0.8 2 581,000
2 ESPN2 0.3 0.6 1 318,000
3 CBS 1.5 n/a 5 1,503,000
4 ESPN2 0.4 0.6 1 360,000
5 ESPN 0.7 1.0 2 734,000
6 ESPN2 0.2 0.4 1 245,000
7 ESPN 0.7 0.9 3 662,000
8 ESPN 0.8 1.0 2 829,000
9 ESPN 0.6 0.8 2 587,000
10 ESPN2 0.4 0.7 1 379,000
11 ESPN2 0.1 0.2 1 138,000
12 ESPN 0.8 1.0 3 765,000
13 ESPN 0.7 1.0 3 725,000
Ch CBS 1.7 n/a 6 1,638,000
Total Households: 9,464,000
1999 NETWORK US AA CABLE RATINGS SHARE HOUSEHOLDS
1 ESPN 0.5 0.7 2 502,000
2 ESPN 0.6 0.7 2 565,000
3 CBS 1.3 n/a 5 1,298,000
4 ESPN2 0.4 0.6 1 403,000
5 ESPN 1.1 1.5 4 1,121,000
6 ESPN2 0.5 0.7 1 480,000
7 ESPN 0.5 0.7 2 517,000
8 ESPN2 0.4 0.7 1 436,000
9 ESPN2 0.4 0.7 2 439,000
10 ESPN2 0.4 0.7 1 436,000
11 ESPN2 0.6 0.9 2 561,000
12 ESPN2 0.5 0.8 1 486,000
13 ESPN2 0.6 0.9 2 576,000
Ch CBS 1.3 n/a 4 1,260,000
Total Households: 9,080,000

70
CWS TELEVISION RATINGS (2000-2002)
2000 NETWORK US AA CABLE RATINGS SHARE HOUSEHOLDS
1 ESPN 0.7 0.9 3 700,000
2 ESPN 0.6 0.7 2 567,000
3 CBS 1.2 n/a 4 1,185,000
4 ESPN2 0.5 0.8 2 550,000
5 ESPN 0.7 0.9 2 728,000
6 ESPN2 0.4 0.6 1 449,000
7 ESPN 0.7 1.0 2 751,000
8 ESPN2 0.4 0.6 1 404,000
9 ESPN 0.6 0.8 3 628,000
10 ESPN2 0.5 0.7 1 463,000
11 ESPN2 0.5 0.7 2 523,000
12 ESPN2 0.4 0.5 1 371,000
Ch CBS 1.7 n/a 5 1,693,000
Total Households: 9,012,000
2001 NETWORK US AA CABLE RATINGS SHARE HOUSEHOLDS
1 ESPN 0.7 0.85 2 697,000
2 ESPN 0.7 0.85 2 696,000
3 CBS 1.0 n/a 3 1,045,000
4 ESPN2 0.4 0.6 1 438,000
5 ESPN 0.9 1.1 3 907,000
6 ESPN2 0.4 0.6 1 443,000
7 ESPN 0.6 0.8 2 639,000
8 ESPN2 0.6 0.8 1 627,000
9 ESPN 0.5 0.6 2 504,000
10 ESPN2 0.5 0.6 1 462,000
11 ESPN2 0.4 0.6 1 438,000
12 ESPN2 0.4 0.5 1 413,000
Ch CBS 1.2 n/a 4 1,201,000
Total Households: 8,510,000
2002 NETWORK US AA CABLE RATINGS SHARE HOUSEHOLDS
1 ESPN2 0.3 0.4 1 319,000
2 ESPN2 0.6 0.7 1 613,000
3 CBS 0.8 n/a 2 875,000
4 ESPN 0.7 0.8 2 713,000
5 ESPN 0.7 0.8 2 692,000
6 ESPN2 0.5 0.6 1 477,000
7 ESPN2 0.5 0.6 2 484,000
8 ESPN2 0.7 0.9 2 752,000
9 ESPN 0.5 0.6 2 494,000
10 ESPN2 0.5 0.6 1 537,000
11 ESPN2 0.5 0.7 1 579,000
12 ESPN 0.9 1.1 2 912,000
13 ESPN2 0.6 0.7 2 621,000
Ch CBS 2.0 n/a 6 2,074,000
Total Households: 10,142,000

71
CWS TELEVISION RATINGS (2003-2005)
2003 NETWORK US AA CABLE RATINGS SHARE HOUSEHOLDS
1 ESPN2 0.2 0.28 1 233,000
2 ESPN2 0.5 0.59 1 497,000
3 ESPN/HD 0.6 0.75 2 648,000
4 ESPN/HD 0.6 0.75 2 647,000
5 ESPN/HD 0.6 0.78 2 674,000
6 ESPN2 0.5 0.64 1 540,000
7 ESPN2 0.4 0.54 1 457,000
8 ESPN2 0.4 0.51 1 432,000
9 ESPN/HD 0.5 0.61 2 526,000
10 ESPN/HD 0.8 1.04 2 899,000
11 ESPN2 0.5 0.61 2 511,000
12 ESPN2 0.7 0.91 1 767,000
13 ESPN/HD 0.8 1.04 2 904,000
Ch. 1 ESPN/HD 1.0 1.21 2 1,049,000
Ch. 2 ESPN/HD 1.0 1.21 3 1,051,000
Ch. 3 ESPN/HD 1.5 1.82 3 1,576,000
Total Households: 11,411,000
2004 NETWORK US AA CABLE RATINGS SHARE HOUSEHOLDS
1 ESPN2 0.5 0.57 2 500,000
2 ESPN2 0.6 0.75 2 656,000
3 ESPN/HD 0.7 0.86 2 756,000
4 ESPN/HD 0.8 0.99 2 873,000
5 ESPN/HD 0.5 0.58 1 514,000
6 ESPN2 0.6 0.79 1 687,000
7 ESPN2 0.6 0.77 2 673,000
8 ESPN2 0.8 1.0 2 872,000
9 ESPN2 0.5 0.57 2 493,000
10 ESPN2 0.7 0.85 1 737,000
11 ESPN2 0.6 0.76 2 662,000
12 ESPN2 0.7 0.85 2 738,000
13 ESPN2 0.7 0.86 2 750,000
Ch. 1 ESPN/HD 1.3 1.54 3 1,361,000
Ch. 2 ESPN/HD 1.2 1.44 3 1,270,000
Total Households: 11,542,000
2005 NETWORK US AA CABLE RATINGS SHARE HOUSEHOLDS
1 ESPN2 HD 0.4 0.47 1 417,000
2 ESPN2 HD 0.5 0.64 1 569,000
3 ESPN HD 0.7 0.89 2 809,000
4 ESPN HD 0.6 0.73 1 659,000
5 ESPN HD 0.5 0.56 1 502,000
6 ESPN2 HD 0.8 0.99 2 885,000
7 ESPN HD 0.7 0.84 2 754,000
8 ESPN HD 0.8 0.95 1 860,000
9 ESPN HD 0.6 0.76 2 686,000
10 ESPN HD 0.7 0.90 1 807,000
11 ESPN HD 0.5 0.65 2 584,000
12 ESPN2 HD 0.7 0.81 1 722,000
13 ESPN HD 0.8 0.92 1 827,000
Ch. 1 ESPN HD 1.1 1.28 2 1,156,000
Ch. 2 ESPN HD 0.8 1.01 2 907,000
Total Households: 11,144,000

72
CWS TELEVISION RATINGS (2006-08)
2006 NETWORK US AA CABLE RATINGS SHARE HOUSEHOLDS
1 ESPN2 HD 0.5 0.61 2 548,000
2 ESPN2 HD 0.8 0.95 2 856,000
3 ESPN HD 0.5 0.66 2 601,000
4 ESPN HD 0.6 0.69 1 619,000
5 ESPN HD 0.6 0.68 2 618,000
6 ESPN2 HD 0.7 0.80 2 723,000
7 ESPN HD 0.5 0.67 2 606,000
8 ESPN2 HD 0.6 0.75 1 677,000
9 ESPN2 HD 0.7 0.82 2 735,000
10 ESPN2 HD 0.4 0.52 1 471,000
11 ESPN2 HD 0.6 0.76 2 686,000
12 ESPN2 HD 0.7 0.88 2 792,000
13 ESPN2 HD 0.7 0.84 1 754,000
Ch. 1 ESPN HD 1.1 1.32 3 1,192,000
Ch. 2 ESPN2 HD 1.2 1.50 3 1,351,000
Ch. 3 ESPN HD 1.8 2.17 4 1,968,000
Total Households: 11,699,000
2008 NETWORK US AA CABLE RATINGS SHARE HOUSEHOLDS
1 ESPN HD 0.8 0.89 2 852,000
2 ESPN HD 0.6 0.76 2 729,000
3 ESPN HD 0.6 0.65 2 624,000
4 ESPN2 HD 0.6 0.66 1 621,000
5 ESPN2 HD 0.4 0.45 1 426,000
6 ESPN2 HD 0.8 0.94 2 901,000
7 ESPN2 HD 0.5 0.65 2 614,000
8 ESPN2 HD 0.7 0.80 1 754,000
9 ESPN2 HD 0.7 0.83 1 783,000
10 ESPNHD 0.9 1.11 2 1,055,000
11 ESPN HD 0.9 107 3 1,019,000
12 ESPN HD 1.0 1.14 2 1,094,000
13 ESPCL HD 0.2 0.43 1 262,000
Final 1 ESPN2 HD 1.2 1.37 2 1,315,000
Final 2 ESPN HD 1.3 1.55 3 1,477,000
Final 3 ESPN HD 1.7 1.97 4 1,879,000
Total Households: 14,405,000
Total Households: 13,197,000
2007 NETWORK US AA CABLE RATINGS SHARE HOUSEHOLDS
1 ESPN2 HD 0.4 0.48 1 448,000
2 ESPN2 HD 0.5 0.57 2 535,000
3 ESPN HD 0.6 0.68 2 641,000
4 ESPN HD 0.7 0.83 2 780,000
5 ESPN HD 0.5 0.57 1 540,000
6 ESPN2 HD 0.6 0.67 1 630,000
7 ESPN2 HD 0.5 0.63 2 594,000
8 ESPN2 HD 0.5 0.63 1 585,000
9 ESPN2 HD 0.6 0.71 2 657,000
10 ESPN2 HD 0.9 1.06 2 990,000
11 ESPN2 HD 0.6 0.72 2 671,000
12 ESPN2 HD 0.8 0.98 2 906,000
13 ESPN HD 1.0 1.20 2 1,131,000
Ch. 1 ESPN HD 1.1 1.29 3 1,211,000
Ch. 2 ESPN2 HD 1.2 1.48 3 1,380,000

2009 DIVISION I BASEBALL
Conference Alignment
288 Teams, 30 Conferences
America East (7)
Albany (N.Y) Binghamton-SUNY Hartford Maine UMBC Stony Brook Vermont Atlantic Coast (12)
Boston College Clemson Duke Florida St. Georgia Tech Maryland Miami (Fla.) North Carolina North Carolina St. Virginia Virginia Tech Wake Forest Atlantic Sun (7/#11)
Belmont Campbell East Tenn. St. #Florida Gulf Coast (09-10) Jacksonville #Kennesaw St. (09-10) Lipscomb Mercer #North Fla. (09-10) #S.C. Upstate (11-12) Stetson Atlantic 10 (14)
Charlotte Dayton Duquesne Fordham George Washington La Salle Massachusetts Rhode Island Richmond St. Bonaventure St. Joseph’s St. Louis Temple Xavier
Big East (12)
Cincinnati Connecticut Georgetown Louisville Notre Dame Pittsburgh Rutgers St. John’s (N.Y.) Seton Hall South Fla. Villanova West Virginia Big South (9/#10)
Charleston So. Coastal Caro. *Gardner-Webb High Point Liberty UNC Asheville #Presbyterian (11-12) Radford VMI Winthrop Big Ten (10)
Illinois Indiana Iowa Michigan Michigan St. Minnesota Northwestern Ohio St. Penn St. Purdue Big 12 (10)
Baylor Kansas Kansas St. Missouri Nebraska Oklahoma Oklahoma St. Texas Texas A&M Texas Tech Big West (9)
UC Davis UC Irvine UC Riverside UC Santa Barb. Cal Poly Cal St. Fullerton Cal St. Northridge Long Beach St. Pacific (Cal.)
Colonial (11)
Delaware George Mason Georgia St. Hofstra James Madison UNC Wilmington Northeastern Old Dominion Towson VCU William & Mary Conference USA (9)
UAB UCF East Caro. Houston Marshall Memphis Rice Southern Miss. Tulane Horizon (7)
Butler Cleveland St. Ill.-Chicago Milwaukee Valparaiso Wright St. Youngstown St. Ivy (8)
Brown Columbia Cornell Dartmouth Harvard Pennsylvania Princeton Yale Metro Atlantic (9)
Canisius Fairfield Iona Manhattan Marist Niagara Rider St. Peter’s Siena
Mid-American (12)
Akron Ball St. Bowling Green Buffalo Central Mich. Eastern Mich. Kent St. Miami (Ohio) Northern Ill. Ohio Toledo Western Mich. Mid-Eastern (7)
Bethune-Cookman Coppin St. Delaware St. Florida A&M Md.-East. Shore Norfolk St. North Carolina A&T Missouri Valley (9)
Bradley Creighton Evansville Illinois St. Indiana St. Missouri St. UNI Southern Ill. Wichita St. Mountain West (7)
Air Force BYU UNLV New Mexico San Diego St. TCU Utah Northeast (8)
Central Conn. St. Fairleigh Dickinson Long Island Monmouth Mt. St. Mary’s Quinnipiac Sacred Heart Wagner

2009 DIVISION I BASEBALL
Conference Alignment
288 Teams, 30 Conferences
Ohio Valley (9)
Austin Peay Eastern Ill. Eastern Ky. Jacksonville St. Morehead St. Murray St. Southeast Mo. St. Tenn.-Martin Tennessee Tech Pacific-10 (10)
Arizona Arizona St. California *Oregon Oregon St. Southern California Stanford UCLA Washington Washington St. Patriot (6)
Army Bucknell Holy Cross Lafayette Lehigh Navy Southeastern (12)
Alabama Arkansas Auburn Florida Georgia Kentucky LSU Mississippi Mississippi St. South Carolina Tennessee Vanderbilt Southern (11)
Appalachian St. Col. of Charleston Citadel Davidson Elon Furman Ga. Southern UNC Greensboro *Samford Western Caro. Wofford
Southland (11/#12)
#Central Ark. (09-10) Lamar McNeese St. Nicholls St. Northwestern St. Sam Houston St. Southeastern La. Stephen F. Austin A&M-Corpus Christi Texas-Arlington Texas-San Antonio Texas St. Southwestern (10)
Alabama A&M Alabama St. Alcorn St. Ark.-Pine Bluff Grambling Jackson St. Mississippi Val. Prairie View Southern U. Texas Southern Summit (8)
Centenary (La.) IPFW *North Dakota St. Oakland Oral Roberts *South Dakota St. Southern Utah Western Ill. Sun Belt (11)
Ark.-Little Rock Arkansas St. Fla. Atlantic FIU La.-Lafayette La.-Monroe Middle Tenn. St. New Orleans South Ala. Troy Western Ky. West Coast (8)
Gonzaga Loyola Marymount Pepperdine Portland St. Mary’s (Cal.) San Diego San Francisco Santa Clara
Western Athletic (7)
Fresno St. Hawaii Louisiana Tech Nevada New Mexico St. Sacramento St. San Jose St. Independents (8)
Chicago St. Dallas Baptist Le Moyne Longwood New York Tech Northern Colorado Savannah St. Tex.-Pan American No Longer Division I (1)
Hawaii-Hilo (moved to DII) New to Division I (3)
North Dakota St. (from reclass.) Oregon (restarting program) South Dakota St. (from reclass.) *New baseball conference member for 2009 #Reclassifying (13)
(Year eligible) ^Bryant (12-13) ^Cal St. Bakersfield (10-11) ^Central Ark. (09-10) ^Florida Gulf Coast (09-10) ^Kennesaw St. (09-10) ^NJIT (09-10) ^North Carolina Central (11-12) ^North Dakota (12-13) ^North Fla. (09-10) ^Presbyterian (11-12) Seattle (12-13) ^S.C. Upstate (11-12) ^SIU-Edwardsville (12-13) Provisional (2)
(Year eligible) ^Houston Baptist (14-15) ^Utah Valley St. (09-10) ^Counts in RPI

75
COLLEGE WORLD SERIES PARTICIPANTS ON CURRENT MLB ROSTERS (78)
NATIONAL LEAGUE (35)
Arizona (2) Billy Buckner (South Carolina, 2004), Eric Byrnes (UCLA, 1997)
Atlanta (5) Matt Diaz (Florida St., 1998, 99), Tim Hudson/dl (Auburn, 1997), Greg Norton (Oklahoma, 1992), David
Ross (Auburn, 1997, Florida, 1998), Clint Sammons (Georgia, 2004)
Chicago (3) Mike Fontenot (LSU, 2000), Reed Johnson (Call St. Fullerton, 1999) , Ryan Theriot (LSU, 2000)
Cincinnati (2) Paul Janish (Rice, 2002, 03), Micah Owings (Tulane, 2005)
Colorado (5) Jeff Baker (Clemson, 2002), Brad Hawpe (LSU, 2000), Todd Helton (Tennessee, 1995), Omar Quintanilla
(Texas, 2002, 03), Huston Street (Texas, 2002, 03, 04)
Florida (2) Andrew Miller (North Carolina, 2006), Scott Proctor (Florida St., 1998)
Houston (4) Lance Berkman (Rice, 1997), Geoff Blum (California, 1992), Jeff Keppinger (Georgia, 2001), Jason
Michaels (Miami, FL, 1997, 98)
Los Angeles (2) Casey Blake (Wichita St., 1993, 96), Doug Mientkiewicz/dl (Florida St., 1994, 95)
Milwaukee (2) Ryan Braun (Miami, FL, 2003, 04), Braden Looper (Wichita St., 1996)
New York (1) Alex Cora (Miami, FL, 1994, 95, 96)
Philadelphia (1) Eric Bruntlett (Stanford, 2000, 01)
Pittsburgh (0) None
San Diego (4) David Eckstein (Florida, 1996), Jody Gerut (Stanford, 1997), Chase Headley (Tennessee, 2005), Nick
Hundley (Arizona, 2004)
San Francisco (0) None
St. Louis (2) Troy Glaus (UCLA, 1997), Khalil Greene (Clemson, 2000, 02)
Washington (0) None
AMERICAN LEAGUE (43)
Baltimore (3) Jeremy Guthrie (Stanford, 2001, 02), Aubrey Huff (Miami, Fla., 1997, 98), Chad Moeller (Southern
California, 1995)
Boston (6) Chris Carter (Stanford, 2003), J.D. Drew (Florida St., 1995, 96), Jacoby Ellsbury (Oregon St., 2005), Mark
Kotsay (Cal St. Fullerton, 1994, 95), Jed Lowrie (Stanford, 2003), Jason Varitek (Georgia Tech, 1994)
Chicago (1) Carlos Quentin (Stanford, 2001, 02, 03)
Cleveland (3) Trevor Crowe (Arizona, 2004), Ryan Garko (2001, 02, 03), Anthony Reyes (Southern California, 2000, 01)
Detroit (1) Jeff Larish (Arizona St., 2005)
Kansas City (4) Brian Bannister (Southern California, 2000, 01), Willie Bloomquist (Arizona St., 1998), Alex Gordon
(Nebraska, 2005) , Luke Hochevar (Tennessee, 2005)
Los Angeles (0) None
Minnesota (4) Brian Bushcer (South Carolina, 2002, 03), R.A. Dickey (Tennessee, 1995), Brian Duensing (Nebraska,
2002, 05), Philip Humber (Rice, 2002, 03)
New York (2) Joba Chamberlain (Nebraska, 2005), Kevin Cash (Florida St., 1998, 99)
Oakland (8) Travis Buck/dl (Arizona St., 2005), Mark Ellis (Florida, 1998), Nomar Garciaparra (Georgia Tech, 1994),
Jason Giambi (Long Beach St., 1991), Landon Powell (South Carolina, 2002, 03, 04), Russ Springer (LSU,
1989), Kurt Suzuki (Cal St. Fullerton, 2003, 04), Brad Ziegler (Missouri St., 2003)
Seattle (1) David Aardsma (Rice, 2002, 03)
Tampa Bay (3) Pat Burrell (Miami, FL, 1996, 97, 98), J.P. Howell (Texas, 2003, 04), Jeff Niemann (Rice, 2003)
Texas (3) Brandon Boggs (Georgia Tech, 2002), Darren O’Day (Florida, 2005), Taylor Teagarden (Texas, 2003, 04,
05)
Toronto (4) Aaron Hill (LSU, 2003), Shaun Marcum/dl (Missouri St., 2003), Ricky Romero (Cal St. Fullerton, 2003,
04), Brian Tallet (LSU, 2000)


SINGLE-GAME
RECORDS


79
COLLEGE WORLD SERIES SINGLE-GAME RECORDS
BATTING – INDIVIDUAL
Most At Bats
7, by 21 players (last time: Josh Fellhauer, lf, Cal St. Fullerton vs. UC Irvine and Matt Morris, lf, UC Irvine vs.
Cal St. Fullerton, 6-18-07 [UC Irvine won 5-4 in 13 inn.])
Most Runs
5, Brendan Winn, rf, South Carolina vs. Miami (Fla.), 6-22-04 (15-11)
5, Oddibe McDowell, cf, Arizona St. vs. Oklahoma St., 6-5-84 (23-12)
5, Rick Gama, 2b, Miami (Fla.) vs. Southern California, 6-2-95 (15-10)
5, Jeff Christensen, lf, Tennessee vs. Georgia, 6-11-01 (19-12)
4, by many (last time: Danny Muno, ss, Fresno St. vs. Georgia, 6-24-08 [19-10])
Most Hits
6, Kris Bennett, 3b, Tennessee vs. Georgia, 6-11-01 (19-12)
5, by 14 players (last time: David Cooper, dh, Cal St. Fullerton vs. Clemson, 6-20-06 [7-6])
Most Doubles
3, Jack Bryant, 2b, Wake Forest vs. Western Mich., 6-14-55 (10-7)
3, Clint Meyers, c, Arizona St. vs. Penn St., 6-8-73 (3-1)
3, Dave Caldwell, rf, Clemson vs. Arizona St., 6-10-77 (7-10)
3, Bob Horner, 3b, Arizona St. vs. St. John's (N.Y.), 6-3-78 (13-2)
3, Bobby Carlsen, 3b, Oklahoma St. vs LSU, 6-7-90 (14-3)
3, Andy Phillips, ss, Alabama vs. Rice, 6-16-99 (6-5)
3, Jeff Corsaletti, cf, Florida vs. Nebraska, 6-19-05 (7-4)
3, Rich Poythress, 1b, Georgia vs. Stanford, 6-21-08 (10-8)
Most Triples
2, by 11 players (last time: Jack Voigt, rf, LSU vs. Florida St., 5-29-87 [6-2])
Most Home Runs
3, J. D. Drew, cf, Florida St. vs. Southern California, 6-6-95 (11-16)
3, Edmund Muth, cf, Stanford vs. La.-Lafayette, 6-15-00 (19-9)
3, Jeff Larish, 1b, Arizona St. vs. Nebraska, 6-19-05 (8-7, 11 inn.)
2, by 52 players (last time: Steve Detwiler, rf, Fresno St. vs. Georgia, 6-25-08 [6-1])
Most Inside-the-Park Home Runs
1, last time by Chris Burke, ss, Tennessee vs. Georgia, 6-11-01 (19-12)
Most Grand Slam Home Runs 1, by 45 players (last time: Tim Federowicz, c, North Carolina vs. LSU, *6-20-08 [3-7]); *-game started on June
19 but was suspended due to rain and grand slam was hit on June 20
Most Total Bases
12, J. D. Drew, cf, Florida St. vs. Southern California, 6-6-95 (11-16)
12, Marshall McDougall, 2b, Florida St. vs. Stanford, 6-18-99 (14-11, 13 inn.)
12, Edmund Muth, cf, Stanford vs. La.-Lafayette, 6-15-00 (19-9)
12, Jeff Larish, 1b, Arizona St. vs. Nebraska, 6-19-05 (8-7, 11 inn.)
11, Pete Naton, c, Holy Cross vs. Western Mich., 6-15-52 (15-3)
11, Rusty DeBold, ss, Miami (Fla.), vs. Stanford, 6-1-85 (17-3)
11, Alberto Concepcion, c, Southern California vs. Georgia, 6-9-01 (11-5)
11, Steve Detwiler, rf, Fresno St. vs. Georgia, 6-25-08 (6-1)
Hitting for the Cycle
Jerry Kindall, ss, Minnesota vs. Mississippi, 6-11-56 (13-5)

80
BATTING – INDIVIDUAL (continued)
Most Runs Batted In
7, Carl Thomas, p, Arizona vs. Oregon, 6-10-54 (12-1)
7, Stan Holmes, lf, Arizona St. vs. Oklahoma St., 6-5-81 (10-11, 13 inn.)
7, Mark Kotsay, lf, Cal St. Fullerton vs. Florida St., 6-7-94 (10-3)
7, Wes Rachels, 2b, Southern California vs. Arizona St., 6-6-98 [21-14])
7, Kris Bennett, 3b, Tennessee vs. Georgia, 6-11-01 (19-12)
Most Stolen Bases
4, Bob Fry, cf, Washington St. vs. Texas, 6-7-65 (12-5)
4, Doug Dascenzo, cf, Oklahoma St. vs. Texas, 6-8-84 (18-13)
4, Charlton Jimerson, cf, Miami (Fla.) vs. Tennessee, 6-14-01 (12-6)
3, by 18 players (last time: Brad Boyer, lf, Arizona vs. Arkansas, 6-20-04 [7-2])
Most Steals of Home 1, last time by Steven Feehan, cf, La.-Lafayette vs. Clemson, 6-14-00 (5-4)
Most Sacrifice Bunts
3, Leland David, ss, Western Mich. vs. Wake Forest, 6-13-55 (9-0)
3, Paul Chamberlain, rf, Northern Colo. vs. Lafayette, 6-14-58 (10-5)
2, by many players (last time: Ben Orloff, ss, UC Irvine vs. Cal St. Fullerton, 6-18-07 [5-4, 13 inn.])
Most Sacrifice Flies
2, by 13 players (last time: Rich Poythress, 1b, Georgia vs. Fresno St., 6-24-08 [10-19])
Most Hit by Pitches
3, Kurt Suzuki, c, Cal St. Fullerton vs. Stanford, 6-15-03 (6-5)
3, Taylor Holiday, 1b, UC Irvine vs. Cal St. Fullerton, 6-18-07 (5-4, 13 inn.)
PITCHING - INDIVIDUAL
Most Innings Pitched
15, Steve Arlin, Ohio St. vs. Washington St., 6-10-65 (1-0, 15 inn.)
14, Gary Gentry, Arizona St. vs. Stanford, 6-17-67 (4-3, 14 inn.)
13 1/3, Rod Poteete, Stanford vs. Arizona St., 6-17-67 (3-4, 14 inn.)
13, Don Herrick, Northern Colo. vs. St. John's (N.Y.), 6-15-60 (2-3, 13 inn.)
13, Jackson Todd, Oklahoma vs. Temple, 6-10-72 (2-1, 13 inn.)
Most Innings Pitched in Relief
10, Carl Thomas, Arizona vs. Oklahoma St., 6-12-54 (4-5, 14 inn.)
9, Dick Larner, California vs. Yale, 6-27-47 (17-4)
9, Tom Borland, Oklahoma St. vs. Arizona, 6-12-54 (5-4, 14 inn.)
9, Carroll Moore, Houston vs. Boston College, 6-15-67 (3-2, 13 inn.)
8 2/3, Kevin Dukes, Arizona St. vs. Oklahoma St., 6-8-81 (7-4)
8 2/3, Al Osuna, Stanford vs. Texas, 6-6-87 (9-3)
8 2/3, Charlie Cruz, Florida St. vs. Miami (Fla.), 6-4-95 (2-4)
Most Hits Allowed
16, Joe Kazura, New Hampshire vs. Mississippi, 6-9-56 (12-13)
15, R. A. Dickey, Tennessee vs. Cal St. Fullerton, 6-5-95 (1-11)
14, Jack Shirley, Oklahoma vs. Ohio St., 6-13-51 (9-8, 10 inn.)
14, Bill Connors, Syracuse vs. Oklahoma St., 6-13-61 (0-8)
14, Ed Molush, Temple vs. Oklahoma, 6-10-72 (1-2, 13 inn.)
14, Aaron Rawl, South Carolina vs. Georgia Tech 6-18-02 (9-5)

81
PITCHING – INDIVIDUAL (continued)
Most Runs Allowed
13, Joe Kazura, New Hampshire vs. Mississippi, 6-9-56 (12-13)
12, Rob Souza, Miami (Fla.), vs. Cal St. Fullerton, 6-6-84 (5-13)
11, Gayl Bernhardt, Northern Colo. vs. Notre Dame, 6-9-57 (2-23)
11, Ken Kempf, Northern Colo. vs. Southern California, 6-16-58 (1-12)
11, Mike Skane, Holy Cross vs. Michigan, 6-12-62 (4-11)
11, Ben McDonald, LSU vs. Texas, 6-8-89 (7-12)
11, R. A. Dickey, Tennessee vs. Cal St. Fullerton, 6-5-95 (1-11)
11, Patrick Hicklen, Tennessee vs. Georgia, 6-11-01 (19-12)
Most Earned Runs Allowed
11, Ben McDonald, LSU vs. Texas, 6-8-89 (7-12)
11, Patrick Hicklen, Tennessee vs. Georgia, 6-11-01 (19-12)
10, Gayl Bernhardt, Northern Colo. vs. Notre Dame, 6-9-57 (2-23)
10, Darren Dilks, Oklahoma St. vs. Arizona St., 6-5-81 (11-10, 13 inn.)
10, James Popoff, Cal St. Fullerton vs. Oklahoma St., 6-2-90 (4-14)
10, R. A. Dickey, Tennessee vs. Cal St. Fullerton, 6-6-95 (1-11)
Most Strikeouts
20, Steve Arlin, Ohio St. vs. Washington St., 6-10-65 (1-0, 15 inn.)
17, Ed Bane, Arizona St. vs. Oklahoma, 6-11-72 (1-0)
16, Harold Stowe, Clemson vs. Arizona, 6-13-59 (2-3, 12 inn.)
16, Jim Ward, Arizona vs. Oklahoma St., 6-13-60 (2-1)
16, Larry Hankhammer, Southern California vs. Oklahoma St., 6-12-61 (4-2)
16, Gary Gentry, Arizona St. vs. Oklahoma St., 6-12-67 (7-2)
16, Brett Laxton, LSU vs. Wichita St., 6-12-93 (8-0)
Most Strikeouts (nine-inning game)
17, Ed Bane, Arizona St. vs. Oklahoma, 6-11-72 (1-0)
16, Jim Ward, Arizona vs. Oklahoma St., 6-13-60 (2-1)
16, Larry Hankhammer, Southern California vs. Oklahoma St., 6-12-61 (4-2)
16, Gary Gentry, Arizona St. vs. Oklahoma St., 6-12-67 (7-2)
16, Brett Laxton, LSU vs. Wichita St., 6-12-93 (8-0)
Most Strikeouts In One Inning
4, last time by Scott Weiss, Stanford vs. Georgia, fifth inning, 6-8-90 (5-1)
Most Walks
15, James Waldrip, Oklahoma vs. Springfield, 6-14-51 (7-1)
12, Rod Keogh, Washington St. vs. Texas, 6-23-50 (0-3)
12, Keith Weber, Missouri vs. Minnesota, 6-15-64 (4-1)
11, Bob Wasko, Minnesota vs. Southern California, 6-19-60 (3-4, 11 inn.)
11, Rich Napolitano, St. John's (N.Y.) vs. North Carolina St., 6-12-68 (3-2, 12 inn.)
Most Wild Pitches
3, by 14 players (last time: Koley Kolberg, Arizona vs. Georgia, 6-18-04 [7-8])
Most Hit Batters
5, Matt Manship, Stanford vs. Cal St. Fullerton, 6-19-03 (7-5, 10 inn.)
4, Bryan Harris, Cal St. Fullerton vs. UC Irvine, 6-18-07 (4-5, 13 inn.)
4, Ryan Berry, Rice vs. North Carolina, 6-20-07 (1-6)
3, by 9 players (last time: Colby Wark, Louisville vs. North Carolina, 6-19-07 [1-3])
Most Balks
2, Frank Carbajal, Northern Colo. vs. Clemson, 6-14-59 (1-7)
2, Jon Smith, Cal St. Fullerton vs. Nebraska, 6-8-01 (5-4)
2, Beau Richardson, Tulane vs. Nebraska, 6-10-01 (6-5)
2, Jeff Kaplan, Cal St. Fullerton vs. UC Irvine, 6-18-07 (4-5, 13 inn.)

82
PITCHING – INDIVIDUAL (continued)
Most Pitches Thrown (since 1981)
189, Darren Dilks, Oklahoma St. vs. Arizona St., 6-5-81 (11-10)
175, Erik Sonberg, Wichita St. vs. Oklahoma St., 6-9-82 (13-2)
172, Brooks Kieschnick, Texas vs. Oklahoma St., 6-5-93 (6-5)
169, Tim Davis, Florida St. vs. California, 5-31-92 (5-4)
167, Jason Young, Stanford vs. Florida St., 6-18-99 (14-11)
Fewest Pitches Thrown (minimum 8 innings pitched; since 1981)
84, John Hudgins, Stanford vs. South Carolina, 6-13-03 (8 IP; 8-0)
87, Jeff Niemann, Rice vs. Missouri St., 6-14-03 (8+ IP; 4-2)
98, Kyle Bakker, Georgia Tech vs. South Carolina, 6-14-02 (8 IP; 11-0)
99, J.D. Arteaga, Miami (Fla.) vs. Florida St., 6-4-95 (9 IP; 4-2)
103, Darric Merrell, Cal St. Fullerton vs. Tulane, 6-12-01 (8 IP; 11-2)
FIELDING – INDIVIDUAL
Most Putouts
20, Doug Mirabelli, c, Wichita St. vs. Creighton, 6-3-91 (3-2, 12 inn.)
19, Dave Thornton, 1b, Temple vs. Oklahoma, 6-10-72 (1-2, 13 inn.)
18, Doug Kasimer, 1b, Florida St. vs. Southern California, 6-19-70 (1-2 15 inn.)
18, Kelly Snider, 1b, Oklahoma vs. Arizona St., 6-12-75 (0-1, 11 inn.)
18, Luke Prestridge, 1b, Baylor vs. Minnesota, 6-13-77 (3-4, 11 inn.)
Most Assists
11, Cal Meier, ss, Southern California vs. Florida St., 6-18-70 (2-1,15 inn.)
10, Spike Owen, ss, Texas vs. Oklahoma St., 6-6-81 (15-8, 13 inn.)
10, Bien Figuero, ss, Florida St. vs. Miami (Fla.), 6-8-86 (4-3)
10, Andrew Romine, ss, Arizona St. vs. UC Irvine, 6-19-07 (7-8, 10 inn.)
9, Roger Detter, ss, Arizona St. vs. UCLA, 6-14-69 (2-1, 11 inn.)
9, Cal Meier, ss, Southern California vs. Delaware, 6-13-70 (7-1)
9, Jeff Jacobson, 2b, Michigan vs. Maine, 6-4-83 (6-5)
9, Mike Fontenot, 2b, LSU vs. Texas, 6-10-00 (13-5)
Most Errors
4, Guy Wallace, ss, Texas A&M vs. Utah, 6-15-51 (8-15)
4, Carmen Troiso, ss, Penn St. vs. Holy Cross, 6-15-52 (4-15)
4, Phil Honeycutt, ss, Tulsa vs. Harvard, 6-13-71 (9-8)
4, David Denny, 3b, Texas vs. Oklahoma St., 6-8-84 (13-18)
3, by many players (last time: Danny Muno, ss, Fresno St. vs. Georgia, 6-25-08 [6-1])
Most Passed Balls
3, Jim Garrett, Fresno St. vs. Arizona, 6-14-59 (1-5)
3, Fred Dumler, Oklahoma St. vs. Southern Ill., 6-13-68 (1-7)
3, Bryan Kennedy, Long Beach St. vs. Miami (Fla.), 6-2-98 (6-3)
2, by many players (last time: Taylor Teagarden, Texas vs. Florida, 6-25-05 [4-2])
BATTING - TEAM
Most Times at Bat
54, Oklahoma St. vs. Texas, 6-6-81 (8-15, 13 inn.)
53, Florida St. vs. Stanford, 6-18-99 (14-11, 13 inn.)
52, Southern California vs. Florida St., 6-19-70 (2-1, 15 inn.)
52, Texas vs. Oklahoma St., 6-6-81 (15-8, 13 inn.)
52, Stanford vs. Florida St., 6-18-99 (11-14, 13 inn.)
52, North Carolina vs. Cal St. Fullerton, 6-16-06 (7-5, 13 inn.)

83
BATTING - TEAM (continued)
Most Times at Bat (nine-inning game)
50, Holy Cross vs. Penn St., 6-15-52 (15-4)
49, Arizona St. vs. Wichita St., 6-10-88 (19-1)
49, Tennessee vs. Miami (Fla.), 6-9-01 (13-21)
47, Arizona St. vs. Oklahoma St., 6-5-84 (23-12)
47, Arizona St. vs. Long Beach St., 6-3-98 (14-4)
Most Runs
23, Notre Dame vs. Northern Colo., 6-9-57 (23-2)
23, Arizona St. vs. Oklahoma St., 6-5-84 (23-12)
21, Southern California vs. Arizona St., 6-6-98 (21-14)
21, Miami (Fla.) vs. Tennessee, 6-9-01 (21-13)
20, Arizona vs. Northern Colo., 6-13-55 (20-0)
20, Cal St. Fullerton vs. LSU, 6-5-94 (20-6)
Most Runs, One Inning
11, California vs. Yale, ninth inning, 6-27-47 (17-4)
11, Seton Hall vs. Texas A&M, eighth inning, 6-10-64 (14-5)
11, Stanford vs. South Caro., sixth inning, 6-5-82 (15-4)
11, Mississippi St. vs. Ga. Southern, first inning, 6-3-90 (15-1)
11, Georgia vs. Stanford, sixth inning, 6-3-90 (16-2)
11, Cal St. Fullerton vs. LSU, first inning, 6-5-94 (20-6)
11, Stanford vs. Florida St., ninth inning, 6-14-2008 (16-5)
Most Hits
23, Arizona St. vs. Oklahoma St., 6-5-84 (23-12)
23, Arizona St. vs. Wichita St., 6-10-88 (19-1)
23, Southern California vs. Arizona St., 6-6-98 (21-14)
21, Duke vs. Oregon St., 6-12-52 (18-7)
21, Tennessee vs. Miami (Fla.), 6-9-01 (13-21)
21, Tennessee vs. Georgia, 6-11-01 (19-12)
Most Doubles
7, Arizona St. vs. Oklahoma St., 6-5-84 (23-12)
6, Duke vs. Oregon St., 6-12-52 (18-7)
6, Arizona St. vs. St. John's (N. Y. ), 6-3-78 (13-2)
6, Florida vs. Wichita St., 6-3-88 (4-5)
6, Georgia vs. Stanford, 6-8-90 (5-1)
6, Texas vs. Georgia, 6-20-04 (9-3)
Most Triples
4, Holy Cross vs. Western Mich., 6-15-52 (15-3)
4, Syracuse vs. Northern Colo., 6-10-61 (12-5)
3, by 10 teams (last time: LSU vs. Fresno St., 6-2-91 [15-3])
Most Home Runs
8, LSU vs. Southern California, 5-30-98 (12-10)
6, LSU vs. Mississippi St., 6-1-98 (10-8)
6, Florida St. vs. Stanford, 6-18-99 (14-11, 13 inn.)
6, Southern California vs. Georgia, 6-9-01 (11-5)
5, by five teams (last time: Southern California vs. Arizona St., 6-6-98 [21-14])
Most Home Runs By Different Players
7, LSU vs. Southern California, 5-30-98 (12-10)

84
BATTING - TEAM (continued)
Most Total Bases
42, Southern California vs. Arizona St., 6-6-98 (21-14)
42, Florida St. vs. Stanford, 6-18-99 (14-11, 13 inn.)
41, Southern California vs. Georgia, 6-9-01 (11-5)
39, Arizona St. vs. Oklahoma St., 6-5-84 (23-12)
39, LSU vs. Southern California, 5-30-98 (12-10)
Most Runs Batted In
22, Notre Dame vs. Northern Colo., 6-9-57 (23-2)
21, Arizona St. vs. Oklahoma St., 6-5-84 (23-12)
20, Southern California vs. Arizona St., 6-6-98 (21-14)
19, Stanford vs. La.-Lafayette, 6-15-00 (19-9)
19, Miami (Fla.) vs. Tennessee, 6-9-01 (21-13)
19, Tennessee vs. Georgia, 6-11-01 (19-12)
Most Walks
16, Miami (Fla.) vs. UCLA, 5-31-97 (7-3, 12 inn.)
15, Springfield vs. Oklahoma, 6-14-51 (1-7)
15, Duke vs. Northern Colo., 6-11-61 (15-3)
15, Oklahoma St. vs. Arizona St., 6-5-81 (11-10, 13 inn.)
14, by three teams (last time: Minnesota vs. Missouri, 6-15-64 [1-4])
Fewest Strikeouts
0, by nine teams (last time: Stanford vs. Cal St. Fullerton, 6-13-01 [4-1])
Most Stolen Bases
7, Rutgers vs. Texas, 6-15-50 (4-2)
7, Wake Forest vs. Western Mich., 6-14-55 (10-7)
7, Pepperdine vs. Mississippi St., 6-4-79 (5-4, 10 inn.)
7, Arizona St. vs. Oklahoma St., 6-5-84 (23-12)
7, Clemson vs. Long Beach St., 6-3-91 (11-12)
Most Stolen Bases In One Inning
4, La.-Lafayette vs. Clemson, 6-14-00, 5th inn. (5-4)
Most Sacrifice Bunts
5, Lafayette vs. Northern Colo., 6-11-53 (6-2)
5, Michigan St. vs. Rollins, 6-12-54 (4-5)
5, California vs. Michigan, 6-1-80 (8-9, 11 inn.)
4, by 15 teams (last time: Oregon St. vs. North Carolina, 6-24-06 [3-4])
Most Sacrifice Flies
3, by 11 teams (last time: Oregon St. vs. North Carolina, 6-23-07 [11-4])
PITCHING - TEAM
Most Earned Runs Allowed
22, Northern Colo. vs. Notre Dame, 6-9-57 (2-23)
21, Arizona St. vs. Southern California, 6-6-98 (14-21)
21, Tennessee vs. Miami (Fla.), 6-9-01 (13-21)
19, Georgia vs. Fresno St., 6-24-08 (10-19)
18, Oklahoma St. vs. Arizona St., 6-5-84 (12-23)
Most Strikeouts
20, Ohio St. vs. Washington St., 6-10-65 (1-0, 15 inn.)
19, Wichita St. vs. Creighton, 6-3-91 (3-2, 12 inn.)
19, Clemson vs. Miami (Fla.), 5-31-96 (3-7)
17, Arizona St. vs. Oklahoma, 6-11-72 (1-0)
16, by eight teams (last time: Southern California vs. Georgia, 6-9-01 [11-5])

85
PITCHING – TEAM (continued)
Most Strikeouts (nine-inning game)
19, Clemson vs. Miami (Fla.), 5-31-96 (3-7)
17, Arizona St. vs. Oklahoma, 6-11-72 (1-0)
16, Arizona vs. Oklahoma St., 6-13-60 (2-1)
16, Southern California vs. Oklahoma St., 6-12-61 (4-2)
16, Arizona St. vs. Oklahoma St., 6-12-67 (7-2)
16, LSU vs. Wichita St., 6-12-93 (8-0)
16, Southern California vs. Georgia, 6-9-01 (11-5)
Most Wild Pitches
6, Long Beach St. vs. Arizona St., 6-3-98 (4-14)
5, Tennessee vs. Miami (Fla.), 6-9-01 (13-21)
4, Texas vs. Arizona St., 6-8-75 (2-5)
4, Florida St. vs. Arizona, 6-6-86 (5-9)
4, Florida St. vs. Florida, 6-1-96 (2-5)
4, LSU vs. Alabama, 6-7-97 (13-6)
4, Mississippi St. vs. Florida, 5-30-98 (14-13)
4, Clemson vs. Stanford, 6-11-00 (4-10)
Most Batters Hit
6, Cal St. Fullerton vs. UC Irvine, 6-18-07 (4-5, 13 inn.)
5, Stanford vs. Cal St. Fullerton, 6-19-03 (7-5, 10 inn.)
5, Arkansas vs. Texas, 6-18-04 (2-13)
4, by seven teams (last time: Rice vs. North Carolina, 6-20-07 [1-6])
Most Balks
2, Northern Colo. vs. Clemson, 6-14-59 (1-7)
2, Cal St. Fullerton vs. Wichita St., 6-4-82 (0-7)
2, James Madison vs. Texas, 6-3-83 (0-12)
2, Cal St. Fullerton vs. Nebraska, 6-8-01 (5-4)
2, Tulane vs. Nebraska, 6-10-01 (6-5)
2, Rice vs. North Carolina, 6-17-2007 (14-4)
2, Cal St. Fullerton vs. UC Irvine, 6-18-07 (4-5, 13 inn.)
Most Pitchers Used
8, North Carolina vs. Rice, 6-17-07 (4-14)
7, LSU vs. Cal St. Fullerton, 6-5-94 (6-20)
7, LSU vs. Stanford, 6-4-97 (13-9)
7, Florida St. vs. Stanford, 6-18-99 (14-11, 13 inn.)
7, Clemson vs. Stanford, 6-11-00 (4-10)
7, Stanford vs. Tulane, 6-8-01 (13-11)
7, Miami (Fla.) vs. Tennessee, 6-9-01 (21-13)
7, Nebraska vs. Clemson, 6-14-02 (10-11)
7, Texas vs. Rice, 6-16-03 (2-12)
7, Florida St. vs. Stanford, 6-14-08 (5-16)
7, Rice vs. Fresno St., 6-15-08 (5-17)
7, North Carolina vs. Fresno St., 6-22-08 (1-6)
7, Georgia vs. Fresno St., 6-24-08 (10-19)
Most Pitches Thrown (since 1981)
262, Oklahoma St. vs. Texas, 6-6-81 (8-15, 13 inn.)
260, Arizona St. vs. Oklahoma St., 6-5-81 (10-11, 13 inn.)
259, UCLA vs. Miami (Fla.), 5-31-97 (3-7, 12 inn.)
257, Oklahoma St. vs. Arizona St., 6-5-81 (11-10, 13 inn.)
252, Stanford vs. Florida St., 6-18-99 (11-14, 13 inn.)
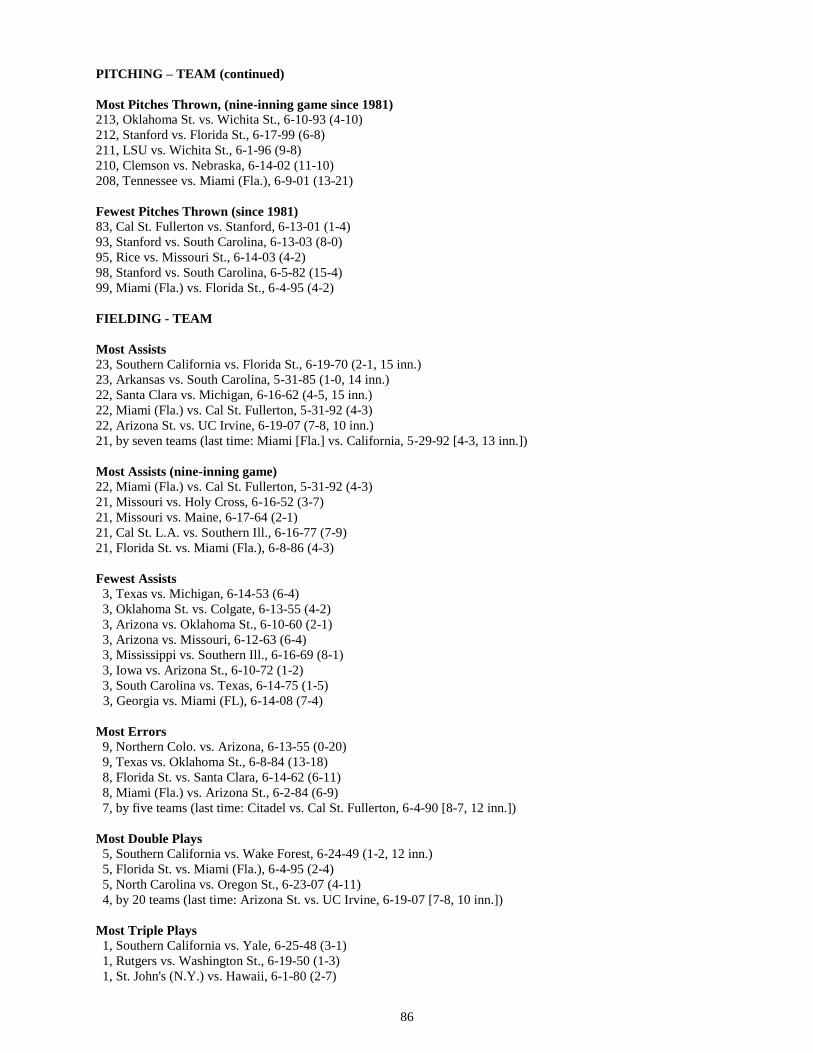
86
PITCHING – TEAM (continued)
Most Pitches Thrown, (nine-inning game since 1981)
213, Oklahoma St. vs. Wichita St., 6-10-93 (4-10)
212, Stanford vs. Florida St., 6-17-99 (6-8)
211, LSU vs. Wichita St., 6-1-96 (9-8)
210, Clemson vs. Nebraska, 6-14-02 (11-10)
208, Tennessee vs. Miami (Fla.), 6-9-01 (13-21)
Fewest Pitches Thrown (since 1981)
83, Cal St. Fullerton vs. Stanford, 6-13-01 (1-4)
93, Stanford vs. South Carolina, 6-13-03 (8-0)
95, Rice vs. Missouri St., 6-14-03 (4-2)
98, Stanford vs. South Carolina, 6-5-82 (15-4)
99, Miami (Fla.) vs. Florida St., 6-4-95 (4-2)
FIELDING - TEAM
Most Assists
23, Southern California vs. Florida St., 6-19-70 (2-1, 15 inn.)
23, Arkansas vs. South Carolina, 5-31-85 (1-0, 14 inn.)
22, Santa Clara vs. Michigan, 6-16-62 (4-5, 15 inn.)
22, Miami (Fla.) vs. Cal St. Fullerton, 5-31-92 (4-3)
22, Arizona St. vs. UC Irvine, 6-19-07 (7-8, 10 inn.)
21, by seven teams (last time: Miami [Fla.] vs. California, 5-29-92 [4-3, 13 inn.])
Most Assists (nine-inning game)
22, Miami (Fla.) vs. Cal St. Fullerton, 5-31-92 (4-3)
21, Missouri vs. Holy Cross, 6-16-52 (3-7)
21, Missouri vs. Maine, 6-17-64 (2-1)
21, Cal St. L.A. vs. Southern Ill., 6-16-77 (7-9)
21, Florida St. vs. Miami (Fla.), 6-8-86 (4-3)
Fewest Assists
3, Texas vs. Michigan, 6-14-53 (6-4)
3, Oklahoma St. vs. Colgate, 6-13-55 (4-2)
3, Arizona vs. Oklahoma St., 6-10-60 (2-1)
3, Arizona vs. Missouri, 6-12-63 (6-4)
3, Mississippi vs. Southern Ill., 6-16-69 (8-1)
3, Iowa vs. Arizona St., 6-10-72 (1-2)
3, South Carolina vs. Texas, 6-14-75 (1-5)
3, Georgia vs. Miami (FL), 6-14-08 (7-4)
Most Errors
9, Northern Colo. vs. Arizona, 6-13-55 (0-20)
9, Texas vs. Oklahoma St., 6-8-84 (13-18)
8, Florida St. vs. Santa Clara, 6-14-62 (6-11)
8, Miami (Fla.) vs. Arizona St., 6-2-84 (6-9)
7, by five teams (last time: Citadel vs. Cal St. Fullerton, 6-4-90 [8-7, 12 inn.])
Most Double Plays
5, Southern California vs. Wake Forest, 6-24-49 (1-2, 12 inn.)
5, Florida St. vs. Miami (Fla.), 6-4-95 (2-4)
5, North Carolina vs. Oregon St., 6-23-07 (4-11)
4, by 20 teams (last time: Arizona St. vs. UC Irvine, 6-19-07 [7-8, 10 inn.])
Most Triple Plays
1, Southern California vs. Yale, 6-25-48 (3-1)
1, Rutgers vs. Washington St., 6-19-50 (1-3)
1, St. John's (N.Y.) vs. Hawaii, 6-1-80 (2-7)

87
FIELDING – TEAM (continued)
Most Passed Balls
5, Fresno St. vs. Arizona, 6-14-59 (1-5)
3, Clemson vs. Penn St., 6-15-59 (0-7)
3, Minnesota vs. Southern California, 6-17-60 (12-11, 10 inn.)
3, Oklahoma St. vs. Southern Ill., 6-13-68 (1-7)
3, Long Beach St. vs. Miami (Fla.), 6-2-98 (6-3)
BATTING - BOTH TEAMS
Most Times at Bat
106, Oklahoma St. (54) vs. Texas (52), 6-6-81 (8-15, 13 inn.)
105, Florida St. (53) vs. Stanford (52), 6-18-99 (14-11, 13 inn.)
102, Southern California (52) vs. Florida St. (50), 6-19-70 (2-1, 15 inn.)
101, Texas (51) vs. Southern California (50), 6-16-70 (7-8, 14 inn.)
100, North Carolina (52) vs. Cal St. Fullerton (48), 6-16-06 (7-5, 13 inn.)
Most Times at Bat (nine-inning game)
89, Tennessee (49) vs. Miami (Fla.) (40), 6-9-01 (13-21)
88, Arizona St. (47) vs. Oklahoma St. (41), 6-5-84 (23-12)
87, Southern California (46) vs. Arizona St. (41), 6-6-98 (21-14)
86, Clemson (43) vs. Alabama (43), 6-4-96 (14-13)
85, Tennessee (47) vs. Georgia (38), 6-11-01 (19-12)
85, South Carolina (44) vs. LSU (41), 6-21-04 (15-4)
Most Runs
35, Arizona St. (23) vs. Oklahoma St. (12), 6-5-84
35, Southern California (21) vs. Arizona St. (14), 6-6-98
34, Miami (Fla.) (21) vs. Tennessee (13), 6-9-01
31, Oklahoma St. (18) vs. Texas (13), 6-8-84
31, Tennessee (19) vs. Georgia (12), 6-11-01
Most Hits
41, Tennessee (21) vs. Miami (Fla.) (20), 6-9-01 (13-21)
39, Southern California (23) vs. Arizona St. (16), 6-6-98 (21-14)
37, Arizona St. (23) vs. Oklahoma St. (14), 6-5-84 (23-12)
36, Southern California (19) vs. Florida (17), 6-1-98 (12-10)
35, Florida St. (19) vs. Stanford (16), 6-18-99 (14-11, 13 inn.)
35, Tennessee (21) vs. Georgia (14), 6-11-01 (19-12)
35, South Carolina (19) vs. LSU (16), 6-21-04 (15-4)
35, Fresno St. (19) vs. Georgia (16), 6-24-08 (19-10)
Most Doubles
9, Duke (6) vs. Oregon St. (3), 6-12-52 (18-7)
9, Clemson (5) vs. Arizona St. (4), 6-10-77 (7-10)
9, Arizona St. (7) vs. Oklahoma St. (2), 6-5-84 (23-12)
9, Stanford (5) vs. Cal St.Fullerton (4), 6-3-95 (5-6)
8, Seven times (last time: Rice [4] vs. Louisville [4], 6-15-07 [15-10])
Most Triples
5, New Hampshire (3) vs. Mississippi (2), 6-9-56 (12-13)
4, Holy Cross (4) vs. Western Mich. (0), 6-15-52 (15-3)
4, Syracuse (4) vs. Northern Colo. (0), 6-10-61 (12-5)
4, Santa Clara (2) vs. Florida St. (2), 6-14-62 (11-6)
4, New York U. (2) vs. Massachusetts (2), 6-16-69 (9-2)

88
BATTING - BOTH TEAMS (continued)
Most Home Runs
10, LSU (8) vs. Southern California (2), 5-30-98 (12-10)
9, Southern California (5) vs. Arizona St. (4), 6-6-98 (21-14)
8, Florida St. (6) vs. Stanford (2), 6-18-99 (14-11, 13 inn.)
8, Stanford (4) vs. La.-Lafayette (4), 6-15-00 (19-9)
7, Five times (last time: Southern California [6] vs. Georgia [1], 6-9-01 [11-5])
Most Total Bases
71, Southern California (42) vs. Arizona St. (29), 6-6-98 (21-14)
68, Florida St. (42) vs. Stanford (26), 6-18-99 (14-11, 13 inn.)
66, Miami (Fla.) (36) vs. Tennessee (30), 6-9-01 (21-13)
60, Arizona St. (39) vs. Oklahoma St. (21), 6-5-84 (23-12)
60, Tennessee (37) vs. Georgia (23), 6-11-01 (19-12)
Most Runs Batted In
34, Southern California (20) vs. Arizona St. (14), 6-6-98 (21-14)
33, Arizona St. (21) vs. Oklahoma St. (12), 6-5-84 (23-12)
31, Miami (Fla.) (19) vs. Tennessee (12), 6-9-01 (21-13)
30, Tennessee (19) vs. Georgia (11), 6-11-01 (19-12)
28, Fresno St. (18) vs. Georgia (10), 6-24-08 (19-10)
Most Walks
25, Oklahoma St. (15) vs. Arizona St. (10), 6-5-81 (11-10, 13 inn.)
23, Springfield (15) vs. Oklahoma (8), 6-14-51 (1-7)
21, Minnesota (12) vs. Southern California (9), 6-17-60 (12-11, 10 inn.)
21, Duke (15) vs. Northern Colo. (6), 6-11-61 (15-3)
21, Clemson (12) vs. Nebraska (9), 6-14-02 (11-10)
Most Stolen Bases
11, Clemson (7) vs. Long Beach St. (4), 6-3-91 (11-12)
9, Ohio St. (6) vs. Houston (3), 6-13-67 (6-7)
9, Arizona St. (7) vs. Oklahoma St. (2), 6-5-84 (23-12)
8, Maine (5) vs. South Carolina (3), 6-2-81 (7-12)
8, California (5) vs. Florida (3), 6-5-88, (5-6)
8, Miami (Fla.) (4) vs. Tennessee (4), 6-9-01 (21-13)
Most Caught Stealing
6, Oklahoma St. (3) vs. Indiana St. (3), 6-1-86 (4-0)
Most Sacrifice Bunts
7, Arizona (4) vs. Oklahoma St. (3), 6-12-54 (4-5, 14 inn.)
7, Michigan State (5) vs. Rollins (2), 6-12-54 (4-5)
7, California (5) vs. Michigan (2), 6-1-80 (8-9, 11 inn.)
6, Santa Clara (4) vs. Missouri (2), 6-12-62 (7-4, 12 inn.)
5, 12 times (last time: Texas (5) vs. Baylor (0), 6-18-05 [5-1])
Most Sacrifice Flies
5, Miami (Fla.) (3) vs. LSU (2), 6-8-96 (8-9)
4, Oklahoma St. (3) vs. Texas (1), 6-8-84 (18-13)
4, Stanford (3) vs. Texas (1), 6-17-02 (8-7)
4, Texas (3) vs. South Carolina (1), 6-22-02 (12-6)
4, Oregon St. (3) vs. North Carolina (1), 6-23-07 (11-4)
3, 13 times (last time: Georgia (2) vs. Fresno St. (1), 6-24-08 [10-19])

89
PITCHING - BOTH TEAMS
Most Earned Runs Allowed
34, Tennessee (21) vs. Miami (Fla.) (13), 6-9-01 (13-21)
32, Arizona St. (21) vs. Southern California (11), 6-6-98 (14-21)
30, Oklahoma St. (18) vs. Arizona St. (12), 6-5-84 (12-23)
27, Florida (14) vs. Mississippi St. (13), 5-30-98 (13-14)
27, Georgia (19) vs. Fresno St. (8), 6-24-08 (10-19)
Most Strikeouts
31, Santa Clara (16) vs. Michigan (15), 6-16-62 (4-5, 15 inn.)
29, Texas (16) vs. Southern California (13), 6-16-70 (7-8, 14 inn.)
27, Wichita St. (19) vs. Creighton (8), 6-3-91 (3-2, 12 inn.)
26, Florida St. (15) vs. Southern California (11), 6-19-70 (1-2, 15 inn.)
25, nine times (last time: North Carolina (15) vs. Cal St. Fullerton (10), 6-16-06 [7-5, 13 inn.])
Most Strikeouts (nine-inning game)
25, Florida St. (14) vs. Dartmouth (11), 6-14-70 (6-0)
25, South Carolina (14) vs. Cal St. L.A. (11), 6-13-77 (6-2)
25, Texas (14) vs. LSU (11), 6-8-89 (12-7)
25, LSU (15) vs. Alabama (10), 6-7-97 (13-6)
24, Clemson (14) vs. Miami [Fla.] (10), 6-5)
24, Alabama (13) vs. Rice (11), 6-16-99 (6-5)
Most Batters Hit
8, Arkansas (5) vs. Texas (3), 6-18-04 (2-13)
8, Cal St. Fullerton (6) vs. UC Irvine (2), 6-18-07 (4-5, 13 inn.)
6, Stanford (4) vs. LSU (2), 6-17-00 (5-6)
6, Stanford (5) vs. Cal St. Fullerton (1), 6-19-2003 (7-5, 10 inn.)
5, by five teams (last time: Rice [4] vs. North Carolina [1], 6-20-07 [1-6])
Most Wild Pitches
7, Tennessee (5) vs. Miami (Fla.) (2), 6-9-01 (13-21)
6, Long Beach St. (6) vs. Arizona St. (0), 6-3-98 (4-14)
5, Texas (4) vs. Arizona St. (1), 6-8-75 (2-5)
5, Temple (3) vs. Southern Ill. (2), 6-10-77 (5-10)
5, Stanford (3) vs. Rice (2), 6-22-03 (8-3)
5, Arizona (3) vs. Georgia (2), 6-18-04 (7-8)
Most Balks
3, Tulane (2) vs. Nebraska (1), 6-10-01 (6-5)
2, Southern California (1) vs. Connecticut (1), 6-11-72 (5-4, 11 inn.)
2, Cal St. Fullerton (2) vs. Wichita St. (0), 6-4-82 (0-7)
2, James Madison (2) vs. Texas (0), 6-3-83 (0-12)
2, James Madison (1) vs. Stanford (1), 6-5-83 (1-3)
2, Cal St. Fullerton (2) vs. Nebraska (0), 6-8-01 (5-4)
2, Tennessee (1) vs. Georgia (1), 6-11-01 (19-12)
2, South Carolina (1) vs. Miami (Fla.) (1), 6-22-04 (15-11)
2, Rice (2) vs. North Carolina (0), 6-17-07 (14-4)
2, Cal St. Fullerton (2) vs. UC Irvine (0), 6-18-07 (4-5, 13 inn.)
Most Pitchers Used
13, Nebraska (7) vs. Clemson (6), 6-14-02 (10-11)
12, Miami (Fla.) (6) vs. Southern California (6), 6-2-95 (15-10)
12, Stanford (7) vs. Tulane (5), 6-8-01 (13-11)
12, Miami (Fla.) (7) vs. Tennessee (5), 6-9-01 (21-13)
11, by four teams (last time: Stanford [4] vs. Florida St. [7], 6-14-08 [16-5])

90
PITCHING - BOTH TEAMS (continued)
Most Pitches Thrown (since 1981)
517, Arizona St. (260) vs. Oklahoma St. (257), 6-5-81 (10-11, 13 inn.)
487, Stanford (252) vs. Florida St., (235), 6-18-99 (11-14, 13 inn.)
458, Oklahoma St. (262) vs. Texas (196), 6-11-99 (8-15, 13 inn.)
430, UCLA (259) vs. Miami (Fla.) (171), 5-31-97 (3-7, 12 inn.)
427, North Carolina (236) vs. Cal St. Fullerton (191), 6-16-06 (7-5, 13 inn.)
417, Cal St. Fullerton (216) vs. UC Irvine (201), 6-18-07 (4-5, 13 inn.)
Most Pitches Thrown (nine-inning game since 1981)
409, Tennessee (208) vs. Miami (Fla.) (201), 6-9-01 (13-21)
395, Tulane (198) vs. Stanford (197), 6-8-01 (11-13)
391, Clemson (210) vs. Nebraska (181), 6-14-02 (11-10)
389, Mississippi St. (203) vs. Florida (186), 5-30-98 (14-13)
386, LSU (211) vs. Wichita St. (175), 6-1-96 (9-8)
FIELDING -- BOTH TEAMS
Most Assists
40, Santa Clara (22) vs. Michigan (18), 6-16-62 (4-5, 15 inn.)
39, Southern California (23) vs. Florida St. (16), 6-19-70 (2-1, 15 inn.)
39, Oklahoma (20) vs. Temple (19), 6-10-72 (2-1, 13 inn.)
39, California (20) vs. Michigan (19), 6-1-80 (8-9, 11 inn.)
38, Arkansas (23) vs. South Carolina (15), 5-31-85 (1-0, 14 inn.)
Most Assists (nine-inning game)
36, Mississippi St. (19) vs. Cal St. Fullerton (17), 6-2-79 (6-1)
36, Oklahoma (18) vs. Georgia Tech (18), 6-11-94 (13-5)
36, Oregon St. (19) vs. North Carolina (17), 6-24-06 (3-4)
34, Southern California (17) vs. Arizona St. (17), 6-6-78 (5-2)
34, Arkansas (17) vs. Pepperdine (17), 6-1-79 (5-4)
34, Arizona (19) vs. Cal St. Fullerton (15), 6-4-79 (3-16)
34, LSU (19) vs. Maine (15), 6-1-86 (8-4)
Fewest Assists
8, Iowa (3) vs. Arizona St. (5), 6-10-72 (1-2)
9, Arizona (4) vs. Northern Colo. (5), 6-13-55 (20-0)
9, Dartmouth (4) vs. Southern California (5), 6-15-70 (1-6)
10, Arizona St. (4) vs. Maine (6), 6-13-64 (2-4)
11, four times (last time: Stanford (4) vs. LSU (7), 6-4-97 [9-13])
Most Errors
12, Texas (9) vs. Oklahoma St. (3), 6-8-84 (13-18)
11, Texas A&M (7) vs. Utah (4), 6-15-51 (8-15)
11, Minnesota (5) vs. Mississippi (6), 6-11-56 (13-5)
10, South Carolina (5) vs. Maine (5), 6-2-81 (12-7)
10, Tufts (6) vs. Bradley (4), 6-18-50 (5-4)
10, Ga. Southern (6) vs. Stanford (4), 6-1-90 (4-5, 10 inn.)
Most Double Plays
8, Minnesota (4) vs. Oklahoma St. (4), 6-18-60 (3-1)
7, Southern California (5) vs. Wake Forest (2), 6-24-49 (1-2, 12 inn.)
6, Oklahoma St. (4) vs. Mississippi St. (2), 5-31-85 (3-12)
6, Stanford (4) vs. Oklahoma St. (2), 6-7-87 (9-5)
6, Cal St. Fullerton (4) vs. Georgia Tech (2), 6-8-94 (2-3, 12 inn.)
6, Florida St. (5) vs. Miami (Fla.) (1), 6-4-95 (2-4)
6, Long Beach St. (3) vs. Miami (Fla.) (3), 6-2-98 (6-3)
6, North Carolina (5) vs. Oregon St. (1), 6-23-07 (4-11)

91
FIELDING -- BOTH TEAMS (continued)
Most Passed Balls
4, Clemson (3) vs. Penn St. (1), 6-15-59 (0-7)
3, eight times (last time: Long Beach St. (3) vs. Miami (Fla.) (0), 6-2-98 [6-3])
MISCELLANEOUS RECORDS
Longest Game by Innings
15, Michigan vs. Santa Clara, 6-16-62 (5-4)
15, Ohio St. vs. Washington St., 6-10-65 (1-0)
15, Southern California vs. Florida St., 6-19-70 (2-1)
14, Oklahoma St. vs. Arizona, 6-12-54 (5-4)
14, Arizona St. vs. Stanford, 6-17-67 (4-3)
14, Southern California vs. Texas, 6-16-70 (8-7)
14, Arkansas vs. South Carolina, 5-31-85 (1-0)
Longest Game by Time
5:40, UC Irvine vs. Cal St. Fullerton, 6-18-07 (5-4, 13 inn.)
5:00, Oklahoma St. vs. Arizona St., 6-5-81 (11-10, 13 inn.)
4:53, North Carolina vs. Cal St. Fullerton, 6-16-06 (7-5, 13 inn.)
4:42, Miami (Fla.) vs. UCLA, 5-31-97 (7-3, 12 inn.)
4:41, Texas vs. Oklahoma St., 6-6-81 (15-8, 13 inn.)
4:35, Florida St. vs. Stanford, 6-18-99 (14-11, 13 inn.)
Longest Game by Time (nine-inning game)
4:21, Miami (Fla.) vs. Tennessee, 6-9-01 (21-13)
4:18, Stanford vs. Tulane, 6-8-01 (13-11)
4:11, Stanford vs. Florida St., 6-14-08 (16-5)
4:05, Cal St. Fullerton vs. Clemson, 6-20-06 (7-6)
4:01, Arizona St. vs. Oklahoma St., 6-5-84 (23-12)
4:01, Clemson vs. Nebraska, 6-14-02 (11-10)
Shortest Game by Innings
6, South Carolina vs. Eastern Mich., 6-8-75 (5-1)
7, Washington St. vs. Alabama, 6-17-50 (9-1)
7, Stanford vs. Auburn, 6-16-67 (5-3)
Shortest Game by Time
1:13, South Carolina vs. Eastern Mich., 6-8-75 (5-1, 6 inn.)
1:35, Arizona St. vs. South Carolina, 6-18-77 (2-1)
1:39, Arizona St. vs. Tulsa, 6-20-69 (10-1)
1:44, Massachusetts vs. Southern Ill., 6-14-69 (2-0)
1:45, three times (last time: Arizona St. vs. Temple, 6-14-72 [1-0])
Most Players Left on Base by One Team
19, Houston vs. Boston College, 6-14-67 (3-2, 13 inn.)
19, Oklahoma St. vs. Arizona St., 6-5-81 (11-10, 13 inn.)
18, Oklahoma St. vs. Arizona, 6-12-54 (5-4, 14 inn.)
18, California vs. Michigan, 6-1-80 (8-9, 11 inn.)
17, Springfield vs. Oklahoma, 6-14-51 (1-7)
17, Miami (FL) vs. UCLA, 5-31-97 (7-3, 12 inn.)
17, Florida St. vs. Miami (FL), 6-16-08 (5-7)
Most Players Left on Base by One Team (nine-inning game)
17, Springfield vs. Oklahoma, 6-14-51 (1-7)
17, Florida St. vs. Miami (FL), 6-16-08 (5-7)
16, Texas vs. Washington St., 6-23-50 (3-0)
16, Oklahoma vs. Tennessee, 6-17-51 (3-2)
16, Minnesota vs. Missouri, 6-15-64 (1-4)
16, Florida St. vs. Stanford, 6-17-99, (8-6)

92
MISCELLANEOUS RECORDS (continued)
Most Players Left on Base by Two Teams
34, Oklahoma St. (18) vs. Arizona (16), 6-12-54 (5-4, 14 inn.)
32, UC Irvine (16) vs. Cal St. Fullerton (16), 6-18-07 (5-4, 13 inn.)
31, Houston (19) vs. Boston College (12), 6-14-67 (3-2, 13 inn.)
30, Springfield (17) vs. Oklahoma (13), 6-14-51 (1-7)
29, Miami [Fla.] (16) vs. California (13), 5-29-92 (4-3, 13 inn.)
28, Oklahoma (16) vs. Ohio St. (12), 6-13-51 (9-8, 10 inn.)
28, Notre Dame (15) vs. Penn St. (13), 6-11-57 (4-5)
Most Players Left on Base by Two Teams (nine-inning game)
30, Springfield (17) vs. Oklahoma (13), 6-14-51 (1-7)
28, Notre Dame (15) vs. Penn St. (13), 6-11-57 (4-5)
26, Maine (14) vs. Arizona St. (12), 6-13-64 (4-2)
26, Florida (14) vs. Tennessee (12), 6-17-05 (6-4)
26, Florida St. (17) vs. Miami (FL) (9), 6-16-08 (5-7)
Fewest Players Left on Base by One Team
0, Michigan vs. Stanford, 6-11-53 (4-0)
1, Michigan vs. Texas, 6-11-62 (3-1)
1, Stanford vs. Cal St. Fullerton, 6-13-01 (4-1)
1, Missouri St. vs. Rice, 6-14-03 (2-4)
2, by 22 teams (last time: Rice vs. Missouri St., 6-14-03 [4-2])
Fewest Players Left on Base by Two Teams
3, Missouri St. (1) vs. Rice (2), 6-14-03 (2-4)
5, Stanford (2) vs. Cal St. Fullerton (3), 6-10-88 (9-5)
5, Stanford (1) vs. Cal St. Fullerton (4), 6-13-01 (4-1)
6, Temple (2) vs. Arizona St. (4), 6-14-72 (0-1)
7, five times (last time: Alabama (4) vs. Miami (Fla.) (3), 6-5-97 [8-6])
Most Players Used by One Team
22, Oklahoma vs. Texas, 5-30-92 (3-15)
22, LSU vs. Cal St. Fullerton, 6-5-94 (6-20)
21, Michigan vs. New Orleans, 6-3-84 (3-11)
21, Southern California vs. Miami (Fla.), 6-2-95 (10-15)
20, Cal St. Fullerton vs. LSU, 6-5-94 (20-6)
20, Clemson vs. Stanford, 6-11-00 (4-10)
Most Players Used by Both Teams
42, LSU (22) vs. Cal St. Fullerton (20), 6-5-94 (6-20)
38, LSU (19) vs. Florida (19), 6-5-91 (19-8)
38, Oklahoma (22) vs. Texas (16), 5-30-92 (3-15)
37, Southern California (21) vs. Miami (Fla.) (16), 6-2-95 (10-15)
37, Tennessee (19) vs. Miami (Fla.) (18), 6-9-01 (13-21)
Largest Winning Margin
21, Notre Dame vs. Northern Colo., 6-9-57 (23-2)
20, Arizona vs. Northern Colo., 6-13-55 (20-0)
18, Arizona St. vs. Wichita St., 6-10-88 (19-1)
15, Southern Ill. vs. St. John's (N.Y.), 6-14-68 (15-0)
14, six times (last time: Miami (Fla.) vs. Alabama, 6-2-96 [15-1])
Most Runs by a Losing Team
14, Arizona St. vs. Southern California, 6-6-98 (14-21)
13, Texas vs. Oklahoma St., 6-8-84 (13-18)
13, Alabama vs. Clemson, 6-4-96 (13-14)
13, Florida vs. Mississippi St., 5-30-98 (13-14)
13, Tennessee vs. Miami (Fla.), 6-9-01 (13-21)

93
MISCELLANEOUS RECORDS (continued)
Largest Margin Overcome for Victory
9 (in the 7th inning), Minnesota vs. Southern California, 6-17-60 (12-11, 10 inn.)
8 (in the 7th inning), Texas vs. Mississippi, 6-10-72 (9-8)
8 (in the 5th inning), Stanford vs. Tulane, 6-8-01 (13-11)
7 (in the 9th inning), Southern California vs. Minnesota, 6-12-73 (8-7)
7 (in the 7th inning), Arizona vs. Maine, 5-30-86 (8-7)
7 (in the 7th
inning), Baylor vs. Tulane, 6-21-05 (8-7)
Most Runs Scored in an Extra Inning
8, Georgia Tech vs. Florida St., 6-5-94 (12-4, 10 inn.)
7, Texas vs. Oklahoma St., 6-6-81 (15-8, 13 inn.)


SINGLE-SERIES
RECORDS


97
CWS SERIES RECORDS
BATTING – INDIVIDUAL
Highest Batting Average (minimum 15 at bats)
*.714 (10-14), Jim Morris, Notre Dame, 4 games, 1957
.611 (11-18), John Gall, Stanford, 4 games, 1999
.600 ( 9-15), Robin Ventura, Oklahoma St., 4 games, 1986
.588 (10-17), Jay Pecci, Stanford, 4 games, 1997
.588 (10-17), Danny Matienzo, Miami (Fla.), 4 games, 2001
.571 (12-21) Steve Pearse, South Carolina, 5 games, 2004
.563 ( 9-16), Mark Standiford, Wichita St., 4 games, 1988
.563 ( 9-16), Rick Gutierrez, Oklahoma, 4 games, 1994
.563 ( 9-16), Antone Williamson, Arizona St., 4 games, 1994
.563 ( 9-16), Mark Kotsay, Cal St. Fullerton, 4 games, 1995
.563 ( 9-16), Victor Menocal, Georgia Tech, 3 games, 2002
*Morris still would lead (.667) even adding an 0-for-1 to his totals to make the minimum for at bats.
Most At Bats
35, Jonny Ash, Stanford, 8 games, 2003
33, Sam Fuld, Stanford, 8 games, 2003
32, Art Moossman, Holy Cross, 7 games, 1952
31, Paul Brissett, Holy Cross, 7 games, 1952
31, Frank Matrango, Holy Cross, 7 games, 1952
31, John Boccabella, Santa Clara, 6 games, 1962
31, Jed Lowrie, Stanford, 8 games, 2003
31, Erik Wetzel, Fresno St., 7 games, 2008
30, David Pflepson, Minnesota, 6 games, 1960
30, John Giovanola, Santa Clara, 6 games, 1962
30, Tim Cullen, Santa Clara, 6 games, 1962
30, Danny Putnam, Stanford, 8 games, 2003
30, Darwin Barney, Oregon St., 8 games, 2006
30, Steve Detwiler, Fresno St., 7 games, 2008
30, Gavin Hedstrom, Fresno St., 7 games, 2008
Most Runs
11, John Turco, Holy Cross, 7 games, 1952
11, Chris Powell, Cal St. Fullerton, 6 games, 1992
10, Sal Bando, Arizona St., 6 games, 1965
10, Bill Bates, Texas, 6 games, 1985
10, Steve Daniel, Tennessee, 4 games, 2001
10, Stephen Susdorf, Fresno St. 7 games, 2008
Most Hits
15, Jason Lane, Southern California, 6 games, 1998
14, Joe Caruso, Alabama, 6 games, 1997
14, Jonny Ash, Stanford, 8 games, 2003
13, Pete Van Horne, Arizona, 6 games, 1976
13, Stan Holmes, Arizona St., 6 games, 1981
13, John Fishel, Cal St. Fullerton, 6 games, 1984
Most Consecutive Hits
8, Dave Magadan, Alabama, June 4, 7, 1983
8, Barry Bonds, Arizona St., June 2, 5, 7, 1984
7, Terry Francona, Arizona, June 4, 5, 1980
7, David Cooper, Cal St. Fullerton, June 18, 20, 21, 2006
Most Doubles
4, by 18 players (last time: Steve Susdorf, Fresno St., 7 games, 2008)

98
BATTING – INDIVIDUAL (continued)
Most Triples
3, Buddy Chain, Mississippi, 4 games, 1956
3, Sonny Siebert, Missouri, 6 games, 1958
3, Arthur Ersepke, Southern California, 6 games, 1960
2, by 33 players (last time: Cord Phelps, Stanford, 4 games, 2008)
Most Home Runs
4, Bud Hollowell, Southern California, 6 games, 1963
4, Gary Hymel, LSU, 4 games, 1991
4, J. D. Drew, Florida St., 3 games, 1995
4, Geoff Jenkins, Southern California, 6 games, 1995
4, Jason Lane, Southern California, 6 games, 1998
4, Brad Ticehurst, Southern California, 6 games, 1998
4, Edmond Muth, Stanford, 4 games, 2000
4, Logan Johnson, Louisville, 3 games, 2007
4, Tommy Mendonca, Fresno St., 7 games, 2008
Most Leadoff Home Runs
2, Charlton Jimerson, Miami (Fla.), 4 games, 2001
Most Total Bases
31, Jason Lane, Southern California, 6 games, 1998
26, Geoff Jenkins, Southern California, 6 games, 1995
24, Sal Bando, Arizona St., 6 games, 1965
24, Jonny Ash, Stanford, 8 games, 2003
23, Joe Caruso, Alabama, 6 games, 1997
22, by five players (last time: Steve Detwiler, Fresno St., 7 games, 2008)
Highest Slugging Percentage (minimum 15 at bats)
1.267 (19-15), Kevin Brown, Miami (Fla.), 4 games, 2001
1.250 (20-16), Mark Kotsay, Cal St. Fullerton, 4 games, 1995
1.200 (18-15), Scott Schroeffel, Tennessee, 4 games, 1995
1.176 (20-17), Danny Matienzo, Miami (Fla.), 4 games, 2001
1.125 (18-16), Jeff Larish, Arizona St., 5 games, 2005
Most Runs Batted In
17, Stan Holmes, Arizona St., 6 games, 1981
13, Robb Gorr, Southern California, 6 games, 1998
12, Russ Morman, Wichita St., 5 games, 1982
12, Todd Walker, LSU, 5 games, 1993
11, Bob Horner, Arizona St., 5 games, 1978
11, Martin Peralta, Arizona St., 6 games, 1988
11, Phil Nevin, Cal St. Fullerton, 6 games, 1992
11, Kris Bennett, Tennessee, 4 games, 2001
11, Steve Detwiler, Fresno St., 7 games, 2008
11, Tommy Mendonca, Fresno St., 7 games, 2008
Most Base on Balls (Since 1975)
8, by 10 players (last time: Alan Ahmady, Fresno St., 7 games, 2008)
Most Stolen Bases
8, Calvin James, Miami (Fla.), 6 games, 1985
8, Tommy Hinzo, Arizona, 5 games, 1986
7, Roger Detter, Arizona St., 6 games, 1969
7, Tim Gloyd, Pepperdine, 5 games, 1979
7, Charlton Jimerson, Miami (Fla.), 4 games, 2001

99
BATTING – INDIVIDUAL (continued)
Most Sacrifice Bunts
5, Drew Stubbs, Texas, 5 games, 2005
4, Leland David, Western Mich., 5 games, 1955
4, Ralph Hochgrebe, Missouri, 6 games, 1958
4, Paul Merch, Oklahoma St., 6 games, 1959
4, Ron Stillwell, Southern California, 6 games, 1960
4, Brian Whatley, Long Beach St., 5 games, 1993
4, Greg Hanoian, Southern California, 6 games, 1998
Most Sacrifice Flies
3, Jim Ifland, Oklahoma St., 5 games, 1987
3, Carlos Quentin, Stanford, 8 games, 2003
3, Tim Fedroff, North Carolina, 7 games, 2007
2, by many players (last time: Brent Milleville, Stanford, 4 games, 2008 and Rich Poythress, Georgia, 6
games, 2008)
Most Hit by Pitch
5, Aaron Luna, Rice, 4 games, 2006
4, Kurt Suzuki, Cal St. Fullerton, 4 games, 2003
4, Josh Horton, North Carolina, 7 games, 2007
4, Taylor Holiday, UC Irvine, 4 games, 2007
4, Reid Fronk, North Carolina, 7 games, 2007
3, by 12 players (last time: Gavin Hedstrom and Steve Susdorf, Fresno St., 7 games, 2008)
PITCHING – INDIVIDUAL
Lowest Earned Run Average (minimum 18 innings)
0.50 (1-18), Jerry Thomas, Minnesota, 2 games, 1956
0.50 (1-18), Craig Swan, Arizona St., 2 games, 1972
0.50 (1-18), Jim Crawford, Arizona St., 2 games, 1972
0.76 (2-23 2/3), Kevin Fowler, Oklahoma St., 3 games, 1961
0.78 (2-23), Gary Gentry, Arizona St., 2 games, 1967
0.84 (2-21 1/3), Bill Thom, Southern California, 3 games, 1958
0.84 (2-21 1/3), Jonah Nickerson, Oregon St., 3 games, 2006
0.86 (2-21), Larry Gura, Arizona St., 4 games, 1969
0.87 (2-20 2/3), Steve Arlin, Ohio St., 5 games, 1966
0.89 (2-20 1/3), Joe Ferris, Maine, 3 games, 1964
0.90 (2-20), Lerrin LaGrow, Arizona St., 2 games, 1969
Fewest Earned Runs Allowed (minimum 14 innings)
0, John Stewart, Southern California, 16 1/3 innings, 5 games, 1966
0, Darrell Jackson, Arizona St., 15 1/3 innings, 2 games, 1977
0, Burt Hooton, Texas, 15 innings, 2 games, 1969
0, Russ McQueen, Southern California, 14 innings, 4 games, 1972
0, Jackson Todd, Oklahoma, 14 innings, 2 games, 1972
0, Patrick Ahearne, Pepperdine, 14 innings, 2 games, 1992
Most Wins
3, James O'Neill, Holy Cross, 3 games, 1952
3, Joseph Pollack, Minnesota, 3 games, 1964
3, Russ McQueen, Southern California, 4 games, 1972
3, George Milke, Southern California, 3 games, 1974
3, Bob Chaulk, Arizona, 3 games, 1976
3, Kevin Sheary, Miami (Fla.), 3 games, 1985
3, Greg Brummett, Wichita St., 3 games, 1989
3, John Hudgins, Stanford, 3 games, 2003
3, Alex White, North Carolina, 4 games, 2008
Most Losses
2, by 40 players (last time: Alex White, North Carolina, 2 games, 2007)

100
PITCHING – INDIVIDUAL (continued)
Most Saves
4, Huston Street, Texas, 4 games, 2002
3, Terry Ray, Texas, 3 games, 1975
3, Tony Hudson, Cal St. Fullerton, 4 games, 1979
3, Dan Smith, Miami (Fla.), 5 games, 1982
3, Jim Newlin, Wichita St., 5 games, 1989
3, Michael Neu, Miami (Fla.), 4 games, 1999
3, Jeff Bruksch, Stanford, 4 games, 2001
3, Kevin Gunderson, Oregon St., 5 games, 2006
3, Andrew Carignan, North Carolina, 5 games, 2007
Most Appearances
6, Rob Wooten, North Carolina, 2007
5, Jessie Smith, Texas, 1953
5, Bob Garibaldi, Santa Clara, 1962
5, Steve Arlin, Ohio St., 1966
5, Dan Smith, Miami (Fla.), 1982
5, Rick Raether, Miami (Fla.), 1985
5, Rick Raether, Miami (Fla.), 1986
5, Richie Lewis, Florida St., 1986
5, Jim Newlin, Wichita St., 1989
5, Jack Krawczyk, Southern California, 1995
5, J. Brent Cox, Texas, 2004
5, J. Brent Cox, Texas, 2005
5, Kevin Gunderson, Oregon St., 2006
5, Joe Patterson, Oregon St., 2007
5, Andrew Carignan, North Carolina, 2007
5, Joshua Fields, Georgia, 2008
5, Alex McRee, Georgia, 2008
5, Brian Moran, North Carolina, 2008
5, Rob Wooten, North Carolina, 2008
Most Games Started
3, by many players (last time: Justin Wilson, Fresno St., 3 games, 2008)
Most Complete Games
3, James O'Neill, Holy Cross, 3 games 1952
3, Joseph Pollack, Minnesota, 3 games, 1964
3, Greg Swindell, Texas, 3 games, 1985
2, by many players (last time: Jason Windsor, Cal St. Fullerton, 3 games, 2004)
Most Games Finished
5, Jessie Smith, Texas, 5 games, 1953
5, Dan Smith, Miami (Fla.), 5 games, 1982
5, Rick Raether, Miami (Fla.), 5 games, 1985
5, Jim Newlin, Wichita St., 5 games, 1989
5, J. Brent Cox, Texas, 5 games, 2005
5, Kevin Gunderson, Oregon St., 5 games, 2006
5, Joshua Fields, Georgia, 5 games, 2008
Most Innings Pitched
27 2/3, Bob Garibaldi, Santa Clara, 5 games, 1962
27, Jim O'Neill, Holy Cross, 3 games, 1952
27, Joseph Pollack, Minnesota, 3 games, 1964
26 1/3, Steve Arlin, Ohio St., 4 games, 1965
26, Walter Peterson, Southern California, 3 games, 1963
26, Greg Swindell, Texas, 3 games, 1985

101
PITCHING – INDIVIDUAL (continued)
Fewest Hits Allowed (minimum 10 innings)
0, Jim Wixson, Oklahoma St., 11 innings, 4 games, 1960
3, James Bobel, Michigan, 11 innings, 2 games, 1962
3, Dan Ricabal, Cal St. Fullerton, 11 innings, 3 games, 1994
3, J. Brent Cox, Texas, 10.1 innings, 5 games, 2005
4, by 10 players (most innings: Burt Hooton, Texas, 15 innings, 2 games, 1969)
Fewest Hits Allowed (minimum 20 innings)
5, Steve Arlin, Ohio St., 20 2/3 innings, 5 games, 1966
7, Kevin Dukes, Arizona St., 22 innings, 4 games, 1981
11, Steve Arlin, Ohio St., 26 1/3 innings, 4 games, 1965
11, Lerrin LaGrow, Arizona St., 20 innings, 2 games, 1969
11, Dave Fleming, Georgia, 21 innings, 3 games, 1990
11, Jason Windsor, Cal St. Fullerton, 21 innings, 3 games, 2004
Most Hits Allowed
25, Walter Peterson, Southern California, 3 games, 1963
25, Stan Jakubowski, Miami (Fla.), 3 games, 1974
24, Joseph Pollack, Minnesota, 5 games, 1964
24, Dewey Robinson, Southern Ill., 5 games, 1977
24, Pat Hope, Oklahoma St., 3 games, 1987
Most Runs Allowed
20, Rob Souza, Miami (Fla.), 2 games, 1984
16, Ben McDonald, LSU, 3 games, 1989
15, Jeff Ballard, Stanford, 2 games, 1985
14, by five players (last time: Kris Benson, Clemson, 2 games, 1996)
Most Earned Runs Allowed
15, Ben McDonald, LSU, 3 games, 1989
14, Jeff Ballard, Stanford, 2 games, 1985
14, Darren Dilkes, Oklahoma St., 3 games, 1981
13, Cecil Burford, Mississippi, 2 games, 1956
13, Kris Benson, Clemson, 2 games, 1996
Fewest Walks Allowed (minimum 15 innings)
0, Roger Clemens, Texas, 17 2/3 innings, 2 games, 1983
0, Gilbert Heredia, Arizona, 16 innings, 2 games, 1986
1, Chuck Hartenstein, Texas, 19 innings, 2 games, 1962
1, Steve Rogers, Tulsa, 16 1/3 innings, 2 games, 1971
1, Craig Swan, Arizona St., 18 innings, 2 games, 1972
Most Walks Allowed
20, Rod Keogh, Washington St., 2 games, 1950
17, Keith Weber, Missouri, 3 games, 1964
15, James Waldrip, Oklahoma, 1 game, 1951
15, Walter Peterson, Southern California, 3 games, 1963
15, Jerry Don Gleaton, Texas, 2 games, 1979
15, Kevin Dukes, Arizona St., 4 games, 1981
Most Strikeouts
38, Bob Garibaldi, Santa Clara, 5 games, 1962
31, Gary Gentry, Arizona St., 2 games, 1967
29, Steve Arlin, Ohio St., 4 games, 1965
29, Dave Winfield, Minnesota, 2 games, 1973
29, Greg Swindell, Texas, 3 games, 1985
29, Jason Windsor, Cal St. Fullerton, 3 games, 2004

102
PITCHING – INDIVIDUAL (continued)
Most Wild Pitches
6, Bob Garibaldi, Santa Clara, 5 games, 1962
4, Don Reifler, Texas, 2 games, 1953
4, Linty Ingram, Arizona St., 4 games, 1988
4, Patrick Coogan, LSU, 3 games, 1997
3, by 23 players (last time: Koley Kolberg, Arizona, 2 games, 2004)
Most Hit Batters
6, Matt Manship, Stanford, 3 games, 2003
6, Ryan Berry, Rice, 2 games, 2007
5, Chad Hutchinson, Stanford, 2 games, 1997
5, Aaron Kramer, Arizona St., 4 games, 1998
5, Jason Young, Stanford, 2 games, 1999
4, Roy Peterson, Oklahoma St., 2 games, 1959
4, Bryan Harris, Cal St. Fullerton, 2 games, 2007
Most Balks
2, Frank Carbajal, Northern Colo., 1 game, 1959
2, Rick Keeton, Southern Ill., 2 games, 1977
2, Curt Krippner, Texas, 3 games, 1987
2, Trey Hodges, LSU, 3 games, 2000
2, Jon Smith, Cal St. Fullerton, 2 games, 2001
2, Beau Richardson, Tulane, 1 game, 2001
2, J.P. Howell, Texas, 2 games, 2003
2, Cole St. Clair, Rice, 2 games, 2007
2, Jeff Kaplan, Cal St. Fullerton, 2 games, 2007
FIELDING – INDIVIDUAL
Most Putouts
87, Bill Rowe, 1b, Oregon St., 8 games, 2006
79, Tim Wallach, 1b, Cal St. Fullerton, 6 games, 1979
71, Matt LaPorta, 1b, Florida, 6 games, 2005
70, Steve Willis, 1b, Arizona St., 6 games, 1988
67, Brian Hall, 1b, Stanford, 8 games, 2003
Most Assists
36, Chris Kunda, 2b, Oregon St., 8 games, 2006
32, Cal Meier, ss, Southern California, 5 games, 1970
32, P. J. Forbes, 2b, Wichita St., 6 games, 1989
31, Spike Owen, ss, Texas, 5 games, 1981
31, Jed Lowrie, 2b, Stanford, 8 games, 2003
Most Chances Without an Error
95, Bill Rowe, 1b, Oregon St., 8 games, 2006
74, Steve Willis, 1b, Arizona St., 6 games, 1988
72, Matt LaPorta, 1b, Florida, 6 games, 2005
69, Dustin Ackley, 1b, North Carolina, 7 games, 2007
68, Wes Clements, 1b, Arizona, 6 games, 1980
Most Errors
8, Gary LeFevers, ss, Arizona, 4 games, 1960
6, Carmen Troiso, ss, Penn St., 4 games, 1952
6, Craig Sorensen, 3b, Arizona, 6 games, 1956
6, Phil Honeycutt, ss, Tulsa, 5 games, 1971
6, Hubie Brooks, ss, Arizona St., 5 games, 1978

103
BATTING – TEAM
Highest Batting Average (Min. 4 games)
.394 (63-160), Tennessee, 4 games, 2001
.378 (88-233), Southern California, 6 games, 1998
.377 (57-151), Miami (Fla.), 4 games, 1996
.373 (53-142), Miami (Fla.), 4 games, 2001
.372 (54-145), Cal St. Fullerton, 4 games, 1995
Most At Bats
273, Stanford, 8 games, 2003
250, Holy Cross, 7 games, 1952
249, Oregon St., 8 games, 2006
249, Fresno St., 7 games, 2008
243, Santa Clara, 6 games, 1962
Most Runs
62, Southern California, 6 games, 1998
62, Fresno St., 7 games, 2008
54, Arizona St., 6 games, 1981
54, Southern California, 6 games, 1995
52, Holy Cross, 7 games, 1952
Most Runs Per Game (Min. 4 games)
12.3, Miami, 49 runs in 4 games, 2001
12.0, LSU, 48 in 4, 1991
12.0, Arizona St., 48 in 4, 1998
12.0, Tennessee, 48 in 4, 2001
11.0, Notre Dame, 44 in 4, 1957
11.0, Miami (Fla.), 44 in 4, 1996
Most Hits
88, Southern California, 6 games, 1998
77, Arizona St., 6 games, 1977
77, Fresno St., 7 games, 2008
76, Stanford, 8 games, 2003
75, Arizona St., 6 games, 1981
Most Doubles
18, Oklahoma St., 5 games, 1981
18, South Carolina, 6 games, 2002
15, Southern California, 6 games, 1974
15, Texas, 6 games, 1985
15, Southern California, 6 games, 1995
15, Stanford, 8 games, 2003
Most Triples
7, Holy Cross, 7 games, 1952
7, Missouri, 6 games, 1954
6, Arizona, 6 games, 1956
6, Minnesota, 6 games, 1956
6, Southern California, 6 games, 1960
6, Western Mich., 3 games, 1961
6, Ohio St., 6 games, 1966
Most Home Runs
17, LSU, 4 games, 1998
17, Southern California, 6 games, 1998
14, Southern California, 6 games, 1995
14, Fresno St., 7 games, 2008
13, Florida St., 6 games, 1999

104
BATTING – TEAM (continued)
Most Grand Slam Home Runs
2, Cal St. Fullerton, 4 games, 1995
2, Southern California, 6 games, 1998
2, Stanford, 4 games, 2000
Most Total Bases
152, Southern California, 6 games, 1998
136, Fresno St., 7 games, 2008
131, Southern California, 6 games, 1995
126, Stanford, 8 games, 2003
124, Florida St., 6 games, 1999
Highest Slugging Percentage (Min. 4 games)
.683 ( 99-145), LSU, 4 games, 1998
.652 (152-233), Southern California, 6 games, 1998
.648 ( 94-145), Cal St. Fullerton, 4 games, 1995
.641 (91-142), Miami (Fla.), 4 games, 2001
.637 (102-160), Tennessee, 4 games, 2001
Most Runs Batted In
61, Southern California, 6 games, 1998
61, Fresno St., 7 games, 2008
50, Southern California, 6 games, 1995
49, Arizona St., 6 games, 1981
46, Miami (Fla.), 4 games, 2001
Most Walks
55, Southern California, 6 games, 1960
46, Texas, 6 games, 1950
46, Florida St., 6 games, 1999
45, Minnesota, 6 games, 1960
43, by three team (last time: Cal St. Fullerton, 6 games, 1992)
Fewest Strikeouts (Min. 4 games) 12, Texas, 4 games, 1992
13, Arizona St., 5 games, 1978
15, Arkansas, 5 games, 1979
15, Hawaii, 5 games, 1980
15, Cal St. Fullerton, 4 games, 1995
15, Tennessee, 4 games, 1995
Most Strikeouts
57, Southern California, 5 games, 1970
54, Santa Clara, 6 games, 1962
53, Arizona, 5 games, 1959
52, Oklahoma St., 5 games, 1961
52, Maine, 5 games, 1964
Most Stolen Bases
17, Oklahoma St., 5 games, 1955
14, Miami (Fla.), 6 games, 1985
13, Pepperdine, 6 games, 1979
13, Arizona, 5 games, 1986
13, Miami (Fla.), 4 games, 2001

105
BATTING – TEAM (continued)
Most Sacrifice Bunts
12, Santa Clara, 6 games, 1962
11, Oregon St., 8 games, 2006
10, Ohio St., 6 games, 1966
10, Cal St. Fullerton, 6 games, 1984
10, Texas, 5 games, 2005
Most Sacrifice Flies
6, Oregon St., 8 games, 2006
5, Arizona St., 6 games, 1965
5, Cal St. Fullerton, 6 games, 1979
4, by 20 teams (last time: Stanford, 8 games, 2003)
Most Hit Batters
12, UC Irvine, 4 games, 2007
12, North Carolina, 7 games, 2007
11, Cal St. Fullerton, 4 games, 2003
9, Oregon St., 8 games, 2006
9, Fresno St., 7 games, 2008
PITCHING – TEAM
Lowest Earned Run Average (Min. 4 games)
0.60, California, 5 games, 1957 (3-45)
0.67, Missouri, 6 games, 1964 (4-54)
0.68, Arizona St., 6 games, 1972 (4-53)
0.92, Florida St., 6 games, 1970 (6-59)
1.00, Pepperdine, 4 games, 1992 (4-36)
Most Innings Pitched
71 2/3, Stanford, 8 games, 2003
71, Oregon St., 8 games, 2006
63, Santa Clara, 6 games, 1962
62, Holy Cross, 7 games, 1952
62, North Carolina, 7 games, 2007
Most Shutouts
3, Wake Forest, 6 games, 1955
3, California, 5 games, 1957
3, Florida St., 6 games, 1970
3, Arizona St., 6 games, 1972
2, by seven teams (last time: Oregon St., 8 games, 2006)
Most Consecutive Scoreless Innings
31, Arizona St., 1972
Most Consecutive Scoreless Innings at Start of CWS
24 1/3, Pepperdine, 1992
22, Florida St., 1970
Most Complete Games
7, Holy Cross, 7 games, 1952
5, by eight teams (last time: South Carolina, 5 games, 1977)

106
PITCHING – TEAM (continued)
Most Saves
4, Texas, 4 games, 2002
3, Southern California, 5 games, 1961
3, Texas, 5 games, 1975
3, Cal St. Fullerton, 6 games, 1979
3, Miami (Fla.), 5 games, 1982
3, Cal St. Fullerton, 6 games, 1984
3, Wichita St., 6 games, 1989
3, Cal St. Fullerton, 6 games, 1992
3, LSU, 4 games, 1996
3, Miami (Fla.), 4 games, 1999
3, Stanford, 4 games, 2001
3, Oregon St., 8 games, 2006
3, North Carolina, 7 games, 2007
Fewest Hits Allowed (Min. 4 games)
16, Oklahoma St., 4 games, 1960
18, Arizona, 4 games, 1955
20, Pepperdine, 4 games, 1992
21, Texas, 4 games, 1969
21, Oklahoma St., 4 games, 1990
Most Hits Allowed
75, South Carolina, 6 games, 2002
73, Southern California, 6 games, 1995
71, Fresno St., 7 games, 2008
70, Texas, 5 games, 1981
69, Stanford, 8 games, 2003
Fewest Runs Allowed (Min. 4 games)
3, California, 5 games, 1957
5, Oklahoma St., 4 games, 1960
5, Arizona St., 6 games, 1972
6, Pepperdine, 4 games, 1992
8, Texas, 4 games, 1969
8, Georgia, 5 games, 1990
8, Texas, 5 games, 2005
Most Runs Allowed
58, Oklahoma St., 5 games, 1984
49, Southern California, 6 games, 1995
47, Tennessee, 4 games, 2001
46, Georgia, 6 games, 2008
45, North Carolina, 7 games, 2007
Most Earned Runs Allowed
47, Oklahoma St., 5 games, 1984
45, Tennessee, 4 games, 2001
45, Georgia, 6 games, 2008
39, Southern California, 6 games, 1998
39, South Carolina, 6 games, 2002
39, North Carolina, 7 games, 2007
Fewest Walks Allowed (Min. 4 games)
3, Cal St. Fullerton, 4 games, 2001
7, Oklahoma, 4 games, 1975
8, Missouri, 4 games, 1963
8, Texas, 5 games, 1983
8, Cal St. Fullerton, 4 games, 1995

107
PITCHING – TEAM (continued)
Most Walks Allowed
41, Oklahoma St., 5 games, 1984
39, Oklahoma St., 5 games, 1981
38, Southern California, 6 games, 1960
38, Missouri, 6 games, 1964
38, Arizona St., 6 games, 1981
38, Stanford, 8 games, 2003
Most Strikeouts 77, Arizona St., 6 games, 1967
65, Texas, 6 games, 1950
65, Southern California, 5 games, 1961
63, Arizona, 6 games, 1956
61, Arizona St., 6 games, 1972
Most Wild Pitches
10, Santa Clara, 6 games, 1962
8, Texas, 6 games, 1953
7, LSU, 4 games, 1997
7, Long Beach St., 2 games, 1998
7, Tennessee, 4 games, 2001
7, Georgia, 6 games, 2008
Most Hit Batters
13, Stanford, 8 games, 2003
12, North Carolina, 7 games, 2007
9, Stanford, 4 games, 1997
7, Arizona St., 4 games, 1998
7, Florida St., 6 games, 1999
7, Tennessee, 4 games, 2001
7, Clemson, 4 games, 2002
Most Balks
3, LSU, 4 games, 2000
3, Cal St. Fullerton, 7 games, 2007
2, Northern Colo., 2 games, 1959
2, Southern Ill., 5 games, 1977
2, Southern California, 6 games, 1963
2, Texas, 5 games, 1987
2, Cal St. Fullerton, 4 games, 2001
2, Southern California, 3 games, 2001
2, Tulane, 3 games, 2001
2, Texas, 4 games, 2003
2, Miami (Fla.), 3 games, 2003
2, Cal St. Fullerton, 4 games, 2006
FIELDING – TEAM
Highest Fielding Percentage (Min. 4 games)
.993, LSU, 4 games, 1991 (108-39-1)
.993, Stanford, 4 games, 2008 (105-29-1)
.989, Texas, 5 games, 2005 (135-49-2)
.989, Arizona St., 5 games, 2005 (135-49-2)
.989, Washington St., 5 games, 1950 (126-55-2)
.9882, Cal St. Fullerton, 4 games, 1994 (114-53-2)
.9878, Arizona St., 6 games, 1988 (162-81-3)

108
FIELDING – TEAM (continued)
Most Assists
88, Cal St. Fullerton, 6 games, 1979
88, Wichita St., 6 games, 1989
86, Arizona, 6 games, 1980
84, North Carolina, 7 games, 2007
82, Southern California, 6 games, 1960
Most Errors
18, Tulsa, 5 games, 1971
17, Texas, 6 games, 1953
16, Arizona, 6 games, 1956
16, California, 5 games, 1980
15, by six teams (last time: Texas, 6 games, 1985)
Most Double Plays
12, Stanford, 6 games, 1987
11, Wichita St., 4 games, 1991
11, North Carolina, 7 games, 2007
11, Fresno St., 7 games, 2008
10, Minnesota, 6 games, 1960
10, Michigan, 6 games, 1962
10, Eastern Mich., 5 games, 1976
10, Arizona St., 4 games, 1983
10, Alabama, 6 games, 1997
10, Florida St., 6 games, 1999
Most Triple Plays
1, Southern California, 3 games, 1948
1, Rutgers, 5 games, 1950
1, St. John's (N.Y.), 3 games, 1980
* * * * *
In 1961, Western Michigan was 1-2 in the College World Series and had no doubles in its three games.
However, they did manage to slug out six triples.
* * * * *
In 1964, while the Yankees had their M&M Boys, Southern California’s baseball team saw plenty of
M&M’s at the CWS while going 2-2. Their opponents that year were Mississippi, Missouri, Minnesota and
Maine.
* * * * *
The first team to play seven games in one series was the 1952 national champion Holy Cross team. The
Crusaders used only 11 different players the entire series: eight position players, and three pitchers who
combined for seven complete games.
* * * * *
Oregon State, in 2006, was the first team to lose two games at the College World Series and still win the
National Championship. The Beavers lost their opening game to Miami (Fla.) and advanced through the
losers’ bracket to advance to the championship series. Oregon State lost game one of the Championship
Series against North Carolina before winning the next two to claim the school’s first national title.
* * * * *
In 2007, Oregon State became the first team since LSU in 1996 and 1997 to win back-to-back national
titles. The Beavers were also the first team, since the bracket expanded to 64 teams in 1999, to win the
national championship despite being a number three seed in the regional.

CAREER
RECORDS


111
CWS CAREER RECORDS
BATTING
Highest Batting Average (minimum 30 at bats)
*.517 (15-29), Mark Kotsay, Cal St. Fullerton, 1994-95
*.517 (15-29), Jason Lane, Southern California, 1998
.500 (17-34), Rudy Gomez, Miami (Fla.), 1995-96
.471 (16-34), Curtis Thigpen, Texas, 2003-04
.459 (17-37), Robin Ventura, Oklahoma St., 1986-87
.440 (22-50), John Gall, Stanford, 1997-99-00
.438 (14-32), Mike Day, Oklahoma St., 1982-83-84-85
.438 (14-32), Barry Bonds, Arizona St., 1983-84
.433 (13-30), Greg Ellena, Miami (Fla.), 1985-86
.424 (14-33), John Fishel, Cal St. Fullerton, 1982-84
*Kotsay and Lane still would be tied for the lead (.500) even adding 0-for-1 to their totals to make the minimum for
at bats.
Most Games Played
20, Daryl Arenstein, Southern California, 1970-71-72-73
18, Tim Federowicz, North Carolina, 2006-07-08
18, Chad Flack, North Carolina, 2006-07-08
18, Garrett Gore, North Carolina, 2006-07-08
18, Seth Williams, North Carolina, 2006-07-08
17, Paul Carey, Stanford, 1987-88-90
Most At Bats 73, Chad Flack, North Carolina, 2006-07-08
68, Daryl Arenstein, Southern California, 1970-71-72-73
68, Tim Federowicz, North Carolina, 2006-07-08
67, Sam Fuld, Stanford, 2001-02-03
66, Seth Williams, North Carolina, 2006-07-08
Most Runs
21, Bill Bates, Texas, 1983-84-85
18, Paul Carey, Stanford, 1987-88-90
17, Sam Fuld, Stanford, 2001-02-03
15, Wes Rachels, Southern California, 1995-98
15, Eddy Furniss, LSU, 1996-97-98
15, Edmund Muth, Stanford, 1997-99-00
15, Ryan Garko, Stanford, 2001-02-03
Most Hits
24, Sam Fuld, Stanford, 2001-02-03
22, Chad Flack, North Carolina, 2006-07-08
23, Keith Moreland, Texas, 1973-74-75
22, John Gall, Stanford, 1997-99-00
21, Ryan Garko, Stanford, 2001-02-03
Most Doubles
7, Robin Ventura, Oklahoma St., 1986-87
7, Khalil Greene, Clemson, 2000-02
7, Ryan Garko, Stanford, 2001-02-03
6, Mike Fiore, Miami (Fla.), 1985-86-88
6, Landan Powell, South Carolina, 2002-04
6, Reid Fronk, North Carolina, 2006-07

112
BATTING (continued)
Most Triples 3, Buddy Chain, Mississippi, 1956
3, Sonny Siebert, Missouri, 1958
3, Arthur Ersepke, Southern California, 1960-61
3, Raymond Shoup, Ohio St., 1965-66-67
3, Spike Owen, Texas, 1981-82
Most Home Runs 6, Edmund Muth, Stanford, 1997-99-00
5, J. D. Drew, Florida St., 1995-96
5, Ryan Barthelemy, Florida St., 1999-00
5, Marshall McDougall, Florida St., 1999-00
5, Kevin Brown, Miami (Fla.), 1999-01
Most Grand Slam Home Runs
2, Mark Kotsay, Cal St. Fullerton, 1994-95
Most Total Bases
43, Sam Fuld, Stanford, 2001-02-03
37, Marshall McDougall, Florida St., 1999-00
36, Edmund Muth, Stanford, 1997-99-00
35, Bill Bates, Texas, 1983-84-85
34, Ryan Garko, Stanford, 2001-02-03
Highest Slugging Percentage (minimum 30 at bats)
*1.103 (32-29), Mark Kotsay, Cal St. Fullerton, 1994-95
.881 (37-42), Marshall McDougall, Florida St., 1999-00
.825 (33-40), Ryan Barthelemy, Florida St., 1999-00
.781 (25-32), Barry Bonds, Arizona St., 1983-84
.767 (23-30), Greg Ellena, Miami (Fla.), 1985-86
.764 (26-34), Sam Fuld, Stanford, 2001-02
.762 (32-42), Pete Incaviglia, Oklahoma St., 1983-84-85
.735 (25-34), David Maroul, Texas, 2004-05
.730 (27-37), Sal Bando, Arizona St., 1964-65
.710 (22-31), Wes Clements, Arizona, 1979-80
*Kotsay still would lead (1.067) even adding an 0-for-1 to his totals to make the minimum for at bats.
Most Runs Batted In
20, Bob Horner, Arizona St., 1976-77-78
18, Keith Moreland, Texas, 1973-74-75
18, Mark Kotsay, Cal St. Fullerton, 1994-95
17, Stan Holmes, Arizona St., 1981
17, Kevin Brown, Miami (Fla.), 1999-01
Most Stolen Bases
11, Doug Dascenzo, Oklahoma St., 1984-85
9, Calvin James, Miami (Fla.), 1981-82-84-85
8, Tommy Hinzo, Arizona, 1985-86
7, Roger Detter, Arizona St., 1967-69
7, Tim Gloyd, Pepperdine, 1979
7, Charlton Jimerson, Miami (Fla.), 2001
Most Sacrifice Bunts
7, Paul Merch, Oklahoma St., 1959-60-61
5, Mark Kotsay, Cal St. Fullerton, 1994-95
5, Drew Stubbs, Texas, 2004-05
4, by seven players (last time: David Maroul, Texas, 2004-05)

113
BATTING (continued)
Most Sacrifice Flies
4, Carlos Quentin, Stanford, 2001-02-03
3, Tracy Dophied, Texas, 1981-82
3, Jim Ifland, Oklahoma St., 1986-87
3, Chris O’Riordan, Stanford, 2000-01-02
3, Tim Fedroff, North Carolina, 2007
2, by many players
Most Hit By Pitches
8, Ryan Garko, Stanford, 2001-02-03
6, Aaron Luna, Rice, 2006-07
5, Carlos Quentin, Stanford, 2001-02-03
5, Kurt Suzuki, Cal St. Fullerton, 2003-04
4, Blair Barbier, LSU, 1997-98-00
4, Chris O’Riordan, Stanford, 2001-01-02
4, Reid Fronk, North Carolina, 2006-07
4, Taylor Holiday, UC Irvine, 2007
4, Josh Horton, North Carolina, 2006-07
PITCHING - INDIVIDUAL
Lowest Earned Run Average (minimum 20 innings)
0.00 (0-24 1/3), Keith Weber, Missouri, 1963-64
0.00 (0-21), Jim Crawford, Arizona St., 1969-72
0.38 (1-24), Ed Bane, Arizona St., 1972-73
0.39 (1-23), Russ McQueen, Southern California, 1972-73
0.44 (1-20 2/3), Jim Ehrler, Texas, 1949-50
0.63 (2-28 2/3), Larry Gura, Arizona St., 1967-69
0.73 (2-24 2/3), Craig Lefferts, Arizona, 1979-80
0.96 (5-47), Steve Arlin, Ohio St., 1965-66
1.03 (3-26 1/3), Larry Hardy, Texas, 1968-69-70
1.09 (3-24 2/3), Craig Swan, Arizona St., 1969-72
1.24 (4-29), Burt Hooton, Texas, 1969-70
Lowest Earned Run Average (minimum 30 innings)
0.96 (5-47), Steve Arlin, Ohio St., 1965-66
1.26 (5-35 2/3), Chuck Hartenstein, Texas, 1962-63
1.37 (7-46), Carl Thomas, Arizona, 1954-55-56
1.50 (5-30), Mark Sogge, Southern California, 1971-72
1.67 (6-32 1/3), Jim Barr, Southern California, 1973-74
1.67 (6-32 1/3), Jason Windsor, Cal St. Fullerton, 2003-04
1.73 (7-36 1/3), Bruce Gardner, Southern California, 1958-60
1.78 (6-30 1/3), Jim Wixson, Oklahoma St., 1960-61
1.82 (7-32 2/3), Jim Withers, Southern California, 1960-61
1.91 (8-37 2/3), Jim Ward, Arizona, 1958-59-60
2.04 (8-35 1/3), Bob Shirley, Oklahoma, 1973-74-75
Most Wins
4, Bruce Gardner, Southern California, 1958-60
4, Steve Arlin, Ohio St., 1965-66
4, Burt Hooton, Texas, 1969-70
4, Steve Rogers, Tulsa, 1969-71
4, Russ McQueen, Southern California, 1972-73
4, Mark Barr, Southern California, 1973-74
4, Greg Swindell, Texas, 1984-85
4, Kevin Sheary, Miami (Fla.), 1984-85
4, Greg Brummett, Wichita St., 1988-89
4, John Hudgins, Stanford, 2001-02-03

114
PITCHING – INDIVIDUAL (continued)
Most Years With Wins
3, Carl Thomas, Arizona, 1954-55-56
3, Greg Widman, Southern California, 1970-71-72
3, Allan Westfall, Miami (Fla.), 1994-95-96
Most Losses 4, Ben McDonald, LSU, 1987-89
3, Don Lee, Arizona, 1954-55-56
3, James Street, Texas, 1968-69-70
3, Bob Shirley, Oklahoma, 1973-74-75
3, Neal Heaton, Miami (Fla.), 1979-80-81
3, Bill Swift, Maine, 1981-82-83-84
3, Dan Davies, Miami (Fla.), 1984-85-86
3, Blair Varnes, Florida St., 1999-00
Most Saves
5, Huston Street, Texas, 2002-04
5, Andrew Carignan, North Carolina, 2006-07
4, Jim Newlin, Wichita St., 1988-89
4, Jack Krawczyk, Southern California, 1995-98
4, Jeff Bruksch, Stanford, 2000-01
3, Terry Ray, Texas, 1975
3, Tony Hudson, Cal St. Fullerton, 1979
3, Dan Smith, Miami (Fla.), 1982
3, Rick Raether, Miami (Fla.), 1985-86
3, Steve Chitren, Stanford, 1987-88
3, Michael Neu, Miami (Fla.), 1999
3, Kevin Gunderson, Oregon St., 2005-06
Most Appearances
13, J. Brent Cox, Texas, 2003-04-05
11, Rob Wooten, North Carolina 2007-08
10, Huston Street, Texas, 2002-03-04
10, Rick Raether, Miami (Fla.), 1985-86
9, Steve Arlin, Ohio St., 1965-66
9, Jack Krawczyk, Southern California, 1995-98
9, Joe Paterson, Oregon St., 2006-07
Most Games Started
7, J.D. Arteaga, Miami (Fla.), 1994-95-96-97
6, Kendall Carter, Arizona St., 1981-83-84
6, Greg Swindell, Texas, 1984-85
5, by seven players (last time: Greg Brummett, Wichita St., 1988-89)
Most Complete Games
4, Don Lee, Arizona, 1954-55-56
4, Carl Thomas, Arizona, 1954-55-56
4, Steve Arlin, Ohio St., 1965-66
4, Greg Swindell, Texas, 1984-85
3, by 13 players (last time: Lee Plemel, Stanford, 1985-87-88)
Most Games Finished
9, Rick Raether, Miami (Fla.), 1985-86
9, Huston Street, Texas, 2002-04
7, Jack Krawczyk, Southern California, 1995-98
6, Steve Chitren, Stanford, 1987-88
6, Jim Newlin, Wichita St., 1988-89
6, Jamie Bluma, Wichita St., 1991-92-93
6, Kevin Gunderson, Oregon St., 2005-06

115
PITCHING – INDIVIDUAL (continued)
Most Innings Pitched
47, Steve Arlin, Ohio St., 1965-66
47, Greg Swindell, Texas, 1984-85
46 1/3, Don Lee, Arizona, 1954-55-56
46, Carl Thomas, Arizona, 1954-55-56
46, J.D. Arteaga, Miami (Fla.), 1994-95-96-97
Fewest Hits Allowed (minimum 20 innings)
7, Kevin Dukes, Arizona St., 22 innings, 1981
7, Jim Ehrler, Texas, 20 2/3 innings, 1949-50
11, Lerrin LaGrow, Arizona St., 20 innings, 1969
12, Larry Fisher, Southern California, 22 1/3 innings, 1963-64
13, by five players (most innings: Larry Hardy, Texas, 26 1/3 innings, 1968-69-70)
Fewest Hits Allowed (minimum 30 innings)
16, Steve Arlin, Ohio St., 47 innings, 1965-66
16, Jim Wixson, Oklahoma St., 30 1/3 innings, 1960-61
19, Murray Wall, Texas, 32 1/3 innings, 1949-50
21, Jim Withers, Southern California, 34 2/3 innings, 1960-61
21, Rick Wortham, Texas, 33 innings, 1973-74-75
Most Hits Allowed
51, J.D. Arteaga, Miami (Fla.), 1994-95-96-97
41, Greg Brummett, Wichita St., 1988-89
38, Lee Plemel, Stanford, 1985-87-88
37, Bill Swift, Maine, 1981-82-83-84
37, Greg Swindell, Texas, 1984-85
Most Runs Allowed
29, Bill Swift, Maine, 1981-82-83-84
28, Kendall Carter, Arizona St., 1981-83-84
28, J.D. Arteaga, Miami (Fla.), 1994-95-96-97
23, Rob Souza, Miami (Fla.), 1982-84
21, Gayl Bernhardt, Northern Colo., 1957-58
21, Dennis Livingston, Oklahoma St., 1982-83-84
21, Aaron Rawl, South Carolina, 2002-03
Most Earned Runs Allowed
22, Bill Swift, Maine, 1981-82-83-84
19, Dennis Livingston, Oklahoma St., 1982-83-84
19, Ben McDonald, LSU, 1987-89
19, Aaron Rawl, South Carolina, 2002-03
18, Gayl Bernhardt, Northern Colo., 1957-58
18, Kendall Carter, Arizona St., 1981-83-84
Most Strikeouts
64, Carl Thomas, Arizona, 1954-55-56
57, Steve Arlin, Ohio St., 1965-66
48, Richie Lewis, Florida St., 1986-87
46, Don Lee, Arizona, 1954-55-56
45, Greg Swindell, Texas, 1984-85
Fewest Walks (minimum 20 innings)
1, Wes Roemer, Cal St. Fullerton, 21 1/3 innings, 2006-07
3, Burt Hooton, Texas, 29 innings, 1969-70
3, Craig Swan, Arizona St., 24 2/3 innings, 1969-72
3, Russ McQueen, Southern California, 23 innings, 1972-73
3, Bill Thom, Southern California, 22 1/3 innings, 1958
3, Bob Chalk, Arizona, 20 1/3 innings, 1976

116
PITCHING – INDIVIDUAL (continued)
Fewest Walks (minimum 30 innings)
5, Murray Wall, Texas, 32 1/3 innings, 1949-50
5, Mark Barr, Southern California, 32 1/3 innings, 1973-74
6, Chuck Hartenstein, Texas, 35 2/3 innings, 1962-63
6, Steve Rogers, Tulsa, 32 1/3 innings, 1969-71
8, Lee Plemel, Stanford, 30 2/3 innings, 1985-86-88
Most Walks
27, Dennis Livingston, Oklahoma St., 1982-83-84
25, Walter Peterson, Southern California, 1963-64
22, Don Lee, Arizona, 1954-55-56
22, Rick Wortham, Texas, 1973-74-75
21, Steve Arlin, Ohio St., 1965-66
21, Gary Kanwisher, Oklahoma St., 1982-83-84
Most Wild Pitches
6, Bob Garibaldi, Santa Clara, 1962
5, Rick Wortham, Texas, 1973-74-75
5, Linty Ingram, Arizona St., 1987-88
4, by eight players (last time: Patrick Coogan, LSU, 1996-97)
Most Hit Batters
7, Jason Young, Stanford, 1999-00
5, Chad Hutchinson, Stanford, 1997
5, Aaron Kramer, Arizona St., 1998
5, Jon McDonald, Florida St., 1998-99-00
4, Roy Peterson, Oklahoma St., 1962
4, John Hudgins, Stanford, 2001-02-03
4, Philip Humber, Rice, 2002-03
4, Mike Stutes, Oregon St., 2006-07
Most Balks
3, Frank Carbajal, Northern Colo., 1959-60
3, Cole St. Clair, Rice, 2006-07-08
2, Rick Keeton, Southern Ill., 1977
2, Curt Krippner, Texas, 1987
2, Trey Hodges, LSU, 2000
2, Jon Smith, Cal St. Fullerton, 2001
2, Beau Richardson, Tulane, 2001
2, J.P. Powell, Texas, 2003
2, Brandon Camardese, Miami (Fla.), 2003-04
2, Jeff Kaplan, Cal St. Fullerton, 2007
FIELDING - INDIVIDUAL
Most Putouts 191, Daryl Arenstein, 1b, Southern California, 1970-71-72-73
118, Taylor Teagarden, c, Texas, 2003-04-05
115, Jimmy Barragan, 1b, Oklahoma St., 1985-86-87
115, Tim Federowicz, c, North Carolina, 2006-07-08
112, Ron Witmeyer, 1b, Stanford, 1987-88
112, Dustin Ackley, 1b, North Carolina, 2007-08

117
FIELDING – INDIVIDUAL (continued)
Most Assists 57, Bill Bates, 2b, Texas, 1983-84-85
52, Darwin Barney, ss, Oregon St., 2005-06-07
50, Roy Smalley, ss, Southern California, 1972-73
48, Lou Bagwell, 2b-ss, Texas, 1968-69-70
46, Keith Drumright, 2b, Oklahoma, 1973-74-75-76
46, Spike Owen, ss, Texas, 1981-82
Most Chances Without Committing an Error
126, Taylor Teagarden, c, Texas, 2003-04-05
119, Dustin Ackley, 1b, North Carolina, 2007-08
95, Bill Rowe, 1b, Oregon St., 2006
89, Kurt Suzuki, c, Cal St. Fullerton, 2003-04
86, Kelly Snider, 1b, Oklahoma, 1974-75-76
75, Brian Hall, 1b, Stanford, 2001-02-03
Most Errors
10, Phil Honeycutt, ss, Tulsa, 1969-71
10, Roy Smalley, ss, Southern California, 1972-73
8, Gary LeFevers, ss, Arizona, 4 games, 1960
8, Keith Drumright, 2b, Oklahoma, 1973-74-75-76
7, Jim Brideweser, ss, Southern California, 1948-49
7, Luis Lagunas, 2b, Arizona St., 1964-65
7, Blair Stouffer, ss, Texas, 1974-75
MISCELLANEOUS – INDIVIDUAL
Father/Son Combinations Appearing in CWS
Dick Leach (Michigan, 1953) and Rick Leach (Michigan, 1978)
John E. O’Donoghue (Missouri, 1958) and John P. O’Donoghue (LSU, 1990)
Mark McClanaham (Auburn, 1976) and Scott McClanahan (Alabama, 1999)
Floyd Bannister (Arizona St., 1975, 1976) and Brian Bannister (Southern California, 2000)
James Street (Texas, 1968, 1969, 1970) and Huston Street (Texas, 2002)
Bob Haas (Missouri, 1958) and David Haas (Wichita St., 1988)
Joe Bonacquista (Northern Colorado, 1962) and Jeff Bonacquista (Wichita St., 1988)


CHAMPIONSHIP
GAME
RECORDS


121
CWS CHAMPIONSHIP GAME RECORDS
(Final Championship Game Only)
BATTING – INDIVIDUAL
Most At Bats
7, Ernie Fazio, Santa Clara vs. Michigan, 6-16-62 (4-5, 15 inn.)
7, Dick Nichols, Florida St. vs. Southern California, 6-19-70 (1-2, 15 inn.)
7, Dave Kingman, Southern California vs. Florida St., 6-19-70 (2-1, 15 inn.)
7, Frank Alfano, Southern California vs. Florida St., 6-19-70 (2-1, 15 inn.)
7, Wes Rachels, Southern California vs. Arizona St., 6-6-98 (21-14)
Most At Bats (nine-inning game)
7, Wes Rachels, Southern California vs., Arizona St., 6-6-98 (21-14)
6, by 11 players (last time: Five players in 1998)
Most Runs 4, Scott Reid, Arizona St. vs. Houston, 6-18-67 (11-2)
4, Warren Morris, LSU vs. Miami (Fla.), 6-8-96 (9-8)
3, by 27 players (last time: Steve Susdorf, Fresno St. vs. Georgia, 6-25-08 [6-1])
Most Hits
5, Jim Shamblin, Texas vs. Wake Forest, 6-25-49 (10-3)
5, Jeremy Freitas, Southern California vs. Arizona St., 6-6-98 (21-14)
5, Wes Rachels, Southern California vs. Arizona St., 6-6-98 (21-14)
4, John Fiscalini, California vs. Yale, 6-28-47 (8-7)
4, Bill Horning, Minnesota vs. Arizona, 6-14-56 (12-1)
4, Greg Ellena, Miami (Fla.), vs. Texas, 6-11-85 (10-6)
4, Robin Ventura, Oklahoma St. vs. Stanford, 6-7-87 (5-9)
4, Casey Myers, Arizona St. vs. Southern California, 6-6-98 (14-21)
4, Omar Quintanilla, Texas vs. South Carolina, 6-22-02 (12-6)
4, Steve Detwiler, Fresno St. vs. Georgia, 6-25-08 (6-1)
Most Doubles
2, Roy Kelly, Texas vs. Michigan, 6-16-53 (5-7)
2, Wes Clements, Arizona vs. Hawaii, 6-15-80 (5-3)
2, Phil Stephenson, Wichita St. vs. Miami (Fla.), 6-12-82 (3-9)
2, Robin Ventura, Oklahoma St. vs. Stanford, 6-7-87 (5-9)
2, Paul Carey, Stanford vs. Oklahoma St., 6-7-87 (9-5)
2, Omar Quintanilla, Texas vs. South Carolina, 6-22-02 (12-6)
2, Brian Hall, Stanford vs. Rice, 6-23-03 (2-14)
2, Chris Kolkhorst, Rice vs. Stanford, 6-23-03 (14-2)
Most Triples
2, Russ Nagelson, Ohio St. vs. Oklahoma St., 6-18-66 (8-2)
2, G.J. Cantu, Houston vs. Arizona St., 6-18-67 (2-11)
1, by many players (last time: Joey Lewis, Georgia vs. Fresno St., 6-25-08 [1-6])
Most Home Runs 2, Bill Horning, Minnesota vs. Arizona, 6-14-56 (12-1)
2, Mark Kotsay, Cal St. Fullerton vs. Southern California, 6-10-95 (11-5)
2, Robb Gorr, Southern California vs. Arizona St., 6-6-98 (21-14)
2, Steve Detwiler, Fresno St. vs. Georgia, 6-25-08 (6-1)

122
BATTING – INDIVIDUAL (continued)
Most Total Bases
11, Steve Detwiler, Fresno St. vs. Georgia, 6-25-08 (6-1)
10, Bill Horning, Minnesota vs. Arizona, 6-14-56 (12-1)
9, Wes Rachels, Southern California vs. Arizona St., 6-6-98 (21-14)
8, Jim Shamblin, Texas vs. Wake Forest, 6-25-49 (10-3)
8, Mark Kotsay, Cal St. Fullerton vs. Southern California, 6-10-95 (11-5)
8, Robb Gorr, Southern California vs. Arizona St., 6-6-98 (21-14)
Most Runs Batted In
7, Wes Rachels, Southern California vs. Arizona St., 6-6-98 (21-14)
6, Steve Detwiler, Fresno St. vs. Georgia, 6-25-08 (6-1)
5, Bill Horning, Minnesota vs. Arizona, 6-14-56 (12-1)
5, Mark Kotsay, Cal St. Fullerton vs. Southern California, 6-10-95 (11-5)
5, Robb Gorr, Southern California vs. Arizona St., 6-6-98 (21-14)
5, Kevin Brown, Miami (Fla.) vs. Stanford, 6-16-01 (12-1)
Most Stolen Bases
3, Billy Hall, Wichita St. vs. LSU, 6-8-91 (3-6)
2, Bernard Kelly, California vs. Penn St., 6-12-57 (1-0)
2, Orlando Gonzalez, Miami (Fla.), vs. Southern California, 6-15-74 (3-7)
2, Ricky Peters, Arizona St. vs. South Carolina 18-77 (2-1)
2, Toi Cook, Stanford vs. Oklahoma St., 6-7-87 (9-5)
Most Sacrifice Bunts
2, Marvin Wisniewski, Michigan vs. Texas, 6-16-53 (7-5)
2, Bob Musgrave, Missouri vs. Rollins, 6-16-54 (4-1)
2, Archie Clark, Minnesota vs. Missouri, 6-18-64 (5-1)
2, Michael Collins, Arizona St. vs. Southern California, 6-6-98 (14-21)
Most Sacrifice Flies
2, Armando Rios, LSU vs. Wichita St., 6-12-93 (8-0)
2, Ryan Hubele, Texas vs. South Carolina, 6-22-02 (12-6)
1, by many players (Last in 2002)
Most Hit by Pitch
2, Anthony Blackmon, Oklahoma St. vs. Stanford, 6-7-87 (5-9)
2, Kevin Melillo, South Carolina vs. Texas, 6-22-02 (6-12)
1, by many players (Last time by Steve Susdorf, Fresno St. in 2008)
PITCHING - INDIVIDUAL
Most Innings Pitched
10, Jim Rantz, Minnesota vs. Southern California, 6-20-60 (2-1, 10 inn.)
9, by 24 players (last time: Jason Windsor, Cal St. Fullerton, 6-27-04 [3-2])
Most Innings Pitched in Relief
8 2/3, Kevin Dukes, Arizona St. vs. Oklahoma St., 6-8-81 (7-4)
8, Sid Hatfield, Tennessee vs. Oklahoma, 6-17-51 (2-3)
8, Bob Garibaldi, Santa Clara vs. Michigan, 6-16-62 (4-5, 15 inn.)
8, Jim Barr, Southern California vs. Florida St., 6-19-70 (2-1, 15 inn.)
Fewest Hits Allowed in Complete Game
3, Jack Shirley, Oklahoma vs. Tennessee, 6-17-51 (3-2)
3, Cal Emery, Penn St. vs. California, 6-12-57 (1-0)
3, Brett Laxton, LSU vs. Wichita St., 6-12-93 (8-0)

123
PITCHING – INDIVIDUAL (continued)
Most Hits Allowed
12, Tom Burgess, Arizona St. vs. Houston, 6-18-67 (11-2)
12, Jack McDowell, Stanford vs. Oklahoma St., 6-7-87 (9-5)
11, Marvin Wisniewski, Michigan vs. Texas, 6-16-53 (7-5)
11, Pat Hope, Oklahoma St. vs. Stanford, 6-7-87 (5-9)
11, Kevin Shipp, LSU vs. Miami (Fla.), 6-8-96 (9-8)
11, Brian Tallet, LSU vs. Stanford, 6-17-00 (6-5)
Complete-Game Shutouts
George Sterling, California vs. Penn St., 6-12-57 (1-0)
Jim Withers, Southern California vs. Oklahoma St., 6-15-61 (1-0)
Brett Laxton, LSU vs. Wichita St., 6-12-93 (8-0)
Most Runs Allowed
10, Steve Rogers, Tulsa vs. Arizona St., 6-20-69 (1-10)
7, Dick Atkinson, Missouri vs. Holy Cross, 6-17-52 (4-8)
7, Stan Jakubowski, Miami (Fla.), vs. Southern California, 6-15-74 (3-7)
7, Don Heinkel, Wichita St. vs. Miami (Fla.), 6-12-82 (3-9)
7, Al Gogolin, Georgia Tech vs. Oklahoma, 6-11-94 (5-13)
7, Brian Cooper, Southern California vs. Cal St. Fullerton, 6-10-95 (5-11)
7, Kevin Shipp, LSU vs. Miami (Fla.), 6-8-96 (9-8)
7, Mike Gosling, Stanford vs. Miami (Fla.), 6-16-01 (1-12)
Most Earned Runs Allowed
8, Steve Rogers, Tulsa vs. Arizona St., 6-20-69 (1-10)
7, Don Heinkel, Wichita St. vs. Miami (Fla.), 6-12-82 (3-9)
7, Mike Gosling, Stanford vs. Miami (Fla.), 6-16-01 (1-12)
Most Strikeouts
16, Brett Laxton, LSU vs. Wichita St., 6-12-93 (8-0)
15, Tom Burgess, Arizona St. vs. Houston, 6-18-67 (11-2)
13, Jim Withers, Southern California vs. Oklahoma St., 6-18-67 (2-11)
Most Base on Balls Allowed
12, Rod Keogh, Washington St. vs. Texas, 6-23-50 (0-3)
9, Jim Rantz, Minnesota vs. Southern California, 6-20-60 (2-1, 10 inn.)
8, Sid Hatfield, Tennessee vs. Oklahoma, 6-17-51 (2-3)
Most Wild Pitches
3, Steve Rogers, Tulsa vs. Arizona St., 6-20-69 (1-10)
3, Linty Ingram, Arizona St. vs. Stanford, 6-11-88 (4-9)
3, Patrick Coogan, LSU vs. Alabama, 6-7-97 (13-6)
Most Hit Batters
2, Jim Ehrler, Texas vs. Wake Forest, 6-25-49 (10-3)
2, Fred Fisher, Michigan vs. Santa Clara, 6-16-62 (5-4, 15 inn.)
2, Mark Olmos, Hawaii vs. Arizona, 6-15-80 (3-5)
2, Darren Dreifort, Wichita St. vs. LSU, 6-8-91 (3-6)
2, Steve Montgomery, Pepperdine vs. Cal St. Fullerton, 6-6-92 (3-2)
2, Justin Wayne, Stanford vs. LSU, 6-17-00 (5-6)
2, Jason Young, Stanford vs. LSU, 6-17-00 (5-6)
2, Justin Simmons, Texas vs. South Carolina, 6-22-02 (12-6)
2, Andrew Carignan, North Carolina vs. Oregon St., 6-24-07 (3-9)
Most Balks
1, Rod Keogh, Washington St. vs. Texas, 6-23-50 (0-3)
1, Trey Hodges, LSU vs. Stanford, 6-17-00 (6-5)
1, Aaron Rawl, South Carolina vs. Texas, 6-22-02 (6-12)

124
PITCHING – INDIVIDUAL (continued)
Most Championship Game Wins, Career
2, Jim Ehrler, Texas, 1949, 1950
Most Championship Game Starts, Career
2, Jim Withers, Southern California, 1960, 1961
Most Championship Game Losses, Career
2, Robert Goodyear, Yale, 1947, 194
FIELDING – INDIVIDUAL (continued)
Most Putouts
18, Doug Kasimer, 1b, Florida St. vs. Southern California, 6-19-70 (1-2, 15 inn.)
16, Wes Clements, 1b, Arizona vs. Hawaii, 6-15-80 (5-3)
16, Dan Melendez, 1b, Pepperdine vs. Cal St. Fullerton, 6-6-92 (3-2)
16, Adrian Antonini, c, LSU vs. Wichita St., 6-12-93 (8-0)
Most Putouts (nine-inning game) 16, Wes Clements, 1b, Arizona vs. Hawaii, 6-15-80 (5-3)
16, Dan Melendez, 1b, Pepperdine vs. Cal St. Fullerton, 6-6-92 (3-2)
16, Adrian Antonini, c, LSU vs. Wichita St., 6-12-93 (8-0)
Most Assists 11, Cal Meier, ss, Southern California vs. Florida St., 6-19-70 (2-1, 15 inn.)
8, Roger Wich, ss, Oklahoma vs. Tennessee, 6-17-51 (3-2)
8, Frank Alfano, 2b, Southern California vs. Florida St., 6-19-70 (2-1, 15 inn.)
Most Assists (nine-inning game)
8, Roger Wich, ss, Oklahoma vs. Tennessee, 6-17-51 (3-2)
7, Mark Van Bever, 2b, South Carolina vs. Arizona St., 6-18-77 (1-2)
7, Ron Quick, 2b, Arizona vs. Hawaii, 6-15-80 (5-3)
7, Scott McIntyre, 2b, Georgia Tech vs. Oklahoma, 6-11-94 (5-13)
Most Errors
3, Jessie Smith, p, Texas vs. Michigan, 6-16-53 (5-7)
3, Gary Starr, 2b, Missouri vs. Southern California, 6-19-58 (7-8, 12 inn.)
3, Art Toombs, ss, Houston vs. Arizona St., 6-18-67 (2-11)
3, Danny Muno, ss, Fresno St. vs. Georgia, 6-25-08 (6-1)
Most Passed Balls
2, by six players (last time: Greg Halvorson, Arizona St. vs. Southern California, 6-6-98 [14-21])
BATTING - TEAM
Most At Bats 52, Southern California vs. Florida St., 6-19-70 (2-1, 15 inn.)
51, Michigan vs. Santa Clara, 6-16-62 (5-4, 15 inn.)
50, Florida St. vs. Southern California, 6-19-70 (1-2, 15 inn.)
Most At Bats (nine-inning game) 46, Southern California vs. Arizona St., 6-6-98 (21-14)
45, Texas vs. Wake Forest, 6-25-49 (10-3)
43, Southern California vs. Arizona St., 6-8-78 (10-3)

125
BATTING – TEAM (continued)
Most Runs
21, Southern California vs. Arizona St., 6-6-98 (21-14)
14, Arizona St. vs. Southern California, 6-6-98 (14-21)
14, Rice vs. Stanford, 6-23-03 (14-2)
13, Oklahoma vs. Georgia Tech, 6-11-94 (13-5)
13, LSU vs. Alabama, 6-7-97 (13-6)
Most Runs, One Inning
7, Southern California vs. Missouri, 4th inning, 6-19-58 (8-7, 12 inn.)
7, Rice vs. Stanford, 6th inning, 6-23-03 (14-2)
6, Minnesota vs. Arizona, 5th inning, 6-14-56 (12-1)
6, Miami (Fla.), vs. Wichita St., 5th inning, 6-12-82 (9-3)
6, LSU vs. Alabama, 1st inning, 6-7-97 (13-6)
Most Hits
23, Southern California vs. Arizona St., 6-6-98 (21-14)
16, Southern California vs. Arizona St., 6-8-78 (10-3)
16, Oklahoma vs. Georgia Tech, 6-11-94 (13-5)
16, Arizona St. vs. Southern California, 6-6-98 (14-21)
Most Doubles
5, Texas vs. South Carolina, 6-22-02 (12-6)
4, Southern California vs. Arizona St., 6-13-73 (4-3)
4, Arizona vs. Hawaii, 6-15-80 (5-3)
4, Stanford vs. Oklahoma St., 6-7-87 (9-5)
4, Alabama vs. LSU, 6-7-97 (6-13)
4, Southern California vs. Arizona St., 6-6-98 (21-14)
4, Miami (Fla.) vs. Stanford, 6-16-01 (12-1)
Most Triples
3, Michigan vs. Santa Clara, 6-16-62 (5-4, 15 inn.)
3, Ohio St. vs. Oklahoma St., 6-18-66 (8-2)
2, Houston vs. Arizona St., 6-18-67 (2-11)
2, Arizona St. vs. Stanford, 6-11-88 (4-9)
Most Home Runs
5, Southern California vs. Arizona St., 6-6-98 (21-14)
4, Cal St. Fullerton vs. Southern California, 6-10-95 (11-5)
4, Arizona St. vs. Southern California, 6-6-98 (14-21)
Most Total Bases
42, Southern California vs. Arizona St., 6-6-98 (21-14)
29, Arizona St. vs. Southern California, 6-6-98 (14-21)
26, Texas vs. Wake Forest, 6-25-49 (10-3)
Most Runs Batted In
20, Southern California vs. Arizona St., 6-6-98 (21-14)
14, Arizona St. vs. Southern California, 6-6-98 (14-21)
14, Rice vs. Stanford, 6-23-03 (14-2)
13, Oklahoma vs. Georgia Tech, 6-11-94 (13-5)
13, LSU vs. Alabama, 6-7-97 (13-6)
Most Walks
14, Texas vs. Washington St., 6-23-50 (3-0)
12, Rice vs. Stanford, 6-23-03 (14-2)
10, Minnesota vs. Missouri, 6-18-64 (5-1)
9, by six teams (last time: LSU vs. Alabama, 6-7-97 [13-6])

126
BATTING -TEAM (continued)
Fewest Strikeouts
1, Southern California vs. Arizona St., 6-8-78 (10-3)
2, California vs. Yale, 6-28-47 (8-7)
2, Arizona St. vs. Southern California, 6-8-78 (3-10)
2, Oregon St. vs. North Carolina, 6-26-06 (3-2)
Most Stolen Bases
4, Arizona vs. Florida St., 6-9-86 (10-2)
4, Wichita St. vs. LSU, 6-8-91 (3-6)
3, Seven times (last time: Oregon St. vs. North Carolina, 6-26-06 [3-2]
Most Sacrifice Bunts
4, Cal St. Fullerton vs. Southern California, 6-10-95 (11-5)
3, Michigan vs. Texas, 6-16-53 (7-5)
3, Oklahoma St. vs. Arizona, 6-18-59 (5-3)
3, Santa Clara vs. Michigan, 6-16-62 (4-5, 15 inn.)
3, Minnesota vs. Missouri, 6-18-64 (5-1)
3, Oregon St. vs. North Carolina, 6-26-06 (3-2)
Most Sacrifice Flies
3, Miami (Fla.) vs. LSU, 6-8-96 (8-9)
3, Texas vs. South Carolina, 6-22-02 (12-6)
2, LSU vs. Wichita St., 6-12-93 (8-0)
2, LSU vs. Miami (Fla.), 6-8-96 (9-8)
PITCHING -- TEAM
Fewest Hits Allowed 3, Oklahoma vs. Tennessee, 6-17-51 (3-2)
3, Penn St. vs. California, 6-12-57 (0-1)
3, Arizona St. vs. Ohio St., 6-12-65 (2-1)
3, Cal St. Fullerton vs. Texas, 6-10-84 (3-1)
3, LSU vs. Wichita St., 6-12-93 (8-0)
Fewest Runs Allowed
0, Texas vs. Washington St., 6-23-50 (3-0)
0, California vs. Penn St., 6-12-57 (1-0)
0, Southern California vs. Oklahoma St., 6-15-61 (1-0)
0, Southern California vs. Arizona St., 6-16-72 (1-0)
0, LSU vs. Wichita St., 6-12-93 (8-0)
Most Earned Runs Allowed
21, Arizona St. vs. Southern California, 6-6-98 (14-21)
11, Southern California vs. Arizona St., 6-6-98 (21-14)
10, Arizona St. vs. Southern California, 6-8-78 (3-10)
10, Stanford vs. Miami (Fla.), 6-16-01 (1-12)
10, South Carolina vs. Texas, 6-22-02 (6-12)
10, Stanford vs. Rice, 6-23-03 (2-14)
Most Unearned Runs Allowed
8, Southern California vs. Cal St. Fullerton, 6-10-95 (5-11)
6, Houston vs. Arizona St., 6-18-67 (2-11)
6, Alabama vs. LSU, 6-7-97 (6-13)
Fewest Base on Balls Allowed
0, by seven teams (last time: Texas vs. Cal St. Fullerton, 6-27-04 [2-3])

127
PITCHING – TEAM (continued)
Most Strikeouts
16, Santa Clara vs. Michigan, 6-16-62 (4-5, 15 inn.)
16, LSU vs. Wichita St., 6-12-93 (8-0)
15, Michigan vs. Santa Clara, 6-16-62 (5-4, 15 inn.)
15, Arizona St. vs. Houston, 6-18-67 (11-2)
15, Florida St. vs. Southern California, 6-19-70 (1-2, 15 inn.)
15, LSU vs. Alabama, 6-7-97 (13-6)
Most Strikeouts (nine-inning game)
16, LSU vs. Wichita St., 6-12-93 (8-0)
15, Arizona St. vs. Houston, 6-18-67 (11-2)
15, LSU vs. Alabama, 6-7-97 (13-6)
Most Hit Batters
4, Stanford vs. LSU, 6-17-00 (5-6)
2, by 10 teams (last time: Texas vs. South Carolina, 6-22-02 [12-6])
Most Wild Pitches
3, Tulsa vs. Arizona St., 6-20-69 (1-10)
3, Arizona St. vs. Stanford, 6-11-88 (4-9)
3, Alabama vs. LSU, 6-7-97 (6-13)
Most Balks
1, Washington St. vs. Texas, 6-23-50 (0-3)
1, LSU vs. Stanford, 6-17-00 (6-5)
1, South Carolina vs. Texas, 6-22-02 (6-12)
Most Pitchers Used
6, Stanford vs. Miami (Fla.), 6-16-01 (1-12)
6, Stanford vs. Rice, 6-23-03 (2-14)
5, Florida St. vs. Southern California, 6-19-70 (1-2, 15 inn.)
5, Oklahoma St. vs. Arizona St., 6-8-81 (4-7)
5, Southern California vs. Arizona St., 6-6-98 (21-14)
5, Arizona St. vs. Southern California, 6-6-98 (14-21)
5, South Carolina vs. Texas, 6-22-02 (6-12)
5, Oregon St. vs. North Carolina, 6-26-06 (3-2)
FIELDING - TEAM
Most Assists 23, Southern California vs. Florida St., 6-19-70 (2-1, 15 inn.)
22, Santa Clara vs. Michigan, 6-16-62 (4-5, 15 inn.)
20, Arizona vs. Hawaii, 6-15-80 (5-3)
Most Assists (nine-inning game) 20, Arizona vs. Hawaii, 6-15-80 (5-3)
18, Texas vs. Miami (Fla.), 6-11-85 (6-10)
18, Pepperdine vs. Cal St. Fullerton, 6-6-92 (3-2)
18, Georgia Tech vs. Oklahoma, 6-11-94 (5-13)
18, Oklahoma vs. Georgia Tech, 6-11-94 (13-5)
Most Errors 6, Missouri vs. Southern California, 6-19-58 (7-8, 12 inn.)
6, Houston vs. Arizona St., 6-18-67 (2-11)
5, by three teams (last time: Texas vs. Miami (Fla.), 6-11-85 [6-10])

128
FIELDING – TEAM (continued)
Most Double Plays
4, Stanford vs. Oklahoma St., 6-7-87 (5-9)
3, Michigan vs. Santa Clara, 6-16-62 (5-4, 15 inn.)
3, Southern California vs. Arizona St., 6-16-72 (1-0)
3, Southern California vs. Arizona St., 6-8-78 (10-3)
3, Arizona vs. Florida St., 6-9-86 (10-2)
3, Georgia vs. Oklahoma St., 6-9-90 (2-1)
3, Wichita St. vs. LSU 6-8-91 (3-6)
3, Georgia Tech vs. Oklahoma, 6-11-94 (5-13)
3, Florida St. vs. Miami (Fla.), 6-19-99 (5-6)
Most Passed Balls
2, by seven teams (last time: Arizona St. vs. Southern California, 6-6-98 [14-21])
BATTING - BOTH TEAMS
Most At Bats
102, Southern California (52) vs. Florida St. (50), 6-19-70 (2-1, 15 inn.)
99, Michigan (51) vs. Santa Clara (48), 6-16-62 (5-4, 15 inn.)
96, Missouri (49) vs. Southern California (47), 6-19-58 (7-8, 12 inn.)
Most At Bats (nine-inning game) 87, Southern California (46) vs. Arizona St. (41), 6-6-98 (21-14)
79, LSU (40) vs. Alabama (39), 6-7-97 (13-6)
78, Texas (45) vs. Wake Forest (33), 6-25-49 (10-3)
Most Runs
35, Southern California (21) vs. Arizona St. (14), 6-6-98
19, LSU (13) vs. Alabama (6), 6-7-97
18, Oklahoma (13) vs. Georgia Tech (5), 6-11-94
18, Texas (12) vs. South Carolina (6), 6-22-02
Most Hits
39, Southern California (23) vs. Arizona St. (16), 6-6-98 (21-14)
29, LSU (15) vs. Miami (Fla.) (14), 6-8-96 (9-8)
28, Stanford (15) vs. Oklahoma St. (13), 6-7-87 (9-5)
Most Doubles
8, Texas (5) vs. South Carolina (3), 6-22-02 (12-6)
6, Stanford (4) vs. Oklahoma St. (2), 6-7-87 (9-5)
6, LSU (3) vs. Miami (Fla.) (3), 6-8-96 (9-8)
6, Alabama (4) vs. LSU (2), 6-7-97 (6-13)
6, Rice (3) vs. Stanford (3), 6-23-03 (14-2)
Most Triples
3, Ohio St. (3) vs. Oklahoma St. (0), 6-18-66 (8-2)
3, Michigan (3) vs. Santa Clara (0), 6-16-62 (5-4, 15 inn.)
2, five times (last time: Arizona St. (2) vs. Stanford (0), 6-11-88 [4-9])
Most Home Runs
9, Southern California (5) vs. Arizona St. (4), 6-6-98 (21-14)
7, Cal St. Fullerton (4) vs. Southern California (3), 6-10-95 (11-5)
4, Oklahoma (2) vs. Georgia Tech (2), 6-11-94 (13-5)

129
BATTING - BOTH TEAMS (continued)
Most Total Bases
71, Southern California (42) vs. Arizona St. (29), 6-6-98 (21-14)
43, Oklahoma St. (24) vs. Stanford (19), 6-7-87 (5-9)
43, Oklahoma (25) vs. Georgia Tech (18), 6-11-94 (13-5)
43, Cal St. Fullerton (24) vs. Southern California (19), 6-10-95 (11-5)
Most Runs Batted In
34, Southern California (20) vs. Arizona St. (14), 6-6-98 (21-14)
19, LSU (13) vs. Alabama (6), 6-7-97 (13-6)
18, Oklahoma (13) vs. Georgia Tech (5), 6-11-94 (13-5)
Most Walks
18, Texas (14) vs. Washington St. (4), 6-23-50 (3-0)
18, Southern California (9) vs. Minnesota (9), 6-20-60 (1-2, 10 inn.)
16, Minnesota (10) vs. Missouri (6), 6-18-64 (5-1)
Fewest Strikeouts
3, Southern California (1) vs. Arizona St. (2), 6-8-78 (10-3)
6, Southern California (3) vs. Yale (3), 6-26-48 (9-2)
7, Pepperdine (3) vs. Cal St. Fullerton (4), 6-6-92 (3-2)
7, Rice (3) vs. Stanford (4), 6-23-03, (14-2)
Most Stolen Bases
5, California (3) vs. Yale (2), 6-28-47 (8-7)
5, Miami (Fla.) (3) vs. Southern California (2), 6-15-74 (3-7)
5, Arizona vs. Florida St., 6-9-86 (10-2)
Most Sacrifice Bunts
5, Oklahoma St. (3) vs. Arizona (2), 6-18-59 (5-3)
5, Cal St. Fullerton (4) vs. Southern California (1), 6-10-95 (11-5)
3, eight times (last time: Oregon St. (3) vs. North Carolina (0), 6-26-06 [3-2])
Most Sacrifice Flies
5, Miami (Fla.) (3) vs. LSU (2), 6-8-96 (8-9)
4, Texas (3) vs. South Carolina (1), 6-22-02 (12-6)
2, Six times (last time: Southern California (1) vs. Arizona St. (1), 6-6-98 [21-14])
PITCHING - BOTH TEAMS
Fewest Hits Allowed
8, Penn St. (3) vs. California (5), 6-12-57 (0-1)
8, Arizona St. (3) vs. Ohio St. (5), 6-16-63 (5-2)
8, Cal St. Fullerton (3) vs. Texas (5), 6-10-84 (3-1)
Fewest Runs Allowed
1, California (0) vs. Penn St. (1), 6-12-57 (1-0)
1, Southern California (0) vs. Oklahoma St. (1), 6-15-61 (1-0)
1, Southern California (0) vs. Arizona St. (1), 6-16-72 (1-0)
Fewest Earned Runs Allowed
0, Southern California (0) vs. Arizona St. (0), 6-16-72 (1-0)
1, California (0) vs. Penn St. (1), 6-12-57 (1-0)
1, Southern California (0) vs. Oklahoma St. (1), 6-15-61 (1-0)

130
PITCHING - BOTH TEAMS (continued)
Most Earned Runs Allowed
32, Arizona St. (21) vs. Southern California (11), 6-6-98 (14-21)
15, Missouri (8) vs. Southern California (7), 6-19-58 (7-8, 12 inn.)
14, Georgia Tech (9) vs. Oklahoma (5), 6-11-94 (5-13)
14, South Carolina (10) vs. Texas (4), 6-22-02 (6-12)
Most Unearned Runs Allowed
11, Southern California (8) vs. Cal St. Fullerton (3), 6-10-95 (5-11)
7, Miami (Fla.) (4) vs. Southern California (3), 6-15-74 (3-7)
6, Houston (6) vs. Arizona St. (0), 6-18-67 (2-11)
6, Alabama (6) vs. LSU (0), 6-7-97 (6-13)
Fewest Base on Balls Allowed
1, Southern California (0) vs. Oklahoma (1), 6-15-61 (1-0)
1, Arizona St. (0) vs. South Caro. (1), 6-18-77 (2-1)
1, Cal St. Fullerton (1) vs. Texas (0), 6-27-04 (3-2)
2, Arizona St. (0) vs. Tulsa (2), 6-20-69 (10-1)
2, Southern California (1) vs. Arizona (1), 6-13-73 (4-3)
Most Strikeouts
31, Santa Clara (16) vs. Michigan (15), 6-16-62 (4-5, 15 inn.)
26, Florida St. (15) vs. Southern California (11), 6-19-70 (1-2, 15 inn.)
25, LSU (15) vs. Alabama (10), 6-7-97 (13-6)
Most Strikeouts (nine-inning game)
25, LSU (15) vs. Alabama (10), 6-7-97 (13-6)
22, LSU (16) vs. Wichita St. (6), 6-12-93 (8-0)
20, Arizona St. (15) vs. Houston (5), 6-18-67 (11-2)
Most Wild Pitches
4, Alabama (3) vs. LSU (1), 6-7-97 (6-13)
3, Tulsa (3) vs. Arizona St. (0), 6-20-69 (1-10)
3, Oklahoma St. (2) vs. Stanford (1), 6-7-87 (5-9)
3, Arizona St. (3) vs. Stanford (0), 6-11-88 (4-9)
Most Hit Batters
6, Stanford (4) vs. LSU (2), 6-17-00 (5-6)
4, Oregon St. (2) vs. North Carolina 2, 6-24-07 (9-3)
3, Texas (2) vs. Wake Forest (1), 6-25-49 (10-3)
3, Wichita St. (2) vs. LSU (1), 6-8-91 (3-6)
Most Balks
1, Washington St. (1) vs. Texas (0), 6-23-50 (0-3)
1, LSU (1) vs. Stanford (0), 6-17-00 (6-5)
1, South Carolina (1) vs. Texas (0), 6-22-02 (6-12)
Most Pitchers Used
10, Southern California (5) vs. Arizona St. (5), 6-6-98 (21-14)
9, Stanford (6) vs. Miami (Fla.) (3), 6-16-01 (1-12)
8, Oklahoma (4) vs. Georgia Tech (4), 6-11-94 (13-5)
8, South Carolina (5) vs. Texas (3), 6-22-02 (6-12)
8, Oregon St. (5) vs. North Carolina (3), 6-26-06 (3-2)
8, Oregon St. (4) vs. North Carolina (4), 6-24-07 (9-3)

131
FIELDING - BOTH TEAMS
Most Assists
40, Santa Clara (22) vs. Michigan (18), 6-16-62 (4-5, 15 inn.)
39, Southern California (23) vs. Florida St. (16), 6-19-70 (2-1, 15 inn.)
36, Oklahoma (18) vs. Georgia Tech (18), 6-11-94 (13-5)
Most Assists (nine-inning game)
36, Oklahoma (18) vs. Georgia Tech (18), 6-11-94 (13-5)
31, Pepperdine (18) vs. Cal St. Fullerton (13), 6-6-92 (3-2)
30, Arkansas (17) vs. Cal St. Fullerton (13), 6-8-79 (1-2)
Most Errors
8, Southern California (4) vs. Yale (4), 6-26-48 (9-2)
8, Missouri (6) vs. Southern California (2), 6-19-58 (8-7, 12 inn.)
8, Houston (6) vs. Arizona St. (2), 6-18-67 (2-11)
Most Double Plays
6, Stanford (4) vs. Oklahoma St. (2), 6-7-87 (9-5)
4, Michigan (3) vs. Santa Clara (1), 6-16-62 (5-4, 15 inn.)
4, Southern California (3) vs. Arizona St. (1), 6-16-72 (1-0)
4, Georgia (3) vs. Oklahoma St. (1), 6-9-90 (2-1)
4, Wichita St. (3) vs. LSU (1), 6-8-91 (3-6)
4, Georgia Tech (3) vs. Oklahoma (1), 6-11-94 (5-13)
Most Passed Balls
3, Texas (2) vs. Miami (Fla.) (1), 6-11-85 (6-10)
2, seven times (last time: Arizona St. (2) vs. Southern California (0), 6-6-98 [14-21])
MISCELLANEOUS RECORDS
Highest Attendance 25,012, Oregon St. vs. North Carolina, 6-24-07
24,456, Southern California vs. Arizona St., 6-6-98 (21-14)
24,401, LSU vs. Alabama, 6-7-97 (13-6)
24,282, LSU vs. Stanford, 6-17-00 (6-5)
Longest Game by Innings
15, Michigan vs. Santa Clara, 6-16-62 (5-4)
15, Southern California vs. Florida St., 6-19-70 (2-1)
12, Southern California vs. Missouri, 6-19-58 (8-7)
10, Minnesota vs. Southern California, 6-20-60 (2-1)
Longest Game by Time
3:59, Southern California vs. Arizona St., 6-6-98 (21-14)
3:56, Southern California vs. Florida St., 6-19-70 (2-1, 15 inn.)
3:42, LSU vs. Stanford, 6-17-00 (6-5)
Longest Game by Time (nine-inning game)
3:59, Southern California vs. Arizona St., 6-6-98 (21-14)
3:42, LSU vs. Stanford, 6-17-00 (6-5)
3:29, Oregon St. vs. North Carolina, 6-24-07 (9-3)
3:19, LSU vs. Miami (Fla.), 6-8-96 (9-8)
3:19, Texas vs. South Carolina, 6-22-02 (12-6)
Shortest Game by Time
1:35, Arizona St. vs. South Carolina, 6-18-77 (2-1)
1:39, Arizona St. vs. Tulsa, 6-20-69 (10-1)
1:53, Missouri vs. Rollins, 6-16-54 (4-1)

132
MISCELLANEOUS RECORDS (continued)
Most Runners Left on Base by One Team
16, Texas vs. Washington St., 6-23-50 (3-0)
16, Oklahoma vs. Tennessee, 6-17-51 (3-2)
15, Southern California vs. Florida St., 6-19-70 (2-1, 15 inn.)
Fewest Runners Left on Base by One Team
2, Oklahoma St. vs. Southern California, 6-15-61 (0-1)
2, Cal St. Fullerton vs. Arkansas, 6-8-79 (2-1)
3, Tulsa vs. Arizona St., 6-20-69 (1-10)
3, Tennessee vs. Oklahoma, 6-17-51 (2-3)
3, Southern California vs. Cal St. Fullerton, 6-10-95 (5-11)
Most Runners Left on Base by Both Teams
25, Michigan (13) vs. Texas (12), 6-16-53 (7-5)
24, Southern California (15) vs. Florida St. (9), 6-19-70 (2-1, 15 inn.)
23, Texas (16) vs. Washington St. (7), 6-23-50 (3-0)
Fewest Runners Left on Base by Both Teams
8, Arizona St. (4) vs. South Carolina (4), 6-18-77 (2-1)
8, Cal State Fulleton (2) vs. Arkansas (6), 6-8-79 (2-1)
9, Tulsa (3) vs. Arizona St. (6), 6-20-69 (1-10)
Most Players Used by One Team
19, Stanford vs, Miami (Fla.), 6-16-01 (1-12)
19, Stanford vs. Rice, 6-23-03 (2-14)
18, Georgia Tech vs. Oklahoma, 6-11-94 (5-13)
18, South Carolina vs. Texas, 6-22-02 (6-12)
Most Players Used by Both Teams
34, Georgia Tech (18) vs. Oklahoma (16), 6-11-94 (5-13)
33, Stanford (19) vs. Miami (Fla.) (14), 6-16-01 (1-12)
33, South Carolina (18) vs. Texas (15), 6-22-02 (6-12)
Largest Winning Margin
12, Rice vs. Stanford, 6-23-03 (14-2)
11, Minnesota vs. Arizona, 6-14-56 (12-1)
11, Miami (Fla.) vs. Stanford, 6-16-01 (12-1)
Largest Margin Overcome for Victory
4, Southern California vs. Missouri, 6-19-58 (8-7, 12 inn.)
4, LSU vs. Miami (Fla.), 6-8-96 (9-8)
3, Wake Forest vs. Western Mich., 6-16-55 (7-6)
3, Miami (Fla.) vs. Wichita St., 6-12-82 (9-3)
3, LSU vs. Stanford, 6-17-00 (6-5)
Most Appearances by One School in the Championship Game or Series
14, Southern California
11, Texas
10, Arizona St.
Teams From Same Conference Playing in the Championship Game or Series
Pacific-10, Stanford vs. Arizona St., 6-11-88 (9-4)
Southeastern, LSU vs. Alabama, 6-7-97 (13-6)
Pacific-10, Southern California vs. Arizona St., 6-6-98 (21-14)
Same Two Teams Playing in the Championship Game or Series in back-to-back years
Southern California vs. Arizona St., 1972 & 1973 (Southern California won both championships, 1-0 in ‘72 and 4-3 in ‘73)
Oregon St. vs. North Carolina, 2006 & 2007 (Oregon St. won both championships, 3-2 in ‘06 and 9-3 in ‘07)
CHAMPIONSHIP
FINALS
RECORDS


135
COLLEGE WORLD SERIES CHAMPIONSHIP FINALS RECORDS (Starting in 2003, the champion was determined with a best two-of-three series between the winners of the two four-team brackets)
BATTING/BASERUNNING – INDIVIDUAL
Highest Batting Average, Series (min. 6 at-bats)
.750, David Maroul, Texas vs. Florida, 2005 (6-8)
Most At Bats, Game
6, by Chris Hopkins, Oregon St. vs. North Carolina, June 24, 2007
6, by Ryan Peisel, Georgia vs. Fresno St., June 24, 2008
6, by Matt Olson, Georiga vs. Fresno St., June 24, 2008
Most At Bats, Series
15, Austin Davis, Rice vs. Stanford, 2003 (3 games)
15, Gavin Hedstrom, Fresno St. vs. Georgia, 2008 (3 games)
15, Matt Olson, Georgia vs. Fresno St., 2008 (3 games)
Most Hits, Game
4, Felipe Garcia, Cal St. Fullerton vs. Texas, June 26, 2004
4, Chad Flack, North Carolina vs. Oregon St., June 24, 2006
4, Tim Federowicz, North Carolina vs. Oregon St., June 25, 2006
4, Steve Detwiler, Fresno St. vs. Georgia, June 25, 2008
Most Hits, Series
8, Steve Detwiler, Fresno St. vs. Georgia, 2008 (3 games)
Most Doubles, Game
2, Tobin Swope, Stanford vs. Rice, June 22, 2003
2, Brian Hall, Stanford vs. Rice, June 23, 2003
2, Chris Kolkhorst, Rice vs. Stanford, June 23, 2003
2, Reid Fronk, North Carolina vs. Oregon St., June 23, 2007
2, Lonnie Lechelt, Oregon St. vs. North Carolina, June 23, 2007
Most Doubles, Series
2, Brian Hall, Stanford vs. Rice, 2003
2, Tobin Swope, Stanford vs. Rice, 2003
2, Ryan Garko, Stanford vs. Rice, 2003
2, Chris Kolkhorst, Rice vs. Stanford, 2003
2, Reid Fronk, North Carolina vs. Oregon St., 2007
2, Lonnie Lechelt, Oregon St. vs. North Carolina, 2007
2, Steve Detwiler, Fresno St. vs. Georgia, 2008
2, Steve Susdorf, Fresno St. vs. Georgia, 2008
Most Triples, Game
1, Chris Kolkhorst, Rice vs. Stanford, June 21, 2003
1, Brett Pill, Cal St. Fullerton vs. Texas, June 27, 2004
1, Chad Flack, North Carolina vs. Oregon St., June 24, 2006
1, Chad Flack, North Carolina vs. Oregon St., June 25, 2006
1, John Wallace, Oregon St. vs. North Carolina, June 24, 2007
1, Steve Susdorf, Fresno St. vs. Georgia, June 23, 2008
1, Danny Muno, Fresno St. vs. Georgia, June 24, 2008
1, Joey Lewis, Georgia vs. Fresno St., June 25, 2008
Most Triples, Series
2, Chad Flack, North Carolina vs. Oregon St., 2006
Most Home Runs, Game
2, Steve Detwiler, Fresno St. vs. Georgia, June 25, 2008
Most Home Runs, Series
3, Steve Detwiler, Fresno St. vs. Georgia, 2008 (3 games)

136
BATTING/BASERUNNING – INDIVIDUAL (continued)
Most Extra-Base Hits, Game
3, Steve Detwiler, Fresno St. vs. Georgia, June 25, 2008 (2 HR, 1 Double)
Most Extra-Base Hits, Series
5, Steve Detwiler, Fresno St. vs. Georgia, 2008 (3 games) (3 HR, 2 Doubles)
Most Runs Scored, Game
4, Danny Muno, Fresno St. vs. Georgia, June 24, 2008
Most Runs Scored, Series
6, Steve Susdorf, Fresno St. vs. Georgia, 2008 (3 games)
Most Runs Batted In, Game
6, Steve Detwiler, Fresno St., vs. Georgia, June 25, 2008
Most Runs Batted In, Series
9, Steve Detwiler, Fresno St., vs. Georgia, 2008 (3 games)
Most Total Bases, Game
11, Steve Detwiler, Fresno St., vs. Georgia, June 25, 2008
Most Total Bases, Series
19, Steve Detwiler, Fresno St., vs. Georgia, 2008 (3 games)
Most Walks, Game
3, Enrique Cruz, Rice vs. Stanford, June 23, 2003
Most Walks, Series
4, Chris Kolkhorst, Rice vs. Stanford, 2003
4, Chris Kunda, Oregon St. vs. North Carolina, 2006
Most Strikeouts, Game
5, Drew Stubbs, Texas vs. Cal St. Fullerton, June 26, 2004
Most Strikeouts, Series
6, Drew Stubbs, Texas vs. Cal St. Fullerton, 2004
Most Sacrifice Hits, Game
1, by 21 players
Most Sacrifice Hits, Series
2, Drew Stubbs, Texas, 2005
2, Chris Kunda, Oregon St., 2006
2, Mike Lissman, Oregon St., 2006
2, John Wallace, Oregon St., 2006
Most Sacrifice Flies, Game
2, Rich Poythress, Georgia vs. Fresno St., June 24, 2008
Most Sacrifice Flies, Series
2, Rich Poythress, Georgia vs. Fresno St., 2008 (3 games)
Most Stolen Bases, Game
1, by 17 players
Most Stolen Bases, Series
2, Mitch Canham, Oregon St., 2006
2, Tyler Graham, Oregon St., 2006

137
BATTING/BASERUNNING – INDIVIDUAL (continued)
Most Times Caught Stealing, Game
2, Gordon Beckham, Georgia vs. Fresno St., June 24, 2008
Most Times Caught Stealing, Series
2, Gordon Beckham, Georgia vs. Fresno St., 2008
Most Times Hit By Pitch, Game
1, by 21 players
Most Times Hit By Pitch, Series
2, Cole Gillespie, Oregon St., 2006
BATTING/BASERUNNING – TEAM
Highest Batting Average, Series
.362, Oregon St. vs. North Carolina, 2007 (25-69)
Highest On-Base Percentage, Series
.466, Oregon St. vs. North Carolina, 2007
Highest Slugging Percentage, Series
.591, Fresno St. vs. Georgia, 2008
Most Plate Appearances, Series
129, Rice vs. Stanford, 2003
Most At Bats, Game
41, Fresno St. vs. Georgia, June 24, 2008
Most At Bats, Series
110, Fresno St. vs. Georgia, 2008
Most Hits, Game
19, Fresno St. vs. Georgia, June 24, 2008
Most Hits, Series
34, Fresno St. vs. Georgia, 2008
Most Doubles, Game
3, Stanford vs. Rice, June 22, 2003
3, Stanford vs. Rice, June 23, 2003
3, Rice vs. Stanford, June 23, 2003
3, North Carolina vs. Oregon St., June 25, 2006
3, Georgia vs. Fresno St., June 23, 2008
Most Doubles, Series
7, Stanford vs. Rice, 2003
Most Triples, Game
1, Rice vs. Stanford, June 21, 2003
1, Cal St. Fullerton vs. Texas, June 27, 2004
1, North Carolina vs. Oregon St., June 24, 2006
1, North Carolina vs. Oregon St., June 25, 2006
1, Oregon St. vs. North Carolina, June 24, 2007
1, Fresno St. vs. Georgia, June 23, 2008
1, Fresno St. vs. Georgia, June 24, 2008
1, Georgia vs. Fresno St., June 25, 2008

138
BATTING/BASERUNNING – TEAM (continued)
Most Triples, Series
2, North Carolina vs. Oregon St., 2006
2, Fresno St. vs. Georgia, 2008
Most Home Runs, Game
3, Fresno St. vs. Georgia, June 23, 2008
Most Home Runs, Series
7, Fresno St. vs. Georgia, 2008
Most Extra-Base Hits, Game
6, Fresno St. vs. Georgia, June 23, 2008
Most Extra-Base Hits, Series
15, Fresno St. vs. Georgia, 2008
Most Runs, Game
19, Fresno St. vs. Georgia, June 24, 2008
Most Runs, Series
31, Fresno St. vs. Georgia, 2008
Most Runs Batted In, Game
18, Fresno St. vs. Georgia, June 24, 2008
Most Runs Batted In, Series
30, Fresno St. vs. Georgia, 2008
Most Total Bases, Game
29, Fresno St. vs. Georgia, June 24, 2008
Most Total Bases, Series
65, Fresno St. vs. Georgia, June 23, 2008
Most Walks, Game
12, Rice vs. Stanford, June 23, 2003
Most Walks, Series
19, Rice vs. Stanford, 2003
Most Sacrifice Hits, Game
4, Oregon St. vs. North Carolina, June 24, 2006
Most Sacrifice Hits, Series
8, Oregon St. vs. North Carolina, 2006
Most Sacrifice Flies, Game
3, Oregon St. vs. North Carolina, 2007
Most Sacrifice Flies, Series
3, Oregon St. vs. North Carolina, 2007
Most Stolen Bases, Game
3, Cal St. Fullerton vs. Texas, June 26, 2004
3, Oregon St. vs. North Carolina, June 25, 2006
3, Oregon St. vs. North Carolina, June 26, 2006
Most Stolen Bases, Series
6, Oregon St. vs. North Carolina, 2006

139
BATTING/BASERUNNING – TEAM (continued)
Most Times Caught Stealing, Game
2, Georgia vs. Fresno St., June 24, 2008
Most Times Caught Stealing, Series
2, Stanford vs. Rice, 2003
2, Georgia vs. Stanford, 2008
Most Runners Left On Base, Game
12, Oregon St. vs. North Carolina, June 24, 2007
12, Georgia vs. Fresno St., June 24, 2008
Most Runners Left On Base, Series
28, Rice vs. Stanford, 2003
Fewest Runners Left On Base, Game
4, Stanford vs. Rice, June 23, 2003
Fewest Runners Left On Base, Series
12, Texas vs. Cal St. Fullerton, 2004
12, Texas vs. Florida, 2005
PITCHING – INDIVIDUAL
Complete Games
Philip Humber, Rice vs. Stanford, June 23, 2003
Jason Windsor, Cal St. Fullerton vs. Texas, June 27, 2004
Most Innings Pitched, Game
9.1, Ryan McCally, Stanford vs. Rice, June 21, 2003
Most Innings Pitched, Series
9.1, Ryan McCally, Stanford vs. Rice, 2003
Most Appearances, Series
2, 20 times (last by five players in 2008)
Most Wins, Series
1, 13 players
Most Losses, Series
1, 13 players
Most Saves, Series
2, J. Brent Cox, Texas vs. Florida, 2005
Fewest Hits Allowed, Complete Game
5, Philip Humber, Rice vs. Stanford, June 23, 2003
5, Jason Windsor, Cal St. Fullerton vs. Texas, June 27, 2004
Most Hits Allowed, Game
10, John Hudgins, Stanford vs. Rice, June 22, 2003 (7 innings)
Fewest Earned Runs Allowed, Complete Game
2, Philip Humber, Rice vs. Stanford, June 23, 2003
2, Jason Windsor, Cal St. Fullerton vs. Texas, June 27, 2004
Most Runs Allowed, Game
8, Wade Townsend, Rice vs. Stanford, June 22, 2003

140
PITCHING – INDIVIDUAL (continued)
Most Earned Runs Allowed, Game
6, Matt Danford, North Carolina vs. Oregon St., June 25, 2006
Most Strikeouts, Game
10, Jason Windsor, Cal St. Fullerton vs. Texas, June 27, 2004
Most Strikeouts, Series
10, Jason Windsor, Cal St. Fullerton vs. Texas, 2004
Most Walks, Game
6, Mark Romanczuk, Stanford vs. Rice, June 23, 2003
Most Walks, Series
6, Mark Romanczuk, Stanford vs. Rice, 2003
Most Wild Pitches, Game
2, Wade Townsend, Rice vs. Stanford, June 22, 2003
2, Kodiak Quick, Stanford vs. Rice, June 22, 2003
Most Wild Pitches, Series
2, Wade Townsend, Rice vs. Stanford, 2003
2, Kodiak Quick, Stanford vs. Rice, 2003
Most Hit Batters, Game
2, Mike Facchinei, North Carolina vs. Oregon St., June 23, 2007
2, Andrew Carignan, North Carolina vs. Oregon St., June 24, 2007
Most Hit Batters, Series
2, Mike Facchinei, North Carolina vs. Oregon St., 2007
2, Andrew Carignan, North Carolina vs. Oregon St., 2007
PITCHING – TEAM
Most Innings Pitched, Game
10, Rice vs. Stanford, June 21, 2003
Most Innings Pitched, Series
27, Rice vs. Stanford, 2003
Fewest Hits Allowed, Game
4, Texas vs. Florida, June 25, 2005
Fewest Hits Allowed, Series
10, Texas vs. Florida, 2005
Fewest Extra-Base Hits Allowed, Game
0, North Carolina vs. Oregon St., June 26, 2006
Fewest Extra-Base Hits Allowed, Series
2, Cal St. Fullerton vs. Texas, 2004
2, Texas vs. Florida, 2005
Fewest Earned Runs Allowed, Game
0, Oregon St. vs. North Carolina, June 26, 2006
Fewest Earned Runs Allowed, Series
4, Texas vs. Florida, 2005
Most Earned Runs Allowed, Game
19, Georgia vs. Fresno St., June 24, 2008

141
PITCHING – TEAM (continued)
Most Earned Runs Allowed, Series
30, Georgia vs. Fresno St., 2008
Fewest Runs Allowed, Game
1, Fresno St.vs. Georgia, June 25, 2008
Fewest Runs Allowed, Series
4, Texas vs. Florida, 2005
Lowest Earned Run Average, Series
2.00, Texas vs. Florida, 2005
Lowest Opponent Batting Average, Series
.164, Texas vs. Florida, 2005
Most Strikeouts, Game
11, Texas vs. Cal St. Fullerton, June 26, 2004
11, Texas vs. Florida, June 25, 2005
Most Strikeouts, Series
21, Texas vs. Florida, 2005
Fewest Strikeouts, Game
2, Fresno St. vs. Georgia, June 23, 2008
Fewest Strikeouts, Series
10, North Carolina vs. Oregon St., 2007
Fewest Walks, Game
0, Texas vs. Cal St. Fullerton, June 27, 2004
Fewest Walks, Series
3, Cal St. Fullerton vs. Texas, 2004
3, Florida vs. Texas, 2005
Most Hit Batters, Game
2, North Carolina vs. Oregon St., June 23, 2007
2, Oregon St. vs. North Carolina, June 24, 2007
2, North Carolina vs. Oregon St., June 24, 2007
2, Fresno St. vs. Georgia, June 24, 2008
Most Hit Batters, Series
4, North Carolina vs. Oregon St., 2007
Most Wild Pitches, Game
3, Stanford vs. Rice, June 22, 2003
Most Wild Pitches, Series
3, Rice vs. Stanford, 2003
3, Stanford vs. Rice, 2003
3, Georgia vs. Fresno St., 2008
Most Pitchers Used, Game
7, Georgia vs. Fresno St., June 24, 2008
Most Different Pitchers Used, Series
12, Georgia vs. Fresno St., 2008

142
PITCHING – TEAM (continued)
Most Saves, Series
2, Texas vs. Florida, 2005
FIELDING – INDIVIDUAL
Most Putouts, Game
17, Bill Rowe, Oregon St. vs. North Carolina, June 24, 2006
Most Putouts, Series
39, Vincent Sinisi, Rice vs. Stanford, 2003
Most Assists, Game
7, Chris Kunda, Oregon St. vs. North Carolina, June 24, 2006
Most Assists, Series
15, Chris Kunda, Oregon St. vs. North Carolina, 2006
Most Errors, Game
3, Danny Muno, Fresno St. vs. Georgia, June 25, 2008
Most Errors, Series
3, Vincent Sinisi, Rice vs. Stanford, 2003
3, Danny Muno, Fresno St. vs. Georgia, 2008
Most Chances, Game
18, Bill Rowe, Oregon St. vs. North Carolina, June 24, 2006 (17 putouts, 1 assist, 0 errors)
Most Chances, Series
43, Vincent Sinisi, Rice vs. Stanford, 2003 (39 putouts, 1 assist, 3 errors)
FIELDING – TEAM
Most Putouts, Game
30, Rice vs. Stanford, June 21, 2003
Most Putouts, Series
81, Rice vs. Stanford, 2003
Most Assists, Game
19, Oregon St. vs. North Carolina, June 24, 2006
Most Assists, Series
43, North Carolina vs. Oregon St., 2006
Most Errors, Game
4, North Carolina vs. Oregon St., June 26, 2006
4, Fresno St. vs. Georgia, June 25, 2008
Most Errors, Series
6, Texas vs. Cal St. Fullerton, 2004
6, Fresno St. vs. Georgia, 2008
Most Chances, Game
45, North Carolina vs. Oregon St., June 24, 2006 (27 putouts, 17 assists, 1 error)
Most Chances, Series
123, North Carolina vs. Oregon St., 2006

143
FIELDING – TEAM (continued)
Most Double Plays, Game
5, North Carolina vs. Oregon St., June 23, 2007
Most Double Plays, Series
7, North Carolina vs. Oregon St., 2007
BATTING/BASERUNNING – BOTH TEAMS
Highest Combined Batting Average
.331, Oregon St. vs. North Carolina, 2007 (46-139)
Most At Bats, Game
81, Fresno St. (41) vs. Georgia (40), June 24, 2008
Most At Bats, Series
219, Fresno St. (110) vs. Georgia (109), 2008
Most Hits, Game
35, Fresno St. (19) vs. Georgia (16), June 24, 2008
Most Hits, Series
66, Fresno St. (34) vs. Georgia (32), 2008
Most Doubles, Game
6, Rice (3) vs. Stanford (3), June 23, 2003
Most Doubles, Series
13, Stanford (7) vs. Rice (6), 2003
Most Triples, Game
1, 8 times
Most Triples, Series
3, Fresno St. (2) vs. Georgia (1), 2008
Most Home Runs, Game
4, Fresno St. (3) vs. Georgia (1), June 23, 2008
Most Home Runs, Series
9, Fresno St. (7) vs. Georgia (2), 2008
Most Extra-Base Hits, Game
10, Fresno St. (6) vs. Georgia (4), June 23, 2008
Most Extra-Base Hits, Series
22, Fresno St. (15) vs. Georgia (7), 2008
Most Runs, Game
29, Fresno St. (19) vs. Georgia (10), June 24, 2008
Most Runs, Series
49, Fresno St. (31) vs. Georgia (18), 2008
Most Runs Batted In, Game
28, Fresno St. (18) vs. Georgia (14), June 24, 2008
Most Runs Batted In, Series
48, Fresno St. (30) vs. Georgia (18), 2008

144
BATTING/BASERUNNING – BOTH TEAMS (continued)
Most Total Bases, Game
46, Fresno St. (29) vs. Georgia (17), June 24, 2008
Most Total Bases, Series
109, Fresno St. (65) vs. Georgia (44), 2008
Most Walks, Game
14, Rice (12) vs. Stanford (2), June 23, 2003
Most Walks, Series
26, Rice (19) vs. Stanford (7), 2003
Most Sacrifice Hits, Game
4, Oregon St. (4) vs. North Carolina (0), June 24, 2006
Most Sacrifice Hits, Series
9, Oregon St. (8) vs. North Carolina (1), 2006
Most Sacrifice Flies, Game
4, Oregon St. (3) vs. North Carolina (1), June 23, 2007
Most Sacrifice Flies, Series
4, Oregon St. (3) vs. North Carolina (1), June 23, 2007
Most Stolen Bases, Game
3, Cal St. Fullerton (3) vs. Texas (0), June 26, 2004
3, Oregon St. (3) vs. North Carolina (0), June 25, 2006
3, Oregon St. (3) vs. North Carolina (0), June 26, 2006
Most Stolen Bases, Series
6, Oregon St. (6) vs. North Carolina (0), 2006
Most Times Caught Stealing, Game
2, Cal St. Fullerton (1) vs. Texas (1), June 26, 2004
2, Texas (1) vs. Florida (1), June 25, 2005
2, Georgia (2) vs. Fresno St. (0), June 24, 2008
Most Times Caught Stealing, Series
3, Georgia (2) vs. Fresno St. (1), 2008
Most Runners Left On Base, Game
22, Oregon St. (12) vs. North Carolina (10), June 24, 2007
Most Runners Left On Base, Series
47, Oregon St. (23) vs. North Carolina (24), 2006
Fewest Runners Left On Base, Game
11, Fresno St. (6) vs. Georgia (5), June 23, 2008
Fewest Runners Left On Base, Series
26, Texas (12) vs. Florida (14), 2005
Most Innings Pitched, Game
19.2, Rice (10) vs. Stanford (9.2), June 21, 2003
Most Innings Pitched, Series
53.2, Rice (27) vs. Stanford (26.2), 2003

145
PITCHING – BOTH TEAMS
Fewest Hits Allowed, Game
12, Texas (4) vs. Florida (8), June 25, 2005
Fewest Hits Allowed, Series
28, Texas (10) vs. Florida (18), 2005
Fewest Extra-Base Hits Allowed, Game
1, Oregon St. (1) vs. North Carolina (0), June 26, 2006
Fewest Extra-Base Hits Allowed, Series
5, Cal St. Fullerton (2) vs. Texas (3), 2004
Fewest Earned Runs Allowed, Game
1, Oregon St. (0) vs. North Carolina (1), June 26, 2006
Fewest Earned Runs Allowed, Series
10, Cal St. Fullerton (5) vs. Texas (5), 2004
Fewest Runs Allowed, Game
5, Cal St. Fullerton (2) vs. Texas (3), June 27, 2004
5, Oregon St. (2) vs. North Carolina (3), June 26, 2006
Fewest Runs Allowed, Series
14, Texas (4) vs. Florida (10), 2005
Fewest Walks Allowed, Game
1, Texas (0) vs. Cal St. Fullerton (1), June 27. 2004
Fewest Walks Allowed, Series
7, Cal St. Fullerton (3) vs. Texas (4), 2004
Fewest Strikeouts, Game
6, Georgia (5) vs. Fresno St. (1), June 23, 2008
Fewest Strikeouts, Series
24, Oregon St. (14) vs. North Carolina (10), 2007
Most Strikeouts, Game
21, Texas (11) vs. Cal St. Fullerton (10), June 26, 2004
Most Strikeouts, Series
40, Texas (20) vs. Cal St. Fullerton (20), 2004
Most Hit Batters, Game
4, Oregon St. (2) vs. North Carolina (2), June 24, 2007
Most Hit Batters, Series
6, Oregon St. (2) vs. North Carolina (4), 2007
Most Wild Pitches, Game
5, Stanford (3) vs. Rice (2), June 22, 2003
Most Wild Pitches, Series
6, Stanford (3) vs. Rice (3), 2003
Most Pitchers Used, Game
10, Fresno St. (5) vs. Georgia (5), June 23, 2008
10, Georgia (7) vs. Fresno St. (3), June 24, 2008

146
PITCHING – BOTH TEAMS (continued)
Most Different Pitchers Used, Series
22, Georgia (12) vs. Fresno St. (10), 2008
FIELDING – BOTH TEAMS
Most Putouts, Game
59, Rice (30) vs. Stanford (29), June 21, 2003
Most Putouts, Series
161, Rice (81) vs. Stanford (80), 2003
Most Assists, Game
36, Oregon St. (19) vs. North Carolina (17), June 24, 2006
Most Assists, Series
84, Oregon St. (41) vs. North Carolina (43), 2006
Most Errors, Game
6, Fresno St. (4) vs. Georgia (2), June 25, 2008
Most Errors, Series
9, Texas (6) vs. Cal St. Fullerton (3), 2004
Most Chances, Game
88, Oregon St. (43) vs. North Carolina (45), June 24, 2006
Most Chances, Series
243, Oregon St. (120) vs. North Carolina (123), 2006
Most Double Plays, Game
6, Oregon St. (1) vs. North Carolina (5), 2007
Most Double Plays, Series
8, Oregon St. (1) vs. North Carolina (7), 2007
MISCELLANEOUS
Largest Attendance, Championship Series Game
26,887, Oregon St. vs. North Carolina, June 23, 2007 (Game 1)
Largest Attendance, Championship Series
70,419, Oregon St. vs. North Carolina, 2006 (3 games)
Longest Game By Innings
10, Rice vs. Stanford, June 21, 2003
Longest Game By Time
3:55, Fresno St. vs. Georgia, June 24, 2008
Shortest Game By Time
2:50, Texas vs. Florida, June 26, 2005
Most Players Used By One Team
19, Stanford vs. Rice, June 23, 2003
19, North Carolina vs. Oregon St., June 23, 2007
19, Georgia vs. Fresno St., June 24, 2008
Most Players Used By Two Teams
35, Georgia (19) vs. Fresno St. (16), June 24, 2008

147
MISCELLANEOUS (continued)
Largest Margin Of Victory
12, Rice (14) vs. Cal St. Fullerton (2), June 23, 2003
Largest Margin Overcome For Victory
5, Oregon St. (11) vs. North Carolina (7), June 25, 2006 (Oregon St. trailed 5-0 going to bottom of 4th
.)
5, Fresno St. (19) vs. Georgia (10), June 24, 2008 (Fresno St. trailed 5-0 going to bottom of 3rd
.)
Most Appearances In Championship Series
2, Texas
2, Oregon St.
2, North Carolina
Most Games Played In Championship Series
5, Oregon St.
5, North Carolina


CWS
TIDBITS


151
MEN’S COLLEGE WORLD SERIES UMPIRES
(MCWS Championship Game Only)
DATE ATTENDANCE UMPIRES
6-28-47 2,258 Bill McKinley, Ed Hurley
6-26-48 1,757 Bill McKinley, Fred Spurgeon
6-25-49 5,000 Ed Brady, Charley Carpenter, Everett Massey, Volney Paul
6-23-50 2,384 Hank Soar, Lon Warneke, Jack Tobin
6-17-51 6,290 Lon Warneke, Jack Tobin, Art Alvarez
6-17-52 6,914 Joe Cibulka, Larry Napp, John Pelton, Jack Tobin
6-16-53 5,303 Jack Tobin, Hal Dixon, Jim Duffy, Robert Luschen
6-16-54 7,810 Nestor Chylak, Jack Tobin, George Hametz, Hal Dixon
6-16-55 2,042 Walter Doyle, Walter Harbour, George Hametz, John Hergert
6-14-56 3,890 Shag Crawford, Jack Tobin, George Hametz, Frank Tabacchi
6-12-57 3,211 Ken Burkhart, Frank Umont, Jack Tobin, Walter Harbour
6-19-58 3,021 Bob Stewart, Vincent Smith, Jerry Carlton, George Hametz
6-18-59 4,168 Bob Stewart, Jack Tobin, Don Carrothers, Ed Sudol
6-20-60 3.635 Bill Summers, Don Carrothers, Yrkoski, Ed LaBrosse
6-15-61 5,704 Al Forman, Don Carrothers, Yrkoski, LaBrosse
6-16-62 7,395 Lee Weyer, Don Carrothers, Yrkoski, Ed LaBrosse
6-16-63 8,682 Mel Steiner, Don Carrothers, Jim Kiehn, Ed LaBrosse
6-18-64 10,562 Don Carrothers, Richard Daup, Yrkoski, Gast
6-12-65 5,698 John Kibler, Jim Odom, Don Carrothers, Ed LaBrosse, Richard Daup, Price
6-18-66 10,507 Charlie Berry, Don Carrothers, Price, Ed LaBrosse, Dale Bergman, McCourt
6-18-67 9,210 Bill McKinley, Don Carrothers, Hank Rountree, Stanek
6-15-68 9,412 Harry Schreiber, Doug Cossey, Jim Duplechain, Hank Morganweck, Don Carrothers, Bob Riha
6-20-69 10,050 McDonough, Bull Newsome, Yost, Fletcher Harvey
6-19-70 11,542 Art Blair, Doug Cossey, Cece Carlucci, Gus Steiner
6-17-71 13,945 Bull Newsome, Stewart, Don Gust, Kirby Hogue
6-16-72 6,950 Al Forman, Doug Cossey, Harry Schreiber, Fred Hodge
6-13-73 12,050 Bob Motley, John Hollar, Giles Threadgold, Gene Agnes
6-15-74 11,346 Cap Tyson, Tom Ravashiere, Tony Patch Jr., Al Alford
6-14-75 10,717 Sonny Noel, Harold Easley, John Couch, Bud Grainger
6-19-76 11,576 C. J. Mitchell, Mel Neese, Doug Cossey, Fred Gerardi
6-18-77 11,875 Doug Cossey, Gus Steiner, C. J. Mitchell, Al Forman
6-08-78 12,172 Hank Rountree, Ed Mariano, Bud Grainger, Dale Williams
6-08-79 10,158 Hank Rountree, Jon Bible, Tony Patch Jr., Bob Clement
6-15-80 15,276 Jon Bible, Tony Patch, Boyd Mauer, Bob Clement
6-08-81 13,239 Gus Steiner, Boyd Mauer, Joe Driscoll, Murray Strey
6-12-82 14,321 Dick Runchey, Randy Christal, Linzy Sumpter, Jim Dunne
6-11-83 14,957 Joe Driscoll, Hank Rountree, Jon Bible, Randy Christal
6-10-84 13,487 Gus Steiner, Murray Strey, Joe Driscoll, Al Forman
6-11-85 9,830 Al Forman, Murray Strey, Tony Patch Jr., Dan Pedersen
6-09-86 12,659 Hank Rountree, Randy Christal, Bill Rosenberry, Dick Zivic
6-07-87 14,132 Randy Christal, Hank Rountree, Bob Nelson, Bill Rosenberry
6-11-88 16,071 Jon Bible, Dale Williams, Jim Garman, Ron Graham, Rusty Herring, Bob Jones
6-10-89 13,701 Dale Williams, Gus Steiner, Bob Jones, Ron Graham, Bruce Ravan, Bob Roberts 6-09-90 16,482 Dick Runchey, Hank Rountree, Randy Christal, Ken Eldridge, Don January, Bob Hernandez
6-08-91 16,612 Lee Hagler, Tony Patch Jr., Bill Rosenberry, Dan Pedersen, Bill Lopina, Dave Yeast
6-06-92 17,962 Dale Williams, Larry Randall, Dick Zivic, Tom McKinney, Al Davis, Larry Waggoner
6-12-93 20,286 Jim Garman, Don January, Ron Graham, Tom Jenkins, Tony Thompson, Bill L’Heureux
6-11-94 21,503 Dick Runchey, Dan Pedersen, Bob Nelson, John Magnusson, Tim Henderson, Bill Davis

152
DATE ATTENDANCE UMPIRES 6-10-95 22,027 Ken Eldridge, Dale Williams, Wade Ford, Bob Homolka, Rich Fetchiet, Jon Bible
6-08-96 23,905 Scott Graham, Randy Christal, Tom McKinney, Tony Thompson, Kevin Gillmore, Bob Jones
6-07-97 24,401 Al Davis, Jim Garman, John Magnusson, Bob Hernandez, Danny Mascorro, Gus Rodriguez
6-06-98 24,456 Dick Runchey, Wade Ford, Ken Eldridge, Tony Walsh, Nick Zibelli, Tony Gisondi
6-19-99 23,563 Rich Fetchiet, Dan Pedersen, Bill Davis, Randy Bruns, Tim Norman, Ken Couch
6-17-00 24,282 Scott Graham, Al Davis, Joe Burleson, Danny Mascorro, Tony Maners, David Wiley
6-16-01 24,070 Tony Walsh, Tim Henderson, Ken Eldridge, Gus Rodriguez, Paul Gullie, Ron Sebastian
6-22-02 24,089 Jim Garman, John Magnusson, Nick Zibelli, A. J. Lostaglio, Perry Costello, Kevin Daugherty
6-23-03 18,494 Al Davis, Joe Burleson, Randy Bruns, Ken Eldridge, Tony Maners, Frank Sylvester
6-27-04 21,395 Tony Walsh, Dave Buck, Paul Guillie, David Rogers, Ken Gracner, Gus Rodriguez
6-26-05 19,836 Jim Garman, Bill Davis, David Wiley, Andy Eaves, Steve Manders, Mike Conlin
6-26-06 18,565 Joe Burleson, Paul Guillie, Tony Maners, Perry Costello, Darrel Mason, Randy Bruns
6-24-07 25,012 Dan Mascorro, David Buck, Jeff Henrichs, Scott Graham, Mark Ditsworth, Ken Eldridge
6-25-08 18,932 David Wiley, Tony Walsh, Bill Speck, Jim Garman, Frank Sylvester, Mike Conlin

NCAA Division I College World SeriesAll-time Umpire Selections
Name # of Years # of GamesCarrothers, Don 18 137Bergman, Dale 12 41LaBrosse, Ed 9 71Tobin, Jack x 8 79Williams, Dale 8 79Christal, Randy 8 77Rountree, Hank 8 73Steiner, Gus 7 70Garman, Jim 7 65Forman, Al * 7 64Bible, Jon 7 61Daup, Richard 7 47Cossey, Doug 6 61Patch, Tony 6 60Eldridge, Ken 6 56Hametz, George 6 47Yrkoski, 6 30Stanek, Ed 6 19Stanek, Joe 6 18Riha, Bob 6 16Stanek, 6 16Runchey, Dick 5 48Pedersen, Dan 5 46Hergert, John 5 29Gerardi, Fred 5 22Mitchell, CJ 4 40Davis, Al 4 36Mascorro, Dan 4 34Walsh, Tony 4 34Graham, Scott 4 33Harbour, Walter 4 26Newsome, Bull 3 32Zivic, Dick 3 31Graham, Ron 3 30Strey, Murray 3 30Jones, Bob 3 29Nelson, Bob 3 29Rosenberry, Bill 3 29Bruns, Randy 3 28Davis, Bill 3 28Driscoll, Joe 3 28Magnusson, John 3 28Rodriguez, Gus 3 28Burleson, Joe 3 27Guillie, Paul 3 27Maners, Tony 3 26Wiley, David 3 26Costello, Perry 3 22McKinley, Bill * 3 8Stanesic, John 3 7Price, 3 5Warneke, Lon * 2 24Couch, John 2 21Fetchiet, Rich 2 21Stewart, Bob * 2 21Clement, Bob 2 20Duffy, Jim * 2 20Grainger, Bud 2 20Hernanadez, Bob 2 20January, Don 2 20Mauer, Boyd 2 20Zibelli, Nick 2 20Ford, Wade 2 19

NCAA Division I College World SeriesAll-time Umpire Selections
Name # of Years # of GamesMcKinney, Tom 2 19Schreiber, Harry 2 19Sylvester, Frank 2 19Thompson, Tony 2 19Henderson, Tim 2 18Buck, Dave 2 17Dixon, Hal * 2 17Henrichs, Jeff 2 17Homolka, Bob 2 17Yeast, Dave 2 17Conlin, Mike 2 16Lostaglio, AJ 2 15Rogers, David 2 15Gust, Don 2 12Kiehn, Jim 2 11Gomez, 2 7Gast, 2 4Larson, Dick 2 2Soar, Hank * 1 15Cibulka, Joe x 1 12Neese, Mel 1 12Alford, Al 1 11Blair, Art 1 11Carlton, Jerry x 1 11Easley, Harold 1 11Harvey, Fletcher 1 11Hodge, Fred 1 11Hogue, Kirby 1 11McDounough, 1 11Noel, Sonny 1 11Ravashiere, Tom 1 11Stewart, 1 11Summers, Bill * 1 11Tyson, Cap 1 11Yost, 1 11Agnes, Gene 1 10Alvarez, Al x 1 10Carlucci, Cece 1 10Daugherty, Kevin 1 10Dunne, Jim 1 10Gisondi, Tony 1 10Herring, Rusty 1 10Hollar, John 1 10L'Heureux, Bill 1 10Mariano, Ed 1 10Motley, Bob 1 10Randall, Larry 1 10Smith, Vincent * 1 10Speck, Bill 1 10Sudol, Ed * 1 10Threadgold, Giles 1 10Weyer, Lee * 1 10Couch, Ken 1 9Crawford, Shag * 1 9Doyle, Walter x 1 9Gillmore, Kevin 1 9Hagler, Lee 1 9Harvey, Randy 1 9Jenkins, Tom 1 9Kleis, John 1 9Lopina, Bill 1 9Mele, Mitch 1 9Napp, Larry * 1 9Ravan, Bruce 1 9

NCAA Division I College World SeriesAll-time Umpire Selections
Name # of Years # of GamesRoberts, Bob 1 9Sebastian, Ron 1 9Sumpter, Linzy 1 9Tabacchi, Frank 1 9Waggoner, Larry 1 9Burkhart, Ken * 1 8Chylak, Nestor * 1 8Ditsworth, Mark 1 8Duplechain, Jim 1 8Erby, Scott 1 8Gracner, Ken 1 8Luschen, Robert x 1 8Manders, Steve 1 8Mason, Darrel 1 8Morganweck, Hank 1 8Norman, Tim 1 8Steiner, Mel * 1 8Eaves, Andy 1 7Nutt, Kelly 1 7Rice, John * 1 7Umont, Frank * 1 7Cox, Jack 1 6Gore, Art * 1 6Spanos, Gus 1 6Hoodzow, Bill 1 5Kibler, John * 1 5Brady, Ed 1 4Carpenter, Charley 1 4Odom, Jim * 1 4Paul, Volney 1 4Vargo, Ed * 1 4Benes, Jim 1 3Dossey, Harry 1 3Massey, Everett 1 3Philiips, Robert x 1 3Spurgeon, Fred 1 3Akromis, 1 2Berry, Charlie * 1 2Bosko, 1 2Horton, 1 2Hurley, Ed * 1 2McGonigle, Dennis 1 2Rice, Charlie 1 2Wykoski, 1 2Elliott, 1 1Engel, Bob * 1 1Holderness, 1 1Knight, 1 1Kraft, 1 1McCourt, 1 1Pelton, John x 1 1Wendelstedt, Harr * 1 1Whitney, Jack 1 1Knapp, 0 0
Total Assignments 3268 Total Umpires 181
* Designates umpires from Major League Baseballx Designates umpires from Minor League Baseballu Designates local Omaha area umpires

156
AT THE MCWS, THE LAST TIME….
…a team went undefeated throughout the NCAA Tournament:
Miami (Fla.), 2001 (9-0)
…a team went undefeated in the MCWS:
Oregon St., 2007 (5-0)
…a team won six games at the MCWS:
Oregon St., 2006
…the National Champion was below .500 during its regular-season conference schedule:
Oregon St., 2007 (10-14 in Pac-10)
…the National Champion was seeded third or lower in its regional:
Fresno St., 2008 (fourth seed at Long Beach Regional)
…the National Champion did not host the regional it won:
Fresno St., 2008 (won Long Beach Regional)
…the National Champion did not host the super regional it won:
Fresno St., 2008 (won Tempe Super Regional)
…a team lost twice in the MCWS and won the National Championship:
Fresno St., 2007
…a team made its first-ever MCWS appearance
Louisville and UC Irvine, 2007
…more than one team in the field made its first MCWS appearance
Louisville and UC Irvine, 2007
…a team lost its first game and came back to win the championship:
Oregon St., 2006
…two teams made their first appearance in the Championship Game/Series:
Oregon St. and North Carolina, 2006
…both teams in Championship Game/Series were trying to win their first National Championship:
Oregon St. and North Carolina, 2006
…two teams both made back-to-back appearances in the Championship Game/Series:
Oregon St. and North Carolina, 2006 and 2007
…a team played eight games at the MCWS:
Oregon St., 2006
…a team won an MCWS game for the first time and a national title in the same year:
Oregon St., 2006
…a team won six elimination games at the MCWS:
Oregon St., 2006
…16 games were played in one year at the MCWS:
2008
…a player hit an inside-the-park home run:
Chris Burke, ss, Tennessee vs. Georgia, 6-11-01 (19-12)
…a player hit a home run to lead-off the game:
Michael Hollander, 3b, LSU vs. North Carolina, 6-15-08 (4-8)

157
AT THE MCWS, THE LAST TIME….
…a player hit the first pitch of the game for a home run:
Zane Green, dh, Clemson vs. South Carolina, 6-19-02 (4-12)
…there were no home runs during a doubleheader:
Baylor vs. Oregon St. (4-3) and Texas vs. Tulane (5-0), 6-20-05
…a player hit two home runs in one game:
Steve Detwiler, rf, Fresno St. vs. Georgia, 6-25-08 (6-1)
…players hit back-to-back home runs:
Jay Cox, lf & Tim Federowicz, dh, North Carolina vs. Cal St. Fullerton, 5th inn., 6-21-06 (6-5)
…players hit back-to-back home runs on back-to-back pitches:
Jay Cox, lf & Tim Federowicz, dh, North Carolina vs. Cal St. Fullerton, 5th inn., 6-21-06 (6-5)
…players hit back-to-back home runs in the championship game:
Tony Martinez, 3b, & Tony Miranda, lf, Cal St. Fullerton vs. Southern California, 6-10-95 (11-5)
…players hit back-to-back-to-back home runs:
Brad Cresse, c, & Clint Earnhart, dh & Wes Davis, rf, LSU vs. Mississippi St., 2nd inn.,6-1-98 (10-8)
…a player hit a home run to end a game:
Chance Wheeless, 1b, Texas vs. Baylor, 6-22-05 (4-3)
…a player hit a home run to end the championship game:
Warren Morris, 2b, LSU vs. Miami (Fla.), 6-8-96 (9-8)
…a player hit a grand slam to end an extra-inning game:
Paul Carey, rf, Stanford vs. LSU, 6-5-87 (6-5, 10 innings)
…a player hit a pinch-hit home run:
Ben Clowe, ph, Stanford vs. Georgia 6-21-08 (8-10)
…a player hit a pinch-hit home run to end a 9-inning game:
Dave Shermet, ph, Arizona vs. Maine, 5-30-86 (8-7)
…a pitcher earned the win and hit a home run in the same game:
Jason Lane, Southern California vs. Arizona St., 6-6-98 (21-14)
…a player hit for the cycle:
Jerry Kindall, ss, Minnesota vs. Mississippi, 6-11-56 (13-5)
…a team hit three home runs in one inning:
LSU vs. Mississippi St., 6-1-98 (2nd inning)
…a team hit lead-off home runs in back-to-back innings:
LSU vs. North Carolina, 6-15-08 (4-8) (1st/2nd innings)
…no home runs were hit on opening day:
Arizona St. vs. Cal St. Fullerton (5-3) and Texas vs. Oklahoma, (4-2), 6-6-1975
…a player hit home runs in back-to-back plate appearances:
Logan Johnson, 2b, Louisville vs. Rice, 6-15-07 (10-15)
…a team did not walk or strike out in the same game:
Stanford vs. Cal St. Fullerton, 6-13-01 (4-1)

158
AT THE MCWS, THE LAST TIME….
…a team was shut out in back-to-back games:
Rice vs. Oregon St. (5-0, 6-21-06 and 2-0, 6-22-06)
…a player struck out five times in one game:
Matt Cerione, Georgia vs. Stanford, 6-21-08 (10-8)
…a player stole home:
Steven Feehan, cf, La.-Lafayette vs. Clemson, 6-14-00 (5-4)
…a player was awarded first base on catcher’s interference:
Greg Schulte, cf, Michigan vs. Mississippi St., 5-30-81
(the catcher was Terry Loe)
…a player was called out for using an illegal bat:
Tony Barquin, Miami (Fla.) vs. Michigan, 6-2-80 (3-2)
…a player was called out for batter’s interference:
Brian Barre, cf, Southern California vs. Florida St., 6-14-00 (2-3)
…a pitcher threw a complete game:
Robert Woodard, North Carolina and Stephen Faris, Clemson, 6-19-06 (2-0)
…a game featured two complete games by the starting pitchers:
Robert Woodard, North Carolina vs. Stephen Faris, Clemson, 6-19-06 (2-0)
…a pitcher threw a complete-game shutout:
Robert Woodard, North Carolina vs. Clemson, 6-19-06 (2-0)
…pitchers threw a combined shutout:
Jonah Nickerson & Kevin Gunderson, Oregon St. vs. Rice, 6-22-06 (2-0)
…a pitcher threw nine innings of relief in a 9-inning game:
Dick Larner, California vs. Yale, 6-27-47 (17-4)
…a pitcher also played catcher in the same game:
Buster Posey, Florida St. vs. Stanford, 6-14-06 (5-16)
…a starting pitcher failed to make it out of the first inning:
Jason Berken, Clemson vs. Cal St. Fullerton, 6-20-06 (6-7)
…a pitcher started games on back-to-back days:
Brian Flores, Arizona St. vs. Oregon St., 6-18-07 (6-12) and vs. UC Irvine, 6-19-07 (7-8)
…a pitcher started games on back-to-back games:
Matt Harvey, North Carolina vs. LSU, 6-19-08 (7-3) and vs. Fresno St., 6-21-08 (4-3)
…a pitcher won at least one game and had two saves in the MCWS:
Joshua Fields, Georgia, 2008
…a player threw two complete games in one CWS:
Jason Windsor, Cal St. Fullerton vs. South Carolina, 6-19-04 (2-0) and
Cal St. Fullerton vs. Texas, 6-27-04 (3-2)
…a team had pitchers throw three complete games in one CWS:
Cal St. Fullerton (Jason Windsor, 2; Ricky Romero, 1), 2004
…a team had pitchers throw four complete games in one CWS:
Georgia (Dave Flemming, 2; Mike Rebban, 2), 1990

159
AT THE MCWS, THE LAST TIME….
…a team pitched shutouts in back-to-back games:
Oregon St. vs. Rice (5-0, 6-21-06 and 2-0, 6-22-06)
…a team shut out an opponent twice in one CWS:
Oregon St. vs. Rice (5-0, 6-21-06 and 2-0, 6-22-06)
…neither team committed an error in a game:
North Carolina vs. Fresno St., 6-21-08 (4-3)
…a team turned a triple play
St. John’s (N.Y) vs. Hawaii, 6-1-80 (2-7)
…a player tossed a live ball into the stands as a souvenir:
Gary Burnham, lf, Clemson vs. Miami (Fla.), 5-31-96 (3-7) (Rudy Gomez hit a double down the third base
line and Burnham, thinking it was a foul, tossed the ball into the stands and Gomez was awarded home)
…a game was shortened because of rain:
South Carolina vs. Eastern Mich., 6 innings, 6-8-75 (5-1)
…a game took two days to finish due to rain:
North Carolina vs. LSU, 6-19/20-08 (7-3)
…two games were rained out on the same day:
6-13-00
…a tornado warning evacuated the press box:
6-13-00
… rain delay in a game:
Fresno St. vs. North Carolina, 6-21-2008 (start delayed 48 minutes)
… lighting delay in a game:
LSU vs. North Carolina, 6-20-2008 (1:27 delay in the bottom of the third inning)
…two rain delays in the same game:
6-17-2006 – Miami (FL) vs. Oregon St. (a four-minute delay prior to the bottom of the fifth and 1:34 delay
in the top of the eighth)
…a team was involved in three rain delays during the CWS:
Oregon St., 2006 (two rain delays on June 17 vs. Miami (Fla.) and one delay in championship series game
vs. North Carolina on June 24)
…a team was involved in three weather delays during the CWS:
North Carolina, 2008 (two rain delays; LSU on June 19 and Fresno St. on June 21; lighting delay vs. LSU
on June 20)
…a team changed uniforms during a game:
Florida St. vs. Miami (Fla.), 6-4-95 (2-4) (during a rain delay)
…brothers were starters for the same team in a game:
Clay Harris, 3b and Will Harris, 1b, LSU vs. South Carolina, 6-21-04 (4-15)
…a son played in the CWS, preceded by his father:
Matt Wallach, Cal St. Fullerton, 2007 and Matt Wallach, Cal St. Fullerton, 1979
…two games were won in a team’s final at-bat on the same day:
Stanford vs. Florida St. (16-5) & Georgia vs. Miami (FL) (7-4), 6-14-08

160
AT THE MCWS, THE LAST TIME….
…both games of a doubleheader ended with the same score:
Arizona St. vs. Nebraska, and Baylor vs. Tulane, 6-21-05 (8-7)
…a team rallied after trailing by four or more runs in the eighth inning or later in a CWS game:
UC Irvine vs. Arizona St., 8-7 (UC Irvine trailed 7-3 entering the bottom of the eighth inning, 6-19-07)
…a team overcame a three-run deficit to win a championship series game:
Georgia vs. Fresno St., 6-23-08 (Down 6-3 heading into the bottom of the 8th
inning, won 7-6)
…a team lost its 30th game of the year at the CWS:
Fresno St. vs. North Carolina, 6-21-08 (3-4)
…both benches left the dugout:
La.-Lafayette vs. Clemson, 6-14-00 (5-4)
…a player was ejected from a game:
Tyler Henley, cf, Rice vs. Oregon St., 7th inn., 6-21-06 (0-5)
…a coach was ejected from a game:
George Horton, Cal St. Fullerton vs. UC Irvine, 13th inn., 6-18-07 (4-5)
…an umpire was injured and was substituted for during a game:
David Wiley (Frank Sylvester), Fresno St. vs. North Carolina, bottom of the 4th
inn. 6-17-08 (5-3)
…there was a crowd of less than 10,000 for a game:
8,267, Wichita St. vs. Long Beach St., 6-1-91 (8-5, Game No. 4)
…there was a crowd of more than 30,000 for a game:
30.422, North Carolina vs. LSU, 6-19/20-08 (7-3, Game No. 10)

COACHING
RECORDS


163
ALL-TIME COACHING RECORDS BY SCHOOL (163 Coaches)
(1947-2008)
App. Won Lost Pct. CH 2nd 3rd 4th T5th T7th
ALABAMA
Tilden Campbell (1950) ............................................. 1 1 2 .333 0 0 0 0 1 0
Barry Shollenberger (1983) ....................................... 1 3 2 .600 0 1 0 0 0 0
Jim Wells (1996, 97, 99) ............................................ 3 7 6 .538 0 1 1 0 1 0
ARIZONA
Frank Sancet (1954, 55, 56, 58, 59, 60, 63,
66, 70) ............................................. 9 17 18 .486 0 3 1 1 2 2
Jerry Kindall (1976, 79, 80, 85, 86) ........................... 5 15 7 .682 3 0 0 0 1 1
Andy Lopez (2004) .................................................... 1 1 2 .333 0 0 0 0 1 0
ARIZONA ST.
Bobby Winkles (1964, 65, 67, 69) ............................. 4 16 5 .762 3 0 0 0 1 0
Jim Brock (1972, 73, 75, 76, 77, 78, 81, 83,
84, 87, 88, 93, 94) ................................... 13 36 24 .600 2 4 4 1 0 2
Pat Murphy (1998, 2005, 07) ..................................... 3 7 5 .583 0 1 1 0 1 0
ARKANSAS
Norm DeBriyn (1979, 85, 87, 89) .............................. 4 7 8 .467 0 1 1 0 2 0
Dave Van Horn (2004) .............................................. 1 0 2 .000 0 0 0 0 0 1
AUBURN
Paul Nix (1967, 76) .................................................... 2 2 4 .333 0 0 0 1 0 1
Hal Baird (1994, 97) .................................................. 2 1 4 .200 0 0 0 0 1 1
BAYLOR
Mickey Sullivan (1977, 78) ....................................... 2 0 4 .000 0 0 0 0 0 2
Steve Smith (2005) .................................................... 1 2 2 .500 0 0 1 0 0 0
BOSTON COLLEGE
John Tempoe (1953) .................................................. 1 2 2 .500 0 0 0 1 0 0
Ed Peligrini (60, 61, 67)............................................. 3 4 6 .400 0 0 1 0 2 0
BRADLEY
Leo Schrall (1950, 56) ............................................... 2 2 4 .333 0 0 1 0 0 1
BRIGHAM YOUNG
Glen Tuckett (1968, 71) ............................................. 2 1 4 .200 0 0 0 0 1 1
CALIFORNIA
Clint Evans (1947) ..................................................... 1 2 0 1.000 1 0 0 0 0 0
George Wolfman (1957) ............................................ 1 5 0 1.000 1 0 0 0 0 0
Bob Milano (1980, 88, 92)......................................... 3 3 6 .333 0 0 1 0 0 2
UC IRVINE
Dave Serrano (2007) .................................................. 1 2 2 .500 0 0 1 0 0 0
CAL ST. FULLERTON
Augie Garrido (1975, 79, 82, 84, 92, 94, 95) ............. 7 20 10 .667 3 1 1 0 0 2
Larry Cochell (1988, 90) ........................................... 2 2 4 .333 0 0 1 0 0 1
George Horton (1999, 01, 03, 04, 06, 07) .................. 6 12 11 .522 1 0 3 0 1 1
CAL ST. L.A.
Jack Deutsch (1977) .................................................. 1 2 2 .500 0 0 0 1 0 0
CITADEL
Chal Port (1990) ........................................................ 1 1 2 .333 0 0 0 0 1 0
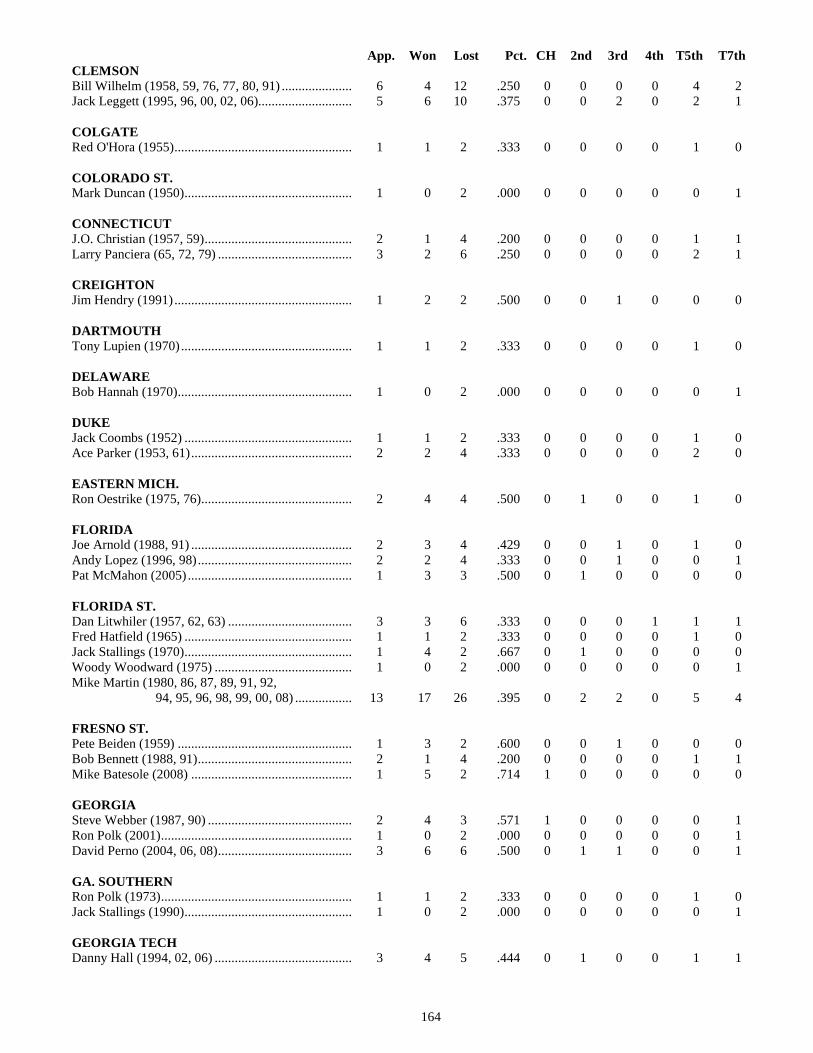
164
App. Won Lost Pct. CH 2nd 3rd 4th T5th T7th
CLEMSON
Bill Wilhelm (1958, 59, 76, 77, 80, 91) ..................... 6 4 12 .250 0 0 0 0 4 2
Jack Leggett (1995, 96, 00, 02, 06)............................ 5 6 10 .375 0 0 2 0 2 1
COLGATE
Red O'Hora (1955) ..................................................... 1 1 2 .333 0 0 0 0 1 0
COLORADO ST.
Mark Duncan (1950) .................................................. 1 0 2 .000 0 0 0 0 0 1
CONNECTICUT
J.O. Christian (1957, 59) ............................................ 2 1 4 .200 0 0 0 0 1 1
Larry Panciera (65, 72, 79) ........................................ 3 2 6 .250 0 0 0 0 2 1
CREIGHTON
Jim Hendry (1991) ..................................................... 1 2 2 .500 0 0 1 0 0 0
DARTMOUTH
Tony Lupien (1970) ................................................... 1 1 2 .333 0 0 0 0 1 0
DELAWARE
Bob Hannah (1970) .................................................... 1 0 2 .000 0 0 0 0 0 1
DUKE
Jack Coombs (1952) .................................................. 1 1 2 .333 0 0 0 0 1 0
Ace Parker (1953, 61) ................................................ 2 2 4 .333 0 0 0 0 2 0
EASTERN MICH.
Ron Oestrike (1975, 76)............................................. 2 4 4 .500 0 1 0 0 1 0
FLORIDA
Joe Arnold (1988, 91) ................................................ 2 3 4 .429 0 0 1 0 1 0
Andy Lopez (1996, 98) .............................................. 2 2 4 .333 0 0 1 0 0 1
Pat McMahon (2005) ................................................. 1 3 3 .500 0 1 0 0 0 0
FLORIDA ST.
Dan Litwhiler (1957, 62, 63) ..................................... 3 3 6 .333 0 0 0 1 1 1
Fred Hatfield (1965) .................................................. 1 1 2 .333 0 0 0 0 1 0
Jack Stallings (1970) .................................................. 1 4 2 .667 0 1 0 0 0 0
Woody Woodward (1975) ......................................... 1 0 2 .000 0 0 0 0 0 1
Mike Martin (1980, 86, 87, 89, 91, 92,
94, 95, 96, 98, 99, 00, 08) ................. 13 17 26 .395 0 2 2 0 5 4
FRESNO ST.
Pete Beiden (1959) .................................................... 1 3 2 .600 0 0 1 0 0 0
Bob Bennett (1988, 91) .............................................. 2 1 4 .200 0 0 0 0 1 1
Mike Batesole (2008) ................................................ 1 5 2 .714 1 0 0 0 0 0
GEORGIA
Steve Webber (1987, 90) ........................................... 2 4 3 .571 1 0 0 0 0 1
Ron Polk (2001) ......................................................... 1 0 2 .000 0 0 0 0 0 1
David Perno (2004, 06, 08) ........................................ 3 6 6 .500 0 1 1 0 0 1
GA. SOUTHERN
Ron Polk (1973) ......................................................... 1 1 2 .333 0 0 0 0 1 0
Jack Stallings (1990) .................................................. 1 0 2 .000 0 0 0 0 0 1
GEORGIA TECH Danny Hall (1994, 02, 06) ......................................... 3 4 5 .444 0 1 0 0 1 1

165
App. Won Lost Pct. CH 2nd 3rd 4th T5th T7th
HARVARD
Loyal Park (1968, 71, 73, 74) .................................... 4 1 8 .111 0 0 0 0 1 3
HAWAII
Les Murakami (1980) ................................................ 1 3 2 .600 0 1 0 0 0 0
HOLY CROSS
Jack Barry (1952, 58) ................................................ 2 8 3 .727 1 0 1 0 0 0
Albert Riopel (1962, 63) ............................................ 2 1 4 .200 0 0 0 0 1 1
HOUSTON
Lovette Hill (1953, 67) .............................................. 2 3 4 .429 0 1 0 0 0 1
INDIANA ST.
Bob Warn (1986) ....................................................... 1 0 2 .000 0 0 0 0 0 1
IOWA
Duane Banks (1972) .................................................. 1 0 2 .000 0 0 0 0 0 1
IOWA ST.
Cap Timm (1957, 70) ................................................ 2 3 4 .429 0 0 1 0 1 0
ITHACA
Bucky Freeman (1962) .............................................. 1 1 2 .333 0 0 0 0 1 0
JAMES MADISON
Brad Babcock (1983) ................................................. 1 0 2 .000 0 0 0 0 0 1
KANSAS
Dave Bingham (1993) ................................................ 1 0 2 .000 0 0 0 0 0 1
LAFAYETTE
Charlie Gelbert (1953, 54, 58, 65). ............................ 4 3 8 .273 0 0 1 0 0 3
LONG BEACH ST.
Dave Snow (1989, 91, 93, 98) ................................... 4 6 8 .429 0 0 2 0 1 1
LA.-LAFAYETTE
Tony Robichaux (2000) ............................................. 1 2 2 .500 0 0 1 0 0 0
LSU
Skip Bertman (1986, 87, 89, 90, 91, 93,
94, 96, 97, 98, 00) ........................... 11 29 13 .690 5 0 3 1 1 1
Smoke Laval (2003, 04)............................................. 2 0 4 .000 0 0 0 0 0 2
Paul Mainieri (2008) .................................................. 1 1 2 .333 0 0 0 0 1 0
LOUISVILLE
Dan McDonnell (2007) .............................................. 1 1 2 .333 0 0 0 0 1 0
LOYOLA MARYMOUNT
Dave Snow (1986) ..................................................... 1 1 2 .333 0 0 0 0 1 0
MAINE
John Butterfield (1964) .............................................. 1 3 2 .600 0 0 1 0 0 0
John Winkin (1976, 81, 82, 83, 84, 86) ..................... 6 4 12 .250 0 0 1 1 0 4
MASSACHUSETTS
Dick Bergquist (1954, 69) ......................................... 2 2 4 .333 0 0 0 0 2 0

166
App. Won Lost Pct. CH 2nd 3rd 4th T5th T7th
MIAMI (FL)
Ron Fraser (1974, 78, 79, 80, 81, 82, 84, 85,
86, 88, 89, 92) ..................................... 12 26 21 .553 2 1 3 1 4 1
Jim Morris (1994, 95, 96, 97, 98, 99, 01, 03, 04, 06,
08) ....................................................... 11 21 17 .553 2 1 2 0 6 0
MICHIGAN
Ray Fisher (1953) ...................................................... 1 4 1 .800 1 0 0 0 0 0
Don Lund (1962) ....................................................... 1 4 1 .800 1 0 0 0 0 0
Moby Benedict (1978) ............................................... 1 1 2 .333 0 0 0 0 1 0
Bud Middaugh (1980, 81, 83, 84) .............................. 4 3 8 .273 0 0 1 0 1 2
MICHIGAN ST.
John Kobs (1954) ....................................................... 1 3 2 .600 0 0 1 0 0 0
MINNESOTA
Dick Siebert (1956, 60, 64, 73, 77) ............................ 5 17 7 .708 3 0 1 0 1 0
MISSISSIPPI
Tom Swayze (1956, 64, 69) ....................................... 3 3 6 .333 0 0 1 0 1 1
Jake Gibbs (1972) ...................................................... 1 0 2 .000 0 0 0 0 0 1
MISSISSIPPI ST.
Paul Gregory (1971) .................................................. 1 0 2 .000 0 0 0 0 0 1
Ron Polk (1979, 81, 85, 90, 97, 2007) ....................... 6 6 12 .333 0 0 1 0 4 1
Pat McMahon (1998) ................................................. 1 1 2 .333 0 0 0 0 1 0
MISSOURI
Hi Simmons (1952, 54, 58, 62, 63, 64) ...................... 6 18 11 .621 1 3 1 0 0 1
MISSOURI ST.
Keith Guttin (2003) .................................................... 1 0 2 .000 0 0 0 0 0 1
NEBRASKA
Dave Van Horn (2001, 02) ........................................ 2 0 4 .000 0 0 0 0 0 2
Mike Anderson (2005) ............................................... 1 1 2 .333 0 0 0 0 1 0
NEW HAMPSHIRE
Hank Swasey (1956) .................................................. 1 1 2 .333 0 0 0 0 1 0
NEW ORLEANS
Ron Maestri (1984) .................................................... 1 1 2 .333 0 0 0 0 1 0
NEW YORK U.
Bill McCarthy (1956) ................................................ 1 0 2 .000 0 0 0 0 0 1
Larry Geracioti (1969) ............................................... 1 3 2 .600 0 0 1 0 0 0
NORTH CAROLINA
Walt Rabb (1960, 66) ................................................ 2 0 4 .000 0 0 0 0 0 2
Mike Roberts (1978, 89) ............................................ 2 2 4 .333 0 0 1 0 0 1
Mike Fox (2006, 07, 08) ............................................ 3 11 7 .611 0 2 1 0 0 0
NORTH CAROLINA ST.
Sam Esposito (1968) .................................................. 1 2 2 .500 0 0 1 0 0 0
NORTHEASTERN
John Connelly (1966) ................................................ 1 0 2 .000 0 0 0 0 0 1
NORTHERN COLO.
Pete Butler (1952, 53, 55, 57, 58, 59, 60,
61, 62) ................................................. 9 2 18 .100 0 0 0 0 2 7
Tom Petroff (1974) .................................................... 1 1 2 .333 0 0 0 0 1 0

167
App. Won Lost Pct. CH 2nd 3rd 4th T5th T7th
NOTRE DAME
Jake Kline (1957) ....................................................... 1 2 2 .500 0 0 1 0 0 0
Paul Mainieri (2002) .................................................. 1 1 2 .333 0 0 0 0 1 0
OHIO
Robert Wren (1970) ................................................... 1 2 2 .500 0 0 0 1 0 0
OHIO ST.
Marty Karow (1951, 65, 66, 67) ................................ 4 9 7 .563 1 1 0 0 0 2
OKLAHOMA
Jack Baer (1951) ........................................................ 1 4 0 1.000 1 0 0 0 0 0
Enos Semore (1972, 73, 74, 75, 76,) .......................... 5 5 10 .333 0 0 0 1 3 1
Larry Cochell (1992, 94, 95) ..................................... 3 5 4 .556 1 0 0 0 1 1
OKLAHOMA ST.
Toby Greene (1954, 55, 59, 60, 61). .......................... 5 15 9 .625 1 1 2 1 0 0
Chet Bryan (1966, 67, 68) ......................................... 3 4 6 .400 0 1 0 0 1 1
Gary Ward (1981, 82, 83, 84, 85, 86, 87, 90,
93, 96) .................................................. 10 19 19 .500 0 3 2 1 3 1
Tom Holliday (1999) ................................................. 1 0 2 .000 0 0 0 0 0 1
ORAL ROBERTS
Larry Cochell (1978) ................................................. 1 1 2 .333 0 0 0 0 1 0
OREGON
Don Kirsch (1954) ..................................................... 1 0 2 .000 0 0 0 0 0 1
OREGON ST.
Ralph Coleman (1952) ............................................... 1 0 2 .000 0 0 0 0 0 1
Pat Casey (2005, 06, 07) ............................................ 3 11 4 .733 2 0 0 0 0 1
PENN ST.
Joe Bedenk (1952, 57, 59) ......................................... 3 7 6 .538 0 1 1 1 0 0
Chuck Medlar (1963, 73) ........................................... 2 1 4 .200 0 0 0 0 1 1
PEPPERDINE
Dave Gorrie (1979) .................................................... 1 3 2 .600 0 0 1 0 0 0
Andy Lopez (1992) .................................................... 1 4 0 1.000 1 0 0 0 0 0
PRINCETON
Emerson Dickman (1951) .......................................... 1 0 2 .000 0 0 0 0 0 1
RICE
Wayne Graham (1997, 99, 02, 03, 06, 07, 08) ........... 7 10 13 .435 1 0 2 0 1 3
RIDER
Tom Petroff (1967) .................................................... 1 1 2 .333 0 0 0 0 1 0
ROLLINS
Joe Justice (1954) ...................................................... 1 3 2 .600 0 1 0 0 0 0
RUTGERS
George Case (1950) ................................................... 1 3 2 .600 0 0 1 0 0 0
ST. JOHN'S (N.Y.)
Frank McGuire (1949) ............................................... 1 0 2 .000 0 0 0 1 0 0
Jack Kaiser (1960, 66, 68) ......................................... 3 5 6 .455 0 0 1 1 1 0
Joe Russo (1978, 80) .................................................. 2 1 4 .200 0 0 0 0 1 1

168
App. Won Lost Pct. CH 2nd 3rd 4th T5th T7th
ST. LOUIS
Roy Lee (1965) .......................................................... 1 2 2 .500 0 0 1 0 0 0
SAN JOSE ST.
Sam Piraro (2000) ...................................................... 1 0 2 .000 0 0 0 0 0 1
SANTA CLARA
Paddy Cottrell (1962) ................................................ 1 4 2 .667 0 1 0 0 0 0
SETON HALL
Owen Carroll (1964, 71) ............................................ 2 1 4 .200 0 0 0 0 1 1
Mike Sheppard (1974, 75) ......................................... 2 1 4 .200 0 0 0 0 1 1
SOUTH CAROLINA
Bobby Richardson (1975) .......................................... 1 4 2 .667 0 1 0 0 0 0
June Raines (1977, 81, 82, 85) ................................... 4 5 8 .385 0 1 0 1 0 2
Ray Tanner (2002, 03, 04) ......................................... 3 8 6 .571 0 1 1 0 1 0
SOUTHERN CALIFORNIA
Sam Barry (1948, 49) ................................................ 2 3 3 .500 1 0 1 0 0 0
Rod Dedeaux (1951, 55, 58, 60, 61, 63, 64,
66, 68, 70, 71, 72, 73, 74, 78) .......... 15 60 16 .789 10 1 2 1 0 1
Mike Gillespie (1995, 98, 00, 01) .............................. 4 11 7 .611 1 1 1 0 1 0
SOUTHERN ILL.
Joe Lutz (1968, 69) .................................................... 2 3 4 .429 0 1 0 0 0 1
Richard "Itchy" Jones (1971, 74, 77) ......................... 3 9 6 .600 0 1 2 0 0 0
SPRINGFIELD
Archie Allen (1951, 55) ............................................. 2 1 4 .200 0 0 0 0 1 1
STANFORD
Everett Dean (1953) ................................................... 1 1 2 .333 0 0 0 0 1 0
Dutch Fehring (1967) ................................................ 1 3 2 .600 0 0 1 0 0 0
Mark Marquess (1982, 83, 85, 87, 88, 90, 95, 97,
99, 00, 01, 02, 03, 08) ................. 14 36 25 .590 2 3 5 0 4 0
SYRACUSE
Ted Kleinhans (1961) ................................................ 1 2 2 .500 0 0 1 0 0 0
TEMPLE
Skip Wilson (1972, 77) .............................................. 2 2 4 .333 0 0 1 0 0 1
TENNESSEE
S.W. Anderson (1951) ............................................... 1 4 2 .667 0 1 0 0 0 0
Rod Delmonico (1995, 01, 05) .................................. 3 4 6 .400 0 0 2 0 0 1
TEXAS
Bibb Falk (1949, 50, 52, 53, 57, 61, 62, 63,
65, 66) .................................................... 10 20 17 .541 2 1 2 0 3 2
Cliff Gustafson (1968, 69, 70, 72, 73, 74, 75,
79, 81, 82, 83, 84, 85, 87,
89, 92, 93) ..................................... 17 44 30 .595 2 3 7 3 2 0
Augie Garrido (2000, 02, 03, 04, 05) ......................... 5 14 6 .700 2 1 1 0 0 1
TEXAS A&M
Beau Bell (1951) ........................................................ 1 1 2 .333 0 0 0 0 1 0
Tom Chandler (1964) ................................................ 1 0 2 .000 0 0 0 0 0 1
Mark Johnson (1993, 99) ........................................... 2 1 4 .200 0 0 0 0 1 1

169
App. Won Lost Pct. CH 2nd 3rd 4th T5th T7th
TEX.-PAN AMERICAN
Al Olgletree (1971) .................................................... 1 2 2 .500 0 0 0 1 0 0
TUFTS
John Ricker (1950) .................................................... 1 1 2 .333 0 0 0 0 1 0
TULANE
Rick Jones (2001, 05) ................................................ 2 2 4 .333 0 0 0 0 2 0
TULSA
Gene Shell (1969, 71) ................................................ 2 6 4 .600 0 1 1 0 0 0
UCLA
Art Reichle (1969) ..................................................... 1 0 2 .000 0 0 0 0 0 1
Gary Adams (1997) ................................................... 1 0 2 .000 0 0 0 0 0 1
UTAH
Pete Carlson (1951) ................................................... 1 2 2 .500 0 0 1 0 0 0
WAKE FOREST
Taylor Sanford (1949, 55) ......................................... 2 7 3 .700 1 1 0 0 0 0
WASHINGTON ST.
Arthur Bailey (1950, 56) ............................................ 2 3 4 .429 0 1 0 0 0 1
Bobo Brayton (1965, 76) ........................................... 2 3 4 .429 0 0 1 0 1 0
WESTERN MICH.
Charlie Mahr (1952, 55, 58, 59, 61, 63)..................... 6 9 12 .429 0 1 2 0 2 1
WICHITA ST.
Gene Stephenson (1982, 88, 89, 91, 92,
93, 96) ................................. 7 16 11 .593 1 3 1 0 0 2
WISCONSIN
Arthur Mansfield (1950) ............................................ 1 2 2 .500 0 0 0 1 0 0
WYOMING
Bud Daniel (1956) ..................................................... 1 1 2 .333 0 0 0 0 1 0
YALE
Ethan Allen (1947, 48)............................................... 2 1 4 .200 0 2 0 0 0 0
TOTALS 480 872 872 .500 62 62 *97 23 118 118
*Includes ties for third

170
ALL-TIME COACHING RECORDS-- ALPHABETICAL
(1947-2008)
Coach School Years App. Won Lost Pct.
Gary Adams UCLA 1997 1 0 2 .000
Archie Allen Springfield 1951, 55 2 1 4 .200
Ethan Allen Yale 1947, 48 2 1 4 .200
Mike Anderson Nebraska 2005 1 1 2 .333
S.W. Anderson Tennessee 1951 1 4 2 .667
Jim Arnold Florida 1988, 91 2 3 4 .429
Brad Babcock James Madison 1983 1 0 2 .000
Jack Baer Oklahoma 1951 1 4 0 1.000
Mike Batesole Fresno St. 2008 1 5 2 .714
Arthur Bailey Washington St. 1950, 56 2 3 4 .429
Hal Baird Auburn 1994, 97 2 1 4 .200
Duane Banks Iowa 1972 1 0 2 .000
Jack Barry Holy Cross 1952, 58 2 8 3 .727
Sam Barry USC 1948, 49 2 3 3 .500
Joe Bedenk Penn St. 1952, 57, 59 3 7 6 .538
Pete Beiden Fresno St. 1959 1 3 2 .600
Beau Bell Texas A&M 1951 1 1 2 .333
Moby Benedict Michigan 1978 1 1 2 .333
Bob Bennett Fresno St. 1988, 91 2 1 4 .200
Dick Bergquist Massachusetts 1954, 69 2 2 4 .333
Skip Bertman LSU 1986, 87, 89, 90, 91, 93, 94, 96, 97, 98, 2000 11 29 13 .690
Dave Bingham Kansas 1993 1 0 2 .000
Bobo Brayton Washington St. 1965, 76 2 3 4 .429
Jim Brock Arizona St. 1972, 73, 75, 76, 77, 78, 81, 83, 84, 87, 88, 93, 94 13 36 24 .600
Chet Bryan Oklahoma St. 1966, 67, 68 3 4 6 .400
Pete Butler Northern Colo. 1952, 53, 55, 57, 58, 59, 60, 61, 62 9 2 18 .100
John Butterfield Maine 1964 1 3 2 .600
Tilden Campbell Alabama 1950 1 1 2 .333
Pete Carlson Utah 1951 1 2 2 .500
Owen Carroll Seton Hall 1964, 71 2 1 4 .200
George Case Rutgers 1950 1 3 2 .600
Pat Casey Oregon St. 2005, 06 , 07 3 11 4 .733
Tom Chandler Texas A&M 1964 1 0 2 .000
J.O. Christian Connecticut 1957, 59 2 1 4 .200
Larry Cochell Cal St. Fullerton 1988, 90 2 2 4 .333
Larry Cochell Oklahoma 1992, 94, 95 3 5 4 .556
Larry Cochell Oral Roberts 1978 1 1 2 .333
COCHELL TOTAL 6 8 10 .444
Ralph Coleman Oregon St. 1952 1 0 2 .000
John Connelly Northeastern 1966 1 0 2 .000
Jack Coombs Duke 1952 1 1 2 .333
Paddy Cottrell Santa Clara 1962 1 4 2 .667
Bud Daniel Wyoming 1956 1 1 2 .333

171
Coach School Years App. Won Lost Pct.
Everett Dean Stanford 1953 1 1 2 .333
Norm DeBriyn Arkansas 1979, 85, 87, 89 4 7 8 .467
Rod Dedeaux USC 1951,55,58,60,61,63,64,66,68,70,71,72,73,74,78 15 60 16 .789
Rod Delmonico Tennessee 1995, 2001, 05 3 4 6 .400
Jack Deutsch Cal St. L.A. 1977 1 2 2 .500
Mark Duncan Colorado St. 1950 1 0 2 .000
Emerson Dickman Princeton 1951 1 0 2 .000
Sam Esposito North Caro. St. 1968 1 2 2 .500
Clint Evans California 1947 1 2 0 1.000
Bib Falk Texas 1949, 50, 52, 53, 57, 61, 62, 63, 65, 66 10 20 17 .541
Dutch Fehring Stanford 1967 1 3 2 .600
Ray Fisher Michigan 1953 1 4 1 .800
Mike Fox North Carolina 2006, 07 , 08 3 11 7 .611
Ron Fraser Miami (FL) 1974, 78, 79, 80, 81, 82, 84, 85, 86, 88, 89, 92 12 26 21 .553
Bucky Freeman Ithaca 1962 1 1 2 .333
Augie Garrido Cal St. Fullerton 1975, 79, 82, 84, 92, 94, 95 7 20 10 .667
Augie Garrido Texas 2000, 02, 03, 04, 05 5 14 6 .700
GARRIDO TOTAL 12 34 16 .680
Charlie Gelbert Lafayette 1953, 54, 58, 65 4 3 8 .273
Larry Geracioti New York U. 1969 1 3 2 .600
Jake Gibbs Mississippi 1972 1 0 2 .000
Mike Gillespie USC 1995, 98, 2000, 01 4 11 7 .611
Dave Gorrie Pepperdine 1979 1 3 2 .600
Wayne Graham Rice 1997, 99, 2002, 03, 06, 07, 08 7 10 13 .435
Toby Greene Oklahoma St. 1954, 55, 59, 60, 61 5 15 9 .625
Paul Gregory Mississippi St. 1971 1 0 2 .000
Cliff Gustafson Texas 1968,69,70,72,73,74,75,79,81,82,83,84,85,87,89,92,93 17 44 30 .595
Keith Guttin Missouri St. 2003 1 0 2 .000
Danny Hall Georgia Tech 1994, 2002, 06 3 4 5 .444
Bob Hannah Delaware 1970 1 0 2 .000
Fred Hatfield Florida St. 1965 1 1 2 .333
Jim Hendry Creighton 1991 1 2 2 .500
Lovette Hill Houston 1953, 67 2 3 4 .429
Tom Holliday Oklahoma St. 1999 1 0 2 .000
George Horton Cal St. Fullerton 1999, 2001, 03, 04, 06, 07 6 12 11 .522
Mark Johnson Texas A&M 1993, 99 2 1 4 .200
Richard “Itchy” Jones Southern Ill. 1971, 74, 77 3 9 6 .600
Rick Jones Tulane 2001, 05 2 2 4 .333
Joe Justice Rollins 1954 1 3 2 .600
Jack Kaiser St. John’s (N.Y.) 1960, 66, 68 3 5 6 .455
Marty Karow Ohio St. 1951, 65, 66, 67 4 9 7 .563
Jerry Kindall Arizona 1976, 79, 80, 85, 86 5 15 7 .682
Don Kirsch Oregon 1954 1 0 2 .000
Ted Kleinhans Syracuse 1961 1 2 2 .500
Jake Kline Notre Dame 1957 1 2 2 .500
John Kobs Michigan St. 1954 1 3 2 .600
Smoke Laval LSU 2003, 04 2 0 4 .000
Roy Lee St. Louis 1965 1 2 2 .500
Jack Leggett Clemson 1995, 96, 2000, 02, 06 5 6 10 .375
Dan Litwhiler Florida St. 1957, 62, 63 3 3 6 .333

172
Coach School Years App. Won Lost Pct.
Andy Lopez Arizona 2004 1 1 2 .333
Andy Lopez Florida 1996, 98 2 2 4 .333
Andy Lopez Pepperdine 1992 1 4 0 1.000
LOPEZ TOTAL 4 7 6 .538
Don Lund Michigan 1962 1 4 1 .800
Tony Lupien Dartmouth 1970 1 1 2 .333
Joe Lutz Southern Ill. 1968, 69 2 3 4 .429
Ron Maestri New Orleans 1984 1 1 2 .333
Charlie Mahr Western Mich. 1952, 55, 58, 59, 61, 63 6 9 12 .429
Paul Mainieri Notre Dame 2002 1 1 2 .333
Paul Mainieri LSU 2008 1 1 2 .333
MAINIERI TOTAL 2 2 4 .333
Arthur Mansfield Wisconsin 1950 1 2 2 .500
Mark Marquess Stanford 1982, 83, 85, 87, 88, 90, 95, 97, 99, 2000, 01,
02, 03, 08 14 36 25 .590
Mike Martin Florida St. 1980, 86, 87, 89, 91, 92, 94, 95, 96, 98, 99,
2000, 08 13 17 26 .395
Bill McCarthy New York U. 1956 1 0 2 .000
Dan McDonnell Louisville 2007 1 1 2 .333
Frank McGuire St. John’s (N.Y.) 1949 1 0 2 .000
Pat McMahon Florida 2005 1 3 3 .500
Pat McMahon Mississippi St. 1998 1 0 2 .000
MCMAHON TOTAL 2 3 5 .375
Chuck Medlar Penn St. 1963, 73 2 1 4 .200
Bud Middaugh Michigan 1980, 81, 83, 84 4 3 8 .273
Bob Milano California 1980, 88, 92 3 3 6 .333
Jim Morris Miami (FL) 1994, 95, 96, 97, 98, 99, 2001, 03, 04, 06, 08 11 21 17 .553
Les Murakami Hawaii 1980 1 3 2 .600
Pat Murphy Arizona St. 1998, 2005, 07 3 7 5 .583
Paul Nix Auburn 1967, 76 2 2 4 .333
Ron Oestrike Eastern Mich. 1975, 76 2 4 4 .500
Red O’Hora Colgate 1955 1 1 2 .333
Al Olgletree Tex.-Pan Am. 1971 1 2 2 .500
Larry Panciera Connecticut 1965, 72, 79 3 2 6 .250
Loyal Park Harvard 1968, 71, 73, 74 4 1 8 .111
Ace Parker Duke 1953, 61 2 2 4 .333
Ed Peligrini Boston College 1960, 61, 67 3 4 6 .400
David Perno Georgia 2004, 06 , 08 3 6 6 .500
Tom Petroff Northern Colo. 1974 1 1 2 .333
Tom Petroff Rider 1967 1 1 2 .333
PETROFF TOTAL 1 2 4 .333
Sam Piraro San Jose St. 2000 1 0 2 .000
Ron Polk Georgia 2001 1 0 2 .000
Ron Polk Ga. Southern 1973 1 1 2 .333
Ron Polk Mississippi St. 1979, 81, 85, 90, 97, 2007 6 6 12 .333
POLK TOTAL 8 7 16 .304
Chal Port Citadel 1990 1 1 2 .333
Walt Rabb North Carolina 1960, 66 2 0 4 .000
June Raines South Carolina 1977, 81, 82, 85 4 5 8 .385

173
Coach School Years App. Won Lost Pct.
Art Reichle UCLA 1969 1 0 2 .000
Bobby Richardson South Carolina 1975 1 4 2 .667
John Ricker Tufts 1950 1 1 2 .333
Albert Riopel Holy Cross 1962, 63 2 1 4 .200
Mike Roberts North Carolina 1978, 89 2 2 4 .333
Tony Robichaux La.-Lafayette 2000 1 2 2 .500
Joe Russo St. John’s (N.Y.) 1978, 80 2 1 4 .200
Frank Sancet Arizona 1954, 55, 56, 58, 59, 60, 63, 66, 70 9 17 18 .486
Taylor Sanford Wake Forest 1949, 55 2 7 3 .700
Leo Schrall Bradley 1950, 56 2 2 4 .333
Enos Semore Oklahoma 1972, 73, 74, 75, 76 5 5 10 .333
Dave Serrano UC Irvine 2007 1 2 2 .500
Gene Shell Tulsa 1969, 71 2 6 4 .600
Mike Sheppard Seton Hall 1974, 75 2 1 4 .200
Barry Shollenberger Alabama 1983 1 3 2 .600
Dick Siebert Minnesota 1956, 60, 64, 73, 77 5 17 7 .708
Hi Simmons Missouri 1952, 54, 58, 62, 63, 64 6 18 11 .621
Steve Smith Baylor 2005 1 2 2 .500
Dave Snow Long Beach St. 1989, 91, 93, 98 4 6 8 .429
Dave Snow Loyola Mary. 1986 1 1 2 .333
SNOW TOTAL 5 7 10 .412
Jack Stallings Florida St. 1970 1 4 2 .667
Jack Stallings Ga. Southern 1990 1 0 2 .000
STALLINGS TOTAL 2 4 4 .500
Gene Stephenson Wichita St. 1982, 88, 89, 91, 92, 93, 96 7 16 11 .593
Mickey Sullivan Baylor 1977, 78 2 0 4 .000
Hank Swasey New Hampshire 1956 1 1 2 .333
Tom Swayze Mississippi 1956, 64, 69 3 3 6 .333
Ray Tanner South Carolina 2002, 03, 04 3 8 6 .571
John Tempoe Boston College 1953 1 2 2 .500
Cap Timm Iowa St. 1957, 70 2 3 4 .429
Glen Tuckett Brigham Young 1968, 71 2 1 4 .200
Dave Van Horn Arkansas 2004 1 0 2 .000
Dave Van Horn Nebraska 2001, 02 2 0 4 .000
VAN HORN TOTAL 3 0 6 .000
Gary Ward Oklahoma St. 1981, 82, 83, 84, 85, 86, 87, 90, 93, 96 10 19 19 .500
Bob Warn Indiana St. 1986 1 0 2 .000
Steve Webber Georgia 1987, 90 2 4 3 .571
Jim Wells Alabama 1996, 97, 99 3 7 6 .538
Bill Wilhelm Clemson 1958, 59, 76, 77, 80, 91 6 4 12 .250
Skip Wilson Temple 1972, 77 2 2 4 .333
John Winkin Maine 1976, 81, 82, 83, 84, 86 6 4 12 .250
Bobby Winkles Arizona St. 1964, 65, 67, 69 4 16 5 .762
George Wolfman California 1957 1 5 0 1.000
Woody Woodward Florida St. 1975 1 0 2 .000
Robert Wren Ohio 1970 1 2 2 .500

174
COACHING LEADERS BY CATEGORY
APPEARANCES
17 Cliff Gustafson, Texas
15 Rod Dedeaux, Southern California
14 Mark Marquess, Stanford
13 Jim Brock, Arizona St.
13 Mike Martin, Florida St.
12 Ron Fraser, Miami (FL)
12 Augie Garrido, Cal St. Fullerton (7), Texas (5)
11 Skip Bertman, LSU
11 Jim Morris, Miami (FL)
10 Bibb Falk, Texas
10 Gary Ward, Oklahoma St.
9 Pete Butler, Northern Colo.
9 Frank Sancet, Arizona
8 Ron Polk, Ga. Southern (1), Mississippi St. (6), Georgia (1)
7 Wayne Graham, Rice
7 Gene Stephenson, Wichita St.
6 Larry Cochell, Cal St. Fullerton (2), Oklahoma (3), Oral
Roberts (1)
6 George Horton, Cal St. Fullerton
6 Charlie Mahr, Western Mich.
6 Hi Simmons, Missouri
6 Bill Wilhelm, Clemson
6 John Winkin, Maine
GAMES
76 Rod Dedeaux, Southern California
74 Cliff Gustafson, Texas
60 Jim Brock, Arizona St.
59 Mark Marquess, Stanford
50 Augie Garrido, Cal St. Fullerton (30), Texas (20)
47 Ron Fraser, Miami (FL)
43 Mike Martin, Florida St.
42 Skip Bertman, LSU
38 Gary Ward, Oklahoma St.
37 Bibb Falk, Texas
36 Jim Morris, Miami (FL)
35 Frank Sancet, Arizona
29 Hi Simmons, Missouri
27 Gene Stephenson, Wichita St.
24 Dick Siebert, Minnesota
24 Toby Greene, Oklahoma St.
TITLES
10 Rod Dedeaux, Southern California
5 Skip Bertman, LSU
5 Augie Garrido, Cal St. Fullerton (3), Texas (2)
3 Jerry Kindall, Arizona
3 Dick Siebert, Minnesota
3 Bobby Winkles, Arizona St.
WINNING PERCENTAGE
(Min. 20 Games)
.789 (60-16) Rod Dedeaux, Southern California
.762 (16-5) Bobby Winkles, Arizona St.
.708 (17-7) Dick Siebert, Minnesota
.690 (29-13) Skip Bertman, LSU
.682 (15-7) Jerry Kindall, Arizona
.680(34-16) Augie Garrido, Cal St. Fullerton/Texas
.625 (15-9) Toby Greene, Oklahoma St.
.621 (18-11) Hi Simmons, Missouri
.600 (36-24) Jim Brock, Arizona St.
.595 (44-30) Cliff Gustafson, Texas
.593 (16-11) Gene Stephenson, Wichita St.
.590 (36-25) Mark Marquess, Stanford
.553 (26-21) Ron Fraser, Miami (FL)
.553 (21-17) Jim Morris, Miami (FL)
.541 (20-17) Bibb Falk, Texas
VICTORIES
60 Rod Dedeaux, Southern California
44 Cliff Gustafson, Texas
36 Jim Brock, Arizona St.
36 Mark Marquess, Stanford
34 Augie Garrido, Cal St. Fullerton/Texas
29 Skip Bertman, LSU
26 Ron Fraser, Miami (FL)
21 Jim Morris, Miami (FL)
20 Bibb Falk, Texas
19 Gary Ward, Oklahoma St.
18 Hi Simmons, Missouri
17 Frank Sancet, Arizona
17 Dick Siebert, Minnesota
16 Bobby Winkles, Arizona St.
16 Gene Stephenson, Wichita St.
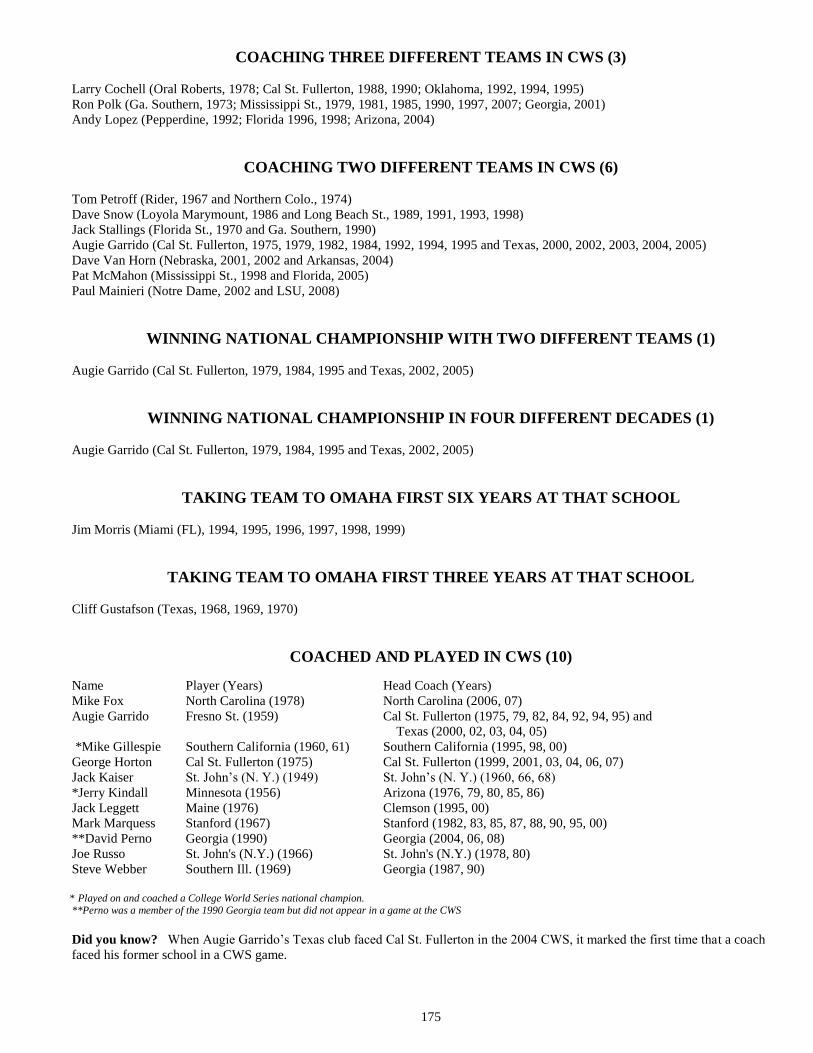
175
COACHING THREE DIFFERENT TEAMS IN CWS (3)
Larry Cochell (Oral Roberts, 1978; Cal St. Fullerton, 1988, 1990; Oklahoma, 1992, 1994, 1995)
Ron Polk (Ga. Southern, 1973; Mississippi St., 1979, 1981, 1985, 1990, 1997, 2007; Georgia, 2001)
Andy Lopez (Pepperdine, 1992; Florida 1996, 1998; Arizona, 2004)
COACHING TWO DIFFERENT TEAMS IN CWS (6)
Tom Petroff (Rider, 1967 and Northern Colo., 1974)
Dave Snow (Loyola Marymount, 1986 and Long Beach St., 1989, 1991, 1993, 1998)
Jack Stallings (Florida St., 1970 and Ga. Southern, 1990)
Augie Garrido (Cal St. Fullerton, 1975, 1979, 1982, 1984, 1992, 1994, 1995 and Texas, 2000, 2002, 2003, 2004, 2005)
Dave Van Horn (Nebraska, 2001, 2002 and Arkansas, 2004)
Pat McMahon (Mississippi St., 1998 and Florida, 2005)
Paul Mainieri (Notre Dame, 2002 and LSU, 2008)
WINNING NATIONAL CHAMPIONSHIP WITH TWO DIFFERENT TEAMS (1)
Augie Garrido (Cal St. Fullerton, 1979, 1984, 1995 and Texas, 2002, 2005)
WINNING NATIONAL CHAMPIONSHIP IN FOUR DIFFERENT DECADES (1)
Augie Garrido (Cal St. Fullerton, 1979, 1984, 1995 and Texas, 2002, 2005)
TAKING TEAM TO OMAHA FIRST SIX YEARS AT THAT SCHOOL
Jim Morris (Miami (FL), 1994, 1995, 1996, 1997, 1998, 1999)
TAKING TEAM TO OMAHA FIRST THREE YEARS AT THAT SCHOOL
Cliff Gustafson (Texas, 1968, 1969, 1970)
COACHED AND PLAYED IN CWS (10)
Name Player (Years) Head Coach (Years)
Mike Fox North Carolina (1978) North Carolina (2006, 07)
Augie Garrido Fresno St. (1959) Cal St. Fullerton (1975, 79, 82, 84, 92, 94, 95) and
Texas (2000, 02, 03, 04, 05)
*Mike Gillespie Southern California (1960, 61) Southern California (1995, 98, 00)
George Horton Cal St. Fullerton (1975) Cal St. Fullerton (1999, 2001, 03, 04, 06, 07)
Jack Kaiser St. John’s (N. Y.) (1949) St. John’s (N. Y.) (1960, 66, 68)
*Jerry Kindall Minnesota (1956) Arizona (1976, 79, 80, 85, 86)
Jack Leggett Maine (1976) Clemson (1995, 00)
Mark Marquess Stanford (1967) Stanford (1982, 83, 85, 87, 88, 90, 95, 00)
**David Perno Georgia (1990) Georgia (2004, 06, 08)
Joe Russo St. John's (N.Y.) (1966) St. John's (N.Y.) (1978, 80)
Steve Webber Southern Ill. (1969) Georgia (1987, 90)
* Played on and coached a College World Series national champion.
**Perno was a member of the 1990 Georgia team but did not appear in a game at the CWS
Did you know? When Augie Garrido’s Texas club faced Cal St. Fullerton in the 2004 CWS, it marked the first time that a coach
faced his former school in a CWS game.


REGIONAL/
SUPER REGIONAL
RESULTS


179
ALL-TIME REGIONAL/DISTRICT AND SUPER REGIONAL WON-LOST RECORDS
(272 Teams)
NOTE: Before 1954, district playoff games were not considered a part of the national collegiate baseball championship. As a result,
only district/playoff games from 1954 to the present, are included in the record column. Super Regionals began in 1999. CWS WON-
LOST RECORDS ARE LISTED ON PAGES 17-19, AND ARE NOT INCLUDED IN THE FOLLOWING TOTALS.
Regional/District and Super Regional Record
TEAM (Years Participated) YRS. WON LOST PCT.
AIR FORCE
(1961-62-64-66-67-69) ............................................................................................. 6 8 12 .400
AKRON
(1996)......................................................................................................................... 1 0 2 .000
ALABAMA
(1950-68-83-86-91-95-96-97-98-99-00-02-03-05-06-08) ........................................ 16 40 22 .645
UAB
(1991)........................................................................................................................ 1 1 2 .333
ALBANY
(2007)......................................................................................................................... 1 0 2 .000
ALMA
(1955-57) ................................................................................................................... 2 1 4 .200
AMERICAN INT’L
(1960)........................................................................................................................ 1 0 1 .000
APPALACHIAN ST.
(1973-84-86) ............................................................................................................. 3 2 6 .250
ARIZONA (1954-55-56-57-58-59-60-61-62-63-66-70-74-75-76-78-79-80-
85-86-87-89-92-93-99-03-04-05-07-08) .................................................................. 30 56 34 .622
ARIZONA ST. (1964-65-67-69-72-73-75-76-77-78-81-82-83-84-87-88-89-90-
92-93-94-97-98-00-01-02-03-04-05-06-07-08) ....................................................... 32 80 30 .727
ARKANSAS (1973-79-80-83-85-86-87-88-89-90-95-96-98-99-02-03-04-05-06-07-08) .............. 21 36 34 .514
ARKANSAS ST. (1970-94) .................................................................................................................. 2 2 4 .333
ARMY (2000-04-05) ............................................................................................................. 3 1 6 .143
ASHLAND (1954)........................................................................................................................ 1 0 2 .000
AUBURN (1963-67-76-78-87-89-93-94-95-97-98-99-00-01-02-03-05) ................................... 17 36 29 .554
AUSTIN PEAY (1996-05-07) ............................................................................................................. 3 1 6 .143
BALL ST. (1965-69-06) ............................................................................................................. 3 3 6 .333
BAYLOR (1948-77-78-91-93-98-99-00-01-02-03-05-06-07) ................................................... 14 31 24 .564
BETHUNE-COOKMAN (1999-00-01-02-03-04-06-07-08) ............................................................................. 9 1 18 .053
BIRMINGHAM-SO.
(2004)........................................................................................................................ 1 1 2 .333
BOSTON COLLEGE (1949-53-55-60-61-62-63-66-67) ............................................................................. 9 10 11 .476
BOSTON U. (1954-56-68-69 ......................................................................................................... 4 3 6 .333
BOWLING GREEN (1972-98-99) ............................................................................................................. 3 2 6 .250
BRADLEY (1950-56-57-59-62-68) ............................................................................................. 6 1 8 .111
BRIDGEPORT (1962)........................................................................................................................ 1 1 2 .333
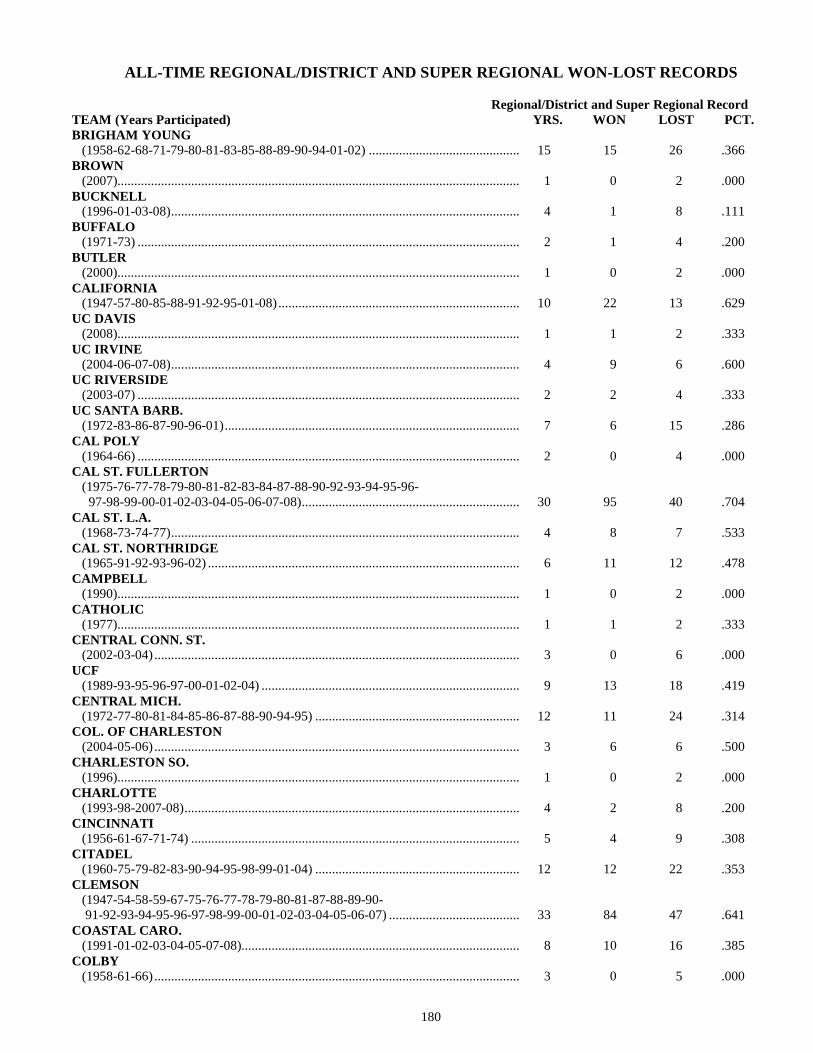
180
ALL-TIME REGIONAL/DISTRICT AND SUPER REGIONAL WON-LOST RECORDS
Regional/District and Super Regional Record
TEAM (Years Participated) YRS. WON LOST PCT.
BRIGHAM YOUNG (1958-62-68-71-79-80-81-83-85-88-89-90-94-01-02) ............................................. 15 15 26 .366
BROWN (2007)........................................................................................................................ 1 0 2 .000
BUCKNELL (1996-01-03-08) ........................................................................................................ 4 1 8 .111
BUFFALO (1971-73) .................................................................................................................. 2 1 4 .200
BUTLER (2000)........................................................................................................................ 1 0 2 .000
CALIFORNIA (1947-57-80-85-88-91-92-95-01-08) ........................................................................ 10 22 13 .629
UC DAVIS (2008)........................................................................................................................ 1 1 2 .333
UC IRVINE (2004-06-07-08) ........................................................................................................ 4 9 6 .600
UC RIVERSIDE (2003-07) .................................................................................................................. 2 2 4 .333
UC SANTA BARB. (1972-83-86-87-90-96-01) ........................................................................................ 7 6 15 .286
CAL POLY (1964-66) .................................................................................................................. 2 0 4 .000
CAL ST. FULLERTON (1975-76-77-78-79-80-81-82-83-84-87-88-90-92-93-94-95-96-
97-98-99-00-01-02-03-04-05-06-07-08) ................................................................. 30 95 40 .704
CAL ST. L.A.
(1968-73-74-77) ........................................................................................................ 4 8 7 .533
CAL ST. NORTHRIDGE (1965-91-92-93-96-02) ............................................................................................. 6 11 12 .478
CAMPBELL (1990)........................................................................................................................ 1 0 2 .000
CATHOLIC (1977)........................................................................................................................ 1 1 2 .333
CENTRAL CONN. ST.
(2002-03-04) ............................................................................................................. 3 0 6 .000
UCF
(1989-93-95-96-97-00-01-02-04) ............................................................................. 9 13 18 .419
CENTRAL MICH. (1972-77-80-81-84-85-86-87-88-90-94-95) ............................................................. 12 11 24 .314
COL. OF CHARLESTON (2004-05-06) ............................................................................................................. 3 6 6 .500
CHARLESTON SO. (1996)........................................................................................................................ 1 0 2 .000
CHARLOTTE
(1993-98-2007-08) .................................................................................................... 4 2 8 .200
CINCINNATI (1956-61-67-71-74) .................................................................................................. 5 4 9 .308
CITADEL (1960-75-79-82-83-90-94-95-98-99-01-04) ............................................................. 12 12 22 .353
CLEMSON (1947-54-58-59-67-75-76-77-78-79-80-81-87-88-89-90-
91-92-93-94-95-96-97-98-99-00-01-02-03-04-05-06-07) ....................................... 33 84 47 .641
COASTAL CARO. (1991-01-02-03-04-05-07-08)................................................................................... 8 10 16 .385
COLBY
(1958-61-66) ............................................................................................................. 3 0 5 .000

181
ALL-TIME REGIONAL/DISTRICT AND SUPER REGIONAL WON-LOST RECORDS
Regional/District and Super Regional Record
TEAM (Years Participated) YRS. WON LOST PCT.
COLGATE (1955-60-66-69) ........................................................................................................ 4 4 5 .444
COLUMBIA (1976-08) .................................................................................................................. 2 0 4 .000
CONNECTICUT (1957-58-59-60-61-63-65-68-70-72-77-79-90-93-94) ............................................. 15 20 21 .488
CORNELL (1977)........................................................................................................................ 1 2 2 .500
CREIGHTON (1973-90-91-92-99-00-05-07)................................................................................... 8 10 14 .417
DALLAS BAPTIST (2008)........................................................................................................................ 1 0 2 .000
DARTMOUTH (1958-67-69-70-87) .................................................................................................. 5 5 8 .385
DELAWARE (1956-60-61-70-78-79-80-82-83-92-96-98-99-00-01) ............................................. 15 17 25 .405
DENVER (1947-57-65-68-70-73) ............................................................................................. 6 8 12 .400
DETROIT (1959-60-61-62-65) .................................................................................................. 5 4 10 .286
DUKE (1952-53-56-57-61) .................................................................................................. 5 8 5 .615
EAST CARO. (1964-66-68-70-74-77-80-82-84-87-89-90-91-93-99-00-01-02-03-04-05-07-08) ... 23 24 46 .343
EAST TENN. ST. (1978-80-81) ............................................................................................................. 3 3 6 .333
EASTERN ILL. (1999-08) .................................................................................................................. 2 1 4 .250
EASTERN KY. (1984-85-86-89) ........................................................................................................ 4 2 8 .200
EASTERN MICH.
(1975-76-78-81-82-03-08) ........................................................................................ 7 13 12 .520
ELON (2002-06-08) ............................................................................................................. 3 2 5 .286
EVANSVILLE (1988-00-06) ............................................................................................................. 3 5 6 .455
FLA. ATLANTIC
(1999-00-02-03-04-05) ............................................................................................. 6 10 13 .435
FLA. SOUTHERN (1960)........................................................................................................................ 1 0 2 .000
FLORIDA (1958-60-62-77-79-81-82-84-85-88-89-91-92-94-96-97-98-00-01-02-03-04-05-
08) ............................................................................................................................ 24 56 40 .583
FLORIDA INT’L
(1991-95-97-98-99-00-01-02)................................................................................... 8 8 17 .320
FLORIDA ST. (1956-57-58-59-61-62-63-65-66-67-68-70-72-75-76-78-79-80-81-82-83-84-
85-86-87-88-89-90-91-92-93-94-95-96-97-98-99-00-01-02-03-04-05-06-07-08) ...... 46 130 66 .663
FORDHAM (1987-88-90-93-98) .................................................................................................. 5 4 10 .286
FRESNO ST. (1954-55-59-61-62-66-67-77-79-80-81-82-83-84-85-88-89-
90-91-92-93-94-95-96-97-00-01-06-07-08) ............................................................ 30 53 58 .477
FURMAN (1965-69-76-91-05) .................................................................................................. 5 5 10 .333
GEORGE MASON (1985-88-92-93-04) .................................................................................................. 5 1 10 .091

182
ALL-TIME REGIONAL/DISTRICT AND SUPER REGIONAL WON-LOST RECORDS
Regional/District and Super Regional Record
TEAM (Years Participated) YRS. WON LOST PCT.
GEORGE WASHINGTON (1957-58-59-79-89-92-02) ........................................................................................ 7 1 14 .067
GEORGIA
(1987-90-92-01-02-04-06-08)................................................................................... 8 33 13 .717
GA. SOUTHERN
(1957-73-74-79-80-87-90-96-00-01-02) ................................................................... 11 16 20 .444
GEORGIA TECH
(1959-71-85-86-87-88-89-90-91-92-93-94-95-96-97-98-00-01-02-03-04-05-06
-08)........................................................................................................................... 24 52 44 .512
GETTYSBURG
(1962)........................................................................................................................ 1 1 1 .500
GONZAGA (1971-73-74-76-78-80-81) ........................................................................................ 7 7 14 .333
GRAMBLING
(1983-84-85) ............................................................................................................. 3 0 6 .000
HARDIN-SIMMONS (1982)........................................................................................................................ 1 0 2 .000
HARVARD
(1968-71-72-73-74-78-80-83-84-97-98-99-02-05) ................................................... 14 22 20 .524 14 .611
HAWAII (1977-79-80-82-84-86-87-89-91-92-93-06) ............................................................. 12 19 22 .463
HOLY CROSS
(1952-54-55-58-60-62-63-65-67-78) ........................................................................ 10 13 9 .591
HOUSTON
(1953-58-60-66-67-82-85-87-90-97-99-00-01-02-03-06-08) ................................... 17 29 32 .475
IDAHO (1966-67-69) ............................................................................................................. 3 5 6 .455
ILLINOIS
(1947-48-62-63-89-90-98-00)................................................................................... 8 11 15 .423
ILL.-CHIGAGO (2003-05-07-08) ........................................................................................................ 4 2 8 .200
ILLINOIS ST.
(1976-94) .................................................................................................................. 2 1 4 .200
INDIANA
(1996)........................................................................................................................ 1 1 2 .333
INDIANA ST.
(1979-83-84-86-87-89-95) ........................................................................................ 7 8 12 .400
IOWA
(1972-75-90) ............................................................................................................. 3 4 5 .444
IOWA ST.
(1957-70-71) ............................................................................................................. 3 4 2 .667
ITHACA (1955-59-62-64-67) .................................................................................................. 5 5 5 .500
JACKSON ST. (1982-86-89-00) ........................................................................................................ 4 0 8 .000
JACKSONVILLE (1972-76-89-91-94-95-99-01-03-06-07) ................................................................... 11 8 22 .267
JACKSONVILLE ST. (2004-06) .................................................................................................................. 2 0 4 .000
JAMES MADISON (1980-81-83-88-95-02-08) ........................................................................................ 7 8 12 .400
KANSAS (1993-94-06) ............................................................................................................. 3 6 5 .545
KENT ST.
(1964-92-93-94-01-02-04-07)................................................................................... 8 6 16 .273
KENTUCKY
(1988-93-06-08) ........................................................................................................ 4 7 8 .467

183
ALL-TIME REGIONAL/DISTRICT AND SUPER REGIONAL WON-LOST RECORDS
Regional/District and Super Regional Record
TEAM (Years Participated) YRS. WON LOST PCT.
LA SALLE (1964-85) .................................................................................................................. 2 2 3 .400
LAFAYETTE (1948-53-54-55-57-58-65-66-90-2007) .................................................................... 10 10 10 .500
LAMAR
(1976-77-79-81-84-85-87-93-95-02-03-04) ............................................................. 12 13 24 .351
LEHIGH (2006)........................................................................................................................ 2 0 2 .000
LE MOYNE (1989-03-04-07) ........................................................................................................ 4 3 8 .273
LIBERTY
(1993-98-00) ............................................................................................................. 3 1 6 .143
LIPSCOMB
(2008)........................................................................................................................ 1 1 2 .333
LONG ISLAND
(1972)........................................................................................................................ 1 1 2 .333
LONG BEACH ST.
(1970-89-91-92-93-94-95-96-97-98-99-01-02-03-04-05-07-08) .............................. 18 41 30 .578
LA.-LAFAYETTE (1988-90-91-92-97-98-99-00-02-05-07) ................................................................... 11 17 21 .447
LA.-MONROE (1983-95-99-00) ...................................................................................................................... 4 2 8 .200
LSU
(1975-85-86-87-89-90-91-92-93-94-95-96-97-98-99-00-01-02-03-04-05-08) ........ 22 82 25 .766
LOUISIANA TECH (1974-75-78-80-86-87) ............................................................................................. 6 6 12 .333
LOUISVILLE
(2002-07-08) ............................................................................................................. 3 6 6 .500
LOYOLA MARYMOUNT (1973-86-88-89-90-98-99-00)................................................................................... 8 10 15 .409
MAINE
(1964-75-76-80-81-82-83-84-86-90-91-93-02-05-06) ............................................. 15 29 18 .617
MANHATTAN (1957-2006) .............................................................................................................. 2 2 3 .400
MARIST
(1997-00-01-02-05) .................................................................................................. 5 3 10 .231
MARSHALL
(1973-78) .................................................................................................................. 2 2 4 .333
MARYLAND
(1965-70-71) ............................................................................................................. 3 1 6 .143
UMBC
(1992-01) .................................................................................................................. 2 0 4 .000
MASSACHUSETTS (1954-55-56-66-67-69-71-73-78-95-96) ................................................................... 11 12 15 .444
McNEESE ST. (1988-93-00-03) ........................................................................................................ 4 2 8 .200
MEMPHIS
(1976-78-81-94-07) .................................................................................................. 5 8 10 .444
MIAMI (FL) (1971-73-74-75-76-77-78-79-80-81-82-83-84-85-86-87-88-89-
90-91-92-93-94-95-96-97-98-99-00-01-02-03-04-05-06-07-08) ............................. 37 122 42 .744
MIAMI (OH) (1973-74-77-79-83-00-05) ........................................................................................ 7 7 14 .333
MICHIGAN
(1953-61-62-75-76-77-78-80-81-83-84-85-86-87-88-89-99-05-06-07-08) .............. 21 47 31 .603
MICHIGAN ST.
(1954-71-78-79) ........................................................................................................ 4 3 7 .300

184
ALL-TIME REGIONAL/DISTRICT AND SUPER REGIONAL WON-LOST RECORDS
Regional/District and Super Regional Record
TEAM (Years Participated) YRS. WON LOST PCT.
MIDDLE TENN.
(1976-82-87-88-90-91-95-00-01-03-04) ................................................................... 11 6 22 .214
MILWAUKEE (1999-01-02) ............................................................................................................. 3 1 6 .143
MINNESOTA (1956-58-59-60-64-68-69-70-73-74-76-77-81-82-85-
87-88-91-92-93-94-98-99-00-01-03-04-07) ............................................................ 28 33 47 .413
MISSISSIPPI
(1956-64-69-72-77-95-99-01-03-04-05-06-07-08) ................................................... 14 35 22 .614
MISSISSIPPI ST.
(1965-66-70-71-78-79-81-83-84-85-87-88-89-90-91-92-93-96-97-98-99-00-01-
03-04-05-06-07) ....................................................................................................... 28 70 47 .598
MISSOURI
(1952-54-58-62-63-64-65-76-78-80-81-88-91-96-03-04-06-07-08) ........................ 20 23 30 .434
MISSOURI ST. (1987-95-96-97-99-02-03) ........................................................................................ 7 13 13 .500
MONMOUTH
(1998-99-2007) ......................................................................................................... 3 0 6 .000
MOREHEAD ST.
(1977-83) .................................................................................................................. 2 2 4 .333
MT ST. MARY’S
(2008)........................................................................................................................ 1 0 2 .000
MURRAY ST.
(1975-79-03) ............................................................................................................. 3 2 6 .250
NAVY
(1954-79-82-86-95-99-02) ........................................................................................ 7 3 13 .188
NEBRASKA
(1979-80-85-99-00-01-02-03-05-06-07-08) ............................................................. 12 29 19 .604
NEVADA (1994-97-99-00) ........................................................................................................ 4 5 8 .385
UNLV
(1978-80-81-84-88-89-96-03-04-05) ........................................................................ 10 10 20 .333
NEW HAMPSHIRE (1956-74) .................................................................................................................. 2 3 2 .600
NEW MEXICO
(1962)........................................................................................................................ 1 1 2 .333
NEW MEXICO ST.
(2002-03) .................................................................................................................. 2 1 4 .200
NEW ORLEANS
(1977-79-80-81-82-84-85-87-88-89-96-00-07-08) ................................................... 14 21 27 .438
NYIT
(1983)........................................................................................................................ 1 0 2 .000
NEW YORK U.
(1947-56-58-68-69) .................................................................................................. 5 9 5 .643
NICHOLLS ST. (1989-92-98) ............................................................................................................. 3 0 6 .000
NORTH CAROLINA
(1948-60-64-66-69-78-82-83-84-89-90-93-95-98-99-00-02-03-04-05-06-07-08) ... 23 57 36 .613
N.C. A&T
(2005)........................................................................................................................ 1 0 2 .000
UNC ASHEVILLE
(2006)........................................................................................................................ 1 0 2 .000
UNC GREENSBORO
(1994-97) .................................................................................................................. 2 3 4 .429
NORTH CAROLINA ST.
(1968-73-74-75-86-87-88-90-91-92-93-94-96-97-98-99-03-04-05-06-07-08) ........ 22 33 43 .434
UNC WILMINGTON (2003-04-06-08) ........................................................................................................ 4 7 8 .467

185
ALL-TIME REGIONAL/DISTRICT AND SUPER REGIONAL WON-LOST RECORDS
Regional/District and Super Regional Record
TEAM (Years Participated) YRS. WON LOST PCT.
NORTH DAKOTA ST. (1956)........................................................................................................................ 1 1 1 .500
NORTHEASTERN
(1964-66-72-73-94-97-03) ........................................................................................ 7 4 12 .250
NORTHEASTERN ILL. (1996)........................................................................................................................ 1 0 2 .000
NORTHERN COLO.
(1948-49-52-53-54-55-56-57-58-59-60-61-62-63-64-
65-66-68-74-75-76) ................................................................................................. 21 25 31 .446
NORTHERN ILL.
(1972)........................................................................................................................ 1 0 2 .000
UNI
(1958-61-01) ............................................................................................................. 3 1 6 .143
NORTHWESTERN (1957)........................................................................................................................ 1 3 2 .600
NORTHWESTERN ST.
(1991-94-05) ............................................................................................................. 3 2 6 .250
NOTRE DAME
(1949-56-57-58-59-60-63-70-89-92-93-94-96-99-00-01-02-03-04-05-06) .............. 21 38 40 .487
OCCIDENTAL (1958)........................................................................................................................ 1 1 2 .333
OHIO
(1954-56-60-65-68-69-70-71-91-97) ........................................................................ 10 12 18 .400
OHIO ST. (1951-55-65-66-67-82-91-92-93-94-95-97-99-01-02-03-05-07) .............................. 18 29 29 .500
OKLAHOMA (1947-51-55-56-72-73-74-75-76-77-79-82-84-85-86-87-
88-89-91-92-94-95-97-98-00-02-04-05-06-08) ....................................................... 30 49 44 .527
OKLAHOMA CITY (1984)........................................................................................................................ 1 2 2 .500
OKLAHOMA ST. (1948-49-54-55-59-60-61-66-67-68-69-78-81-82-83-84-85-86-87-
88-89-90-91-92-93-94-95-96-97-98-99-01-04-06-07-08) ....................................... 36 94 43 .686 31 .713
OLD DOMINION (1982-85-90-94-95-96-00) ........................................................................................ 7 4 14 .222
ORAL ROBERTS
(1973-78-80-81-82-83-85-86-87-98-99-00-01-02-03-04-05-06-07-08) ................... 20 26 38 .406
OREGON
(1954-64) .................................................................................................................. 2 3 2 .600
OREGON ST.
(1952-62-63-83-85-86-05-06-07) ............................................................................. 9 19 12 .613
PENN
(1975-88-89-90-95) .................................................................................................. 5 3 10 .231
PENN ST.
(1952-55-56-57-58-59-62-63-67-70-71-72-73-74-75-76-00) ................................... 17 19 21 .475
PEPPERDINE
(1955-57-60-74-75-76-79-82-85-86-87-88-89-91-92-93-95-99-01-03-04-05-06
07-08)........................................................................................................................ 24 45 48 .484
PITTSBURGH (1959-65-95) ............................................................................................................. 3 2 4 .333
PORTLAND
(1957-58-79-89-91) .................................................................................................. 5 4 11 .267
PORTLAND ST.
(1977)........................................................................................................................ 1 0 2 .000
PRAIRIE VIEW
(2006-07) .................................................................................................................. 2 0 4 .000
PRINCETON
(1951-65-85-91-96-00-01-03-04-06) ........................................................................ 10 3 17 .150
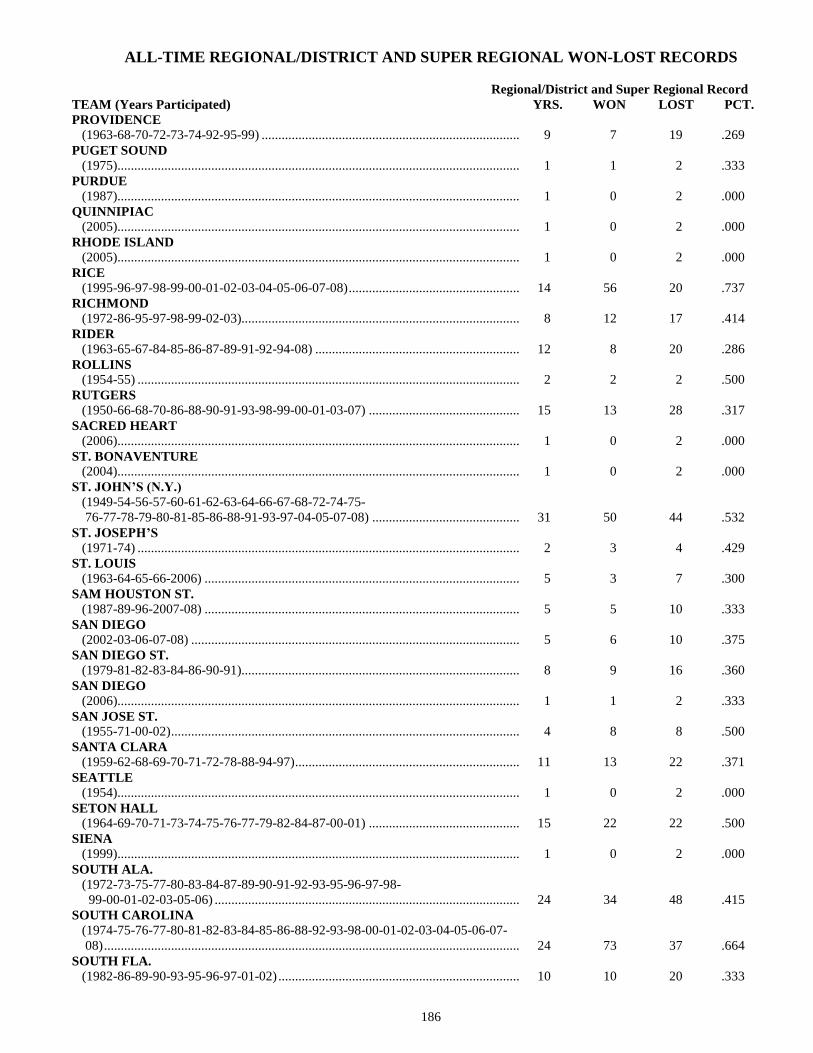
186
ALL-TIME REGIONAL/DISTRICT AND SUPER REGIONAL WON-LOST RECORDS
Regional/District and Super Regional Record
TEAM (Years Participated) YRS. WON LOST PCT.
PROVIDENCE (1963-68-70-72-73-74-92-95-99) ............................................................................. 9 7 19 .269
PUGET SOUND (1975)........................................................................................................................ 1 1 2 .333
PURDUE
(1987)........................................................................................................................ 1 0 2 .000
QUINNIPIAC
(2005)........................................................................................................................ 1 0 2 .000
RHODE ISLAND
(2005)........................................................................................................................ 1 0 2 .000
RICE
(1995-96-97-98-99-00-01-02-03-04-05-06-07-08) ................................................... 14 56 20 .737 20 .718
RICHMOND
(1972-86-95-97-98-99-02-03)................................................................................... 8 12 17 .414
RIDER
(1963-65-67-84-85-86-87-89-91-92-94-08) ............................................................. 12 8 20 .286
ROLLINS
(1954-55) .................................................................................................................. 2 2 2 .500
RUTGERS
(1950-66-68-70-86-88-90-91-93-98-99-00-01-03-07) ............................................. 15 13 28 .317
SACRED HEART (2006)........................................................................................................................ 1 0 2 .000
ST. BONAVENTURE (2004)........................................................................................................................ 1 0 2 .000
ST. JOHN’S (N.Y.) (1949-54-56-57-60-61-62-63-64-66-67-68-72-74-75-
76-77-78-79-80-81-85-86-88-91-93-97-04-05-07-08) ............................................ 31 50 44 .532
ST. JOSEPH’S (1971-74) .................................................................................................................. 2 3 4 .429
ST. LOUIS
(1963-64-65-66-2006) .............................................................................................. 5 3 7 .300
SAM HOUSTON ST. (1987-89-96-2007-08) .............................................................................................. 5 5 10 .333
SAN DIEGO (2002-03-06-07-08) .................................................................................................. 5 6 10 .375
SAN DIEGO ST. (1979-81-82-83-84-86-90-91)................................................................................... 8 9 16 .360
SAN DIEGO (2006)........................................................................................................................ 1 1 2 .333
SAN JOSE ST. (1955-71-00-02) ........................................................................................................ 4 8 8 .500
SANTA CLARA (1959-62-68-69-70-71-72-78-88-94-97) ................................................................... 11 13 22 .371
SEATTLE
(1954)........................................................................................................................ 1 0 2 .000
SETON HALL (1964-69-70-71-73-74-75-76-77-79-82-84-87-00-01) ............................................. 15 22 22 .500
SIENA (1999)........................................................................................................................ 1 0 2 .000
SOUTH ALA.
(1972-73-75-77-80-83-84-87-89-90-91-92-93-95-96-97-98-
99-00-01-02-03-05-06) ........................................................................................... 24 34 48 .415
SOUTH CAROLINA
(1974-75-76-77-80-81-82-83-84-85-86-88-92-93-98-00-01-02-03-04-05-06-07-
08) ............................................................................................................................ 24 73 37 .664
SOUTH FLA.
(1982-86-89-90-93-95-96-97-01-02) ........................................................................ 10 10 20 .333

187
ALL-TIME REGIONAL/DISTRICT AND SUPER REGIONAL WON-LOST RECORDS
Regional/District and Super Regional Record
TEAM (Years Participated) YRS. WON LOST PCT.
SOUTHEAST MO. ST. (1998-02) .................................................................................................................. 2 1 4 .200
SOUTHEASTERN LA.
(1992-94) .................................................................................................................. 2 1 4 .200
SOUTHERN CALIFORNIA
(1948-49-51-54-55-58-60-61-63-64-66-68-70-71-72-
73-74-75-77-78-84-88-89-90-91-93-94-95-96-97-98-99-00-01-02-05) .................. 36 97 42 .698
SOUTHERN ILL.
(1966-67-68-69-70-71-73-74-76-77-78-81-86-90) ................................................... 14 27 20 .574
SOUTHERN MISS.
(1990-91-99-03-04-05-06-07-08) ............................................................................. 9 10 18 .357
SOUTHERN U.
(1987-88-99-01-02-03-05) ........................................................................................ 7 3 14 .176
SPRINGFIELD (1951-54-55-57-61) .................................................................................................. 5 4 5 .444
STANFORD (1953-65-67-81-82-83-84-85-86-87-88-90-91-92-94-95-96-97-98-99-00-01-02-
03-04-05-06-08) ....................................................................................................... 28 88 34 .721
STETSON (1982-84-88-89-90-92-96-97-00-01-02-03-05-06-07) ............................................. 15 16 30 .348
STONY BROOK (2004-08) .................................................................................................................. 2 0 4 .000
SYRACUSE (1961)........................................................................................................................ 1 2 0 1.000
TEMPLE
(1959-63-68-72-73-75-76-77-78-81-83-84-01) ........................................................ 13 17 20 .459
TENNESSEE
(1951-93-94-95-96-97-01-04-05) ............................................................................. 9 23 11 .676
TENNESSEE TECH
(1956-97-01) ............................................................................................................. 3 2 6 .250
TEXAS-ARLINGTON (1990-92-01-06) ........................................................................................................ 4 1 8 .111
TEXAS
(1947-49-50-52-53-54-57-58-60-61-62-63-65-66-67-68-
69-70-71-72-73-74-75-76-79-80-81-82-83-84-85-86-87-
88-89-90-91-92-93-94-95-96-99-00-01-02-03-04-05-06-07-08) ............................. 52 128 49 .723
TEXAS A&M
(1951-55-59-64-75-76-77-78-84-86-87-88-89-91-92-93-95-97-98-99-03-04-07
-08)............................................................................................................................ 24 50 44 .532
TCU
(1956-94-04-05-06-07-08) ........................................................................................ 7 7 14 .333
TEX.-PAN AMERICAN (1968-70-71-72-73-74-75-76-78-79-80-83-86) ........................................................ 13 13 24 .351
UTSA (1994-05) .................................................................................................................. 2 0 4 .000
TEXAS ST.
(1997-99-00) ............................................................................................................. 3 3 6 .333
TEXAS SOUTHERN
(2004-08) .................................................................................................................. 2 1 4 .250
TEXAS TECH (1995-96-97-98-99-00-01-02-04) ............................................................................. 9 15 18 .455
TOWSON (1988-91) .................................................................................................................. 2 2 4 .333
TRINITY (TEX.) (1969-72-73) ............................................................................................................. 3 1 6 .143
TROY
(1995-97-06-07) ........................................................................................................ 4 2 8 .200

188
ALL-TIME REGIONAL/DISTRICT AND SUPER REGIONAL WON-LOST RECORDS Regional/District and Super Regional Record
TEAM (Years Participated) YRS. WON LOST PCT.
TULANE
(1979-82-83-86-87-88-92-94-96-98-99-00-01-02-03-04-05-06-08) ........................ 19 33 36 .478
TULSA
(1969-70-71-72-73-74-75) ........................................................................................ 7 8 10 .444
UCLA
(1969-79-86-87-90-92-93-96-97-99-00-04-06-07-08) ............................................. 15 34 27 .557
UTAH
(1951-59-60) ............................................................................................................. 3 2 4 .333
VALPARAISO (1958-63-66-67-68) .................................................................................................. 5 2 10 .167
VANDERBILT (1973-74-80-04-06-07-08) ........................................................................................ 7 12 14 .462
VERMONT
(1956-62) .................................................................................................................. 2 3 3 .500
VILLANOVA (1954-58-60-61-89-91) ............................................................................................. 6 3 8 .273
VIRGINIA
(1972-85-96-04-05-06-07-08)................................................................................... 8 12 16 .429
VCU (1988-92-98-99-01-02-03-05-07) ............................................................................. 9 11 18 .379
VIRGINIA TECH
(1954-69-76-77-94-97-99-00)................................................................................... 8 5 16 .238
WAGNER
(2000)........................................................................................................................ 1 0 2 .000
WAKE FOREST
(1949-55-62-63-77-98-99-00-01-02-07) ................................................................... 11 27 20 .575
WASHINGTON
(1959-92-94-97-98-02-03-04)................................................................................... 8 19 16 .543
WASHINGTON ST.
(1950-56-60-61-65-66-75-76-77-78-84-87-88-90) ................................................... 14 19 21 .475
WEBER ST.
(1968-70-72) ............................................................................................................. 3 3 7 .300
WEST VIRGINIA
(1955-61-62-63-64-67-82-85-87-94-96) ................................................................... 11 8 22 .267
WESTERN CARO. (1985-86-87-88-89-92-93-94-97-03-07) ................................................................... 11 13 22 .371
WESTERN KY.
(1980-04-08) ............................................................................................................. 3 3 6 .333
WESTERN MICH.
(1952-55-57-58-59-61-62-63-66-67-89) ................................................................... 11 26 14 .650
WICHITA ST. (1980-81-82-83-85-87-88-89-90-91-92-93-94-95-96-97-98-
99-00-02-03-04-05-07-08) ...................................................................................... 26 58 42 .580
WILLAMETTE (1955)........................................................................................................................ 1 0 2 .000
WILLIAM & MARY
(1983-01) .................................................................................................................. 2 0 4 .000
WINTHROP (1995-99-01-05-06) .................................................................................................. 5 8 10 .444
WOFFORD (2007)........................................................................................................................ 1 0 2 .000
WRIGHT ST.
(1994-2006) .............................................................................................................. 2 1 4 .200
WYOMING (1954-55-56-61) ........................................................................................................ 4 5 7 .417
YALE
(1947-48-81-92-93) .................................................................................................. 5 6 6 .500
YOUNGSTOWN ST.
(2004)........................................................................................................................ 1 0 2 .000

189
DISTRICT / REGIONAL AND SUPER REGIONAL RESULTS (1954-2008)
NOTE: From 1947 to 1953 various tournaments and playoffs took place around the country, but were not considered part of the NCAA
Championship, similar to the play-in system used from 1994 to 1998.
1954 DISTRICT RESULTS
DISTRICT 1 at Springfield, MA Massachusetts 9, Springfield 7 (10 inn.)
Boston U. 8, Holy Cross 3
Massachusetts 2, Boston U. 0
DISTRICT 2 at Allentown, PA St. John's (N.Y.) 4, Navy 2
Lafayette 4, Villanova 3
Lafayette 9, St. John's (N.Y.) 0
DISTRICT 3
at Clemson, SC
Virginia Tech 11, Clemson 10
at Blacksburg, VA
Virginia Tech 7, Clemson 1
at Winter Park, FL
Rollins 3, Virginia Tech 0
Rollins 9, Virginia Tech 3
DISTRICT 4
at Athens, OH Ohio 18, Ashland 4
Ohio 10, Ashland 6 (7 inn.)
at East Lansing, MI
Michigan St. 14, Ohio 10
Ohio 7, Michigan St. 0 (7 inn.)
Michigan St. 5, Ohio 3 (5 inn.)
DISTRICT 5
Missouri (automatic qualifier)
DISTRICT 6 at Austin, TX
Oklahoma St. 6, Texas 3
Texas 16, Oklahoma St. 12
Oklahoma St. 7, Texas 6
DISTRICT 7 at Greeley, CO Arizona 8, Northern Colo. 2
Northern Colo. 21, Wyoming 14
Arizona 16, Wyoming 9
Arizona 8, Northern Colo. 5 (11 inn.)
DISTRICT 8 at Eugene, OR Oregon 9, Seattle 4
Fresno St. 9, Southern California 3
Southern California 9, Seattle 0
Oregon 9, Fresno St. 5
Fresno St. 7, Southern California 4
Oregon 1, Fresno St. 0 (5 inn.)
1955 DISTRICT RESULTS
DISTRICT 1 at Springfield, MA Springfield 4, Boston College 3
Massachusetts 1, Holy Cross 0
Springfield 17, Massachusetts 6
DISTRICT 2 at Allentown, PA Colgate 7, Penn St. 4
Ithaca 5, Lafayette 0
Colgate 7, Ithaca 6
DISTRICT 3 at Morgantown, WV Wake Forest 4, Rollins 0
Wake Forest 6, Rollins 2
Wake Forest 5, West Virginia 1
West Virginia 9, Wake Forest 7
Wake Forest 6, West Virginia 5
DISTRICT 4 at Kalamazoo, MI Alma 9, Western Mich. 8,
Western Mich. 3, Alma 0
Western Mich. 15, Alma 4
Western Mich. 1, Ohio St. 0 (10 inn.)
Ohio St. 8, Western Mich. 5
Western Mich. 7, Ohio St. 5
DISTRICT 5 at Norman, OK Oklahoma 3, Oklahoma St. 0
Oklahoma St. 6, Oklahoma 3
Oklahoma St. 6, Oklahoma 2
DISTRICT 6 at Tucson, AZ Arizona 6, Texas A&M 2
Texas A&M 5, Arizona 0,
Arizona 2, Texas A&M 1
DISTRICT 7 at Greeley, CO Northern Colo. 17, Wyoming 8
Wyoming 13, Northern Colo. 7
Northern Colo. 12, Wyoming 5
DISTRICT 8
at Fresno, CA Fresno St. 6, Willamette 3
San Jose St. 9, Pepperdine 2
Pepperdine 14, Willamette 11
San Jose St. 3, Fresno St. 1
Fresno St. 8, Pepperdine 7
Fresno St. 9, San Jose St. 4
Fresno St. 5, San Jose St. 1
at Los Angeles, CA
Southern California 11, Fresno St. 2
Southern California 15, Fresno St. 2

190
1956 DISTRICT RESULTS
DISTRICT 1 at Springfield, MA Vermont 8, Massachusetts 1
New Hampshire 5, Boston U. 0
New Hampshire 2, Vermont 0
DISTRICT 2 at Allentown, PA
St. John's (N.Y.) 3, Delaware 1
New York U. 15, Penn St. 7
New York U. 6, St. John's (N.Y.) 2
DISTRICT 3 at Gastonia, NC Florida St. 2, Duke 1
Duke 7, Florida St. 6
Duke 4, Florida St. 2
Mississippi 4, Tennessee Tech 3
Mississippi 3, Tennessee Tech 2
Duke 4, Mississippi 2
Mississippi 6, Duke 2
Mississippi 7, Duke 1
DISTRICT 4
at Athens, OH Ohio 8, Cincinnati 6
at Minneapolis, MN
Notre Dame 4, Minnesota 3
Minnesota 15, Notre Dame 5
Minnesota 10, Notre Dame 1
at Athens, OH
Minnesota 5, Ohio 0
Minnesota 7, Ohio 6
DISTRICT 5 at Stillwater, OK
North Dakota St. 8, Oklahoma 3
Bradley 11, North Dakota St. 2
DISTRICT 6 at Tucson, AZ Arizona 7, TCU 5
Arizona 8, TCU 2
DISTRICT 7 at Greeley, CO Wyoming 8, Northern Colo. 5
Northern Colo. 8, Wyoming 3
Wyoming 9, Northern Colo. 7
DISTRICT 8
Washington St. (automatic qualifier)
1957 DISTRICT RESULTS
DISTRICT 1 Springfield 9, Connecticut 4
Connecticut 4, Springfield 3
Connecticut 5, Springfield 0
DISTRICT 2 at Brooklyn, NY Penn St. 2, Manhattan 1
St. John's (N.Y.) 8, Lafayette 3
Penn St. 5, St. John's (N.Y.) 0
DISTRICT 3 at Gastonia, NC
Florida St. 5, Ga. Southern 3
Duke 9, George Washington 5
Ga. Southern 5, George Washington 3
Florida St. 3, Duke 2
Duke 21, Ga. Southern 2
Duke 8, Florida St. 6
Florida St. 4, Duke 1
DISTRICT 4 at Kalamazoo, MI Notre Dame 18, Alma 2
Western Mich. 11, Northwestern 1
Northwestern 11, Alma 2
Notre Dame 4, Western Mich. 2
Northwestern 10, Western Mich. 9 (10 inn.)
Northwestern 9, Notre Dame 2
Notre Dame 6, Northwestern 1
DISTRICT 5 at Ames, IA Iowa St. 2, Bradley 0
Iowa St. 3, Bradley 0
DISTRICT 6 at Austin, TX Texas 7, Arizona 1
Texas 2, Arizona 0
DISTRICT 7 Northern Colo. 8, Denver 3
Denver 4, Northern Colo. 3
Northern Colo. 5, Denver 3 (10 inn.)
DISTRICT 8
at Portland, OR Portland 5, Pepperdine 4
Pepperdine 6, Portland 5
Pepperdine 7, Portland 6
at Berkeley, CA
California 4, Pepperdine 2
Pepperdine 10, California 6
California 10, Pepperdine 3

191
1958 DISTRICT RESULTS
DISTRICT 1 at Springfield, MA Connecticut 1, Dartmouth 0
Connecticut 10, Dartmouth 0
Holy Cross 4, Colby 3
Holy Cross 5, Colby 1
Holy Cross 2, Connecticut 1 (10 inn.)
DISTRICT 2 at Philadelphia, PA New York U. 2, Villanova 1
Lafayette 9, Penn St. 1
Lafayette 5, New York U. 1
DISTRICT 3 at Gastonia, NC
Florida St. 3, George Washington 1
Florida 8, Clemson 6
Florida 2, Florida St. 1
Clemson 4, George Washington 2
Clemson 8, Florida St. 5 (10 inn.)
Clemson 15, Florida 14
Clemson 3, Florida 1
DISTRICT 4 at Kalamazoo, MI Valparaiso 2, Notre Dame 0
Western Mich. 4, Minnesota 0
Notre Dame 11, Minnesota 7
Western Mich. 24, Valparaiso 2
Notre Dame 10, Valparaiso 4
Western Mich. 5, Notre Dame 4
DISTRICT 5 at Columbia, MO Missouri 11, UNI 7
Missouri 13, UNI 3
DISTRICT 6 at Tucson, AZ Texas 3, Houston 2 (10 inn.)
Texas 14, Arizona 3
Arizona 16, Texas 4
Arizona 5, Texas 2
DISTRICT 7 at Provo, UT Brigham Young 4, Northern Colo. 3
Northern Colo. 8, Brigham Young 0
*Brigham Young 9, Northern Colo. 5
DISTRICT 8
at Portland, OR Occidental 5, Portland 2
Portland 3, Occidental 0
Portland 3, Occidental 0
at Los Angeles, CA
Southern California 6, Portland 0
Southern California 11, Portland 1
*Brigham Young withdrew from championship.
Northern Colo. selected as District 7 representative.
1959 DISTRICT RESULTS
DISTRICT 1 Connecticut (automatic qualifier)
DISTRICT 2 at University Park, PA Penn St. 16, Temple 4
Ithaca 4, Pittsburgh 3 (11 inn.)
Penn St. 7, Ithaca 3
DISTRICT 3 at Gastonia, NC Clemson 9, Georgia Tech 6
Florida St. 3, George Washington 2 (10 inn.)
Clemson 24, Florida St. 2
Georgia Tech 7, George Washington 2
Florida St. 16, Georgia Tech 9
Clemson 5, Florida St. 0
DISTRICT 4 at Notre Dame, IN Minnesota 6, Western Mich. 4
Notre Dame 10, Detroit 0
Western Mich. 4, Detroit 0
Notre Dame 12, Minnesota 4
Western Mich. 5, Minnesota 1
Western Mich. 5, Minnesota 1
Western Mich. 2, Notre Dame 0 (10 inn.)
Western Mich. 9, Notre Dame 6
DISTRICT 5 at Peoria, IL Oklahoma St. 7, Bradley 6
Oklahoma St. 6, Bradley 2
DISTRICT 6 at Bryan, TX Arizona 1, Texas A&M 0
Arizona 1, Texas A&M 0
DISTRICT 7 at Greeley, CO
Northern Colo. 17, Utah 8
Utah 13, Northern Colo. 8
Northern Colo. 12, Utah 8
DISTRICT 8
at Fresno, CA Fresno St. 23, Santa Clara 11
Fresno St. 15, Santa Clara 3
at Seattle, WA
Fresno St. 3, Washington 2
Washington 5, Fresno St. 4
Fresno St. 10, Washington 5

192
1960 DISTRICT RESULTS
DISTRICT 1 at Springfield, MA Boston College 2, Connecticut 1
Holy Cross 5, American Int'l 1
Boston College 5, Holy Cross 4
DISTRICT 2 at Cooperstown, NY Delaware 15, Colgate 4
St. John's (N.Y.) 7, Villanova 2
St. John's (N.Y.) 4, Delaware 3
DISTRICT 3 at Gastonia, NC Citadel 4, Florida 2 (6 inn.)
North Carolina 2, Fla. Southern 1
Florida 5, Fla. Southern 0 (6 inn.)
North Carolina 13, Citadel 1
Florida 4, Citadel 1
North Carolina 7, Florida 5
DISTRICT 4 at St. Paul, MN
Minnesota 15, Notre Dame 6
Detroit 16, Ohio 2
Minnesota 12, Detroit 5
Ohio 5, Notre Dame 4
Detroit 14, Ohio 4
Minnesota 5, Detroit 4
DISTRICT 5
Oklahoma St. (automatic qualifier)
DISTRICT 6
at Austin, TX
Houston 4, Texas 2
at Tucson, AZ
Arizona 4, Houston 3
Arizona 6, Houston 4
DISTRICT 7 at Salt Lake City, UT Utah 24, Northern Colo. 3
Northern Colo. 3, Utah 2
Northern Colo. 6, Utah 2
DISTRICT 8 at Los Angeles, CA Southern California 10, Pepperdine 3
Southern California 10, Pepperdine 3
Washington St. 8, Southern California 7
Southern California 8, Washington St. 3
Southern California 10, Washington St. 5
1961 DISTRICT RESULTS
DISTRICT 1 at Springfield, MA Springfield 9, Colby 2
Boston College 11, Springfield 8
Connecticut 15, Colby 1
Boston College 4, Connecticut 1
Connecticut 3, Springfield 1
Connecticut 3, Boston College 2
Boston College 14, Connecticut 4
DISTRICT 2 at Syracuse, NY St. John's (N.Y.) 10, Villanova 4
Syracuse 2, Delaware 0
Syracuse 12, St. John's (N.Y.) 5
DISTRICT 3 at Gastonia, NC Florida St. 3, West Virginia 1
Duke 7, Florida St. 2
West Virginia 4, Florida St. 3
Duke 7, West Virginia 3
DISTRICT 4 at Ann Arbor, MI Western Mich. 3, Detroit 1
Cincinnati 3, Michigan 1 (10 inn.)
Michigan 6, Detroit 3 (10 inn.)
Western Mich. 8, Cincinnati 1
Michigan 2, Cincinnati 1
Western Mich. 4, Michigan 3 (14 inn.)
DISTRICT 5 at Stillwater, OK Oklahoma St. 10 , UNI 0
Oklahoma St. 11, UNI 8
DISTRICT 6 at Austin, TX Texas 8, Arizona 2
Texas 5, Arizona 4
DISTRICT 7 at Laramie, WY Wyoming 3, Northern Colo. 2
Wyoming 12, Air Force 10
Northern Colo. 10, Air Force 6
Northern Colo. 16, Wyoming 12
Northern Colo. 12, Wyoming 1
DISTRICT 8
at Los Angeles, CA Southern California 4, Fresno St. 1
Fresno St. 6, Southern California 4
Southern California 10, Fresno St. 6
at Pullman, WA Southern California 13, Washington St. 6
Southern California 10, Washington St. 4

193
1962 DISTRICT RESULTS
DISTRICT 1 at Springfield, MA Holy Cross 7, Vermont 5
Bridgeport 4, Boston College 3
Holy Cross 5, Bridgeport 2
Vermont 3, Boston College 2
Vermont 5, Bridgeport 4 (13 inn.)
Holy Cross 12, Vermont 5
DISTRICT 2 at University Park, PA Ithaca 7, Penn St. 6
Gettysburg 7, St. John's (N.Y.) 5
Ithaca 7, Gettysburg 4
DISTRICT 3 at Gastonia, NC Wake Forest 8, West Virginia 3
Florida 1, Florida St. 0
Florida St. 6, West Virginia 5
Wake Forest 7, Florida 1
Florida St. 3, Florida 1 (5 inn.)
Florida St. 10, Wake Forest 8
Florida St. 3, Wake Forest 2 (11 inn.)
DISTRICT 4 at Kalamazoo, MI
Illinois 2, Detroit 1
Western Mich. 6, Michigan 5 (10 inn.)
Michigan 12, Detroit 6
Western Mich. 10, Illinois 2
Michigan 5, Illinois 1
Michigan 3, Western Mich. 2 (10 inn.)
Michigan 7, Western Mich 6 (10 inn.)
DISTRICT 5 at Columbia, MO Missouri 3, Bradley 1
Missouri 9, Bradley 4
DISTRICT 6 at Tucson, AZ
Texas 1, Arizona 0
Texas 7, Arizona 4
DISTRICT 7 at Greeley, CO New Mexico 9, Brigham Young 2
Northern Colo. 7, Air Force 2
Air Force 4, Brigham Young 2
Northern Colo. 11, New Mexico 2
Air Force 2, New Mexico 1
Northern Colo. 6, Air Force 5 (11 inn.)
DISTRICT 8 at Santa Clara, CA Santa Clara 6, Fresno St. 1
Fresno St. 3, Santa Clara 1
Santa Clara 4, Fresno St. 2
Santa Clara 8, Oregon St. 1
Santa Clara 7, Oregon St. 5
1963 DISTRICT RESULTS
DISTRICT 1
at Newton, MA Holy Cross 4, Boston College 0
Holy Cross 7, Boston College 4
at Worcester, MA
Connecticut 4, Providence 3 (10 inn.)
Providence 4, Connecticut 3
Providence 10, Connecticut 6
Holy Cross 11, Providence 0
Holy Cross 7, Providence 4
DISTRICT 2 at Princeton, NJ Penn St. 3, Rider 0
St. John's (N.Y.) 7, Temple 0
Penn St. 11, St. John's (N.Y.) 2
DISTRICT 3 at Gastonia, NC Florida St. 4, Auburn 3
Wake Forest 4, West Virginia 3
West Virginia 2, Auburn 1
Florida St. 12, Wake Forest 4
Wake Forest 12, West Virginia 8
Wake Forest 6, Florida St. 5
Florida St. 11, Wake Forest 5
DISTRICT 4 at Champaign, IL
Illinois 13, Valparaiso 2
Western Mich. 2, Notre Dame 1
Notre Dame 5, Valparaiso 2
Western Mich. 1, Illinois 0
Illinois 4, Notre Dame 0
Illinois 8, Western Mich. 0
Western Mich. 7, Illinois 0
DISTRICT 5 at Columbia, MO
Missouri 16, St. Louis 0
St. Louis 2, Missouri 1
Missouri 7, St. Louis 1
DISTRICT 6 Texas (automatic qualifier)
DISTRICT 7 at Tucson, AZ Arizona 13, Northern Colo. 0
Arizona 10, Northern Colo. 0
DISTRICT 8 at Corvallis, OR Southern California 6, Oregon St. 5
Oregon St. 8, Southern California 6
Southern California 7, Oregon St. 5

194
1964 DISTRICT RESULTS
DISTRICT 1 at Boston, MA Maine 9, Northeastern 5
Maine 4, Northeastern 2
DISTRICT 2 at Princeton, NJ Ithaca 6, St. John's (N.Y.) 3
Seton Hall 8, La Salle 3
Seton Hall 8, Ithaca 3
DISTRICT 3 at Gastonia, NC Mississippi 11, West Virginia 0
North Carolina 8, East Caro. 0
East Caro. 6, West Virginia 5
Mississippi 4, North Carolina 3
North Carolina 13, East Caro. 2
Mississippi 13, North Carolina 1
DISTRICT 4 at Kent, OH Minnesota 7, Kent 4
Minnesota 13, Kent 2
DISTRICT 5 at Columbia, MO Missouri 2, St. Louis 1
DISTRICT 6 Texas A&M (automatic qualifier)
DISTRICT 7 at Colorado Springs, CO Air Force 3, Northern Colo. 1
Air Force 7, Northern Colo. 1
Arizona St. 6, Air Force 1
Arizona St. 7, Air Force 6
DISTRICT 8 at Los Angeles, CA Southern California 12, Cal Poly Pomona 3
Southern California 5, Cal Poly Pomona 3
Southern California 5, Oregon 0
Southern California 9, Oregon 3
1965 DISTRICT RESULTS
DISTRICT 1 at Boston, MA Connecticut 7, Holy Cross 4
Holy Cross 5, Connecticut 0
Connecticut 7, Holy Cross 0
DISTRICT 2 at Princeton, NJ Princeton 4, Rider 3
Lafayette 4, Pittsburgh 3
Lafayette 5, Princeton 4
DISTRICT 3 at Gastonia, NC Mississippi St. 6, Florida St. 3
Furman 4, Maryland 3
Florida St. 7, Maryland 3
Furman 5, Mississippi St. 2
Florida St. 6, Mississippi St. 2
Florida St. 2, Furman 1
Florida St. 7, Furman 5
DISTRICT 4 at Oxford, OH Ohio 7, Detroit 6
Ohio St. 4, Ball St. 0
Detroit 4, Ball St. 3
Ohio St. 4, Ohio 2
Detroit 8, Ohio 7
Ohio St. 10, Detroit 7
DISTRICT 5 at St. Louis, MO St. Louis 5, Missouri 4
St. Louis 5, Missouri 4
DISTRICT 6 Texas (automatic qualifier)
DISTRICT 7 at Phoenix, AZ Denver 8, Northern Colo. 1
Northern Colo. 1, Denver 0
Northern Colo. 1, Denver 0
Arizona St. 7, Northern Colo. 2
Arizona St. 12, Northern Colo. 3
DISTRICT 8
at Stanford, CA Cal St. Northridge 1, Stanford 0
Stanford 12, Cal St. Northridge 1
Stanford 11, Cal St. Northridge 6
at Pullman, WA
Washington St. 2, Stanford 1
Washington St. 13, Stanford 3

195
1966 DISTRICT RESULTS
DISTRICT 1 at Boston, MA Boston College 8, Massachusetts 5
Northeastern 5, Colby 4
Northeastern 10, Boston College 2
DISTRICT 2 at Princeton, NJ
Lafayette 15, Colgate 0
St. John's (N.Y.) 9, Rutgers 4
Rutgers 3, Colgate 2
St. John's (N.Y.) 2, Lafayette 0
Lafayette 4, Rutgers 3 (12 inn.)
St. John's (N.Y.) 8, Lafayette 3
DISTRICT 3 at Gastonia, NC Mississippi St. 4, Florida St. 3
North Carolina 7, East Caro. 1
Florida St. 6, East Caro. 3
North Carolina 5, Mississippi St. 4
Florida St. 7, Mississippi St. 0
Florida St. 6, North Carolina 5
North Carolina 6, Florida St. 4
DISTRICT 4 at Columbus, OH Ohio St. 13, Valparaiso 3
Western Mich. 18, Southern Ill. 4
Valparaiso 4, Southern Ill. 3
Ohio St. 10, Western Mich. 3
Western Mich. 5, Valparaiso 2
Ohio St. 14, Western Mich. 7
DISTRICT 5 at Stillwater, OK Oklahoma St. 4, St. Louis 3
Oklahoma St. 4, St. Louis 3
DISTRICT 6 at Houston, TX
Houston 5, Texas 4
Texas 9, Houston 3
Texas 8, Houston 5
DISTRICT 7
at Greeley, CO Idaho 3, Northern Colo. 1
Air Force 7, Northern Colo. 6
Idaho 2, Air Force 1
Idaho 4, Air Force 2
at Tucson, AZ Arizona 3, Idaho 2
Arizona 8, Idaho 5
DISTRICT 8 at Los Angeles, CA Southern California 11, Cal Poly Pomona 7 (10 inn.)
Washington St. 5, Fresno St. 2 (13 inn.)
Fresno St. 5, Cal Poly Pomona 4
Southern California 4, Washington St. 2
Washington St. 2, Fresno St. 1 (15 inn.)
Southern California 7, Washington St. 4
1967 DISTRICT RESULTS
DISTRICT 1 at Amherst, MA Massachusetts 4, Holy Cross 0
Massachusetts 6, Holy Cross 0
Boston College 4, Dartmouth 3
Dartmouth 9, Boston College 8
Boston College 15, Dartmouth 13
Boston College 4, Massachusetts 1
Massachusetts 6, Boston College 5 (11 inn.)
Boston College 7, Massachusetts 6 (12 inn.)
DISTRICT 2 at Princeton, NJ
St. John's (N.Y.) 1, Penn St. 0
Rider 4, Ithaca 1
Penn St. 16, Ithaca 5
Rider 9, St. John's (N.Y.) 1
St. John's (N.Y.) 10, Penn St. 5
Rider 4, St. John's (N.Y.) 3
DISTRICT 3 at Gastonia, NC
Florida St. 5, Clemson 3
Auburn 8, West Virginia 3 (12 inn.)
Clemson 5, West Virginia 0
Auburn 13, Florida St. 3
Clemson 6, Florida St. 4
Clemson 3, Auburn 2
Auburn 6, Clemson 5 (13 inn.)
DISTRICT 4 at Carbondale, IL
Ohio St. 3, Valparaiso 2
Southern Ill. 2, Western Mich. 1
DISTRICT 4
Western Mich. 6, Valparaiso 1
Ohio St. 5, Southern Ill. 4
Western Mich. 1, Southern Ill. 0 (12 inn.)
Western Mich. 5, Ohio St. 4
Ohio St. 5, Western Mich. 4
DISTRICT 5 at Stillwater, OK
Oklahoma St. 4, Cincinnati 0
Cincinnati 3, Oklahoma St. 2
Oklahoma St. 1, Cincinnati 0
DISTRICT 6
at Houston, TX
Houston 11, Texas 8
at Austin, TX
Texas 5, Houston 1
Houston, 4, Texas 3
DISTRICT 7 at Phoenix, AZ
Air Force 5, Idaho 0
Air Force 10, Idaho 7
Arizona St. 11, Air Force 0
Air Force 5, Arizona St. 2
Arizona St. 6, Air Force 0
DISTRICT 8
at Stanford, CA Fresno St. 7, Stanford 3
at Fresno, CA
Stanford 6, Fresno St. 3
Stanford 6, Fresno St. 4

196
1968 DISTRICT RESULTS
DISTRICT 1 at Storrs, CT
Connecticut 1, Providence 0
Harvard 4, Boston U. 1
Boston U. 5, Providence 4 (13 inn.)
Harvard 3, Connecticut 0
Connecticut 8, Boston U. 2
Harvard 3, Connecticut 2
DISTRICT 2 St. John's (N.Y.) 12, Rutgers 0
Temple 6, New York U. 5
New York U. 5, Rutgers 0
St. John's (N.Y.) 2, Temple 0
New York U. 5, Temple 2
St. John's (N.Y.) 1, New York U. 0
DISTRICT 3 at Gastonia, NC North Carolina St. 3, Alabama 1
East Caro. 2, Florida St. 1 (13 inn.)
Florida St. 6, Alabama 1
North Carolina St. 7, East Caro. 5
Florida St. 3, East Caro. 2
Florida St. 15, North Carolina St. 12
North Carolina St. 4, Florida St. 1
DISTRICT 4 at Minneapolis, MN Southern Ill. 6, Ohio 3
Minnesota 6, Valparaiso 4
Ohio 1, Valparaiso 0
Southern Ill. 10, Minnesota 9
Ohio 5, Minnesota 4
Southern Ill. 3, Ohio 0
DISTRICT 5 at Stillwater, OK Oklahoma St. 13, Bradley 1
Oklahoma St. 3, Bradley 0
DISTRICT 6 at Austin, TX Texas 3, Tex.-Pan American 0
Tex.-Pan American 2, Texas 1 (10 inn.)
Texas 10, Tex.-Pan American 6
DISTRICT 7 at Ogden, UT Denver 15, Northern Colo. 6
Northern Colo. 4, Weber St. 3
Weber St. 7, Denver 5
Weber St. 21, Northern Colo. 15
Weber St. 4, Denver 1
Brigham Young 17, Weber St. 7
Brigham Young 7, Weber St. 6 (10 inn.)
DISTRICT 8 at Los Angeles, CA Cal St. L.A. 2, Santa Clara 1
Cal St. L.A. 5, Santa Clara 3
Southern California 4, Cal St. L.A. 2
Cal St. L.A. 8, Southern California 4 (10 inn.)
Southern California 5, Cal St. L.A. 4 (10 inn.)
1969 DISTRICT RESULTS
DISTRICT 1 at Amherst, MA
Boston U. 13, Dartmouth 10 (11 inn.)
Massachusetts 5, Dartmouth 3
Massachusetts 8, Boston U. 6
Massachusetts 6, Boston U. 1
DISTRICT 2 at Coplay, PA Colgate 4, Seton Hall 3
New York U. 5, Seton Hall 3
New York U. 5, Colgate 1
Colgate 7, New York U. 1
New York U. 5, Colgate 1
DISTRICT 3 at Gastonia, NC Mississippi 7, Virginia Tech 6 (11 inn.)
North Carolina 3, Furman 0
Virginia Tech 6, Furman 3
Mississippi 6, North Carolina 5
North Carolina 5, Virginia Tech 1
Mississippi 5, North Carolina 2
DISTRICT 4 at Minneapolis, MN Southern Ill. 15, Ball St. 6
Minnesota 11, Ohio 8
DISTRICT 4 (Cont.) Ball St. 4, Ohio 3 (11 inn.)
Southern Ill. 4, Minnesota 3 (11 inn.)
Ball St. 4, Minnesota 1
Southern Ill. 4, Ball St. 3
DISTRICT 5 at Tulsa, OK Tulsa 5, Oklahoma St. 4 (12 inn.)
Tulsa 8, Oklahoma St. 4
DISTRICT 6 at Austin, TX Texas 10, Trinity (Tex.) 0
Texas 5, Trinity (Tex.) 0
DISTRICT 7 at Mesa, AZ Idaho 3, Air Force 1
Idaho 5, Air Force 4
Arizona St. 7, Idaho 1
Arizona St. 3, Idaho 2
DISTRICT 8 at Los Angeles, CA
UCLA 7, Santa Clara 5
UCLA 2, Santa Clara 1

197
1970 DISTRICT RESULTS
DISTRICT 1 at Hanover, NH Dartmouth 7, Providence 2
Connecticut 8, Providence 0
Dartmouth 8, Connecticut 2
Dartmouth 12, Connecticut 3
DISTRICT 2 at Princeton, NJ Delaware 7, Penn St. 1
Seton Hall 3, Rutgers 0
Penn St. 5, Rutgers 1
Delaware 5, Seton Hall 1
Seton Hall 1, Penn St. 0
Delaware 4, Seton Hall 0
DISTRICT 3 at Gastonia, NC
Florida St. 2, East Caro. 0
Maryland 3, Mississippi St. 2
Mississippi St. 12, East Caro. 6
Florida St. 10, Maryland 1
Mississippi St. 8, Maryland 4
Florida St. 5, Mississippi St. 4
DISTRICT 4 at Columbus, OH Ohio 6, Minnesota 4 (10 inn.)
Southern Ill. 10, Notre Dame 2
Notre Dame 6, Minnesota 1
Ohio 7, Southern Ill. 0
Southern Ill. 1, Notre Dame 0
Ohio 8, Southern Ill. 5
DISTRICT 5 at Ames, IA Iowa St. 7, Tulsa 6 (12 inn.)
Iowa St. 4, Tulsa 0
DISTRICT 6 at Austin, TX Tex.-Pan American 5, Arkansas St. 0
Texas 5, Arkansas St. 0
Texas 2, Tex.-Pan American 1
Texas 4, Tex.-Pan American 3 (11 inn.)
DISTRICT 7
at Denver, CO Denver 1, Weber St. 0
Denver 13, Weber St. 4
at Tucson, AZ
Arizona 4, Denver 2
Denver 9, Arizona 7 (12 inn.)
Arizona 9, Denver 8
DISTRICT 8 at Los Angeles, CA Santa Clara 4, Long Beach St. 3
Santa Clara 12, Long Beach St. 4
Southern California 12, Santa Clara 1
Southern California 6, Santa Clara 1
1971 DISTRICT RESULTS
DISTRICT 1 at Cambridge, MA Harvard 2, Massachusetts 1
Harvard 4, Massachusetts 2
DISTRICT 2 at Princeton, NJ Seton Hall 3, Buffalo 1
St. Joseph’s 3, Penn St. 0
Penn St. 2, Buffalo 0
Seton Hall 8, St. Joseph’s 1
St. Joseph’s 2, Penn St. 1
Seton Hall 4, St. Joseph’s 1
DISTRICT 3 at Gastonia, NC Mississippi St. 2, Maryland 1
Miami (Fla.) 4, Georgia Tech 3
Georgia Tech 9, Maryland 4
Mississippi St. 7, Miami (Fla.) 3
Georgia Tech 5, Miami (Fla.) 3
Georgia Tech 20, Mississippi St. 8
Mississippi St. 5, Georgia Tech 2
DISTRICT 4 at East Lansing, MI Southern Ill. 5, Ohio 4
Cincinnati 8, Michigan St. 7
Ohio 7, Michigan St. 1
Cincinnati 11, Southern Ill. 10
DISTRICT 4 (Cont.) Southern Ill. 7, Ohio 1 (13 inn.)
Southern Ill. 6, Cincinnati 2
Southern Ill. 10, Cincinnati 7
DISTRICT 5 at Tulsa, OK Tulsa 3, Iowa St. 2
Tulsa 5, Iowa St. 0
DISTRICT 6 at San Antonio, TX Tex.-Pan American 1, Texas 0
Tex.-Pan American 4, Texas 0
DISTRICT 7 at Provo, UT Gonzaga 12, Brigham Young 3
Brigham Young 5, Gonzaga 1
Brigham Young 15, Gonzaga 6
DISTRICT 8
at Santa Clara, CA Santa Clara 5, San Jose St. 0
Santa Clara 3, San Joes St. 1
Santa Clara 6, Southern California 5
at Los Angeles, CA Southern California 5, Santa Clara 1
Southern California 9, Santa Clara 1

198
1972 DISTRICT RESULTS
DISTRICT 1 at Storrs, CT Harvard 4, Providence 2 (12 inn.)
Connecticut 5, Northeastern 2
Northeastern 4, Providence 3
Connecticut 8, Harvard 5 (16 inn.)
Harvard 18, Northeastern 6
Connecticut 11, Harvard 2
DISTRICT 2 at Princeton, NJ
Temple 3, Penn St. 0
Long Island 2, St. John's (N.Y.) 1
Temple 1, Long Island 0
Penn St. 8, St. John's (N.Y.) 5
Penn St. 7, Long Island 5
Temple 4, Penn St. 3
DISTRICT 3 at Gastonia, NC South Ala. 6, Florida St. 5
Virginia 18, Richmond 2
Mississippi 9, Jacksonville 3
Florida St. 10, Richmond 5
South Ala. 9, Jacksonville 6
Virginia 9, Mississippi 3
Mississippi 8, Florida St. 3
South Ala. 6, Virginia 1
Mississippi 9, Virginia 0
Mississippi 8, South Ala. 4
Mississippi 12, South Ala. 1
DISTRICT 4 at Bowling Green, OH
Central Mich. 7, Iowa 2
Bowling Green 2, Northern Ill. 0
DISTRICT 4 (Cont.)
Iowa 8, Northern Ill. 1
Bowling Green 7, Central Mich. 5 (10 inn.)
Iowa 4, Central Mich. 3
Iowa 4, Bowling Green 2
Iowa 7, Bowling Green 5
DISTRICT 5
at Tulsa, OK Oklahoma 6, Tulsa 3
at Norman, OK Oklahoma 5, Tulsa 4
DISTRICT 6 at San Antonio, TX Tex.-Pan American 6, Trinity (Tex.) 1
Texas 4, Trinity (Tex.) 3 (14 inn.)
Texas 1, Tex.-Pan American 0
Texas 2, Tex.-Pan American 1
DISTRICT 7 at Mesa, AZ Arizona St. 8, Weber St. 1
Arizona St. 5, Weber St. 0
DISTRICT 8
at Santa Clara, CA Santa Clara 4, UC Santa Barb. 1
UC Santa Barb. 8, Santa Clara 2
UC Santa Barb. 6, Santa Clara 5
at Santa Barbara, CA
Southern California 9, UC Santa Barb. 5
Southern California 13, UC Santa Barb. 6
1973 DISTRICT RESULTS
DISTRICT 1 at Boston, MA Northeastern 3, Providence 2
Harvard 4, Massachusetts 2
Harvard 11, Northeastern 1
Providence 8, Massachusetts 7
Providence 5, Northeastern 4
Harvard 8, Providence 1
DISTRICT 2 at West Windsor, NJ Buffalo 1, Temple 0
Penn St. 5, Seton Hall 3
Temple 4, Seton Hall 2
Penn St. 3, Buffalo 1
Temple 4, Buffalo 3 (11 inn.)
Penn St. 4, Temple 2
DISTRICT 3 at Starkville, MS Miami (Fla.) 5, South Ala. 3
North Carolina St. 5, Appalachian St. 1
Vanderbilt 6, Ga. Southern 2
Appalachian St. 2, South Ala. 1
Ga. Southern 1, Miami (Fla.) 0
Vanderbilt 4, North Carolina St. 2 (13 inn.)
Appalachian St. 4, North Carolina St. 3 (10 inn.)
Ga. Southern 5, Vanderbilt 2
Miami (Fla.) 13, Appalachian St. 6
Miami (Fla.) 6, Vanderbilt 5
Ga. Southern 4, Miami (Fla.) 1
DISTRICT 4 at Carbondale, IL
Southern Ill. 5, Marshall 2
Minnesota 3, Miami (Ohio) 2
Miami (Ohio) 5, Marshall 2
Southern Ill. 8, Miami (Ohio) 1
Minnesota 2, Southern Ill. 0
Minnesota 7, Southern Ill. 6 (14 inn.)
DISTRICT 5 at Tulsa, OK Oklahoma 8, Creighton 1
Tulsa 6, Oral Roberts 0
Oral Roberts 11, Creighton 4
Oklahoma 4, Tulsa 1
Tulsa 2, Oral Roberts 1
Oklahoma 5, Tulsa 1 (13 inn.)
DISTRICT 6 at Arlington, TX Trinity (Tex.) 6, Arkansas 0
Texas 7, Tex.-Pan American 1
Tex.-Pan American 4, Arkansas 2 (14 inn.)
Texas 17, Trinity (Tex.) 2
Tex.-Pan American 4, Trinity (Tex.) 3 (11 inn.)
Texas 14, Tex.-Pan American 12 (13 inn.)

199
1973 DISTRICT RESULTS (cont.)
DISTRICT 7
at Spokane, WA Gonzaga 8, Denver 2
Denver 4, Gonzaga 3
Denver 4, Gonzaga 3
at Mesa, AZ
Arizona St. 14, Denver 1
DISTRICT 8 at Los Angeles, CA Southern California 9, Loyola Marymount 8
Southern California 2, Loyola Marymount 1
Southern California 4, Cal St. L.A. 3
Southern California 13, Cal St. L.A. 6
1974 DISTRICT RESULTS
DISTRICT 1 at Cambridge, MA Harvard 2, Providence 1
New Hampshire 2, Providence 1
Harvard 10, New Hampshire 1
Harvard 6, New Hampshire 0
DISTRICT 2 at West Windsor, NJ St. Joseph’s 4, St. John's (N.Y.) 1
Seton Hall 4, Penn St. 1
St. John's (N.Y.) 5, Penn St. 4 (10 inn.)
Seton Hall 4, St. Joseph’s 3
St. John's (N.Y.) 8, St. Joseph’s 0
Seton Hall 11, St. John's (N.Y.) 7
DISTRICT 3 at Starkville, MS South Carolina 9, North Carolina St. 0
Miami (Fla.) 2, Ga. Southern 1
Vanderbilt 2, East Caro. 1
Ga. Southern 8, North Carolina St. 1
South Carolina 5, East Caro. 1
Miami (Fla.) 7, Vanderbilt 1
Ga. Southern 5, Vanderbilt 3
Miami (Fla.) 5, South Carolina 0
South Carolina 1, Ga. Southern 0
South Carolina 3, Miami (Fla.) 1
Miami (Fla.) 2, South Carolina 1
DISTRICT 4 at Minneapolis, MN Miami (Ohio) 3, Cincinnati 0
Minnesota 9, Southern Ill. 4
Northern Ill. 6, Cincinnati 1
DISTRICT 4 (Cont.) Minnesota 4, Miami (Ohio) 3
Southern Ill. 6, Miami (Ohio) 2 (11 inn.)
Southern Ill. 10, Minnesota 2
Southern Ill. 4, Minnesota 3
DISTRICT 5 at Oklahoma City, OK Oklahoma 6, Tulsa 2
Oklahoma 5, Tulsa 4
DISTRICT 6 at Arlington, TX
Louisiana Tech 3, Tex.-Pan American 2
Texas 7, Tex.-Pan American 0
Louisiana Tech 5, Texas 4
Texas 8, Louisiana Tech 0
Texas 12, Louisiana Tech 2
DISTRICT 7 at Greeley, CO Northern Colo. 6, Gonzaga 3
Gonzaga 12, Northern Colo. 0
Northern Colo. 6, Gonzaga 2
Northern Colo. 6, Arizona 5
Northern Colo. 6, Arizona 2
DISTRICT 8 at Los Angeles, CA
at CSLA Southern California 9, Cal St. L.A. 2
Cal St. L.A. 7, Southern California 6
Southern California 11, Cal St. L.A. 9
at USC
Pepperdine 4, Southern California 2
Southern California 4, Pepperdine 1
Southern California 12, Pepperdine 1
1975 REGIONAL RESULTS
ATLANTIC REGIONAL at Columbia, SC Temple 4, North Carolina St. 3
South Carolina 11, Citadel 3
North Carolina St. 16, Citadel 3
South Carolina 15, Temple 0
North Carolina St. 4, Temple 2
South Carolina 4, Norh Caro. St. 3
MIDEAST REGIONAL at Ypsilanti, MI
Michigan 5, Penn St. 1
Eastern Mich. 5, Clemson 3
Penn St. 5, Clemson 4
Eastern Mich. 3, Michigan 2
Michigan 10, Penn St. 7
Michigan 4, Eastern Mich. 2
Eastern Mich. 2, Michigan 1
MIDWEST REGIONAL at Norman, OK Tulsa 3, Iowa 2 (14 inn.)
Oklahoma 5, Texas A&M 4
Texas A&M 9, Iowa 6
Oklahoma 6, Texas A&M 4
Tulsa 4, Oklahoma 3 (14 inn.)
Oklahoma 2, Tulsa 1
Oklahoma 8, Tulsa 5
NORTHEAST REGIONAL at Stamford, CT Seton Hall 7, Penn 5
St. John's (N.Y.) 17, Maine 3
Maine 1, Penn 0
Seton Hall 5, St. John's (N.Y.) 1
Maine 6, St. John's (N.Y.) 5 (10 inn.)
Seton Hall 11, Maine 7

200
1975 DISTRICT RESULTS (cont.)
ROCKY MOUNTAIN REGIONAL at Tempe, AZ
Arizona St. 18, Washington St. 2
Puget Sound 11, Northern Colo. 3
Washington St. 7, Northern Colo. 2
Arizona St. 20, Puget Sound 3
Washington St. 4, Puget Sound 3
Washington St. 8, Arizona St. 7
Arizona St. 5, Washington St. 1
SOUTH REGIONAL at Starkville, MS Florida St. 1, Miami (Fla.) 0
LSU 7, Murray St. 2
Miami (Fla.) 8, Murray St. 7
Florida St. 4, LSU 2
Miami (Fla.) 8, LSU 1
Florida St. 6, Miami (Fla.) 5
SOUTH CENTRAL REGIONAL at Arlington, TX South Ala. 8, Tex.-Pan American 7
Texas 6, Louisiana Tech 2
Tex.-Pan American 8, Louisiana Tech 1 (7 inn.)
Texas 7, South Ala. 4
Tex.-Pan American 9, South Ala. 8
Texas 9, Tex.-Pan American 2
WEST REGIONAL at Los Angeles, CA
Pepperdine 4, Arizona 3
Cal St. Fullerton 3, Southern California 1
Southern California 1, Arizona 0
Cal St. Fullerton 2, Pepperdine 1
Pepperdine 5, Southern California 2
Pepperdine 5, Cal St. Fullerton 4
Cal St. Fullerton 6, Pepperdine 4
1976 REGIONAL RESULTS
ATLANTIC REGIONAL at Columbia, SC Clemson 13, Furman 2
South Carolina 7, Virginia Tech 6 (10 inn.)
Furman 5, Virginia Tech 4
Clemson 10, South Carolina 4
Furman 12, South Carolina 1
Clemson 6, Furman 2
MIDEAST REGIONAL at Ypsilanti, MI
Illinois St. 5, Southern Ill. 2
Eastern Mich. 6, Michigan 0
Michigan 2, Southern Ill. 0
Eastern Mich. 3, Illinois St. 0
Michigan 5, Illinois St. 4
Michigan 9, Eastern Mich. 3
Eastern Mich. 6, Michigan 0
MIDWEST REGIONAL at Edinburg, TX Missouri 5, Texas A&M 3
Arizona 5, Tex.-Pan American 0
Texas A&M 2, Tex.-Pan American 1
Arizona 10, Missouri 1
Texas A&M 12, Missouri 3
Arizona 8, Texas A&M 2
NORTHEAST REGIONAL at Storrs, CT Seton Hall 8, St. John's (N.Y.) 0
Temple 6, Columbia 2
Maine 11, Penn St. 4
St. John's (N.Y.) 12, Columbia 5
Seton Hall 3, Penn St. 2
Maine 6, Temple 3
Temple 4, St. John's (N.Y.) 3
Maine 3, Seton Hall 1
Seton Hall 1, Temple 0
Maine 4, Seton Hall 2
ROCKY MOUNTAIN REGIONAL at Tempe, AZ Memphis 6, Minnesota 0
Arizona St. 13, Gonzaga 2
Minnesota 4, Gonzaga 0
Arizona St. 11, Memphis 4
Minnesota 17, Memphis 4
Arizona St. 12, Minnesota 5
SOUTH REGIONAL at Tallahassee, FL Auburn 10, Middle Tenn. St. 5
Florida St. 6, Jacksonville 1
Jacksonville 8, Middle Tenn. St. 5
Auburn 2, Florida St. 1
Jacksonville 9, Florida St. 7
Auburn 7, Jacksonville 5
SOUTH CENTRAL REGIONAL at Arlington, TX Oklahoma 11, Miami (Fla.) 3
Texas 3, Lamar 2
Miami (Fla.) 6, Lamar 0
Oklahoma 3, Texas 2
Texas 5, Miami (Fla.) 0
Texas 6, Oklahoma 5 (11 inn.)
Oklahoma 4, Texas 1
WEST REGIONAL at Pullman, WA Cal St. Fullerton 7, Northern Colo. 1
Washington St. 8, Pepperdine 2
Pepperdine 4, Northern Colo. 2
Washington St. 5, Cal St. Fullerton 1
Cal St. Fullerton 11, Pepperdine 3
Cal St. Fullerton 13, Washington St. 1
Washington St. 7, Cal St. Fullerton 2

201
1977 REGIONAL RESULTS
ATLANTIC REGIONAL at Columbia, SC Wake Forest 6, East Caro. 3
South Ala. 7, South Carolina 6
South Carolina 4, East Caro. 1
Wake Forest 9, South Ala. 6
South Carolina 11, South Ala. 2
South Carolina 5, Wake Forest 2
South Carolina 6, Wake Forest 1
MIDEAST REGIONAL at Minneapolis, MN
Central Mich. 2, Virginia Tech. 1
Minnesota 7, Florida 0
Florida 9, Virginia Tech 4
Minnesota 13, Central Mich. 2
Florida 13, Central Mich. 11
Minnesota 5, Florida 1
MIDWEST REGIONAL at Norman, OK Southern Ill. 4, Texas A&M 1
Oklahoma 3, Michigan 1
Michigan 13, Texas A&M 4
Southern Ill. 7, Oklahoma 3
Michigan 5, Oklahoma 2
Southern Ill. 9, Michigan 0
NORTHEAST REGIONAL at Storrs, CT Cornell 10, St. John's (N.Y.) 7 (12 inn.)
Catholic 4, Seton Hall 3
Temple 9, Connecticut 7
St. John's (N.Y.) 3, Seton Hall 2
Cornell 9, Connecticut 7
Temple 10, Catholic 3
St. John's (N.Y.) 8, Catholic 3
Temple 9, Cornell 6
St. John's (N.Y.) 11, Cornell 9
Temple 8, St. John's (N.Y.) 6
ROCKY MOUNTAIN REGIONAL at Tempe, AZ Washington St. 8, Portland St. 7
Arizona St. 6, Cal St. Fullerton 2
Cal St. Fullerton 5, Portland St. 3
Arizona St. 11, Washington St. 7
Washington St. 6, Cal St. Fullerton 5
Arizona St. 3, Washington St. 2
SOUTH REGIONAL at Coral Gables, FL Clemson 8, Mississippi 7
Miami (Fla.) 6, Morehead St. 1
Mississippi 5, Morehead St. 2
Clemson 7, Miami (Fla.) 2
Miami (Fla.) 5, Mississippi 2
Miami (Fla.) 10, Clemson 3
Clemson 10, Miami (Fla.) 9
SOUTH CENTRAL REGIONAL at Arlington, TX
Miami (Ohio) 1, Lamar 0
Baylor 10, New Orelans 1
New Orleans 5, Lamar 2
Miami (Ohio) 7, Baylor 3
Baylor 7, New Orleans 1
Baylor 12, Miami (Ohio) 7
Baylor 2, Miami (Ohio) 0
WEST REGIONAL at Honolulu, HI
Fresno St. 7, Cal St. L.A. 4
Southern California 6, Hawaii 1
Cal St. L.A. 8, Hawaii 4
Southern California 7, Fresno St. 3
Cal St. L.A. 15, Fresno St. 11
Cal St. L.A. 6, Southern California 5
Cal St. L.A. 7, Southern California 6
1978 REGIONAL RESULTS
ATLANTIC REGIONAL at Coral Gables, FL Marshall 4, Florida St. 0
Clemson 8, Miami (Fla.) 5
Miami (Fla.) 7, Florida St. 2
Marshall 9, Clemson 3
Miami (Fla.) 7, Clemson 5
Miami (Fla.) 6, Marshall 0
Miami (Fla.) 5, Marshall 1
MIDEAST REGIONAL at Ann Arbor, MI
Eastern Mich. 4, Missouri 2
Michigan 8, Texas A&M 1
Texas A&M 5, Missouri 1
Michigan 6, Eastern Mich. 4
Texas A&M 6, Eastern Mich. 1
Michigan 3, Texas A&M 0
MIDWEST REGIONAL at Tulsa, OK
Southern Ill. 7, Michigan St. 2
Oral Roberts 10, Oklahoma St. 3
Oklahoma St. 7, Michigan St. 6
Oral Roberts 8, Southern Ill. 5
Southern Ill. 4, Oklahoma St. 0
Oral Roberts 7, Southern Ill. 2
NORTHEAST REGIONAL at Holyoke, MA Delaware 1, Harvard 0 (6 inn.)
Holy Cross 5, St. John's (N.Y.) 3
Temple 5, Massachusetts 0
St. John's (N.Y.) 8, Harvard 0
Delaware 4, Massachusetts 3
Temple 8, Holy Cross 7 (10 inn.)
St. John's (N.Y.) 14, Holy Cross 12
Temple 12, Delaware 4
St. John's (N.Y.) 7, Delaware 4
St. John's (N.Y.) 8, Temple 5
St. John's (N.Y.) 15, Temple 6
ROCKY MOUNTAIN REGIONAL at Tempe, AZ
Gonzaga 7, Washington St. 1
UNLV 17, Arizona St. 10
Arizona St. 14, Washington St. 8
Gonzaga 5, UNLV 4
Arizona St. 30, UNLV 5
Arizona St. 17, Gonzaga 1
Arizona St. 11, Gonzaga 4

202
1978 REGIONAL RESULTS (cont.)
SOUTH REGIONAL at Auburn, AL
North Carolina 15, East Tenn. St. 1
Auburn 14, Memphis 10
Memphis 5, East Tenn. St. 0
North Carolina 3, Auburn 2
Memphis 6, Auburn 5
Memphis 8, North Carolina 6
North Carolina 11, Memphis 9
SOUTH CENTRAL REGIONAL at Arlington, TX
Tex.-Pan American 7, Louisiana Tech 0
Baylor 3, Mississippi St. 0
Mississippi St. 6, Louisiana Tech 5
Baylor 3, Tex.-Pan American 2 (10 inn.)
SOUTH CENTRAL REGIONAL (Cont.)
Mississippi St. 7, Tex.-Pan American 5 (11 inn.)
Baylor 6, Mississippi St. 3
WEST REGIONAL at Los Angeles, CA
Cal St. Fullerton 4, Santa Clara 0
Southern California 3, Arizona 2
Arizona 13, Santa Clara 6
Southern California 3, Cal St. Fullerton 2 (11 inn.)
Arizona 7, Cal St. Fullerton 3
Southern California 2, Arizona
1979 REGIONAL RESULTS
ATLANTIC REGIONAL at Coral Gables, FL Clemson 8, Ga. Southern 4
Miami (Fla.) 3, Citadel 1 (16 inn.)
Ga. Southern 5, Citadel 3
Miami (Fla.) 2, Clemson 1
Clemson 2, Ga. Southern 0
Miami (Fla.) 4, Clemson 1
CENTRAL REGIONAL at Austin, TX Texas 4, Tex.-Pan American 2
Lamar 3, Brigham Young 2
Brigham Young 11, Tex.-Pan American 5
Texas 6, Lamar 4
Brigham Young 7, Lamar 4
Texas 6, Brigham Young 2
EAST REGIONAL at Tallahassee, FL
Delaware 10, Seton Hall 1
Arkansas 12, George Washington 11
Florida 9, Florida St. 5
George Washington 5, Seton Hall 2
Delaware 7, Florida St. 6
Arkansas 9, Florida 1
Florida 12, George Washington 7
Arkansas 8, Delaware 6
Delaware 7, Florida 5
Arkansas 4, Delaware 3
MIDEAST REGIONAL at East Lansing, MI
San Diego St. 11, Miami (Ohio) 6
Pepperdine 15, Michigan St. 0
Michigan St. 6, Miami (Ohio) 4
Pepperdine 15, San Diego St. 9
San Diego St. 5, Michigan St. 4
Pepperdine 13, San Diego St. 2
MIDWEST REGIONAL at Tucson, AZ Hawaii 4, Indiana St. 3
Arizona 8, Oklahoma 1
Oklahoma 9, Indiana St. 2
Arizona 10, Hawaii 2
Hawaii 12, Oklahoma 8
Arizona 5, Hawaii 3
NORTHEAST REGIONAL at Annapolis, MD
Connecticut 5, Navy 4 (6 inn.)
St. John's (N.Y.) 5, Nebraska 0
Nebraska 13, Navy 4
St. John's (N.Y.) 6, Connecticut 3
Connecticut 15, Nebraska 0
Connecticut 14, St. John's (N.Y.) 4
Connecticut 4, St. John's (N.Y.) 0
SOUTH REGIONAL at Starkville, MS
Murray St. 5, Tulane 3
New Orleans 13, Mississippi St. 11
Mississippi St. 12, Tulane 4
Murray St. 16, New Orleans 15
Mississippi St. 13, New Orleans 10
Mississippi St. 8, Murray St. 6
Mississippi St. 18, Murray St. 8
WEST REGIONAL at Fresno, CA
UCLA 5, Cal St. Fullerton 4
Fresno St. 10, Portland 8 (12 inn.)
Cal St. Fullerton 20, Portland 3
UCLA 5, Fresno St. 4 (10 inn.)
Cal St. Fullerton 12, Fresno St. 3
Cal St. Fullerton 9, UCLA 2
Cal St. Fullerton 9, UCLA 5
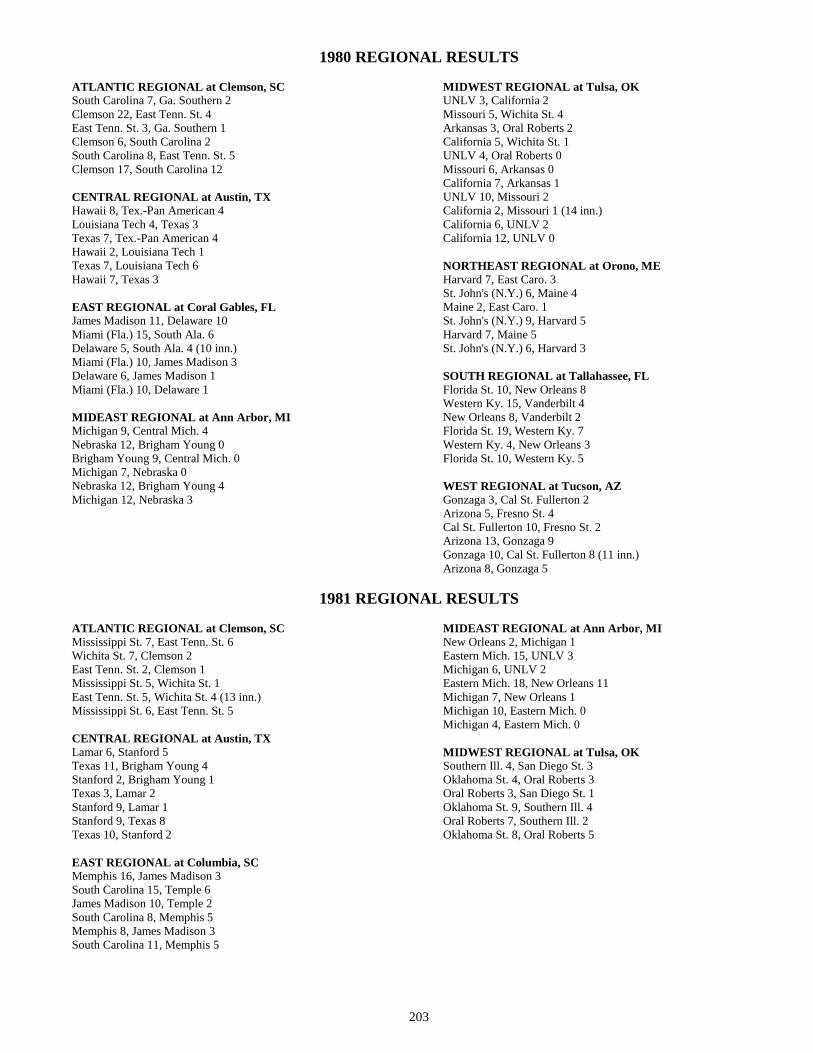
203
1980 REGIONAL RESULTS
ATLANTIC REGIONAL at Clemson, SC South Carolina 7, Ga. Southern 2
Clemson 22, East Tenn. St. 4
East Tenn. St. 3, Ga. Southern 1
Clemson 6, South Carolina 2
South Carolina 8, East Tenn. St. 5
Clemson 17, South Carolina 12
CENTRAL REGIONAL at Austin, TX
Hawaii 8, Tex.-Pan American 4
Louisiana Tech 4, Texas 3
Texas 7, Tex.-Pan American 4
Hawaii 2, Louisiana Tech 1
Texas 7, Louisiana Tech 6
Hawaii 7, Texas 3
EAST REGIONAL at Coral Gables, FL James Madison 11, Delaware 10
Miami (Fla.) 15, South Ala. 6
Delaware 5, South Ala. 4 (10 inn.)
Miami (Fla.) 10, James Madison 3
Delaware 6, James Madison 1
Miami (Fla.) 10, Delaware 1
MIDEAST REGIONAL at Ann Arbor, MI
Michigan 9, Central Mich. 4
Nebraska 12, Brigham Young 0
Brigham Young 9, Central Mich. 0
Michigan 7, Nebraska 0
Nebraska 12, Brigham Young 4
Michigan 12, Nebraska 3
MIDWEST REGIONAL at Tulsa, OK
UNLV 3, California 2
Missouri 5, Wichita St. 4
Arkansas 3, Oral Roberts 2
California 5, Wichita St. 1
UNLV 4, Oral Roberts 0
Missouri 6, Arkansas 0
California 7, Arkansas 1
UNLV 10, Missouri 2
California 2, Missouri 1 (14 inn.)
California 6, UNLV 2
California 12, UNLV 0
NORTHEAST REGIONAL at Orono, ME
Harvard 7, East Caro. 3
St. John's (N.Y.) 6, Maine 4
Maine 2, East Caro. 1
St. John's (N.Y.) 9, Harvard 5
Harvard 7, Maine 5
St. John's (N.Y.) 6, Harvard 3
SOUTH REGIONAL at Tallahassee, FL
Florida St. 10, New Orleans 8
Western Ky. 15, Vanderbilt 4
New Orleans 8, Vanderbilt 2
Florida St. 19, Western Ky. 7
Western Ky. 4, New Orleans 3
Florida St. 10, Western Ky. 5
WEST REGIONAL at Tucson, AZ Gonzaga 3, Cal St. Fullerton 2
Arizona 5, Fresno St. 4
Cal St. Fullerton 10, Fresno St. 2
Arizona 13, Gonzaga 9
Gonzaga 10, Cal St. Fullerton 8 (11 inn.)
Arizona 8, Gonzaga 5
1981 REGIONAL RESULTS
ATLANTIC REGIONAL at Clemson, SC Mississippi St. 7, East Tenn. St. 6
Wichita St. 7, Clemson 2
East Tenn. St. 2, Clemson 1
Mississippi St. 5, Wichita St. 1
East Tenn. St. 5, Wichita St. 4 (13 inn.)
Mississippi St. 6, East Tenn. St. 5
CENTRAL REGIONAL at Austin, TX
Lamar 6, Stanford 5
Texas 11, Brigham Young 4
Stanford 2, Brigham Young 1
Texas 3, Lamar 2
Stanford 9, Lamar 1
Stanford 9, Texas 8
Texas 10, Stanford 2
EAST REGIONAL at Columbia, SC
Memphis 16, James Madison 3
South Carolina 15, Temple 6
James Madison 10, Temple 2
South Carolina 8, Memphis 5
Memphis 8, James Madison 3
South Carolina 11, Memphis 5
MIDEAST REGIONAL at Ann Arbor, MI
New Orleans 2, Michigan 1
Eastern Mich. 15, UNLV 3
Michigan 6, UNLV 2
Eastern Mich. 18, New Orleans 11
Michigan 7, New Orleans 1
Michigan 10, Eastern Mich. 0
Michigan 4, Eastern Mich. 0
MIDWEST REGIONAL at Tulsa, OK Southern Ill. 4, San Diego St. 3
Oklahoma St. 4, Oral Roberts 3
Oral Roberts 3, San Diego St. 1
Oklahoma St. 9, Southern Ill. 4
Oral Roberts 7, Southern Ill. 2
Oklahoma St. 8, Oral Roberts 5

204
1981 REGIONAL RESULTS (cont.)
NORTHEAST REGIONAL at New Haven, CT
Maine 10, Central Mich. 2
St. John's (N.Y.) 1, Yale 0 (12 inn.)
Central Mich. 7, Yale 2
Maine 10, St. John's (N.Y.) 5
St. John's (N.Y.) 23, Central Mich. 13
St. John's (N.Y.) 10, Maine 5
Maine 15, St. John's (N.Y.) 0
SOUTH REGIONAL at Coral Gables, FL Florida St. 5, Florida 1
Middle Tenn. St. 4, Missouri 2
Miami (Fla.) 12, Minnesota 0
Florida 7, Missouri 3
Florida St. 9, Minnesota 5
Miami (Fla.) 2, Middle Tenn. St. 0
SOUTH REGIONAL (Cont.) Florida 7, Middle Tenn. St. 4 (10 inn.)
Miami (Fla.) 14, Florida St. 6
Florida 5, Florida St. 4
Miami (Fla.) 8, Florida 6
WEST REGIONAL at Tempe, AZ Cal St. Fullerton 9, Fresno St. 8
Arizona St. 9, Gonzaga 6
Fresno St. 10, Gonzaga 8
Arizona St. 18, Cal St. Fullerton 9
Cal St. Fullerton 10, Fresno St. 9
Arizona St. 12, Cal St. Fullerton 7
NOTE: From 1982 to 1986, the Division I Baseball Committee selected five, number-one seeds and placed each
in a different regional.
1982 REGIONAL RESULTS
ATLANTIC REGIONAL at Coral Gables, FL South Fla. 8, Florida 0
Miami (Fla.) 18, Stetson 2
Stetson 5, Florida 4
Miami (Fla.) 9, South Fla. 4
Stetson 5, South Fla. 4
Miami (Fla.) 15, Stetson 3
CENTRAL REGIONAL at Austin, TX
Eastern Mich. 7, Florida St. 2
Oklahoma 5, Ohio St. 2
(1) Texas 10, Hardin-Simmons 0
Florida St. 8, Ohio St. 3
Eastern Mich. 10, Hardin-Simmons 2
Texas 8, Oklahoma 0
Oklahoma 6, Florida St. 5
Texas 7, Eastern Mich. 2 (11 inn.)
Eastern Mich. 9, Oklahoma 2
Texas 9, Eastern Mich. 1
EAST REGIONAL at Columbia, SC
Old Dominion 2, East Caro. 1
Citadel 9, North Carolina 4
South Carolina 7, West Virginia 0
East Caro. 1, North Carolina 0
West Virginia 7, Old Dominion 6 (10 inn.)
South Carolina 6, Citadel 4
Citadel 15, Old Dominion 1
West Virginia 4, East Caro. 1
South Carolina 11, Citadel 2
South Carolina 2, West Virginia 1
MIDWEST REGIONAL at Stillwater, OK
Middle Tenn. St. 3, Oral Roberts 2
(1) Oklahoma St. 16, Minnesota 9
Minnesota 9, Oral Roberts 0
Oklahoma St. 5, Middle Tenn. St. 3
Middle Tenn. St. 7, Minnesota 1
Oklahoma St. 7, Middle Tenn. St. 3
NORTHEAST REGIONAL at Orono, ME
Delaware 4, Navy 3
Maine 6, Seton Hall 4
Navy 15, Seton Hall 5
Maine 13, Delaware 4
Navy 3, Delaware 1
Maine 4, Navy 3
SOUTH REGIONAL at New Orleans, LA (1) Wichita St. 3, Jackson St. 0
New Orleans 7, Tulane 5
Tulane 11, Jackson St. 5
Wichita St. 7, New Orleans 0
New Orleans 5, Tulane 4 (10 inn.)
Wichita St. 8, New Orleans 1
WEST I REGIONAL at Fresno, CA
Stanford 10, Hawaii 5
(1) Fresno St. 14, Pepperdine 5
Pepperdine 13, Hawaii 9
Stanford 17, Fresno St. 10
Pepperdine 11, Fresno St. 8
Stanford 15, Pepperdine 8
WEST II REGIONAL at Tempe, AZ
Cal St. Fullerton 7, Houston 3
(1) Arizona St. 6, San Diego St. 1
Houston 13, San Diego St. 3
Cal St. Fullerton 10, Arizona St. 9
Arizona St. 9, Houston 5
Cal St. Fullerton 8, Arizona St. 7

205
1983 REGIONAL RESULTS
CENTRAL REGIONAL at Austin, TX Tex.-Pan American 5, Grambling 0
Mississippi St. 4, Tulane 2
(1) Texas 15, La.-Monroe 0
Tulane 8, Grambling 7 (10 inn.)
Tex.-Pan American 9, La.-Monroe 8
Mississippi St. 6, Texas 2
Texas 7, Tulane 5
Mississippi St. 7, Tex.-Pan American 5
Texas 6, Tex.-Pan American 1
Texas 7, Mississippi St. 0
Texas 12, Mississippi St. 3
EAST REGIONAL at Chapel Hill, NC
James Madison 9, South Carolina 0
Citadel 14, Delaware 5
North Carolina 11, William & Mary 0
Delaware 12, South Carolina 11 (11 inn.)
James Madison 13, William & Mary 8
Citadel 5, North Carolina 3
Delaware 6, North Carolina 5
James Madison 5, Citadel 2
Delaware 7, Citadel 1
James Madison 6, Delaware 5
MIDEAST REGIONAL at Ann Arbor, MI
(1) Michigan 4, Morehead St. 3
Miami (Ohio) 7, Indiana St. 4
Morehead St. 7, Indiana St. 2
Michigan 6, Miami (Ohio) 4
Morehead St. 9, Miami (Ohio) 7
Michigan 10, Morehead St. 1
MIDWEST REGIONAL at Stillwater, OK
Oral Roberts 7, Arkansas 6
Oklahoma St. 9, Wichita St. 2
Wichita St. 6, Arkansas 3
Oklahoma St. 9, Oral Roberts 8
Oral Roberts 6, Wichita St. 5
Oklahoma St. 10, Oral Roberts 9
NORTHEAST REGIONAL at Orono, ME
Harvard 2, Temple 1
Maine 8, NYIT 2
Temple 10, NYIT 5
Maine 6, Harvard 2
Harvard 3, Temple 2
Maine 4, Harvard 3
SOUTH REGIONAL at Tallahassee, FL
Alabama 6, Miami (Fla.) 4
(1) Florida St. 8, South Ala. 2
Miami (Fla.) 14, South Ala. 5
Alabama 7, Florida St. 5
Miami (Fla.) 10, Florida St. 5
Alabama 11, Miami (Fla.) 9
WEST I REGIONAL at Stanford, CA San Diego St. 7, UC Santa Barb. 5
(1) Stanford 14, Oregon St. 0
UC Santa Barb. 7, Oregon St. 3
Stanford 4, San Diego St. 3 (11 inn.)
UC Santa Barb. 9, San Diego St. 5
Stanford 11, UC Santa Barb. 5
WEST II REGIONAL at Tempe, AZ Cal St. Fullerton 7, Fresno St. 5
Arizona St. 19, (1) Brigham Young 11
Fresno St. 13, Brigham Young 6
Arizona St. 8, Cal St. Fullerton 0
Fresno St. 6, Cal St. Fullerton 3
Arizona St. 7, Fresno St. 2
1984 REGIONAL RESULTS
CENTRAL REGIONAL at Austin, TX UNLV 2, Oklahoma 1
(1) Texas 6, Lamar 0
Lamar 4, Oklahoma 3
Texas 12, UNLV 3
Lamar 10, UNLV 5
Texas 6, Lamar 5 (10 inn.)
MIDEAST REGIONAL at Mt. Pleasant, MI
Michigan 13, Temple 9
Indiana St. 4, Central Mich. 2
Central Mich. 15, Temple 10
Michigan 8, Indiana St. 2
Central Mich. 4, Indiana St. 0
Michigan 4, Central Mich. 3
MIDWEST REGIONAL at Stillwater, OK Oklahoma City 2, Texas A&M 1
(1) Oklahoma St. 21, Grambling 5
Texas A&M 11, Grambling 5
Oklahoma City 5, Oklahoma St. 2
Oklahoma St. 5, Texas A&M 0
Oklahoma St. 11, Oklahoma City 1
Oklahoma St. 9, Oklahoma City 4
NORTHEAST REGIONAL at Orono, ME
Harvard 10, Seton Hall 8
Maine 12, Rider 6
Seton Hall 7, Rider 5
Maine 5, Harvard 4 (12 inn.)
Seton Hall 9, Harvard 1
Seton Hall 3, Maine 2
Maine 5, Seton Hall 2

206
1984 REGIONAL RESULTS (cont.)
SOUTH I REGIONAL at Tallahassee, FL East Caro. 5, South Ala. 4
Miami (Fla.) 6, Florida 5
Stetson 10, Florida St. 7
South Ala. 7, Florida 4
East Caro. 7, Florida St. 4
Miami (Fla.) 13, Stetson 8
Miami (Fla.) 6, East Caro. 4
South Ala. 10, Stetson 9
South Ala. 18, East Caro. 2
South Ala. 6, Miami (Fla.) 4
Miami (Fla.) 10, South Ala. 2
SOUTH II REGIONAL at Mississippi St., MS New Orleans 1, Appalachian St. 0
(1) North Carolina 4, Eastern Ky. 2
South Carolina 4, Mississippi St. 1
Eastern Ky. 10, Appalachian St. 9
Mississippi St. 11, New Orleans 4
South Carolina 5, North Carolina 4
SOUTH II REGIONAL (Cont.) New Orleans 13, North Carolina 6
Mississippi St. 13, Eastern Ky. 8
New Orleans 6, South Carolina 5
Mississippi St. 18, South Carolina 9
New Orleans 6, Mississippi St. 3
WEST I REGIONAL at Fresno, CA (1) Cal St. Fullerton 10, Southern California 6
San Diego St. 10, Fresno St. 6
Fresno St. 15, Southern California 12
Cal St. Fullerton 16, San Diego St. 6
San Diego St. 10, Fresno St. 7
San Diego St. 9, Cal St. Fullerton 5
Cal St. Fullerton 8, San Diego St. 7 (11 inn.)
WEST II REGIONAL at Tempe, AZ
Hawaii 10, Stanford 7 (10 inn.)
(1) Arizona St. 8, Washington St. 4
Stanford 3, Washington St. 1
Arizona St. 15, Hawaii 11
Stanford 11, Hawaii 7
Arizona St. 5, Stanford 4
1985 REGIONAL RESULTS
ATLANTIC REGIONAL at Coral Gables, FL Virginia 14, Florida 1
(1) Miami (Fla.) 22, Princeton 6
Florida 14, Princeton 4
Miami (Fla.) 11, Virginia 6
Florida 15, Virginia 2
Florida 8, Miami (Fla.) 1
Miami (Fla.) 12, Florida 9
CENTRAL REGIONAL at Austin, TX
Oklahoma 9, Lamar 1
Houston 11, LSU 4
Texas 4, Grambling 3 (12 inn.)
Lamar 4, LSU 3
Oklahoma 5, Grambling 2
Texas 9, Houston 2
Lamar 10, Houston 9
Texas 9, Oklahoma 4
Lamar 7, Oklahoma 5
Texas 10, Lamar 2
EAST REGIONAL at Columbia, SC Western Caro. 5, Old Dominion 3
St. John's (N.Y.) 14, Rider 9
South Carolina 11, La Salle 1
Rider 3, Old Dominion 2
La Salle 13, Western Caro. 12 (10 inn.)
South Carolina 13, St. John's (N.Y.) 6
Western Caro. 9, St. John's (N.Y.) 6
La Salle 17, Rider 12
South Carolina 14, Western Caro. 3
South Carolina 7, La Salle 2
MIDWEST REGIONAL at Stillwater, OK Wichita St. 12, Oral Roberts 1
(1) Oklahoma St. 8, Minnesota 3
Oral Roberts 17, Minnesota 8
Oklahoma St. 15, Wichita St. 8
Wichita St. 15, Oral Roberts 14
Wichita St. 7, Oklahoma St. 2
MIDWEST REGIONAL (cont.) Oklahoma St. 10, Wichita St. 6
SOUTH I REGIONAL at Mississippi St., MS New Orleans 12, Michigan 10 (13 inn.)
(1) Mississippi St. 10, West Virginia 1
Miichigan 9, West Virginia 2
Mississippi St. 8, New Orleans 4
Michigan 11, New Orleans 6
Michigan 14, Mississippi St. 6
Mississippi St. 19, Michigan 8
SOUTH II REGIONAL at Tallahassee, FL
(1) Arkansas 20, Eastern Ky. 13
Georgia Tech 7, Central Mich. 6
Florida St. 11, George Mason 0
Eastern Ky. 10, Central Mich. 7
Arkansas 13, George Mason 9
Florida St. 9, Georgia Tech 1
Arkansas 7, Florida St. 6
Georgia Tech 14, Eastern Ky. 13
Georgia Tech 8, Florida St. 3
Arkansas 7, Georgia Tech 5
WEST I REGIONAL at Stanford, CA Nebraska 4, Pepperdine 2
(1) Stanford 17, Oregon St. 3
Pepperdine 6, Oregon St. 1
Stanford 9, Nebraska 8
Pepperdine 7, Nebraska 6
Pepperdine 5, Stanford 1
Stanford 7, Pepperdine 1
WEST II REGIONAL at Fresno, CA Arizona 7, Brigham Young 3
Fresno St. 7, California 6 (10 inn.)
Brigham Young 9, California 5
Arizona 6, Fresno St. 0
Fresno St. 12, Brigham Young 8
Arizona 10, Fresno St. 3

207
1986 REGIONAL RESULTS
ATLANTIC REGIONAL at Coral Gables, FL Georgia Tech 9, Navy 8 (14 inn.)
South Carolina 5, Alabama 3
(1) Miami (Fla.) 10, Western Caro. 8
Alabama 4, Navy 1
Georgia Tech 8, Western Caro. 7 (11 inn.)
Miami (Fla.) 7, South Carolina 5
Miami (Fla.) 7, Georgia Tech 6 (10 inn.)
Alabama 8, South Carolina 7
Georgia Tech 12, Alabama 6
Miami (Fla.) 15, Georgia Tech 9
CENTRAL REGIONAL at Austin, TX Pepperdine 11, Tex.-Pan American 0
Arizona 26, San Diego St. 5
(1) Texas 21, Southern Ill. 7
Tex.-Pan American 10, San Diego St. 6
Pepperdine 5, Southern Ill. 3
Arizona 9, Texas 3
Arizona 10, Pepperdine 6
Texas 9, Tex.-Pan American 5
Pepperdine 2, Texas 0 (10 inn.)
Arizona 5, Pepperdine 3
MIDEAST REGIONAL at Ann Arbor, MI
Indiana St. 7, Michigan 1
Central Mich. 7, Oral Roberts 2
Oral Roberts 5, Michigan 4
Indiana St. 5, Central Mich. 3
Central Mich. 6, Oral Roberts 2
Indiana St. 7, Central Mich. 6 (11 inn.)
MIDWEST REGIONAL at Stillwater, OK Oklahoma St. 20, Richmond 8
Arkansas 4, Oregon St. 3
Stanford 11, Appalachian St. 1
Oregon St. 7, Richmond 1
Oklahoma St. 23, Appalachian St. 2
Stanford 2, Arkansas 0
MIDWEST REGIONAL (cont.) Oklahoma St. 16, Stanford 8
Oregon St. 1, Arkansas 0
Stanford 10, Oregon St. 7
Oklahoma St. 3, Stanford 0
NORTHEAST REGIONAL at Orono, ME
St. John's 8, Rider 2
Maine 5, Rutgers 1
Rider 9, Rutgers 4
Maine 13, St. John's (N.Y.) 7
St. John's (N.Y.) 16, Rider 3
Maine 21, St. John's (N.Y.) 8
SOUTH I REGIONAL at Baton Rouge, LA
Louisiana Tech 7, Tulane 5
Oklahoma 21, Eastern Ky. 14
(1) LSU 14, Jackson St. 11
Tulane 16, Eastern Ky. 6
Louisiana Tech 14, Jackson St. 6
LSU 8, Oklahoma 5
LSU 7, Louisiana Tech 4
Tulane 14, Oklahoma 5
Tulane 9, Louisiana Tech 4
LSU 7, Tulane 6
SOUTH II REGIONAL at Tallahassee, FL
Texas A&M 10, South Fla. 2
(1) Florida St. 10, North Carolina St. 6
South Fla. 12, North Carolina St. 4
Florida St. 12, Texas A&M 9
South Fla. 10, Texas A&M 7
Florida St. 11, South Fla. 7
WEST REGIONAL at Los Angeles, CA
UC Santa Barb. 11, Loyola Marymount 5 (10 inn.)
Hawaii 6, (1) UCLA 3
Loyola Marymount 12, UCLA 10
Hawaii 8, UC Santa Barb. 6
Loyola Marymount 14, UC Santa Barb. 6 (11 inn.)
Loyola Marymount 10, Hawaii 6
Loyola Marymount 12, Hawaii 5
NOTE: Starting in 1987, the committee selected eight No. 1 seeds and placed each in a different regional. The field was expanded to 48 teams.
1987 REGIONAL RESULTS
ATLANTIC REGIONAL at Tallahassee, FL
South Ala. 2, Central Mich. 0
Ga. Southern 11, Miami (Fla.) 6
(1) Florida St. 10, East Caro. 5
Central Mich. 17, East Caro. 9
Florida St. 5, Miami (Fla.) 2
South Ala. 6, Ga. Southern 1
Ga. Southern 3, Central Mich. 1
Florida St. 12, South Ala. 3
South Ala. 3, Ga. Southern 0
South Ala. 6, Florida St. 3
Florida St. 9, South Ala. 2
CENTRAL REGIONAL at Austin, TX Houston 10, Indiana St. 5
Sam Houston St. 5, Oklahoma 1
(1) Texas 6, Lamar 5 (10 inn.)
Indiana St. 10, Lamar 5
Texas 10, Oklahoma 5
Houston 8, Sam Houston St. 4
CENTRAL REGIONAL at Austin, TX (cont) Texas 15, Houston 3
Sam Houston St. 10, Indiana St. 8
Houston 4, Sam Houston St. 0
Texas 13, Houston 4
MIDEAST REGIONAL at Mississippi State, MS
Texas A&M 13, Purdue 3
Mississippi St. 10, North Carolina St. 6
(1) Oklahoma St. 6, Western Caro. 3
Western Caro. 8, Purdue 7
Oklahoma St. 8, North Carolina St. 6
Texas A&M 7, Mississippi St. 4
Western Caro. 8, Mississippi 1
Texas A&M 4, Oklahoma St. 1
Oklahoma St. 9,. Western Caro. 6
Oklahoma St. 7, Texas A&M 4
Oklahoma St. 11, Texas A&M 9

208
1987 REGIONAL RESULTS (cont.)
NORTHEAST REGIONAL at Atlanta, GA Fordham 5, Georgia 3
Dartmouth 4, Michigan 0
Rider 8, (1) Georgia Tech 5
Georgia 5, Georgia Tech 1
Michigan 10, Rider 0
Fordham 4, Dartmouth 2
Rider 6, Dartmouth 3
Georgia 10, Michigan 8
Rider 12, Fordham 0
Georgia 10, Fordham 4
Georgia 13, Rider 5
SOUTH I REGIONAL at Huntsville, AL Seton Hall 15, Auburn 6
Clemson 8, West Virginia 0
(1) Arkansas 10, Middle Tenn. St. 7
Auburn 5, Middle Tenn. St. 3
Arkansas 7, West Virginia 2
Clemson 6, Seton Hall 3
Auburn 22, Seton Hall 1
Arkansas 6, Clemson 5
Clemson 6, Auburn 3
Arkansas 4, Clemson 2
SOUTH II REGIONAL at New Orleans, LA
LSU 5, Tulane 3
New Orleans 18, Louisiana Tech 5
Southern U. 1, (1) Cal St. Fullerton 0
Cal St. Fullerton 4, Tulane 0
Louisiana Tech 5, Southern U. 2
LSU 14, New Orleans 1
SOUTH II REGIONAL at New Orleans, LA (cont.)
New Orleans 6, Southern U. 2
Cal St. Fullerton 11, Louisiana Tech 0
LSU 3, New Orleans 0
LSU 7, Cal St. Fullerton 3
WEST I REGIONAL at Stanford, CA Washington St. 10, Oral Roberts 5
Wichita St. 4, UC Santa Barb. 3
(1) Stanford 12, Minnesota 1
Oral Roberts 7, Minnesota 0
Stanford 12, UC Santa Barb. 5
Washington St. 4, Wichita St. 3
Oral Roberts 11, Wichita St. 4
Stanford 12, Washington St. 11
Oral Roberts 14, Washington St. 13 (12 inn.)
Stanford 9, Oral Roberts 4
WEST II REGIONAL at Tempe, AZ UCLA 12, Hawaii 11
Arizona St. 9, Missouri St. 5
(1) Pepperdine 7, Arizona 3
Hawaii 6, Arizona 3
Pepperdine 10, Missouri St. 4
Arizona St. 9, UCLA 3
UCLA 16, Hawaii 7
Arizona St. 4, Pepperdine 2
UCLA 21, Pepperdine 5
Arizona St. 14, UCLA 4
NOTE: Starting in 1988, the Division I Baseball Committee seeded each regional field.
1988 REGIONAL RESULTS
ATLANTIC REGIONAL at Coral Gables, FL
(2) Georgia Tech 9, (5) VCU 6
(1) Miami (Fla.) 4, (6) Towson 0
(3) South Carolina 3, (4) James Madison 2
Towson 4, VCU 2
Georgia Tech 7, South Carolina 6
Miami (Fla.) 18, James Madison 8
South Carolina 5, Towson 1
Miami (Fla.) 4, Georgia Tech 2
South Carolina 5, Georgia Tech 0
Miami (Fla.) 10, South Carolina 3
CENTRAL REGIONAL at Austin, TX
(2) California 13, (5) Penn 3
(1) Texas 7, (6) Southern U. 3
(4) Michigan 6, (3) New Orleans 4
Penn 10, Southern U. 6
Texas 16, New Orleans 10
California 8, Michigan 7 (11 inn.)
Michigan 7, Penn 6
California 8, Texas 7
Texas 5, Michigan 4
California 6, Texas 5
EAST REGIONAL at Tallahassee, FL (1) Florida 7, (6) George Mason 0
(2) Florida St. 10, (5) Stetson 3
(4) Tulane 1, (3) North Carolina St. 0
Stetson 2, George Mason 1
EAST REGIONAL at Tallahassee, FL (cont.) North Carolina St. 13, Florida 3
Florida St. 8, Tulane 6
Florida 9, Tulane 5
Stetson 4, North Carolina St. 1
Florida 9, Florida St. 3
Stetson 7, Florida St. 2
Florida 8, Stetson 0
MIDWEST REGIONAL at Stillwater, OK
(2) Wichita St. 6, (5) La.-Lafayette 2
(1) Oklahoma St. 14, (6) McNeese St. 4
(3) Loyola Marymount 8, (4) Arkansas 3
McNeese St. 11, La.-Lafayette 6
Oklahoma St. 13, Arkansas 7
Wichita St. 10, Loyola Marymount 6
Loyola Marymount 12, McNeese St. 4
Wichita St. 8, Oklahoma St. 5
Oklahoma St. 8, Loyola Marymount 6
Oklahoma St. 12, Wichita St. 7
Wichita St. 15, Oklahoma St. 5
NORTHEAST REGIONAL at New Britain, CT
(1) Clemson 3, (6) Fordham 2 (19 inn.)
(5) St. John's (N.Y.) 5, (2) Stanford 3
(3) Kentucky 6, (4) Rutgers 2
Stanford 7, Fordham 5
Rutgers 6, Clemson 1

209
1988 REGIONAL RESULTS (cont.)
NORTHEAST REGIONAL at New Britain, CT (cont.) Kentucky 12, St. John's (N.Y.) 5
Clemson 11, St. John's (N.Y.) 1
Stanford 8, Rutgers 1
Kentucky 8, Clemson 7
Stanford 6, Kentucky 5
Stanford 16, Kentucky 2
SOUTH REGIONAL at Mississippi State, MS
(2) Mississippi St. 7, (5) Western Caro. 4 (11 inn.)
(1) Texas A&M 8, (6) Middle Tenn. St. 6
(3) Cal St. Fullerton 6, (4) Missouri 3
Middle Tenn. St. 3, Texas A&M 1
Missouri 10, Middle Tenn. St. 6
Cal St. Fullerton 5, Mississippi St. 1
Mississippi St. 12, Middle Tenn. St. 4
Texas A&M 6, Missouri 2
Cal St. Fullerton 5, Mississippi St. 3 (12 inn.)
Cal St. Fullerton 6, Texas A&M 3
WEST I REGIONAL at Fresno, CA
(2) Washington St. 8, (5) Santa Clara 5
(1) Fresno St. 10, (6) Minnesota 8 (10 inn.)
(4) Southern California 9, (3) Brigham Young 8
Santa Clara 6, Minnesota 3
Fresno St. 9, Brigham Young 4
Southern California 10, Washington St. 9
Washington St. 6, Santa Clara 5
Southern California 18, Fresno St. 17
Fresno St. 7, Washington St. 6
Fresno St. 17, Southern California 12
Fresno St. 14, Southern California 3
WEST II REGIONAL at Tempe, AZ
(6) Evansville 1, (1) Arizona St. 0
(5) Pepperdine 10, (2) Oklahoma 1
(3) Central Mich. 10, (4) UNLV 7
Arizona St. 13, Oklahoma 6
UNLV 2, Evansville 1
Pepperdine 11, Central Mich. 8
Central Mich. 7, Evansville 6
Arizona St. 27, UNLV 8
Pepperdine 5, Central Mich. 4 (14 inn.)
Arizona St. 11, Pepperdine 4
Arizona St. 10, Pepperdine 5
1989 REGIONAL RESULTS
ATLANTIC REGIONAL at Tallahassee, FL
(4) Auburn 9, (3) South Fla. 3
(2) Clemson 6, (5) Stetson 2
(1) Florida St. 13, (6) Rider 7
Stetson 13, Rider 6
Florida St. 8, South Fla. 1
Auburn 14, Clemson 7
Clemson 13, Stetson 5
Florida St. 7, Auburn 6
Clemson 11, Auburn 1
Florida St. 8, Clemson 1
CENTRAL REGIONAL at College Station, TX
(2) LSU 12, (5) UNLV 10
(3) South Ala. 11, (4) Brigham Young 10 (10 inn.)
(1) Texas A&M 23, (6) Jackson St. 3
UNLV 13, Jackson St. 2
Texas A&M 25, Brigham Young 4
South Ala. 6, LSU 4
LSU 13, UNLV 8
Texas A&M 17, South Ala. 6
LSU 6, South Ala. 5
LSU 13, Texas A&M 5
LSU 5, Texas A&M 4 (11 inn.)
EAST REGIONAL at Gainesville, FL (1) Miami (Fla.) 3, (6) Villanova 1
(4) Central Fla. 6, (3) Georgia Tech 4
(2) Florida 11, (5) East Caro. 6
Villanova 10, East Caro. 6
Georgia Tech 9, Miami (Fla.) 7
Central Fla. 10, Florida 7
Miami (Fla.) 9, Florida 1
Villanova 18, Georgia Tech 16 (10 inn.)
Miami (Fla.) 10, Central Fla. 1
Villanova 5, Central Fla. 2
Miami (Fla.) 4, Villanova 1
MIDWEST REGIONAL at Austin, TX
(2) Oklahoma St. 6, (5) Sam Houston St. 5
(1) Texas 2, (6) New Orleans 0
(4) Western Mich. 9, (3) Southern California 8
New Orleans 8, Sam Houston St. 4
Texas 11, Southern California 8
Oklahoma St. 8, Western Mich. 3 (10 inn.)
New Orleans 6, Western Mich. 5
Texas 8, Oklahoma St. 7
New Orleans 3, Oklahoma St. 2
Texas 9, New Orleans 3
NORTHEAST REGIONAL at Waterbury, CT
(6) Le Moyne 7, (1) Arkansas 5
(2) Arizona St. 5, (5) George Washington 0
(4) Penn 7, (3) Illinois 1
Arkansas 8, George Washington 2
Illinois 7, Le Moyne 0
Arizona St. 15, Penn 4
Le Moyne 18, Penn 16 (12 inn.)
Arkansas 9, Illinois 2
Le Moyne 4, Arizona St. 2
Arkansas 1, Arizona St. 0
Arkansas 6, Le Moyne 5
SOUTH REGIONAL at Mississippi State, MS
(2) Jacksonville 3, (5) Indiana St. 2
(3) North Carolina 8, (4) Nicholls St. 4
(1) Mississippi St. 8, (6) Western Caro. 0
Indiana St. 10, Western Caro. 3
Mississippi St. 11, Nicholls St. 2
North Carolina 8, Jacksonville 3
Indiana St. 9, Jacksonville 4
North Carolina 2, Mississippi St. 1
Mississippi St. 11, Indiana St. 2
Mississippi St. 6, North Carolina 0
North Carolina 7, Mississippi St. 1

210
1989 REGIONAL RESULTS (cont.)
WEST I REGIONAL at Tucson, AZ (2) Oklahoma 5, (5) Loyola Marymount 2
(3) Long Beach St. 14, (4) Hawaii 7
(1) Arizona 12, (6) Eastern Ky. 6
Loyola Marymount 9, Eastern Ky. 3
Arizona 17, Hawaii 3
Long Beach St. 11, Oklahoma 4
Loyola Marymount 6, Oklahoma 5 (11 inn.)
Long Beach St. 10, Arizona 6
Arizona 13, Loyola Marymount 4
Long Beach St. 10, Arizona 3
WEST II REGIONAL at Fresno, CA (1) Wichita St. 4, (6) Portland 0
(3) Michigan 4, (4) Pepperdine 3
(2) Fresno St. 9, (5) Notre Dame 8
Norte Dame 8, Portland 6 (13 inn.)
Wichita St. 12, Pepperdine 1
Michigan 5, Fresno St. 3
Fresno St. 11, Notre Dame 4
Michigan 14, Wichita St. 5
Wichita St. 6, Fresno St. 4
Wichita St. 3, Michigan 2
Wichita St. 9, Michigan 5
1990 REGIONAL RESULTS
ATLANTIC REGIONAL at Coral Gables, FL (3) East Caro. 4, (4) South Fla. 2
(5) Citadel 11, (2) North Carolina St. 3
(1) Miami (Fla.) 4, (6) Stetson 3
North Carolina St. 13, Stetson 2
Miami (Fla.) 5, South Fla. 2
Citadel 8, East Caro. 5
North Carolina St. 8, East Caro. 1
Citadel 6, Miami (Fla.) 2
Miami (Fla.) 6, North Carolina St. 1
Citadel 4, Miami (Fla.) 1
CENTRAL REGIONAL at Austin, TX (5) Creighton 9, (2) Clemson 6
(1) Texas 9, (6) Texas-Arlington 8
(3) Cal St. Fullerton 16, (4) Old Dominion 3
Clemson 8, Texas-Arlington 5
Texas 10, Old Dominion 0
Cal St. Fullerton 6, Creighton 3
Cal St. Fullerton 5, Texas 2
Creighton 4, Clemson 3
Texas 11, Creighton 9
Cal St. Fullerton 3, Texas 0
MIDWEST REGIONAL at Wichita, KS (6) Fordham 8, (1) Arkansas 5
(3) South Ala. 6, (4) UCLA 4
(5) Ga. Southern 4, (2) Wichita St. 2 (13 inn.)
Wichita St. 7, Arkansas 6
UCLA 13, Fordham 8
Ga. Southern 13, South Ala. 4
South Ala. 6, Fordham 5
UCLA 7, Wichita St. 5
South Ala. 3, Ga. Southern 2
Ga. Southern 5, UCLA 4
Ga. Southern 6, South Ala. 5
NORTHEAST REGIONAL at Waterbury, CT (1) North Carolina 3, (6) Rutgers 2
(4) Maine 4, (3) Iowa 3
(2) Georgia 7, (5) Connecticut 2
Rutgers 15, Connecticut 5
North Carolina 5, Iowa 3
Georgia 6, Maine 3
Georgia 5, North Carolina 4
Rutgers 5, Maine 4
Rutgers 9, North Carolina 7
Rutgers 4, Georgia 3
Georgia 20, Rutgers 9
SOUTH I REGIONAL at Baton Rouge, LA
(3) Houston 4, (4) Georgia Tech 2
(2) Southern California 23, (5) Southern Miss. 5
(1) LSU 8, (6) La.-Lafayette 0
Southern Miss. 14, La.-Lafayette 10
LSU 11, Georgia Tech 5
Southern California 26, Houston 11
Southern California 5, LSU 4
Houston 15, Southern Miss. 3
LSU 6, Houston 4
LSU 5, Southern California 4
LSU 7, Southern California 6
SOUTH II REGIONAL at Mississippi State, MS
(1) Florida St. 7, (6) Lafayette 2
(3) Illinois 8, (4) Central Mich. 6
(2) Mississippi St. 16, (5) Brigham Young 5
Brigham Young 13, Lafayette 3
Florida St. 4, Central Mich. 2
Mississippi St. 5, Illinois 3
Mississippi St. 11, Florida St. 8
Illinois 8, Brigham Young 5
Florida St. 6, Illinois 4
Florida St. 11, Mississippi St. 9
Mississippi St. 4, Florida St. 3
WEST I REGIONAL at Stanford, CA
(3) San Diego St. 18, (4) Middle Tenn. St. 6
(5) Fresno St. 3, (2) Southern Ill. 2
(1) Stanford 7, (6) Campbell 0
Southern Ill. 8, Campbell 7
Stanford 6, Middle Tenn. St. 1
San Diego St. 8, Fresno St. 4
Stanford 6, San Diego St. 2
Southern Ill. 3, Fresno St. 1
San Diego St. 4, Southern Ill. 3 (10 inn.)
Stanford 6, San Diego St. 2
WEST II REGIONAL at Tempe, AZ (4) Washington St. 13, (3) Loyola Marymount 2
(2) Oklahoma St. 7, (5) UC Santa Barb. 2
(1) Arizona St. 12, (6) Penn 1
Penn 5, UC Santa Barb. 3
Arizona St. 11, Loyola Marymount 9
Oklahoma St. 14, Washington St. 0
Oklahoma St. 17, Arizona St. 9
Washington St. 8, Penn 2
Arizona St. 8, Washington St. 6 (10 inn.)
Oklahoma St. 10, Arizona St. 5
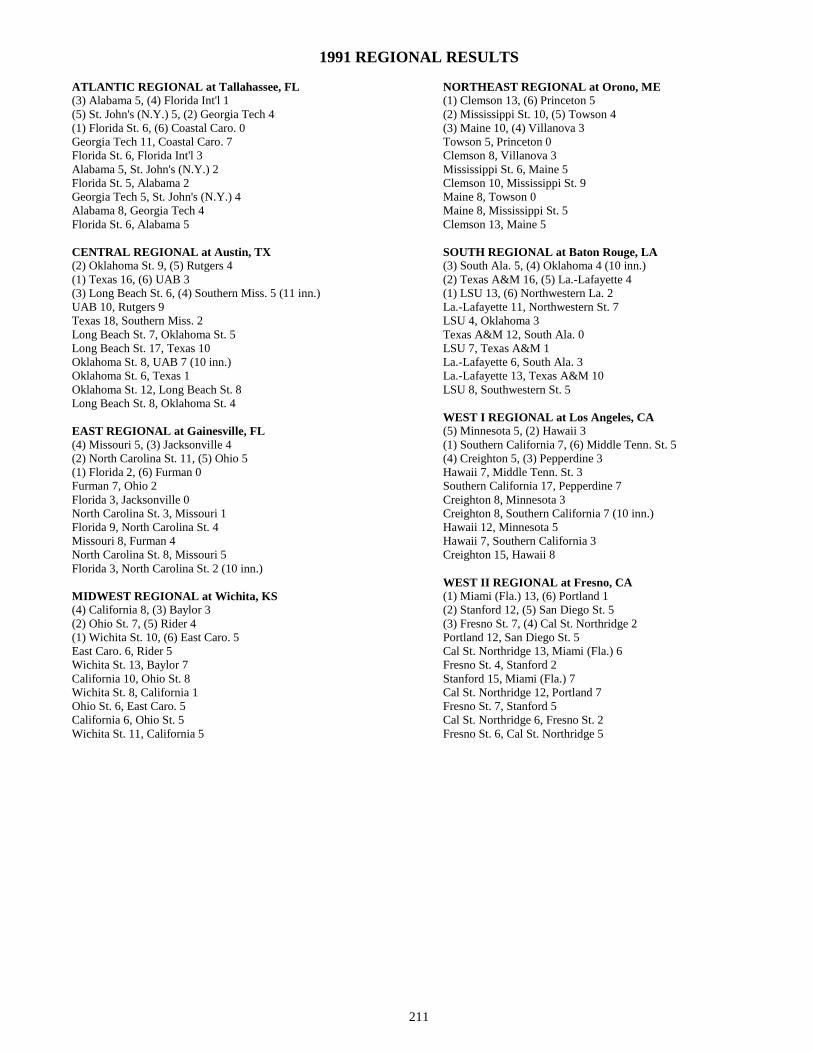
211
1991 REGIONAL RESULTS
ATLANTIC REGIONAL at Tallahassee, FL (3) Alabama 5, (4) Florida Int'l 1
(5) St. John's (N.Y.) 5, (2) Georgia Tech 4
(1) Florida St. 6, (6) Coastal Caro. 0
Georgia Tech 11, Coastal Caro. 7
Florida St. 6, Florida Int'l 3
Alabama 5, St. John's (N.Y.) 2
Florida St. 5, Alabama 2
Georgia Tech 5, St. John's (N.Y.) 4
Alabama 8, Georgia Tech 4
Florida St. 6, Alabama 5
CENTRAL REGIONAL at Austin, TX (2) Oklahoma St. 9, (5) Rutgers 4
(1) Texas 16, (6) UAB 3
(3) Long Beach St. 6, (4) Southern Miss. 5 (11 inn.)
UAB 10, Rutgers 9
Texas 18, Southern Miss. 2
Long Beach St. 7, Oklahoma St. 5
Long Beach St. 17, Texas 10
Oklahoma St. 8, UAB 7 (10 inn.)
Oklahoma St. 6, Texas 1
Oklahoma St. 12, Long Beach St. 8
Long Beach St. 8, Oklahoma St. 4
EAST REGIONAL at Gainesville, FL
(4) Missouri 5, (3) Jacksonville 4
(2) North Carolina St. 11, (5) Ohio 5
(1) Florida 2, (6) Furman 0
Furman 7, Ohio 2
Florida 3, Jacksonville 0
North Carolina St. 3, Missouri 1
Florida 9, North Carolina St. 4
Missouri 8, Furman 4
North Carolina St. 8, Missouri 5
Florida 3, North Carolina St. 2 (10 inn.)
MIDWEST REGIONAL at Wichita, KS
(4) California 8, (3) Baylor 3
(2) Ohio St. 7, (5) Rider 4
(1) Wichita St. 10, (6) East Caro. 5
East Caro. 6, Rider 5
Wichita St. 13, Baylor 7
California 10, Ohio St. 8
Wichita St. 8, California 1
Ohio St. 6, East Caro. 5
California 6, Ohio St. 5
Wichita St. 11, California 5
NORTHEAST REGIONAL at Orono, ME
(1) Clemson 13, (6) Princeton 5
(2) Mississippi St. 10, (5) Towson 4
(3) Maine 10, (4) Villanova 3
Towson 5, Princeton 0
Clemson 8, Villanova 3
Mississippi St. 6, Maine 5
Clemson 10, Mississippi St. 9
Maine 8, Towson 0
Maine 8, Mississippi St. 5
Clemson 13, Maine 5
SOUTH REGIONAL at Baton Rouge, LA (3) South Ala. 5, (4) Oklahoma 4 (10 inn.)
(2) Texas A&M 16, (5) La.-Lafayette 4
(1) LSU 13, (6) Northwestern La. 2
La.-Lafayette 11, Northwestern St. 7
LSU 4, Oklahoma 3
Texas A&M 12, South Ala. 0
LSU 7, Texas A&M 1
La.-Lafayette 6, South Ala. 3
La.-Lafayette 13, Texas A&M 10
LSU 8, Southwestern St. 5
WEST I REGIONAL at Los Angeles, CA
(5) Minnesota 5, (2) Hawaii 3
(1) Southern California 7, (6) Middle Tenn. St. 5
(4) Creighton 5, (3) Pepperdine 3
Hawaii 7, Middle Tenn. St. 3
Southern California 17, Pepperdine 7
Creighton 8, Minnesota 3
Creighton 8, Southern California 7 (10 inn.)
Hawaii 12, Minnesota 5
Hawaii 7, Southern California 3
Creighton 15, Hawaii 8
WEST II REGIONAL at Fresno, CA
(1) Miami (Fla.) 13, (6) Portland 1
(2) Stanford 12, (5) San Diego St. 5
(3) Fresno St. 7, (4) Cal St. Northridge 2
Portland 12, San Diego St. 5
Cal St. Northridge 13, Miami (Fla.) 6
Fresno St. 4, Stanford 2
Stanford 15, Miami (Fla.) 7
Cal St. Northridge 12, Portland 7
Fresno St. 7, Stanford 5
Cal St. Northridge 6, Fresno St. 2
Fresno St. 6, Cal St. Northridge 5

212
1992 REGIONAL RESULTS
ATLANTIC REGIONAL at Coral Gables, FL
(3) South Carolina 5, (4) Notre Dame 1
(2) North Carolina St. 6, (5) Delaware 2
(1) Miami (Fla.) 3, (6) Md.-Balt. County 1
Delaware 6, Md.-Balt. County 5 (10 inn.)
Notre Dame 6, Miami (Fla.) 3
South Carolina 9, North Carolina St. 6
Miami (Fla.) 5, North Carolina St. 4
Notre Dame 12, Delaware 6
Miami (Fla.) 17, South Carolina 2
Notre Dame 11, South Carolina 2
Miami (Fla.) 5, Notre Dame 1
CENTRAL REGIONAL at Austin, TX (2) Long Beach St. 7, (5) La.-Lafayette 6
(1) Texas 2, (6) VCU 0
(3) Creighton 11, (4) Texas-Arlington 6
VCU 12, La.-Lafayette 5
Texas 17, Texas-Arlington 1
Long Beach St. 5, Creighton 2
Texas 9, Long Beach St. 1
VCU 5, Creighton 4 (11 inn.)
VCU 16, Long Beach St. 6
VCU 4, Texas 2
Texas 12, VCU 3
EAST REGIONAL at Gainesville, FL (3) Texas A&M 15, (4) California 6
(2) Georgia Tech 5, (5) George Mason 4
(1) Florida 6, (6) Rider 1
George Mason 10, Rider 2
California 4, Florida 3 (10 inn.)
Georgia Tech 3, Texas A&M 2 (10 inn.)
Texas A&M 6, Florida 5
California 16, George Mason 5
Texas A&M 7, Georgia Tech 5
California 3, Georgia Tech 2
California 11, Texas A&M 4
MIDEAST REGIONAL at Mississippi State, MS (1) Clemson 8, (6) Yale 4
(3) Oklahoma 4, (4) UCLA 3 (13 inn.)
(2) Mississippi St. 1, (5) Nicholls St. 0 (11 inn.)
Yale 13, Nicholls St. 4
UCLA 6, Clemson 5
Mississippi St. 9, Oklahoma 6
Oklahoma 7, Clemson 6
UCLA 8, Yale 0
Oklahoma 10, Mississippi St. 6
UCLA 3, Mississippi St. 2
Oklahoma 10, UCLA 0
MIDWEST REGIONAL at Wichita, KS
(3) Cal St. Northridge 5, (4) Arizona St. 1
(2) Oklahoma St. 12, (5) Minnesota 11
(1) Wichita St. 9, (6) George Washington 0
Minnesota 19, George Washington 3
Wichita St. 3, Arizona St. 1
Oklahoma St. 5, Cal St. Northridge 0
Wichita St. 5, Oklahoma St. 0
Minnesota 7, Cal St. Northridge 6
Oklahoma St. 15, Minnesota 6
Wichita St. 5, Oklahoma St. 2
SOUTH I REGIONAL at Baton Rouge, LA
(3) Cal St. Fullerton 3, (4) Ohio St. 2
(5) Tulane 4, (2) South Ala. 2
(1) LSU 8, (6) Providence 1
Providence 4, South Ala. 0
Ohio St. 5, LSU 0
Cal St. Fullerton 8, Tulane 0
LSU 7, Tulane 3
Ohio St. 7, Providence 6 (12 inn.)
Cal St. Fullerton 11, LSU 0
Cal St. Fullerton 13, Ohio St. 1
SOUTH II REGIONAL at Tallahassee, FL (1) Stanford 2, (6) Stetson 1 (12 inn.)
(4) Kent 5, (3) Georgia 2
(5) Western Caro. 1, (2) Florida St. 0
Florida St. 2, Stetson 0
Stanford 7, Georgia 3
Western Caro. 14, Kent 1
Western Caro. 5, Stanford 0
Florida St. 4, Kent 2
Florida St. 9, Stanford 4
Florida St. 4, Western Caro. 3
Florida St. 18, Western Caro. 3
WEST REGIONAL at Tucson, AZ (3) Pepperdine 5, (4) Fresno St. 4 (10 inn.)
(5) Southeastern La. 8, (2) Hawaii 0
(6) Washington 6, (1) Arizona 5
Hawaii 10, Arizona 3
Washington 4, Fresno St. 3
Pepperdine 8, Southeastern La. 5
Pepperdine 11, Washington 0
Hawaii 10, Southeastern La. 3
Hawaii 9, Washington 3
Hawaii 6, Pepperdine 3
Pepperdine 9, Hawaii 0

213
1993 REGIONAL RESULTS
ATLANTIC REGIONAL at Atlanta, GA
(3) Wichita St. 14, (4) Ohio St. 5
(2) South Carolina 6, (5) East Caro. 5
(1) Georgia Tech 4, (6) Liberty 1
East Caro. 6, Liberty 0
Ohio St. 7, Georgia Tech 4
Wichita St. 3, South Carolina 2
Georgia Tech 12, South Carolina 0
Ohio St. 6, East Caro. 2
Wichita St. 5, Georgia Tech 4 (10 inn.)
Ohio St. 8, Wichita St. 6
Wichita St. 5, Ohio St. 3
CENTRAL I REGIONAL at College Station, TX
(3) UCLA 6, (4) Lamar 1
(5) Hawaii 9, (2) North Carolina 8
(1) Texas A&M 13, (6) Yale 1
North Carolina 11, Yale 6
Texas A&M 10, Lamar 5
UCLA 9, Hawaii 4
Texas A&M 11, UCLA 4
North Carolina 10, Hawaii 8
North Carolina 8, UCLA 5
Texas A&M 14, North Carolina 2
CENTRAL II REGIONAL at Austin, TX (2) Cal St. Fullerton 11, (5) Maine 5
(1) Texas 7, (6) McNeese St. 4
(4) Southern California 7, (3) Kentucky 1
McNeese St. 16, Maine 3
Texas 8, Kentucky 3
Southern California 5, Cal St. Fullerton 2
Texas 11, Southern California 3
Cal St. Fullerton 2, McNeese St. 0
Southern California 5, Cal St. Fullerton 2
Texas 3, Southern California 2
EAST REGIONAL at Tallahassee, FL (1) Long Beach St. 11, (6) Central Fla. 6
(4) Notre Dame 15, (3) Mississippi St. 1
(2) Florida St. 4, (5) South Fla. 2
Central Fla. 4, South Fla. 3
Long Beach St. 2, Mississippi St. 1
Florida St. 7, Notre Dame 3 (10 inn.)
Long Beach St. 4, Florida St. 1
Notre Dame 12, Central Fla. 3
Notre Dame 4, Florida St. 3
Long Beach St. 13, Notre Dame 3
MIDEAST REGIONAL at Knoxville, TN (4) Fresno St. 7, (3) Kansas 4
(2) Clemson 7, (5) Rutgers 3
(1) Tennessee 7, (6) Charlotte 4
Rutgers 5, Charlotte 1
Kansas 3, Tennessee 2
Clemson 10, Fresno St. 3
Fresno St. 6, Tennessee 2
Kansas 8, Rutgers 2
Fresno St. 11, Clemson 4
Kansas 9, Clemson 1
Kansas 3, Fresno St. 2 (10 inn.)
MIDWEST REGIONAL at Stillwater, OK (1) North Carolina St. 12, (6) Fordham 4
(4) Auburn 9, (3) Arizona 1
(2) Oklahoma St. 9, (5) Connecticut 5
Fordham 5, Connecticut 0
Arizona 5, North Carolina St. 2
Oklahoma St. 14, Auburn 10
North Carolina St. 13, Auburn 2
Arizona 18, Fordham 7
Oklahoma St. 8, North Carolina St. 3
Arizona 4, Oklahoma St. 0
Oklahoma St. 11, Arizona 10
SOUTH REGIONAL at Baton Rouge, LA (4) Baylor 4, (3) Kent 1
(5) South Ala. 7, (2) Miami (Fla.) 3
(1) LSU 7, (6) Western Caro. 2
Western Caro. 10, Miami (Fla.) 5
Kent 15, LSU 12
South Ala. 9, Baylor 3
LSU 13, Baylor 6
Kent 8, Western Caro. 5
LSU 11, South Ala. 4
South Ala. 7, Kent 6
LSU 9, South Ala. 4
WEST REGIONAL at Tempe, AZ (3) Pepperdine 4, (4) Minnesota 1
(2) Cal St. Northridge 3, (5) St. John's (N.Y.) 1
(1) Arizona St. 13, (6) George Mason 4
St. John's (N.Y.) 16, George Mason 9
Arizona St. 6, Minnesota 5
Cal St. Northridge 7, Pepperdine 6
Arizona St. 9, Cal St. Northridge 0
St. John's (N.Y.) 4, Pepperdine 1
St. John's (N.Y.) 11, Cal St. Northridge 10
Arizona St. 12, St. John's (N.Y.) 2

214
1994 REGIONAL RESULTS
ATLANTIC I REGIONAL at Miami, FL
(4) Minnesota 11, (3) Kent 6
(2) Florida 8, (5) West Virginia 7
(1) Miami (Fla.) 17, (6) Rider 4
West Virginia 19, Rider 7
Miami (Fla.) 4, Kent 1
Minnesota 12, Florida 2
Miami (Fla.) 11, Minnesota 3
Florida 12, West Virginia 8
Florida 4, Minnesota 1
Miami (Fla.) 10, Florida 6
ATLANTIC II REGIONAL at Tallahassee, FL
(1) Ohio St. 6, (6) Brigham Young 1
(4) Jacksonville 7, (3) Kansas 2
(2) Florida St. 8, (5) Central Mich. 6
Brigham Young 8, Central Mich. 6
Kansas 20, Ohio St. 6
Florida St. 5, Jacksonville 1
Jacksonville 6, Ohio St. 5
Brigham Young 8, Kansas 3
Florida St. 5, Jacksonville 1
Florida St. 7, Brigham Young 1
CENTRAL REGIONAL at Austin, TX (1) Oklahoma 10, (6) Arkansas St. 3
(3) Texas 8, (4) Stanford 4
(2) Nevada 11, (5) UTSA 8
Arkansas St. 10, UTSA 5
Oklahoma 10, Stanford 4
Texas 16, Nevada 6
Oklahoma 15, Texas 4
Arkansas St. 4, Nevada 2
Texas 9, Arkansas St. 4
Oklahoma 6, Texas 3
EAST REGIONAL at Clemson, SC
(3) Old Dominion 9, (4) Notre Dame 5
(2) Auburn 7, (5) Virginia Tech 0
(1) Clemson 5, (6) Citadel 1
Citadel 4, Virginia Tech 3
Notre Dame 8, Clemson 1
Auburn 11, Old Dominion 8 (10 inn.)
Clemson 6, Old Dominion 1
Notre Dame 5, Citadel 1
Auburn 11, Clemson 5
Auburn 8, Notre Dame 0
MIDEAST REGIONAL at Knoxville, TN (3) Arizona St. 8, (4) Western Caro. 6
(5) Wright St. 14, (2) North Carolina St. 12
(1) Tennessee 9, (6) Northeastern 6
North Carolina St. 5, Northeastern 2
Tennessee 6, Western Caro. 4
Arizona St. 7, Wright St. 4
Arizona St. 10, Tennessee 5
North Carolina St. 10, Wright St. 6
Tennessee 15, North Carolina St. 4
Arizona St. 5, Tennessee 4 (10 inn.)
MIDWEST I REGIONAL at Stillwater, OK
(3) TCU 11, (4) Memphis 3
(2) Cal St. Fullerton 11, (5) Northwestern St. 3
(1) Oklahoma St. 8, (6) Illinois St. 2
Northwestern St. 8, Illinois St. 2
Memphis 12, Oklahoma St. 4
Cal St. Fullerton 4, TCU 1
Oklahoma St. 10, TCU 8
Memphis 14, Northwestern St. 9
Oklahoma St. 13, Cal St. Fullerton 11
Cal St. Fullerton 12, Memphis 5
Cal St. Fullerton 6, Oklahoma St. 5 (10 inn.)
MIDWEST II REGIONAL at Wichita, KS
(1) Georgia Tech 7, (6) Connecticut 0
(5) Washington 10, (2) Long Beach St. 4
(4) Santa Clara 2, (3) Wichita St. 1
Long Beach St. 16, Connecticut 9
Georgia Tech 13, Wichita St. 1
Washington 11, Santa Clara 7
Georgia Tech 6, Washington 2
Long Beach St. 6, Santa Clara 3
Washington 6, Long Beach St. 2
Washington 12, Georgia Tech 9 (14 inn.)
Georgia Tech 18, Washington 7
SOUTH REGIONAL at Baton Rouge, LA
(3) Tulane 7, (4) Fresno St. 5
(2) Southern California 19, (5) UNC Greensboro 3
(1) LSU 10, (6) Southeastern La. 6
UNC Greensboro 22, Southeastern La. 12
LSU 6, Fresno St. 2
Southern California 5, Tulane 0
LSU 6, Southern California 2
UNC Greensboro 4, Tulane 1
Southern California 25, UNC Greensboro 9
LSU 12, Southern California 10

215
1995 REGIONAL RESULTS
ATLANTIC I REGIONAL at Tallahassee, FL (4) Central Fla. 6, (3) South Ala. 5
(5) Old Dominion 5, (2) Mississippi 3
(1) Florida St. 18, (6)Troy 3
Mississippi 8, Troy 5
Florida St. 7, South Ala. 2
Old Dominion 7, Central Fla. 6
Florida St. 7, Old Dominion 2
Mississippi 10, Central Fla. 4
Mississippi 5, Old Dominion 4
Florida St. 13, Mississippi 1
ATLANTIC II REGIONAL at Coral Gables, FL (3) North Carolina 6, (4) South Fla. 3
(5) Florida Int'l 9, (2) Texas A&M 5
(1) Miami (Fla.) 3, (6) Massachusetts 1
Texas A&M 14, Massachusetts 11
Miami (Fla.) 11, South Fla. 10
North Carolina 6, Florida Int'l 5
Miami (Fla.) 8, North Carolina 4
Texas A&M 4, Florida Int'l 2
Texas A&M 7, North Carolina 0
Texas A&M 4, Miami (Fla.) 0
Miami (Fla.) 5, Texas A&M 2
EAST REGIONAL at Clemson, SC
(4) Richmond 8, (3) Jacksonville 2
(5) Winthrop 4, (2) Alabama 0
(1) Clemson 8, (6) Navy 4
Alabama 6, Navy 0
Clemson 11, Jacksonville 5
Winthrop 9, Richmond 8
Alabama 11, Richmond 4
Clemson 9, Winthrop 5
Alabama 14, Winthrop 0
Clemson 7, Alabama 4
MIDEAST REGIONAL at Knoxville, TN
(3) California 4, (4) Georgia Tech 3
(2) Oklahoma St. 6, (5) Pittsburgh 3
(1) Tennessee 5, (6) Citadel 2
Pittsburgh 12, Citadel 10
Tennessee 6, Georgia Tech 4
Oklahoma St. 15, California 4
Tennessee 14, Oklahoma St. 10
Pittsburgh 9, California 4
Oklahoma St. 15, Pittsburgh 13
Tennessee 3, Oklahoma St. 1 (11 inn.)
MIDWEST I REGIONAL at Wichita St.
(1) Texas Tech 24, (6) Providence 5
(5) Lamar 13, (2) Wichita St. 11
(3) Stanford 10, (4) Arkansas 3
Wichita St. 6, Providence 2
Texas Tech 14, Arkansas 10
Stanford 8, Lamar 1
Texas Tech 3, Stanford 1
Lamar 4, Wichita St. 1
Stanford 16, Lamar 9
Stanford 3, Texas Tech 2
Stanford 6, Texas Tech 5
MIDWEST II REGIONAL at Oklahoma City, OK
(1) Auburn 2, (6) Penn 1
(3) Texas 10, (4) Ohio St. 5
(2) Oklahoma 9, (5) Indiana St. 6
Indiana St. 6, Penn 5
Auburn 8, Ohio St. 6
Oklahoma 13, Texas 9
Oklahoma 9, Auburn 8
Texas 3, Indiana St. 2
Auburn 4, Texas 2
Oklahoma 3, Auburn 1
SOUTH REGIONAL at Baton Rouge, LA (1) Cal St. Fullerton 7, (6) La.-Monroe 6
(3) Rice 8, (4) James Madison 7
(2) LSU 5, (5) Central Mich. 3
Central Mich. 14, La.-Monroe 11
Cal St. Fullerton 9, James Madison 1
Rice 15, LSU 7
Cal St. Fullerton 17, Rice 7
LSU 10, Central Mich. 5
Rice 16, LSU 9
Cal St. Fullerton 8, Rice 7
WEST REGIONAL at Fresno, CA
(1) Southern California 10, (6) Middle Tenn. St. 4
(2) Long Beach St. 14, (5) Missouri St. 11
(4) Pepperdine 9, (3) Fresno St. 5
Middle Tenn. St. 5, Missouri St. 3
Southern California 22, Fresno St. 17
Long Beach St. 14, Pepperdine 3
Southern California 6, Long Beach St. 5
Pepperdine 18, Middle Tenn. St. 17 (12 inn.)
Long Beach St. 9, Pepperdine 5
Long Beach St. 4, Southern California 3
Southern California 9, Long Beach St. 2

216
1996 REGIONAL RESULTS
ATLANTIC REGIONAL at Clemson, SC (3) Ga. Southern 6, (4) Old Dominion 0
(5) West Virginia 8, (2) Tennessee 4
(1) Clemson 9, (6) Charleston So. 1
Tennessee 8, Charleston So. 4
Clemson 5, Old Dominion 1
West Virginia 9, Ga. Southern 4
Clemson 6, West Virginia 3
Tennessee 6, Ga. Southern 1
Tennessee 10, West Virginia 4
Clemson 12, Tennessee 5
CENTRAL I REGIONAL at Austin, TX (6) Sam Houston St. 5, (1) Miami (Fla.) 4
(5) Missouri St. 5, (2) Long Beach St. 3
(4) UCLA 5, (3) Texas 2
Miami (Fla.) 5, Long Beach St. 2
Texas 4, Sam Houston St. 2
Missouri St. 13, UCLA 2
UCLA 10, Sam Houston St. 8
Miami (Fla.) 9, Texas 7
UCLA 9, Missouri St. 4 (10 inn.)
Miami (Fla.) 8, Missouri St. 2
Miami (Fla.) 8, UCLA 4
CENTRAL II REGIONAL at Lubbock, TX
(1) Southern California 20, (6) Akron 10
(3) Oklahoma St. 6, (4) Arkansas 5
(5) Fresno St. 12, (2) Texas Tech 2
Texas Tech 7, Akron 2
Southern California 15, Arkansas 5
Oklahoma St. 12, Fresno St. 5
Oklahoma St. 9, Southern California 3
Texas Tech 13, Fresno St. 2
Southern California 13, Texas Tech 10 (11 inn.)
Oklahoma St. 10, Southern California 2
EAST REGIONAL at Gainesville, FL
(4) South Fla. 12, (3) North Carolina St. 3
(5) Massachusetts 8, (2) Central Fla. 7
(1) Florida 7, (6) Bucknell 0
Central Fla. 13, Bucknell 1
Florida 12, North Carolina St. 9
South Fla. 14, Massachusetts 8
Florida 6, South Fla. 4 (13 inn.)
Massachusetts 7, Central Fla. 5
Massachusetts 13, South Fla. 12
Florida 12, Massachusetts 2
MIDWEST REGIONAL at Wichita, KS
(3) Rice 17, (4) Missouri 4
(2) Cal St. Fullerton 19, (5) Delaware 8
(1) Wichita St. 4, (6) Indiana 0
Indiana 10, Delaware 8
Wichita St. 9, Missouri 2
Cal St. Fullerton 7, Rice 3
Wichita St. 6, Cal St. Fullerton 1
Rice 11, Indiana 8
Rice 13, Cal St. Fullerton 10
Wichita St. 16, Rice 6
SOUTH I REGIONAL at Tuscaloosa, AL
(4) Stetson 9, (3) South Ala. 8
(5) Notre Dame 12, (2) Virginia 1
(1) Alabama 19, (6) Princeton 2
Virginia 12, Princeton 2
Alabama 9, South Ala. 3
Stetson 7, Notre Dame 6
Alabama 3, Stetson 1
Virginia 7, Notre Dame 1
Virginia 5, Stetson 4 (10 inn.)
Alabama 18, Virginia 8
SOUTH II REGIONAL at Baton Rouge, LA (4) Tulane 10, (3) UNLV 7
(5) New Orleans 13, (2) Georgia Tech 3
(1) LSU 9, (6) Austin Peay 3
Georgia Tech 14, Austin Peay 3
LSU 7, UNLV 6
New Orleans 13, Tulane 5
LSU 17, New Orleans 4
Georgia Tech 7, Tulane 4
Georgia Tech 12, New Orleans 7
LSU 29, Georgia Tech 13
WEST REGIONAL at Stanford, CA
(1) Florida St. 16, (6) Northeastern Ill. 0
(3) Mississippi St. 6, (4) UC Santa Barb. 2
(2) Stanford 10, (5) Cal St. Northridge 5
Cal St. Northridge 18, Northeastern Ill. 1
Florida St. 10, UC Santa Barb. 1
Stanford 8, Mississippi St. 6
Florida St. 5, Stanford 4
Cal St. Northridge 20, Mississippi St. 19
Cal St. Northridge 4, Stanford 3
Florida St. 9, Cal St. Northridge 2

217
1997 REGIONAL RESULTS
ATLANTIC REGIONAL at Coral Gables, FL
(3) Arizona St. 10, (4) Florida Int’l 2
(2) Florida 4, (5) St. John’s (N.Y.) 3
(1) Miami (Fla.) 11, (6) Richmond 4
Richmond 10, St. John’s (N.Y.) 4
Miami (Fla.) 5, Florida Int’l 2
Arizona St. 3, Florida 2
Arizona St. 10, Miami (Fla.) 3
Florida 16, Richmond 2
Miami (Fla.) 6, Florida 5 (11 inn.)
Miami (Fla.) 7, Arizona St. 6
Miami (Fla.) 6, Arizona St. 5
CENTRAL REGIONAL at Lubbock, TX
(3) Clemson 13, (4) Nevada 9
(2) Rice 5, (5) Missouri St. 2
(6) Texas St. 7, (1) Texas Tech 6 (11 inn.)
Missouri St. 4, Texas Tech 2
Nevada 7, Texas St. 1
Rice 10, Clemson 6
Texas St. 12, Clemson 7
Missouri St. 10, Nevada 9
Rice 13, Texas St. 9
Rice 25, Missouri St. 6
EAST REGIONAL at Tallahassee, FL
(4) South Fla. 5, (3) Central Fla. 4
(2) Auburn 11, (5) Western Caro. 3
(1) Florida St. 4, (6) Marist 2
Western Caro. 8, Marist 3
Florida St. 16, Central Fla. 2
Auburn 9, South Fla. 0
Auburn 8, Florida St. 7
South Fla. 9, Western Caro. 4
Florida St. 6, South Fla. 5
Florida St. 9, Auburn 7
Auburn 5, Florida St. 2
MIDEAST REGIONAL at Starkville, MS
(1) Georgia Tech 5, (6) Tennessee Tech 0
(4) Washington 5, (3) La.-Lafayette 4
(2) Mississippi St. 8, (5) Ohio St. 5
Tennessee Tech 5, Ohio St. 3
Georgia Tech 8, La.-Lafayette 0
Washington 5, Mississippi St. 4
Washington 8, Georgia Tech 4
Mississippi St. 25, Tennessee Tech 5
Mississippi St. 10, Georgia Tech 2
Mississippi St. 7, Washington 5
Mississippi St. 4, Washington 3
MIDWEST REGIONAL at Stillwater, OK (6) Harvard 7, (1) UCLA 2
(2) Tennessee 5, (5) Ohio 2
(3) Oklahoma St. 8, (4) Stetson 1
UCLA 15, Ohio 1
Harvard 8, Stetson 6
Oklahoma St. 6, Tennessee 1
Oklahoma St. 10, Harvard 7
UCLA 5, Tennessee 3
UCLA 14, Harvard 9
UCLA 14, Oklahoma St. 2
UCLA 22, Oklahoma St. 2
SOUTH I REGIONAL at Baton Rouge, LA
(4) Long Beach St. 1, (3) Oklahoma 0
(2) South Ala. 12, (5) Houston 6
(1) LSU 14, (6) UNC Greensboro 0
UNC Greensboro 9, Houston 5
LSU 14, Oklahoma 3
South Ala. 12, Long Beach St. 4
South Ala. 11, LSU 5
Long Beach St. 14, UNC Greensboro 4
LSU 14, Long Beach St. 7 (11 inn.)
LSU 14, South Ala. 4
LSU 15, South Ala. 4
SOUTH II REGIONAL at Tuscaloosa, AL
(3) North Carolina St. 10, (4) Wichita St. 9 (10 inn.)
(5) Virginia Tech 3, (2) Southern California 2
(1) Alabama 8, (6) Troy 5
Southern California 5, Troy 2
Alabama 6, Wichita St. 2
North Carolina St. 12, Virginia Tech 6
Alabama 6, North Carolina St. 3
Southern California 6, Virginia Tech 2
Southern California 13, North Carolina St. 4
Alabama 9, Southern California 8 (10 inn.)
WEST REGIONAL at Stanford, CA
(4) Fresno St. 2, (3) Texas A&M 1
(5) Santa Clara 5, (2) Cal St. Fullerton 0
(1) Stanford 12, (6) Northeastern 3
Cal St. Fullerton 8, Northeastern 4
Stanford 3, Texas A&M 1
Santa Clara 8, Fresno St. 1
Stanford 9, Santa Clara 2
Fresno St. 8, Cal St. Fullerton 7
Fresno St. 10, Santa Clara 7
Stanford 5, Fresno St. 2

218
1998 REGIONAL RESULTS
ATLANTIC I REGIONAL at Coral Gables, FL
5-21 (4) Texas Tech 6, (3) North Carolina 2
5-21 (2) South Carolina 21, (5) Florida Int’l 9
5-21 (1) Miami (Fla.) 21, (6) Bowling Green 6
5-22 Florida Int’l 13, Bowling Green 7
5-22 North Carolina 6, Miami (Fla.) 5
5-22 South Carolina 9, Texas Tech 8
5-23 Miami (Fla.) 13, Texas Tech 0
5-23 North Carolina 8, Florida Int’l 2
5-23 Miami (Fla.) 14, South Carolina 2
5-24 North Carolina 4, South Carolina 2
5-24 Miami (Fla.) 7, North Carolina 4
ATLANTIC II REGIONAL at Tallahassee, FL
5-21 (4) Oklahoma 6, (3) Delaware 3
5-21 (5) Rutgers 17, (2) Auburn 15
5-21 (1) Florida St. 10, (6) Liberty 7
5-22 Auburn 3, Liberty 2
5-22 Florida St. 27, Delaware 6
5-22 Oklahoma 9, Rutgers 7
5-23 Florida St. 23, Oklahoma 2
5-23 Auburn 7, Rutgers 4
5-23 Auburn 9, Oklahoma 8
5-24 Florida St. 16, Auburn 10
CENTRAL REGIONAL at College Station, TX
5-21 (1) Rice 11, (6) Oral Roberts 1
5-21 (4) Mississippi St. 7, (3) Washington 6
5-21 (2) Texas A&M 17, (5) Charlotte 0
5-22 Oral Roberts 20, Charlotte 13
5-22 Washington 20, Rice 11
5-22 Texas A&M 4, Mississippi St. 3
5-23 Mississippi St. 15, Rice 14
5-23 Washington 13, Oral Roberts 6
5-23 Mississippi St. 10, Texas A&M 9
5-24 Texas A&M 6, Washington 4
5-24 Mississippi St. 11, Texas A&M 5
EAST REGIONAL at Clemson, SC
5-21 (1) Southern California 10, (6) Fordham 6
5-21 (4) South Ala. 2, (3) VCU 1
5-21 (2) Clemson 12, (5) Citadel 3
5-22 Citadel 5, Fordham 1
5-22 VCU 14, Southern California 4
5-22 South Ala. 2, Clemson 1 (16)
5-23 Southern California 8, Clemson 5
5-23 VCU 3, Citadel 2
5-23 Southern California 3, South Ala. 2
5-24 South Ala. 6, VCU 0
5-24 Southern California 4, South Ala. 3
MIDWEST REGIONAL at Wichita, KS
5-21 (3) Arizona St. 8, (4) Arkansas 4
5-21 (5) Oklahoma St. 13, (2) Georgia Tech 4
5-21 (1) Wichita St. 7, (6) Southeast Mo. St. 4
5-22 Georgia Tech 14, Southeast Mo. St. 5
5-22 Arkansas 3, Wichita St. 2 (11)
5-22 Oklahoma St. 13, Arizona St.. 8
5-23 Arizona St.. 6 Wichita St. 4
5-23 Georgia Tech 2, Arkansas 0
5-23 Arizona St.. 13, Oklahoma St. 5
5-24 Georgia Tech 6, Oklahoma St. 5
5-25 Arizona St.. 3, Georgia Tech 1
SOUTH I REGIONAL at Gainesville, FL
5-21 (4) Richmond 12, (3) Baylor 10
5-21 (2) Wake Forest 14, (5) Illinois 12
5-21 (1) Florida 12, (6) Monmouth 8
5-22 Illinois 12, Monmouth 2
5-22 Baylor 10, Florida 5
5-22 Wake Forest 6, Richmond 5
5-23 Florida 15, Richmond 3
5-23 Illinois 8, Baylor 7 (13)
5-23 Florida 12, Wake Forest 9
5-24 Illinois 13, Wake Forest 4
5-24 Florida 7, Illinois 6
SOUTH II REGIONAL at Baton Rouge, LA
5-21 (3) Tulane 11, (4) La.-Lafayette 5
5-21 (2) Cal St. Fullerton 16, (5) Harvard 1
5-21 (1) LSU 18, (6) Nicholls St. 4
5-22 Harvard 6, Nicholls St. 5 (10)
5-22 LSU 15, La.-Lafayette 6
5-22 Cal St. Fullerton 10, Tulane 6
5-23 LSU 13, Cal St. Fullerton 11
5-23 Harvard 14, Tulane 11
5-23 Cal St. Fullerton 11, Harvard 7
5-24 LSU 14, Cal St. Fullerton 3
WEST REGIONAL at Stanford, CA
5-21 (4) North Carolina St. 12, (3) Long Beach St. 3
5-21 (2) Alabama 8, (5) Minnesota 2
5-21 (6) Loyola Marymount 6, (1) Stanford 2
5-22 Stanford 19, Minnesota 1
5-22 Long Beach St.. 19, Loyola Marymount 9
5-22 North Carolina St. 13, Alabama 10
5-23 Alabama 13, Loyola Marymount 5
5-23 Long Beach St. 5, Stanford 1
5-23 Alabama 9, North Carolina St. 2
5-24 Long Beach St. 10, North Carolina St. 6
5-24 Long Beach St.. 5, Alabama 3

219
1999 REGIONAL AND SUPER REGIONAL RESULTS
at Coral Gables, FL
5-28 (3) Florida Int’l 4, (2) Fla. Atlantic 1
5-28 (1) Miami (Fla.) 15, (4) Bethune-Cookman 9
5-29 Fla. Atlantic 12, Bethune-Cookman 0
5-29 Miami (Fla.) 6, Florida Int’l 4
5-30 Fla. Atlantic 1, Florida Int’l 0
5-30 Miami (Fla.) 3, Fla. Atlantic 2
at Winston-Salem, NC
5-28 (2) Richmond 5, (3) Virginia Tech 3
5-28 (1) Wake Forest 22, (4) Siena 4
5-29 Virginia Tech 11, Siena 5
5-29 Wake Forest 12, Richmond 1
5-29 Richmond 11, Virginia Tech 8
5-30 Richmond 9, Wake Forest 3
5-30 Wake Forest 13, Richmond 3
SUPER REGIONALS at Coral Gables, FL
Miami (Fla.) 10, Wake Forest 2
Miami (Fla.) 8, Wake Forest 1
at Houston, TX
5-28 (2) La.-Lafayette 13, (3) Texas 6
5-28 (1) Houston 6, (4) Texas St. 4
5-29 Texas 7, Texas St. 5
5-29 La.-Lafayette 5, Houston 3
5-29 Houston 8, Texas 5
5-30 La.-Lafayette 19, Houston 8
at Lubbock, TX
5-28 (4) Wis.-Milwaukee 8, (1) Rice 4
5-28 (2) Texas Tech 5, (3) Rutgers 2
5-29 Rice 6, Rutgers 1
5-29 Texas Tech 8, Wis.-Milwaukee 5
5-29 Rice 27, Wis.-Milwaukee 1
5-30 Rice 3, Texas Tech 1
5-30 Rice 15, Texas Tech 11
SUPER REGIONALS at Houston, TX (Astrodome)
6-4 La.-Lafayette 12, Rice 8
6-5 Rice 10, La.-Lafayette 1
6-6 Rice 8, La.-Lafayette 3
at Tallahassee, FL
5-28 (3) Jacksonville 7, (2) Providence 5
5-28 (1) Florida St. 24, (4) Citadel 6
5-29 Providence 12, Citadel 1
5-29 Florida St. 9, Jacksonville 2
5-30 Providence 9, Jacksonville 8
5-30 Florida St. 14, Providence 3
at Auburn, AL
5-28 (4) Winthrop 8, (1) Tulane 7 (11 inn.)
5-28 (2) Auburn 9, (3) North Carolina St. 7
5-29 Tulane 11, North Carolina St. 5
5-29 Auburn 8, Winthrop 6
5-29 Tulane 15, Winthrop 8
5-30 Tulane 7, Auburn 5
5-29 Auburn 13, Tulane 9
SUPER REGIONALS at Tallahassee, FL
6-4 Florida St. 10, Auburn 2
6-5 Florida St. 6, Auburn 3
at Tuscaloosa, AL
5-28 (3) Southern Miss. 20, (2) South Ala. 13
5-28 (1) Alabama 16, (4) Navy 3
5-29 South Ala. 10, Navy 0
5-29 Alabama 10, Southern Miss. 4
5-29 Southern Miss. 10, South Ala. 9
5-30 Alabama 7, Southern Miss. 6
at Baton Rouge, LA
5-28 (2) LSU 11, (3) La.-Monroe 4
5-28 (1) East Caro. 13, (4) Southern U. 2
5-29 Southern U. 8, La.-Monroe 7 (10 inn.)
5-29 East Caro. 11, LSU 10
5-29 LSU 6, Southern U. 3
5-30 LSU 12, East Caro. 10
5-31 LSU 9, East Caro. 0
SUPER REGIONALS at Tuscaloosa, AL
6-4 Alabama 13, LSU 6
6-5 Alabama 13, LSU 5
at Wichita, KS
5-28 (3) UCLA 12, (2) Oklahoma St. 6
5-28 (1) Wichita St. 13, (4) Oral Roberts 5
5-29 Oklahoma St. 12, Oral Roberts 4
5-29 Wichita St. 4, UCLA 2
5-29 Oklahoma St. 17, UCLA 10
5-30 Oklahoma St. 11, Wichita St. 8
5-30 Oklahoma St. 7, Wichita St. 6
at Waco, TX
5-28 (2) Minnesota 4, (3) Arizona 3
5-28 (1) Baylor 7, (4) Eastern Ill. 3
5-29 Eastern Ill. 13, Arizona 4
5-29 Baylor 6, Minnesota 4
5-29 Minnesota 15, Eastern Ill. 10
5-30 Baylor 22, Minnesota 6
SUPER REGIONALS at Waco, TX
6-4 Oklahoma St. 18, Baylor 11
6-5 Baylor 17, Oklahoma St. 7
6-5 Oklahoma St. 6, Baylor 2
at Palo Alto, CA
5-28 (3) North Carolina 8, (2) Nevada 5 (12 inn.)
5-28 (1) Stanford 10, (4) Loyola Marymount 2
5-29 Nevada 4, Loyola Marymount 3
5-29 Stanford 7, North Carolina 4
5-29 Nevada 5, North Carolina 1
5-30 Stanford 7, Nevada 4

220
1999 REGIONAL AND SUPER REGIONAL RESULTS (cont.)
at Los Angeles, CA
5-28 (2) Southern California 10, (3) VCU 0
5-28 (1) Pepperdine 4, (4) Harvard 0
5-29 VCU 3, Harvard 2
5-29 Southern California 5, Pepperdine 3
5-29 Pepperdine 12, VCU 5
5-30 Pepperdine 4, Southern California 3
5-30 Southern California 12, Pepperdine 7
SUPER REGIONALS at Palo Alto, CA
6-4 Stanford 1, Southern California 0
6-5 Stanford 5, Southern California 3
at Fayetteville, AR
5-28 (3) Missouri St. 23, (2) Clemson 5
5-28 (1) Arkansas 10, (4) Delaware 6
5-29 Clemson 17, Delaware 3
5-29 Missouri St. 9, Arkansas 8 (10 inn.)
5-29 Clemson 12, Arkansas 4
5-30 Clemson 8, Missouri St. 7
5-30 Clemson 7, Missouri St. 5
at College Station, TX
5-28 (2) Long Beach St. 4, (3) Mississippi 3 (10 inn.)
5-28 (1) Texas A&M 6, (4) Monmouth 0
5-29 Mississippi 12, Monmouth 3
5-29 Long Beach St. 7, Texas A&M 5
5-29 Texas A&M 13, Mississippi 7
5-30 Texas A&M 9, Long Beach St. 5
5-30 Texas A&M 17, Long Beach St. 7
SUPER REGIONALS at College Station, TX
6-4 Texas A&M 20, Clemson 3
6-5 Clemson 10, Texas A&M 3
6-6 Texas A&M 5, Clemson 4
at Columbus, OH
5-28 (3) Mississippi St. 18, (2) Nebraska 14
5-28 (1) Ohio St. 4, (4) Bowling Green 1
5-29 Nebraska 10, Bowling Green 5
5-29 Ohio St. 6, Mississippi St. 3
5-29 Mississippi St. 13, Nebraska 7
5-30 Ohio St. 10, Mississippi St. 7
at South Bend, IN
5-28 (1) Cal St. Fullerton 6, (4) Michigan 5
5-28 (2) Notre Dame 8, (3) Creighton 1
5-29 Michigan 13, Creighton 5
5-29 Cal St. Fullerton 6, Notre Dame 3
5-29 Michigan 11, Notre Dame 5
5-30 Cal St. Fullerton 9, Michigan 4
SUPER REGIONALS at Columbus, OH
6-4 Ohio St. 10, Cal St. Fullerton 7
6-5 Cal St. Fullerton 11, Ohio St. 5
6-6 Cal St. Fullerton 13, Ohio St. 2
NATIONAL TOP EIGHT SEEDS
1. Miami (Fla.)
2. Florida St.
3. Cal St. Fullerton
4. Baylor
5. Alabama
6. Stanford
7. Texas A&M
8. Rice
2000 REGIONAL AND SUPER REGIONAL RESULTS
at Columbia, SC
5-26 (2) Wake Forest 8, (3) Seton Hall 3
5-26 (1) South Carolina 6, (4) Liberty 4
5-27 Liberty 10, Seton Hall 2
5-27 South Carolina 6, Wake Forest 1
5-27 Wake Forest 4, Liberty 2
5-28 South Carolina 8, Wake Forest 4
at Lafayette, LA
5-26 (1) East Caro. 12, (4) Marist 3
5-26 (2) La.-Lafayette 11, (3) McNeese St. 5
5-27 Marist 6, McNeese St. 5
5-27 La.-Lafayette 5, East Caro. 3
5-27 East Caro. 8, Marist 7 (11 inn.)
5-28 La.-Lafayette 8, East Caro. 5
SUPER REGIONALS at Columbia, SC
6-2 South Carolina 6, La.-Lafayette 3
6-3 La.-Lafayette 7, South Carolina 1
6-4 La.-Lafayette 3, South Carolina 2
at Minneapolis, MN
5-26 (1) Nebraska 2, (4) Butler 1
5-26 (2) Minnesota 10, (3) Wichita St. 7
5-28 Wichita St. 15, Butler 5
5-28 Nebraska 4, Minnesota 1
5-28 Wichita St. 5, Minnesota 1
5-29 Nebraska 8, Wichita St. 1
at Palo Alto, CA
5-26 (2) Alabama 8, (3) Nevada 2
5-26 (1) Stanford 5, (4) Fresno St. 1
5-27 Nevada 13, Fresno St. 5
5-27 Stanford 8, Alabama 6
5-27 Alabama 6, Nevada 5
5-28 Alabama 14, Stanford 9
5-28 Stanford 16, Alabama 6
SUPER REGIONALS at Palo Alto, CA
6-2 Nebraska 7, Stanford 3
6-3 Stanford 7, Nebraska 1
6-4 Stanford 5, Nebraska 3
at Houston, TX
5-26 (2) Rice 5, (3) Texas Tech 2
5-26 (1) Houston 7, (4) Princeton 6
5-27 Texas Tech 10, Princeton 1
5-27 Houston 5, Rice 2
5-27 Rice 11, Texas Tech 4
5-28 Rice 5, Houston 4
5-28 Houston 9, Rice 5

221
2000 REGIONAL AND SUPER REGIONAL RESULTS (cont.)
at Waco, TX
5-26 (3) San Jose St. 4, (2) Florida 1
5-26 (4) Texas St. 6, (1) Baylor 0
5-27 Florida 10, Baylor 1
5-27 San Jose St. 5, Texas St. 2
5-28 Florida 14, Texas St. 0
5-28 Florida 8, San Jose St. 7
5-29 San Jose St. 2, Florida 1
SUPER REGIONALS at Houston, TX
6-2 San Jose St. 5, Houston 3
6-3 Houston 5, San Jose St. 2 (14 inn.)
6-4 San Jose St. 3, Houston 2
at Starkville, MS
5-26 (3) Notre Dame 8, (2) Tulane 4
5-26 (1) Mississippi St. 9, (4) South Ala. 2
5-27 Tulane 4, South Ala. 3
5-27 Mississippi St. 8, Notre Dame 1
5-27 Notre Dame 10, Tulane 6
5-28 Notre Dame 7, Mississippi St. 0
5-28 Mississippi St. 10, Notre Dame 9
at Clemson, SC
5-26 (3) Illinois 3, (2) Old Dominion 1
5-26 (1) Clemson 4, (4) Middle Tenn. 0
5-27 Middle Tenn. 6, Old Dominion 5
5-27 Clemson 9, Illinois 3
5-27 Middle Tenn. 4, Illinois 3
5-28 Clemson 21, Middle Tenn. 3
SUPER REGIONALS at Clemson, SC
6-2 Clemson 11, Mississippi St. 4
6-3 Clemson 9, Mississippi St. 4
at Baton Rouge, LA
5-26 (1) LSU 19, (4) Jackson St. 1
5-26 (3) La.-Monroe 8, (2) New Orleans 3
5-27 New Orleans 24, Jackson St. 9
5-27 LSU 21, La.-Monroe 0
5-27 La.-Monroe 10, New Orleans 4
5-28 LSU 5, La.-Monroe 3
at Oklahoma City, OK
5-26 (1) UCLA 13, (4) Delaware 12
5-26 (2) Oklahoma 6, (3) Oral Roberts 5 (11 inn.)
5-27 Oral Roberts 4, Delaware 2
5-27 UCLA 10, Oklahoma 5
5-27 Oklahoma 9, Oral Roberts 7
5-27 UCLA 11, Oklahoma 3
SUPER REGIONALS at Baton Rouge, LA
6-2 LSU 8, UCLA 2
6-3 LSU 14, UCLA 8
at Montclair, NJ
5-26 (1) Rutgers 4, (4) Army 3
5-26 (2) North Carolina 14, (3) Penn St. 5
5-27 Penn St. 3, Army 1
5-27 North Carolina 9, Rutgers 3
5-27 Penn St. 6, Rutgers 5
5-28 Penn St. 6, North Carolina 5
5-28 Penn St. 10, North Carolina 3
at Tempe, AZ
5-26 (2) Texas 5, (3) Creighton 4
5-26 (1) Arizona St. 15, (4) Miami (Ohio) 7
5-27 Miami (Ohio) 6, Creighton 3
5-27 Arizona St. 3, Texas 1
5-27 Texas 11, Miami (Ohio) 1
5-28 Texas 6, Arizona St. 4
5-28 Texas 9, Arizona St. 7
SUPER REGIONALS at Austin, TX
6-2 Texas 7, Penn St. 3
6-3 Texas 10, Penn St. 0
at Coral Gables, FL
5-26 (2) Fla. Atlantic 14, (3) Florida Int’l 6
5-26 (1) Miami (Fla.) 19, (4) Wagner 5
5-27 Florida Int’l 10, Wagner 1
5-27 Miami (Fla.) 11, Fla. Atlantic 5
5-27 Florida Int’l 7, Fla. Atlantic 0
5-28 Miami (Fla.) 14, Florida Int’l 4
at Tallahassee, FL
5-26 (2) UCF 4, (3) Evansville 1
5-26 (1) Florida St. 6, (4) Bethune-Cookman 3
5-27 Evansville 6, Bethune-Cookman 5
5-27 UCF 9, Florida St. 8
5-27 Florida St. 11, Evansville 2
5-28 Florida St. 6, UCF 1
5-28 Florida St. 8, UCF 1
SUPER REGIONALS at Tallahassee, FL
6-2 Florida St. 9, Miami (Fla.) 2
6-3 Miami (Fla.) 7, Florida St. 5
6-4 Florida St. 6, Miami (Fla.) 1
at Fullerton, CA
5-26 (1) Southern California 8, (4) Virginia Tech 3
5-26 (3) Loyola Marymount 6, (2) Cal St. Fullerton 4
5-27 Cal St. Fullerton 8, Virginia Tech 6
5-27 Southern California 13, Loyola Marymount 5
5-27 Cal St. Fullerton 5, Loyola Marymount 2
5-28 Southern California 8, Cal St. Fullerton 3
at Atlanta, GA
5-26 (3) Stetson 9, (2) Auburn 5
5-26 (1) Georgia Tech 11, (4) Ga. Southern 9
5-27 Auburn 11, Ga. Southern 5
5-27 Georgia Tech 24, Stetson 1
5-27 Stetson 13, Auburn 10
5-28 Georgia Tech 16, Stetson 11
SUPER REGIONALS at Atlanta
6-2 Southern California 9, Georgia Tech 2
6-3 Southern California 6, Georgia Tech 3
NATIONAL TOP EIGHT SEEDS
1. South Carolina
2. LSU
3. Georgia Tech
4. Clemson
5. Houston
6. Florida St.
7. Arizona St.
8. Stanford

222
2001 REGIONAL AND SUPER REGIONAL RESULTS
at Fullerton, CA 5-25 (2) Arizona St. 12, (3) Texas Tech 3
5-25 (1) Cal St. Fullerton 17, (4) Temple 3
5-26 Texas Tech 14, Temple 3
5-26 Cal St. Fullerton 13, Arizona St. 3
5-26 Texas Tech 9, Arizona St. 8
5-27 Texas Tech 11, Cal St. Fullerton 5
5-27 Cal St. Fullerton 9, Texas Tech 2
at Columbus, OH 5-25 (1) Mississippi St. 9, (4) Kent St. 8 (10 inn.)
5-25 (3) Delaware 5, (2) Ohio St. 4 (10 inn.)
5-26 Kent St. 9, Ohio St. 8
5-26 Mississippi St 4, Delaware, 3
5-26 Kent St. 12, Delaware 11
5-27 Mississippi St 14, Kent St. 4
SUPER REGIONALS at Fullerton, CA
6-1 Cal St. Fullerton 13, Mississippi St. 2
6-2 Cal St. Fullerton 9, Mississippi St. 3
at New Orleans, LA 5-25 (3) Oklahoma St. 5, (2) Mississippi 4 (10 inn.)
5-25 (1) Tulane 22, (4) Southern U. 9
5-26 Mississippi 10, Southern U. 2
5-26 Tulane 13, Oklahoma St. 10
5-26 Oklahoma St. 16, Mississippi 7
5-27 Tulane 9, Oklahoma St. 8
at Baton Rouge, LA 5-25 (1) LSU 10, (4) Minnesota 9
5-25 (2) VCU 9, (3) California 7
5-26 California 9, Minnesota 3
5-26 LSU 13, VCU 9
5-26 VCU 11, California 2
5-27 VCU 10, LSU 7
5-27 LSU 14, VCU 9
SUPER REGIONALS at Metairie, LA
6-1 LSU 4, Tulane 3 (13 inn.)
6-2 Tulane 9, LSU 4
6-3 Tulane 7, LSU 1
at Houston, TX 5-25 (1) Rice 11, (4) Texas-Arlington 4
5-25 (2) Baylor 7, (3) Houston 1
5-26 Texas-Arlington 7, Houston 6
5-26 Baylor 11, Rice 10
5-27 Rice 14, Texas-Arlington 2
5-27 Rice 7, Baylor 4
5-28 Rice 5, Baylor 4
at Lincoln, NE 5-25 (1) Nebraska 16, (4) UNI 6
5-25 (2) Rutgers 4, (3) Brigham Young 3
5-26 UNI 10, Brigham Young 1
5-26 Nebraska 5, Rutgers 4
5-26 Rutgers 6, UNI 5
5-27 Nebraska 14, Rutgers 10
SUPER REGIONALS at Lincoln, NE
6-1 Nebraska 7, Rice 0
6-2 Nebraska 9, Rice 6 (10 inn.)
at Columbus, SC 5-25 (1) UCF 13, (4) Princeton 12 (12 inn.)
5-25 (2) South Carolina 16, (3) Citadel 0
5-26 Princeton 11, Citadel 6
5-26 UCF 8, South Carolina 6
5-26 South Carolina 11, Princeton 7
5-27 South Carolina 9, UCF 7
5-27 South Carolina 5, UCF 2
at Palo Alto, CA 5-25 (3) Texas 11, (2) Long Beach St. 2
5-25 (1) Stanford 4, (4) Marist 3
5-26 Marist 7, Long Beach St. 6
5-26 Texas 4, Stanford 3
5-26 Stanford 6, Marist 0
5-27 Stanford 10, Texas 9 (10 inn.)
5-27 Stanford 4, Texas 3
SUPER REGIONALS at Palo Alto, CA
6-1 Stanford 11, South Carolina 1
6-2 South Carolina 4, Stanford 3
6-3 Stanford 3, South Carolina 2
at Miami, FL 5-25 (2) Florida 10, (3) Stetson 9
5-25 (1) Miami (Fla.) 14, (4) Bucknell 6
5-26 Stetson 7, Bucknell 0
5-26 Miami (Fla.) 6, Florida 2
5-26 Stetson 6, Florida 3
5-27 Miami (Fla.) 16, Stetson 8
at Clemson, SC 5-25 (4) Seton Hall 7, (1) South Alabama 2
5-25 (2) Clemson 4, (3) William & Mary 1
5-26 South Alabama 8, William & Mary 4
5-26 Clemson 24, Seton Hall 4
5-26 Seton Hall 8, South Alabama 7
5-27 Clemson 8, Seton Hall 2
SUPER REGIONALS at Miami, FL
6-1 Miami (Fla.) 10, Clemson 8
6-2 Miami (Fla.) 14, Clemson 6
at Athens, GA 5-25 (3) Coastal Caro. 5, (2) Georgia Tech 3
5-25 (4) Ga. Southern 4, (1) Georgia 3
5-26 Georgia 13, Georgia Tech 5
5-26 Coastal Caro. 12, Ga. Southern 3
5-26 Georgia 10, Ga. Southern 9 (11 inn.)
5-27 Georgia 9, Coastal Caro. 3
5-27 Georgia 8, Coastal Caro. 7
at Tallahassee, FL 5-25 (2) Auburn 8, (3) Jacksonville 7 (10 inn.)
5-25 (1) *Florida St. 8, (4) Bethune-Cookman 1
5-26 Jacksonville 3, Bethune-Cookman 0
5-26 Florida St. 10, Auburn 6
5-26 Auburn 3, Jacksonville 2
5-27 Florida St. 9, Auburn 6

223
2001 REGIONAL AND SUPER REGIONAL RESULTS (cont.)
SUPER REGIONALS at Athens, GA
6-2 Georgia 8, Florida St. 7 (10 inn.)
6-4 Florida St. 11, Georgia 6
6-4 Georgia 8, Florida St. 3
at Knoxville, TN 5-25 (4) Tennessee Tech 9, (1) Wake Forest 7
5-25 (2) Tennessee, 2, (3) Middle Tennessee 1
5-26 Wake Forest 6, Middle Tennessee 3
5-26 Tennessee 11, Tennessee Tech 0
5-26 Wake Forest 18, Tennessee Tech 5
5-27 Wake Forest 10, Tennessee 3
5-27 Tennessee 6, Wake Forest 3
at Wilson, NC 5-25 (3) South Florida 7, (2) Winthrop 2
5-25 (1) East Caro. 7, (4) UMBC 0
5-26 Winthrop 6, UMBC 0
5-26 East Caro. 12, South Florida, 8
5-27 Winthrop 6, South Florida 1
5-27 East Caro. 7, Winthrop 3
SUPER REGIONALS at Kinston, NC
6-2 Tennessee 13, East Caro. 10
6-3 Tennessee 6, East Caro. 3
at South Bend, IN 5-25 (1) Notre Dame 12, (4) Wis.-Milwaukee 4
5-25 (3) Florida Int’l 17, (2) UC Santa Barb. 4
5-27 UC Santa Barb. 13, Wis.-Milwaukee 12
5-27 Florida Int’l 7, Notre Dame 6 (10 inn.)
5-27 Notre Dame 11, UC Santa Barb. 10 (10 inn.)
5-28 Notre Dame 5, Florida Int’l 2
5-28 Florida Int’l 5, Notre Dame 4
at Los Angeles, CA 5-25 (1)Southern California 12, (4) Oral Roberts 4
5-25 (2) Pepperdine 4 , (3) Fresno St. 0
5-26 Fresno St. 2, Oral Roberts 1
5-26 Southern California 4, Pepperdine 3
5-26 Fresno St. 8, Pepperdine 6
5-27 Southern California 8, Fresno St. 0
SUPER REGIONALS at Los Angeles, CA
6-1 Southern California 5, Florida Int’l 1
6-2 Southern California 6, Florida Int’l 0
NATIONAL TOP EIGHT SEEDS
1. Cal St. Fullerton
2. Miami (Fla.)
3. Southern California
4. Stanford
5. Tulane
6. Georgia
7. East Caro.
8. Nebraska
2002 REGIONAL AND SUPER REGIONAL RESULTS
at Tallahassee, FL 5-31 (2) UCF 6, (3) South Fla. 1
5-31 (1) Florida St. 11, (4) Stetson 8
6-1 South Fla. 14, Stetson 13
6-1 Florida St. 7, UCF 3
6-1 South Fla. 7, UCF 2
6-2 Florida St. 13, South Fla. 6
at South Bend, IN
5-31 (2) Notre Dame 8, (3) Ohio St. 6
5-31 (1) South Ala. 7, (4) Kent St. 4
6-1 Ohio St. 12, Kent St. 8
6-1 Notre Dame 25, South Ala. 1
6-1 Ohio St. 6, South Ala. 4
6-2 Notre Dame 9, Ohio St. 6
SUPER REGIONALS at Tallahassee, FL
6-7 Notre Dame 10, Florida St. 4
6-9 Florida St. 12, Notre Dame 5
6-10 Notre Dame 3, Florida St. 1
at Los Angeles, CA
5-31 (1) Southern California 5, (4) Brigham Young 4 (12 inn.)
5-31 (2) Cal St. Northridge 7, (3) Maine 4
6-1 Brigham Young 12, Maine 5
6-1 Southern California 7, Cal St. Northridge 5
6-1 Brigham Young 7, Cal St. Northridge 2
6-3 Southern California 13, Brigham Young 10
at Stanford, CA
5-31 (2) Long Beach St. 6, (3) San Jose St. 3
5-31 (1) Stanford 3, (4) Cal. St. Fullerton 2 (13 inn.)
6-1 Cal. St. Fullerton 9, San Jose St. 1
6-1 Stanford 5, Long Beach St. 4
6-1 Long Beach St. 4, Cal St. Fullerton 0
6-2 Stanford 8, Long Beach St. 4
SUPER REGIONALS at Stanford, CA
6-7 Stanford 4, Southern California 2
6-8 Stanford 5, Southern California 3
at Austin, TX
5-31 (2) Baylor 4, (3) Lamar 2
5-31 (1) Texas 7, (4) Central Conn. St. 2
6-1 Lamar 9, Central Conn. St. 4
6-1 Texas 10, Baylor 8
6-1 Baylor 10, Lamar 9
6-2 Texas 2, Baylor 0
at Tempe, AZ
5-31 (1) Houston 9, (4) New Mexico St. 0
5-31 (2) Arizona St. 6, (3) San Diego 3
6-1 San Diego 2, New Mexico St. 1
6-1 Houston 8, Arizona St. 4
6-1 Arizona St. 11, San Diego 1
6-2 Houston 8, Arizona St. 3

224
2002 REGIONAL AND SUPER REGIONAL RESULTS (cont.)
SUPER REGIONAL at Austin, TX
6-7 Houston 2, Texas 0
6-8 Texas 17, Houston 2
6-9 Texas 5, Houston 2
at Baton Rouge, LA
5-31 (1) LSU 5, (4) Southern U. 4
5-31 (2) La.-Lafayette 6, (3) Tulane 3
6-1 Tulane 10, Southern U. 2
6-1 La.-Lafayette 5, LSU 0
6-1 LSU 4, Tulane 2
6-2 LSU 12, La.-Lafayette 2
6-2 LSU 12, La.-Lafayette 2
at Houston, TX
5-31 (1) Rice 8, (4) Harvard 3
5-31 (2) Texas Tech 5, (3) Washington 4
6-1 Washington 4, Harvard 2
6-1 Rice 6, Texas Tech 0
6-1 Washington 3, Texas Tech 1
6-2 Washington 7, Rice 6
6-2 Rice 14, Washington 2
SUPER REGIONALS at Houston, TX
6-7 Rice 6, LSU 0
6-7 Rice 3, LSU 0
at Clemson, SC
5-31 (2) East Caro. 13, (3) Elon 7
5-31 (1) Clemson 15, (4) Ga. Southern 1
6-1 Ga. Southern 6, Elon 2
6-1 Clemson 4, East Caro. 2
6-1 East Caro. 7, Ga. Southern 3
6-2 Clemson 21, East Caro. 1
at Wichita, KS
5-31 (3) Arkansas 8, (2) Oklahoma 5
5-31 (4) Oral Roberts 6, (1) Wichita St. 1
6-1 Wichita St. 8, Oklahoma 4
6-1 Arkansas 7, Oral Roberts 6
6-1 Oral Roberts 15, Wichita St. 8
6-2 Arkansas 11, Oral Roberts 6
SUPER REGIONAL at Clemson, SC
6-7 Arkansas 9, Clemson 6
6-8 Clemson 8, Arkansas 7
6-9 Clemson 7, Arkansas 4
at Lincoln, NE
5-31 (1) Nebraska 7, (4) Wis.-Milwaukee 2
5-31 (3) Marist 5, (2) Missouri St. 4 (11 inn.)
6-1 Missouri St. 6, Wis.-Milwaukee 1
6-1 Nebraska 9, Marist 1
6-1 Missouri St. 5, Marist 2
6-2 Nebraska 14, Missouri St. 3
at Winston Salem, NC
5-31 (2) Richmond 15, (3) Navy 5
5-31 (1) Wake Forest 12, (4) George Washington 6
6-1 Navy 6, George Washington 4
6-1 Richmond 3, Wake Forest 2
6-1 Wake Forest 13, Navy 1
6-2 Wake Forest 5, Richmond 4 (10 inn.)
6-2 Richmond 7, Wake Forest 5
SUPER REGIONAL at Lincoln, NE
6-7 Nebraska 2, Richmond 0
6-8 Richmond 6, Nebraska 2
6-9 Nebraska 11, Richmond 6
at Columbia, SC
5-31 (2) North Carolina 5, (3) James Madison 0
5-31 (1) South Carolina 6, (4) VCU 3
6-1 James Madison 5, VCU 2
6-1 South Carolina 9, North Carolina 6
6-1 North Carolina 9, James Madison 7
6-2 North Carolina 8, South Carolina 4
6-2 South Carolina 3, North Carolina 1
at Gainesville, FL
5-31 (3) Miami (Fla.) 9, (2) Florida Int’l 1
5-31 (1) Florida 13, (4) Bethune-Cookman 1
6-1 Bethune-Cookman 7, Florida Int’l 4
6-1 Miami (Fla.) 7, Florida 2
6-1 Florida 21, Bethune-Cookman 10
6-2 Florida 11, Miami (Fla.) 10 (10 inn.)
6-2 Miami (Fla.) 8, Florida 7
SUPER REGIONAL at Columbia, SC
6-7 South Carolina 10, Miami (Fla.) 7
6-8 Miami (Fla.) 5, South Carolina 2
6-9 South Carolina 6, Miami (Fla.) 4
at Atlanta, GA
5-31 (2) Georgia 7, (3) Louisville 1
5-31 (1) Georgia Tech 6 (4) Coastal Caro. 0
6-1 Coastal Caro. 9, Louisville 1
6-1 Georgia Tech 3, Georgia 0
6-1 Georgia 9, Coastal Caro. 7
6-2 Georgia Tech 8, Georgia 7
at Tuscaloosa, AL
5-31 (3) Fla. Atlantic 16, (2) Auburn 11
5-31 (4) Southeast Mo. St. 7, (1) Alabama 4
6-1 Alabama 6, Auburn 3
6-1 Fla. Atlantic 12, Southeast Mo. St. 6
6-1 Alabama 7, Southeast Mo. St. 4
6-2 Alabama 7, Fla. Atlantic 2
6-2 Fla. Atlantic 6, Alabama 5
SUPER REGIONAL at Atlanta, GA
6-7 Georgia Tech 14, Fla. Atlantic 3
6-8 Georgia Tech 11, Fla. Atlantic 5
NATIONAL TOP EIGHT SEEDS
1. Florida St.
2. Clemson
3. Alabama
4. Rice
5. Texas
6. South Carolina
7. Wake Forest
8. Stanford

225
2003 REGIONAL AND SUPER REGIONAL RESULTS
at Tallahassee, FL
5-30 (2) South Alabama 14, (3) Rutgers 1
5-30 (1) Florida St. 6, (4) Jacksonville 0
5-31 Rutgers 8, Jacksonville 5
5-31 South Alabama 8, Florida St. 6
5-31 Florida St. 17, Rutgers 7
6-1 Florida St. 13, South Alabama 5
6-1 Florida St. 12, South Alabama 2
at Austin, TX
5-30 (3) Lamar 3, (2) Arkansas 2
5-30 (1) Texas 7, (4) Bucknell 0
5-31 Arkansas 10, Bucknell 7
5-31 Texas 7, Lamar 3
5-31 Lamar 7, Arkansas 6
6-1 Lamar 6, Texas 2
6-1 Texas 6, Lamar 3
SUPER REGIONAL at Tallahassee, FL
6-8 Texas 8, Florida St. 3
6-9 Texas 6, Florida St. 5
at Wilson, NC
5-30 (2) VCU 6, (3) Western Caro. 0
5-30 (1) North Carolina St. 8, (4) Le Moyne 2
5-31 Western Caro. 9, Le Moyne 7
5-31 North Carolina St. 4, VCU 3 (10 inn.)
5-31 Western Caro. 2, VCU 0
6-1 North Carolina St. 6, Western Caro. 4 (14 inn.)
at Coral Gables, FL
5-30 (2) Fla. Atlantic 4, (3) Florida 3
5-30 (1) Miami (Fla.) 10, (4) Bethune-Cookman 5
5-31 Florida 8, Bethune-Cookman 6
5-31 Miami (Fla.) 1, Fla. Atlantic 0
5-31 Florida 22, Fla. Atlantic 14
6-1 Florida 15, Miami (Fla.) 5
6-1 Miami (Fla.) 13, Florida 10
SUPER REGIONAL at Coral Gables, FL
6-7 Miami (Fla.) 10, North Carolina St. 9
6-8 Miami (Fla.) 11, North Carolina St. 5 (11 inn.)
at Houston, TX
5-30 (1) Rice 3, (4) McNeese St. 2 (10 inn.)
5-30 (3) Wichita St. 4, (2) Mississippi 2
5-31 Mississippi 7, McNeese St. 1
5-31 Rice 10, Wichita St. 1
5-31 Wichita St. 5, Mississippi 4
6-1 Rice 5, Wichita St. 2
at College Station, TX
5-30 (2) Alabama 9, (3) Houston 3
5-30 (1) Texas A&M 6, (4) Oral Roberts 3
5-31 Houston 4, Oral Roberts 2
5-31 Texas A&M 16, Alabama 5
5-31 Houston 16, Alabama 8
6-1 Houston 7, Texas A&M 6
6-1 Houston 7, Texas A&M 6
SUPER REGIONAL at Houston, TX
6-7 Houston 5, Rice 2
6-8 Rice 10, Houston 2
6-9 Rice 5, Houston 2
at Lincoln, NE
5-30 (1) Nebraska 16, (4) Eastern Mich. 11
5-30 (3) Missouri St. 8, (2) Coastal Caro. 3
5-31 Eastern Mich. 9, Coastal Caro. 8
5-31 Missouri St. 4, Nebraska 2
5-31 Nebraska 18, Eastern Mich. 2
6-1 Nebraska 9, Missouri St. 5
6-1 Missouri St. 7, Nebraska 0
at Auburn, AL
5-30 (3) Ohio St. 10, (2) Clemson 8
5-30 (1) Auburn 5, (4) Princeton 2
5-31 Clemson 7, Princeton 6 (10 inn.)
5-31 Ohio St. 6, Auburn 2
5-31 Auburn 15, Clemson 0
6-1 Ohio St. 9, Auburn 7
SUPER REGIONAL at Columbus, OH
6-7 Missouri St. 13, Ohio St. 8
6-8 Missouri St. 13, Ohio St. 7
at Baton Rouge, LA
5-30 (1) LSU 11, (4) Northeastern 8
5-30 (2) Tulane 8, (3) UNC Wilmington 3
5-31 UNC Wilmington 12, Northeastern 6
5-31 LSU 13, Tulane 5
5-31 UNC Wilmington 9, Tulane 8 (10 inn.)
6-1 LSU 9, UNC Wilmington 8 (11 inn.)
at Hattiesburg, MS
5-30 (3) Southern U. 5, (2) Southern Miss. 3
5-30 (1) Baylor 7, (4) Murray St. 6
5-31 Southern Miss. 18, Murray St. 0
5-31 Baylor 10, Southern U. 3
5-31 Southern Miss. 18, Southern U. 1
6-1 Baylor 3, Southern Miss. 2
SUPER REGIONAL at Baton Rouge, LA
6-6 Baylor 4, LSU 1
6-7 LSU 6, Baylor 5
6-8 LSU 20, Baylor 5
at Tempe, AZ
5-30 (3) New Mexico St. 14, (2) UNLV 12 (11 inn.)
5-30 (1) Arizona St. 14, (4) Central Conn. St. 2
5-31 UNLV 22, Central Conn. St. 3
5-31 Arizona St. 15, New Mexico St. 0
5-31 UNLV 16, New Mexico St. 10
6-1 Arizona St. 16, UNLV 1
at Fullerton, CA
5-30 (3) Notre Dame 13, (2) Arizona 5
5-30 (1) Cal St. Fullerton 3, (4) San Diego 1
5-31 San Diego 5, Arizona 2
5-31 Cal St. Fullerton 4, Notre Dame 3
5-31 Notre Dame 6, San Diego 3
6-1 Cal St. Fullerton 8, Notre Dame 1
SUPER REGIONAL at Fullerton, CA
6-6 Cal St. Fullerton 5, Arizona St. 1
6-7 Arizona St. 7, Cal St. Fullerton 6
6-8 Cal St. Fullerton 7, Arizona St. 1

226
2003 REGIONAL AND SUPER REGIONAL RESULTS (cont.)
at Palo Alto, CA
5-30 (3) UC Riverside 10, (2) Richmond 8
5-30 (1) Stanford 7, (4) Ill.-Chicago 2
5-31 Richmond 5, Ill.-Chicago 0
5-31 Stanford 13, UC Riverside 6
5-31 Richmond 8, UC Riverside 1
6-1 Stanford 19, Richmond 6
at Long Beach, CA
5-30 (3) Washington 5, (2) Minnesota 3
5-30 (1) Long Beach St. 6, (4) Pepperdine 1
5-31 Minnesota 7, Pepperdine 5
5-31 Long Beach St. 7, Washington 2
5-31 Washington 4, Minnesota 1
6-1 Long Beach St. 7, Washington 2
SUPER REGIONAL at Palo Alto, CA
6-6 Stanford 5, Long Beach St. 1
6-7 Stanford 4, Long Beach St. 2
at Starkville, MS
5-30 (2) North Carolina 4, (3) Missouri 3 (11 inn.)
5-30 (1) Mississippi St. 10, (4) Middle Tenn. St. 4
5-31 Missouri 13, Middle Tenn. St. 7
5-31 North Carolina 10, Mississippi St. 5
5-31 Mississippi St. 10, Missouri 5
6-1 North Carolina 8, Mississippi St. 6 (11 inn.)
at Atlanta, GA
5-30 (2) South Carolina 4, (4) East Caro. 0
5-30 (4) Stetson 5, (1) Georgia Tech 4
5-31 East Caro. 10, Georgia Tech 3
5-31 South Carolina 3, Stetson 2
5-31 Stetson 9, East Caro. 4
6-1 South Carolina 9, Stetson 3
SUPER REGIONAL at Columbia, SC
6-6 South Carolina 5, North Carolina 4
6-7 South Carolina 14, North Carolina 4
NATIONAL TOP EIGHT SEEDS
1. Florida St.
2. LSU
3. Georgia Tech
4. Auburn
5. Rice
6. Stanford
7. Cal St. Fullerton
8. Miami (Fla.)
2004 REGIONAL AND SUPER REGIONAL RESULTS
at Austin, TX
6-4 (2) Oral Roberts 6, (3) TCU 5
6-4 (1) Texas 10, (4) Youngstown St. 3
6-5 TCU 12, Youngstown St. 8
6-5 Texas 7, Oral Roberts 5
6-5 Oral Roberts 10, TCU 1
6-6 Texas 7, Oral Roberts 3
at Charlottesville, VA
6-4 (2) Vanderbilt 7, (3) George Mason 3
6-5 (4) Princeton 4, (1) Virginia 2
6-5 Virginia 7, George Mason 2
6-5 Vanderbilt 11, Princeton 1
6-6 Virginia 9, Princeton 0
6-6 Vanderbilt 7, Virginia 3
SUPER REGIONAL at Austin, TX
6-11 Texas 15, Vanderbilt 3
6-12 Texas 10, Vanderbilt 2
at Tallahassee, FL
6-4 (3) UCF 7, (2) Oklahoma St. 3
6-4 (1) Florida St. 10, (4) Bethune-Cookman 3
6-5 Oklahoma St. 4, Bethune- Cookman 1
6-5 Florida St. 3, UCF 2
6-5 UCF 12, Oklahoma St. 9
6-6 UCF 7, Florida St. 5
6-6 Florida St. 19, UCF 3
at Fayetteville, AR
6-4 (2) Wichita St. 3, (3) Missouri 0
6-4 (1) Arkansas 4, (4) Le Moyne 1
6-5 Missouri 11, Le Moyne 3
6-5 Wichita St. 4, Arkansas 3
6-5 Arkansas 10, Missouri 7
6-6 Arkansas 11, Wichita St. 9
6-6 Arkansas 4, Wichita St. 3
SUPER REGIONAL at Fayetteville, AR
6-11 Arkansas 7, Florida St. 5
6-12 Arkansas 4, Florida St. 2
at Palo Alto, CA
6-4 (1) Stanford 10, (4) UNLV 4
6-4 (2) Long Beach St. 4, (3) St. John’s 3
6-5 St. John’s 9, UNLV 6
6-5 Long Beach St. 7, Stanford 4
6-5 Stanford 7, St. John’s 2
6-6 Long Beach St. 8, Stanford 4
at South Bend, IN
6-4 (4) Kent St. 2, (1) Notre Dame 1
6-4 (3) Arizona 7, (2) UC Irvine 3
6-5 Notre Dame 6, UC Irvine 5
6-5 Arizona 7, Kent St. 4
6-5 Notre Dame 7, Kent St. 1
6-6 Arizona 7, Notre Dame 6
SUPER REGIONAL at Long Beach, CA
6-11 Arizona 6, Long Beach St. 5
6-12 Long Beach St. 9, Arizona 4
6-13 Arizona 4, Long Beach St. 3 (11 inn.)

227
2004 REGIONAL AND SUPER REGIONAL RESULTS (cont)
at Athens, GA
6-4 (1) Georgia 16, (4) Middle Tenn. St. 2
6-4 (2) Clemson 10, (3) Birmingham So. 6
6-5 Birmingham So. 5, Middle Tenn. St. 0
6-5 Georgia 6, Clemson 3
6-5 Clemson 5, Birmingham So. 4
6-6 Clemson 10, Georgia 9
6-6 Georgia 7, Clemson 6
at Atlanta, GA
6-4 (2) Texas Tech 10, (3) Mississippi St. 6
6-4 (1) Georgia Tech 16, (4) Jacksonville St. 3
6-5 Mississippi St. 7, Jacksonville St. 6
6-5 Georgia Tech 9, Texas Tech 3
6-5 Texas Tech 14, Mississippi St. 7
6-6 Georgia Tech 5, Texas Tech 3
SUPER REGIONAL at Atlanta, GA
6-11 Georgia 7, Georgia Tech 5
6-12 Georgia 5, Georgia Tech 3
at Columbia, SC
6-4 (2) North Carolina 6, (3) Coastal Caro. 5
6-4 (1) South Carolina 12, (4) Citadel 4
6-5 Citadel 10, Coastal Caro. 1
6-5 South Carolina 5, North Carolina 2
6-5 North Carolina 6, Citadel 3
6-6 South Carolina 7, North Carolina 6
at Kinston, NC
6-5 (3) UNC Wilmington 8, (2) Tennessee 5
6-5 (1) East Caro. 8, (4) Stony Brook 2
6-6 Tennessee 1, Stony Brook 0
6-6 East Caro. 11, UNC Wilmington 4
6-6 UNC Wilmington 4, Tennessee 3
6-7 East Caro. 7, UNC Wilmington 0
SUPER REGIONAL at Columbia, SC
6-12 South Carolina 4, East Caro. 2
6-13 South Carolina 5, East Caro. 3
at Oxford, MS
6-4 (3) Tulane 3, (2) Washington 2
6-4 (4) Western Ky. 1, (1) Mississippi 0
6-5 Washington 7, Mississippi 2
6-5 Tulane 7, Western Ky. 0
6-5 Washington 4, Western Ky. 1
6-6 Tulane 12, Washington 3
at Fullerton, CA
6-4 (4) Pepperdine 15, (1) Arizona St. 5
6-4 (2) Cal St. Fullerton 7, (3) Minnesota 1
6-5 Arizona St. 6, Minnesota 4
6-5 Pepperdine 7, Cal St. Fullerton 6
6-5 Cal St. Fullerton 5, Arizona St. 0
6-6 Cal St. Fullerton 15, Pepperdine 1
6-6 Cal St. Fullerton 16, Pepperdine 3
SUPER REGIONAL at Fullerton, CA
6-12 Cal St. Fullerton 9, Tulane 0
6-13 Cal St. Fullerton 10, Tulane 7
at Houston, TX
6-4 (4) Texas Southern 4, (1) Rice 3
6-5 (2) Texas A&M 14, Lamar 3
6-5 Rice 6, Lamar 3
6-5 Texas A&M 12, Texas Southern 1
6-5 Rice 7, Texas Southern 1
6-6 Rice 3, Texas A&M 1
6-6 Texas A&M 7, Rice 5
at Baton Rouge, LA
6-4 (1) LSU 9, (4) Army 0
6-4 (2) Southern Miss. 6, (3) Col. of Charleston 5
6-5 Col. of Charleston 2, Army 1
6-5 LSU 6, Southern Miss. 2
6-5 Col. of Charleston 7, Southern Miss. 3
6-6 LSU 11, Col. of Charleston 3
SUPER REGIONAL at Baton Rouge, LA
6-12 LSU 11, Texas A&M 8
6-13 LSU 4, Texas A&M 0
at Oklahoma City, OK
6-4 (1) Florida 12, (4) Central Conn. St. 1
6-4 (3) UCLA 9, (2) Oklahoma 1
6-5 Oklahoma 6, Central Conn. St. 1
6-5 Florida 4, UCLA 3
6-5 UCLA 17, Oklahoma 7
6-6 Florida 11, UCLA 0
at Coral Gables, FL
6-4 (2) North Carolina St. 6, (3) Fla. Atlantic 5
6-4 (1) Miami (Fla.) 6, (4) St. Bonaventure 3
6-5 Fla. Atlantic 14, St. Bonaventure 2
6-5 Miami (Fla.) 19, North Carolina St. 5
6-5 Fla. Atlantic 10, North Carolina St. 2
6-6 Miami (Fla.) 19, Fla. Atlantic 6
SUPER REGIONAL at Coral Gables, FL
6-12 Miami (Fla.) 8, Florida 7
6-13 Miami (Fla.) 3, Florida 1
NATIONAL TOP EIGHT SEEDS
1. Texas
2. South Carolina
3. Miami (Fla.)
4. Georgia Tech
5. Stanford
6. Rice
7. Arizona St.
8. Arkansas

228
2005 REGIONAL AND SUPER REGIONAL RESULTS
at New Orleans, LA
6-3 (1) Tulane 17, (4) Southern U. 7
6-3 (2) Alabama 7, (3) La.-Lafayette 5
6-4 La.-Lafayette 9, Southern U. 1
6-4 Tulane 10, Alabama 4
6-5 Alabama 4, La.-Lafayette 3
6-6 Tulane 7, Alabama 4
at Baton Rouge, LA
6-3 (1) LSU 14, (4) Marist 5
6-3 (2) Rice 7, (3) Northwestern St. 3
6-4 Northwestern St. 4, Marist 3
6-4 Rice 9, LSU 7
6-5 LSU 12, Northwestern St. 4
6-6 Rice 5, LSU 4
SUPER REGIONAL at New Orleans, LA
6-11 Rice 9, Tulane 5
6-12 Tulane 7, Rice 0
6-13 Tulane 9, Rice 6
at Long Beach, CA
6-3 (2) Southern California 7, (3) Pepperdine 3
6-3 (1) Long Beach St. 11, (4) Rhode Island 2
6-4 Pepperdine 2, Rhode Island 1
6-4 Southern California 6, Long Beach St. 4
6-5 Pepperdine 6, Long Beach St. 3
6-5 Pepperdine 9, Southern California 2
6-6 Southern California 5, Pepperdine 2
at Corvallis, OR
6-3 (3) St. John’s (N.Y.) 5, (2) Virginia 3
6-3 (1) Oregon St. 4, (4) Ohio St. 3
6-4 Ohio St. 2, Virginia 1
6-4 Oregon St. 11, St. John’s (N.Y.) 1
6-5 St. John’s (N.Y.) 7, Ohio St. 1
6-5 Oregon St. 19, St. John’s (N.Y.) 3
SUPER REGIONAL at Corvallis, OR
6-11 Oregon St. 10, Southern California 4
6-12 Southern California 9, Oregon St. 8 (10 inn.)
6-13 Oregon St. 10, Southern California 8
at Oxford, MS
6-3 (3) Oklahoma 5, (2) Southern Miss. 4
6-3 (1) Mississippi 5, (4) Maine 0
6-4 Maine 12, Southern Miss. 2
6-4 Mississippi 7, Oklahoma 3
6-5 Oklahoma 11, Maine 10
6-5 Mississippi 20, Oklahoma 5
at Austin, TX
6-3 (2) Arkansas 9, (3) Miami (Ohio) 5
6-3 (1) Texas 20, (4) Quinnipiac 2
6-4 Miami (Ohio) 35, Quinnipiac 8
6-4 Arkansas 9, Texas 2
6-5 Texas 12, Miami (Ohio) 5
6-5 Texas 19, Arkansas 8
6-6 Texas 5, Arkansas 2
SUPER REGIONAL at Oxford, MS
6-11 Mississippi 6, Texas 4
6-12 Texas 3, Mississippi 1
6-13 Texas 6, Mississippi 4
at Clemson, SC
6-3 (2) Col. of Charleston 5, (3) Oral Roberts 2
6-3 (1) Clemson 12, (4) N.C. A&T 2
6-4 Oral Roberts 6, N.C. A&T 3
6-4 Clemson 6, Col. of Charleston 0
6-5 Oral Roberts 6, Col. of Charleston 0
6-5 Clemson 8, Oral Roberts 3
at Waco, TX
6-3 (2) TCU 5, (3) Stanford 1
6-3 (1) Baylor 8, (4) UTSA 3
6-4 Stanford 6, UTSA 2
6-4 Baylor 8, TCU 3
6-5 Stanford 12, TCU 4
6-5 Baylor 4, Stanford 3 (12 inn.)
SUPER REGIONAL at Waco, TX
6-11 Clemson 4, Baylor 2
6-12 Baylor 7, Clemson 1
6-13 Baylor 6, Clemson 1
at Atlanta, GA
6-3 (2) South Carolina 6, (3) Michigan 5
6-3 (1) Georgia Tech 5, (4) Furman 4 (10 inn.)
6-4 Michigan 6, Furman 3
6-4 Georgia Tech 10, South Carolina 2
6-5 South Carolina 4, Michigan 3
6-5 South Carolina 8, Georgia Tech 3
6-6 Georgia Tech 5, South Carolina 0
at Knoxville, TN
6-3 (2) Winthrop 2, (3) Wichita St. 1
6-3 (1) Tennessee 7, (4) Austin Peay 5
6-4 Wichita St. 5, Austin Peay 1
6-4 Tennessee 3, Winthrop 2
6-5 Wichita St. 3, Winthrop 2
6-5 Tennessee 12, Wichita St. 2
SUPER REGIONAL at Atlanta, GA
6-10 Tennessee 3, Georgia Tech 2
6-11 Tennessee 13, Georgia Tech 3
at Tallahassee, FL
6-3 (2) Auburn 13, (3) South Alabama 5
6-3 (1) Florida St. 3, (4) Army 2
6-4 Army 8, South Alabama 5
6-4 Florida St. 4, Auburn 3
6-5 Auburn 12, Army 3
6-5 Florida St. 10, Auburn 4
at Gainesville, FL
6-3 (2) North Carolina 5, (3) Notre Dame 1
6-3 (1) Florida 8, (4) Stetson 3
6-4 Notre Dame 7, Stetson 4
6-4 Florida 5, North Carolina 2
6-5 Notre Dame 3, North Carolina 0
6-5 Florida 23, Notre Dame 3
SUPER REGIONAL at Gainesville, FL
6-10 Florida 8, Florida St. 1
6-11 Florida 8, Florida St. 5

229
2005 REGIONAL AND SUPER REGIONAL RESULTS (cont.)
at Fullerton, CA
6-3 (2) Arizona 5, (3) Missouri 3
6-3 (1) Cal St. Fullerton 19, (4) Harvard 0
6-4 Missouri 14, Harvard 6
6-4 Arizona 6, Cal St. Fullerton 5
6-5 Cal St. Fullerton 8, Missouri 6
6-5 Cal St. Fullerton 7, Arizona 2
6-6 Cal St. Fullerton 6, Arizona 3
at Tempe, AZ
6-3 (1) Coastal Caro. 12, (4) UNLV 8
6-3 (2) Arizona St. 9, (3) East Caro. 6
6-4 UNLV 5, East Caro. 3
6-4 Arizona St. 11, Coastal Caro. 3
6-5 Coastal Caro. 14, UNLV 10
6-5 Arizona St. 9, Coastal Caro. 5
SUPER REGIONAL at Fullerton, CA
6-10 Cal St. Fullerton 3, Arizona St. 2
6-11 Arizona St. 6, Cal St. Fullerton 2
6-12 Arizona St. 9, Cal St. Fullerton 8
at Coral Gables, FL
6-3 (2) Mississippi St. 13, (3) Fla. Atlantic 2
6-3 (1) Miami (Fla.) 6, (4) VCU 2
6-4 Fla. Atlantic 3, VCU 1
6-4 Miami (Fla.) 4, Mississippi St. 1
6-5 Mississippi St. 8, Fla. Atlantic 4
6-5 Miami (Fla.) 10, Mississippi St. 4
at Lincoln, NE
6-3 (1) Nebraska 8, (4) Ill.-Chicago 6
6-3 (3) Creighton 8, (2) North Carolina St. 3
6-4 North Carolina St. 9, Ill.-Chicago 7
6-4 Nebraska 10, Creighton 8
6-5 Creighton 11, North Carolina St. 9
6-5 Nebraska 10, Creighton 2
SUPER REGIONAL at Lincoln, NE
6-10 Nebraska 3, Miami (Fla.) 1
6-11 Nebraska 6, Miami (Fla.) 3
NATIONAL TOP EIGHT SEEDS
1. Tulane
2. Georgia Tech
3. Nebraska
4. Baylor
5. Mississippi
6. Cal St. Fullerton
7. Florida
8. Oregon St.
2006 REGIONAL AND SUPER REGIONAL RESULTS
at Clemson, SC
6-2 Elon 5, Mississippi St. 4
6-2 Clemson 3, UNC Asheville 0
6-3 Mississippi St. 5, UNC Asheville 4
6-3 Clemson 13, Elon 3
6-4 Mississippi St. 12, Elon 3
6-4 Clemson 8, Mississippi St. 6
at Fayetteville, AR
6-2 Oklahoma St. 4, Princeton 1
6-2 Oral Roberts 4, Arkansas 3
6-3 Arkansas 6, Princeton 2
6-3 Oral Roberts 5, Oklahoma St. 4
6-4 Oklahoma St. 6, Arkansas 5
6-4 Oral Roberts 9, Oklahoma St. 2.
SUPER REGIONAL at Clemson, SC
6-9 Clemson 11, Oral Roberts 8
6-10 Clemson 6, Oral Roberts 5
at Lexington, KY
6-2 Col. of Charleston 5, Notre Dame 4 (16)
6-2 Ball St. 3, Kentucky 1
6-3 Kentucky 10, Notre Dame 4
6-3 Col. of Charleston 11, Ball St. 0
6-4 Kentucky 12, Ball St. 9
6-4 Col. of Charleston 7, Kentucky 4
at Atlanta, GA
6-2 Vanderbilt 5, Michigan 2
6-3 Georgia Tech 7, Stetson 5
6-3 Michigan 11, Stetson 1
6-3 Georgia Tech 7, Vanderbilt 3
6-4 Vanderbilt 5, Michigan 4
6-4 Georgia Tech 8, Vanderbilt 4
SUPER REGIONAL at Atlanta, GA
6-9 Georgia Tech 5, Col. of Charleston 0
6-10 Georgia Tech 12, Col. of Charleston 3
at Fullerton, CA
6-2 Cal St. Fullerton 6, St. Louis 1
6-2 Fresno St. 9, San Diego 8
6-3 San Diego 19, St. Louis 12
6-3 Cal St. Fullerton 9, Fresno St. 2
6-4 Fresno St. 9, San Diego 8
6-4 Cal St. Fullerton 10, Fresno St. 3
at Malibu, CA
6-2 UCLA 3, UC Irvine 2
6-2 Pepperdine 3, Missouri 2
6-3 Missouri 1, UC Irvine 0 (14)
6-3 Pepperdine 6, UCLA 0
6-4 Missouri 2, UCLA 1
6-4 Missouri 4, Pepperdine 1
6-5 Missouri 8, Pepperdine 3
SUPER REGIONAL at Fullerton, CA
6-9 Cal St. Fullerton 7, Missouri 1
6-10 Cal St. Fullerton 9, Missouri 1.

230
2006 REGIONAL AND SUPER REGIONAL RESULTS (cont.)
at Chapel Hill, NC
6-2 North Carolina 15, Maine 7
6-2 Winthrop 14, UNC Wilmington 2
6-3 North Carolina 14, Winthrop 4
6-3 UNC Wilmington 21, Maine 19
6-4 Winthrop 5, UNC Wilmington 3
6-4 North Carolina 14, Winthrop 2
at Tuscaloosa, AL
6-2 Troy 10, Southern Miss. 8
6-2 Alabama 13, Jacksonville St. 1
6-3 Southern Miss. 6, Jacksonville St. 2
6-3 Alabama 4, Troy 3
6-4 Troy 6, Southern Miss. 5
6-4 Alabama 14, Troy 5
SUPER REGIONAL at Tuscaloosa, AL
6-9 North Carolina 11, Alabama 5
6-10 North Carolina 8, Alabama 7
at Houston, TX
6-2 Rice 6, Prairie View 5
6-2 Baylor 3, Arizona St. 2
6-3 Arizona St. 13, Prairie View 4
6-4 Rice 7, Baylor 2
6-4 Baylor 7, Arizona St. 2
6-5 Rice 7, Baylor 4
at Norman, OK
6-2 TCU 6, Oklahoma 5
6-2 Wichita St. 2, Houston 1
6-3 Wichita St. 18, TCU 8
6-3 Oklahoma 8, Houston 6
6-4 Oklahoma 15, TCU 6
6-4 Oklahoma 12, Wichita St. 7
6-5 Oklahoma 7, Wichita St. 6
SUPER REGIONAL at Houston, TX
6-10 Rice 10, Oklahoma 4
6-11 Oklahoma 11, Rice 5
6-12 Rice 9, Oklahoma 5
at Charlottesville, VA
6-2 Virginia 11, Lehigh 5
6-3 South Carolina 4, Evansville 2
6-3 South Carolina 8, Virginia 2
6-3 Evansville 10, Lehigh 6
6-4 Evansville 15, Virginia 4
6-4 Evansville 15, South Carolina 5
6-5 South Carolina 5, Evansville 1
at Athens, GA
6-2 Florida St. 18, Jacksonville 0
6-3 Georgia 11, Sacred Heart 0
6-3 Florida St. 6, Georgia 4
6-3 Jacksonville 4, Sacred Heart 3
6-4 Georgia 15, Jacksonville 8
6-4 Georgia 7, Florida St. 1
6-5 Georgia 3, Florida St. 1
SUPER REGIONAL at Athens, GA 6-10 South Carolina 15, Georgia 6
6-11 Georgia 11, South Carolina 5
6-12 Georgia 11, South Carolina 6
at Lincoln, NE
6-2 Miami (Fla.) 11, San Francisco 2
6-2 Manhattan 4, Nebraska 1
6-3 Miami (Fla.) 8, Manhattan 2
6-3 San Francisco 5, Nebraska 1
6-4 Manhattan 6, San Francisco 4
6-4 Miami (Fla.) 10, Manhattan 4
at Oxford, MS
6-2 South Ala. 7, Tulane 1
6-2 Mississippi 3, Bethune-Cookman 2
6-3 Tulane 12, Bethune-Cookman 7
6-3 Mississippi 9, South Ala. 7
6-4 Tulane 18, South Ala. 11
6-4 Mississippi 12, Tulane 4
SUPER REGIONAL at Oxford, MS
6-10 Mississippi 11, Miami (Fla.) 9
6-11 Miami (Fla.) 7, Mississippi 0
6-12 Miami (Fla.) 14, Mississippi 9
at Austin, TX
6-2 Stanford 7, North Carolina St. 2
6-2 Texas 9, Texas-Arlington 1
6-3 North Carolina St. 6, Texas-Arlington 5 (10)
6-3 Stanford 12, Texas 8
6-4 North Carolina St. 6, Texas 3
6-4 Stanford 17, North Carolina St. 7
at Corvallis, OR
6-2 Kansas 9, Hawaii 6
6-2 Oregon St. 5, Wright St. 3
6-3 Hawaii 5, Wright St. 3
6-3 Oregon St. 11, Kansas 3
6-4 Hawaii 9, Kansas 5
6-4 Oregon St. 12, Hawaii 3
SUPER REGIONAL at Corvallis, OR
6-10 Oregon St. 4, Stanford 3
6-11 Oregon St. 15, Stanford 0
NATIONAL TOP EIGHT SEEDS
1. Clemson
2. Rice
3. Texas
4. Alabama
5. Cal St. Fullerton
6. Nebraska
7. Georgia
8. Georgia Tech

231
2007 REGIONAL AND SUPER REGIONAL RESULTS
at Nashville, TN
6-1 Michigan 10, Memphis 7
6-1 Vanderbilt 2, Austin Peay 1
6-2 Michigan 4, Vanderbilt 3
6-2 Austin Peay 18, Memphis 7
6-3 Vanderbilt 11, Austin Peay 5
6-3 Vanderbilt 10, Michigan 7
6-4 Michigan 4, Vanderbilt 3 (10 inn.)
at Charlottesville, VA
6-1 Virginia 5, Lafayette 1
6-1 Oregon St. 5, Rutgers 1
6-2 Virginia 7, Oregon St. 3 (13 inn.)
6-2 Rutgers 11, Lafayette 10
6-4 Oregon St. 5, Rutgers 2
6-4 Oregon St. 5, Virginia 3
6-5 Oregon St. 7, Virginia 3
SUPER REGIONAL at Corvallis, OR
6-10 Oregon St. 1, Michigan 0
6-11 Oregon St. 8, Michigan 2
at Long Beach, CA
6-1 UCLA 7, Pepperdine 3
6-1 Ill.-Chicago 4, Long Beach St. 1
6-2 UCLA 3, Ill.-Chicago 1
6-2 Long Beach St. 6, Pepperdine 3
6-3 Long Beach St. 4, Ill.-Chicago 3
6-3 UCLA 7, Long Beach St. 4
at San Diego, CA
6-1 Fresno St. 6, San Diego 2
6-1 Cal St. Fullerton 7, Minnesota 1
6-2 Cal St. Fullerton 6, Fresno St. 4
6-2 Minnesota 6, San Diego 5 (10 inn.)
6-3 Fresno St. 11, Minnesota 6
6-3 Cal St. Fullerton 13, Fresno St. 2
SUPER REGIONAL at Fullerton, CA
6-9 Cal St. Fullerton 12, UCLA 2
6-9 Cal St. Fullerton 2, UCLA 1
at Tempe, AZ
6-1 Arizona St. 5, Monmouth 3
6-1 UC Riverside 10, Nebraska 5
6-2 Arizona St. 9, UC Riverside 2
6-2 Nebraska 6, Monmouth 5
6-3 Nebraska 11, UC Riverside 1
6-3 Arizona St. 19, Nebraska 7
at Oxford, MS
6-1 Southern Miss. 14, Troy 1
6-1 Mississippi 14, Sam Houston St. 5
6-2 Mississippi 4, Southern Miss. 0
6-2 Sam Houston St. 5, Troy 4
6-3 Sam Houston St. 12, Southern Miss. 11 (11 inn.)
6-3 Mississippi 21, Sam Houston St. 13
SUPER REGIONAL at Tempe, AZ
6-9 Arizona St. 4, Mississippi 3
6-10 Arizona St. 7, Mississippi 1
at Wichita, KS
6-1 New Orleans 7, Wichita St. 6
6-1 Arizona 4, Oral Roberts 3
6-2 Wichita St. 11, Oral Roberts 4
6-2 Arizona 9, New Orleans 8
6-3 Wichita St. 7, New Orleans 3
6-3 Wichita St. 4, Arizona 3
6-4 Wichita St. 3, Arizona 0
at Round Rock, TX
6-1 Texas 8, Brown 2
6-1 UC Irvine 13, Wake Forest 0
6-2 Wake Forest 4, Brown 2
6-2 UC Irvine 3, Texas 1
6-3 Texas 7, Wake Forest 4 (12 inn.)
6-3 UC Irvine 9, Texas 6
SUPER REGIONAL at Wichita, KS
6-9 UC Irvine 1, Wichita St. 0
6-10 UC Irvine 3, Wichita St. 2
at Houston, TX (Rice)
6-1 Rice 5, Prairie View 0
6-1 TCU 3, Baylor 2
6-2 Baylor 9, Prairie View 2
6-2 Rice 6, TCU 3
6-3 TCU 10, Baylor 5
6-3 Rice 3, TCU 1
at College Station, TX
6-1 La.-Lafayette 5, Ohio St. 4
6-1 Texas A&M 7, Le Moyne 2
6-2 Ohio St. 6, Le Moyne 5 (10 inn.)
6-2 La.-Lafayette 5, Texas A&M 4
6-3 Texas A&M 10, Ohio St. 4
6-3 Texas A&M 4, La.-Lafayette 1
6-4 Texas A&M 5, La.-Lafayette 2
SUPER REGIONAL at Houston, TX (Rice)
6-8 Rice 3, Texas A&M 2 (10 inn.)
6-9 Rice 5, Texas A&M 2
at Columbia, MO
6-1 Louisville 13, Miami (Fla.) 7
6-1 Missouri 10, Kent St. 2
6-2 Missouri 7, Louisville 5
6-2 Miami (Fla.) 8, Kent St. 7
6-3 Louisville 8, Miami (Fla.) 7
6-3 Louisville 4, Missouri 3
6-4 Louisville 16, Missouri 6
at Fayetteville, AR
6-1 Arkansas 9, Albany (N.Y.) 0
6-1 Oklahoma St. 6, Creighton 4
6-2 Creighton 21, Albany (N.Y.) 11
6-2 Oklahoma St. 14, Arkansas 3
6-3 Arkansas 6, Creighton 0
6-3 Oklahoma St. 7, Arkansas 6
SUPER REGIONAL at Louisville, KY
6-8 Louisville 9, Oklahoma St. 0
6-9 Oklahoma St. 3, Louisville 2 (12 inn.)
6-9 Louisville 20, Oklahoma St. 2

232
2007 REGIONAL AND SUPER REGIONAL RESULTS (cont.)
at Tallahassee, FL
6-1 Florida St. 6, Bethune-Cookman 2
6-1 Mississippi St. 6, Stetson 3
6-2 Mississippi St. 3, Florida St. 0
6-2 Stetson 12, Bethune-Cookman 0
6-3 Florida St. 17, Stetson 1
6-3 Mississippi St. 9, Florida St. 4
at Myrtle Beach, SC
6-1 Clemson 3, St. John’s (N.Y.) 2
6-1 Coastal Caro. 7, VCU 1
6-3 Clemson 11, Coastal Caro. 8
6-3 St. John’s (N.Y.) 5, VCU 4
6-3 Coastal Caro. 6, St. John’s 5
6-4 Clemson 15, Coastal Caro. 3
SUPER REGIONAL at Starkville, MS
6-8 Mississippi St. 8, Clemson 6
6-9 Mississippi St. 8, Clemson 5
at Columbia, SC
6-1 Charlotte 6, North Carolina St. 3
6-1 South Carolina 9, Wofford 1
6-3 North Carolina St. 10, Wofford 6
6-3 South Carolina 12, Charlotte 8
6-3 Charlotte 12, North Carolina St. 10
6-4 South Carolina 11, Charlotte 6
at Chapel Hill, NC
6-1 North Carolina 6, Jacksonville 0
6-1 East Caro. 9, Western Caro. 8
6-2 North Carolina 11, East Caro. 10
6-2 Western Caro. 7, Jacksonville 0
6-3 Western Caro. 9, East Caro. 5
6-4 North Carolina 6, Western Caro. 5
SUPER REGIONAL at Chapel Hill, NC
6-8 North Carolina 9, South Carolina 6
6-9 South Carolina 8, North Carolina 6
6-10 North Carolina 9, South Carolina 4
NATIONAL TOP EIGHT SEEDS
1. Vanderbilt
2. Rice
3. North Carolina
4. Texas
5. Arizona St.
6. Florida St.
7. Arkansas
8. San Diego
2008 REGIONAL AND SUPER REGIONAL RESULTS
at Miami, FL
5-30 Missouri 7, Mississippi 0
5-30 Miami (FL) 7, Bethune-Cookman 4
5-31 Mississippi 14, Bethune-Cookman 1
5-31 Miami (FL) 6, Missouri 5
6-1 Mississippi 9, Missouri 6
6-1 Miami (FL) 11, Mississippi 2
at Ann Arbor, MI
5-30 Arizona 13, Eastern Mich. 7
5-30 Michigan 7, Kentucky 5
5-31 Kentucky 4, Eastern Mich. 3
5-31 Arizona 4, Michigan 3
6-1 Kentucky 12, Michigan 6
6-1 Arizona 5, Kentucky 3
SUPER REGIONAL at Miami, FL
6-6 Arizona 4, Miami (FL) 2
6-7 Miami (FL) 14, Arizona 10
6-8 Miami (FL) 4, Arizona 2
at Raleigh, NC
5-30 South Carolina 15, Charlotte 8
5-30 North Carolina St. 6, James Madison 2
5-31 James Madison 13, Charlotte 12
5-31 North Carolina St. 5, South Carolina 4
6-1 South Carolina 7, James Madison 5
6-1 North Carolina St. 2, South Carolina 1.
at Athens, GA
5-30 Lipscomb 10, Georgia 7
5-30 Georgia Tech 8, Louisville 5
5-31 Georgia 9, Louisville 8
5-31 Georgia Tech 6, Lipscomb 3
6-1 Georgia 14, Lipscomb 3
6-1 Georgia 8, Georgia Tech 0
6-2 Georgia 18, Georgia Tech 6
SUPER REGIONAL at Athens, GA
6-6 Georgia 11, North Carolina St. 4
6-7 North Carolina St. 10, Georgia 6
6-8 Georgia 17, North Carolina St. 8
at Fullerton, CA
5-30 UCLA 3, Virginia 2
5-30 Cal St. Fullerton 11, Rider 0
5-31 Virginia 8, Rider 2
5-31 UCLA 11, Cal St. Fullerton 4
6-1 Cal St. Fullerton 4, Virginia 1
6-1 Cal St. Fullerton 11, UCLA 8
6-2 Cal St. Fullerton 5, UCLA 4
at Stanford, CA
5-30 Pepperdine 4, Arkansas 3
5-30 UC Davis 4, Stanford 2
5-31 Stanford 5, Arkansas 1
5-31 Pepperdine 7, UC Davis 4
6-1 Stanford 8, UC Davis 4
6-1 Stanford 13, Pepperdine 1
6-2 Stanford 9, Pepperdine 7

233
2008 REGIONAL AND SUPER REGIONAL RESULTS (cont.)
SUPER REGIONAL at Fullerton, CA
6-6 Stanford 4, Cal St. Fullerton 3
6-7 Stanford 8, Cal St. Fullerton 5
at Stillwater, OK
Oklahoma St. 5, Western Ky. 3
Wichita St. 8, TCU 5
TCU 10, Western Ky. 5
Wichita St. 5, Oklahoma St. 3
Oklahoma St. 9, TCU 8
Wichita St. 11, Oklahoma St. 7
at Tallahassee, FL
Bucknell 7, Florida St. 0
Tulane 7, Florida 4
Florida St. 17, Florida 11
Tulane 4, Bucknell 1
Florida St. 24, Bucknell 9
Florida St. 17, Tulane 8
Florida St. 16, Tulane 7
SUPER REGIONAL at Tallahassee, FL
Wichita St. 10, Florida St. 7
Florida St. 14, Wichita St. 4
Florida St. 11, Wichita St. 4
at Cary, NC
North Carolina 16, Mount St. Mary’s 8
UNC-Wilmington 5, Elon 2
Elon 6, Mount St. Mary’s 3
North Carolina 5, UNC-Wilmington 1
UNC-Wilmington 15, Elon 11
North Carolina 7, UNC-Wilmington 3
at Conway, SC
Coastal Carolina 10, Columbia 2
Alabama 16, East Carolina 3
East Carolina 9, Columbia 0
Coastal Carolina 13, Alabama 10
East Carolina 16, Alabama 1
Coastal Carolina 24, East Carolina 11
SUPER REGIONAL at Cary, NC
North Carolina 9, Coastal Carolina 4
North Carolina 14, Coastal Carolina 4
at Lincoln, NE
Nebraska 13, Eastern Ill. 10
UC Irvine 9, Oral Roberts 7
Oral Roberts 8, Eastern Ill. 7
UC Irvine 3, Nebraska 2
Oral Roberts 8, Nebraska 0
UC Irvine 8, Oral Roberts 0
at Baton Rouge, LA
LSU 12, Texas Southern 1
Southern Miss. 13, New Orleans 6
New Orleans 18, Texas Southern 5
LSU 13, Southern Miss. 4
Southern Miss. 8, New Orleans 2
LSU 11, Southern Miss. 4
SUPER REGIONAL at Baton Rouge, LA
UC Irvine 11, LSU 5
LSU 9, UC Irvine 7
LSU 21, UC Irvine 7
at Houston, TX (Rice)
Rice 3, Sam Houston St. 2
St. John’s 2, Texas 1
Texas 13, Sam Houston St. 3
Rice 11, St. John’s 2
Texas 4, St. John’s 3
Rice 7, Texas 4
at College Station, TX
Houston 9, Dallas Baptist 5
Texas A&M 15, Ill.-Chicago 1
Ill.-Chicago 9, Dallas Baptist 5
Texas A&M 22, Houston 4
Houston 14, Ill.-Chicago 11
Houston 4, Texas A&M 3
Texas A&M 13, Houston 5
SUPER REGIONAL at Houston, TX (Rice)
Rice 9, Texas A&M 7
Rice 6, Texas A&M 5
at Long Beach, CA
Fresno St. 7, Long Beach St. 3
San Diego 5, California 0
Long Beach St. 9, California 2
Fresno St. 6, San Diego 0
San Diego 5, Long Beach St. 1
San Diego 15, Fresno St. 1
Fresno St. 5, San Diego 1
at Tempe, AZ
Arizona St. 9, Stony Brook 7
Oklahoma 8, Vanderbilt 5
Vanderbilt 9, Stony Brook 4
Arizona St. 15, Oklahoma 3
Oklahoma 11, Vanderbilt 10
Arizona St. 12, Oklahoma 0
SUPER REGIONAL at Tempe, AZ Arizona St. 12, Fresno St. 4
Fresno St. 8, Arizona St. 6
Fresno St. 12, Arizona St. 9.
NATIONAL TOP EIGHT SEEDS
1. Miami (FL)
2. North Carolina
3. Arizona St.
4. Florida St.
5. Cal St. Fullerton
6. Rice
7. LSU
8. Georgia

234
Top eight seeds advancing to MCWS (since bracket expanded to 64 teams in 1999)
1999 (includes MCWS record and finish)
#1 Miami (Fla.) (4-0; 1st)
#2 Florida St. (4-2; 2nd)
#3 Cal St. Fullerton (1-2; t5th)
#5 Alabama (2-2; t3rd)
#6 Stanford (2-2; t3rd)
#7 Texas A&M (0-2; t7th)
#8 Rice (0-2; t7th)
#4 Baylor lost in super regional
2000 (includes MCWS record and finish)
#2 LSU (4-0; 1st)
#4 Clemson (1-2; t5th)
#6 Florida St. (2-2; t3rd)
#8 Stanford (3-1; 2nd)
#1 South Carolina, #3 Georgia Tech, #5 Houston all lost in super regional
#7 Arizona St. lost in regional
2001 (includes MCWS record and finish)
#1 Cal St. Fullerton – (2-2; t3rd)
#2 Miami (Fla.) (4-0; 1st)
#3 Southern California (1-2; t5th)
#4 Stanford (3-1; 2nd)
#5 Tulane (1-2; t5th)
#6 Georgia (0-2; t7th)
#8 Nebraska (0-2; t7th)
#7 East Carolina lost in super regional
2002 (includes MCWS record and finish)
#2 Clemson (2-2; t3rd)
#4 Rice (0-2; t7th)
#5 Texas (4-0; 1st)
#6 South Carolina (4-2; 2nd)
#8 Stanford (2-2; t3rd)
#1 Florida St. lost in super regional
#3 Alabama and #7 Wake Forest lost in regional

235
Top eight seeds advancing to MCWS (continued) (since bracket expanded to 64 teams in 1999)
2003 (includes MCWS record and finish)
#2 LSU (0-2; t7th)
#5 Rice (5-1; 1st)
#6 Stanford (5-3; 2nd)
#7 Cal St. Fullerton (2-2; t3rd)
#8 Miami (Fla.) (1-2; t5th)
#1 Florida St. lost in super regional
#3 Georgia Tech and #4 Auburn lost in regionals
2004 (includes MCWS record and finish)
#1 Texas – 3-2 (2nd)
#2 South Carolina (3-2; t3rd)
#3 Miami (Fla.) (1-2; t5th)
#8 Arkansas (0-2; t7th)
unseeded Cal St. Fullerton won national title
#4 Georgia Tech lost in super regionals
#5 Stanford, #6 Rice and #7 Arizona St. lost in regionals
2005 (includes MCWS record and finish)
#1 Tulane (1-2; t5th)
#3 Nebraska (1-2; t5th)
#4 Baylor (2-2; t3rd)
#7 Florida (3-3; 2nd)
#8 Oregon St. (0-2; t7th)
unseeded Texas won national title
#2 Georgia Tech, #5 Mississippi, #6 Cal St. Fullerton all lost in super regionals
2006 (includes MCWS record and finish)
#1 Clemson (1-2; t5th)
#2 Rice (2-2; t3rd)
#5 Cal St. Fullerton (2-2; t3rd)
#7 Georgia (0-2; t7th)
#8 Georgia Tech (0-2; t7th)
unseeded Oregon St. won national title; unseeded North Carolina was runner-up
#4 Alabama lost in super regionals
#3 Texas, #6 Nebraska lost in regionals

236
Top eight seeds advancing to MCWS (continued) (since bracket expanded to 64 teams in 1999)
2007(includes MCWS record and finish)
#2 Rice (2-2; t3rd)
#3 North Carolina (4-3; 2nd
)
#5 Arizona St. (1-2; t5th)
unseeded Oregon St. won national title
#1 Vanderbilt, #4 Texas, #6 Florida St., #7 Arkansas, #8 San Diego all lost in regionals
2008(includes MCWS record and finish)
#1 Miami (FL) (1-2; t5th)
#2 North Carolina (3-2; t3rd)
#4 Florida St. (0-2; t7th)
#6 Rice (0-2; t7th)
#7 LSU (1-2; t5th)
#8 Georgia (4-2; 2nd)
unseeded Fresno St. won national title
#3 Arizona St. and #5 Cal St. Fullerton lost in super regionals

237
YEAR-BY-YEAR SUPER REGIONAL RECORDS
(through 2008)
1999 2000 2001 2002 2003 2004 2005 2006 2007 2008 TOTAL
Alabama 2-0 -- -- -- -- -- -- 0-2 -- -- 2-2
Arizona -- -- -- -- -- 2-1 -- -- -- 1-2 3-3
Arizona St. -- -- -- -- 1-2 -- 2-1 -- 2-0 1-2 6-5
Arkansas -- -- -- 1-2 -- 2-0 -- -- -- -- 3-2
Auburn 0-2 -- -- -- -- -- -- -- -- -- 0-2
Baylor 1-2 -- -- -- 1-2 -- 2-1 -- -- -- 4-5
UC Irvine -- -- -- -- -- -- -- -- 2-0 1-2 3-2
Cal St. Fullerton 2-1 -- 2-0 -- 2-1 2-0 1-2 2-0 2-0 0-2 13-6
Clemson 1-2 2-0 0-2 2-1 -- -- 1-2 2-0 0-2 -- 8-9
Coll. of Charleston -- -- -- -- -- -- -- 0-2 -- -- 0-2
Coastal Carolina -- -- -- -- -- -- -- -- -- 0-2 0-2
East Caro. -- -- 0-2 -- -- 0-2 -- -- -- -- 0-4
Florida -- -- -- -- -- 0-2 2-0 -- -- -- 2-2
Fla. Atlantic -- -- -- 0-2 -- -- -- -- -- -- 0-2
Florida Int’l -- -- 0-2 -- -- -- -- -- -- -- 0-2
Florida St. 2-0 2-1 1-2 1-2 0-2 0-2 0-2 -- -- 2-1 8-12
Fresno St. -- -- -- -- -- -- -- -- -- 2-1 2-1
Georgia -- -- 2-1 -- -- 2-0 -- 2-1 -- 2-1 8-3
Georgia Tech -- 0-2 -- 2-0 -- 0-2 0-2 2-0 -- -- 4-6
Houston -- 1-2 -- 1-2 1-2 -- -- -- -- -- 3-6
Long Beach St. -- -- -- -- 0-2 1-2 -- -- -- -- 1-4
La.-Lafayette 1-2 2-1 -- -- -- -- -- -- -- -- 3-3
LSU 0-2 2-0 1-2 0-2 2-1 2-0 -- -- -- 2-1 9-8
Louisville -- -- -- -- -- -- -- -- 2-1 -- 2-1
Miami (Fla.) 2-0 1-2 2-0 1-2 2-0 2-0 0-2 2-1 -- 2-1 14-8
Michigan -- -- -- -- -- -- -- -- 0-2 -- 0-2
Mississippi -- -- -- -- -- -- 1-2 1-2 0-2 -- 2-6
Mississippi St. -- 0-2 0-2 -- -- -- -- -- 2-0 -- 2-4
Missouri -- -- -- -- -- -- -- 0-2 -- -- 0-2
Missouri St. -- -- -- -- 2-0 -- -- -- -- -- 2-0
Nebraska -- 1-2 2-0 2-1 -- -- 2-0 -- -- -- 7-3
Notre Dame -- -- -- 2-1 -- -- -- -- -- -- 2-1
North Carolina -- -- -- -- 0-2 -- -- 2-0 2-1 2-0 6-3
North Carolina St. -- -- -- -- 0-2 -- -- -- -- 1-2 1-4
Ohio State 1-2 -- -- -- 0-2 -- -- -- -- -- 1-4
Oklahoma -- -- -- -- -- -- -- 1-2 -- -- 1-2
Oklahoma St. 2-1 -- -- -- -- -- -- -- 1-2 -- 3-3
Oral Roberts -- -- -- -- -- -- -- 0-2 -- -- 0-2
Oregon St. -- -- -- -- -- -- 2-1 2-0 2-0 -- 6-1
Penn St. -- 0-2 -- -- -- -- -- -- -- -- 0-2
Rice 2-1 -- 0-2 2-0 2-1 -- 1-2 2-1 2-0 2-0 13-7
Richmond -- -- -- 1-2 -- -- -- -- -- -- 1-2
San Jose St. -- 2-1 -- -- -- -- -- -- -- -- 2-1
South Carolina -- 1-2 1-2 2-1 2-0 2-0 -- 1-2 1-2 -- 10-9
Southern California 0-2 2-0 2-0 0-2 -- -- 1-2 -- -- -- 5-6
Stanford 2-0 2-1 2-1 2-0 2-0 -- -- 0-2 -- 2-0 12-4
Tennessee -- -- 2-0 -- -- -- 2-0 -- -- -- 4-0
Texas -- 2-0 -- 2-1 2-0 2-0 2-1 -- -- -- 10-2
Texas A&M 2-1 -- -- -- -- 0-2 -- -- 0-2 0-2 2-7
Tulane -- -- 2-1 -- -- 0-2 2-1 -- -- -- 4-4
UCLA -- 0-2 -- -- -- -- -- -- 0-2 -- 0-4
Vanderbilt -- -- -- -- -- 0-2 -- -- -- -- 0-2
Wake Forest 0-2 -- -- -- -- -- -- -- -- -- 0-2
Wichita St. -- -- -- -- -- -- -- -- 0-2 1-2 1-4

238
BEST SUPER REGIONAL PCT.
(minimum 4 games)
Tennessee 1.000 (4-0)
Oregon St. .857 (6-1)
Texas .833 (10-2)
Stanford .750 (12-4)
Georgia .727 (8-3)
Nebraska .700 (7-3)
Cal St. Fullerton .684 (13-6)
North Carolina .667 (6-3)
Rice .650 (13-7)
Miami (Fla.) .636 (14-8)
Arkansas .600 (3-2)
UC Irvine .600 (3-2)
Arizona St. .545 (6-5)
LSU .529 (9-8)
South Carolina .526 (10-9)
Alabama .500 (2-2)
Arizona .500 (3-3)
Florida .500 (2-2)
La.-Lafayette .500 (3-3)
Tulane .500 (4-4)
Oklahoma St. .500 (3-3)
MOST SUPER REGIONAL GAMES
Miami (Fla.) 22
Florida St. 20
Rice 20
Cal St. Fullerton 19
South Carolina 19
Clemson 17
LSU 17
Stanford 16
Texas 12
Arizona St. 11
Georgia 11
Southern California 11
Georgia Tech 10
Nebraska 10
Baylor 9
Houston 9
North Carolina 9
Texas A&M 9
Mississippi 8
Tulane 8
MOST SUPER REGIONAL WINS
Miami (Fla.) 14
Cal St. Fullerton 13
Rice 13
Stanford 12
South Carolina 10
Texas 10
LSU 9
Clemson 8
Florida St. 8
Georgia 8
Nebraska 7
Arizona St. 6
North Carolina 6
Oregon St. 6
Southern California 5
Baylor 4
Georgia Tech 4
Tennessee 4
Tulane 4
MOST SUPER REGIONAL
APPEARANCES
Miami (Fla.) 9
Florida St. 8
Cal St. Fullerton 8
Rice 8
Clemson 7
LSU 7
South Carolina 7
Stanford 7
Georgia Tech 5
Southern California 5
Texas 5
Arizona St. 4
Georgia 4
Nebraska 4
North Carolina 4
Texas A&M 4
Baylor 3
Houston 3
Mississippi 3
Mississippi St. 3
Oregon St. 3
Tulane 3

239
REGIONAL/SUPER REGIONAL TEAM APPEARANCE, WIN LEADERS
ALL-TIME CONSECUTIVE REGIONAL
APPEARANCES
(Through 2008)
APP. TEAMS YEARS
36 Miami (Fla.) 1973-2008
31 Florida St. 1978-2008
21 Clemson 1987-2007
19 Oklahoma St. 1981-1999
18 Texas 1979-1996
17 Cal St. Fullerton 1992-2008
17 LSU 1989-2005
15 Northern Colo. 1952-1966
14 Georgia Tech 1985-1998
14 Rice 1995-2008
14 Wichita St. 1987-2000
13 Stanford 1994-2006
12 Texas 1965-1976
11 Oral Roberts 1998-2008
10 Arizona 1954-1963
10 Cal St. Fullerton 1975-1984
10 Fresno St. 1988-1997
10 Southern California 1993-2002
CURRENT CONSECUTIVE REGIONAL
APPEARANCES
(Through 2008)
FIRST
APP. TEAMS YEAR
36 Miami (Fla.) 1973
31 Florida St. 1978
17 Cal St. Fullerton 1992
14 Rice 1995
11 Oral Roberts 1998
ALL-TIME TOURNAMENT APPEARANCES
(Through 2008)
TEAM APP.
Texas 52
Florida St. 46
Miami (Fla.) 37
Oklahoma St. 36
Southern California 36
Clemson 33
Arizona St. 32
St. John’s (N.Y.) 31
Arizona 30
Cal St. Fullerton 30
Fresno St. 30
Oklahoma 30
Minnesota 28
Mississippi St. 28
Stanford 28
ALL-TIME REGIONAL/SUPER REGIONAL WINS
(Through 2008)
TEAM WINS
Texas 128
Florida St. 130
Miami (Fla.) 122
Southern California 97
Cal St. Fullerton 95
Oklahoma St. 94
Stanford 88
Clemson 84
LSU 82
Arizona St. 80
South Carolina 73
Mississippi St. 70
ALL-TIME REGIONAL/SUPER REGIONAL GAMES
(Through 2008)
TEAM GAMES
Florida St. 196
Texas 177
Miami (Fla.) 164
Southern California 139
Oklahoma St. 137
Clemson 131
Cal St. Fullerton 135
Stanford 122
Mississippi St. 117
Fresno St. 111
South Carolina 110
LSU 107
ALL-TIME REGIONAL/SUPER REGIONAL
WINNING PCT.
(Through 2008 – Minimum 25 games)
TEAM W-L PCT.
LSU 82-25 .766
Miami (Fla.) 122-42 .744
Rice 56-20 .737
Arizona St. 80-30 .727
Texas 128-49 .723
Stanford 88-34 .721
Cal St. Fullerton 95-40 .704
Georgia 33-13 .717
Southern California 97-42 .698
Oklahoma St. 94-43 .686
Tennessee 23-11 .676
South Carolina 73-37 .664
California 22-11 .667
Alabama 40-22 .645
Florida St. 130-66 .663
Western Mich. 26-14 .650

240
YEAR-BY-YEAR REGIONAL HOME-FIELD SUCCESS
(1975-2008)
HOME REGIONALS WON
YEAR FIELDS BY HOME TEAM 1975 5 4
1976 7 3
1977 7 3
1978 7 5
1979 8 4
1980 8 5
1981 8 5
1982 8 5
1983 8 6
1984 8 4
1985 8 6
1986 8 5
1987 7 4
1988 7 3
1989 7 2
1990 7 3
1991 8 5
HOME REGIONALS WON
YEAR FIELDS BY HOME TEAM
1992 8 4
1993 8 5
1994 8 3
1995 7 4
1996 8 5
1997 8 5
1998 8 4
1999 16 11
2000 16 10
2001 16 14
2002 16 11
2003 16 10
2004 16 10
2005 16 14
2006 16 10
2007 16 7
2008 16 13
HOME TEAM REGIONAL SUCCESS SUMMARY
WON REG. WITH HOME TEAM
REGIONAL HOME TEAM SUCCESS
Last 34 Years (1975-2008) 212 341 62.1%
Last 12 years (1997-2008) 119 176 67.6%
Last 8 years (2001-2008) 89 128 69.5%
*Last 21 years (1988-2008): When Home team is seeded #1 won 137 of 200 regionals (68.5%)
When Home team is seeded #2 won 15 of 37 regionals (40.5%)
When Home team is seeded #3 won 1 of 7 regionals (14.3%)
Total: 153 of 244 (62.7%)
*Since committee began seeding entire regional field.
YEAR-BY-YEAR SUPER REGIONAL HOME-FIELD SUCCESS
(1999-2008)
YEAR HOME FIELDS SUPER REGIONALS WON BY HOME TEAM
1999 8 6
2000 8 5
2001 *7 6
2002 8 7
2003 8 6
2004 8 6
2005 8 5
2006 8 6
2007 8 7
2008 8 6
*Does not include neutral sites.

241
YEAR-BY-YEAR REGIONAL/SUPER REGIONAL COMPARISON
(1975 - 2008)
TOTAL PAID ATTENDANCE FOR ALL
REGIONALS/SUPER REGIONALS
TOTAL NET RECEIPTS FOR ALL
REGIONALS/SUPER REGIONALS
NET PCT. NET PCT.
YEAR TOTAL CHANGE CHANGE TOTAL CHANGE CHANGE 1975 43,219 - - $ 58,526 - - 1976 59,122 +15,903 +36.80% 73,985 +$15,459 +26.41% 1977 77,580 +18,458 +31.22% 136,636 +62,651 *+84.68% 1978 64,614 -12,966 -16.71% 107,808 -28,828 -21.10% 1979 71,107 +6,493 +10.05% 114,984 +7,176 +6.66% 1980 73,330 +2,223 +3.13% 108,333 -6,651 -5.78% 1981 86,731 +13,401 +18.27% 182,656 +74,323 +68.61% 1982 108,434 +21,703 +25.02% 249,298 +66,642 +36.48% 1983 105,959 -2,475 -2.28% 240,523 -8,775 -3.52% 1984 133,093 +27,134 +25.61% 295,935 +55,412 +23.04% 1985 177,568 +44,475 +33.42% 382,990 +87,055 +29.42% 1986 118,332 -59,236 -33.36% 374,405 -8,585 -2.24% 1987 144,952 +26,620 +22.50% 465,447 +91,042 +24.32% 1988 192,800 +47,848 +33.01% 616,747 +151,300 +32.51% 1989 205,150 +12,350 +6.41% 637,076 +20,329 +3.30% 1990 229,325 +24,175 +11.78% 720,601 +83,525 +13.11% 1991 165,043 -64,282 -28.03% 664,371 -56,230 -7.80% 1992 233,604 +68,561 +41.54% 841,999 +177,628 +26.74% 1993 203,897 -29,707 -12.72% 780,766 -61,233 -7.27% 1994 233,134 +29,237 +14.34% 859,987 +79,221 +10.15% 1995 234,134 +1,000 +0.42% 854,818 -5,169 -0.60% 1996 224,819 -9,315 -3.98% 786,729 -68,089 -7.97% 1997 269,714 +44,895 +19.97% 907,700 +120,971 +15.38 1998 259,634 -10,080 -3.74% 994,871 +87,171 +9.60%
REGIONAL SUPER REGIONAL GRAND REGIONAL SUPER REGIONAL GRAND
TOTAL TOTAL TOTAL TOTAL TOTAL TOTAL *1999 329,811 94,021 423,832 $1,328,691 $517,159 $1,845,850 2000 292,354 87,776 380,130 1,375,756 605,830 1,981,586 2001 265,460 91,923 357,383 1,372,166 870,859 2,243,025 2002 311,081 104,775 415,856 1,539,545 696,608 2,236,153 2003 332,520 84,768 417,288 1,771,467 631,156 2,402,623 2004 316,466 94,356 410,822 1,764,654 747,395 2,512,049 2005 320,347 96,471 416,818 1,851,055 545,265 2,396,320 2006 311,288 91,988 403,276 1,809,260 585,850 2,395,110 2007 352,965 92,722 445,687 2,188,908 780,069 2,968,977 2008 302,884 95,544 398,428 1,672,144 733,668 2,405,812 *First year of expanded bracket

242
REGIONAL/SUPER REGIONAL SITE RANKINGS
(1975 - 2008)
TOTAL PAID REGIONAL ATTENDANCE
Total Paid
Site Year Attendance 1. LSU 1998 67,938 2. LSU 1997 66,561 3. Mississippi St. 1997 64,723 4. Mississippi St. 1989 63,388 5. Mississippi St. 1990 62,191 6. LSU 2008 59,958 7. LSU 1996 58,016 8. LSU 1995 56,231 9. LSU 1994 55,283 10. Texas A&M 1998 51,715
TOTAL PAID SUPER REGIONAL ATTENDANCE
Total Paid
Site Year Attendance 1. Tulane ** 2001 34,341 2. LSU 2008 26,586 3. Mississippi St. 2007 26,331 4. Mississippi 2006 26,025 5. Nebraska 2002 23,913 6. LSU 2003 22,515 7. Mississippi 2005 21,817 8. Texas A&M 1999 21,621 9. Arkansas 2004 19,365 10. Texas 2002 18,949 ** Zephyr Field
TOP 10 SUPER REGIONAL ATTENDANCE DATES
13,715 --Mississippi St. (8) vs. Clemson (5), 6-9-07, Dudy Noble Field, Starkville, MS 12,620 --Mississippi St. (8) vs. Clemson (6), 6-8-07, Dudy Noble Field, Starkville, MS 11,870 – Tulane (7) vs. LSU (1), 6-3-01, Zephyr Field, Metaire, LA 11,719 – LSU (4) vs. Tulane (3) (13 inn.), 6-1-01 Zephyr Field, Metaire, LA 11,679 – Tulane (9) vs. LSU (4), 6-2-01 Zephyr Field, Metaire, LA 10,027 – Arkansas (4) vs. Florida St. (2), 6-12-04 Baum Stadium, Fayetteville, AR 9,338 – Arkansas (7) vs. Florida St. (5), 6-11-04 Baum Stadium, Fayetteville, AR 9,202 – Mississippi (11) vs. Miami (Fla.) (9), 6-10-06 Oxford-University Stadium/Swayze Field, Oxford, MS 9,139 – Miami (Fla.) (7) vs. Mississippi (0), 6-11-06 Oxford-University Stadium/Swayze Field, Oxford, MS 8,947 – Texas (3) vs. Mississippi (1), 6-12-05 Oxford-University Stadium/Swayze Field, Oxford, MS
REGIONAL NET RECEIPTS
Net
Site Year Receipts 1. Arkansas 2007 $378,433 2. Texas 2007 287,251 3. Nebraska 2005 284,407 4. LSU 2008 269,832 5. LSU 2002 257,741 6. LSU 1998 256,492 7. Mississippi St. 2000 253,509 8. LSU 2004 251,673 9. Arkansas 2004 249,802 10. LSU 2003 247,674
SUPER REGIONAL NET RECEIPTS
Net
Site Year Receipts
1. Tulane** 2001 $502,639 2. Arkansas 2004 192,746 3. Mississippi St. 2007 170,267 4. Wichita St. 2007 166,373 5. LSU 2008 158,712 6. Nebraska 2005 156,509 7. LSU 2004 150,786 8. Rice 2008 147,454 9. LSU 2000 143,821
10. Nebraska 2002 142,461 **Zephyr Field
TOP 10 REGIONAL ATTENDANCE DATES 15,379 -- Oklahoma (3) vs. Auburn (1), 5-28-95, All Sports Stadium, Oklahoma City 11,496 -- Florida St. (11) vs. Mississippi St. (9), 5-27-90, Dudy Noble Field, Starkville, MS 11,127 -- Mississippi St. (9) vs. South Ala. (2), 5-26-00, Dudy Noble Field, Starkville, MS 10,832 -- Notre Dame (7) vs. Mississippi St. (0), 5-28-00, Dudy Noble Field, Starkville, MS 10,688 -- Mississippi St. (4) vs. Washington (3), 5-26-97, Dudy Noble Field, Starkville, MS 10,588 -- North Carolina (7) vs. Mississippi St. (1), 5-28-89, Dudy Noble Field, Starkville, MS 10,248 -- Mississippi St. (10) vs. Middle Tenn. St. (4), 5-30-03, Dudy Noble Field, Starkville, MS 10,000 -- Fresno St. (7) vs. Cal St. Los Angeles (4) and Southern Cal (6) vs. Hawaii (1), 5-26-77, Aloha Stadium, Honolulu
9,784 -- Mississippi St. (8) vs. Notre Dame (1), 5-27-00, Dudy Noble Field, Starkville, MS
9,572 -- Oklahoma St. (14) vs. Arkansas (3), 6-2-07, Baum Stadium, Fayetteville, AR

243
SITE-BY-SITE REGIONAL COMPARISON (1975 - 2008)
(Listed Alphabetically - 71 Sites) NO. OF NET
YEAR SESSIONS ATTENDANCE RECEIPTS
ALABAMA (5)
2006 6 25,561 $88,031
2002 7 25,070 118,044
1999 6 19,376 116,490
1997 10 23,552 110,848
1996 7 17,164 57,892
ARIZONA (4)
1992 7 7,384 $46,034
1989 7 21,508 52,352
1980 - 20,841 34,081
1979 - 17,981 20,715
ARIZONA ST. (18)
2008 6 13,087 $73,695
2007 6 15,189 $94,571
2005 6 8,952 $42,393
2003 6 10,720 52,849
2002 6 8,159 46,956
2000 6 12,821 58,377
1993 8 14,929 60,144
1990 4 18,622 85,012
1988 5 26,833 69,229
1987 5 26,452 68,521
1984 3 14,566 29,331
1983 4 21,656 35,286
1982 - 20,389 42,722
1981 3 15,507 28,267
1978 - 21,709 38,732
1977 - 13,170 20,560
1976 - 10,388 14,124
1975 - 7,968 8,211
ARKANSAS (4)
2007 6 43,585 $378,433
2006 6 35,221 $243,317
2004 7 38,779 249,802
1999 7 26,653 123,077
AUBURN (3)
2003 6 14,419 $122,424
1999 7 33,873 91,366
1978 7 5,694 8,088
BAYLOR (3)
2005 6 15,316 $78,626
2000 7 22,986 90,401
1999 6 10,551 72,159
CAL ST. FULLERTON (7)
2008 4 10,468 $80,554
2006 6 12,836 $82,608
2005 7 15,974 79,224
2004 7 13,165 55,012
2003 6 12,203 43,724
2001 7 11,164 46,103
2000 6 12,525 64,011
CENTRAL MICH. (1)
1984 8 3,623 $4,409
CLEMSON (11)
NO. OF NET
YEAR SESSIONS ATTENDANCE RECEIPTS
2006 6 26,287 $197,572
2005 6 18,414 112,233
2002 6 13,948 85,301
2001 6 9,738 44,560
2000 6 11,796 65,975
1998 8 13,887 67,977
1996 8 18,195 69,341
1995 8 25,600 115,197
1994 7 20,708 78,967
1981 3 2,738 2,550
1980 - 11,140 13,907
COASTAL CARO. (2)
2008 7 11,900 $57,850
2007 6 20,972 $124,792
CONNECTICUT (2)
1977 - 3,248 $202
1976 - 2,275 (413)
EAST CARO. (2)
2004 6 19,260 $140,821
2001 6 17,440 119,662
EASTERN MICH. (2)
1976 - 3,980 $2,110
1975 - 3,264 643
FLORIDA (7)
2005 6 13,394 $57,759
2002 7 13,004 $45,621
1998 11 22,965 103,956
1996 10 18,811 61,476
1992 11 12,780 74,635
1991 10 15,898 73,234
1989 11 17,149 62,867
FLORIDA ST. (26)
2008 7 27,912 $121,039
2007 6 18,856 $90,136
2005 6 19,281 $85,889
2004 7 20,379 71,428
2003 7 23,572 75,503
2002 6 17,990 60,659
2001 6 14,758 53,211
2000 7 16,275 41,638
1999 6 13,224 42,087
1998 10 19,407 83,115
1997 11 21,995 73,538
1995 10 19,317 72,245
1994 10 16,740 76,628
1993 10 16,876 68,079
1992 10 14,877 70,785
1991 4 11,686 72,650
1989 4 10,340 53,286
1988 5 14,245 55,336
1987 4 10,265 50,739
1986 5 13,425 44,778
1985 4 9,035 28,314
1984 5 12,664 28,129
1983 6 18,392 46,707

244
NO. OF NET
YEAR SESSIONS ATTENDANCE RECEIPTS 1980 - 7,572 6,584
1979 10 7,112 5,228
1976 - 7,794 8,175
FRESNO ST. (8)
1995 4 14,875 $86,524
1991 4 16,948 84,281
1989 4 19,412 89,504
1988 5 27,148 98,170
1985 6 17,363 35,605
1984 6 20,554 37,928
1982 4 6,443 18,513
1979 7 5,244 10,919
GEORGIA (4)
2008 4 10,637 $72,841
2006 7 13,914 $48,606
2004 7 14,889 44,883
2001 7 15,888 52,252
GEORGIA TECH (8)
2006 6 9,361 $66,535
2005 7 15,935 92,226
2004 6 12,301 70,590
2003 6 11,929 73,430
2002 7 13,469 58,206
2000 6 10,857 34,786
1993 10 7,831 70,613
1987 4 4,177 22,705
HAWAII (1)
1977 - 15,343 $30,967
HOUSTON (2)
2000 7 14,850 $78,126
1999 6 11,745 54,301
HUNTSVILLE, ALABAMA (1)
1987 10 9,953 $20,664
KENTUCKY (1)
2006 6 17,786 $35,819
LA.-LAFAYETTE (1)
2000 6 13,085 $78,377
LONG BEACH ST. (4)
2008 4 8,714 $70,011
2007 6 7.719 $56,153
2005 7 15,726 $66,448
2003 6 10,632 $43,047
LSU (18)
2008 6 59,958 $269,832
2005 6 40,720 $245,807
2004 6 25,113 $251,673
2003 6 44,311 247,674
2002 7 51,608 257,741
2001 7 48,672 239,219
2000 7 48,270 243,073
1999 7 47,455 207,361
1998 10 67,938 256,492
1997 10 66,561 190,226
1996 10 58,016 179,098
1995 10 56,231 157,847
NO. OF NET
YEAR SESSIONS ATTENDANCE RECEIPTS 1994 10 55,283 150,243
1993 10 47,141 128,316
1992 10 44,160 117,849
1991 11 39,533 95,044
1990 11 45,278 116,438
1986 10 22,187 65,717
MAINE (6)
1991 4 9,954 $44,916
1986 4 10,087 23,631
1984 4 11,975 27,693
1983 3 9,218 21,378
1982 - 8,475 15,808
1980 - 4,723 3,152
MASSACHUSETTS (1)
1978 - 1,360 $(2,974)
MIAMI (FLA.) (22)
2008 6 11,133 $85,650
2005 6 5,592 $23,106
2004 6 11,726 $42,870
2003 7 9,726 67,849
2001 6 9,840 70,852
2000 6 10,838 40,609
1999 6 9,486 38,245
1998 4 12,331 93,052
1997 10 17,992 85,955
1995 10 17,331 80,668
1994 10 19,038 72,882
1992 11 27,542 89,524
1990 4 15,132 76,908
1988 5 11,471 50,508
1986 4 11,506 54,176
1985 7 16,033 49,907
1982 6 7,252 20,879
1981 4 12,325 55,611
1980 - 6,499 15,000
1979 3 7,853 24,728
1978 4 10,981 29,773
1977 - 11,006 24,768
MICHIGAN (6)
2008 6 8,963 $38,863
1986 3 5,016 $21,303
1983 3 8,512 15,502
1981 4 10,089 18,538
1980 - 3,813 4,062
1978 - 5,754 6,036
MICHIGAN ST. (1)
1979 - 1,573 $(1,521)
MINNESOTA (2)
2000 6 9,454 $22,744
1977 - 6,865 6,282
MISSISSIPPI (4)
2007 6 30,987 $157,664
2006 6 35,166 $150,540
2005 6 27,786 131,692
2004 6 23,365 91,645

245
NO. OF NET
YEAR SESSIONS ATTENDANCE RECEIPTS
MISSISSIPPI ST. (11)
2003 6 37,129 $216,704
2000 6 42,181 253,509
1997 11 64,723 198,539
1992 11 50,783 139,420
1990 11 62,191 152,807
1989 11 63,388 153,311
1988 10 35,340 99,359
1987 11 40,689 107,177
1985 7 36,446 79,349
1984 11 25,484 67,532
1979 7 13,815 24,250
MISSOURI (1)
2007 7 14,152 $72,548
NAVY (1)
1979 - 670 $(4,082)
NEBRASKA (6)
2008 6 30,947 $194,697
2006 6 24,290 $230,517
2005 6 43,746 284,407
2003 7 36,660 189,307
2002 7 36,903 179,178
2001 6 24,225 122,391
NEW BRITAIN, CONNECTICUT (1)
1988 5 3,345 $17,020
NEW ORLEANS (2)
1987 4 15,250 $80,876
1982 4 11,539 39,944
NORTH CAROLINA (4)
2008 6 14,665 $89,672
2007 6 9,054 $49,603
2006 6 12,011 $43,207
1983 10 4,053 1,946
NORTH CAROLINA ST. (2)
2008 6 14,090 $89,714
2003 6 8,261 $38,047
NOTRE DAME (4)
2004 6 11,260 $34,072
2002 6 7,895 22,011
2001 7 8,920 35,419
1999 6 8,452 22,949
OHIO ST. (2)
2001 6 7,771 $38,997
1999 6 13,322 77,650
OKLAHOMA (3)
2006 7 16,333 $84,861
1977 - 5,844 $10,915
1975 - 7,185 16,370
OKLAHOMA CITY, OKLAHOMA (3)
2004 6 19,956 $146,452
2000 7 20,907 127,289
1995 10 46,388 140,331
NO. OF NET
YEAR SESSIONS ATTENDANCE RECEIPTS
OKLAHOMA ST. (10)
2008 6 18,015 $92,892
1997 11 31,475 $112,609
1994 11 31,550 109,184
1993 11 30,905 113,753
1988 11 34,297 92,428
1986 10 19,678 64,358
1985 7 24,197 39,595
1984 7 18,329 33,028
1983 4 7,084 33,198
1982 3 10,104 23,881
ORAL ROBERTS (3)
1981 3 8,381 $11,902
1980 - 6,489 8,079
1978 - 7,307 10,722
OREGON ST. (2)
2006 6 10,962 $151,310
2005 6 13,146 74,431
PEPPERDINE (1)
2006 7 6,006 $41,660
RICE (7)
2008 6 26,303 $163,700
2007 6 21,695 $132,318
2006 6 20,477 $115,178
2004 7 27,174 145,179
2003 6 19,245 97,862
2002 7 18,713 84,211
2001 7 22,851 111,993
RUTGERS (1)
2000 6 11,784 $22,307
SAN DIEGO (1)
^2007 6 8,877 $41,384
SOUTH CAROLINA (11)
2007 6 22,527 $176,933
2004 6 22,253 $145,295
2002 7 21,078 105,403
2001 7 22,125 120,372
2000 6 18,778 113,586
1985 10 24,751 33,925
1982 10 18,290 34,424
1981 5 10,703 19,338
1977 - 14,061 29,476
1976 - 10,895 18,858
1975 - 9,237 15,992
SOUTHERN CALIFORNIA (6)
2002 6 5,702 $16,962
2001 6 8,452 36,396
1999 7 22,899 32,747
1991 10 8,962 52,925
1978 6 6,501 9,293
1975 - 5,042 3,963
SOUTHERN MISS. (1)
2003 6 19,695 $106,233
STARKVILLE, MISSISSIPPI (1)
1975 - 2,665 $4,000

246
NO. OF NET
YEAR SESSIONS ATTENDANCE RECEIPTS
STAMFORD, CONNECTICUT (1) 1975 - 785 $(1,694)
STANFORD (14)
2008 7 13,557 $63,849
2004 6 9,513 $60,742
2003 6 12,203 43,724
2002 6 16,349 75,623
2001 7 17,245 80,213
2000 7 14,947 40,948
1999 6 15,407 50,306
1998 10 21,688 29,959
1997 10 22,341 40,607
1996 10 24,521 50,342
1990 10 20,555 34,258
1987 10 14,166 20,664
1985 7 15,090 27,322
1983 3 8,988 17,017
TENNESSEE (5)
2005 6 11,118 $77,576
2001 6 9,967 51,559
1995 10 20,315 89,120
1994 10 22,971 103,425
1993 10 16,719 77,671
TEXAS (23)
*2007 6 36,425 $287,251
2006 6 27,306 $195,269
2005 7 30,737 203,759
2004 6 32,153 182,358
2003 7 30,785 177,168
2002 6 31,443 188,718
1996 7 31,506 153,613
1994 7 35,167 160,970
1993 7 33,953 155,357
1992 8 38,091 154,866
1991 8 33,469 132,583
1990 7 29,843 128,284
1989 7 29,124 118,332
1988 9 40,121 134,697
1987 4 24,000 94,101
1986 7 30,288 86,122
1985 10 34,653 88,973
1984 6 25,898 67,885
1983 7 28,056 69,489
1982 6 25,942 53,127
1981 4 22,625 44,528
1980 - 12,253 23,468
1979 6 16,859 34,747
TEXAS-ARLINGTON (4)
1978 6 5,308 $8,138
1977 - 8,043 13,466
1976 - 15,369 18,401
1975 - 7,073 11,041
TEX.-PAN AMERICAN (1)
1976 - 4,804 $10,000
NO. OF NET
YEAR SESSIONS ATTENDANCE RECEIPTS
TEXAS A&M (6)
2008 7 22,535 $107,285
2007 7 30,637 $151,802
2003 7 30,744 $154,289
1999 7 38,454 149,275
1998 11 51,715 191,761
1993 10 35,543 106,833
1989 11 38,883 93,661
TEXAS TECH (3)
1999 7 14,724 $79,312
1997 11 21,075 95,378
1996 10 24,341 97,316
TULANE (2)
2005 6 24,510 $136,901
2001 6 16,404 $148,968
UCLA (1)
1986 7 6,145 $14,320
VANDERBILT (1)
2007 7 21,874 $78,924
VIRGINIA (3)
2007 7 16,191 $56,086
2006 7 17,771 $34,231
2004 6 15,180 31,831
WAKE FOREST (2)
2002 7 7,039 $19,584
1999 7 12,425 32,353
WASHINGTON ST. (1)
1976 - 3,617 $2,730
WATERBURY, CONNECTICUT (2)
1990 4 8,301 $26,548
1989 4 5,346 13,763
WICHITA ST. (10)
2007 7 34,224 $240,312
2002 6 22,711 $175,327
1999 7 31,765 139,013
1998 11 49,703 168,559
1996 10 32,265 117,651
1995 8 34,077 112,886
1994 8 31,667 107,688
1992 7 37,987 148,886
1991 7 28,593 108,738
1990 8 29,403 100,346
YALE (1)
1981 4 4,363 $1,922
NOTE: Schools listed denote hosts. Cities listed denote no host institution. *City of Round Rock served as host
^Games played at San Diego St.

247
SITE-BY-SITE SUPER REGIONAL COMPARISON (1999 - 2008)
(Listed Alphabetically - 30 Sites) NO. OF PAID NET
YEAR SESSIONS ATTENDANCE RECEIPTS
ALABAMA (2)
2006 2 10,660 $60,993
1999 2 7,912 $59,730
ARIZONA ST. (2) 2008 3 9,841 $75,290 2007 2 8,337 $77,819
ARKANSAS (1)
2004 2 19,365 $192,746
BAYLOR (2)
2005 3 11,622 $58,578
1999 3 11,792 $69,176
CAL ST. FULLERTON (7)
2008 2 6,194 $50,271
2007 2 6,752 $53,734
2006 2 6,725 $51,037
2005 3 9,720 $45,874
2004 2 6,095 $34,389
2003 3 10,161 55,696
2001 2 6,018 33,710
CLEMSON (3)
2006 2 11,234 $107,777
2002 3 11,921 $76,486
2000 2 9,088 68,514
EAST CARO. (1)
2001 3 10,314 $69,990
FLORIDA (1)
2005 2 8,298 $37,918
FLORIDA ST. (5) 2008 3 13,478 $109,769
2003 2 10,614 $92,170
2002 3 13,366 78,598
2000 3 12,875 65,778
1999 2 8,898 35,765
GEORGIA (3)
2008 3 8,756 67,164
2006 3 11,911 $38,556
2001 3 9,540 $33,926
GEORGIA TECH (5)
2006 2 6,358 $49,455
2005 2 6,616 $52,098
2004 2 8,314 $75,450
2002 3 7,344 39,615
2000 2 6,651 37,472
HOUSTON (1)
2000 2 8,493 $55,797
LONG BEACH ST. (1)
2004 3 8,982 $58,033
LSU (4)
2008 3 26,586 $158,712
2004 2 15,205 $150,786
2003 3 22,515 141,514
2000 2 14,750 143,821
NO. OF PAID NET YEAR SESSIONS ATTENDANCE RECEIPTS
LOUISVILLE (1) 2007 3 13,301 $80,252
MIAMI (FLA.) (5) 2008 3 8,803 $71,629 2004 2 9,950 $49,319 2003 2 10,614 27,592 2001 2 6,407 38,597 1999 3 6,979 45,749
MISSISSIPPI (2) 2006 3 26,025 $91,518 2005 3 21,817 $92,428
MISSISSIPPI ST. (1) 2007 1 26,331 $170,267
NEBRASKA (3) 2005 2 17,289 $156,509 2002 3 23,913 $142,461 2001 2 10,407 70,766
NORTH CAROLINA (2) 2008 2 11,584 $53,379 2007 3 6,144 $37,733
OHIO ST. (2) 2003 2 9,435 $60,321 1999 3 10,549 58,535
OREGON ST. (3) 2007 2 6,222 $58,276 2006 2 6,367 $72,794 2005 3 7,815 $44,278
RICE (6) 2008 2 10,302 $147,454 2007 2 9,561 $135,615 2006 3 12,708 $113,721 2003 3 13,128 $99,938 2002 2 8,618 91,636 *1999 3 18,793 63,020
SOUTH CAROLINA (4) 2004 2 11,170 $64,985 2003 2 7,625 92,217 2002 3 13,687 97,098 2000 3 11,472 75,709
SOUTHERN CALIFORNIA (1) 2001 2 4,270 $39,197
STANFORD (5) 2003 2 6,730 $61,708 2002 2 6,977 64,582 2001 3 10,626 82,033 2000 3 10,779 63,950 1999 2 7,477 50,040
TEXAS (3) 2004 2 15,275 $121,688 2002 3 18,949 106,132 2000 2 13,668 94,789
TEXAS A&M (1) 1999 3 21,621 $135,144
TULANE (1) 2005 3 13,294 $116,160 **2001 3 34,341 $502,639
WICHITA ST. (1) 2007 1 16,074 $166,373 *Played at Astrodome ** Played at Zephyr Field


MCWS
Brackets


251
Note: Won-lost records (listed in parenthesis after each team’s name) include district/regional/super regional
results and reflect that team’s record entering the CWS.
1947 Bracket (June 27-June 28) (Kalamazoo, MI – Best of Three)
1948 Bracket (June 25-June 26) (Kalamazoo, MI – Best of Three)
1949 Bracket (June 22-June 25) (Wichita, KS)

252
1950 Bracket (June 15-June 23)
1951 Bracket (June 13-June 17)

253
1952 Bracket (June 12-June 17)
1953 Bracket (June 11-June 16)
**When three teams remain after Game 13, a drawing determines which team receives a bye to the championship game

254
1954 Bracket (June 10-June 16)
**When three teams remain after Game 13, a drawing determines which team receives a bye to the championship game.
1955 Bracket (June 10-June 16)
**When three teams remain after Game 13, a drawing determines which team receives a bye to the championship game.

255
1956 Bracket (June 9-June 14)
1957 Bracket (June 8-June 12)

256
1958 Bracket (June 13-June 19)
1959 Bracket (June 12-June 18)
**When three teams remain after Game 13, a drawing determines which team receives a bye to the championship game.

257
1960 Bracket (June 13-June 20)
1961 Bracket (June 9-June 15)

258
1962 Bracket (June 11-June 16)
** When three teams remain after Game 13, a drawing determines which team receives a bye to the championship game.
1963 Bracket (June 10-June 16)

259
1964 Bracket (June 8-June 18)
**When three teams remain after Game 13, a drawing determines which team receives a bye to the championship game.
1965 Bracket (June 7-June 12)

260
1966 Bracket (June 13-June 18)
**When three teams remain after Game 13, a drawing determines which team receives a bye to the championship game.
1967 Bracket (June 12-June 18)
**When three teams remain after Game 13, a drawing determines which team receives a bye to the championship game.

261
1968 Bracket (June 10-June 15)
*Pairing
adjusted for Games 12 and 13 to match teams which have not played previously, or have not played since first round.
1969 Bracket (June 13-June 20)
*Pairings adjusted for Games 12 and 13 to match teams which have not played previously, or have not played since first round.
**When three teams remain after Game 13, a drawing determines which team receives a bye to the championship game.
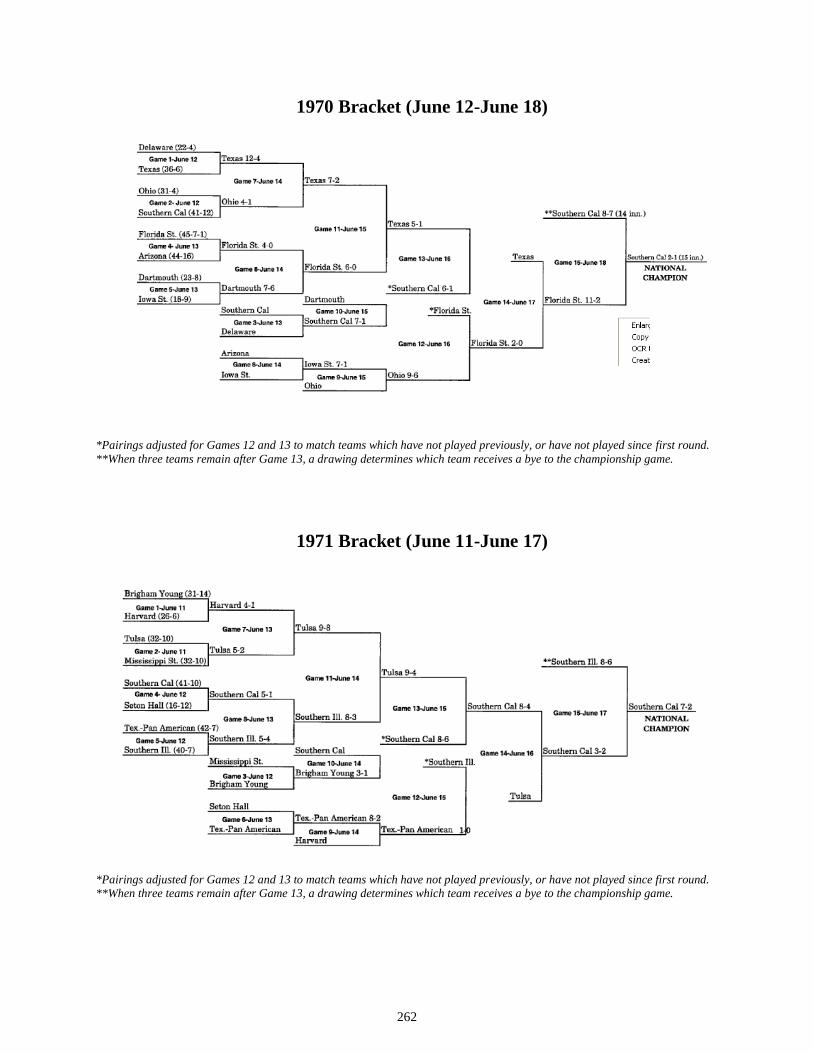
262
1970 Bracket (June 12-June 18)
*Pairings adjusted for Games 12 and 13 to match teams which have not played previously, or have not played since first round.
**When three teams remain after Game 13, a drawing determines which team receives a bye to the championship game.
1971 Bracket (June 11-June 17)
*Pairings adjusted for Games 12 and 13 to match teams which have not played previously, or have not played since first round.
**When three teams remain after Game 13, a drawing determines which team receives a bye to the championship game.

263
1972 Bracket (June 9-June 16)
*Pairings adjusted for Games 12 and 13 to match teams which have not played previously, or have not played since first round.
1973 Bracket (June 8-June 13)
*Pairings adjusted for Games 12 and 13 to match teams which have not played previously, or have not played since first round.

264
1974 Bracket (June 7-June 15)
*Pairings adjusted for Games 12 and 13 to match teams which have not played previously, or have not played since first round.
**When three teams remain after Game 13, a drawing determines which team receives a bye to the championship game.
1975 Bracket (June 6-June 14)
*Pairings adjusted for Games 12 and 13 to match teams which have not played previously, or have not played since first round.
**When three teams remain after Game 13, a drawing determines which team receives a bye to the championship game.

265
1976 Bracket (June 11-June 19)
*Pairing adjusted for Games 12 and 13 to match teams which have not played previously, or have not played since first round.
1977 Bracket (June 10-June 18)
*Pairing adjusted for Games 12 and 13 to match teams which have not played previously, or have not played since first round.

266
1978 Bracket (June 2-June 8)
*Pairings adjusted for Games 12 and 13 to match teams which have not played previously, or have not played since first round.
1979 Bracket (June 1-June 8)
*Pairings adjusted for Games 12 and 13 to match teams which have not played previously, or have not played since first round.
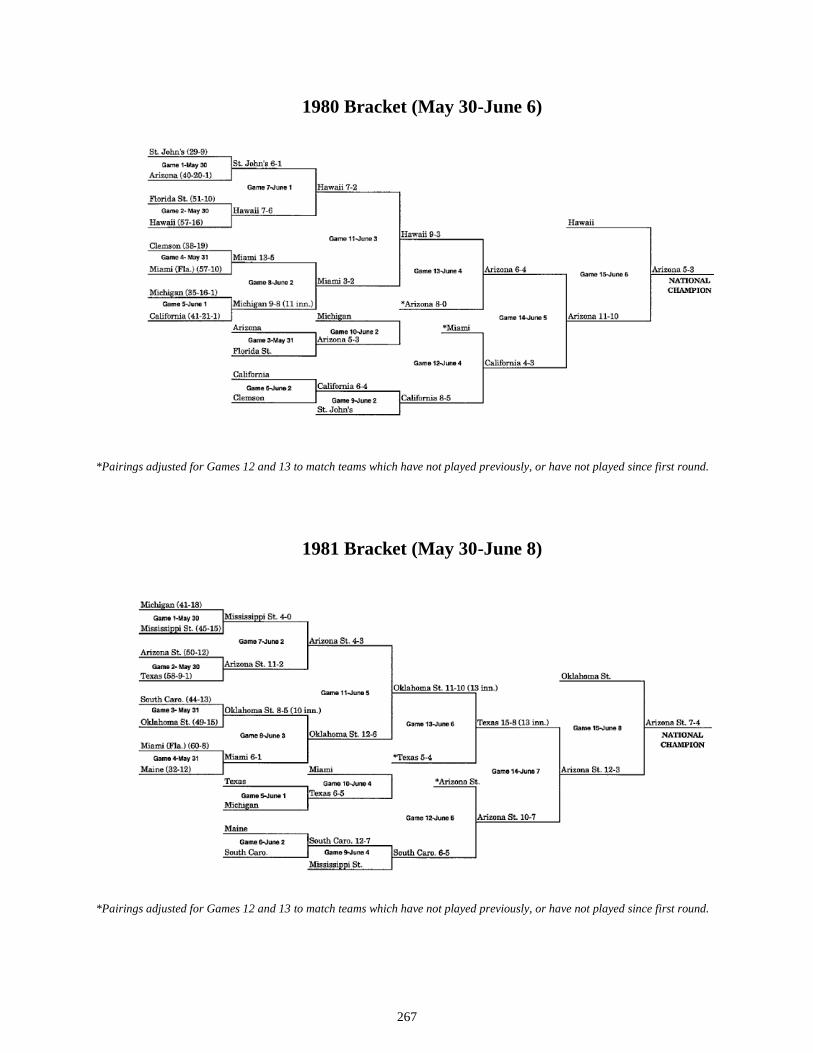
267
1980 Bracket (May 30-June 6)
*Pairings adjusted for Games 12 and 13 to match teams which have not played previously, or have not played since first round.
1981 Bracket (May 30-June 8)
*Pairings adjusted for Games 12 and 13 to match teams which have not played previously, or have not played since first round.

268
1982 Bracket (June 4-June 12)
*Pairings adjusted for Games 12 and 13 to match teams which have not played previously, or have not played since first round.
1983 Bracket (June 3-June 11)
*Pairings adjusted for Games 12 and 13 to match teams which have not played previously, or have not played since first round.

269
1984 Bracket (June 1-June 10)
*Pairings adjusted for Games 12 and 13 to match teams which have not played previously, or have not played since first round.
1985 Bracket (May 31-June 11)
*Pairings adjusted for Games 12 and 13 to match teams which have not played previously, or have not played since first round.

270
1986 Bracket (May 30-June 9)
*Pairings adjusted for Games 12 and 13 to match teams which have not played previously, or have not played since first round.
1987 Bracket (May 29-June 7)
*Pairings adjusted for Games 12 and 13 to match teams which have not played previously, or have not played since first round.

271
1988 Bracket (June 3-June 11)
1989 Bracket (June 2-June 10)
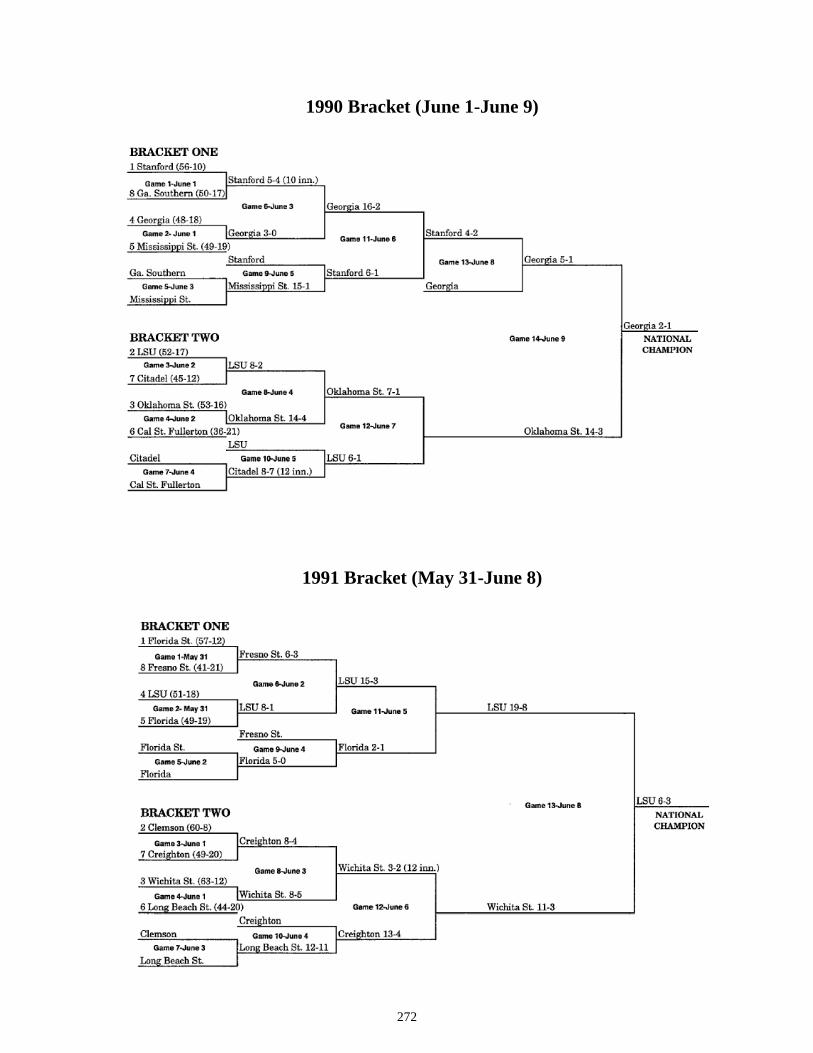
272
1990 Bracket (June 1-June 9)
1991 Bracket (May 31-June 8)

273
1992 Bracket (May 29-June 6)
1993 Bracket (June 4-June 12)

274
1994 Bracket (June 3-June 11)
1995 Bracket (June 2-June 10)

275
1996 Bracket (May 31-June 8)
1997 Bracket (May 30-June 7)

276
1998 Bracket (May 29-June 6)
Note: Beginning in 1999, the Division I Baseball Committee selected the eight national seeds at the beginning of the championship.
Number before team names are national seed numbers only.
1999 Bracket (June 11-June 19)

277
2000 Bracket (June 9-June 17)
2001 Bracket (June 8-June 16)

278
2002 Bracket (June 14-June 22)
2003 Bracket (June 13-June 23)

279
2004 Bracket (June 18-June 27)

280
2005 Bracket (June 17- June 26)

281
2006 Bracket (June 16- June 26)

282
2007 Bracket (June 15- June 24)

283
2008 Bracket (June 14- June 25)


The NCAA salutes the more than
400,000 student-athletes
participating in 23 sports at
more than 1,200 member institutions.