nchrp project 9-44 - transportation research...
TRANSCRIPT

NCHRP
Project 9-44
Developing a Plan for Validating an Endurance Limit for HMA Pavements
HMA Endurance Limit Validation Study
Research Plan
LIMITED USE DOCUMENT
The information contained in this Document is regarded as fully privileged. Dissemination of information included herein must be approved by the NCHRP.
Final November 21, 2008
Advanced Asphalt Technologies, LLC 108 Powers Court, Suite 100
Sterling, Virginia 20166
ADVANCED ASPHALT TECHNOLOGIESENGINEERING SERVICES FOR THE ASPHALT INDUSTRY

i
ACKNOWLEDGMENT OF SPONSORSHIP
This work was sponsored by the American Association of State Highway and Transportation Officials, in cooperation with the Federal Highway Administration, and was conducted in the National Cooperative Highway Research Program, which is administered by the Transportation Research Board of the National Research Council. DISCLAIMER
This is an uncorrected draft as submitted by the research agency. The opinions and conclusions expressed or implied in the report are those of the research agency. They are not necessarily those of the Transportation Research Board, the National Research Council, the Federal Highway Administration, the American Association of State Highway and Transportation Officials, or the individual states participating in the National Cooperative Highway Research Program.

ii
Table of Contents
Table of Contents............................................................................................................................. i
Table of Contents............................................................................................................................ ii
List of Figures ................................................................................................................................ iv
List of Tables .................................................................................................................................. v
List of Tables .................................................................................................................................. v
Acknowledgements........................................................................................................................ vi
Acknowledgements........................................................................................................................ vi
Abstract ......................................................................................................................................... vii
Introduction..................................................................................................................................... 1
Purpose........................................................................................................................................ 1 Statement of the Problem............................................................................................................ 1 Objectives and Hypothesis.......................................................................................................... 4 Scope of the Plan ........................................................................................................................ 5
Summary of the Research Plan ....................................................................................................... 7
Task by Task Description of the Research Plan ........................................................................... 12
Task A. Management and Reporting ....................................................................................... 12 Subtask A.1 Project Management........................................................................................ 12 Subtask A.2 Progress Reporting .......................................................................................... 15 Subtask A.3 Interim Reports and Presentations................................................................... 15 Subtask A.4 Final Report and Presentation ......................................................................... 16 Task A Milestones ................................................................................................................ 16 Task A Labor Estimate ......................................................................................................... 16 Task A Sources ..................................................................................................................... 18
Task B. Formulate Design Procedure ...................................................................................... 18 Preliminary Design Procedure .............................................................................................. 18 Subtask B.1 Review Selected Literature.............................................................................. 34 Subtask B.2 Finalize Preliminary Approach ..................................................................... 36 Subtask B.3 Incorporate Findings from Laboratory Studies ............................................... 36 Subtask B.4 Modify Approach Based on Analysis of Accelerated Pavement Tests ........... 37 Subtask B.5 Prepare Final Design Procedure ...................................................................... 38 Task B Milestones................................................................................................................. 38 Task B Labor Estimate.......................................................................................................... 39 Task B Sources ..................................................................................................................... 39
Task C. Database Management................................................................................................ 41 Subtask C.1 Develop a Plan to Use the NCHRP 9-30 Database ......................................... 41 Subtask C.2 Develop Needed Tables................................................................................... 43 Subtask C.3 Input and Manage Data.................................................................................... 43 Task C Milestones................................................................................................................. 43

iii
Task C Labor Estimate.......................................................................................................... 43 Task C Sources ..................................................................................................................... 44
Task D. Laboratory Studies ..................................................................................................... 44 Subtask D.1 Experiment 1: Mixture Compositional Factors Affecting Healing in HMA.. 46 Subtask D.2 Experiment 2: Effect of Applied Strain on Healing ........................................ 55 Subtask D.3 Experiment 3: Effect of Temperature and Rest Period Duration on Healing 56 Subtask D.4 Experiment 4: Development of Testing and Analysis Procedures to Determine Allowable Strain Levels........................................................................................................ 63 Subtask D.5 Experiment 5: Estimation of Allowable Strain Levels from Mixture Composition.......................................................................................................................... 72 Task D Milestones ................................................................................................................ 75 Task D Labor Estimate ......................................................................................................... 76 Task D Sources ..................................................................................................................... 77
Task E. Analysis of Pavement Sections................................................................................... 79 Subtask E.1 Review Data Sources and Select Sections for Analysis .................................. 80 Subtask E.2 Obtain Materials and Data for Accelerated Pavement Tests and Test Roads . 90 Subtask E.3 Perform Lab Testing and Analyze Accelerated Pavement Tests and Test Roads............................................................................................................................................... 92 Subtask E.4 Obtain Materials and Data for In-Service Pavement Sections ........................ 92 Subtask E.5 Perform Lab Testing and Analyze In-Service Pavement Sections .................. 93 Task E Milestones................................................................................................................. 97 Task E Labor Estimate.......................................................................................................... 98 Task E Sources...................................................................................................................... 98
Schedule of Tasks ....................................................................................................................... 101
Budget ......................................................................................................................................... 104
References................................................................................................................................... 107
Appendix A: Recommended LTPP Test Sections ..................................................................... 113

iv
List of Figures Figure 1. Typical S-N Diagram From Laboratory Fatigue Tests................................................... 2 Figure 2. Results of Flexural Fatigue Tests by Carpenter et al., Including Extrapolated Results at Low Strain Levels . .................................................................. 3 Figure 3. Project Flow Chart.......................................................................................................... 7 Figure 4. Overall Project Schedule. ..............................................Error! Bookmark not defined. Figure 5. Recommended Research Management Structure......................................................... 14 Figure 6. Effect of Rest Periods on Plateau Value ...................................................................... 22 Figure 7. Effect of Rest Period on Fatigue Life........................................................................... 23 Figure 8. Plateau Value for Continuous Loading as a Function of Applied Strain Level. .......... 25 Figure 9. Application of Time-Temperature Superposition to Rest Periods. .............................. 28 Figure 10. Comparison of Applied and Allowable Strains.......................................................... 32 Figure 11. Example of Minimum Asphalt Thicknesses to Resist Bottom Initiated Fatigue Cracking With Observed Performance of Four UK Pavement Sections. ...... 33 Figure 12. Schematic of Pulsed, Strain Controlled Fatigue Loading. ......................................... 53 Figure 13. Expected Results When Healing is Significant. ......................................................... 54 Figure 14. Schematic of Time-Temperature Superposition Applied to Rest Periods.................. 62 Figure 15. Typical Plot of Ratio of Dissipated Energy Change Versus Loading Cycles ............ 64 Figure 16. Typical Damage Ratio Curves From a Cyclic Direct Tension Fatigue Test. ............. 67 Figure 17. Typical Damage Relationship From Continuum Damage Analysis. ......................... 70 Figure 18. Comparison of Area Fatigue Cracking (Area Alligator Cracking Based on a Percent of Wheel Path Area) and HMA Layer Thickness ....................... 86 Figure 19. Comparison of the Area Fatigue Cracking for and Maximum Tensile Strain Computed at the Bottom of the HMA Layer ............................................................. 86 Figure 20. Comparison of the Maximum Tensile Strain at the Bottom of the HMA Layer and HMA Thickness......................................................................................... 88 Figure 21. Schematic of Field Section Data Analysis. ................................................................ 95 Figure 22. Project Schedule With Critical Path Shown in Black. Error! Bookmark not defined. Figure 23. Project Budget. ......................................................................................................... 105 Figure 24. Estimated Monthly and Cumulative Expenditures................................................... 106

v
List of Tables Table 1. Summary of Man-hour and Cost Estimates..................................................................... 8 Table 2. Major Task 1 Milestones. .............................................................................................. 17 Table 3. Estimated Labor Hours for Task 1................................................................................. 17 Table 4. Summary of Existing Pavement Analysis Approaches Considered. ............................. 20 Table 5. Effect of Rest Period on Fatigue Life. ........................................................................... 23 Table 6. Approximate Rest Periods for Various Design Traffic Levels...................................... 24 Table 7. Allowable Strains for Various Design Traffic Levels. .................................................. 27 Table 8. Computation of Allowable Strain Strains...................................................................... 30 Table 9. Applied Strains for Design Example. ............................................................................ 31 Table 10. Major Task 2 Milestones. ............................................................................................ 38 Table 11. Estimated Labor Hours for Task 2............................................................................... 39 Table 12. Major Task C Milestones............................................................................................. 43 Table 13. Estimated Labor Hours for Task C. ............................................................................. 44 Table 14. Summary of Proposed Laboratory Experiments.......................................................... 45 Table 15. Design for a Two Level, Seven Factor Plackett-Burman Experiment. ....................... 47 Table 16. Summary of Proposed Experiment 1. .......................................................................... 52 Table 17. Strain Level Experiment. ............................................................................................. 56 Table 18. Experimental Design for Experiment 3. ...................................................................... 57 Table 19. Temperature and Frequency Combinations for Dynamic Modulus Tests. .................. 58 Table 20. Major Task 4 Milestones. ............................................................................................ 76 Table 21. Estimated Labor Hours for Task 4............................................................................... 76 Table 22. HMA Thicknesses in NCAT Structural Sections ........................................................ 82 Table 23. Summary of MNRoad Mainline HMA Pavement Sections......................................... 83 Table 24. FHWA Pavement Testing Facility Superpave Fatigue Experiment. ........................... 83 Table 25. Preliminary Matrix for Field Calibration of the Allowable Strain Limit Design Procedure. .............................................................................................. 89 Table 26. LTPP Sections Recommended for Consideration. ...................................................... 90 Table 27. Summary of Required Inputs for Allowable Strain Limit Design............................... 91 Table 28. Preliminary Testing Plan for Cores From the LTPP Sections. .................................... 94 Table 29. Major Task 5 Milestones. ............................................................................................ 97 Table 30. Estimated Labor Hours for Task 5............................................................................... 98 Table 31. Project Milestone Summary....................................................................................... 103 Table 32. Labor Costs Used in Budget Preparation................................................................... 104 Table 33. Travel Cost Estimate.................................................................................................. 104 Table 34. Estimate of Report Printing Costs. ............................................................................ 104
vi
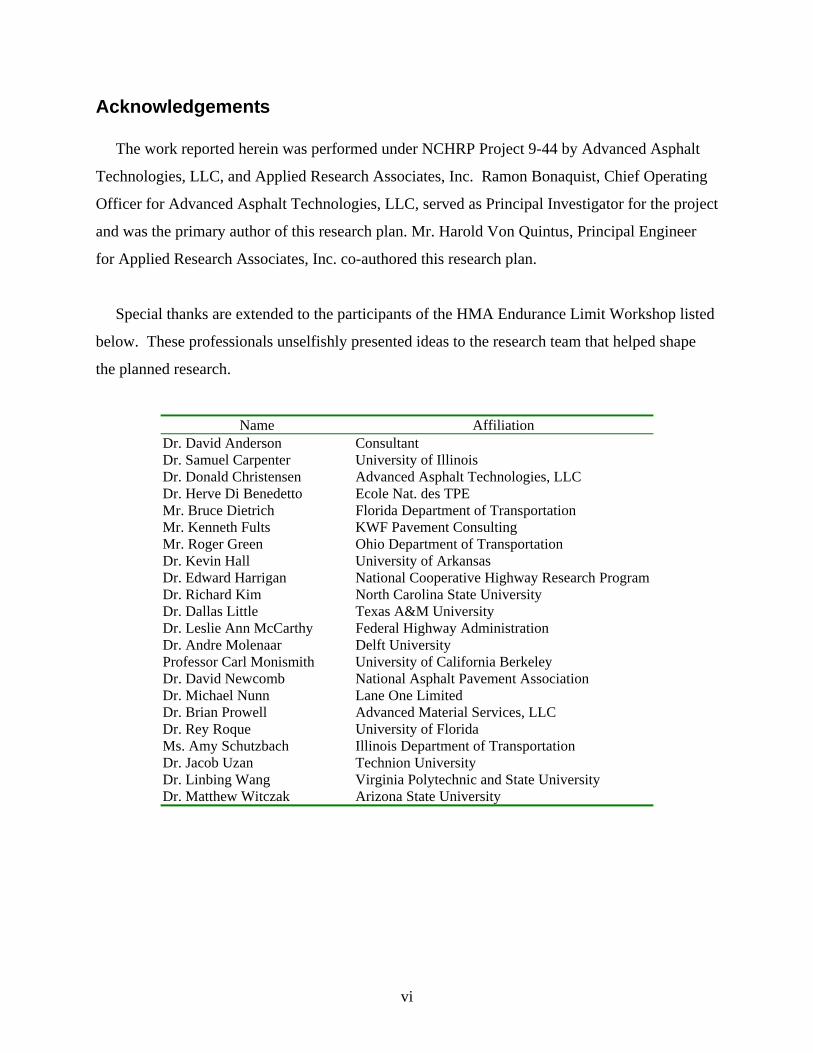
Acknowledgements The work reported herein was performed under NCHRP Project 9-44 by Advanced Asphalt
Technologies, LLC, and Applied Research Associates, Inc. Ramon Bonaquist, Chief Operating
Officer for Advanced Asphalt Technologies, LLC, served as Principal Investigator for the project
and was the primary author of this research plan. Mr. Harold Von Quintus, Principal Engineer
for Applied Research Associates, Inc. co-authored this research plan.
Special thanks are extended to the participants of the HMA Endurance Limit Workshop listed
below. These professionals unselfishly presented ideas to the research team that helped shape
the planned research.
Name Affiliation Dr. David Anderson Consultant Dr. Samuel Carpenter University of Illinois Dr. Donald Christensen Advanced Asphalt Technologies, LLC Dr. Herve Di Benedetto Ecole Nat. des TPE Mr. Bruce Dietrich Florida Department of Transportation Mr. Kenneth Fults KWF Pavement Consulting Mr. Roger Green Ohio Department of Transportation Dr. Kevin Hall University of Arkansas Dr. Edward Harrigan National Cooperative Highway Research Program Dr. Richard Kim North Carolina State University Dr. Dallas Little Texas A&M University Dr. Leslie Ann McCarthy Federal Highway Administration Dr. Andre Molenaar Delft University Professor Carl Monismith University of California Berkeley Dr. David Newcomb National Asphalt Pavement Association Dr. Michael Nunn Lane One Limited Dr. Brian Prowell Advanced Material Services, LLC Dr. Rey Roque University of Florida Ms. Amy Schutzbach Illinois Department of Transportation Dr. Jacob Uzan Technion University Dr. Linbing Wang Virginia Polytechnic and State University Dr. Matthew Witczak Arizona State University

vii
Abstract
This document presents a plan for research to rationally incorporate the concept of an
endurance limit for hot mix asphalt (HMA) into a mechanistic-empirical algorithm for bottom
initiated fatigue cracking in flexible pavements, and to validate the resulting procedure using
performance data from full-scale pavement sections.
The planned research is based on the hypothesis that the endurance limit for HMA is the
result of a balance of damage caused by loading and healing or damage recovery that occurs
during rest periods. Under this hypothesis the primary objective in designing a flexible
pavement to resist bottom initiated fatigue cracking will be to make sure that the damage induced
by loading remains small enough so that healing occurs and there is no accumulation of damage
over the life of the pavement. This is a significant departure from current cumulative or
incremental damage models, which assume that no healing occurs and that each load cycle uses
up a portion of the finite fatigue life of the HMA.
This research plan includes a preliminary design procedure that is based on layered elastic
analysis and compatible with the Mechanistic-Empirical Pavement Design Guide (MEPDG). It
uses allowable strains to identify satisfactory conditions for full healing. The allowable strains
are a function of the properties of the HMA, the pavement temperature, and the duration of rest
periods between traffic loads. Five laboratory experiments that are needed to fully develop the
procedure are described. Studies using data from completed accelerated pavement tests and test
roads are proposed to verify critical aspects of the design procedure. Finally, an experiment to
calibrate the design procedure using selected test sections from the Long Term Pavement
Performance Program is presented.
The recommended research study has been titled the HMA Endurance Limit Validation
Study. It addresses an important concept in the design of perpetual pavements that is gaining
increasing acceptance worldwide. It is envisioned that application of an endurance limit in
flexible pavement design will lead to more effective pavement sections with significant benefit
and cost savings to the public.

1
Introduction
Purpose This document presents a plan for research to rationally incorporate the concept of an
endurance limit for hot mix asphalt (HMA) into a mechanistic-empirical algorithm for bottom
initiated fatigue cracking in flexible pavements, and to validate the resulting procedure using
performance data from full-scale pavement sections. For HMA pavements, the endurance limit
has been defined as a level of strain below which there is no cumulative damage over an
indefinite number of load cycles (1).
This research plan is the primary product of National Cooperative Highway Research
Program (NCHRP) Project 9-44, Developing a Plan for Validating an Endurance Limit for HMA
Pavements. The recommended research study has been titled the HMA Endurance Limit
Validation Study. It addresses an important concept in the design of perpetual pavements that is
gaining increasing acceptance worldwide. It is envisioned that application of an endurance limit
in flexible pavement design will lead to more effective pavement sections with significant
benefit and cost savings to the public.
Statement of the Problem In engineering, fatigue refers to the progressive and localized damage that occurs when a
material is subjected to repeated loading below its ultimate strength. It is an important
consideration in the design of many civil engineering structures including pavements.
The fatigue behavior of materials is evaluated using laboratory fatigue tests, where a sample
is loaded repeatedly using a known stress or strain and the number of load applications are
counted until the sample fails. By performing tests at different stress or strain levels a Wöhler
curve or S-N diagram can be developed. These diagrams are simply plots of the applied stress or
strain and the corresponding number of cycles to failure. Figure 1 shows two typical S-N
diagrams generated from laboratory test data. In curve (a), the fatigue life increases at a
gradually increasing rate with decreasing stress amplitude. In curve (b), on the other hand, the
fatigue life gradually increases until a limit is reached (50 MPa in this case) where the fatigue

2
life becomes indefinite. This is called the endurance limit for the material. The endurance limit is
a critical concept in the design of structures that must resist large numbers of repeated loads. If
stresses or strains are kept below the endurance limit, the structure will be able to withstand an
infinite number of load applications.
0
50
100
150
1.E+04 1.E+05 1.E+06 1.E+07 1.E+08
Cycles to Failure, N
Stre
ss A
mpl
itude
, S (M
Pa)
(b) endurance limit = 50 MPa
(a) no endurance limit
Figure 1. Typical S-N Diagram From Laboratory Fatigue Tests: (a) No Endurance Limit;
(b) 50 MPa Endurance Limit.
Many materials do not have the well-defined endurance limit shown schematically in Figure
1. HMA is one of these materials. Although early HMA fatigue research conducted by
Monismith and his colleagues suggested that HMA exhibited an endurance limit at
approximately 70 μstrain (2), only limited HMA fatigue research was conducted at low strain
levels until recently when the Asphalt Pavement Alliance began promoting the concept of
perpetual pavement design (3). A perpetual pavement is an asphalt pavement that provides a
very long life without structural failure and only requires periodic replacement of the surface. A
key element of perpetual pavement design is to eliminate fatigue cracking that initiates at the
bottom of the HMA base due to repeated flexure under traffic loading and to confine distresses to
the surface of the pavement, which can easily be renewed by milling and resurfacing.

3
In response to increasing interest in perpetual pavements, a substantial amount of laboratory
fatigue testing has recently been performed in the United States in an effort to demonstrate that
HMA does exhibit an endurance limit. Most of this work has been performed at the University
of Illinois (4,5) and the National Center for Asphalt Technology (NCAT) (6). These studies
provide clear evidence that the fatigue behavior of HMA is much different in low strain level
tests compared to normal strain level tests. Figure 2 shows a consolidated plot of the University
of Illinois fatigue data including low and normal strain level test data. Below approximately 100
μstrain, the fatigue life is significantly longer than estimated from extrapolation of normal strain
level test data. Healing of microdamage has been proposed as the primary reason for the
increased fatigue life at low strain levels (1, 7, 8). For cyclic tests at low strain levels, it appears
that the damage that is caused by loading is offset by healing that occurs during unloading
resulting in essentially infinite fatigue life. Current mechanistic-empirical fatigue criteria for
HMA, including the field calibrated criterion in the Mechanistic Empirical Pavement Design
Guide (MEPDG), are based on results from normal strain level tests and do not include the low
strain level effects shown in Figure 2.
Figure 2. Results of Flexural Fatigue Tests by Carpenter et al., Including Extrapolated Results at Low Strain Levels (4).
4
Detailed investigation of four heavily trafficked pavements in the United Kingdom support
the perpetual pavement concept and the likelihood of an endurance limit for HMA. This
comprehensive study found no evidence of fatigue damage at the bottom of properly constructed
thick flexible pavements with total HMA thickness ranging from 230 to 350 mm (9). Cracks in
these pavements were found to have initiated at the surface and deflections monitored over a
number of years generally showed steady or decreasing deflection with increasing cumulative
traffic, indicating that fatigue damage to the bottom of the HMA was not occurring. Similar
conclusions concerning the absence of cracking at the bottom of thick HMA pavements have
been reported by others (10, 11, 12).
In summary, there is mounting evidence that an endurance limit for HMA does exist. It has
been observed in laboratory studies of fatigue at low strain levels, and several documented case
studies indicate that bottom initiated fatigue cracking is almost non-existent in properly
constructed, thick HMA pavements. A concentrated research effort, however, is needed to
validate the endurance limit concept, and to devise effective methods for incorporating it in
mechanistic-empirical pavement design methods.
Objectives and Hypothesis The objectives of the HMA Endurance Limit Validation Study are:
1. To incorporate the concept of an endurance limit for HMA into a mechanistic-
empirical algorithm for bottom initiated fatigue cracking in flexible pavements.
2. To validate the methodology using performance data from full-scale pavement
sections.
These objectives could potentially be satisfied using a number of research approaches. The
specific approach presented in this plan is based on the following hypothesis, which was
developed from a review of recent literature concerning the fatigue response of HMA, and
recommendations made during the HMA Endurance Limit Workshop conducted early in
NCHRP Project 9-44 (1):

5
HMA does exhibit an endurance limit. This endurance limit, however, does not reflect an absence of load induced damage in the HMA. It is the result of a balance of damage caused by loading and healing or damage recovery that occurs during rest periods. The endurance limit for HMA is, therefore, not a single value, but will change depending on the loading and environmental conditions applied to the HMA. To properly consider this form of an endurance limit in flexible pavement design requires consideration of the effects of loading, environment and material properties on both damage accumulation and healing.
Under this hypothesis the primary objective in designing a flexible pavement to resist
bottom initiated fatigue cracking will be to make sure that the damage induced by loading
remains small enough so that healing occurs and there is no accumulation of damage over
the life of the pavement. This is a significant departure from current cumulative or
incremental damage models which assume that no healing occurs and that each load
cycle uses up a portion of the finite fatigue life of the HMA. The hypothesis presented
above implies that any flexible pavement structure can be designed to indefinitely resist
bottom initiated fatigue cracking. Thicker pavements will be required for heavier loads,
shorter rest periods (higher traffic volume), and poorer foundation conditions. To
successfully formulate this type of design procedure will require research to quantify the
effects of temperature, aging, and materials properties on damage accumulation and
damage recovery in HMA. Once formulated, the procedure can be validated using
performance data from full-scale pavement sections.
Scope of the Plan This research plan is a comprehensive document describing the research that must be
completed to successfully incorporate the concept of an endurance limit for HMA into a fatigue
algorithm for bottom initiated fatigue cracking and to validate the resulting procedure using full-
scale pavement sections. It includes four parts in addition to this Introduction. The first is a
summary that briefly describes the proposed research and presents overall cost estimates and
time requirements. The second is a description of the required research tasks. This section
includes detailed information for each task and subtask, including (1) a description of the work to
be performed, (2) preliminary experimental designs when appropriate, (3) a list of milestones
related to the task, (4) labor hour estimates, and (5) a listing of pertinent data and reference
material that will be needed to accomplish the task. The third is a detailed schedule for the

6
project. The schedule addresses the sequence of the research tasks and the interactions between
tasks. Finally, the fourth presents the proposed budget for the project. The budget includes
detailed estimates of labor and other costs associated with each task and subtask.

7
Summary of the Research Plan
The HMA Endurance Limit Validation Study consist of five major tasks: (A) Management
and Reporting, (B) Formulate Design Procedure, (C) Database Management, (D) Laboratory
Studies, and (E) Analysis of Pavement Sections. Figure 3 presents an overall flow chart for the
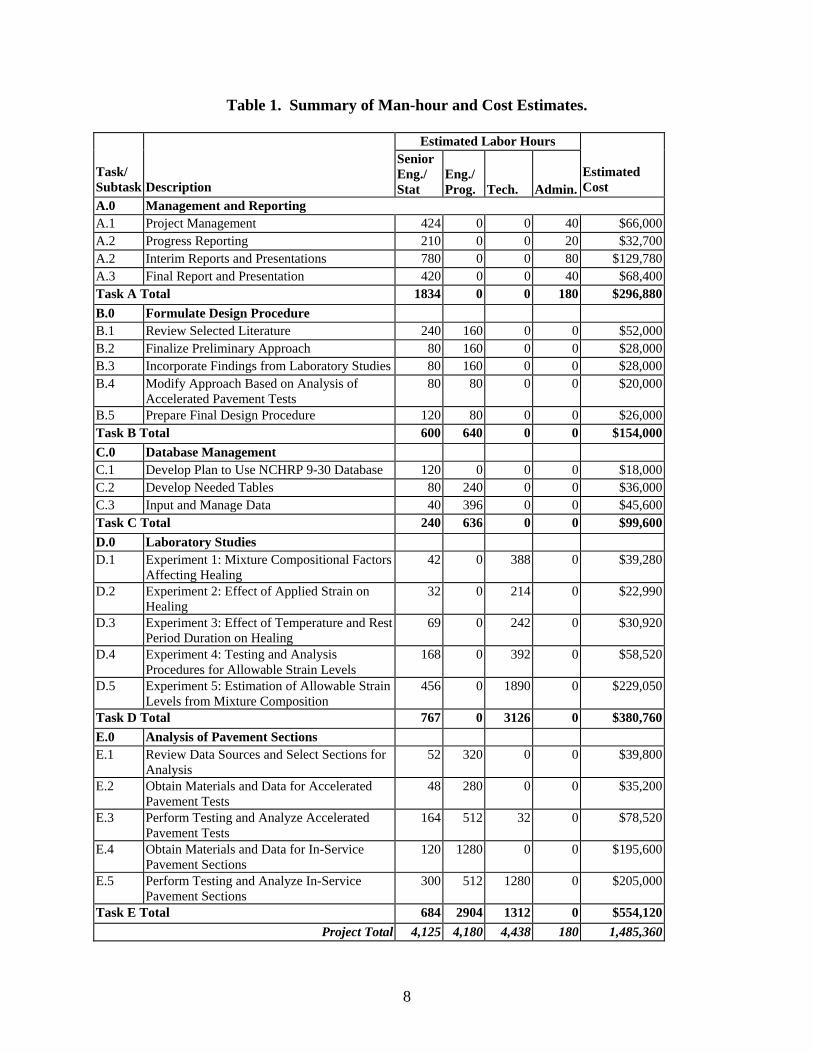
project with major interactions between tasks identified. Table 1 lists the subtasks for each of
the five major tasks and presents estimated labor hours and costs. The HMA Endurance Limit
Validation Study is estimated to require approximately 12,923 man-hours of effort at a cost of
approximately $1.5 million. Figure 4 presents the overall schedule for the project, which is
estimated to require 48 months to complete.
Figure 3. Project Flow Chart.
Task A
Management andReporting
Task B
Formulate DesignProcedure
Task C
Database Management
Task D
Laboratory Studies
Task E
Analysis ofPavement Sections
8
Table 1. Summary of Man-hour and Cost Estimates.
Estimated Labor Hours Task/ Subtask
Description
Senior Eng./ Stat
Eng./Prog.
Tech.
Admin.
Estimated Cost
A.0 Management and Reporting A.1 Project Management 424 0 0 40 $66,000A.2 Progress Reporting 210 0 0 20 $32,700A.2 Interim Reports and Presentations 780 0 0 80 $129,780A.3 Final Report and Presentation 420 0 0 40 $68,400Task A Total 1834 0 0 180 $296,880 B.0 Formulate Design Procedure B.1 Review Selected Literature 240 160 0 0 $52,000B.2 Finalize Preliminary Approach 80 160 0 0 $28,000B.3 Incorporate Findings from Laboratory Studies 80 160 0 0 $28,000B.4 Modify Approach Based on Analysis of
Accelerated Pavement Tests 80 80 0 0 $20,000
B.5 Prepare Final Design Procedure 120 80 0 0 $26,000Task B Total 600 640 0 0 $154,000C.0 Database Management C.1 Develop Plan to Use NCHRP 9-30 Database 120 0 0 0 $18,000C.2 Develop Needed Tables 80 240 0 0 $36,000C.3 Input and Manage Data 40 396 0 0 $45,600Task C Total 240 636 0 0 $99,600D.0 Laboratory Studies D.1 Experiment 1: Mixture Compositional Factors
Affecting Healing 42 0 388 0 $39,280
D.2 Experiment 2: Effect of Applied Strain on Healing
32 0 214 0 $22,990
D.3 Experiment 3: Effect of Temperature and Rest Period Duration on Healing
69 0 242 0 $30,920
D.4 Experiment 4: Testing and Analysis Procedures for Allowable Strain Levels
168 0 392 0 $58,520
D.5 Experiment 5: Estimation of Allowable Strain Levels from Mixture Composition
456 0 1890 0 $229,050
Task D Total 767 0 3126 0 $380,760E.0 Analysis of Pavement Sections E.1 Review Data Sources and Select Sections for
Analysis 52 320 0 0 $39,800
E.2 Obtain Materials and Data for Accelerated Pavement Tests
48 280 0 0 $35,200
E.3 Perform Testing and Analyze Accelerated Pavement Tests
164 512 32 0 $78,520
E.4 Obtain Materials and Data for In-Service Pavement Sections
120 1280 0 0 $195,600
E.5 Perform Testing and Analyze In-Service Pavement Sections
300 512 1280 0 $205,000
Task E Total 684 2904 1312 0 $554,120Project Total 4,125 4,180 4,438 180 1,485,360

9
Task Subtask1 2 3 4 5 6 7 8 9 10 11 12 13 14 15 16 17 18 19 20 21 22 23 24 25 26 27 28 29 30 31 32 33 34
A.0 Management and ReportingA.1 Project ManagementA.2 Progress ReportingA.3 Interim Reports and Presentations P PA.4 Final Report and Presentation
B.0 Formulate Design ProcedureB.1 Review Selected LiteratureB.2 Finalize Preliminary ReportB.3 Incorporate Findings From Laboratory StudiesB.4 Modify Approach Based on Analysis of Accelerated Pavement TestsB.5 Prepare Final Design Procedure
C.0 Database ManagementC.1 Develop Plan to Use M-E_DPM DatabaseC.2 Develop Needed TablesC.3 Input and Manage data
D.0 Laboratory StudiesD.1 Experiment 1: Mixture Compositional Factors Affecting HealingD.2 Experiment 2: Effect of Applied Strain on HealingD.3 Experiment 3: Effect of Temperature and Rest Period Duration on HealingD.4 Experiment 4: Testing and Analysis Procedures for Allowable Strain LevelsD.5 Experiment 5: Estimation of Allowable Strain Levels from Mixture Composition
E.0 Analysis of Field SectionsE.1 Review Data Sources and Select Sections for AnalysisE.2 Obtain Materials and Data for Accelerated Pavement Tests and Test RoadsE.3 Perform Lab Testing and Analyze Accelerated Pavement Tests and Test RoadsE.4 Obtain Materials and Data for In-Service Pavement SectionsE.5 Perform Lab Testing and Analyze In-Service Pavement Sections
Months After Notice To Proceed
Figure 4. Overall Project Schedule.
Figure 4. Overall Project Schedule

10
Task A, Management and Reporting, includes all activities normally associated with
management and reporting for NCHRP Projects. Major management tasks include scheduling,
coordinating, and directing various technical work activities as well as project financial
management. Reporting activities include monthly and quarterly progress reports, the
preparation of several interim reports and presentations, and the preparation of the final report.
Interim reports are required at approximately 6 month intervals and coincide with the completion
of five critical milestones:
(1) Formulation of the preliminary design procedure and selection of the laboratory analysis
approach,
(2) Selection of pavement sections for analysis,
(3) Completion of the laboratory studies,
(4) Modification of the preliminary design procedure to reflect the findings from the
laboratory studies and the analysis of accelerated pavement tests, and
(5) Analysis of the calibration sections and preparation of the final design procedure.
The final report will document the entire study and will be prepared from the interim reports.
Task B, Formulate Design Procedure, is a critical project task that will be active throughout
the project. This task includes finalizing the preliminary approach that is presented in this
research plan, modifying the preliminary approach based on the results of the laboratory studies
and selected accelerated pavement tests, and preparation of the final design procedure after
analysis of the calibration pavement sections. It is important to emphasize that the preliminary
approach prepared early in this task will shape the laboratory studies and guide the selection of
pavement sections, both accelerated pavement tests and in-service pavement sections.
Task C, Database Management, is a support task that will be active throughout the project. A
database will be developed in this task to store and analyze data from the laboratory studies and
the analysis of the pavement sections. It is envisioned that the database will be an adaptation of
the one developed in NCHRP Project 9-30.

11
Task D, Laboratory Studies, includes the planning and execution of five laboratory studies that
are needed to complete the design procedure that will be formulated in Task 2. The laboratory
studies concentrate on quantifying what affects the healing properties of HMA. The laboratory
studies will be sufficient in breadth to develop models relating mixture and binder properties to
the key engineering properties required for the analysis.
Task E, Analysis of Pavement Sections, includes several activities associated with the
selection and analysis of full-scale pavements. The preliminary design procedure formulated in
Task 2 will be tested using data from completed accelerated pavement tests, such as the fatigue
studies from the Federal Highway Administration’s (FHWA’s) Pavement Testing Facility or the
structural sections included in the National Center for Asphalt Technology (NCAT) test track.
Calibration of the design procedure will be accomplished through an analysis of in-service
pavements where it has been documented that bottom-up fatigue cracking has occurred or has
not occurred. These analyses will serve to calibrate the design procedure and validate the HMA
endurance limit concept. The predictive models developed in Task D will be used in the analysis
of the full-scale pavement sections. This will allow consideration of pavement sections where
original materials are not available since the required data can be obtained from cores taken from
the pavement section.

12
Task by Task Description of the Research Plan
This section of the research plan presents detailed descriptions of each of the tasks and
subtasks included in the HMA Endurance Limit Validation Study. Each task description
includes a detailed description of the work to be performed including: (1) preliminary
experimental designs when appropriate, (2) a list of milestones related to the task, (3) labor hour
estimates, and (4) a listing of pertinent data and reference material that will be needed to
accomplish the task.
Task A. Management and Reporting Task A includes all activities normally associated with management and reporting for
NCHRP projects. Task A has been divided into four subtasks:
A.1 Project Management,
A.2 Progress Reporting,
A.3 Interim Reports and Presentations, and
A.4 Final Report and Presentation.
Each of these subtasks are described in detail below. Subtask A.1 Project Management
Effective project management will be critical to the successful completion of the HMA
Endurance Limit Study. The study requires that the Principal Investigator have in-depth
knowledge of the following technical areas:
• Mechanistic-empirical pavement design and analysis,
• Experimental design,
• Model development,
• Laboratory characterization of HMA,
• Accelerated pavement testing, and
• Pavement evaluation.

13
Since the design procedure incorporating an endurance limit for bottom initiated fatigue cracking
will determine the details of the laboratory and field studies, the Principal Investigator should
directly lead Task B, Formulate Design Procedure. To efficiently manage several tasks that will
be conducted concurrently, the team structure shown in Figure 5 is recommended. In this
structure, the Principal Investigator is supported by three teams: Laboratory, Pavement, and
Data Support, each with a separate team leader. Additionally, it is strongly recommended that a
Statistician be included in the project team to assist the Principal Investigator and team leaders
with detailed experimental design, model formulation, and model calibration. The Principal
Investigator will be responsible for the overall technical content of the project, while the team
leaders will be responsible for the details of the work in their area of expertise. In addition to the
scenario shown in Figure 5 where the management team consists of the Principal Investigator
and three team leaders, other structures are possible depending on the skills and commitment
levels of the senior members of the research team. For example, the Principal Investigator may
also serve as one of the team leaders and one individual may serve as the leader of the remaining
two teams. It is recommended, however, that a single individual not fill more than two
leadership roles.
This research plan as modified during the proposal process will serve as the principal project
management tool. Shortly after contract award, the research management team should meet and
the Principal Investigator should make initial task assignments to the project team. The research
management team should then meet semi-monthly to discuss the progress of the work and
resolve any problems that may develop. These meetings should be scheduled to provide timely
information for the monthly and quarterly progress reports discussed in the next section.
Another important aspect of project management is coordination with other on-going research
efforts. Several studies addressing cracking in flexible pavements are on-going including: (1)
NCHRP 1-41, Models for Predicting Reflection Cracking of Hot-Mix Asphalt Overlays,
(2) NCHRP 1-42A, Models for Predicting Top-Down Cracking of Hot-Mix Asphalt Layers, and
(3) the fatigue studies being conducted in the Asphalt Research Consortium. Although different
approaches are being used in each of these studies, it is important that the research team monitor
and share information with these studies.

14
Principal Investigator• Formulate Design Procedure• Experimental Design• Laboratory and Pavement Data Analysis• Reporting
Laboratory Team Leader• Laboratory Experimental Design• Oversee Laboratory Testing• Laboratory Data Analysis• Model Formulation• Reporting
Pavement Team Leader• Select Pavement Sections• Oversee Pavement Data Collection• Pavement Data Analysis• Reporting
Data Support Team Leader• Design Data Base Structure• Oversee Data Input• Assist With Data Analysis• Reporting
Statistician• Experimental Design• Model Formulation• Model Calibration
Figure 4. Recommended Research Management Structure.

15
Subtask A.2 Progress Reporting
NCHRP has specific requirements for progress reporting (13). The required reporting
includes brief monthly progress reports and detailed quarterly progress reports. The monthly
progress reports briefly summarize the work that has been completed, planned work, problems
encountered, and expenditures for the project. The detailed quarterly progress reports describe
completed work, planned work, and problems encountered in sufficient detail for review by the
project panel during the course of the project. The quarterly progress reports are the means by
which the project panel provides direction to the research team. Timely progress reporting and
communication with the project panel are essential tools for effective project management.
Subtask A.3 Interim Reports and Presentations
The HMA Endurance Limit Validation Study includes a series of interim reports that coincide
with the completion of five critical milestones:
(1) Formulation of the preliminary design procedure and selection of the laboratory analysis
approach,
(2) Selection of pavement sections for analysis,
(3) Completion of the laboratory studies,
(4) Modification of the preliminary design procedure to reflect the findings from the
laboratory studies and the analysis of accelerated pavement tests, and
(5) Analysis of the calibration sections and preparation of the final design procedure.
Each interim report should be prepared in accordance with NCHRP requirements (14) and
specifically address the work completed in the relevant tasks. These interim reports will provide
more detailed information than normally contained in the progress reports. The final report will
be compiled from the interim reports.
Presentations to the project panel are included after the second and fourth interim reports.
The purpose of these presentations is to encourage a dialog between the project panel and the

16
Principal Investigator on the progress and direction of the work. One full day should be planned
for each of these presentations sessions. Each session should include:
(1) A presentation from the Principal Investigator focusing on the completed interim
reports, planned work, and any changes to the direction of the research.
(2) A discussion period where the project panel discusses critical aspects of the
completed and planned work with the Principal Investigator and other key members
of the research team.
(3) Recommendations concerning the direction of the research.
Subtask A.4 Final Report and Presentation
The final report will document the entire project and will be compiled from the five interim
reports. This report will be prepared in accordance with NCHRP requirements (14) and revised
as required for publication. Upon completion of the review of the draft of the final report, the
Principal Investigator will meet with the project panel to discuss the outcome of the project and
to jointly develop recommendations concerning implementation and additional research
activities.
Task A Milestones
Table 2 summarizes the major milestones for Task A. This milestone schedule assumes that
this research plan as modified during the proposal process will serve as the work plan for the
project. In addition to the major milestones listed in Table 2, meetings of the research
management team will occur semi-monthly throughout the project, and monthly progress reports
will be submitted as required by NCHRP.
Task A Labor Estimate
Table 3 presents the estimated labor required for Task 1. Table 3 presents estimated labor
hours for each of the positions in the research management structure presented in Figure 5.
Project management and reporting is estimated to require at total of 2014 man-hours of effort.
This is approximately 16 percent of the total effort required for the project.

17
Table 2. Major Task A Milestones. Milestone Description Months After
Contract Award A.1 Initial Work Assignments 0.5 A.2 First Quarterly Progress Report 3 A.3 Second Quarterly Progress Report 6 A.4 First Interim Report (Preliminary Design Procedure and Laboratory
Analysis Approach) 7
A.5 Third Quarterly Progress Report 9 A.6 Fourth Quarterly Progress Report 12 A.7 Second Interim Report (Selection of Pavement Sections for Analysis) 13 A.8 First Panel Presentation (Interim Reports 1 and 2) 14 A.9 Fifth Quarterly Progress Report 15
A.10 Sixth Quarterly Progress Report 18 A.11 Seventh Quarterly Progress Report 21 A.12 Third Interim Report (Analysis of Laboratory Studies) 22 A.13 Eighth Quarterly Progress Report 24 A.14 Ninth Quarterly Progress Report 27 A.15 Tenth Quarterly Progress Report 30 A.16 Fourth Interim Report (Design Procedure Incorporating Findings From
Laboratory Studies and Analysis of Accelerated Pavement Tests) 30
A.17 Second Panel Presentation (Interim Reports 3 and 4) 31 A.18 Eleventh Quarterly Progress Report 33 A.19 Twelfth Quarterly Progress Report 36 A.20 Thirteenth Quarterly Progress Report 39 A.21 Fifth Interim Report (Analysis of Validation Sections and Final Design
Procedure) 42
A.22 Fourteenth Quarterly Progress Report 42 A.23 Submit Draft of Final Report 45 A.24 Fifteenth Quarterly Progress Report 45 A.25 Third Panel Presentation (Draft Final Report and Recommendations for
Implementation and Additional Research 46
A.26 Revised Final Report 48
Table 3. Estimated Labor Hours for Task A. Subtask Principal
Investigator StatisticianLaboratory Team Leader
Pavement Team Leader
Data Support Team Leader
Administrative Assistant
A.1 Project Management 112 0 104 104 104 40A.2 Progress Reporting 120 0 30 30 30 20A.3 Interim Reports and Presentations
432 0 116 116 116 80
A.4 Final Report and Presentation 216 0 68 68 68 40Total 880 0 318 318 318 180

18
Task A Sources
Procedural Manual for Agencies Conducting Research in the National Cooperative Highway Research Program, Transportation Research Board, August, 2006. Preparing Your CRP Final Report, Transportation Research Board, September, 2006
Task B. Formulate Design Procedure In Task B, the procedure for designing pavements to resist bottom initiated fatigue cracking
that considers the effects of an endurance limit for HMA will be developed. Task B will build
on the preliminary procedure described in this research plan in four distinct steps:
1. Finalize preliminary procedure,
2. Incorporate findings from laboratory studies,
3. Modify approach based on analysis of accelerated pavement tests, and
4. Prepare final design procedure.
In step 1, the research team will become familiar with the preliminary procedure described in this
research plan, and develop improvements based on their review of the relevant literature and
research in progress. Then in steps 2, 3, and 4 information obtained from Tasks D and E of the
project will be used to further improve the procedure. The final product will be a procedure for
designing flexible pavements to resist bottom initiated fatigue cracking that accounts for the
effects of an HMA endurance limit. This procedure will be compatible with current mechanistic-
empirical flexible pavement design methods such as the MEPDG.
Preliminary Design Procedure
Background
A major part of the work completed during NCHRP 9-44 was the development of a
preliminary procedure for designing pavements to resist bottom initiated fatigue cracking that
considers the effects of an endurance limit. This preliminary procedure is based on the research
hypothesis that the endurance limit for HMA is the result of a balance of damage caused by
19
loading and healing or damage recovery that occurs during rest periods. Under this hypothesis
the primary objective in designing a flexible pavement to resist bottom initiated fatigue cracking
will be to make sure that the damage induced by loading remains small enough so that healing
occurs and there is no accumulation of damage over the life of the pavement. This is a
significant departure from current cumulative or incremental damage models, which assume that
no healing occurs and that each load cycle uses up a portion of the finite fatigue life of the HMA.
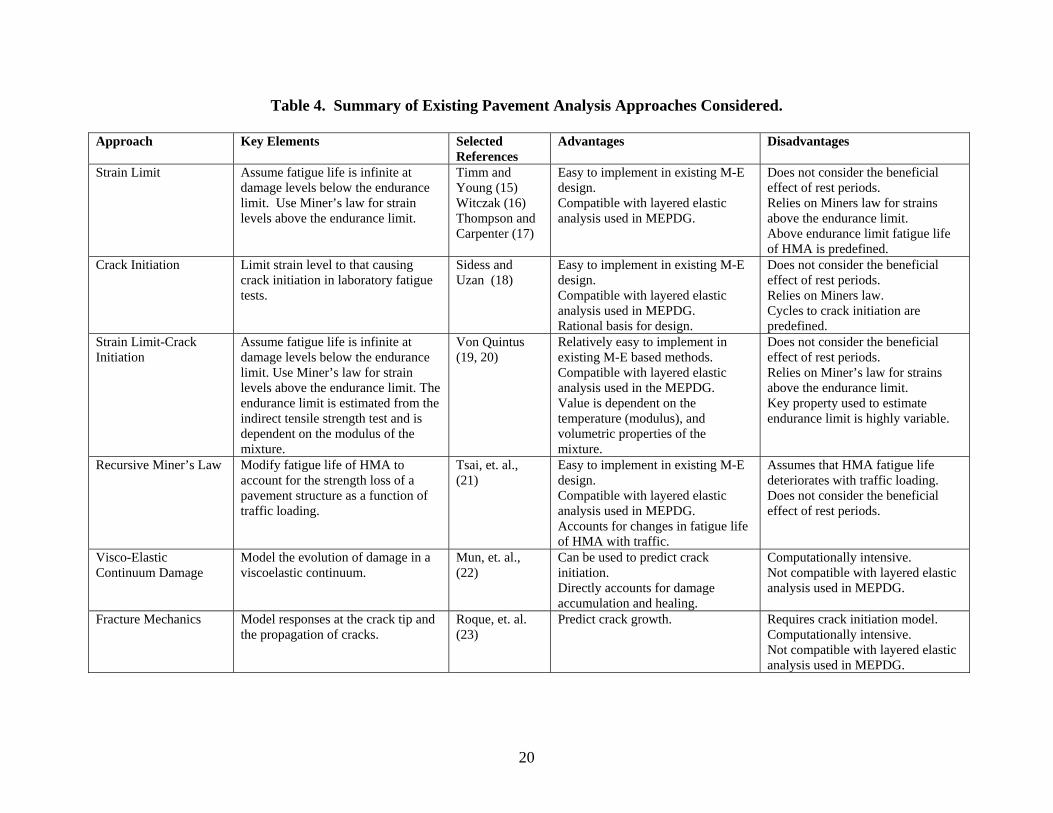
A number of approaches for designing pavements to resist bottom initiated fatigue cracking
were reviewed during NCHRP Project 9-44. Table 4 briefly summarizes the approaches that
were considered. These range from relatively simple modifications of traditional mechanistic-
empirical fatigue algorithms to sophisticated finite element models based on damage mechanics
and fracture mechanics. The major deficiency of the more practical approaches is that they do
not account for the beneficial effects of healing. In the HMA Endurance Limit Workshop,
healing was identified as a significant factor affecting the endurance limit in HMA (1). The
sophisticated approaches can account for healing, but are not practical at this time for use in
routine pavement design.
Effect of Rest Periods
An alternative approach was conceived during NCHRP Project 9-44 based on recent
endurance limit research published by Carpenter and Shen (7). In this work, Carpenter and Shen
clearly demonstrated the beneficial effects of rest periods on the fatigue life of HMA. Strain
controlled flexural fatigue tests were conducted at 20 °C using a 10 Hz haversine load pulse with
a rest period between each pulse to simulate the time between traffic loads. The rest periods
ranged from 0 sec (continuous loading) to 9 seconds. Two 19 mm mixtures, one with a neat PG
64-22 binder and one with a polymer modified PG 70-22 binder, were tested. The gradation,
binder content and air void content of the two mixtures was the same.
20
Table 4. Summary of Existing Pavement Analysis Approaches Considered. Approach Key Elements Selected
References Advantages Disadvantages
Strain Limit Assume fatigue life is infinite at damage levels below the endurance limit. Use Miner’s law for strain levels above the endurance limit.
Timm and Young (15) Witczak (16) Thompson and Carpenter (17)
Easy to implement in existing M-E design. Compatible with layered elastic analysis used in MEPDG.
Does not consider the beneficial effect of rest periods. Relies on Miners law for strains above the endurance limit. Above endurance limit fatigue life of HMA is predefined.
Crack Initiation Limit strain level to that causing crack initiation in laboratory fatigue tests.
Sidess and Uzan (18)
Easy to implement in existing M-E design. Compatible with layered elastic analysis used in MEPDG. Rational basis for design.
Does not consider the beneficial effect of rest periods. Relies on Miners law. Cycles to crack initiation are predefined.
Strain Limit-Crack Initiation
Assume fatigue life is infinite at damage levels below the endurance limit. Use Miner’s law for strain levels above the endurance limit. The endurance limit is estimated from the indirect tensile strength test and is dependent on the modulus of the mixture.
Von Quintus (19, 20)
Relatively easy to implement in existing M-E based methods. Compatible with layered elastic analysis used in the MEPDG. Value is dependent on the temperature (modulus), and volumetric properties of the mixture.
Does not consider the beneficial effect of rest periods. Relies on Miner’s law for strains above the endurance limit. Key property used to estimate endurance limit is highly variable.
Recursive Miner’s Law Modify fatigue life of HMA to account for the strength loss of a pavement structure as a function of traffic loading.
Tsai, et. al., (21)
Easy to implement in existing M-E design. Compatible with layered elastic analysis used in MEPDG. Accounts for changes in fatigue life of HMA with traffic.
Assumes that HMA fatigue life deteriorates with traffic loading. Does not consider the beneficial effect of rest periods.
Visco-Elastic Continuum Damage
Model the evolution of damage in a viscoelastic continuum.
Mun, et. al., (22)
Can be used to predict crack initiation. Directly accounts for damage accumulation and healing.
Computationally intensive. Not compatible with layered elastic analysis used in MEPDG.
Fracture Mechanics Model responses at the crack tip and the propagation of cracks.
Roque, et. al. (23)
Predict crack growth. Requires crack initiation model. Computationally intensive. Not compatible with layered elastic analysis used in MEPDG.
21
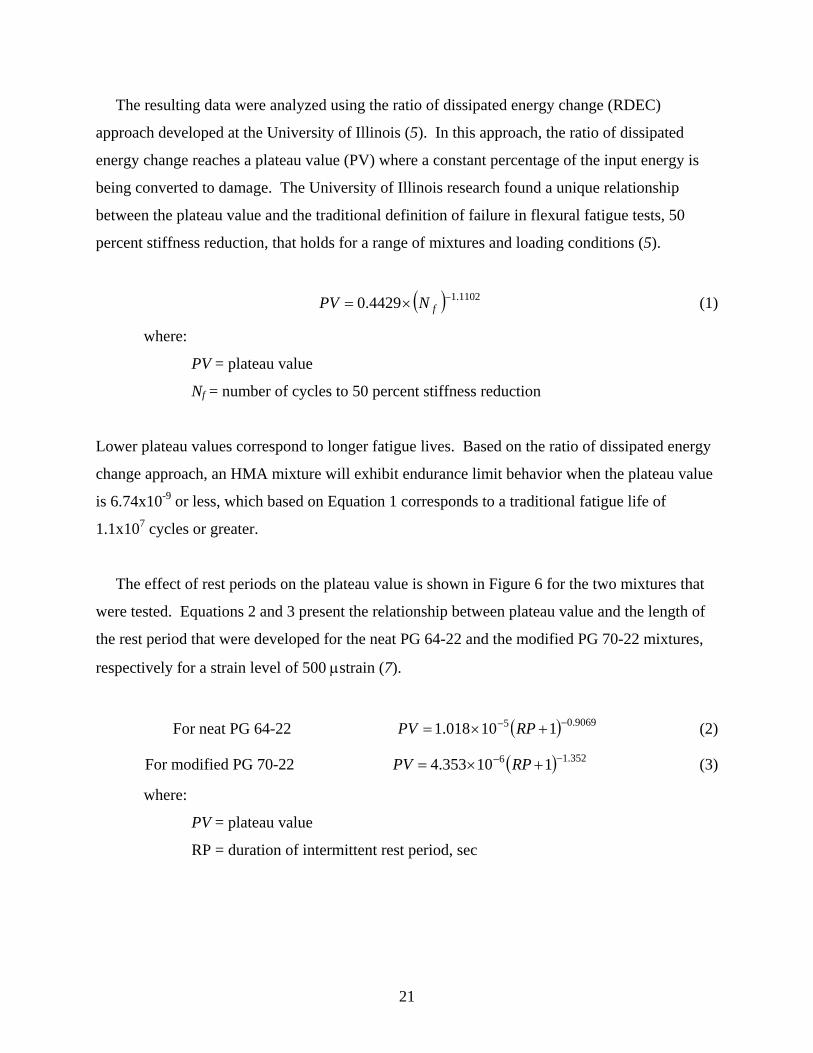
The resulting data were analyzed using the ratio of dissipated energy change (RDEC)
approach developed at the University of Illinois (5). In this approach, the ratio of dissipated
energy change reaches a plateau value (PV) where a constant percentage of the input energy is
being converted to damage. The University of Illinois research found a unique relationship
between the plateau value and the traditional definition of failure in flexural fatigue tests, 50
percent stiffness reduction, that holds for a range of mixtures and loading conditions (5).
( ) 1102.14429.0 −×= fNPV (1)
where:
PV = plateau value
Nf = number of cycles to 50 percent stiffness reduction
Lower plateau values correspond to longer fatigue lives. Based on the ratio of dissipated energy
change approach, an HMA mixture will exhibit endurance limit behavior when the plateau value
is 6.74x10⁻⁹ or less, which based on Equation 1 corresponds to a traditional fatigue life of
1.1x10⁷ cycles or greater.
The effect of rest periods on the plateau value is shown in Figure 6 for the two mixtures that
were tested. Equations 2 and 3 present the relationship between plateau value and the length of
the rest period that were developed for the neat PG 64-22 and the modified PG 70-22 mixtures,
respectively for a strain level of 500 μstrain (7).
For neat PG 64-22 ( ) 9069.05 110018.1 −− +×= RPPV (2)
For modified PG 70-22 ( ) 352.16 110353.4 −− +×= RPPV (3)
where:
PV = plateau value
RP = duration of intermittent rest period, sec

22
a. Neat PG 64-22
b. Polymer PG 70-22
Figure 5. Effect of Rest Periods on Plateau Value (5). The decreasing plateau values for tests with rest periods result in increasing fatigue lives.
This can be quantified by substituting plateau values from Equations 2 or 3 into Equation 1. The
results are summarized in Table 5. Figure 7 shows the beneficial effect of the rest periods on the
fatigue lives for the two mixtures. There is a substantial improvement in the fatigue life of both
mixtures. The values for the neat PG 64-22 mixture are of similar magnitude to improvements
previously reported by Bonnaure, et. al. (24). The effect of rest periods on the modified PG 70-
22 mixture is much more pronounced.

23
Table 5. Effect of Rest Period on Fatigue Life.
Neat PG 64-22 Modified PG 70-22 Rest Period, sec PV Nf Ratio PV Nf Ratio
0 1.02E-05 1.51E+04 1.00 4.35E-06 3.24E+04 1.00 1 5.43E-06 2.65E+04 1.76 1.71E-06 7.53E+04 2.33 2 3.76E-06 3.70E+04 2.45 9.86E-07 1.23E+05 3.81 3 2.90E-06 4.68E+04 3.10 6.68E-07 1.75E+05 5.41 4 2.37E-06 5.61E+04 3.72 4.94E-07 2.30E+05 7.10 5 2.00E-06 6.51E+04 4.32 3.86E-07 2.87E+05 8.86 6 1.74E-06 7.39E+04 4.90 3.13E-07 3.46E+05 10.69 7 1.54E-06 8.24E+04 5.47 2.62E-07 4.08E+05 12.58 8 1.39E-06 9.07E+04 6.02 2.23E-07 4.70E+05 14.52 9 1.26E-06 9.89E+04 6.56 1.94E-07 5.35E+05 16.51 10 1.16E-06 1.07E+05 7.09 1.70E-07 6.01E+05 18.54
0
2
4
6
8
10
12
14
16
18
20
0 2 4 6 8 10 12
Duration of Rest Period, sec
Rel
ativ
e Fa
tigue
Life
NEAT PG 64-22
Polymer PG 70-22
Figure 6. Effect of Rest Period on Fatigue Life.
An estimate of approximate rest periods can be obtained from the 20 year design traffic level
typically used in mixture design. Table 6 summarizes rest periods for various design traffic
levels. The rest period for a 20 year design traffic level of 100 million ESAL is approximately 6
sec., which results in a factor of 5 improvement in the fatigue life of the mixture with the neat
PG 64-22 binder and a factor of 10 improvement for the polymer modified PG 70-22 mixture.

24
Table 6. Approximate Rest Periods for Various Design Traffic Levels.
20 Year Design ESAL
ESAL/Day
ESAL/sec
Rest Period, sec
1.00E+05 13.7 0.0002 6307.2 3.00E+05 41.1 0.0005 2102.4 1.00E+06 137.0 0.0016 630.7 3.00E+06 411.0 0.0048 210.2 1.00E+07 1369.9 0.0159 63.1 3.00E+07 4109.6 0.0476 21.0 1.00E+08 13698.6 0.1585 6.3 3.00E+08 41095.9 0.4756 2.1
Allowable Strains
Continuous loading tests at different strain levels were also conducted by Carpenter and Shen
on the two mixtures and the plateau values are shown in Figure 6 for a rest period of zero
(RP+1=1) (7). From these data relationships between the plateau value for continuous loading
and the applied strain level can be developed as shown in Figure 8. These relationships are given
in Equations 4 and 5 for the neat PG 64-22 mixture and the polymer modified PG 70-22 mixture.
For neat PG 64-22 ( ) 617.3160 10142.9 ε−×=PV (4)
For modified PG 70-22 ( ) 331.5210 10347.5 ε−×=PV (5)
where:
PV0 = plateau value for continuous loading
ε = tensile strain, μstrain

25
y = 9.142E-16x3.617E+00
R2 = 9.689E-01
y = 5.347E-21x5.331E+00
R2 = 9.640E-01
1.00E-09
1.00E-08
1.00E-07
1.00E-06
1.00E-05
1.00E-04
1.00E-03
10 100 1000 10000
Strain, μstrain
Plat
eau
Valu
eNeat PG 64-22Polymer PG 70-22
Figure 7. Plateau Value for Continuous Loading as a Function of Applied Strain Level.
Based on previous work by Bonnaure (24), it is reasonable to assume that the effect of the rest
periods is the same at each strain level. Substituting Equations 4 and 5 for the constants 1.018
x10-5 and 4.353 x10⁻⁶ in Equations 2 and 3 respectively, yield the following relationships
between the plateau value, applied strain and rest period for the two mixtures.
For neat PG 64-22 ( ) ( ) 9069.0617.316 110142.9 −− +×= RPPV ε (6)
For modified PG 70-22 ( ) ( ) 352.1331.521 110347.5 −− +×= RPPV ε (7)
where:
PV = plateau value
ε = tensile strain, μstrain
RP = duration of intermittent rest period, sec

26
Equations 6 and 7 can then be substituted into Equation 1 and solved for the allowable strain
level to produce a selected mixture fatigue life.
For neat PG 64-22 ( )( ) ⎥
⎥⎦
⎤
⎢⎢⎣
⎡ += 3069.0
2507.0132.11483f
a NRPε (8)
For modified PG 70 -22 ( )( ) ⎥
⎥⎦
⎤
⎢⎢⎣
⎡ += 2082.0
2536.0174.5448f
a NRPε (9)
where:
εa = allowable tensile strain, μstrain
RP = duration of intermittent rest period, sec
Nf = number of cycles to failure
Recalling that endurance limit behavior occurs when the number of cycles to failure exceeds
1.1 x10⁷, then setting the number of cycles to failure in Equations 8 and 9 to a value above
1.1 x 10⁷ will ensure that full healing occurs at the selected rest period. Conservatively using 2.0
x 107 as the number of cycles to failure yields Equations 10 and 11, which give allowable strain
levels as a function of rest period to ensure that full healing occurs.
For neat PG 64-22 ( ) 2507.010.66 RPaf +=ε (10)
For modified PG 70-22 ( ) 2536.015.164 RPaf +=ε (11)
where:
εaf = allowable tensile strain for full healing, μstrain
RP = duration of intermittent rest period, sec
If the strains in a pavement at 20 °C are kept below the values given by Equations 10 and 11,
then complete healing will occur during intermittent rest periods, and the pavement will exhibit
endurance limit behavior. Table 7 summarizes these strain levels for various 20 year design
traffic levels.

27
Table 7. Allowable Strains for Various Design Traffic Levels.
Allowable Strains, μstrain 20 Year Design ESAL
Rest Period, sec Neat PG 64-22 Modified PG 70-22
1.00E+05 6307.2 592 1513 3.00E+05 2102.4 449 1145 1.00E+06 630.7 332 844 3.00E+06 210.2 253 639 1.00E+07 63.1 187 472 3.00E+07 21.0 143 360 1.00E+08 6.3 109 272 3.00E+08 2.1 88 219
Multiple Temperatures
The allowable strains presented in the previous section were developed from test data
obtained at 20 °C. To be useful in a pavement design procedure, the allowable strains for a wide
range of temperatures must be available. In this procedure the major concern is the effect of
temperature on the healing properties of the mixture. Previous research by Bonnaure, et al. (24)
concluded that the beneficial effect of rest periods increased with increasing temperature. Since
healing can be envisioned as a type of flow phenomenon where the binder flows together to
repair microcracks, it has been hypothesized that the effect of healing at multiple temperatures
can be accounted for using time-temperature superposition. By applying time-temperature
superposition, rest periods at different temperatures can be reduced to an equivalent rest period at
20 °C. The reduced rest period for temperatures above 20 °C will be longer than the actual rest
period, while those for temperatures below 20 °C will be shorter than the actual rest period.
Research conducted in NCHRP Project 9-19 showed that linear, viscoelastic time-temperature
shift factors obtained from dynamic modulus tests could be applied when a high level of
nonlinear damage is present (25). Equation 12 presents the application of time-temperature
superposition to the duration of the rest period.
( ) ( ) ( )TR ARPRP logloglog −= (12)
where:
RPR = duration of the rest period at the reference temperature, sec
RP = actual duration of the rest period, sec

28
AT = linear viscoelastic time temperature shift factor obtained from dynamic
modulus testing.
Figure 9 illustrates the use of time-temperature superposition for rest periods at temperatures of
40, 20, and 4 °C using 20° C as the reference temperature. In developing Figure 9, typical time-
temperature shift factors were used (log(AT) for 4 °C =2.0 and log(AT) for 40 °C = -2.2).
1.0E-02
1.0E-01
1.0E+00
1.0E+01
1.0E+02
1.0E+03
1.0E+04
1.0E+05
1.0E+06
1.0E+04 1.0E+05 1.0E+06 1.0E+07 1.0E+08 1.0E+09 1.0E+10
20 Year Design Traffic, ESAL
Red
uced
Res
t Per
iod
at 2
0 C
, sec
4 C20 C40 C
Figure 8. Application of Time-Temperature Superposition to Rest Periods.
Design Example
This section illustrates how the proposed methodology would be used in a mechanistic-
empirical design system such as the MEPDG. To limit the number of computations, a monthly
analysis is illustrated using typical pavement temperatures estimated from mean monthly air
temperature data from Reagan National Airport in Washington, DC. The pavement being
analyzed is 9 in of HMA constructed on a 6 in aggregate subbase base layer and a silty clay
subgrade. The 20 year design traffic level is 1 x 10⁸ ESALs, and the design traffic speed is 45
mph. The purpose of the analysis is to determine if the pavement section is sufficiently thick to

29
resist bottom initiated fatigue cracking assuming the fatigue properties of the neat PG 64-22
mixture discussed in the preceding section.
Material Properties For this analysis the modulus of the subgrade is assumed to be 4,500 psi and constant
throughout the year. The modulus of the aggregate subbase is assumed to be 25,000 psi and is
also assumed constant throughout the year. Dynamic modulus testing of a typical 19 mm
mixture with PG 64-22 binder using the Simple Performance Test System yielded the master
curve and shift factors given in Equations 13 and 14 for a reference temperature of 20 °C. The
allowable strains for full healing are given in Equation 15.
( )⎥⎦⎤
⎢⎣
⎡
++= −− )log(499.0213.11
259.3234.0*logrfe
E (13)
⎟⎠⎞
⎜⎝⎛ −+=
2.293112.10448loglog
Tffr (14)
( ) 2507.010.66 raf RP+=ε (15)
where:
⎪E*⎪ = dynamic modulus, ksi
f = loading frequency, Hz
fr = reduced frequency, Hz
T = temperature, °K
εaf = allowable tensile strain of full healing, μstrain
RPr = reduced rest period at 20 °C, sec
Allowable Strains Allowable strains at the bottom of the asphalt layer are determined from Equation 15 using
reduced rest periods that depend on the traffic volume and the monthly pavement temperature.

30
Mean monthly pavement temperatures can be estimated from the mean monthly air temperature
using Equation 16 (26).
64
344
11 ++
−⎟⎠⎞
⎜⎝⎛
++=
zzMM ap (16)
where:
Mp = mean monthly pavement temperature at depth z, °F
Ma = mean monthly air temperature, °F
z = depth, in
For a 20 year design traffic of 1 x 10⁸ ESAL, the rest period is 6.3 sec. The reduced rest period
for each month is determined from Equation 12 using the shift factors from the dynamic modulus
master curve and the mean monthly pavement temperature. Table 8 summarizes the computation
of the allowable strains. Because the reduced rest period is much shorter during cold months
compared to warm months, the allowable strain levels for full healing are significantly lower.
Table 8. Computation of Allowable Strain Strains.
Month
Mean Monthly Pavement Temp, C
Log (AT)
Rest Period, sec
Reduced Rest Period, sec
Allowable Strain Level, μstrain
Jan 5.5 1.851 6.3 0.09 67 Feb 7.3 1.611 6.3 0.15 68 Mar 12.2 0.971 6.3 0.67 75 Apr 18.0 0.242 6.3 3.61 97 May 23.7 -0.445 6.3 17.56 137 Jun 29.0 -1.065 6.3 73.20 194 Jul 32.0 -1.397 6.3 157.26 235 Aug 30.9 -1.276 6.3 118.95 219 Sep 26.8 -0.803 6.3 40.04 167 Oct 19.7 0.036 6.3 5.79 107 Nov 13.8 0.773 6.3 1.06 79 Dec 8.4 1.469 6.3 0.21 69

31
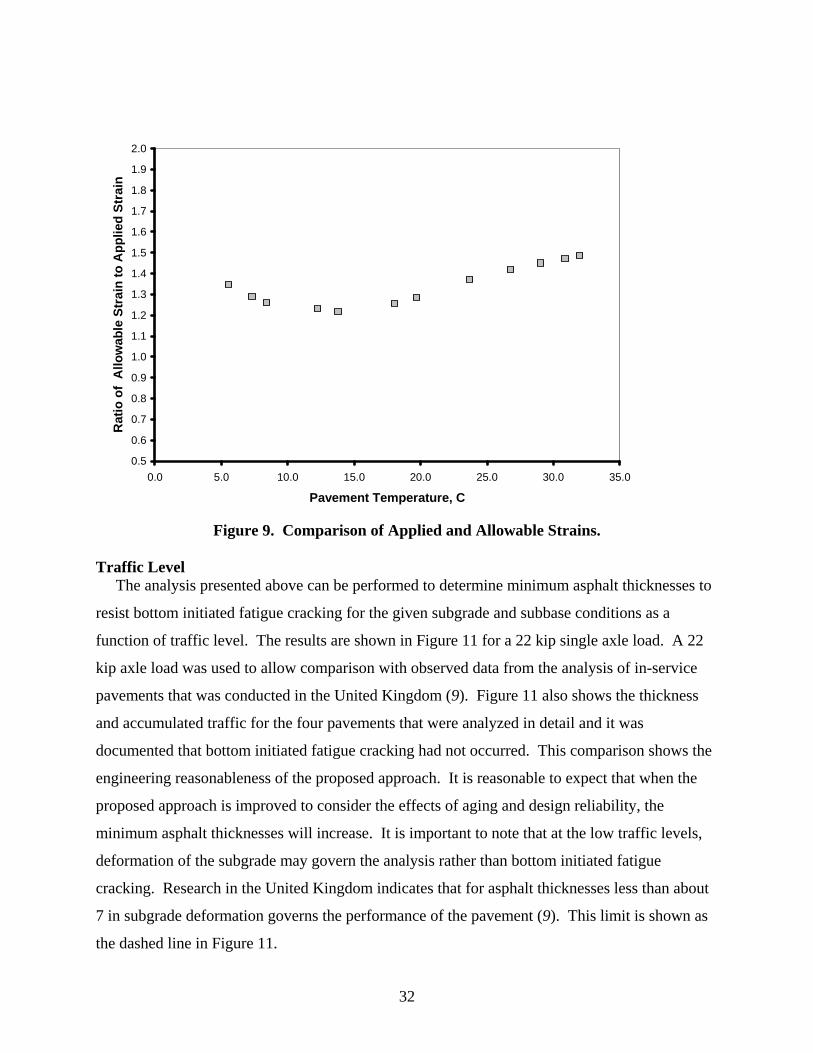
Applied Strains The strains applied by the traffic loading are computed for the design axle load using layered
elastic analysis. In this example an 18 kip single axle load was used for computing applied
strains. For this example the modulus of the subgrade and subbase are constant at 4.5 and 25 ksi,
respectively. The modulus of the asphalt depends on the pavement temperature and the speed of
traffic. Recent research by Al-Qadi, et. al, using in-situ instrumentation at the Virginia Smart
Road (27) indicates that loading rates computed by the transformed section analysis in the
MEPDG and other approaches such as that recommended by Barksdale (28) overestimate the
frequency of the load pulse. Based on data presented by Al-Qadi, a loading rate of 16 Hz
appears reasonable for a depth of 9 in under 45 mph traffic. Table 10 summarizes the applied
strains for each month computed using the KENLAYER software (26). The applied strains are
compared to the allowable strains in Figure 10. Since the applied strains in Table 9 are less than
the allowable strains, the proposed section is acceptable with respect to bottom initiated fatigue
cracking. An interesting observation in Figure 10 is that this analysis shows that the critical
condition for bottom initiated fatigue cracking occurs at intermediate to low pavement
temperatures, which is in contrast with traditional cumulative or incremental damage analyses,
which show that the majority of the fatigue damage occurs at high pavement temperatures.
Table 9. Applied Strains for Design Example.
Month
Mean Monthly Pavement Temp, C
Log (AT)
Load Frequency, Hz
Reduced Frequency, Hz
AC Modulus, ksi
Subbase Modulus, ksi
Subgrade Modulus, ksi
Applied Strain, μstrain
Jan 5.6 1.841 16 1108.93 1969.7 25 4.5 51Feb 7.5 1.584 16 614.01 1858.0 25 4.5 54Mar 12.8 0.900 16 127.08 1535.8 25 4.5 62Apr 19.0 0.122 16 21.21 1148.4 25 4.5 77May 25.1 -0.608 16 3.95 801.7 25 4.5 100Jun 30.8 -1.265 16 0.87 535.6 25 4.5 133Jul 33.9 -1.616 16 0.39 418.2 25 4.5 157Aug 32.8 -1.488 16 0.52 458.9 25 4.5 148Sep 28.4 -0.987 16 1.65 641.1 25 4.5 117Oct 20.8 -0.096 16 12.83 1041.1 25 4.5 83Nov 14.4 0.688 16 78.05 1431.1 25 4.5 65Dec 8.7 1.432 16 432.33 1789.1 25 4.5 55
32
0.5
0.6
0.7
0.8
0.9
1.0
1.1
1.2
1.3
1.4
1.5
1.6
1.7
1.8
1.9
2.0
0.0 5.0 10.0 15.0 20.0 25.0 30.0 35.0
Pavement Temperature, C
Rat
io o
f A
llow
able
Str
ain
to A
pplie
d St
rain
Figure 9. Comparison of Applied and Allowable Strains.
Traffic Level The analysis presented above can be performed to determine minimum asphalt thicknesses to
resist bottom initiated fatigue cracking for the given subgrade and subbase conditions as a
function of traffic level. The results are shown in Figure 11 for a 22 kip single axle load. A 22
kip axle load was used to allow comparison with observed data from the analysis of in-service
pavements that was conducted in the United Kingdom (9). Figure 11 also shows the thickness
and accumulated traffic for the four pavements that were analyzed in detail and it was
documented that bottom initiated fatigue cracking had not occurred. This comparison shows the
engineering reasonableness of the proposed approach. It is reasonable to expect that when the
proposed approach is improved to consider the effects of aging and design reliability, the
minimum asphalt thicknesses will increase. It is important to note that at the low traffic levels,
deformation of the subgrade may govern the analysis rather than bottom initiated fatigue
cracking. Research in the United Kingdom indicates that for asphalt thicknesses less than about
7 in subgrade deformation governs the performance of the pavement (9). This limit is shown as
the dashed line in Figure 11.

33
0
2
4
6
8
10
12
14
16
1.0E+05 1.0E+06 1.0E+07 1.0E+08 1.0E+09 1.0E+10
20 Year Design Traffic, 22 kip ESAL
Min
imum
Asp
halt
Thic
knes
s, in
UK Pavements With No Bottom Initiated Fatigue Cracking
Minimum Asphalt Thickness for StructuralDeformation
Figure 10. Example of Minimum Asphalt Thicknesses to Resist Bottom Initiated Fatigue Cracking With Observed Performance of Four UK Pavement Sections.
Aging
The example presented above does not consider the important effect of aging on either the
applied or allowable strains. As a pavement ages, the modulus of the HMA will increase due to
the increased stiffness of the asphalt binder resulting in lower applied strains. Aging will also
affect the healing rate for the HMA. Although no data is currently available for the effect of
aging on the healing rate, it is reasonable to expect that the healing rate will decrease
significantly on aging resulting in lower allowable strains for full healing. Early research on
healing by Bonnaure, et. al (24) showed that healing rates were much greater in softer binders.
The effect of aging can be incorporated in the procedure outlined above, by computing allowable
and applied strains as a function of pavement age. The global aging model currently
incorporated in the MEPDG provides a method for computing aged modulus values (29).
Additional research proposed in the laboratory studies discussed in Task D will be required to
develop a model of the effect of aging on HMA healing and the allowable strains that result in

34
full healing. For perpetual pavement design, it may only be necessary to perform the analysis for
highly aged conditions.
Climate and Mixed Traffic Effects
The MEPDG currently provides excellent capabilities to evaluate the effects of climate and
mixed traffic on the applied strains at the bottom of the asphalt layer. This capability can be
used with the allowable strains described above to determine the HMA thickness needed to resist
bottom initiated fatigue cracking.
Reliability
Because the computations involved in the analysis do not require substantial computer time,
reliability can be included in the analysis using Monte-Carlo simulation. This approach has
already been implemented in the PerRoad program (15). In fact, the allowable strains computed
based on rest periods can be input as the threshold criteria for HMA the in the PerRoad program
and the analysis for a single season can be performed.
Subtask B.1 Review Selected Literature
The preceding section presented a rational approach for incorporating an endurance limit for
bottom initiated fatigue cracking in mechanistic-empirical pavement design methods. The
method is based on maintaining tensile strain levels at the bottom of the HMA low enough to
ensure that complete healing occurs between traffic loads and that there is no accumulation of
damage at the bottom of the asphalt concrete. This is accomplished through the use of allowable
strain levels that depend on the damage and healing properties of the HMA, the aging
characteristics of the HMA, the duration of rest periods between traffic loads, and the
temperature of the pavement. Several improvements to this preliminary procedure should be
made based on a detailed review of selected literature. These improvements should be made
before the detailed laboratory testing plans are developed in Task D. Areas where improvements
should be considered are summarized below:
Duration of Rest Periods. In the preliminary procedure a very simple approach was
used to estimate the duration of rest periods as a function of design traffic level.
35
Additional effort should be expended to establish representative rest period durations as a
function of traffic level and roadway classification. Potential sources of information on
the duration of rest periods include: the Highway Capacity Manual (30), data from traffic
studies performed for the Long Term Pavement Performance Program (31), and the
approach used in Strategic Highway Research Program (SHRP) Contract 005 (32).
MEPDG Modifications. It is envisioned that the design procedure will be implemented
in the MEPDG. Because the MEPDG is an AASHTO product, any proposed changes,
including research versions of the software, must be approved by AASHTO. AASHTO
has approved a research version of the software for use in NCHRP 9-30A. It is
envisioned that similar approval will be granted for this project.
A detailed review of the documentation and source code for the MEPDG will be required
to determine specific modifications that will be needed to implement the approach. This
review should concentrate on how the MEDPG addresses the following:
1. Climatic effects,
2. Mixed traffic (Currently hourly traffic distribution factors are not included in
any flexible pavement analysis, they are only considered for the rigid
pavement analysis. It may be necessary to tie daily truck traffic distributions
to temperature distributions to accurately consider the effect of healing),
3. Vehicle speed effects,
4. Vehicle wander (Currently being considered for revision under NCHRP
Project 9-30A),
5. Location of maximum strain at the bottom of the asphalt layer for various axle
configurations,
6. Aging, and
7. Reliability.

36
The MEPDG source code should also be reviewed to determine how to remove the
current bottom initiated fatigue cracking algorithm and implement the allowable strain
approach.
Since the major new component of the design procedure is the determination of allowable
strain levels that provide for complete healing between traffic loads, completed research on
healing in HMA should be reviewed before finalizing the laboratory testing program. Several
important publications addressing healing in HMA that should be reviewed are listed at the end
of the Task 2 work description.
Subtask B.2 Finalize Preliminary Approach
In this Subtask, the preliminary design procedure described in this research plan will be
improved based on the findings from the literature review conducted in Subtask B.1. The
improved procedure will then be implemented in a research version of the MEPDG software,
designated NCHRP9-44A_Version 0.1. The products of this subtask will be detailed
documentation of the preliminary procedure and a modified research version of the MEPDG
software. The documentation and software will be submitted as part of the first interim report
that is scheduled for delivery during the 7th month of the project.
Subtask B.3 Incorporate Findings from Laboratory Studies
In Subtask B.3, the preliminary procedure and software developed in Subtask B.2 will be
improved by adding the results from the laboratory studies conducted in Task D. The laboratory
studies are envisioned to result in the following improvements:
1. Verification that time-temperature superposition can be applied to HMA rest periods.
This is an assumption that has been included in the preliminary procedure described
in this research plan.
2. Verification that healing in HMA is not affected by the strain level provided the
strains are low enough that macrocracking does not occur.
3. Testing and data analysis procedures for determining mixture specific allowable
strains levels for HMA. Under the current hierarchical structure of the MEPDG, this
testing and analysis will be used in Level 1 analyses.

37
4. A model for estimating allowable strain levels as a function of mixture composition,
binder properties, and age. This model will be used for Level 2 and Level 3 analyses,
and for the analysis of pavement sections to be completed in Task E. Von Quintus
(19, 20) developed a model to estimate the allowable strain levels at which no
damage is retained in the HMA mixtures. It is estimated from the indirect tensile
strength test, and is dependent on the mixture composition. Healing within this
approach is captured through field calibration factors. A similar type of approach is
expected for this research plan, but using healing directly.
The products of this subtask will be detailed documentation of the improved procedure and a
modified research version of the MEPDG software designated NCHRP9-44A_Version 0.2 that
will be used in Subtask E.3 for the analysis of selected accelerated pavement test and test road
sections. This documentation and software will be further improved in Subtask B.4.
Subtask B.4 Modify Approach Based on Analysis of Accelerated Pavement Tests
In Subtask B.4, the improved procedure developed in Subtask B.3 will be further improved
based on the analysis of selected accelerated pavement test and test road sections. The
accelerated pavement test and test road sections will be selected in Subtask E.1 to exercise
critical aspects of the design procedure. For example, the fatigue tests conducted at the FHWA
Pavement Testing Facility provide data addressing the effect of temperature on HMA fatigue and
healing. These field tests provide the ability to investigate time-temperature superposition as
applied to rest periods. The structural sections from the NCAT test track provide data addressing
the effect of thickness on HMA fatigue, while the WesTrack sections provide data on the effect
of HMA material properties on fatigue. In all three cases, the applied strains should exceed the
allowable strains for full healing. On the other hand, the original sections from the NCAT test
track that are still in-service, should have applied strains that are below the allowable strains for
full healing.
The products of this subtask will be detailed documentation of the improved procedure and a
modified research version of the MEPDG software designated NCHRP9-44A_Version 0.3 that
will be used in Subtask E.5 for the analysis of selected in-service pavement test sections. The

38
documentation and software will be submitted as part of the fourth interim report that is
scheduled for delivery during the 30th month of the project.
Subtask B.5 Prepare Final Design Procedure
The final subtask in Task 2 is the preparation of the final design procedure. This will be
accomplished after analysis of the in-service pavement calibration sections is completed in
Subtask E.5. It is envisioned that design reliability will be the primary effort addressed in this
final version of the design procedure.
The products of Subtask B.5 will be detailed documentation of the final procedure and a
modified research version of the MEPDG software designated NCHRP9-44A_Version 1.0. The
documentation and software will be submitted as part of the draft final report that is scheduled
for delivery during the 45th month of the project.
Task B Milestones
Table 10 summarizes the major milestones for Task B. These are all associated with
improvements to the preliminary design procedure described in this research plan, and the
development of various modified research versions of the MEPDG software.
Table 10. Major Task B Milestones.
Milestone Description Months After
Contract Award B.1 Review Selected Literature 3 B.2 Preliminary Approach and NCHRP 944A_Version 0.1 Software 6 B.3 Incorporate Findings from Laboratory Studies into NCHRP 9-
44A_Version 0.2 Software 27
B.4 Modify Approach Based on Analysis of Selected Accelerated Pavement Tests and NCHRP 9-44A_Version 0.3 Software
29
B.5 Prepare Final Design Procedure and NCHRP 9-44A_Version 1.0 Software
41
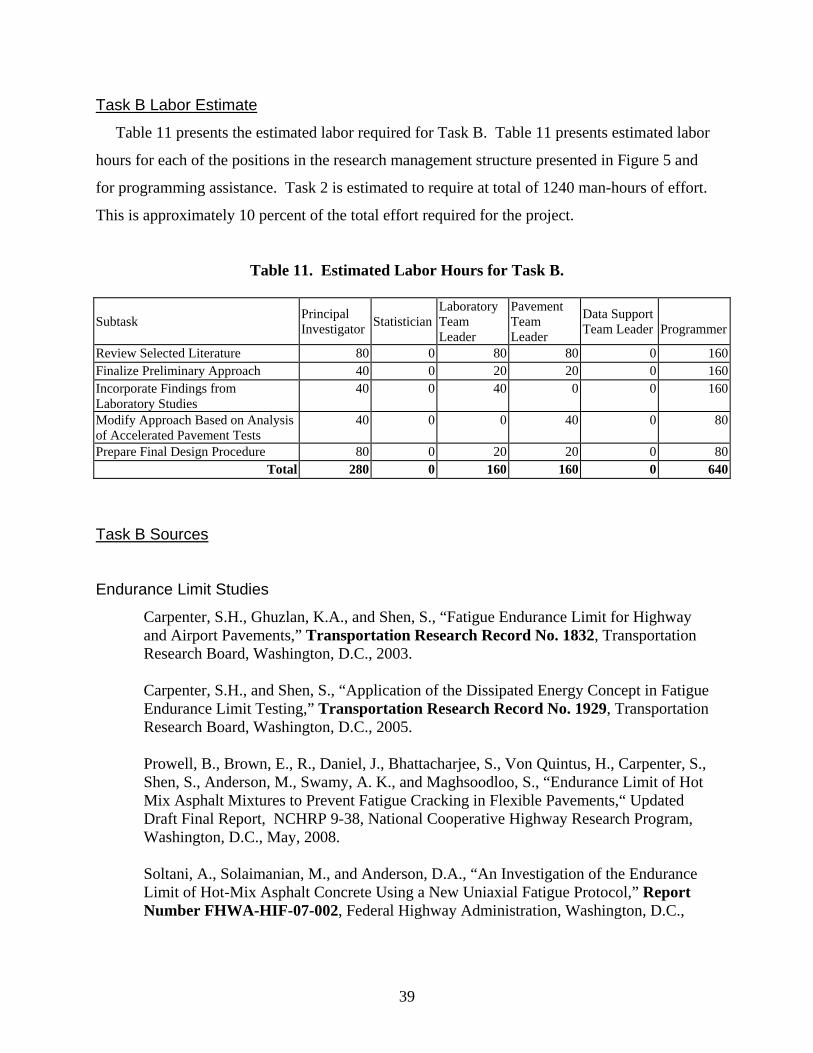
39
Task B Labor Estimate
Table 11 presents the estimated labor required for Task B. Table 11 presents estimated labor
hours for each of the positions in the research management structure presented in Figure 5 and
for programming assistance. Task 2 is estimated to require at total of 1240 man-hours of effort.
This is approximately 10 percent of the total effort required for the project.
Table 11. Estimated Labor Hours for Task B. Subtask Principal
Investigator StatisticianLaboratory Team Leader
Pavement Team Leader
Data Support Team Leader
Programmer
Review Selected Literature 80 0 80 80 0 160Finalize Preliminary Approach 40 0 20 20 0 160Incorporate Findings from Laboratory Studies
40 0 40 0 0 160
Modify Approach Based on Analysis of Accelerated Pavement Tests
40 0 0 40 0 80
Prepare Final Design Procedure 80 0 20 20 0 80Total 280 0 160 160 0 640
Task B Sources
Endurance Limit Studies
Carpenter, S.H., Ghuzlan, K.A., and Shen, S., “Fatigue Endurance Limit for Highway and Airport Pavements,” Transportation Research Record No. 1832, Transportation Research Board, Washington, D.C., 2003. Carpenter, S.H., and Shen, S., “Application of the Dissipated Energy Concept in Fatigue Endurance Limit Testing,” Transportation Research Record No. 1929, Transportation Research Board, Washington, D.C., 2005. Prowell, B., Brown, E., R., Daniel, J., Bhattacharjee, S., Von Quintus, H., Carpenter, S., Shen, S., Anderson, M., Swamy, A. K., and Maghsoodloo, S., “Endurance Limit of Hot Mix Asphalt Mixtures to Prevent Fatigue Cracking in Flexible Pavements,“ Updated Draft Final Report, NCHRP 9-38, National Cooperative Highway Research Program, Washington, D.C., May, 2008. Soltani, A., Solaimanian, M., and Anderson, D.A., “An Investigation of the Endurance Limit of Hot-Mix Asphalt Concrete Using a New Uniaxial Fatigue Protocol,” Report Number FHWA-HIF-07-002, Federal Highway Administration, Washington, D.C.,

40
HMA Healing Studies
Bonnaure, F.P, Huibers, A.H.J.J., Boonders, A., “A Laboratory Investigation of the Influence of Rest Periods on the Fatigue Response of Bituminous Mixes,” Proceedings, Association of Asphalt Paving Technologists, Vol. 51, 1982. Carpenter, S.H., and Shen, S., “Application of the Dissipated Energy Concept in Fatigue Endurance Limit Testing,” Transportation Research Record No. 1929, Transportation Research Board, Washington, D.C., 2005.
Kim, B. and Roque, R., “Evaluation of Healing Property of Asphalt Mixtures,” Transportation Research Record No. 1970, Transportation Research Board, Washington, D.C., 2006. Kim, Y.R., Little, D.N., and Benson, F.C., “Chemical and Mechanical Evaluation of Healing of Asphalt Concrete, Journal of the Association of Asphalt Paving Technologists, Vol. 59, 1990. Little, D. N., Lytton, R. L., Williams, D., and Chen, C. W., “Microdamage Healing in Asphalt and Asphalt Concrete, Volume I: Microdamage and Microdamage Healing Project Summary Report,” Report Number FHWA-RD-98-141, Federal Highway Administration, Washington, D.C., June 2001. Pronk, A.C., “Partial Healing, “A New Approach for the Damage Process During Fatigue Testing of Asphalt Specimens,” Asphalt Concrete Simulation, Modeling, and Experimental Characterization, Geotechnical Special Publication No. 146, American Society of Civil Engineers, Reston, VA, 2005.
MEPDG
National Cooperative Highway Research Program, http://www.trb.org/mepdg/guide.htm (accessed June 30, 2008).
Rest Periods
Hajek, J. J., Selezneva, O., I., Mladenovic, G., and Jiang, Y., J., “Estimating Cumulative Traffic Loads, Volume II: Traffic Data Assessment and Axle Load Projection for the Sites With Acceptable Axle Weight Data, Final Report for Phase 2,” Report Number FHWA-RD-03-094, Federal Highway Administration, Washington, D.C., March, 2005. Lytton, R L; Uzan, J; Fernando, E G; Roque, R; Hiltunen, D; Stoffels, S M, “Development And Validation Of Performance Prediction Models And Specifications For Asphalt Binders And Paving Mixes,” Report Number SHRP-A-357, Strategic Highway Research Program, Washington, D.C., 1993.
41
Transportation Research Board, Highway Capacity Manual, Special Report 209, Third Edition, Transportation Research Board, Washington, DC 1994.
Task C. Database Management Task C includes the development and management of a database to store and analyze data
generated in Task D, Laboratory Testing, and Task E, Analysis of Pavement Sections. It is
envisioned that the database will be an adaptation of the one developed in NCHRP Project 9-30.
Task C has been divided into three subtasks:
C.1 Develop a Plan to Use the NCHRP 9-30 Database
C.2 Develop Needed Tables,
C.3 Input and Manage Data Each of these subtasks are described in detail below. Subtask C.1 Develop a Plan to Use the NCHRP 9-30 Database
In NCRHP Project 9-30 a database called M-E Distress Prediction Models (M-E_DPM) was
developed to provide an appropriate database structure for storing all HMA pavement data
required for the continued improvement of mechanistic-empirical pavement distress prediction
models (33). It was envisioned that this database would serve future mechanistic-empirical
development efforts such as the HMA Endurance Limit Validation Study. Consequently, M-
E_DPM was designed to be flexible to accommodate changes in models and test procedures.
The database was developed in Microsoft Access to take advantage of the standard and custom
features available for entering and storing data, querying data, and generating reports. It consists
of three parts that are briefly described below:
• Descriptive Database. This part of the database includes text files that document
details for the data included in the model inputs portion of the database. This part of
the database provides the flexibility to define the new type of data that will be needed
in the HMA Endurance Limit Validation Study.
• Model Inputs. This part of the database includes the data required to execute the
mechanistic-empirical models. The data are contained in tables that define (1)

42
pavement structure, (2) material properties, (3) traffic, and (4) climate. For the HMA
Endurance Limit Validation Study new material properties associated with the
allowable strain levels for full healing will be required.
• Performance Data. This part of the database includes various measures of pavement
distress including (1) area of alligator cracking, (2) longitudinal cracking, (3)
transverse cracking, (4) rutting, (5) smoothness, and (6) other distresses such as
potholes and the extent of patching. Additional detail concerning the performance
data will be required by the Endurance Limit Validation Study to differentiate
bottom-initiated cracking from surface initiated cracking.
In Subtask C.1, the current version of M-E_DPM and its documentation will be reviewed and
a plan will be developed for modifying this database for use in the analysis of the pavement
sections in Task E. M-E_DPM is currently being improved and additional data is being added in
NCHRP Project 9-30A. The key HMA property needed for the analysis approach described
earlier in this plan is the allowable strains for full healing, which will be a function of HMA
damage and healing properties, age, and climate. The laboratory experiments in Task D will
establish methods for measuring the HMA damage and healing properties and will develop
models for estimating these properties from mixture composition and binder properties that can
be easily measured on field cores. The required material property data tables will have to be
added to the model inputs portion of M-E_DPM. The extent of bottom-initiated fatigue cracking
will be the pavement distress needed for the analysis of the pavement sections. Only the extent
of surface cracking is currently contained in M-E_DPM; therefore, additional tables will be
needed to store this data. The data will be obtained from the crack coring operations described in
Task E.
A plan for storing the data from the Task D laboratory experiments will also be developed in
Subtask C.1. This will likely be a separate database that can be linked to M-E_DPM upon
completion of the analysis of the laboratory experiments and the development of the models and
procedures for computation of allowable strains for full healing.

43
Subtask C.2 Develop Needed Tables
In Subtask C.2, the various tables required to use M-E_DPM in the HMA Endurance Limit
Validation Study will be developed. Work in this task will be coordinated with the data
collection and analysis activities in Tasks 4 and 5.
Subtask C.3 Input and Manage Data
Data from the project will be entered into the database and managed in Subtask C.3. This
subtask includes entering the data, verifying the entered data, and extracting data in support of
the analyses that will be performed in Tasks 4 and 5 of the project. Subtask C.3 will be active
during the majority of the project.
Task C Milestones
Table 12 summarizes the major milestones for Task C. These are all associated with the
modification of M-E_DPM for use in this project. In addition to the major milestones listed in
Table 12, data entry and management will occur as needed from month 8 through the completion
of Tasks 3, 4, and 5 in month 41 of the project.
Table 12. Major Task C Milestones. Milestone Description Months After
Contract Award C.1 Database Plan 8 C.2 Tables for Laboratory Data 10 C.3 Tables for Analysis of Accelerated Pavement Tests 15 C.4 Tables for Analysis of In-Service Pavement Sections 23 C.5 Final Database 41
Task C Labor Estimate
Table 13 presents the estimated labor required for Task C. Table 13 presents estimated labor
hours for each of the positions in the research management structure presented in Figure 5 and
for programming/engineering assistance. Task C is estimated to require at total of 876 man-
hours of effort. This is approximately 6 percent of the total effort required for the project.

44
Table 13. Estimated Labor Hours for Task C.
Subtask Principal
Investigator StatisticianLaboratory Team Leader
Pavement Team Leader
Data Support Team Leader
Programmer/ Engineer
Develop Plan to Use NCHRP 9-30 Database
20 0 10 10 80 0
Develop Needed Tables 0 0 0 0 80 240Input and Manage Data 0 0 0 0 40 396
Total 20 0 10 10 200 636 Task C Sources
Von Quintus, H.L., Schwartz, C., McQuen, R., and Andrei, D., “Experimental Plan for Calibration and Validation of Hot-Mix Asphalt Performance Models for Mix and Structural Design,” Final Report for National Cooperative Highway Research Program Project 9-30, National Cooperative Highway Research Program, January, 2004. Quarterly Reports for NCHRP Project 9-30A.
Task D. Laboratory Studies In Task D a series of laboratory experiments addressing critical aspects of the allowable strain
limit design procedure described earlier in Task B will be designed and executed. Table 14
summarizes the laboratory experiments that are needed.
Experiment 1 is a screening study to identify the mixture compositional factors that affect
healing and therefore, the allowable strain levels in HMA. The results from this experiment will
be used in the remaining experiments. Experiment 2 addresses a major assumption that was
made in developing the allowable strain limit procedure that was described in Task 2. In this
experiment healing rates will be determined using different strain levels. This experiment will
be conducted on mixtures from Experiment 1 that have high and low healing rates. Experiment
3 is a study to verify the applicability of time-temperature superposition to healing in HMA.
This was the second major assumption included in the development of the allowable strain limit
procedure described in Task 2. Experiment 3 will be conducted on a mixture from Experiment 1
that exhibits a moderate healing rate. Testing and analysis methods for determining allowable
strain limits that result in complete healing will be developed in Experiment 4. This experiment

45
will include testing and analysis of selected mixtures from Experiment 1 and mixtures used in
the endurance limit testing completed in NCHRP 9-38. This experiment will generate the Level
1 test procedure for use with the modified version of the MEPDG. In the last experiment,
Experiment 5, a wide range of mixtures will be tested using the methods developed in
Experiment 4 to develop predictive models relating the allowable strain limits to mixture
compositional factors. This last experiment will generate the relationships between allowable
strain and easily measured mixture compositional properties that will be used in the analysis of
the pavement sections in Task E. These relationships will provide the Level 2 and 3 analysis for
the modified version of the MEPDG.
Table 14. Summary of Proposed Laboratory Experiments. Experiment Topic Factors
1 Mixture Compositional Factors Affecting Healing in HMA
• Binder Type • Binder Age • Effective Binder Content • Air Voids • Design Compaction • Gradation • Filler Content
2 Effect of Applied Strain on Healing
• Strain Level • Healing Rate From Experiment 1
3 Effect of Temperature and Rest Period Duration on Healing
• Temperature • Rest Period Duration
4 Development of Testing and Analysis Procedures to Determine Allowable Strain Levels
• Healing Rate From Experiment 1 • Mixtures From NCHRP 9-38
5 Estimation of Allowable Strain Levels from Mixture Composition
• Mix Compositional Factors Affecting Damage Accumulation
• Significant Factors From Experiment 1 • Temperature • Rest Period Duration
For each experiment, detailed laboratory work plans will be prepared based on the experiment
descriptions and preliminary designs in this research plan and the results from completed
experiments. The experiments will then be executed and the resulting data analyzed. Pertinent
interim findings from the laboratory studies will be included in the quarterly progress reports.
The laboratory testing and analysis will be fully documented in the third interim report that will

46
be submitted at the end of the 22nd month of the project. The five experiments are described in
greater detail below.
Subtask D.1 Experiment 1: Mixture Compositional Factors Affecting Healing in HMA
Experimental Design
Past studies of healing in HMA have assumed that only the properties of the binder affect the
healing characteristics of the mixture (7, 24, 34). Experiment 1 is a screening study that will use
an appropriate statistical design to verify or refute this assumption and to identify mixture
compositional factors affecting healing in HMA that should be included in Experiment 5.
Experiment 1 is based on a Plackett-Burman experimental design. This is a specific type of
partial factorial experiment that can simultaneously assess the effect of multiple factors with a
limited amount of testing. It is routinely used in ruggedness testing to quickly assess the effect
of a number of controllable test factors. ASTM E 1169 presents detailed information on the
design and analysis of Plackett-Burman experiments. Inherent to this type of statistical design is
the assumption that the effect of each of the factors on the result is independent. Therefore, the
observed effect resulting from simultaneous variation of several factors is simply the sum of the
individual effects. Since screening experiments are concerned with identifying significant
effects and not necessarily the form of the effect, each factor is evaluated at only two levels.
Replication is included in the experiment to estimate the variance of a single measurement.
A Plackett-Burman design with replication to simultaneously evaluate 7 factors requires only
16 tests, two for each of the specific combinations shown in Table 15. The seven factors are
designated by letters A through G. A “+” indicates high levels for the factors while a “-“
indicates low levels. Thus, determination 1 will be made with factors A, B, C and E at high
levels, and factors D, F, and G at low levels. The order of the tests should be randomized within
each replication of the experiment. ASTM E1169 describes designs for other numbers of factors.

47
Table 15. Design for a Two Level, Seven Factor Plackett-Burman Experiment.
Factor Determination A B C D E F G
1 + + + - + - - 2 - + + + - + - 3 - - + + + - + 4 + - - + + + - 5 - + - - + + + 6 + - + - - + + 7 + + - + - - + 8 - - - - - - -
Selection of Factors
The selection of factors for Experiment 1 was based on a review of literature concerning
fatigue damage and healing in HMA. The factors are discussed individually below.
Binder Type. Several studies of fatigue and healing in HMA have shown that binder
properties affect the fatigue response of the mixture (35). The Shell fatigue equation is,
perhaps, the earliest example (36). It included the penetration index, which was an early
measure of the rheology of the binder. Research into healing that has been conducted at
the Texas Transportation Institute has shown that the properties of the binder affect
healing (34).
Less information is available on the effect of polymer modification on the fatigue and
healing characteristics HMA. Using continuum damage analysis, Lee, et. al
demonstrated better fatigue resistance for mixtures incorporating SBS modified binders
(37). Recent research on healing conducted at the University of Illinois using one neat
and one polymer modified binder showed the mixture with the polymer modified binder
had improved healing characteristics compared to the mixture with the neat binder (7). In
both of these studies, the neat and polymer modified binders were different grades.
Clearly, Experiment 5 will have to include a wide variety of binders, both neat and
modified, from different sources. In an attempt to better quantify the effect of polymer
48
modification on healing, Experiment 1 will use two binders from the same source having
the same performance grade, one neat and one modified with styrene butadiene styrene
(SBS). The recommended binders are neat PG 70-22 and a modified PG 70-22 produced
by adding SBS polymer to neat PG 58-28 binder obtained from the same refinery as the
neat PG 70-22.
Binder Aging. It is generally assumed by pavement and materials engineers that binder
aging has a detrimental effect on the fatigue life of asphalt mixtures. With this in mind, it
is interesting that only one study was identified where the effect of binder aging on
laboratory fatigue results was directly evaluated (38). In most laboratory fatigue studies,
unaged or short-term aged binders of different consistencies were used, and the results
generalized to describe the effect of mixture stiffness on fatigue life. The general
conclusions drawn from these studies that used relatively unaged binders are (35):
1. For continuous, controlled stress flexural testing, which is typically associated
with thick asphalt pavements, laboratory fatigue life increases with increasing
mixture stiffness.
2. For continuous, controlled strain flexural testing, which is typically associated
with thin asphalt pavements, laboratory fatigue life decreases with increasing
mixture stiffness.
3. When the results from either controlled stress or controlled strain flexural tests are
used in a mechanistic-empirical analysis of pavements with 6 or more inches of
asphalt, the predicted fatigue life increases with increasing mixture stiffness.
These conclusions imply that binder aging improves the fatigue life of pavements with
relatively thick asphalt layers. Because unaged and short-term aged binders were used in
these studies, the important effect of binder embittlement was not included in the
analysis. As asphalt binders age, they become, not only stiffer, but also more brittle due
to oxidation.

49
Recently, researchers at the Texas Transportation Institute performed controlled strain
flexural fatigue testing on compacted specimens from two mixtures that were aged for 0,
3, and 6 months at 60 °C (38). Three months of aging at 60 °C simulates 3 to 6 years of
field service for Texas conditions while 6 months of aging simulates 6 to 12 years of field
service (38). The loose mix for all specimens was short-term oven aged for 4 hours at
135 °C prior to compaction. Fatigue lives were 25 percent shorter for specimens aged for
three months, and 50 percent shorter for specimens aged for six months (38). The study
also included direct tension strength tests. In these tests strength increased while the
strain at failure decreased with increased aging, confirming that the mixtures become
stiffer and more brittle on aging (38). Aged, brittle mixtures would be expected to have
significantly poorer healing characteristics compared to unaged, ductile mixtures.
Short-term and long-term aged mixtures will be included in Experiment 1. The short-
term aging will be done for 4 hours at 135 °C as specified in AASHTO R30 for mixture
performance testing. The long-term aged specimens will be oven aged for 120 hours at
85 °C in accordance with AASHTO R30. Since the effects of aging are binder specific,
preliminary dynamic modulus and tensile strength tests should be conducted to ensure
that the selected binders exhibit significant stiffening and embrittlement as a result of the
laboratory, long-term aging process.
Effective Binder Content. Models for predicting the fatigue life of asphalt concrete
based on the results of continuous laboratory fatigue tests all indicate that fatigue life
increases as the mixture becomes increasingly rich in asphalt binder (39). These models
use either the effective volumetric binder content of the mixture, VBE, or voids filled
with asphalt, VFA, to indicate the richness of the mixture. Binder content effects have
not been included in past studies of healing in asphalt concrete.
It is reasonable to expect that richer mixtures may have improved healing characteristics,
resulting in improved fatigue lives, and higher allowable strains for complete healing.
Binder content will, therefore, be one of the factors included in Experiment 1.
Volumetric design procedures for asphalt mixtures set minimum limits for the effective
binder content of the mixture. These limits depend on the nominal maximum aggregate

50
size; increasing with decreasing nominal maximum aggregate size. Since this project is
concerned with fatigue cracking that initiates at the bottom of the asphalt layer, a typical
25 mm base course mixture will be used. The minimum effective binder content for 25
mm mixtures in AASHTO M323 is 8.0 percent by volume. The recommended
production tolerance for asphalt content in ASTM D 3535 is ± 0.5 percent by weight,
which is approximately ± 1 percent for the effective binder content by volume. These are
reasonable ranges for use in Experiment 1.
Air Voids. Nearly all laboratory fatigue studies have found the air void content of the
mixture to be a significant factor affecting mixture fatigue life (35, 39). Fatigue life
decreases with increasing air voids. It is reasonable to expect that air voids will also have
a significant effect on healing in asphalt concrete mixtures. Based on typical compaction
specifications, specimen air void contents of 4 and 8 percent will be included in
Experiment 1.
Design Compaction. An interesting finding in NCHRP Report 567, Volumetric
Requirements for Superpave Mix Design, is that the fatigue life of asphalt concrete
mixtures is significantly affected by the design compaction level; increasing as the design
gyration level increases (39).
Design compaction level was included in Experiment 1 to determine if healing properties
of asphalt mixtures are affected by the design compaction level. Considering the current
design compaction levels in AASHTO R35, the recommendations in NCHRP Report
573, Superpave Mix Design: Verifying the Gyration Levels in the Ndesign Table (40) and
approximate equivalencies between Marshall and gyratory compaction (39), design
gyration levels of 65 and 100 will be used in Experiment 1.
Gradation. The WesTrack project demonstrated that there is a difference in the fatigue
life of coarse-graded mixtures compared to fine-graded mixtures. Significantly more
cracking was observed in the coarse-graded mixture sections (41). Mixture gradation has

51
not been found to be a significant factor in fatigue models based on analysis of laboratory
test data.
As a result of the WesTrack experience, gradation was included in Experiment 1 to
determine if healing is different in coarse-graded compared to fine-graded mixtures. The
primary control sieve designation in AASHTO M323 will be used to distinguish between
coarse-graded and fine-graded mixtures. For 25 mm mixtures, the 4.75 mm sieve is the
primary control sieve and mixtures with less than 40 percent passing the 4.75 mm sieve
are considered coarse-graded.
Filler Content. Like aging, the effect of filler on the fatigue life of asphalt concrete has
not been systematically investigated. Currently, the influence of mineral filler on HMA
properties is being studied in NCHRP Project 9-45. The dust to binder ratio, defined as
the percent by weight passing the 0.075 mm sieve divided by the effective binder content
by weight of total mixture, is used in AASHTO M323 to control the filler content of
mixtures. A reasonable median value for the dust to binder ratio for design is 1.0. The
recommended production tolerance for the percent passing the 0.075 mm sieve in ASTM
D 3535 is ± 3.0 percent. This range is considered reasonable for Experiment 1.
Table 16 summarizes the factors and factor levels to be included in Experiment 1.
Experiment 1 requires the selection of a neat and polymer modified binder from the same source
and having the same performance grade, and the design of four 25 mm mixtures.
• 100 gyration coarse-graded
• 100 gyration fine-graded
• 65 gyration coarse-graded
• 65 gyration fine-graded
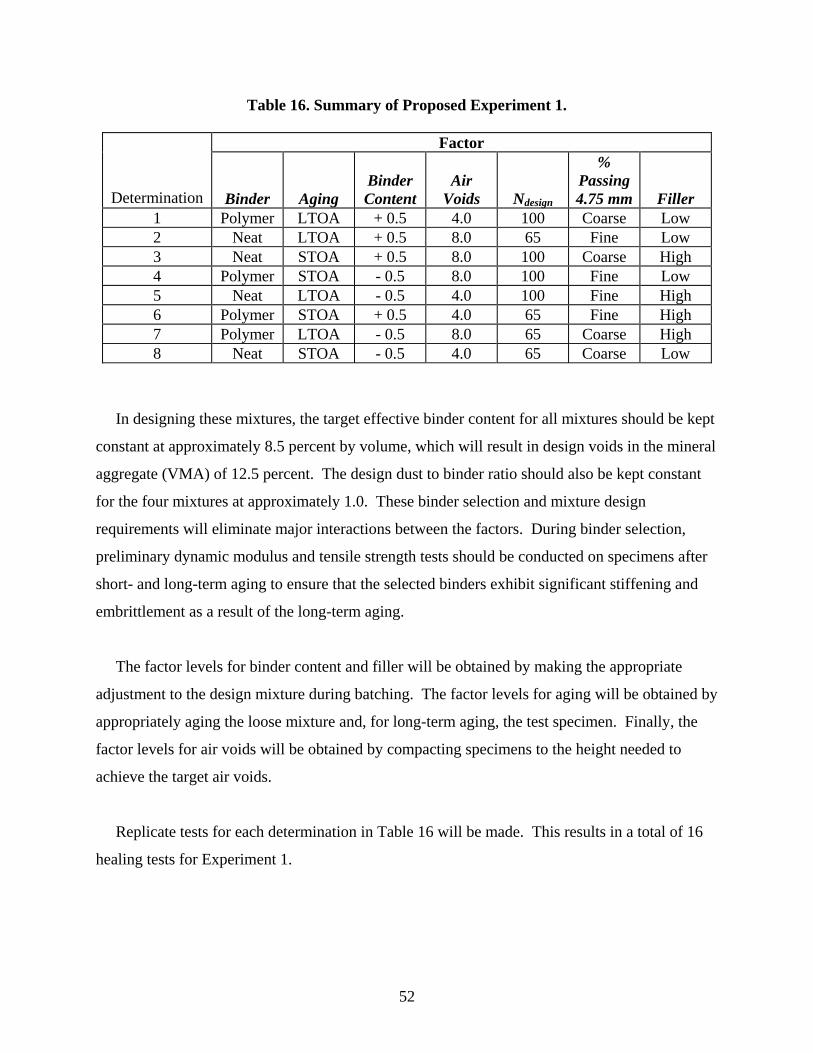
52
Table 16. Summary of Proposed Experiment 1.
Factor
Determination
Binder
Aging
Binder Content
Air
Voids
Ndesign
% Passing 4.75 mm
Filler 1 Polymer LTOA + 0.5 4.0 100 Coarse Low 2 Neat LTOA + 0.5 8.0 65 Fine Low 3 Neat STOA + 0.5 8.0 100 Coarse High 4 Polymer STOA - 0.5 8.0 100 Fine Low 5 Neat LTOA - 0.5 4.0 100 Fine High 6 Polymer STOA + 0.5 4.0 65 Fine High 7 Polymer LTOA - 0.5 8.0 65 Coarse High 8 Neat STOA - 0.5 4.0 65 Coarse Low
In designing these mixtures, the target effective binder content for all mixtures should be kept
constant at approximately 8.5 percent by volume, which will result in design voids in the mineral
aggregate (VMA) of 12.5 percent. The design dust to binder ratio should also be kept constant
for the four mixtures at approximately 1.0. These binder selection and mixture design
requirements will eliminate major interactions between the factors. During binder selection,
preliminary dynamic modulus and tensile strength tests should be conducted on specimens after
short- and long-term aging to ensure that the selected binders exhibit significant stiffening and
embrittlement as a result of the long-term aging.
The factor levels for binder content and filler will be obtained by making the appropriate
adjustment to the design mixture during batching. The factor levels for aging will be obtained by
appropriately aging the loose mixture and, for long-term aging, the test specimen. Finally, the
factor levels for air voids will be obtained by compacting specimens to the height needed to
achieve the target air voids.
Replicate tests for each determination in Table 16 will be made. This results in a total of 16
healing tests for Experiment 1.

53
Test Procedure
The objective of Experiment 1 is to identify the mixture compositional factors that affect
healing in asphalt concrete. To evaluate healing, a pulsed, strain controlled fatigue test must be
used. Either direct tension or flexural beam fatigue tests may be used, but the loading must be
such that a rest period is included after each load pulse. Figure 12 presents a schematic of the
required loading. The amount of healing that occurs will be evaluated by conducting fatigue
tests at 20 °C using two rest periods: 0 sec (continuous loading), and 3 sec. The modulus of the
specimen will be recorded for each load pulse. For each test, the accumulated damage in the
specimen will be determined from the ratio of the current modulus to the initial modulus. Figure
13 presents a schematic of the expected results when significant healing occurs.
Time
Stra
in
Rest Period
0.1 sec Pulse
Target Strain
Figure 11. Schematic of Pulsed, Strain Controlled Fatigue Loading.

54
0.0
0.1
0.2
0.3
0.4
0.5
0.6
0.7
0.8
0.9
1.0
0 2000 4000 6000 8000 10000 12000
Cycles
Dam
age
(1-E
*/E* I)
Continuous3 sec Rest Period
Healing
Figure 12. Expected Results When Healing is Significant.
The same strain level must be used for all specimens tested in Experiment 1. The strain level
should be selected to produce a high degree of damage, approximately 30 to 40 percent, in the
specimens after 10,000 cycles when tested with continuous loading. Fifty percent damage is
typically used as the failure criterion for controlled strain tests. A maximum of 10,000 cycles
was selected because tests using the 3 sec rest period will require approximately 8.6 hours to
complete. Selection of an appropriate strain level will require some initial trial and error testing
with selected combinations. For example, the combination of factors used in Determination 6 in
Table 16 (polymer modified binder, short-term aging, high binder content, low air voids) would
be expected to give low amounts of damage during the testing. On the other had, the
combination of factors used in Determination 7 (polymer modified binder, long-term aging, low
binder content, high air voids) would be expected to give high amounts of damage during the
testing. Initial testing with these combinations at various strain levels will be needed to select an
appropriate strain level for the testing.

55
Data Analysis
For Experiment 1, healing is defined as the difference in damage between continuous loading
and loading with 3 sec rest period at 30,000 cycles. Linear regression is an efficient method for
analyzing the resulting healing data. The healing can be fit to a linear model of the form:
ErrorXBXBXBXBXBXBXBBY ++++++++= 776655443322110 (17)
where:
Y = healing
Xi = seven factors included in the experiment
Bi = model coefficients
Error = model error
From this analysis, the statistical significance of the model coefficients can be used to determine
which factors affect healing in HMA. For statistically significant factors, the model coefficients
can be used to select appropriate factor levels to be used in other experiments. Combinations
yielding low, moderate, and high levels of healing in Experiment 1 will be used in Experiments
2, 3, and 4. Significant factors identified in Experiment 1 will be included in Experiment 5.
Subtask D.2 Experiment 2: Effect of Applied Strain on Healing
Experimental Design
One of the major assumptions that was made in developing the allowable strain limit design
approach described in Task 2 is that healing in HMA is independent of the applied strain level.
Early healing research provided some data supporting this assumption, but the testing was not
specifically designed to evaluate the effect of strain level (24).
In Experiment 2, the healing tests described for Experiment 1 will be conducted using three
different strain levels. Two different mixtures from Experiment 1 will be used: one exhibiting a
high amount of healing and one exhibiting a low amount of healing. All tests will be conducted
at 20 °C. The strain level used in Experiment 1 will be the medium strain level for Experiment
2. Tests at higher and lower strain levels will be added to complete the factorial. In selecting the
high strain level, it is important that the strain be such that macro-cracking does not occur during

56
the tests. Three replicates will be tested for each mixture. The experimental design is
summarized in Table 17.
Table 17. Strain Level Experiment.
Mixture Strain Level Replicates
Low 3 Medium 3 Low Healing
High 3 Low 3
Medium 3 High Healing High 3
Data Analysis
Analysis of variance will be used to analyze the data from Experiment 2. For each mixture a
one-way analysis of variance will be conducted. It is anticipated that this analysis will confirm
that healing in HMA is not significantly affected by the applied strain level, provided the strains
are low enough that macro-cracking does not occur.
Subtask D.3 Experiment 3: Effect of Temperature and Rest Period Duration on Healing
Experimental Design
The second major assumption that was made in developing the allowable strain limit design
approach described in Task 2 is that time-temperature superposition can be applied to the rest
periods to account for the effect of varying temperatures. The objective of Experiment 3 is to
confirm that this assumption is valid. Previous research on healing clearly showed that healing
effects were greater at higher temperatures (24). It is reasonable to expect that time-temperature
superposition will apply to rest period effects as it does for many other aspects of asphalt
material response. It is well known that time-temperature superposition is valid for measures of
binder and mixture stiffness. Time-temperature superposition is also an integral part of the
continuum damage approach to fatigue analysis that has become popular with a number of
researchers (42, 43, 44).

57
In Experiment 3, the healing tests described for Experiment 1 will be conducted using a
factorial of temperatures and rest period duration. A single mixture from Experiment 1, one
exhibiting a moderate amount of healing, will be used. Two replicates will be tested for each
mixture. The experimental design is summarized in Table 18. In addition to the healing tests
outlined in Table 18, dynamic modulus tests will be performed on replicate specimens at the
temperatures and frequencies listed in Table 19 to determine time-temperature shift factors for
the mixture. The dynamic modulus testing will be performed in accordance with NCHRP 9-29:
PT1, Determining the Dynamic Modulus and Flow Number for Hot Mix Asphalt (HMA) Using
the Simple Performance Test System (45).
Table 18. Experimental Design for Experiment 3.
Mixture Temperature, C Rest Period, sec Replicates 4 0 2 4 0.1 2 4 1 2 4 10 2
10 0 2 10 0.1 2 10 1 2 10 10 2 20 0 2 20 0.1 2 20 1 2 20 10 2 30 0 2 30 0.1 2 30 1 2 30 10 2 40 0 2 40 0.1 2 40 1 2
Moderate Healing
40 10 2

58
Table 19. Temperature and Frequency Combinations for Dynamic Modulus Tests.
Temperature, C Frequency, Hz 4 10 4 1 4 0.1 4 0.01
10 10 10 1 10 0.1 10 0.01 20 10 20 1 20 0.1 20 0.01 30 10 30 1 30 0.1 30 0.01 40 10 40 1 40 0.1 40 0.01
Data Analysis
The data analysis for Experiment 3 is somewhat more complicated than that for Experiments
1 and 2. First, time-temperature shift factors must be determined from the dynamic modulus
measurements. Then the time-temperature shift factors will be applied to the rest periods to shift
the measured healing data. If time-temperature superposition applies to the rest periods, then the
healing results will form a continuous function after shifting.
Dynamic Modulus Master Curve and Shift Factors
Equation 18 presents a modified version of the dynamic modulus master curve equation
included in the MEPDG that is appropriate for this analysis (46).
( )rfe
EE log
max
1
*log*log γβ
δδ ++
−+= (18)

59
where:
⎮E*⎮ = dynamic modulus
fr = reduced frequency, Hz
⎮E*⎮max = limiting maximum modulus
δ, β, and γ = fitting parameters
A second order polynomial can be used to describe the time-temperature shift factors:
[ ] 221 )()()(log TTaTTaTA RR −+−= (19)
where:
A(T) = time-temperature factor
T = test temperature
TR = reference temperature (normally 20 °C)
a1, a2 = fitting coefficients
The reduced frequency in Equation 18 is given by:
2
21 )()(loglog TTaTTaff RRr −+−+= (20)
where:
fr = reduced frequency at the reference temperature
f = loading frequency at the test temperature
Substituting Equation 20 into Equation 18 yields the final form of the dynamic modulus master
curve equation.
( )[ ]2
21 )()(logmax
1
*log*log
TTaTTaf RRe
EE
−+−+++
−+=
γβ
δδ (21)

60
The limiting maximum modulus, ⎮E*⎮max, in Equation 21 is estimated from mixture volumetric
properties using the Hirsch model (47) and a limiting binder modulus of 1 GPa (145,000 psi),
using Equations 22 and 23. Chirstensen and Anderson recommended 1 GPa as a reasonable
estimate of the glassy modulus for all asphalt binders (48).
⎥⎥⎥⎥
⎦
⎤
⎢⎢⎢⎢
⎣
⎡
+⎟⎠⎞
⎜⎝⎛ −
−+⎥
⎦
⎤⎢⎣
⎡⎟⎠
⎞⎜⎝
⎛+⎟
⎠⎞
⎜⎝⎛ −=
)(000,435000,200,4100
1
1000,10
000,435100
1000,200,4|*| max
VFAVMA
VMAPVMAxVFAVMAPE c
c (22)
where
58.0
58.0
)(000,435650
)(000,43520
⎟⎠⎞
⎜⎝⎛+
⎟⎠⎞
⎜⎝⎛ +
=
VMAVFA
VMAVFA
Pc (23)
⏐E*⏐max = limiting maximum mixture dynamic modulus, psi
VMA = Voids in mineral aggregates, %
VFA = Voids filled with asphalt, %
Using the limiting maximum modulus estimated from the volumetric properties of the test
specimens, the fitting coefficients (δ, β, γ, a1, and a2) are determined by numerical optimization
of Equation 21 using the measured modulus data. The optimization can be performed using the
Solver function in Microsoft EXCEL®. This is done by setting up a spreadsheet to compute the
sum of the squared errors between the logarithm of the average measured dynamic moduli at
each temperature/frequency combination and the values predicted by Equation 21.
( )∑∑ −=n
iiEEerror
1
22 *log*ˆlog (24)
where:
∑ 2error = sum of squared errors

61
n = number of temperature/frequency combinations used in the testing
log *E i = value predicted by Equation 20 for each
temperature/frequency combination
log *E i = logarithm of the average measured dynamic modulus for each
temperature/frequency combination.
The time-temperature shift factors are then determined from Equation 18 using the fitting
coefficients, a1 and a2, obtained from the numerical optimization.
Reduced Rest Period
Knowing the time-temperature shift factors from the dynamic modulus testing, the results of
the healing tests will be shifted according to Equation 25. If time-temperature superposition
applies to the rest periods, then the healing results will form a continuous function after shifting.
This is shown schematically in Figure 14.
( ) ( ) ( )TR ARPRP logloglog −= (25)
where:
RPR = duration of the rest period at the reference temperature, sec
RP = actual duration of the rest period, sec
AT = linear viscoelastic time temperature shift factor obtained from dynamic
modulus testing.

62
0
10
20
30
40
50
60
70
80
90
100
0.001 0.01 0.1 1 10 100 1000
Reduced Rest Period, sec
Hea
ling,
%
4 C10 C20 C30 C40 C
0
10
20
30
40
50
60
70
80
90
100
0.001 0.01 0.1 1 10 100 1000Reduced Rest Period, sec
Hea
ling,
%
4 C10 C20 C30 C40 C
a. Original Data
a. Shifted Data Figure 13. Schematic of Time-Temperature Superposition Applied to Rest Periods.
63
Subtask D.4 Experiment 4: Development of Testing and Analysis Procedures to
Determine Allowable Strain Levels
Possible Approaches
In Experiment 4, testing and analysis procedures for determining the allowable strain levels
will be developed. One approach, using flexural fatigue testing and the ratio of dissipated energy
change (RDEC) method was illustrated in the description of Task 2. A second approach based
on cyclic direct tension testing and continuum damage analysis is also possible. Brief
descriptions of these two approaches are presented below.
Ratio of Dissipated Energy Change
Recently a substantial amount of HMA fatigue research has been performed at the University
of Illinois (4, 5, 7). This research has concentrated on using the ratio of dissipated energy change
to describe the fatigue response of HMA. The basic premise of this research is that the change in
dissipated energy per cycle of loading is related to the growth of damage that occurs in HMA.
The dissipated energy for each cycle of loading is the area within the stress-strain hysteresis loop
generated for that cycle of loading. The ratio of dissipated energy change is defined as the
average change in dissipated energy between two cycles divided by the dissipated energy from
the first of the two cycles:
( )a
baa DEab
DEDERDEC×−−
=)(
(26)
where:
RDECa = ratio of dissipated energy change for cycle a
DEa = dissipated energy for cycle a
DEb = dissipated energy for cycle b
For a given mixture a plot of the ratio of dissipated energy change as a function of loading cycles
forms a broad “U” shape as shown in Figure 15. The ratio of dissipated energy change initially
decreases, then reaches a broad plateau, where a constant percentage of the input energy is being
converted to damage, then finally increases as the sample begins to fail. Because of the high
variability of the cyclic dissipated energy measurements due to the small amount of energy

64
dissipated in each cycle, statistical methods were developed to determine the plateau value (5).
Lower plateau values imply lower damage per cycle. The plateau value for a given mixture
depends on the mixture properties, the applied strain level, and the duration of rest periods.
Plateau values decrease with decreasing applied strain and increasing rest period duration (7).
The effect of mixture properties on the plateau value is not clear from the research that has been
completed to date. From tests on a number of mixtures, the University of Illinois researchers
also found a unique relationship between the plateau value and number of cycles to 50 percent
reduction in stiffness, the traditional definition of failure in constant strain fatigue tests (7).
Figure 14. Typical Plot of Ratio of Dissipated Energy Change Versus Loading Cycles (6).
( ) 1102.14429.0 −×= fNPV (27)
where:
PV = plateau value
Nf = number of cycles to 50 percent stiffness reduction

65
The University of Illinois research further found that an HMA mixture will exhibit endurance
limit behavior when the plateau value is 6.74x10⁻⁹ or less, which based on Equation 27
corresponds to a traditional fatigue life of 1.1x10⁷ cycles or greater.
The testing and analysis required to use the ratio of dissipated energy change to establish
allowable strain limits for complete healing is summarized below:
1. Conduct dynamic modulus tests on the mixture and develop a dynamic modulus
master curve and associated time-temperature shift factors.
2. Conduct continuous loading, controlled strain flexural fatigue tests at 20 °C using
different strain levels to develop a relationship between the plateau value and the
applied strain (Equations 4 and 5 in Task 2).
3. Conduct pulsed, controlled strain flexural fatigue tests at a moderate strain level using
various temperatures and rest periods to determine a relationship between the plateau
value and reduced rest period (Equations 2 and 3 in Task 2).
4. Combine the relationships from Steps 2 and 3 to form a relationship for the plateau
value as a function of applied strain level and reduced rest period (Equations 6 and 7
in Task 2).
5. Substitute the relationship from Step 4 into the unique plateau value – number of
cycles to 50 percent stiffness reduction relationship (Equation 27) established by the
University of Illinois research (Equations 8 and 9 in Task 2).
6. Solve the equation developed in Step 5 for the allowable strain level for full healing
by substituting a value greater than 1.1 x10⁷ for the number of cycles to 50 percent
stiffness reduction (Equations 10 and 11 in Task 2).
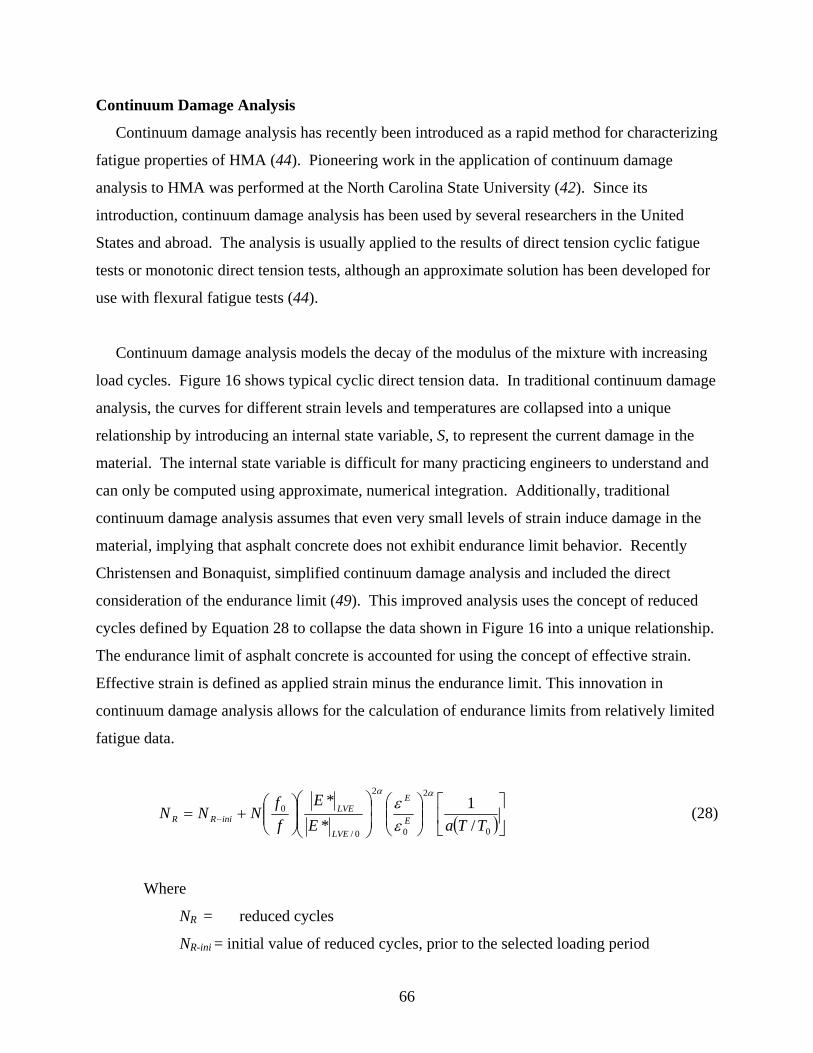
66
Continuum Damage Analysis
Continuum damage analysis has recently been introduced as a rapid method for characterizing
fatigue properties of HMA (44). Pioneering work in the application of continuum damage
analysis to HMA was performed at the North Carolina State University (42). Since its
introduction, continuum damage analysis has been used by several researchers in the United
States and abroad. The analysis is usually applied to the results of direct tension cyclic fatigue
tests or monotonic direct tension tests, although an approximate solution has been developed for
use with flexural fatigue tests (44).
Continuum damage analysis models the decay of the modulus of the mixture with increasing
load cycles. Figure 16 shows typical cyclic direct tension data. In traditional continuum damage
analysis, the curves for different strain levels and temperatures are collapsed into a unique
relationship by introducing an internal state variable, S, to represent the current damage in the
material. The internal state variable is difficult for many practicing engineers to understand and
can only be computed using approximate, numerical integration. Additionally, traditional
continuum damage analysis assumes that even very small levels of strain induce damage in the
material, implying that asphalt concrete does not exhibit endurance limit behavior. Recently
Christensen and Bonaquist, simplified continuum damage analysis and included the direct
consideration of the endurance limit (49). This improved analysis uses the concept of reduced
cycles defined by Equation 28 to collapse the data shown in Figure 16 into a unique relationship.
The endurance limit of asphalt concrete is accounted for using the concept of effective strain.
Effective strain is defined as applied strain minus the endurance limit. This innovation in
continuum damage analysis allows for the calculation of endurance limits from relatively limited
fatigue data.
( )⎥⎦⎤
⎢⎣
⎡⎟⎟⎠
⎞⎜⎜⎝
⎛⎟⎟⎠
⎞⎜⎜⎝
⎛⎟⎟⎠
⎞⎜⎜⎝
⎛+= −
0
2
0
2
0/
0
/1
**
TTaEE
ff
NNN E
E
LVE
LVEiniRR
αα
εε (28)
Where
NR = reduced cycles
NR-ini = initial value of reduced cycles, prior to the selected loading period
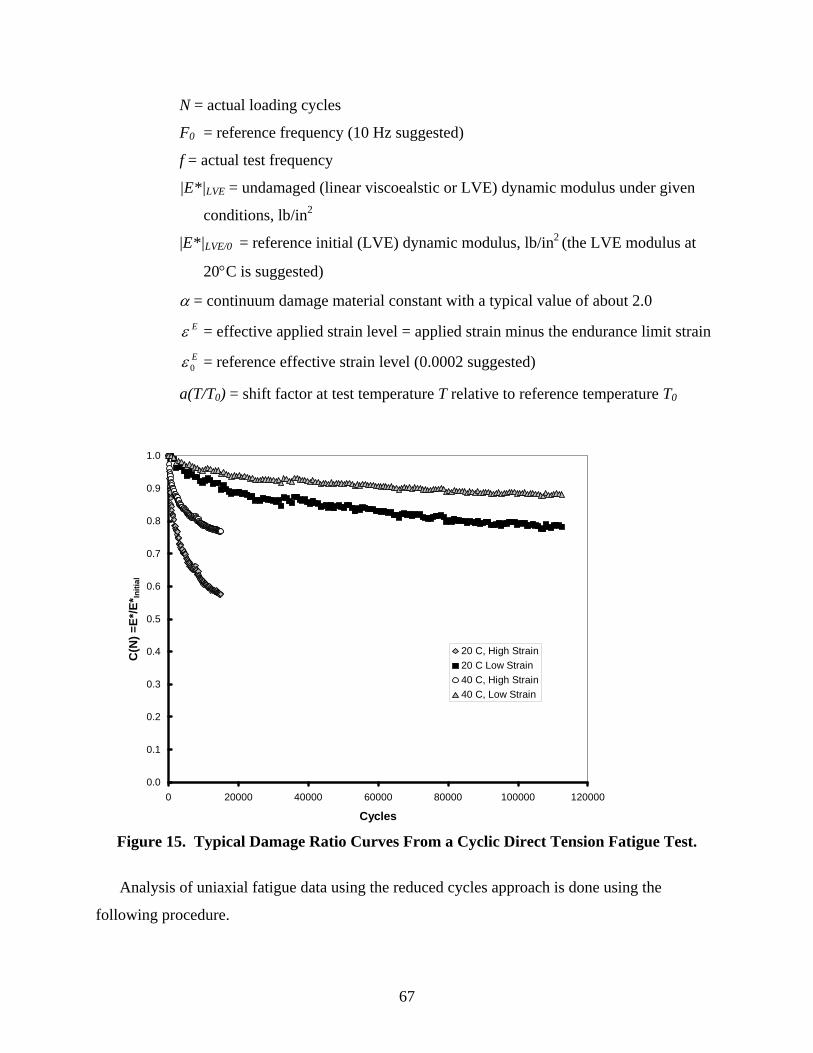
67
N = actual loading cycles
F0 = reference frequency (10 Hz suggested)
f = actual test frequency
|E*|LVE = undamaged (linear viscoealstic or LVE) dynamic modulus under given
conditions, lb/in2
|E*|LVE/0 = reference initial (LVE) dynamic modulus, lb/in2 (the LVE modulus at
20°C is suggested)
α = continuum damage material constant with a typical value of about 2.0
Eε = effective applied strain level = applied strain minus the endurance limit strain
E0ε = reference effective strain level (0.0002 suggested)
a(T/T0) = shift factor at test temperature T relative to reference temperature T0
0.0
0.1
0.2
0.3
0.4
0.5
0.6
0.7
0.8
0.9
1.0
0 20000 40000 60000 80000 100000 120000
Cycles
C(N
) =E*
/E* In
itial
20 C, High Strain20 C Low Strain40 C, High Strain40 C, Low Strain
Figure 15. Typical Damage Ratio Curves From a Cyclic Direct Tension Fatigue Test.
Analysis of uniaxial fatigue data using the reduced cycles approach is done using the
following procedure.

68
1. Select the reference conditions. The suggested reference strain is 0.000200, peak-to-peak.
The recommended reference temperature is 68 °F (20°C). The reference modulus should
be the undamaged dynamic modulus or linear viscoelastic LVE modulus at 68 °F (20°C).
The reference frequency should be 10 Hz—the same as the most commonly used test
frequency for modulus and fatigue testing of asphalt concrete mixtures.
2. Perform dynamic modulus master curve testing on two samples to determine time-
temperature shift factors for the mixture.
3. Test a total of four to eight specimens, two to four at both 39.2 °F (4°C) and 68 °F
(20°C). Other temperatures may be used if desired, but temperatures much higher or
lower than these might prove difficult to test using the procedures given here. At each
test temperature, the specimens should be tested at different strain levels for each test.
4. Set up a spreadsheet to compute the damage ratio, C, and the reduced cycles for each test.
The damage ratio is given by Equation 29:
LVE
nE
EC
**
= (29)
where:
C = damage ratio
|E*|n = damaged modulus at cycle n
|E*|LVE = undamaged (linear viscoealstic or LVE) dynamic modulus
Reduced cycles are calculated using Equation 28 and value of 2.00 for the continuum
damage constant α and an endurance limit strain of zero. Variation in the applied strain
during the test can be accounted for by splitting the data up into a number of segments,
calculating reduced cycles for each segment, and adding this value to the initial value
calculated at the end of the previous segment.

69
The LVE modulus can be estimated by visual examination of a plot of |E*| as a function
of loading cycles at the lowest strain level tested. The LVE modulus should be within a
few percent of the maximum observed value.
In some tests, macro damage (“localization”) might occur, which means that data beyond
this point is not valid for analysis using continuum damage methods. Macro damage is
indicated when there is a sudden drop in the modulus, or if modulus values suddenly
become erratic, rather than decreasing smoothly. Data after macro damage has occurred
should be eliminated from the analysis.
5. Fit Equation 30 to the C versus NR data.
( ) 211
1K
R KNC
+= (30)
where
K1 = cycles to 50 % damage = the fatigue half-life
K2 = fitting parameter
Linear regression can be used for the fitting by performing a logarithmic transformation
of Equation 30 to produce:
RNBAC
ln11ln +=⎟⎠⎞
⎜⎝⎛ − (31)
where:
A = -K2(lnK1)
B = K2
A problem in practical application of this approach is that because of noise in the
experimental data at low strains, the measured modulus can approach the LVE, resulting
in very noisy data when it is transformed using Equation 31. For this reason, a weighted
least squares approach to linear regression should be used, with a weight of 5.0RN . This
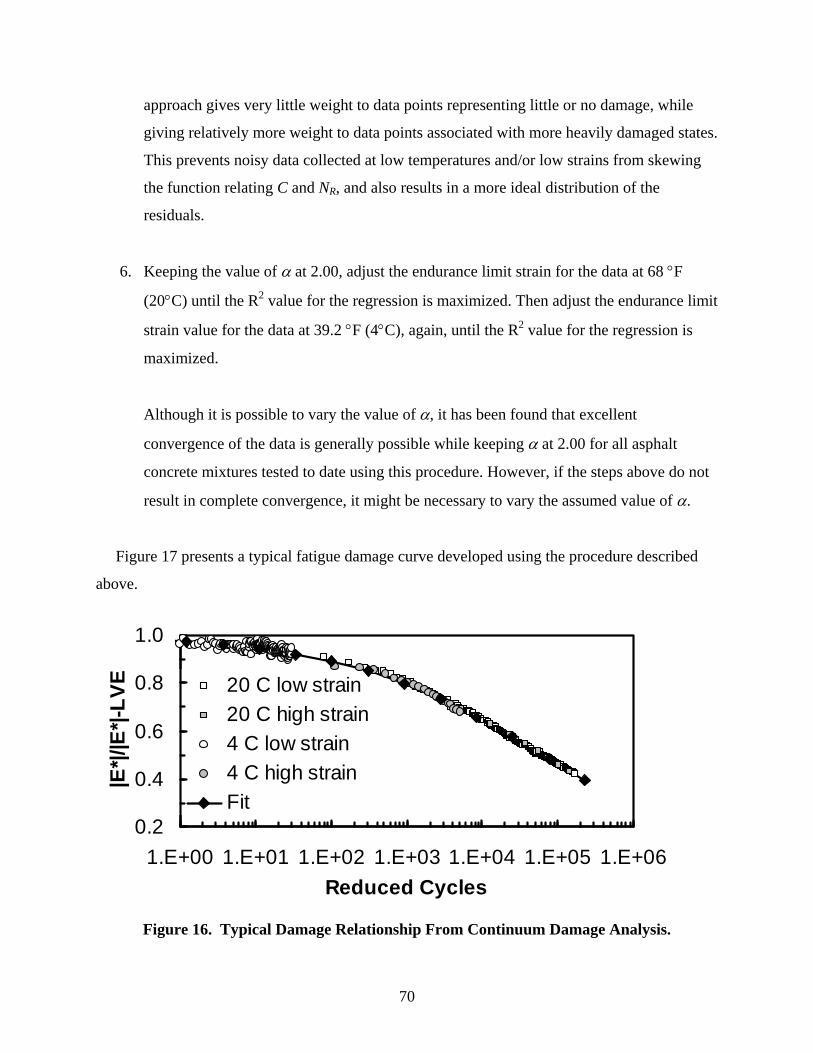
70
approach gives very little weight to data points representing little or no damage, while
giving relatively more weight to data points associated with more heavily damaged states.
This prevents noisy data collected at low temperatures and/or low strains from skewing
the function relating C and NR, and also results in a more ideal distribution of the
residuals.
6. Keeping the value of α at 2.00, adjust the endurance limit strain for the data at 68 °F
(20°C) until the R2 value for the regression is maximized. Then adjust the endurance limit
strain value for the data at 39.2 °F (4°C), again, until the R2 value for the regression is
maximized.
Although it is possible to vary the value of α, it has been found that excellent
convergence of the data is generally possible while keeping α at 2.00 for all asphalt
concrete mixtures tested to date using this procedure. However, if the steps above do not
result in complete convergence, it might be necessary to vary the assumed value of α.
Figure 17 presents a typical fatigue damage curve developed using the procedure described
above.
0.2
0.4
0.6
0.8
1.0
1.E+00 1.E+01 1.E+02 1.E+03 1.E+04 1.E+05 1.E+06Reduced Cycles
|E*|/
|E*|-
LVE 20 C low strain
20 C high strain4 C low strain4 C high strainFit
Figure 16. Typical Damage Relationship From Continuum Damage Analysis.

71
Continuum damage analysis has not been applied to pulsed fatigue tests where intermittent
healing is permitted to occur. It is expected that the endurance limit will increase as the duration
of rest period increases. The testing and analysis required to use continuum damage analysis to
establish allowable strain limits for complete healing is summarized below:
1. Conduct dynamic modulus tests on the mixture and develop a dynamic modulus
master curve and associated time-temperature shift factors.
2. Conduct cyclic direct tension controlled strain fatigue tests using various
temperatures, strain levels, and rest periods.
3. Perform continuum damage analysis and determine the endurance limit for each of
the test conditions.
4. Develop a relationship of the endurance limit as a function of temperature and rest
period using time-temperature superposition if appropriate.
5. The endurance limit relationship developed in Step 4 is the allowable strain for full
healing.
It should be noted that the allowable strains from the continuum damage analysis will likely
be lower than the allowable strains developed using flexural fatigue testing and the RDEC
method. The reason is the endurance limit in the continuum damage analysis is defined as the
strain below which no measurable damage occurs in the mixture. The endurance limit in the
RDEC approach is defined as the strain that results in less than a 50 percent reduction in the
modulus of the material after an infinite number of loading cycles.
Experimental Design and Data Analysis
The two approaches are very similar. In both cases the rate of damage accumulation should
depend on the HMA properties, the applied strain level, the temperature, and the duration of rest
periods. The allowable strain limit for design is the strain level for specific temperatures and rest

72
periods where no damage accumulates in the HMA. The primary issue for both approaches is
determining the testing conditions that provide for an efficient and robust analysis. This
includes:
• Strain levels,
• Test temperatures,
• Duration of rest periods,
• Number of replicates.
The results of Experiments 1, 2, and 3 will provide initial estimates for the testing conditions.
Data will then be collected on two mixtures from Experiment 1, one exhibiting a low healing rate
and one exhibiting a high healing rate using a wider than estimated range and more intervals for
each of the testing conditions. The analysis will then be repeated using a reduced data set to
determine the optimum testing conditions. Tests using the optimum testing conditions will then
be conducted on selected mixtures from NCHRP 9-38 and the results will be compared to the
endurance limit strain levels determined in NCHRP 9-38.
Subtask D.5 Experiment 5: Estimation of Allowable Strain Levels from Mixture
Composition
The final experiment that will be conducted is one to establish a predictive model to estimate
allowable strain levels from mixture composition. This is an extremely important experiment for
two reasons. First, it is unlikely that original materials or appropriate size field specimens will
be available from the calibration pavement sections; therefore, estimates of allowable strain
levels will be needed for the Task E analyses. Using the models developed in Experiment 5,
estimates of allowable strain levels can be made using test data from standard tests on a small
number of cores removed from the pavement sections. Second, a method of estimating
allowable strain levels will also be needed for use in Level 2 and 3 design with the modified
version of the MEPDG. The testing and analysis procedure developed in Experiment 4 will
provide methods for Level 1 analysis. The predictive model developed in Experiment 5 will
provide relationships for Level 2 and Level 3 analyses.

73
Experiment Design
Regression analysis will be used to develop a predictive model to estimate allowable strain
levels from mixture composition. In Experiment 5 a database of allowable strains and mixture
properties will be assembled by performing the analysis developed in Experiment 4 on a
representative sample of HMA base course mixtures. Since it is envisioned that the model will
be used for both analysis of existing pavements and the design of future pavements, the mixtures
tested should include past, current, and likely future features that affect HMA fatigue response
and healing. For example the base course of many existing pavements was designed using
Marshall compaction resulting in somewhat richer mixtures than designed today using gyratory
compaction. If healing is found to be much greater in modified binders, then it may be likely
that modified binders will be considered for base courses in the future, an uncommon practice
today.
Guidance on the factors and their ranges to be included in Experiment 5 will be obtained from
Experiment 1. As discussed previously, the following factors have been identified as potentially
affecting the allowable strain levels:
• Binder grade
• Binder modification
• Aging
• Effective Binder Content
• Air Voids
• Design Compaction
• Gradation
• Filler Content
The purpose of Experiment 1 is to narrow this list to the factors that significantly affect the
fatigue damage and healing characteristics of HMA. The results of Experiment 1 and a review
of past and current mixture design and mixture production specifications will be used to
determine the specific factors and the ranges that must be included in Experiment 5. It is
envisioned that approximately 30 mixtures will be tested in Experiment 5. It is not necessary

74
that Experiment 5 be a full or partial factorial design. The major experimental design
requirements are that (1) the mixtures that are selected to be representative of base courses (2)
they span the desired range of each important factor, and (3) at least three levels are included for
each factor so that non-linear analyses can be made.
Data Analysis
The database of allowable strains and associated mixture compositional properties will be
analyzed using graphical and regression techniques. First scatter plots will be prepared for each
of the factors included in the experiment to determine appropriate mathematical functions for the
model. At this point consideration will be given to using a more general factor that combines
some of the individual factors. For example, the effects of binder grade and aging could both be
addressed using the rheological index obtained from a binder master curve. Or the effects of air
voids and effective binder content could both be addressed using the voids in the mineral
aggregate or voids filled with asphalt. Additionally, consideration will be given to using easily
measured or estimated mechanical properties such as indirect tensile strength or modulus.
Once appropriate model forms have been identified using graphical analysis, a regression
analysis will be performed to determine the model coefficients. Most likely the relationships
will be non-linear resulting in the need to use numerical optimization. Several statistical
packages are available for performing non-linear regression analyses.
The final step in the process, which is often overlooked, is to evaluate the appropriateness of
the model. There are several analyses that must be performed to evaluate the model including:
1. Goodness of Fit. Two measures of the goodness of fit of the model should be evaluated.
The first is the square of the correlation coefficient, R2, which is the percentage of the
variance of the criterion variable explained by the predictor variables. The second
measure of the goodness of fit of the model is the standard error of estimate, Se, which is
the standard deviation of the errors. The standard error of estimate has the same units as
the criterion, and its magnitude is a direct indicator of the model errors. If the model

75
provides a good prediction, the standard error of estimate should be much lower than the
standard deviation of the data used to fit the model.
2. Statistical Significance of the Predictor Variables. Only statistically significant
predictor variables should be included in the model. If predictor variables that are not
statistically significant are included, then irrational effects may be predicted for important
predictor variables. The standard error of the parameter estimates should be used in a t-
test to determine if each of the model parameters is significantly different from zero.
3. Residual Analysis. An analysis of the residuals or errors should always be performed to
ensure that the underlying assumptions of regression analysis are not violated by the
model. The model errors should (1) be independent, (2) have zero mean, (3) have a
constant variance across all predictor variables, and (4) be normally distributed. Plots of
the residuals as a function of the predictor variables should be used to identify bias in the
model and to identify potential violations of the underlying regression assumptions.
4. Reliability of the Model. Confidence intervals should be constructed to assess the
reliability of the model. Since the model will be used to predict properties for design and
analysis, the width of prediction intervals for the model are of primary concern. The
prediction interval is the confidence interval associated with the prediction of a future
value.
Task D Milestones
Table 20 summarizes the major milestones for Task D. These are all associated with the
design, execution, and analysis of the five laboratory experiments.

76
Table 20. Major Task D Milestones. Milestone Description Months After
Contract Award D.1 Select Analysis Approach and Prepare Detailed Work Plan for
Experiment 1 5
D.2 Complete Experiment 1 8 D.3 Detailed Work Plan for Experiments 2 8 D.4 Complete Experiment 2 10 D.5 Detailed Work Plan for Experiment 3 and Experiment 4 10 D.6 Complete Experiment 3 11 D.7 Complete Experiment 4 13 D.8 Detailed Work Plan for Experiment 5 13 D.9 Complete Experiment 5 21
Task D Labor Estimate
Table 21 presents the estimated labor required for Task D. Table 21 presents estimated labor
hours for each of the positions in the research management structure presented in Table 5 and for
laboratory technicians. Task D is estimated to require a total of 3,893 man-hours of effort. This
is approximately 30 percent of the total effort required for the project.
Table 21. Estimated Labor Hours for Task D. Subtask Principal
Investigator StatisticianLaboratory Team Leader
Pavement Team Leader
Data Support Team Leader
Technicians
Experiment 1: Mixture Compositional Factors Affecting Healing
4 4 34 0 0 388
Experiment 2: Effect of Applied Strain on Healing
4 4 24 0 0 214
Experiment 3: Effect of Temperature and Rest Period Duration on Healing
8 4 57 0 0 242
Experiment 4: Testing and Analysis Procedures for Allowable Strain Levels
54 16 98 0 0 392
Experiment 5: Estimation of Allowable Strain Levels from Mixture Composition
146 40 270 0 0 1890
Total 216 68 483 0 0 3126

77
Task D Sources
HMA Fatigue
Christensen, D.W., and Bonaquist, R.F., “Volumetric Requirements for Superpave Mix Design,” NCHRP Report 567, National Cooperative Highway Research Program, Washington, D.C., 2006. Rao Tangella, S.C.S., Craus, J., Deacon, J.A., and Monismith, C.L., “Summary Report on Fatigue Response of Asphalt Mixtures,” Report Number SHRP-A/IR-90-011, Strategic Highway Research Program, Washington, D.C., 1990. Shook, J. F., F. N. Finn, M. W. Witczak, and C. L. Monismith, “Thickness Design of Asphalt Pavements—The Asphalt Institute Method,” Proceedings, Fifth International Conference on the Structural Design of Asphalt Pavements, Vol. 1, The University of Michigan and The Delft University of Technology, August 1982 University of California, Berkeley, Asphalt Research Program, Institute of Transportation Studies, Fatigue Response of Asphalt-Aggregate Mixes, Report SHRP-404, Washington, D.C.: National Research Council, 1994. Walubita, L.F., Epps-Martin, A., Jung, S. H., Glover, C. J., Park, E.S., Chowdhury, A., and Lytton, R. L., “Comparison of Fatigue Analysis Approaches for Two Hot Mix Asphalt Concrete (HMAC) Mixtures, Report Number FHWA/TX-05/0-4468-2, Texas Department of Transportation, Austin, TX, August, 2005.
Healing in HMA
Influence of Rest Periods on the Fatigue Response of Bituminous Mixes,” Proceedings, Association of Asphalt Paving Technologists, Vol. 51, 1982. Carpenter, S.H., and Shen, S., “Application of the Dissipated Energy Concept in Fatigue Endurance Limit Testing,” Transportation Research Record No. 1929, Transportation Research Board, Washington, D.C., 2005.
Kim, B. and Roque, R., “Evaluation of Healing Property of Asphalt Mixtures,” Transportation Research Record No. 1970, Transportation Research Board, Washington, D.C., 2006. Kim, Y.R., Little, D.N., and Benson, F.C., “Chemical and Mechanical Evaluation of Healing of Asphalt Concrete, Journal of the Association of Asphalt Paving Technologists, Vol. 59, 1990. Little, D. N., Lytton, R. L., Williams, D., and Chen, C. W., “Microdamage Healing in Asphalt and Asphalt Concrete, Volume I: Microdamage and Microdamage Healing Project Summary Report,” Report Number FHWA-RD-98-141, Federal Highway Administration, Washington, D.C., June 2001.

78
Pronk, A.C., “Partial Healing, “A New Approach for the Damage Process During Fatigue Testing of Asphalt Specimens,” Asphalt Concrete Simulation, Modeling, and Experimental Characterization, Geotechnical Special Publication No. 146, American Society of Civil Engineers, Reston, VA, 2005.
Ratio of Dissipated Energy Change
Carpenter, S.H., Ghuzlan, K.A., and Shen, S., “Fatigue Endurance Limit for Highway and Airport Pavements,” Transportation Research Record No. 1832, Transportation Research Board, Washington, D.C., 2003. Carpenter, S.H., and Shen, S., “Application of the Dissipated Energy Concept in Fatigue Endurance Limit Testing,” Transportation Research Record No. 1929, Transportation Research Board, Washington, D.C., 2005. Carpenter, S.H., and Shen, S., “Dissipated Energy Approach to Study Hot-Mix Asphalt Healing in Fatigue,” Transportation Research Record No. 1970, Transportation Research Board, Washington, D.C., 2006. Prowell, B., Brown, E., R., Daniel, J., Bhattacharjee, S., Von Quintus, H., Carpenter, S., Shen, S., Anderson, M., Swamy, A. K., and Maghsoodloo, S., “Endurance Limit of Hot Mix Asphalt Mixtures to Prevent Fatigue Cracking in Flexible Pavements,“ Updated Draft Final Report, NCHRP 9-38, National Cooperative Highway Research Program, Washington, D.C., May, 2008.
Continuum Damage Analysis
Christensen, D.W., and Bonaquist, R.F., “Practical Application of Continuum Damage Theory to Fatigue Phenomena in Asphalt Concrete Mixtures,” Journal of the Association of Asphalt Paving Technologists, Vol. 74, 2005 Kim, Y. R. and Little, D. N. “One Dimensional Constitutive Modeling of Asphalt Concrete,” ASCE Journal of Engineering Mechanics, Vol. 116, No. 4, 1990 Kim, Y. R., Little, D. N., and Lytton, R. L., “Use of Dynamic Mechanical Analysis (DMA) to Evaluate the Fatigue and Healing Potential of Asphalt Binders in Sand Asphalt Mixtures,” Journal of the Association of Asphalt Paving Technologists, Vol. 71, 2002
Kim, Y.R., Lee, H. J., and Little, D. N ., “Fatigue Characterization of Asphalt Concrete Using Viscoelasticity and Continuum Damage Theory,” Journal of the Association of Asphalt Paving Technologists, Vol. 66, 1997.
Lee, H. J., and Kim, Y. R. “A Uniaxial Viscoelastic Constitutive Model for Asphalt Concrete Under cyclic Loading,” ASCE Journal of Engineering Mechanics, Vol. 124, 1998, No. 11.

79
Statistical Analysis
American Society for Testing Materials, “ASTM Designation E 1169-02: Standard Guide for Conducting Ruggedness Tests,” Annual Book of ASTM Standards, Vol. 14.02. Statistica for Windows. [Computer software]. StatSoft, Inc., Tulas, Oklahoma, 1994.
Task E. Analysis of Pavement Sections The final task in the HMA Endurance Limit Validation Study is an analysis of full-scale
pavement sections using the allowable strain limit design procedure formulated in Task 2 and
improved through the laboratory experiments in Task D. Two types of full-scale pavement
sections will be analyzed. First data from selected accelerated pavement tests and test roads will
be used to test critical elements of the procedure. These include the effects of temperature,
applied strain, and material properties on the allowable strain levels. Results from these analyses
will be used to further improve the allowable strain limit design procedure for use in analysis of
the second type of full-scale pavement: in-service pavement sections. For the in-service
pavements, both cracked and uncracked pavements will be analyzed. These analyses will be
used to calibrate the procedure and serve as validation of the concept of an endurance limit for
flexible pavement design. It is important to recognize that the allowable strain limit design
procedure is not intended to be a tool for predicting the extent of bottom initiated cracking with
time and traffic like the MEPDG fatigue model. Its purpose is to identify design features that
minimize the possibility of bottom initiated fatigue cracking. Thus field calibration of the
allowable strain limit design procedure will be easier and likely more precise than the calibration
that was completed for the MEPDG fatigue model. Task E has been divided into five subtasks:
E.1 Review Data Sources and Select Sections for Analysis
E.2 Obtain Materials and Data for Accelerated Pavement Tests and Test Roads
E.3 Perform Testing and Analyze Accelerated Pavement Tests and Test Roads
E.4 Obtain Materials and Data for In-Service Pavement Sections
E.5 Perform Testing and Analyze In-Service Pavement Sections
Each of these subtasks are described in detail below.

80
Subtask E.1 Review Data Sources and Select Sections for Analysis
In this subtask the sources identified in this research plan will be reviewed considering the
final preliminary approach developed in Subtask 2.2 and specific pavement sections will be
selected for subsequent analysis. Subtask E.1 will begin immediately after the preliminary
approach is finalized in Subtask 2.2. Initial selection of sections for analysis will be documented
in the second interim report that will be submitted at the end of the 13th month of the project.
This initial selection will be reviewed as results from the laboratory experiments become
available and adjusted as needed. Two types of full-scale pavements: accelerated pavement tests
and test roads, and in-service pavements will be selected for analysis. The sections that follow
describe specific pavement sections that are recommended for consideration in Task E.
Accelerated Pavement Tests and Test Roads
Selected, well documented accelerated pavements tests and test roads will serve the important
role of verifying critical aspects of the allowable strain limit design procedure. Specific elements
of the procedure that can be verified include:
1. The overall engineering reasonableness of the approach,
2. Applicability of time-temperature superposition to healing and allowable strains,
3. Independence of healing on applied strain, and
4. Effect of material properties on allowable strains.
Although there are now a number of accelerated pavement testing devices and test road
facilities in the United States, few of the testing programs have addressed fatigue of HMA in a
structured manner. For flexible pavements, accelerated pavement testing has mostly been used
to investigate rutting in HMA surfaces, or to evaluate specific materials or design features. Only
four projects were identified where structured, full-scale testing was conducted that is useful in
verifying the above aspects of the allowable strain limit design procedure. The following
projects are recommended for analysis:

81
• Fatigue tests conducted during the Superpave validation study at the FHWA
Pavement Test Facility (50).
• Sections at the NCAT Test Track that have remained in service from the first cycle
through the current cycle (51).
• Sections from the WesTrack experiment containing mixtures with different
composition (41).
• Sections from the structural design experiment performed at the NCAT Test Track
(52, 53).
• Selected sections from the MNRoad project (54).
Although the MNRoad sections are actually in-service pavements loaded with normal traffic,
they are included in the verification studies because there are a number of sections that can be
analyzed and all of the sections are exposed to the same environmental conditions. If MNRoad
sections are included in the calibration, then only a limited number of sections can be used,
otherwise the analysis will be biased toward the environmental and construction conditions at
MNRoad. The sections that follow describe analyses that should be conducted considering the
preliminary design approach described in Task 2.
Overall Engineering Reasonableness
All of the accelerated pavement tests will be used to judge the engineering reasonableness of
the allowable strain limit design procedure. An analysis of each section using the procedure
should provide the correct conclusion concerning cracking in the pavement. For sections that
have cracked, the analysis should show that the allowable strain levels were exceeded. For
sections that have not yet cracked, such as the first cycle sections at the NCAT Test Track that
remain in-service, the analysis should show that the allowable strain levels were not exceeded.
It should be noted that the allowable strain limit design procedure developed in Task 2 does
not require the pavement to exhibit endurance limit behavior. Equations 8 and 9 in Task 2 can
be solved for the allowable strains for any number of loading cycles. Endurance limit behavior
occurs when the number of cycles to failure exceeds 1.1x10⁷. This will be very useful for
analysis of the structural sections at the NCAT test track. Table 22 presents the HMA

82
thicknesses in the NCAT structural sections (51). For the materials used in the base course of
these sections, analysis can be done assuming endurance limit behavior, then the analysis can be
repeated using the observed load cycles to failure and the allowable and actual strains can be
compared.
Table 22. HMA Thicknesses in NCAT Structural Sections
2003 Construction 2006 Construction Section HMA Thickness,
in HMA Base Binder HMA Thickness,
in HMA Base Binder
N1 5 Polymer 76-22 7 Neat PG 67-22 N2 5 Neat 67-22 7 Polymer 76-22 N3 9 Neat 67-22 NA NA N4 9 Polymer 76-22 NA NA N5 7 Polymer 76-22 7 Neat PG 67-22 N6 7 Neat 67-22 NA NA N7 7 Neat 67-22 NA NA N8 7 (rich bottom) Neat 67-22 10 Polymer 76-28 N9 NA NA 14 Polymer PG 76-28 N10 NA NA 8 Polymer PG 70-22
The MNRoad sections also provide the opportunity to perform a systematic analysis of the
overall reasonableness of the approach for pavements of different thickness and composition
exposed to the same traffic and environment. At MNRoad, sections were constructed using
different thicknesses, design compaction levels, and binders. Table 23 summarizes the main line
HMA cells at MNRoad that could be used in the verification analyses (54). Although bottom
initiated fatigue cracking was not reported as a distress for any of the HMA sections in the last
condition report (55), the pavements have received seven years of additional traffic and selected
sections will remain in service after reconstruction is completed in 2008 and 2009 (54).

83
Table 23. Summary of MNRoad Mainline HMA Pavement Sections.
Section HMA Thickness, in Design Compaction Binder
1 6.0 75 Blow Marshall PG 58-28 2 6.1 35 Blow Marshall PG 58-28 3 6.3 50 Blow Marshall PG 58-28 4 9.1 Gyratory PG 58-28 14 10.9 75 Blow Marshall PG 58-28 15 11.1 75 Blow Marshall PG 64-22 16 8.0 Gyratory PG 64-22 17 7.9 75 Blow Marshall PG 64-22 18 7.9 50 Blow Marshall PG 64-22 19 7.8 35 Blow Marshall PG 64-22 20 7.8 35 Blow Marshall PG 58-28 21 7.9 50 Blow Marshall PG 58-28 22 7.9 75 Blow Marshall PG 58-28 23 8.2 50 Blow Marshall PG 58-28
Applicability of Time-Temperature Superposition to Rest Periods
The fatigue experiment that was conducted during the Superpave validation study at the
FHWA Pavement Testing Facility provides an excellent opportunity to validate that application
of time-temperature superposition to rest periods. In this study, accelerated pavement tests were
conducted with the FHWA Accelerated Loading Facility on two pavements at three different
pavement temperatures. The tests were performed when ambient air temperatures were low. An
infrared heating system was used to maintain the pavement temperatures (50). Table 24
summarizes the tests that were performed. Analysis of these tests at different temperatures using
the allowable strain limit design procedure will provide validation of the use of time-temperature
superposition to model HMA healing effects.
Table 24. FHWA Pavement Testing Facility Superpave Fatigue Experiment.
HMA Thickness, mm Binder Load, kN 10 °C 19 °C 28 °C
AC-5 53 X X X 100 AC-20 53 X X X AC-5 53 X X X 200 AC-20 53 X X X

84
The instrumented structural sections at the NCAT Test Track can be used to evaluate the
effect of damage and healing during different temperature conditions. Measured strains and
deflections in these sections can be used to determine the effects of rest periods on healing at
different temperatures. Within the current loading experiment, four of the structural test sections
are instrumented.
Independence of Healing on Strain Level
The FHWA Superpave validation study fatigue experiments also provide the opportunity to
verify that healing is independent of strain level. Since the same mixtures were tested at the
same temperature and load in two different pavement structures, the effect of strain level on
healing can be evaluated. The thicker pavement has significantly lower tensile strains at the
bottom of the HMA compared to the thinner pavement. The structural sections at the NCAT
Test Track and sections at MNRoad where the same base course material was used in pavements
of different thicknesses can also be used to verify that healing is independent of strain level.
Effect of Material Properties on Allowable Strains
All four recommended projects can be used to assess how well the allowable strain limit
design procedure addresses the effect of changes in mixture composition. The WesTrack
experiment included variations in gradation, filler content, binder content, and in-place density
(41). A single asphalt binder and aggregate source were used in the original sections. In the
replacement sections a different aggregate was used (41). As shown in Table 22, the structural
sections at the NCAT Test Track includes pavements of the same thickness made with a polymer
modified PG 76-22 binder and a neat PG 67-22 binder. The FHWA experiment included two
neat binders, AC-5 and AC-20. Finally as shown in Table 23, the MNRoad project includes
sections of the same thickness designed with different compaction and two different binders.
The predictive model developed in Experiment 5 of Task D addresses the effect of material
properties on allowable strains. The effects predicted by this model can be compared to the
observed effects within each of the experiments.
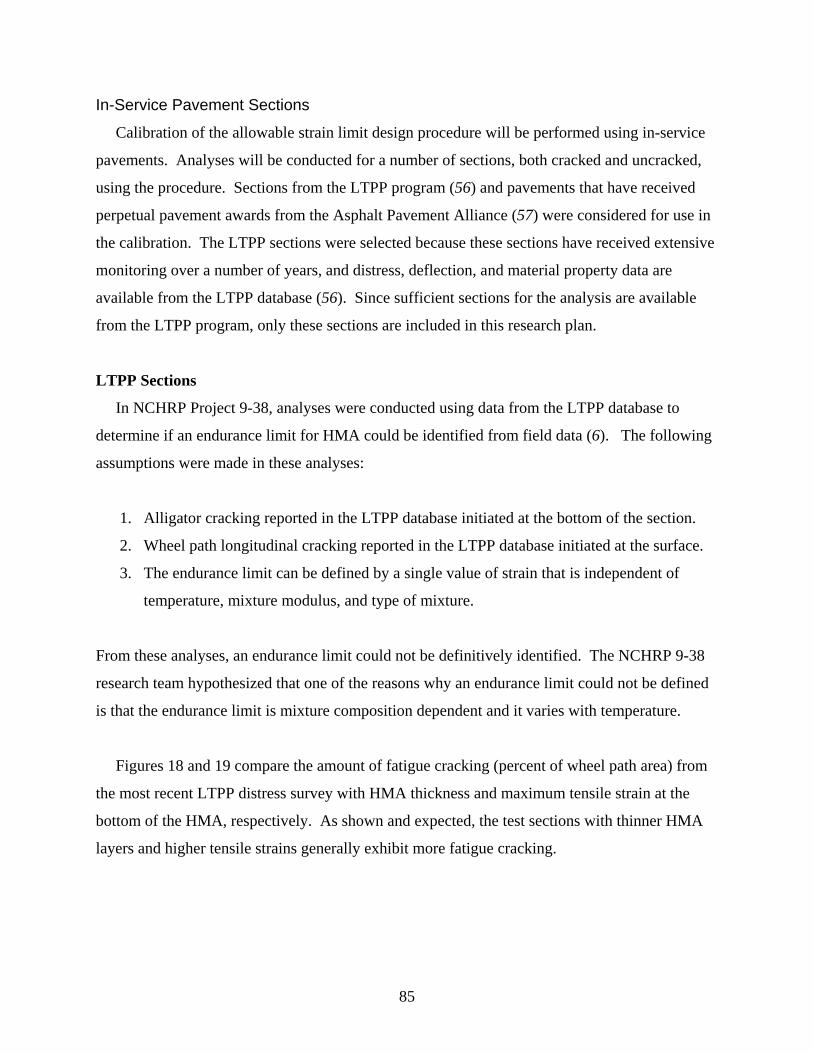
85
In-Service Pavement Sections
Calibration of the allowable strain limit design procedure will be performed using in-service
pavements. Analyses will be conducted for a number of sections, both cracked and uncracked,
using the procedure. Sections from the LTPP program (56) and pavements that have received
perpetual pavement awards from the Asphalt Pavement Alliance (57) were considered for use in
the calibration. The LTPP sections were selected because these sections have received extensive
monitoring over a number of years, and distress, deflection, and material property data are
available from the LTPP database (56). Since sufficient sections for the analysis are available
from the LTPP program, only these sections are included in this research plan.
LTPP Sections
In NCHRP Project 9-38, analyses were conducted using data from the LTPP database to
determine if an endurance limit for HMA could be identified from field data (6). The following
assumptions were made in these analyses:
1. Alligator cracking reported in the LTPP database initiated at the bottom of the section.
2. Wheel path longitudinal cracking reported in the LTPP database initiated at the surface.
3. The endurance limit can be defined by a single value of strain that is independent of
temperature, mixture modulus, and type of mixture.
From these analyses, an endurance limit could not be definitively identified. The NCHRP 9-38
research team hypothesized that one of the reasons why an endurance limit could not be defined
is that the endurance limit is mixture composition dependent and it varies with temperature.
Figures 18 and 19 compare the amount of fatigue cracking (percent of wheel path area) from
the most recent LTPP distress survey with HMA thickness and maximum tensile strain at the
bottom of the HMA, respectively. As shown and expected, the test sections with thinner HMA
layers and higher tensile strains generally exhibit more fatigue cracking.

86
0102030405060708090
100
0 5 10 15 20 25 30
HMA Thickness, inches
Area
Fat
igue
Cra
ckin
g, %
Series1 Log. (Series1)
Figure 17. Comparison of Area Fatigue Cracking (Area Alligator Cracking Based on a
Percent of Wheel Path Area) and HMA Layer Thickness (6).
0102030405060708090
100
10 100 1000 10000
Tensile Strain, micro-inches
Fatig
ue C
rack
ing,
%
Fatigue Cracking Log. (Fatigue Cracking)
Figure 18. Comparison of the Area Fatigue Cracking for and Maximum Tensile Strain
Computed at the Bottom of the HMA Layer (6).
A number of test sections with thick HMA layers and low tensile strains, however, have
levels of fatigue cracking exceeding 5 percent. Reasons given for the cracking in these sections
included (6):

87
• Misclassification of longitudinal cracking as alligator cracking.
• The presence of construction defects, such as high air voids, debonding of layers, etc.
• Moisture damage in the section,
• The endurance limit is dependent on the quality of the HMA base; therefore, sections
with poor HMA base quality require lower strains to exhibit endurance limit
behavior.
Forensic evaluation of the thick HMA sections with reported alligator cracking was
recommended for future endurance limit validation studies.
An observation of the data in Figures 18 and 19 that was not made by the NCHRP Project 9-
38 research team is the pavements in the LTPP database are generally properly designed to resist
fatigue cracking for the level of traffic that they have received. This is indicated by the large
number of sections having zero alligator cracking. This is particularly true for pavements having
maximum tensile strains at the bottom of the asphalt layer below about 100 microstrain when
calculated using the equivalent annual layer moduli for each pavement layer. Figure 20 presents
a plot of tensile strain at the bottom of the asphalt layer versus HMA layer thickness that was
used to develop Figure 19. From Figure 20 tensile strains of 100 microstrain correspond to
approximately 10 inches of HMA, which is similar to the thicknesses reported for the heavily
trafficked pavements in the United Kingdom having no evidence of bottom initiated fatigue
cracking (9). This observation suggests that the thick sections with high levels of alligator
cracking likely contain construction defects and should not be included in the calibration of the
allowable strain limit design procedure. Forensic evaluation of these sections should definitely
be conducted, but not as part of the HMA Endurance Limit Validation Study.

88
10
100
1000
0 5 10 15 20 25 30
HMA Thickness, inches
Tens
ile S
train
, Mic
ro-in
ches
Series1 Power (Series1)
Figure 19. Comparison of the Maximum Tensile Strain at the Bottom of the HMA Layer
and HMA Thickness (6).
Table 25 presents the preliminary test matrix for using LTPP sections to calibrate the
allowable strain limit design procedure. Since the procedure is not intended for prediction of the
extent of cracking in a pavement section, but rather as a tool to identify design features to
minimize the potential for bottom initiated fatigue cracking, an extremely large data set is not
required. The recommended matrix includes a total of 32 pavement sections: 16 not exhibiting
alligator cracking and 16 exhibiting low to moderate amounts of alligator cracking. An equal
number of sections from the four environmental zones are included in the matrix. Only
pavements with HMA thicknesses exceeding 8 inches are included. Subgrade deformation
becomes an important consideration in thinner HMA pavements.

89
Table 25. Preliminary Matrix for Field Calibration of the Allowable Strain Limit Design Procedure.
Environment HMA Thickness, in
No Alligator Cracking
Low Alligator Cracking
8 to 12 2 2 Wet Freeze >12 2 2 8 to 12 2 2 Wet No Freeze >12 2 2 8 to 12 2 2 Dry Freeze >12 2 2 8 to 12 2 2 Dry No Freeze >12 2 2
Table 26 presents a summary of applicable LTPP sections for each of the cells in the
experimental matrix. Information from the LTPP database on these sections and and others that
may be considered is presented in Appendix A. Specific sections to be included in the
calibration effort will be selected in Subtask E.1. Items that should be considered in the final
selection include:
• Current status of the section (active or out of service).
• Willingness of the state agency to assist with providing traffic control for distress
verification and seismic testing, and to provide limited coring to investigate cracking
and obtain samples for laboratory testing.
• Consistency of time series distress data for the section in the LTPP database.
• Consistency of time series deflection data for uncracked sections.
• Availability of traffic information or an estimate of traffic for the section.

90
Table 26. LTPP Sections Recommended for Consideration.
Fatigue or Alligator Cracking Climate HMA Total
Thickness, in. None Appreciable
8 to 12 12-0101; 12-0103; 22-0114; 40-0160
01-0101; 05-0114; 12-0107; 40-0114
Wet-No Freeze
>12 05-3071; 12-0106; 12-0104; 13-4113; 22-0116; 40-0115 01-0111; 05-0115; 05-0116
8 to 12 35-0111; 35-0103; 35-0107 04-0162; 48-1070 Dry-No Freeze
>12 04-1065; 35-0106; 48-0116 04-1062; 04-0116
8 to 12 32-0101; 32-0105 16-9034; 30-0114; 32-0103 Dry-Freeze
>12 31-0115; 31-0116; 32-0106; 32-0104 30-0116; 30-0115; 30-0124
8 to 12 19-0101; 19-0105; 55-01114; 55-C901 19-0103; 55-C960
Wet-Freeze >12 19-0112; 26-0115; 39-0902;
55-0116 39-0106; 39-0112; 39-0903
Subtask E.2 Obtain Materials and Data for Accelerated Pavement Tests and Test
Roads
The primary activity required in Subtask E.2 is extracting the data required for analysis of the
accelerated pavement tests and test road sections from various research reports. This includes
information on the pavement structure, loading, environmental conditions, material properties,
and distress for each section that will be analyzed. The data will be entered into the database and
managed in Subtask C.2.
The inputs needed to apply the allowable strain limit design procedure to accelerated
pavement tests and test roads are similar to those required for current mechanistic-empirical
design, such as the MEPDG. Table 27 summarizes the required inputs. The elements in bold in
Table 27 are ones required by the allowable strain limit design procedure that are not included in
current mechanistic-empirical analysis. Since mechanistic-empirical pavement analyses were
included in the recommended projects, most of the information needed for the analyses are in
published reports for the projects or available from the project websites (41, 50, 51, 52, 53, 54,
58).

91
Table 27. Summary of Required Inputs for Allowable Strain Limit Design.
Category Required Input Pavement Structure Layer thicknesses
Layer moduli Layer Poisson’s ratios Mixture composition and binder properties for HMA base
Traffic Axle configuration Tire configuration Tire loads Tire pressure Speed Wander Rest Period
Environmental Pavement temperature history Base modulus history Subgrade modulus history
It is envisioned that the model for predicting allowable strains in HMA developed in
Experiment 5 of Task D will relate allowable strains to mixture composition and binder
properties. The required mixture composition data are available in the published research
reports; however, it is expected that binder properties in addition to the performance grade of the
binder will be required. Extensive testing of the binders used in the FHWA Superpave validation
study, WesTrack, and MNRoad was completed during NCHRP Project 9-19 (59, 60, 61).
Therefore, the only material sampling and testing that will be needed for analysis of the
accelerated pavement tests and test roads will be characterization of the binders used in the
structural sections at the NCAT Test Track. One quart samples of these binders will be
requested from NCAT or the test section sponsors.
The required performance data for the recommended projects are included in published
reports. Updated information on performance of the MNRoad test sections is available by
request through the MNRoad website (54). Traffic loading for the 2006 sections included in the
structural sections at the NCAT Test Track is scheduled for completion in the Fall of 2008 (51).

92
Subtask E.3 Perform Lab Testing and Analyze Accelerated Pavement Tests and Test
Roads
The only laboratory testing envisioned in Subtask E.3 is further characterization of the
binders used in the structural test sections from the NCAT test track. It is unlikely that master
curves characterizing the flow characteristics of the binders over a wide temperature range and
for various aging conditions are available; therefore, they will have to be developed. Master
curves are developed by testing the binder at multiple temperatures and frequencies using the
dynamic shear rheometer, AASHTO T315, and conducting bending beam rheometer tests,
AASHTO T313, at multiple temperatures.
For each accelerated pavement test and test road section, an analysis will be performed with
the research version of the MEPDG software, NCHRP9-44A_Version 0.2, using section specific
material properties, loading, and environment. Two analyses will be performed. For all sections
an analysis will be conducted to determine the allowable strains that will produce endurance
limit behavior (full healing). Then, for those sections that have exhibited cracking an analysis
will be performed using the observed cycles to first cracking. Comparisons will be made within
projects and between projects to verify the following aspects of the allowable strain limit design
procedure:
• The overall engineering reasonableness of the approach,
• Applicability of time-temperature superposition to healing and allowable strains,
• Independence of healing on applied strain, and
• Effect of material properties on allowable strains.
Pertinent interim results from these analyses will be discussed in the quarterly progress
reports. The analyses will be thoroughly documented in the fourth interim report submitted at
the end of the 30th month of the project.
Subtask E.4 Obtain Materials and Data for In-Service Pavement Sections
In this Subtask, data and materials needed to analyze each of the LTPP sections included in
the final matrix of in-service pavements will be obtained. First, the most recent data for the test

93
section will be retrieved from the LTPP database (56). This data will be entered into the project
database and managed under Subtask C.2. The relevant data for the analyses include:
• Traffic.
• Time-series deflection data.
• Time-series fatigue cracking.
• Time-series longitudinal cracking.
• Layer material properties.
A site visit to each of the selected pavement sections is required. The site visit will include:
1. A visual condition survey to confirm the distresses obtained from the LTPP database,
2. Non-destructive testing at various locations in the section using the Portable Seismic
Pavement Analyzer (PSPA) (62, 63) to identify damage in the base layers that is not
apparent from surface distress measurements.
3. Coring to obtain 3 to 5 full depth samples for laboratory testing, and
4. Additional coring to confirm the distress survey and seismic testing. If cracks are
present, cores will be taken through selected cracks to confirm where the cracks
initiated and confirm the cause of cracking.
Each site visit will require two full days. It is envisioned that the necessary traffic control and
coring will be provided by the state highway agencies. Their willingness to participate in the
field testing is an important consideration in the final selection of pavements for analysis.
Subtask E.5 Perform Lab Testing and Analyze In-Service Pavement Sections
Laboratory Testing
The pavement section cores will be used to determine modulus values for analysis of the
seismic test data and to obtain the properties of the HMA base for use in the predictive model
developed in Experiment 5 of Task D. This model will relate allowable strains for full healing to
easily measured volumetric properties of the mixture and flow characteristics of the binder.
Mixture properties will be obtained from normal volumetric analysis of the cores. The binder

94
will be recovered to determine the required binder properties. A preliminary testing plan is
presented in Table 28 assuming that an indirect tensile strength will be used in the model and a
binder master curve will be required to characterize the flow properties of the binder in the
predictive model developed in Experiment 5 of Task D.
Table 28. Preliminary Testing Plan for Cores From the LTPP Sections.
Test Method Number Reason
Bulk specific gravity AASHTO T169 3 Volumetric properties Indirect Tensile Modulus
Modified AASHTO T322
3 Analysis of seismic data
Indirect Tensile Strength
AASHTO T322 3 Mixture strength
Asphalt content AASHTO T164 3 Volumetric properties Sieve analysis AASHTO T30 3 Gradation Aggregate bulk specific gravity
AASHTO T84 AASHTO T85
1 1 Volumetric properties
Binder Recovery AASHTO T170 3 Obtain binder for rheological testing Dynamic Shear Rheometer
AASHTO T315 Frequency sweep at 6 temperatures
Binder master curve
Bending Beam Rheometer
AASHTO T313 3 temperatures Binder master curve
Analysis
Analysis of the LTPP sections will be performed using the research version of the MEPDG
software, NCHRP9-44A_Version 0.3, developed in Subtask 2.4. The analysis will involve
performing simulations for each of the 32 pavement sections to determine the frequency at which
the allowable strains for full healing (endurance limit behavior) are exceeded. For all of the
simulations, the best available information on the traffic and unbound layers will be used.
Since the field data consists of cracked and uncracked sections, the analysis will produce
binary data (either cracked or uncracked) as shown schematically in Figure 21. From this data a
model for the probability that bottom initiated cracking will occur can be developed using the
logistic function given in Equation 32.
[ ][ ])(
)(
10
10
1 PEbb
PEbb
eep
+
+
+= (32)

95
where:
p = probability of bottom initiated fatigue cracking
PE = percent of axle loads with strains exceeding the endurance limit
b0 and b1 = fitting parameters
0.0
0.1
0.2
0.3
0.4
0.5
0.6
0.7
0.8
0.9
1.0
0 10 20 30 40 50 60 70 80 90 100
Percent of Axle Loads Exceeding Endurance Limit Strain, %
Prob
abili
ty o
f Bot
tom
Initi
tate
d C
rack
ing
Figure 20. Schematic of Field Section Data Analysis.
Jackknifing as described in Research Results Digest Number 283 (64) can be used to assess
the accuracy of the of the model coefficients without having to separate the 32 sections into
calibration and validation subsets. Jackknifing is performed by systematically removing one of
the sections, calibrating the model using the remaining sections, then predicting the value of the
section that was removed. For the section that was removed, the model error, ei, is computed as
the difference between the predicted and measured values. The process of withholding,

96
calibrating, and determining the error is repeated until each section has been removed. This
process produces n values of the error from which the following jackknifing goodness of fit
statistics can be computed.
5.0
1
25.0
1
2 )ˆ(11⎥⎦
⎤⎢⎣
⎡∑ −=⎥
⎦
⎤⎢⎣
⎡∑=
==
n
iii
n
iie YYeS
νν
(33)
where
Se = standard error
ei = errors computed from jackknifing
n = number of measurements taken
ν = degrees of freedom = n minus number of unknowns
iY = predicted value for the ith jackknifing set
Yi = measured value for the ith jackknifing set
⎥⎥
⎦
⎤
⎢⎢
⎣
⎡⎟⎠⎞
⎜⎝⎛
−−
⎟⎟
⎠
⎞
⎜⎜
⎝
⎛−=
11 2
22
npn
SSR
y
e (34)
where
R2 = explained variance
Se = standard error
Sy = standard deviation of the measured data
n = number of measurements taken
p = number of unknowns
∑==
n
iiebias
1 (35)
where
ei = errors computed from jackknifing

97
n = number of measurements taken
The advantage of jackknifing is the goodness of fit statistics are based on predictions of
measurements that are not included in the calibration. They are, therefore, better estimates of the
accuracy of future predictions than goodness of fit statistics based on calibration using the full
data set. The stability of the model can also be assessed by performing the jackknifing again by
withholding two sets of measurements and calibrating using the remaining n-2 measurements.
For n-2 jackknifing, two errors are computed for each set of two measurements that are withheld.
The change in the jackknifing goodness of fit statistics between n-1 and n-2 jackknifing is an
indicator of the stability of the statistics. Stable goodness of fit statistics indicate a model with
reliable prediction accuracy.
Pertinent interim results from these analyses will be discussed in the quarterly progress
reports. The analyses will be thoroughly documented in the fifth interim report submitted at the
end of the 42nd month of the project.
Task E Milestones
Table 29 summarizes the major milestones for Task E. Initially the emphasis of the project
will be on the formulation of the design procedure and the laboratory testing and analysis. This
provides substantial time for compiling the accelerated pavement test and test road data and for
final selection of the LTPP sections. After the laboratory testing and analysis are complete, the
emphasis of the project shifts to collection and analysis of the data from the LTPP sections.
Table 29. Major Task E Milestones.
Milestone Description Months After
Contract Award E.1 Initial Selection of Sections for Analysis 12 E.2 Final Selection of LTPP Sections for Analysis 20 E.3 Compile Data From Accelerated Pavement Tests and Test Roads 24 E.4 Complete Analysis of Accelerated Pavement Tests and Test
Roads 27
E.5 Complete Data Collection for LTPP Sections 32 E.6 Complete Testing and Analysis of LTPP Sections 35
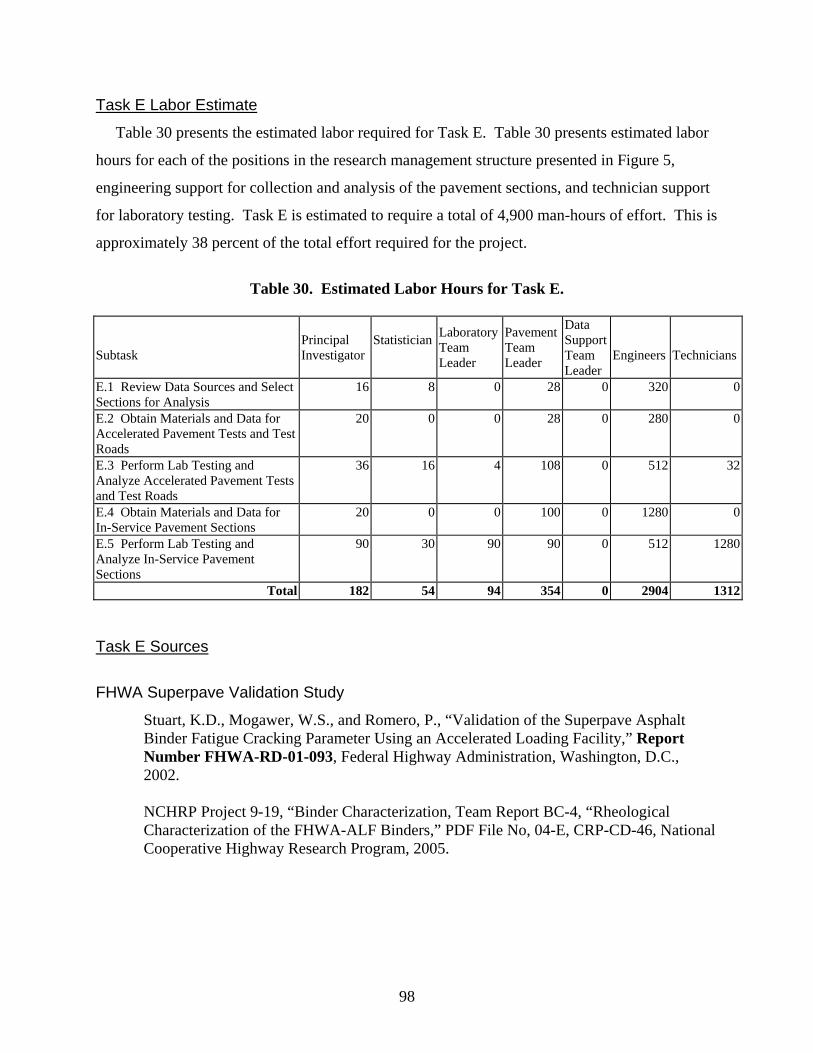
98
Task E Labor Estimate
Table 30 presents the estimated labor required for Task E. Table 30 presents estimated labor
hours for each of the positions in the research management structure presented in Figure 5,
engineering support for collection and analysis of the pavement sections, and technician support
for laboratory testing. Task E is estimated to require a total of 4,900 man-hours of effort. This is
approximately 38 percent of the total effort required for the project.
Table 30. Estimated Labor Hours for Task E.
Subtask
Principal Investigator
Statistician
Laboratory Team Leader
Pavement Team Leader
Data Support Team Leader
Engineers
Technicians
E.1 Review Data Sources and Select Sections for Analysis
16 8 0 28 0 320 0
E.2 Obtain Materials and Data for Accelerated Pavement Tests and Test Roads
20 0 0 28 0 280 0
E.3 Perform Lab Testing and Analyze Accelerated Pavement Tests and Test Roads
36 16 4 108 0 512 32
E.4 Obtain Materials and Data for In-Service Pavement Sections
20 0 0 100 0 1280 0
E.5 Perform Lab Testing and Analyze In-Service Pavement Sections
90 30 90 90 0 512 1280
Total 182 54 94 354 0 2904 1312 Task E Sources
FHWA Superpave Validation Study
Stuart, K.D., Mogawer, W.S., and Romero, P., “Validation of the Superpave Asphalt Binder Fatigue Cracking Parameter Using an Accelerated Loading Facility,” Report Number FHWA-RD-01-093, Federal Highway Administration, Washington, D.C., 2002. NCHRP Project 9-19, “Binder Characterization, Team Report BC-4, “Rheological Characterization of the FHWA-ALF Binders,” PDF File No, 04-E, CRP-CD-46, National Cooperative Highway Research Program, 2005.

99
MnRoad
Minnesota Department of Transportation. http://www.dot.state.mn.us/mnroad/ (accessed June, 2008). Palmquist, D., Worel, B., Zerfas, W., “2002 Hot-Mix Asphalt Mainline Test Cell Condition Report,” Minnesota Department of Transportation, September 6, 2002. Worel, B., “MnRoad Database Guide,” Minnesota Department of Transportation, January, 2006. NCHRP Project 9-19, “Binder Characterization, Team Report BC-3, “Rheological Characterization of the MnRoad Binders,” PDF File No. 04-D, CRP-CD-46, National Cooperative Highway Research Program, 2005.
LTPP Sections
Federal Highway Administration. http//www.ltpp-products.com/DataPave/index.asp (accessed June, 2008). National Cooperative Highway Research Program, http://www.trb.org/mepdg/guide.htm (accessed June 30, 2008).
NCAT Test Track
National Center for Asphalt Technology. http://www.pavetrack.com/ (accessed June, 2008). Timm, D. West, R., Priest, A., Powell, B., Selvaraj, I., Zhang, J., and Brown, R., “Phase II NCAT Test Track Results,” NCAT Report 06-05, National Center for Asphalt Technology, Auburn University, Auburn, AL, December, 2006. Timm, D. and Priest, A., “Material Properties of the 2003 NCAT Test Track Structural Study,” NCAT Report 06-01, National Center for Asphalt Technology, Auburn University, Auburn, AL, April, 2006. Willis, J., and Timm, D., “Forensic Investigation of a Rich Bottom Pavement”, NCAT Report 06-04, National Center for Asphalt Technology, Auburn University, Auburn, AL, December, 2006.
Timm, D.H., Priest, A.L., and McEwen, T. V., “Design and Instrumentation of the Structural Pavement Experiment at the NCAT Test Track,” NCAT Report 04-01, National Center for Asphalt Technology, Auburn University, Auburn, AL, April, 2004.
Brown, E.R., Cooley, L.A., Hanson, D., Lynn, C., Powell, B., Prowell, B., and Watson, D., “NCAT Test Track Design, Construction, and Performance,” NCAT Report 02-12,

100
National Center for Asphalt Technology, Auburn University, Auburn, AL, November, 2002.
Westrack
Epps, J. A., Hand, A., Seeds, S., Schultz, T., Alavi, S., Ashmore, C., Monismith, C., Deacon, J.A., Harvey, J.T., and Leahy, R., “Recommended Performance Related Specifications for Hot-Mix Asphalt Construction: Results of the WesTrack Project,” NCHRP Report 455, National Cooperative Highway Research Program, Washington, D.C., 2002. NCHRP Web-Only Document 111: “Recommended Performance Related Specifications for Hot-Mix Asphalt Construction: Results of the WesTrack Project,” http://onlinepugs.trb.org/onlinepubs/nchrp/nchrp_w111.pdf (acessed June, 2008). NCHRP Project 9-19, “Binder Characterization, Team Report BC-5, “Rheological Characterization of the WesTrack Binders,” PDF File No, 04-F, CRP-CD-46, National Cooperative Highway Research Program, 2005.
Seismic Pavement Analyzer
Geomedia Research and Development, http://geomedia.us/ (accessed June, 2008)
McDaniel, M., Yuan. D., Chen, D., and Nazarian, S., “Use of Seismic Pavement Analyzer in Forensic Studies in Texas,” Nondestructive Testing of Pavements and Backcalculation of Moduli, Third Volume, ASTM STP 1735, American Society for Testing and Materials, West Conshohoken, PA, 2000. Nazarian, Soheil, et al., Development of Structural Field Testing of Flexible Pavement Layers, Project No. 1735, Final Report, University of Texas at El Paso, Center for Materials and Research, El Paso, Texas, 2002. Nazarian, S., Baker, M. R., and Crain, K., “Development and Testing of a Seismic Pavement Analyzer,” Report Number SHRP-H-377 Strategic Highway Research Program, Washington, D.C., 1993. Steyn, W., and Sadzik, E., “Application of the Portable Seismic Pavement Analyzer (PSPA) for Pavement Analysis,” http://hdl.handle.net/1024/1246, 2007. Von Quintus, et al., Nondestructive Testing Technology for Quality Control and Acceptance of Flexible Pavement Construction; Volume I - Procedure Manual, Final Report, NCHRP Project 10-65, June 2008.

101
Schedule of Tasks
The HMA Endurance Limit Validation Study will require 48 months to complete. Figure 22
presents a Gantt Chart for the project with the critical path identified. Table 31 presents a
complete listing of milestones for the project.
Perhaps the most critical task in the project is Task B.2, Finalize Preliminary Approach,
because the procedure assembled in this task will shape the final design of the laboratory
experiments and the final selection of in-service pavements for analysis. Once the preliminary
design procedure is finalized, then the critical path shifts to the laboratory studies in Task D.
When the laboratory studies are completed, the critical path splits. The development of
NCHRP944A_Version 0.2 of the research MEPDG software in Task 2.3 becomes critical. This
version of the software will be used to analyze the accelerated pavement and test road data in
Task E.3. Then based on the finding from these analyses, NCHRP944A_Version 0.3 will be
developed for the calibration studies using data from the LTPP sections. The collection of data
from the LTPP sections in Task E.4 also becomes critical. The site visits required in this task
can not begin until the form of the model for predicting allowable strains from mixture
composition is determined. The final field coring and laboratory testing plans will depend on the
form of the model developed in Task D.5. The schedule provides 12 months to perform the 32
site visits. This is a compressed schedule for the site visits and likely will require at least two
field engineers to complete the work as scheduled.
Analysis of the LTPP sections can begin as soon as the NCHRP944A_Version 0.3 is
completed in Task B.4. Laboratory testing of the field cores will lag the site visits by
approximately 1 month; therefore, the data required to analyze most of the LTPP sections will be
available when NCHRP944A_Version 0.3 is completed.
The final tasks of the project begin after the calibration analyses are completed in Task E.5.
This includes development of the final design procedure, NCHRP9-44A_Version 1.0 of the
software, and the preparation of the final report for the project.

102
Task Subtask1 2 3 4 5 6 7 8 9 10 11 12 13 14 15 16 17 18 19 20 21 22 23 24 25 26 27 28 29 30 31 32 33 34
A.0 Management and ReportingA.1 Project ManagementA.2 Progress ReportingA.3 Interim Reports and Presentations P PA.4 Final Report and Presentation
B.0 Formulate Design ProcedureB.1 Review Selected LiteratureB.2 Finalize Preliminary ReportB.3 Incorporate Findings From Laboratory StudiesB.4 Modify Approach Based on Analysis of Accelerated Pavement TestsB.5 Prepare Final Design Procedure
C.0 Database ManagementC.1 Develop Plan to Use M-E_DPM DatabaseC.2 Develop Needed TablesC.3 Input and Manage data
D.0 Laboratory StudiesD.1 Experiment 1: Mixture Compositional Factors Affecting HealingD.2 Experiment 2: Effect of Applied Strain on HealingD.3 Experiment 3: Effect of Temperature and Rest Period Duration on HealingD.4 Experiment 4: Testing and Analysis Procedures for Allowable Strain LevelsD.5 Experiment 5: Estimation of Allowable Strain Levels from Mixture Composition
E.0 Analysis of Field SectionsE.1 Review Data Sources and Select Sections for AnalysisE.2 Obtain Materials and Data for Accelerated Pavement Tests and Test RoadsE.3 Perform Lab Testing and Analyze Accelerated Pavement Tests and Test RoadsE.4 Obtain Materials and Data for In-Service Pavement SectionsE.5 Perform Lab Testing and Analyze In-Service Pavement Sections
Months After Notice To Proceed
Figure 22. Project Schedule With Critical Path Shown in Black.
Figure 22. Project Schedule With Critical Path Shown in Black.
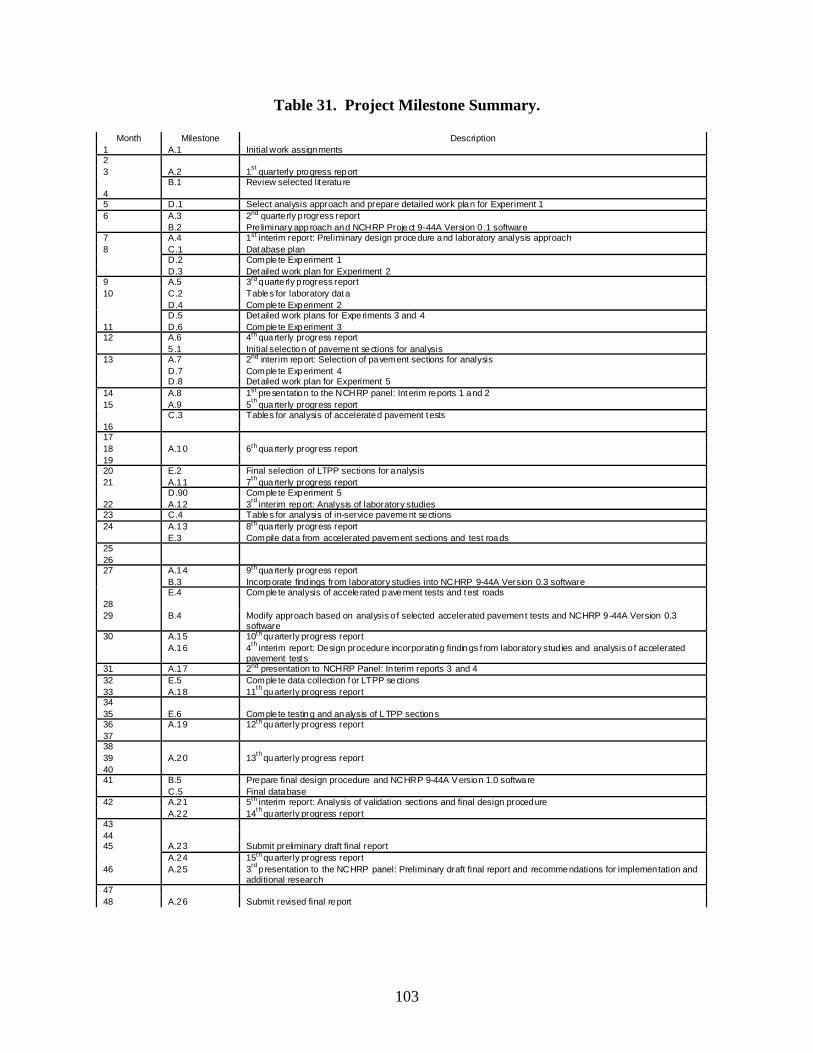
103
Table 31. Project Milestone Summary.
Month Milestone Description 1 A.1 Initial work assignments 2
A.2 1st quarterly progress report 3 B.1 Review selected lit eratu re
4 5 D.1 Select analysis approach and prepare detailed work plan for Experiment 1
A.3 2nd quarte rly progress report 6 B.2 Pre liminary approach and NCHRP Project 9-44A Version 0 .1 software
7 A.4 1st interim report: Preliminary design procedure and laboratory analysis approach C.1 Database plan D.2 Comple te Experiment 1
8
D.3 Detailed work plan for Experiment 2 9 A.5 3rd quarte rly progress report
C.2 Tables for laboratory data D.4 Comple te Experiment 2
10
D.5 Detailed work plans for Experiments 3 and 4 11 D.6 Comple te Experiment 3
A.6 4th quarterly progress report 12 5 .1 Initial selection of pavement sections for analysis A.7 2nd interim report: Selection of pavement sections for analysis D.7 Comple te Experiment 4
13
D.8 Detailed work plan for Experiment 5 14 A.8 1st presentation to the NCHRP panel: Interim reports 1 and 2
A.9 5th quarterly progress report 15 C.3 Tables for analysis of accelerated pavement tests
16 17 18 A.10 6th quarterly progress report 19 20 E.2 Final selection of LTPP sections for analysis
A.11 7th quarterly progress report 21 D.90 Comple te Experiment 5
22 A.12 3rd interim report: Analysis of laboratory studies 23 C.4 Tables for analysis of in-service pavement sections
A.13 8th quarterly progress report 24 E.3 Compile data from accelerated pavement sections and test roads
25 26
A.14 9th quarterly progress report B.3 Incorporate find ings from laboratory studies into NCHRP 9-44A Version 0.3 software
27
E.4 Comple te analysis of accelerated pavement tests and test roads 28 29 B.4 Modify approach based on analysis o f selected accelerated pavement tests and NCHRP 9-44A Version 0.3
software A.15 10th quarterly progress report 30 A.16 4th interim report: Design procedure incorporating findings f rom laboratory stud ies and analysis o f accelerated
pavement tests 31 A.17 2nd presentation to NCHRP Panel: In terim reports 3 and 4 32 E.5 Comple te data collection for LTPP sections 33 A.18 11th quarterly progress report 34 35 E.6 Comple te testing and analysis of LTPP sections 36 A.19 12th quarterly progress report 37 38 39 A.20 13th quarterly progress report 40
B.5 Prepare final design procedure and NCHRP 9-44A V ersion 1.0 software 41 C.5 Final database A.21 5th interim report: Analysis of validation sections and final design procedure 42 A.22 14th quarterly progress report
43 44
A.23 Submit preliminary draft final report 45 A.24 15th quarterly progress report
46 A.25 3rd presentation to the NCHRP panel: Preliminary draft final report and recommendations for implementation and additional research
47 48 A.26 Submit revised final report

104
Budget
The budget for the project is based on the labor hour estimates provided in the Task by Task
Description of the Research Plan and the loaded hourly rates presented in Table 32 for various
categories of labor. Travel costs were included for the panel meetings in Task A.3 and for the
LTPP site visits in Task E.4. Printing costs were also included in Task A.3 for each of the
Interim Reports and the Final Report. The overall budget is presented in Figure 23. Details of
the travel and printing estimates are provided in Tables 33 and 34, respectively.
Table 32. Labor Costs Used in Budget Preparation.
Labor Category Loaded Hourly Rate Senior Engineers and Statistician $150.00 Engineers and Programmers $100.00 Technicians $85.00 Administrative Support $60.00
Table 33. Travel Cost Estimate. Task Item Detail Estimate A.3 Transportation 3 presentations × 2 people × $800 per trip $4,800 A.3 Lodging & Per Diem 3 presentations × 2 people × 2 days × $265/day $3,180
Task 1.3 Total $7,980 E.4 Airfare 2 person × 16 projects × $800 per site $25,600 E.4 Rental Car 1 car × 4 days × 16 sites × $75.00/day $4,800 E.4 Lodging & Per Diem 2 × 5 days × 16 sites × $120.00/ day $19,200
Task E.4 Total $49,600
Table 34. Estimate of Report Printing Costs.
Report Pages Copies Cost /Page Cost Interim 1 300 20 $0.05 $300 Interim 2 300 20 $0.05 $300 Interim 3 300 20 $0.05 $300 Interim 4 300 20 $0.05 $300 Interim 5 300 20 $0.05 $300 Revised Final 300 100 $0.05 $1,500 Total $3,000

105
Senior Engineer
Engineer/ Programmer Technician Support
Senior Engineer
Engineer/ Programmer Technician Support Travel Printing Total
A.0 Management and ReportingA.1 Project Management 424 40 $63,600 $2,400 $66,000
A.2 Progress Reporting 210 20 $31,500 $1,200 $32,700
A.3 Inte rim Reports and Presentations 780 80 $117,000 $4,800 $7,980 $129,780
A.4 Final Report and Presentation 420 40 $63,000 $2,400 $3,000 $68,400
Task A Total 1834 180 $275,100 $10,800 $7,980 $3,000 $296,880
B.0 Formulate Des ign Procedure
B.1 Review Selected Literature 240 160 $36,000 $16,000 $52,000
B.2 Finalize Preliminary Report 80 160 $12,000 $16,000 $28,000
B.3 Incorporate Findings From Laboratory Studies 80 160 $12,000 $16,000 $28,000
B.4 Modify Approach Based on Analysis of Accelerated Pavement Tests 80 80 $12,000 $8,000 $20,000
B.5 Prepare Final Design Procedure 120 80 $18,000 $8,000 $26,000
Task B Total 600 640 $90,000 $64,000 $154,000
C.0 Database Management
C.1 Develop Plan to Use M-E_DPM Database 120 . $18,000 $0 $18,000
C.2 Develop Needed Tables 80 240 $12,000 $24,000 $36,000
C.3 Input and Manage data 40 396 $6,000 $39,600 $45,600
Task C Total 240 636 $36,000 $63,600 $99,600
D.0 Laboratory Studies
D.1 Experiment 1: Mixture Compositional Factors Affecting Healing 42 388 $6,300 $32,980 $39,280
D.2 Experiment 2: Effect of Applied St rain on Healing 32 214 $4,800 $18,190 $22,990
D.3 Experiment 3: Effect of Temperatu re and Rest Period Duration on Healing 69 242 $10,350 $20,570 $30,920
D.4 Experiment 4: Testing and Analysis Procedures for Allowab le Strain Leve ls 168 392 $25,200 $33,320 $58,520
D.5 Experiment 5: Est imation of Allowable Stra in Levels from Mixture Composit ion 456 1890 $68,400 $160,650 $229,050
Task D Total 767 3126 $115,050 $265,710 $380,760
E.0 Analysis of Field Sections
E.1 Review Data Sources and Select Sections for Analysis 52 320 $7,800 $32,000 $39,800
E.2 Obtain Materials and Da ta for Accelerated Pavement Tests and Test Roads 48 280 $7,200 $28,000 $35,200
E.3 Perform Lab Testing and Analyze Accelerated Pavement Tests and Test Roads 164 512 32 $24,600 $51,200 $2,720 $78,520
E.4 Obtain Materials and Da ta for In-Service Pavement Sections 120 1280 $18,000 $128,000 $49,600 $195,600
E.5 Perform Lab Testing and Analyze In-Service Pavement Sections 300 512 1280 $45,000 $51,200 $108,800 $205,000
Task E Total 684 2904 1312 $102,600 $290,400 $111,520 $49,600 $554,120
Grand Total 4125 4180 4438 180 $618,750 $418,000 $377,230 $10,800 $57,580 $3,000 $1,485,360
Task/Subtask
Estimated Level of EffortStaff Hours
Estimated CostsLabor
Figure 21. Project Budget.

106
The total cost of the the project is $1,485,360. Figure 24 provides a estimate of monthly
expenditures for the project. Monthly expenditures reach approximately $52,000 per month
when the laboratory experiments are being conducted.
Figure 22. Estimated Monthly and Cumulative Expenditures.
$0
$10,000
$20,000
$30,000
$40,000
$50,000
$60,000
0 2 4 6 8 10 12 14 16 18 20 22 24 26 28 30 32 34 36 38 40 42 44 46 48
Month After Contract Award
Estim
ated
Mon
thly
Exp
endi
ture
$0
$200,000
$400,000
$600,000
$800,000
$1,000,000
$1,200,000
$1,400,000
Estim
ate
Cum
mul
ativ
e Ex
pend
iture
MontlyCumulative

107
References
1. Advanced Asphalt Technologies, LLC, “Hot Mix Asphalt Endurance Limit Workshop: Executive Summary,” National Cooperative Highway Research Program Project 9-44, November, 2007.
2. Monismith, C.L., and McLean, D.B., “Structural Design Considerations,” Proceedings of
the Association of Asphalt Paving Technologists, Vol. 41, 1972. 3. Newcomb, D.E., Buncher, M., and Huddleston, I.J., “Concepts of Perpetual Pavements,”
Transportation Research Circular Number 503, Perpetual Bituminous Pavements, Transportation Research Board, Washington, D.C., December, 2001.
4. Carpenter, S.H., Ghuzlan, K.A., and Shen, S., “Fatigue Endurance Limit for Highway and
Airport Pavements,” Transportation Research Record No. 1832, Transportation Research Board, Washington, D.C., 2003.
5. Carpenter, S.H., and Shen, S., “Application of the Dissipated Energy Concept in Fatigue
Endurance Limit Testing,” Transportation Research Record No. 1929, Transportation Research Board, Washington, D.C., 2005.
6. Prowell, B., Brown, E., R., Daniel, J., Bhattacharjee, S., Von Quintus, H., Carpenter, S.,
Shen, S., Anderson, M., Swamy, A. K., and Maghsoodloo, S., “Endurance Limit of Hot Mix Asphalt Mixtures to Prevent Fatigue Cracking in Flexible Pavements,“ Updated Draft Final Report, NCHRP 9-38, National Cooperative Highway Research Program, Washington, D.C., May, 2008.
7. Carpenter, S.H., and Shen, S., “Dissipated Energy Approach to Study Hot-Mix Asphalt
Healing in Fatigue,” Transportation Research Record No. 1970, Transportation Research Board, Washington, D.C., 2006.
8. Kim, B. and Roque, R., “Evaluation of Healing Property of Asphalt Mixtures,”
Transportation Research Record No. 1970, Transportation Research Board, Washington, D.C., 2006.
9. Nunn, M. and Ferne, B.W., “Design and Assessment of Long-Life Flexible Pavements,”
Transportation Research Circular Number 503, Perpetual Bituminous Pavements, Transportation Research Board, Washington, D.C., December, 2001.
10. Brown, S.R., Thom, N.H., and Hakim, B.A., “Performance and Rehabilitation of Heavy-duty
Pavements in the UK: Some Case Studies,” Proceedings, International Symposium of Design and Construction of Long Lasting Asphalt Pavements, National Center for Asphalt Technology, Auburn, AL, 2004.
11. Wu, Z., Siddiqui, Z.Q., Hossain, M., and Gisi, A.J., “Kansas Turnpike – An Example of
Long Lasting Asphalt Pavement,” Proceedings, International Symposium of Design and

108
Construction of Long Lasting Asphalt Pavements, National Center for Asphalt Technology, Auburn, AL, 2004.
12. Uhlmeyer, J.S., Willoughby, K., Pierce, L.M., and Mahoney, J.P., “Top-Down Cracking in
Washington State Asphalt Concrete Wearing Courses,” Transportation Research Record No. 1730, Transportation Research Board, Washington, D.C., 2000.
13. Procedural Manual for Agencies Conducting Research in the National Cooperative Highway
Research Program, Transportation Research Board, August, 2006. 14. Preparing Your CRP Final Report, Transportation Research Board, September, 2006. 15. Timm, D., H., and Young, J., B., “Effects of Load Spectra and Variability on Perpetual
Pavement Design,” Proceedings, International Symposium of Design and Construction of Long Lasting Asphalt Pavements, National Center for Asphalt Technology, Auburn, AL, 2004.
16. Witczak, M.W., “Use of HMA Fatigue Endurance Limits in the Mechanistic-Empirical
Pavement Design Guide,” Presentation at the Hot Mix Asphalt Endurance Limit Workshop, August 1, 2007.
17. Thompson, M.R., ad Carpenter, S.H., “Design Principles for Long Lasting Pavement,”
Proceedings, International Symposium of Design and Construction of Long Lasting Asphalt Pavements, National Center for Asphalt Technology, Auburn, AL, 2004.
18. Sidess, A. and Uzan, J., “A Design Method for Perpetual Flexible Pavement in Israel,”
International Journal of Pavement Engineering, February, 2008. 19. Von Quintus, H. L., “Hot-Mix Asphalt Layer Thickness Design for Longer Life Bituminous
Pavements,” Transportation Research Circular Number 503, Perpetual Bituminous Pavements, Transportation Research Board, Washington, D.C., December, 2001.
20. Von Quintus, Harold L., “Application of the Endurance Limit in Mechanistic-Empirical
Based Pavement Design Procedures,” paper prepared for presentation and publication at the International Conference on Perpetual Pavements, Columbus, Ohio, September 13-15, 2006.
21. Tsai, B.W., Harvey, J., Monismith, C., and Bejarano, M., “Calibration of Fatigue Surface
Cracking Using Simplified Recursive Miner’s Law,” Journal of the Association of Asphalt Paving Technologists, Vol., 76, 2007.
22. Mun, S., Guddati, M. N., and Kim, Y. R., “Fatigue Cracking Mechanisms in Asphalt
Pavements with Viscoelastic Continuum Damage Finite-Element Program,” Transportation Research Record No. 1896, Transportation Research Board, Washington, D.C., 2004.

109
23. Roque, R., B. Birgisson, B. Sangpetngam and Z. Zhang, “Hot Mix Asphalt Fracture Mechanics: A Fundamental Crack Growth Law for Asphalt Mixtures,” Journal of the Association of Asphalt Paving Technologists, Vol. 71, 2002.
24. Bonnaure, F.P, Huibers, A.H.J.J., Boonders, A., “A Laboratory Investigation of the Influence
of Rest Periods on the Fatigue Response of Bituminous Mixes,” Proceedings, Association of Asphalt Paving Technologists, Vol. 51, 1982.
25. Chehab, G.R., Kim, Y.R., Schapery, R.A., Witczak, M.W., and Bonaquist, R.,
"Characterization of Asphalt Concrete in Uniaxial Tension Using a Viscoelastoplastic Continuum Damage Model," Journal of the Association of Asphalt Paving Technologists, Vol. 72, 2003.
26. Huang, Y. H., Pavement Analysis and Design, Englewood Cliffs, N.J.: Prentice-Hall, Inc.,
1993. 27. Al-Qadi, I., Xie, W., and Elseifi, M., “Frequency Determination from Vehicular Loading
Time Pulse to Predict Appropriate Complex Modulus in MEPDG," Paper P:reprint CD, Association of Asphalt Paving Annual Meeting and Technical Sessions, Philadelphia, PA, April 27-30, 2008.
28. Barksdale, R.G., “Compressive Stress Pulse Times in Flexible Pavements for Use in
Dynamic Testing,” Highway Research Record 345, Highway Research Board, Washington, D.C., 1971.
29. Mirza, M. W., and M. W. Witczak, “Development of a Global Aging System for Short and
Long Term Aging of Asphalt Cements,” Journal of the Association of Asphalt Paving Technologists, Vol. 64, 1995.
30. Transportation Research Board, Highway Capacity Manual, Special Report 209, Third
Edition, Transportation Research Board, Washington, DC 1994. 31. Hajek, J. J., Selezneva, O., I., Mladenovic, G., and Jiang, Y., J., “Estimating Cumulative
Traffic Loads, Volume II: Traffic Data Assessment and Axle Load Projection for the Sites With Acceptable Axle Weight Data, Final Report for Phase 2,” Report Number FHWA-RD-03-094, Federal Highway Administration, Washington, D.C., March, 2005.
32. Lytton, R L; Uzan, J; Fernando, E G; Roque, R; Hiltunen, D; Stoffels, S M, “Development
And Validation Of Performance Prediction Models And Specifications For Asphalt Binders And Paving Mixes,” Report Number SHRP-A-357, Strategic Highway Research Program, Washington, D.C., 1993.
33. Von Quintus, H.L., Schwartz, C., McQuen, R., and Andrei, D., “Experimental Plan for
Calibration and Validation of Hot-Mix Asphalt Performance Models for Mix and Structural Design,” Final Report for National Cooperative Highway Research Program Project 9-30, National Cooperative Highway Research Program, January, 2004.

110
34. Little, D. N., Lytton, R. L., Williams, D., and Chen, C. W., “Microdamage Healing in
Asphalt and Asphalt Concrete, Volume I: Microdamage and Microdamage Healing Project Summary Report,” Report Number FHWA-RD-98-141, Federal Highway Administration, Washington, D.C., June 2001.
35. Rao Tangella, S.C.S., Craus, J., Deacon, J.A., and Monismith, C.L., “Summary Report on
Fatigue Response of Asphalt Mixtures,” Report Number SHRP-A/IR-90-011, Strategic Highway Research Program, Washington, D.C., 1990.
36. Bonnaure, R., Gravois, A., and Udron, J., “A New Method for Predicting the Fatigue Life of
Bituminous Mixes,” Proceedings of the Association of Asphalt Paving Technologists, Vol. 49, 1980.
37. Lee, H., J., Daniel, J.S., and Kim, Y.R., “Laboratory Performance Evaluation of Modified
Asphalt Mixtures for Inchon Airport Pavements,” International Journal of Pavement Engineering, Volume 1, Number 2, 2000.
38. Walubita, L.F., Epps-Martin, A., Jung, S. H., Glover, C. J., Park, E.S., Chowdhury, A., and
Lytton, R. L., “Comparison of Fatigue Analysis Approaches for Two Hot Mix Asphalt Concrete (HMAC) Mixtures, Report Number FHWA/TX-05/0-4468-2, Texas Department of Transportation, Austin, TX, August, 2005.
39. Christensen, D.W., and Bonaquist, R.F., “Volumetric Requirements for Superpave Mix
Design,” NCHRP Report 567, National Cooperative Highway Research Program, Washington, D.C., 2006.
40. Prowell, B. D., and Brown, E. R., “Superpave Mix Design: Verifying the Gyration Levels in
the Ndesign Table,” NCHRP Report 573, National Cooperative Highway Research Program, Washington, D.C., 2007.
41. Epps, J. A., Hand, A., Seeds, S., Schultz, T., Alavi, S., Ashmore, C., Monismith, C., Deacon,
J.A., Harvey, J.T., and Leahy, R., “Recommended Performance Related Specifications for Hot-Mix Asphalt Construction: Results of the WesTrack Project,” NCHRP Report 455, National Cooperative Highway Research Program, Washington, D.C., 2002.
42. Kim, Y.R., and Little, D.N., “One Dimensional Constitutive Modeling of Asphalt Concrete,”
ASCE Journal of Engineering Mechanics, Vol. 116, No. 4, 1990. 43. Lundstrom, R., and Isacsson, U., “Characterization of Asphalt Concrete Deterioration Using
Monotonic and Cyclic Tests,” International Journal of Pavement Engineering, Vol. 4, No. 3, September, 2003.
44. Christensen, D.W., and Bonaquist, R.F., “Practical Application of Continuum Damage
Theory to Fatigue Phenomena in Asphalt Concrete Mixtures,” Journal of the Association of Asphalt Paving Technologists, Vol. 74, 2005.
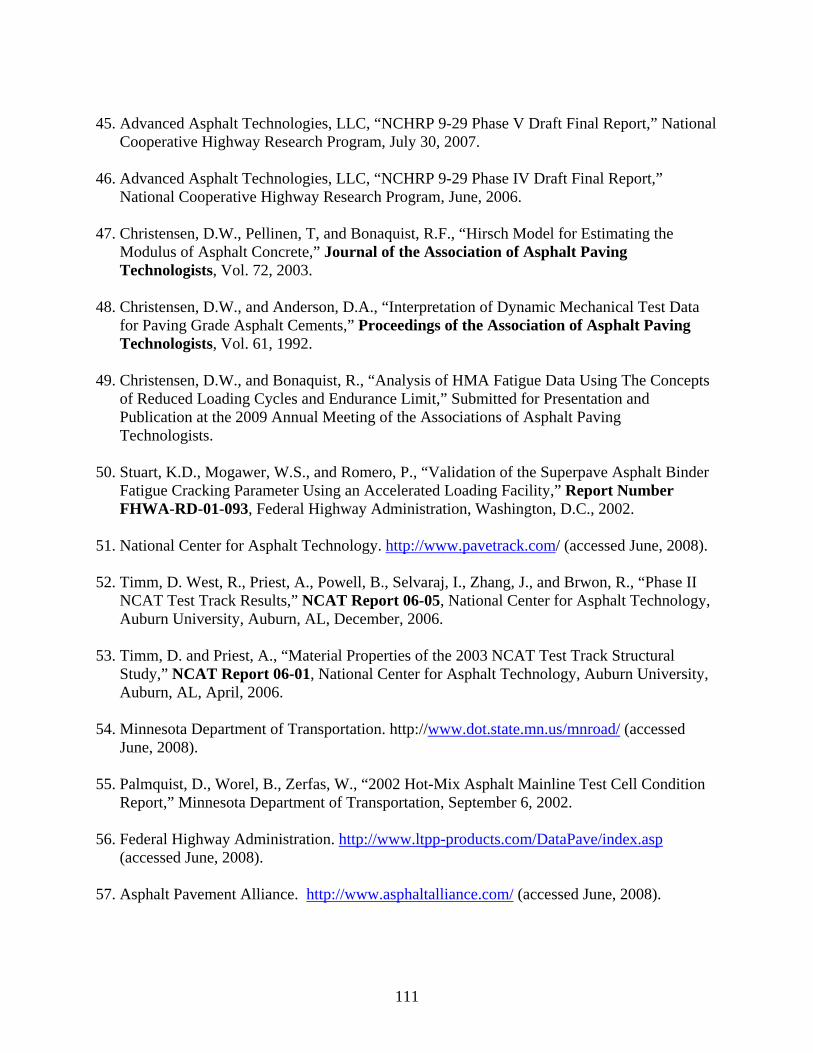
111
45. Advanced Asphalt Technologies, LLC, “NCHRP 9-29 Phase V Draft Final Report,” National
Cooperative Highway Research Program, July 30, 2007. 46. Advanced Asphalt Technologies, LLC, “NCHRP 9-29 Phase IV Draft Final Report,”
National Cooperative Highway Research Program, June, 2006. 47. Christensen, D.W., Pellinen, T, and Bonaquist, R.F., “Hirsch Model for Estimating the
Modulus of Asphalt Concrete,” Journal of the Association of Asphalt Paving Technologists, Vol. 72, 2003.
48. Christensen, D.W., and Anderson, D.A., “Interpretation of Dynamic Mechanical Test Data
for Paving Grade Asphalt Cements,” Proceedings of the Association of Asphalt Paving Technologists, Vol. 61, 1992.
49. Christensen, D.W., and Bonaquist, R., “Analysis of HMA Fatigue Data Using The Concepts
of Reduced Loading Cycles and Endurance Limit,” Submitted for Presentation and Publication at the 2009 Annual Meeting of the Associations of Asphalt Paving Technologists.
50. Stuart, K.D., Mogawer, W.S., and Romero, P., “Validation of the Superpave Asphalt Binder
Fatigue Cracking Parameter Using an Accelerated Loading Facility,” Report Number FHWA-RD-01-093, Federal Highway Administration, Washington, D.C., 2002.
51. National Center for Asphalt Technology. http://www.pavetrack.com/ (accessed June, 2008). 52. Timm, D. West, R., Priest, A., Powell, B., Selvaraj, I., Zhang, J., and Brwon, R., “Phase II
NCAT Test Track Results,” NCAT Report 06-05, National Center for Asphalt Technology, Auburn University, Auburn, AL, December, 2006.
53. Timm, D. and Priest, A., “Material Properties of the 2003 NCAT Test Track Structural
Study,” NCAT Report 06-01, National Center for Asphalt Technology, Auburn University, Auburn, AL, April, 2006.
54. Minnesota Department of Transportation. http://www.dot.state.mn.us/mnroad/ (accessed
June, 2008). 55. Palmquist, D., Worel, B., Zerfas, W., “2002 Hot-Mix Asphalt Mainline Test Cell Condition
Report,” Minnesota Department of Transportation, September 6, 2002. 56. Federal Highway Administration. http://www.ltpp-products.com/DataPave/index.asp
(accessed June, 2008). 57. Asphalt Pavement Alliance. http://www.asphaltalliance.com/ (accessed June, 2008).

112
58. Worel, B., “MnRoad Database Guide,” Minnesota Department of Transportation, January, 2006
59. NCHRP Project 9-19, “Binder Characterization, Team Report BC-4, “Rheological
Characterization of the FHWA-ALF Binders,” PDF File No, 04-E, CRP-CD-46, National Cooperative Highway Research Program, 2005.
60. NCHRP Project 9-19, “Binder Characterization, Team Report BC-5, “Rheological
Characterization of the WesTrack Binders,” PDF File No, 04-F, CRP-CD-46, National Cooperative Highway Research Program, 2005.
61. NCHRP Project 9-19, “Binder Characterization, Team Report BC-3, “Rheological
Characterization of the MnRoad Binders,” PDF File No. 04-D, CRP-CD-46, National Cooperative Highway Research Program, 2005.
62. Von Quintus, et al., Nondestructive Testing Technology for Quality Control and Acceptance
of Flexible Pavement Construction; Volume I - Procedure Manual, Final Report, NCHRP Project 10-65, June 2008
63. Geomedia Research and Development, http://geomedia.us/ (accessed June, 2008) 64. VonQuintus, H.L, Schwartz, C.E., McCuen, R.H., and Andrei, D., “Jackknife Testing – An
Experimental Approach to Refine Model Calibration and Validation,” Research Results Digest Number 283, National Cooperative Highway Research Program, Washington, D.C, December, 2003.

113
Appendix A: Recommended LTPP Test Sections
The following provides location and summary information for the LTPP test sections that are applicable for use in confirming the endurance limit and values. The distress information listed for each test sections are the values included within the LTPP database. Specifically, the longitudinal cracking and transverse cracking values are in meters, while the block and alligator cracking values are in square meters.

114
LTPP Site Identification Number: 0103 State: Alabama (01) Roadway or Route No.: US-280 Date of Construction: April 1991 Status: In Service Location: Longitude: 85.25 Latitude: 32.62 Elevation: 151 Pavement Cross Section:
Layer Material Type Thickness, inches 4 HMA Hot Mixed, Hot Laid HMA, Dense Graded (1) 1.5 3 HMA Hot Mixed, Hot Laid HMA, Dense Graded (1) 3.1 2 ATB Asphalt Treated Base (319) 7.4 1 Subgrade Soil Sandy Lean Clay (114) ---
Traffic Data: Number of Years with Data: AADTT (One-way): Year: KESALS per year: Unbound Layers Resilient Modulus: Layer Material/Soil Type Equivalent Resilient Modulus, ksi
1 Sandy Lean Clay 6
Hot Mix Asphalt Mixtures: Equivalent Annual Modulus of HMA: 200 Type of Asphalt: PG64-22 HMA HMA ATB Asphalt Content, % 5.1 4.0 4.3 Air Voids, % 3.3 5.1 11.6 Gradation; percent passing: #3/4 #3/8 #4 #40 #200 HMA 100 83 61 24 6.7 HMA 90 66 48 21 7.2 ATB 90 65 42 18 5.6 Tensile Strain at Bottom of HMA Layer: Total Amount of Fatigue Cracking: Year Alligator Block Long. Transverse Year Alligator Block Long. Transverse 1994 0 0 0 0 2001 22.9 0 9.7 0 1995 0 0 0 0 2002 28.7 0 0 1.5 1996 0 0 0 0 2003 34.4 0 0 7.9 2000 34.9 0 30.6 0 2004 40.1 0 0 8.7 2005 41.4 0 0 8.0

115
LTPP Site Identification Number: 0101 State: Alabama (01) Roadway or Route No.: US-280 Date of Construction: April 1991 Status: In Service Location: Longitude: 85.25 Latitude: 32.62 Elevation: 151 Pavement Cross Section:
Layer Material Type Thickness, inches 4 HMA Hot Mixed, Hot Laid HMA, Dense Graded (1) 1.3 3 HMA Hot Mixed, Hot Laid HMA, Dense Graded (1) 6.2 2 GB Crushed Stone, Granular Base (303) 7.9 1 Subgrade Soil Sandy Silt (145) ---
Traffic Data: Number of Years with Data: AADTT (One-way): Year: KESALS per year: Unbound Layers Resilient Modulus: Layer Material/Soil Type Equivalent Resilient Modulus, ksi
1 Sandy Lean Clay 6
Hot Mix Asphalt Mixtures: Equivalent Annual Modulus of HMA: 200 Type of Asphalt: PG64-22 HMA HMA Asphalt Content, % Air Voids, % Gradation; percent passing: #3/4 #3/8 #4 #40 #200 HMA HMA Tensile Strain at Bottom of HMA Layer: Total Amount of Fatigue Cracking: Year Alligator Block Long. Transverse Year Alligator Block Long. Transverse 1995 0 0 0 0 2001 25.3 0 13.7 0.8 1996 1.2 0 4.5 0 2002 31.1 0 0 3.5 1997 0 0 37.5 0 2003 64.9 0 0 14.6 1998 3.0 0 0.2 0.3 2004 68.0 0 0 15.7 2000 38.6 0 16.2 0.6 2005 70.4 0 0 14.6

116
LTPP Site Identification Number: 0111 State: Alabama (01) Roadway or Route No.: US 280 Date of Construction: April 1991 Status: In Service Location: Longitude: 85.25 Latitude: 32.61 Elevation: 151 Pavement Cross Section:
Layer Material Type Thickness, inches 4,5 HMA Hot Mixed, Hot Laid AC, Dense Graded (1) 4.0 3 ATB Hot Mixed, Hot Laid AC Dense Graded Mix (319) 7.9 2 PATB Open-Graded Hot Laid Mix (325) 3.7 1 Subgrade Soil Silt with Sand (143) ---
Traffic Data: Number of Years with Data: AADTT (One-way): Year: KESALS per year: Unbound Layers Resilient Modulus: Layer Material/Soil Type Equivalent Resilient Modulus, ksi
1 Silt with Sand 5
Hot Mix Asphalt Mixtures: Equivalent Annual Modulus of HMA: 200 Type of Asphalt: PG62-22 HMA HMA ATB PATB Asphalt Content, % 5.2 4.0 4.3 2.2 Air Voids, % 3.3 5.1 11.6 --- Gradation; percent passing: #3/4 #3/8 #4 #40 #200 HMA 100 83 61 24 6.7 HMA 90 66 48 21 7.2 ATB 90 65 42 18 5.6 PATB 71 19 10 7.0 4.3 Tensile Strain at Bottom of HMA Layer: 144.29 Total Amount of Fatigue Cracking: Year Alligator Block Long. Transverse Year Alligator Block Long. Transverse 1994 0 0 0 0 2001 92.7 0 0.5 0 1995 0 0 0 0 2001 67.8 0 0 1.2 1996 0 0 5.5 0 2003 86.4 0 0 2.4 2000 60.2 0 23.2 0 2004 86.9 0 0 3.3
2005 89.0 0 0 3.5

117
LTPP Site Identification Number: 0116 State: Arizona (04) Roadway or Route No.: US 93 Date of Construction: Jan. 1993 Status: In Service Location: Longitude: 114.2 Latitude: 35.39 Elevation: 3580 Pavement Cross Section:
Layer Material Type Thickness, inches 4 AC Surface Seal (72), 2003 3 HMA Hot Mixed, Hot Laid AC, Dense Graded (1)
4.0
2 ATB Hot Mix, Hot Laid, AC, Dense Graded (1) 12.1 1 Subgrade Soil Silty Sand with Gravel (215) 132
Traffic Data: Number of Years with Data: 3 AADTT (One-way): 1190 Year: 1995 KESALS per year: 300 Unbound Layers Resilient Modulus: Layer Material/Soil Type Equivalent Resilient Modulus. ksi
1 Silty Sand with Gravel 4 Last 5
Hot Mix Asphalt Mixtures: Equivalent Annual Modulus of HMA: 200 Type of Asphalt: HMA ATB Asphalt Content, % 4.7 4.5 Air Voids, % 10.3 6.1 Gradation; percent passing: #3/4 #3/8 #4 #40 #200 HMA 99 82 64 18 3.9 ATB 88 72 56 16 4.0 Tensile Strain at Bottom of HMA Layer: 142.48 Total Amount of Fatigue Cracking: Year Alligator Block Long. Transverse Year Alligator Block Long. Transverse 1995 0 0 0 0 2002 69.9 0 16.2 1.5 1998 0 0 0 0 2003 5.8 0 19.2 1.1 1999 1.4 0 2.1 0 2004 11.2 0 17.3 2.8 2000 4 0 3.3 0 2005 11.6 0 28.5 5.3 2001 9.9 0 22 0

118
LTPP Site Identification Number: 04-0162 State: Arizona (04) Roadway or Route No.: US 93 Date of Construction: Jan. 1993 Status: In Service Location: Longitude: 114.2 Latitude: 35.39 Elevation: 3580 Pavement Cross Section:
Layer Material Type Thickness, inches
3 AC Seal Coat (72), 2003 2 HMA Hot Mixed, Hot Laid AC, Dense Graded (1)
9.0
1 Subgrade Soil Well Graded Gravel with Sand & Silt (261) --- Traffic Data: Number of Years with Data: 3 AADTT (One-way): 1190 Year: 1995 KESALS per year: 300 Unbound Layers Resilient Modulus: Layer Material/Soil Type Equivalent Resilient Modulus. ksi
1 Silty Sand with Gravel 5
Hot Mix Asphalt Mixtures: Equivalent Annual Modulus of HMA: 200 Type of Asphalt: HMA Asphalt Content, % Air Voids, % Gradation; percent passing: #3/4 #3/8 #4 #40 #200 HMA Tensile Strain at Bottom of HMA Layer: Total Amount of Fatigue Cracking: Year Alligator Block Long. Transverse Year Alligator Block Long. Transverse 1995 0 0 0 0 2002 1.7 0 3.8 2.0 1998 0 0 0 0 2005 2.8 0 4.5 10.4 1999 0 0 0 0 2006 4.4 0 1.4 20.4 2000 0 0 0 0 2001 0 0 1.0 0

119
LTPP Site Identification Number: 1062 State: Arizona (04) Roadway or Route No.: I 40 Date of Construction: 10-1-1977 Status: Milled/Overlay; Friction Course Location: Longitude: 113.34 Latitude: 35.19 Elevation: 5060 Pavement Cross Section:
Layer Material Type Thickness, inches 6 AC Open-Graded Friction Course (82); 9-1999 0.3 5 AC Open Graded, Sand Seal (2) 4 HMA Hot Mixed, Hot Laid AC, Dense Graded (1)
4.6 – after milling (5.8 – Original)
3 ATB Asphalt Treated Mixture (321) 11.2 2 TS Lime Treated Mixture (338) 6 1 Subgrade Soil Clayey Gravel with Sand (267) 54
Traffic Data: Number of Years with Data: 8 AADTT (One-way): 1900 Year: 1998 KESALS per year: 1200 Unbound Layers Resilient Modulus: Layer Material/Soil Type Equivalent Resilient Modulus, ksi
2 Lime Treated Mixture 28 1 Clayey Gravel with Sand 15
Hot Mix Asphalt Mixtures: Equivalent Annual Modulus of HMA: 450 Type of Asphalt: HMA Asphalt Content, % 5.3 Air Voids, % 5.5 Gradation; percent passing: #3/4 #3/8 #4 #40 #200 HMA 80.5 57 48.5 14.5 7.4 Tensile Strain at Bottom of HMA Layer: 49.15 Total Amount of Fatigue Cracking: Year Alligator Block Long. Transverse Year Alligator Block Long. Transverse 1996 0 0 0 6.4 2005 7.0 0 1.4 0.6 1998 0 0 0 8.7 2000 0 0 0 0 2003 0 0 0 0

120
LTPP Site Identification Number: 1065 State: Arizona (04) Roadway or Route No.: I 40 Date of Construction: 10-1-1977 Status: Milled/Overlay; Friction Course Location: Longitude: 113.26 Latitude: 35.2 Elevation: 5301 Pavement Cross Section:
Layer Material Type Thickness, inches 5 AC Open-Graded Friction Course (82); 9-1999 0.3 4 AC Hot Mixed, Hot Laid AC, Dense Graded (1) 5.3 3 TB Asphalt Treated Mixture (319) 13.7 2 TS Lime Treated Soil (338) 5 1 Subgrade Soil Clayey Gravel with Sand (A-2-6) ---
Traffic Data: Number of Years with Data: 8 AADTT (One-way): 1900 Year: 1998 KESALS per year: 1200 Unbound Layers Resilient Modulus: Layer Material/Soil Type Equivalent Resilient Modulus, ksi
2 Lime Treated Soil 28 1 Clayey Gravel with Sand 15
Hot Mix Asphalt Mixtures: Equivalent Annual Modulus of HMA: 450 Type of Asphalt: HMA Asphalt Content, % 5.6 Air Voids, % 4.2 Gradation; percent passing: #3/4 #3/8 #4 #40 #200 HMA 77 54.5 47.5 14.5 7.2 Tensile Strain at Bottom of HMA Layer: 39.96 Total Amount of Fatigue Cracking: Year Alligator Block Long. Transverse Year Alligator Block Long. Transverse 1992 0 0 0 0 2005 0 0 2.7 0.7 1998 0 0 0 12.2 2000 0 0 0 0 2003 0 0 0 0.3
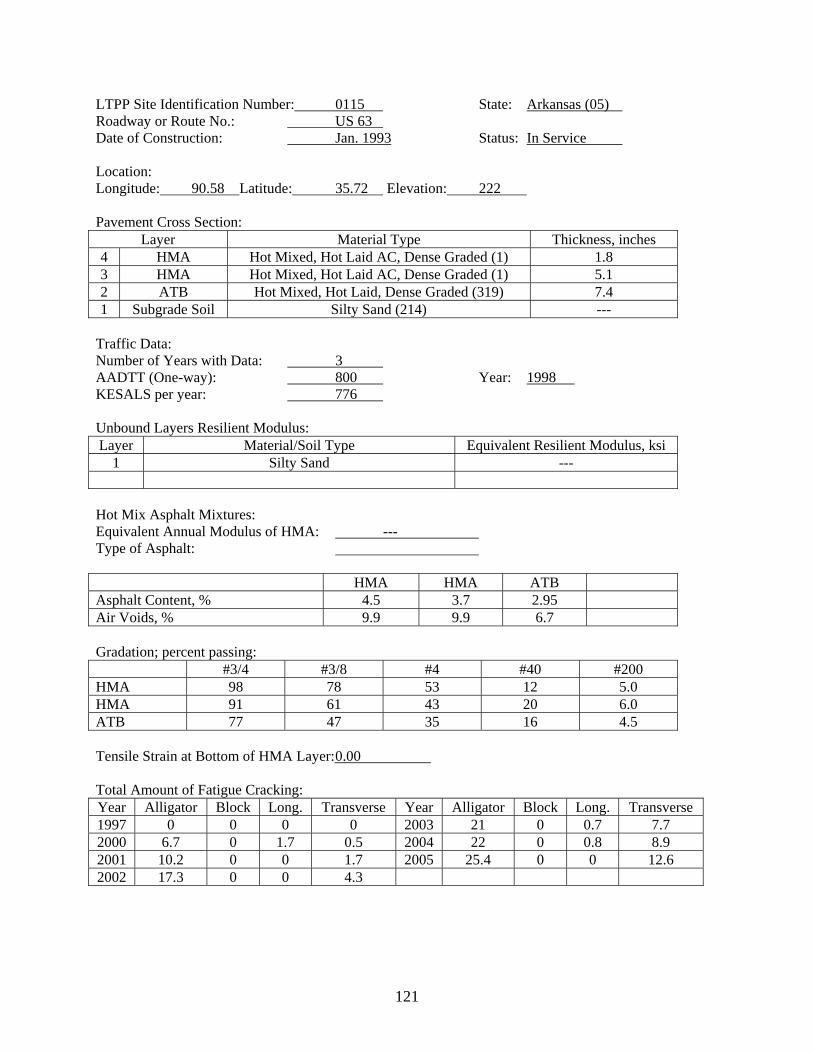
121
LTPP Site Identification Number: 0115 State: Arkansas (05) Roadway or Route No.: US 63 Date of Construction: Jan. 1993 Status: In Service Location: Longitude: 90.58 Latitude: 35.72 Elevation: 222 Pavement Cross Section:
Layer Material Type Thickness, inches 4 HMA Hot Mixed, Hot Laid AC, Dense Graded (1) 1.8 3 HMA Hot Mixed, Hot Laid AC, Dense Graded (1) 5.1 2 ATB Hot Mixed, Hot Laid, Dense Graded (319) 7.4 1 Subgrade Soil Silty Sand (214) ---
Traffic Data: Number of Years with Data: 3 AADTT (One-way): 800 Year: 1998 KESALS per year: 776 Unbound Layers Resilient Modulus: Layer Material/Soil Type Equivalent Resilient Modulus, ksi
1 Silty Sand ---
Hot Mix Asphalt Mixtures: Equivalent Annual Modulus of HMA: --- Type of Asphalt: HMA HMA ATB Asphalt Content, % 4.5 3.7 2.95 Air Voids, % 9.9 9.9 6.7 Gradation; percent passing: #3/4 #3/8 #4 #40 #200 HMA 98 78 53 12 5.0 HMA 91 61 43 20 6.0 ATB 77 47 35 16 4.5 Tensile Strain at Bottom of HMA Layer: 0.00 Total Amount of Fatigue Cracking: Year Alligator Block Long. Transverse Year Alligator Block Long. Transverse 1997 0 0 0 0 2003 21 0 0.7 7.7 2000 6.7 0 1.7 0.5 2004 22 0 0.8 8.9 2001 10.2 0 0 1.7 2005 25.4 0 0 12.6 2002 17.3 0 0 4.3

122
LTPP Site Identification Number: 0114 State: Arkansas (05) Roadway or Route No.: US 63 Date of Construction: Jan. 1993 Status: In Service Location: Longitude: 90.58 Latitude: 35.72 Elevation: 222 Pavement Cross Section:
Layer Material Type Thickness, inches 4 HMA Hot Mixed, Hot Laid AC, Dense Graded (1) 1.5 3 HMA Hot Mixed, Hot Laid AC, Dense Graded (1) 5.5 2 GB Crushed Stone, Granular Base (303) 11.3 1 Subgrade Soil Silty Sand (214) ---
Traffic Data: Number of Years with Data: 3 AADTT (One-way): 800 Year: 1998 KESALS per year: 776 Unbound Layers Resilient Modulus: Layer Material/Soil Type Equivalent Resilient Modulus, ksi
1 Silty Sand ---
Hot Mix Asphalt Mixtures: Equivalent Annual Modulus of HMA: --- Type of Asphalt: HMA HMA Asphalt Content, % Air Voids, % Gradation; percent passing: #3/4 #3/8 #4 #40 #200 HMA HMA Tensile Strain at Bottom of HMA Layer: Total Amount of Fatigue Cracking: Year Alligator Block Long. Transverse Year Alligator Block Long. Transverse 1997 0 0 0 0 2003 39.8 0 0 18.6 2000 6.2 0 2.3 0.4 2004 59.1 0 1.2 37.3 2001 10.7 0 1.0 2.4 2005 81.6 0 0 79.3 2002 31.2 0 0 9.7

123
LTPP Site Identification Number: 0116 State: Arkansas (05) Roadway or Route No.: US 63 Date of Construction: Jan. 1993 Status: In Service Location: Longitude: 90.58 Latitude: 35.72 Elevation: 222 Pavement Cross Section:
Layer Material Type Thickness, inches 4 HMA Hot Mixed, Hot Laid AC, Dense Graded (1) 1.6 3 HMA Hot Mixed, Hot Laid AC, Dense Graded (1) 2.5 2 ATB Hot Mixed, Hot Laid, Dense Graded (319) 12.0 1 Subgrade Soil Poorly Graded Sand with Silt (204) ---
Traffic Data: Number of Years with Data: 3 AADTT (One-way): 800 Year: 1998 KESALS per year: 776 Unbound Layers Resilient Modulus: Layer Material/Soil Type Equivalent Resilient Modulus, ksi
1 Silty Sand ---
Hot Mix Asphalt Mixtures: Equivalent Annual Modulus of HMA: --- Type of Asphalt: HMA HMA ATB Asphalt Content, % Air Voids, % Gradation; percent passing: #3/4 #3/8 #4 #40 #200 HMA HMA ATB Tensile Strain at Bottom of HMA Layer: Total Amount of Fatigue Cracking: Year Alligator Block Long. Transverse Year Alligator Block Long. Transverse 1997 0 0 0 0 2003 15.5 0 0 11.7 2000 2.7 0 0.7 1.4 2004 15.5 0 0 16.9 2001 5.4 0 0 0.8 2005 19.9 0 0 21.1 2002 10.8 0 0 6.3

124
LTPP Site Identification Number: 3071 State: Arkansas (05) Roadway or Route No.: US 71 Date of Construction: 7-1-1987 Status: In Service Location: Longitude: 94.15 Latitude: 36.26 Elevation: 1311 Pavement Cross Section:
Layer Material Type Thickness, inches 6 AC Seal Coat (72); Placed after construction 0.4 5 AC Seal Coat (71) 0.5 4 HMA Hot Mixed, Hot Laid AC, Dense Graded (1) 1.5 3 HMA Hot Mixed, Hot Laid AC, Dense Graded (1) 3.9 2 ATB Hot Mix, Hot Laid, Dense Graded (319) 10.5 1 Subgrade Soil Lean Clay (214) ---
Traffic Data: Number of Years with Data: 6 AADTT (One-way): 2925 Year: 1998 KESALS per year: 3102 Unbound Layers Resilient Modulus: Layer Material/Soil Type Equivalent Resilient Modulus, ksi
1 Subgrade Soil/Lean Clay 5
Hot Mix Asphalt Mixtures: Equivalent Annual Modulus of HMA: 450 Type of Asphalt: HMA HMA Asphalt Content, % 4.9 4.45 Air Voids, % 3.7 6.0 Gradation; percent passing: #3/4 #3/8 #4 #40 #200 HMA 100 80 64 30 8.5 HMA 84 58 45 21 7.4 Tensile Strain at Bottom of HMA Layer: 69.28 Total Amount of Fatigue Cracking: Year Alligator Block Long. Transverse Year Alligator Block Long. Transverse 1991 0 0 0 0 1999 0 0 0 0 1994 0 0 1 0 2000 0 0 0 2.2 1995 0 0 0 0 2003 0.7 0 0 60.7 1997 0 0 0 0 2004 0.6 0 0 95.9

125
LTPP Site Identification Number: 0106 State: Florida (12) Roadway or Route No.: US 27 Date of Construction: Jan. 1993 Status: In Service Location: Longitude: 80.69 Latitude: 26.54 Elevation: 14 Pavement Cross Section:
Layer Material Type Thickness, inches 5 HMA Hot Mixed, Hot Laid AC, Dense Graded (1) 2.1 4 HMA Hot Mixed, Hot Laid AC, Dense Graded (1) 5.0 3 ATB Hot Mixed, Hot Laid AC, Dense Graded (319) 8.4 2 GB Crushed Stone (303) 4 1 Subgrade Soil Silty Sand with Gravel (215) 87.6
Traffic Data: Number of Years with Data: AADTT (One-way): Year: KESALS per year: Unbound Layers Resilient Modulus: Layer Material/Soil Type Equivalent Resilient Modulus, ksi
2 Crushed Stone 25 1 Silty Sand with Gravel 12
Hot Mix Asphalt Mixtures: Equivalent Annual Modulus of HMA: 450 Type of Asphalt: HMA HMA ATB Asphalt Content, % 6.2 5.2 2.5 Air Voids, % 8.1 5.5 4.6 Gradation; percent passing: #3/4 #3/8 #4 #40 #200 HMA 100 90 68 28 3.1 HMA 99 77 60 25 3.2 ATB Tensile Strain at Bottom of HMA Layer: 60.33 Total Amount of Fatigue Cracking: Year Alligator Block Long. Transverse Year Alligator Block Long. Transverse 1996 0 0 0 0 2003 0 0 0 0 2000 0 0 0 0 2004 0 0 1.7 1.1 2001 0 0 0 0 2005 0 0 2.3 1.3 2002 0 0 0 0

126
LTPP Site Identification Number: 0104 State: Florida (12) Roadway or Route No.: US 27 Date of Construction: Jan. 1993 Status: In Service Location: Longitude: 80.69 Latitude: 26.54 Elevation: 14 Pavement Cross Section:
Layer Material Type Thickness, inches 4 HMA Hot Mixed, Hot Laid AC, Dense Graded (1) 1.9 3 HMA Hot Mixed, Hot Laid AC, Dense Graded (1) 4.9 2 ATB Hot Mixed, Hot Laid, Dense Graded (319) 12.1 1 Subgrade Soil Poorly Graded Sand with Silt and Gravel (205) 87.6
Traffic Data: Number of Years with Data: AADTT (One-way): Year: KESALS per year: Unbound Layers Resilient Modulus: Layer Material/Soil Type Equivalent Resilient Modulus, ksi
1 Poorly Graded Sand with Silt and Gravel 5
Hot Mix Asphalt Mixtures: Equivalent Annual Modulus of HMA: 450 Type of Asphalt: HMA HMA ATB Asphalt Content, % 6.2 5.2 2.5 Air Voids, % 4.2 3.9 5.9 Gradation; percent passing: #3/4 #3/8 #4 #40 #200 HMA 100 90 68 28 3.1 HMA 99 77 60 25 3.2 ATB Tensile Strain at Bottom of HMA Layer: 45.71 Total Amount of Fatigue Cracking: Year Alligator Block Long. Transverse Year Alligator Block Long. Transverse 1996 0 0 0 0 2003 0 0 0 0 2000 0 0 0 0 2004 0.2 0 0 0 2001 0 0 0 0 2005 0.5 0 1.2 0 2002 0 0 0 0

127
LTPP Site Identification Number: 0101 State: Florida (12) Roadway or Route No.: US 27 Date of Construction: Jan. 1993 Status: In Service Location: Longitude: 80.69 Latitude: 26.54 Elevation: 14 Pavement Cross Section:
Layer Material Type Thickness, inches
4 HMA Hot Mixed, Hot Laid AC, Dense Graded (1) 2.0 3 HMA Hot Mixed, Hot Laid AC, Dense Graded (1) 4.8 2 GB Crushed Stone (303) 8.1 1 Subgrade Soil Silty Sand with Gravel (215) 68.4
Traffic Data: Number of Years with Data: AADTT (One-way): Year: KESALS per year: Unbound Layers Resilient Modulus: Layer Material/Soil Type Equivalent Resilient Modulus, ksi
2 Crushed Stone 25 1 Silty Sand with Gravel 12
Hot Mix Asphalt Mixtures: Equivalent Annual Modulus of HMA: Type of Asphalt: HMA HMA Asphalt Content, % Air Voids, % Gradation; percent passing: #3/4 #3/8 #4 #40 #200 HMA HMA Tensile Strain at Bottom of HMA Layer: Total Amount of Fatigue Cracking: Year Alligator Block Long. Transverse Year Alligator Block Long. Transverse 1996 0 0 0 0 2003 0 0 0 0 2000 0 0 0 0 2004 0.1 0 0 0.3 2001 0 0 0 0 2005 0.2 0 0 0.8 2002 0 0 0 0

128
LTPP Site Identification Number: 0103 State: Florida (12) Roadway or Route No.: US 27 Date of Construction: Jan. 1993 Status: In Service Location: Longitude: 80.69 Latitude: 26.54 Elevation: 14 Pavement Cross Section:
Layer Material Type Thickness, inches
4 HMA Hot Mixed, Hot Laid AC, Dense Graded (1) 2.0 3 HMA Hot Mixed, Hot Laid AC, Dense Graded (1) 2.1 2 ATB Hot Mixed, Hot Laid AC, Dense Graded (319) 8.0 1 Subgrade Soil Poorly Graded Sand with Gravel & Silt (205) 87.6
Traffic Data: Number of Years with Data: AADTT (One-way): Year: KESALS per year: Unbound Layers Resilient Modulus: Layer Material/Soil Type Equivalent Resilient Modulus, ksi
1 Silty Sand with Gravel 12
Hot Mix Asphalt Mixtures: Equivalent Annual Modulus of HMA: 450 Type of Asphalt: HMA HMA ATB Asphalt Content, % Air Voids, % Gradation; percent passing: #3/4 #3/8 #4 #40 #200 HMA HMA ATB Tensile Strain at Bottom of HMA Layer: Total Amount of Fatigue Cracking: Year Alligator Block Long. Transverse Year Alligator Block Long. Transverse 1996 0 0 0 0 2003 0.6 0 0 0 2000 0 0 0 0 2004 2.6 0 0.6 0 2001 0 0 0 0 2005 3.4 0 7.8 0 2002 0 0 0.4 0

129
LTPP Site Identification Number: 0107 State: Florida (12) Roadway or Route No.: US 27 Date of Construction: Jan. 1993 Status: In Service Location: Longitude: 80.69 Latitude: 26.54 Elevation: 14 Pavement Cross Section:
Layer Material Type Thickness, inches
4 HMA Hot Mixed, Hot Laid AC, Dense Graded (1) 3.8 3 ATB Hot Mixed, Hot Laid AC, Dense Graded (325) 4.1 2 GB Crushed Stone (303) 4.1 1 Subgrade Soil Poorly Graded Sand with Gravel & Silt (205) 105.6
Traffic Data: Number of Years with Data: AADTT (One-way): Year: KESALS per year: Unbound Layers Resilient Modulus: Layer Material/Soil Type Equivalent Resilient Modulus, ksi
2 Crushed Stone 25 1 Silty Sand with Gravel 12
Hot Mix Asphalt Mixtures: Equivalent Annual Modulus of HMA: Type of Asphalt: HMA HMA ATB Asphalt Content, % Air Voids, % Gradation; percent passing: #3/4 #3/8 #4 #40 #200 HMA HMA ATB Tensile Strain at Bottom of HMA Layer: Total Amount of Fatigue Cracking: Year Alligator Block Long. Transverse Year Alligator Block Long. Transverse 1996 0 0 0 0 2003 1.6 0 5.9 0 2000 0 0 0 0 2004 11.6 0 54.3 0.3 2001 0 0 0 0 2005 12.1 0 52.8 0.6 2002 0 0 0 0

130
LTPP Site Identification Number: 0111 State: Florida (12) Roadway or Route No.: US 27 Date of Construction: Jan. 1993 Status: In Service Location: Longitude: 80.69 Latitude: 26.54 Elevation: 14 Pavement Cross Section:
Layer Material Type Thickness, inches 5 HMA Hot Mixed, Hot Laid AC, Dense Graded (1) 1.8 4 HMA Hot Mixed, Hot Laid AC, Dense Graded (1) 2.1 3 ATB HMAC, Hot Laid, Dense Graded (319) 8.2 2 PATB Open Graded Hot Mix, Hot Laid (325) 4.0 1 Subgrade Soil Silty Sand with Gravel (215) 75.6
Traffic Data: Number of Years with Data: AADTT (One-way): Year: KESALS per year: Unbound Layers Resilient Modulus: Layer Material/Soil Type Equivalent Resilient Modulus, ksi
1 Silty Sand with Gravel 12
Hot Mix Asphalt Mixtures: Equivalent Annual Modulus of HMA: 450 Type of Asphalt: HMA HMA ATB Asphalt Content, % 6.1 5.2 Air Voids, % 7.9 6.8 5.3 Gradation; percent passing: #3/4 #3/8 #4 #40 #200 HMA 98 78 59 29 2.5 HMA 99 77 60 25 3.2 ATB Tensile Strain at Bottom of HMA Layer: 60.35 Total Amount of Fatigue Cracking: Year Alligator Block Long. Transverse Year Alligator Block Long. Transverse 1996 0 0 0 0 2003 0 0 0 0 2000 0 0 0 0 2004 0.3 0 8.0 1.2 2001 0 0 0 0 2005 0.5 0 13.1 1.6 2002 0 0 0 0

131
LTPP Site Identification Number: 4113 State: Georgia (13) Roadway or Route No.: IH 95 Date of Construction: 6-1-1977 Status: In Service Location: Longitude: 81.61 Latitude: 31.08 Elevation: 13 Pavement Cross Section:
Layer Material Type Thickness, inches AC Seal Coat (71) 0.1
3 HMA Hot Mixed, Hot Laid AC, Dense Graded (1) 3.7 2 ATB Asphalt Treated Mixture (321) 11.5 1 Subgrade Soil Poorly Graded Sand with Silt (204) ---
Traffic Data: Number of Years with Data: 6 AADTT (One-way): 3703 Year: 1997 KESALS per year: 1933 Unbound Layers Resilient Modulus: Layer Material/Soil Type Equivalent Resilient Modulus, ksi
1 Poorly Graded Sand with Silt 12
Hot Mix Asphalt Mixtures: Equivalent Annual Modulus of HMA: 450 Type of Asphalt: HMA ATB Asphalt Content, % 5.31 4.14 Air Voids, % 2.1 4.5 Gradation; percent passing: #3/4 #3/8 #4 #40 #200 HMA 99 63 46 27 3.7 ATB 74 47 40 22 3.9 Tensile Strain at Bottom of HMA Layer: 65.52 Total Amount of Fatigue Cracking: Year Alligator Block Long. Transverse Year Alligator Block Long. Transverse 1991 0 0 0 0 1999 0 0 0 0 1994 0 0 0 1 2000 0 0 0 0 1997 4.4 0 9.5 2 1998 4.1 0 11.3 2.1

132
LTPP Site Identification Number: 4119 State: Georgia (13) Roadway or Route No.: IH 75 Date of Construction: 6-1-1978 Status: In Service Location: Longitude: 84.21 Latitude: 34.09 Elevation: 815 Pavement Cross Section:
Layer Material Type Thickness, inches 5 AC Friction Course (2) 0.8 4 HMAA Hot Mixed, Hot Laid AC, Dense Graded (1) 2.0 3 ATB Hot Mixed, Hot Laid, Dense Graded (319) 13.8 2 GS Soil Agg. Mix (308) 16.4 1 Subgrade Soil Sandy Silt (145) ---
Traffic Data: Number of Years with Data: 3 AADTT (One-way): 5568 Year: 1996 KESALS per year: 2906 Unbound Layers Resilient Modulus: Layer Material/Soil Type Equivalent Resilient Modulus ksi
1 Soil Agg. Mix 14 2 Sandy Silt 9
Hot Mix Asphalt Mixtures: Equivalent Annual Modulus of HMA: 450 Type of Asphalt: HMA ATB Asphalt Content, % 5.6 4.75 Air Voids, % 3.0 5.9 Gradation; percent passing: #3/4 #3/8 #4 #40 #200 HMA 96 75 61 17 9.5 ATB 72 63 52 15 8.5 Tensile Strain at Bottom of HMA Layer: 58.55 Total Amount of Fatigue Cracking: Year Alligator Block Long. Transverse Year Alligator Block Long. Transverse 1992 0 0 0 0 1994 0 0 0 0 1995 0 0 0 1.7

133
LTPP Site Identification Number: 4112 State: Georgia (13) Roadway or Route No.: IH 95 Date of Construction: 6-1-1977 Status: In Service Location: Longitude: 81.6 Latitude: 31.02 Elevation: 13 Pavement Cross Section:
Layer Material Type Thickness, inches 4 AC Seal Coat (72) 0.1 3 HMA Hot Mixed, Hot Laid AC, Dense Graded (1) 3.2 2 ATB Hot Mixed, Hot Laid, Dense Graded (319) 12.7 1 Subgrade Soil Poorly Graded Sand (202) ---
Traffic Data: Number of Years with Data: 6 AADTT (One-way): 3703 Year: 1997 KESALS per year: 1933 Unbound Layers Resilient Modulus: Layer Material/Soil Type Equivalent Resilient Modulus, ksi
1 Poorly Graded Sand 12
Hot Mix Asphalt Mixtures: Equivalent Annual Modulus of HMA: 450 Type of Asphalt: HMA ATB Asphalt Content, % 5.69 4.63 Air Voids, % 2.1 5.9 Gradation; percent passing: #3/4 #3/8 #4 #40 #200 HMA 99 59 44 31 3.5 ATB 84 51 44 25 3.5 Tensile Strain at Bottom of HMA Layer: 60.74 Total Amount of Fatigue Cracking: Year Alligator Block Long. Transverse Year Alligator Block Long. Transverse 1991 0 0 0 0 1998 0 0 0 0 1994 0 0 0 0 1999 0 0 0 0 1997 0 0 0 0 2000 0 0 0 0

134
LTPP Site Identification Number: 9034 State: Idaho (16) Roadway or Route No.: 95 Date of Construction: 9-30-1988 Status: In Service Location: Longitude: 116.5 Latitude: 48.42 Elevation: 2119 Pavement Cross Section:
Layer Material Type Thickness, inches 6 AC Seal Coat (71) 5 AC Seal Coat (71)
0.6
4 HMA Hot Mixed, Hot Laid AC, Dense Graded (1) 2.9 3 HMA Hot Mixed, Hot Laid AC, Dense Graded (1) 6.0 2 GB Crushed Stone Base (303) 18.8 1 Subgrade Soil Silty Gravel with Sand (265) ---
Traffic Data: Number of Years with Data: AADTT (One-way): Year: KESALS per year: Unbound Layers Resilient Modulus: Layer Material/Soil Type Equivalent Resilient Modulus, ksi
1 Poorly Graded Sand
Hot Mix Asphalt Mixtures: Equivalent Annual Modulus of HMA: Type of Asphalt: HMA HMA Asphalt Content, % Air Voids, % Gradation; percent passing: #3/4 #3/8 #4 #40 #200 HMA HMA Tensile Strain at Bottom of HMA Layer: Total Amount of Fatigue Cracking: Year Alligator Block Long. Transverse Year Alligator Block Long. Transverse 1994 0 0 44.5 0.7 2004 17.3 0 0 4.8 1997 2.3 0 66.2 5.3 1998 2.3 0 68.8 3.5 2001 0 0 0 0

135
LTPP Site Identification Number: 2009 State: Indiana (18) Roadway or Route No.: ST 37 Date of Construction: Jan. 1981 Status: Out of Service; 4-1999 Location: Longitude: 86 Latitude: 40.03 Elevation: 785 Pavement Cross Section:
Layer Material Type Thickness, inches 6 AC Seal Coat, Slurry Seal (72) 0.5 5 HMA Hot Mixed, Hot Laid AC, Dense Graded (1) 5.7 4 ATB Dense Graded, Cold Laid, Plant Mix (326) 6.5 3 PATB Open Graded, Hot Mix, Hot Laid (323) 3.3 2 GB Gravel, Uncrushed (302) 9.5 1 Subgrade Soil Sandy Lean Clay (114) ---
Traffic Data: Number of Years with Data: 2 AADTT (One-way): 481 Year: 1991 KESALS per year: 408 Unbound Layers Resilient Modulus: Layer Material/Soil Type Equivalent Resilient Modulus, ksi
2 Gravel (uncrushed) 100 1 Sandy Lean Clay 7
Hot Mix Asphalt Mixtures: Equivalent Annual Modulus of HMA: 450 Type of Asphalt: HMA ATB Asphalt Content, % 3.4 Air Voids, % 6.6 Gradation; percent passing: #3/4 #3/8 #4 #40 #200 HMA 78 45 32 8.0 3.7 ATB Tensile Strain at Bottom of HMA Layer: 103.87 Total Amount of Fatigue Cracking: Year Alligator Block Long. Transverse Year Alligator Block Long. Transverse 1993 3.7 0 0 44.7 1995 5.9 0 12 51.7

136
LTPP Site Identification Number: 0112 State: Iowa (19) Roadway or Route No.: US 61 Date of Construction: May 1992 Status: In Service Location: Longitude: 91.25 Latitude: 40.70 Elevation: 530 Pavement Cross Section:
Layer Material Type Thickness, inches 6 HMA Hot Mixed, Hot Laid AC, Dense Graded 2.5 5 HMA Hot Mixed, Hot Laid AC, Dense Graded 2.1 4 ATB HMAC, Hot Laid, Dense Graded 12.4 3 PATB Open-Graded Hot-Mix, Hot Laid; 4.1 2 GS Lean Clay with Sand 24 1 Subgrade Soil Clay ---
Traffic Data: Number of Years with Data: 4 AADTT (One-way): 425 Year: 1992 KESALS per year: Unbound Layers Resilient Modulus: Layer Material/Soil Type Equivalent Resilient Modulus, ksi
2 Lean Clay with Sand 6 1 Clay 5
Hot Mix Asphalt Mixtures: Equivalent Annual Modulus of HMA: 450 Type of Asphalt: PG70-22 HMA ATB Asphalt Content, % 4.8 4.5 Air Voids, % 10.0 8.5 Gradation; percent passing: #3/4 #3/8 #4 #40 #200 HMA 92 57 39 5.3 ATB 96 68 47 6.2 Tensile Strain at Bottom of HMA Layer: 43.50 Total Amount of Fatigue Cracking: Year Alligator Block Long. Transverse Year Alligator Block Long. Transverse 1995 0 0 0 0 2005 0.3 0 16.4 12.3 1999 0 0 1.2 10.4 2001 0 0 5 17.3 2002 0 0 0 6.3

137
LTPP Site Identification Number: 0101 State: Iowa (19) Roadway or Route No.: US 61 Date of Construction: May 1992 Status: In Service Location: Longitude: 91.25 Latitude: 40.70 Elevation: 530 Pavement Cross Section:
Layer Material Type Thickness, inches
5 HMA Hot Mixed, Hot Laid AC, Dense Graded 2.0 4 HMA Hot Mixed, Hot Laid AC, Dense Graded 6.0 3 GB Crushed Stone Base (303) 8.0 2 GS Embankment Soil; Clay with Gravel (104) 24 1 Subgrade Soil Clay with Gravel (104) ---
Traffic Data: Number of Years with Data: 4 AADTT (One-way): 425 Year: 1992 KESALS per year: Unbound Layers Resilient Modulus: Layer Material/Soil Type Equivalent Resilient Modulus, ksi
2 Lean Clay with Sand 6 1 Clay 5
Hot Mix Asphalt Mixtures: Equivalent Annual Modulus of HMA: Type of Asphalt: PG70-22 HMA HMA Asphalt Content, % Air Voids, % Gradation; percent passing: #3/4 #3/8 #4 #40 #200 HMA HMA Tensile Strain at Bottom of HMA Layer: Total Amount of Fatigue Cracking: Year Alligator Block Long. Transverse Year Alligator Block Long. Transverse 1995 15.0 0 0 0 2005 0.8 0 0 14.8 1999 7.5 0 7.3 15.3 2001 12.1 0 15.3 32.0 2002 1.3 0 0 9.9

138
LTPP Site Identification Number: 0103 State: Iowa (19) Roadway or Route No.: US 61 Date of Construction: May 1992 Status: In Service Location: Longitude: 91.25 Latitude: 40.70 Elevation: 530 Pavement Cross Section:
Layer Material Type Thickness, inches
5 HMA Hot Mixed, Hot Laid AC, Dense Graded (1) 2.1 4 HMA Hot Mixed, Hot Laid AC, Dense Graded (1) 1.7 3 ATB Dense Graded Asphalt Treated Base (319) 8.4 2 GS Embankment Soil; Clay with Gravel (104) 24 1 Subgrade Soil Clay with Sand (107) ---
Traffic Data: Number of Years with Data: 4 AADTT (One-way): 425 Year: 1992 KESALS per year: Unbound Layers Resilient Modulus: Layer Material/Soil Type Equivalent Resilient Modulus, ksi
2 Lean Clay with Sand 6 1 Clay 5
Hot Mix Asphalt Mixtures: Equivalent Annual Modulus of HMA: Type of Asphalt: PG70-22 HMA HMA ATB Asphalt Content, % Air Voids, % Gradation; percent passing: #3/4 #3/8 #4 #40 #200 HMA HMA ATB Tensile Strain at Bottom of HMA Layer: Total Amount of Fatigue Cracking: Year Alligator Block Long. Transverse Year Alligator Block Long. Transverse 1995 0 0 0 0 2005 9.8 0 0 12.5 1999 5.3 0 17.1 16.4 2001 5.4 0 21.4 34.6 2002 2.2 0 6.8 12.8

139
LTPP Site Identification Number: 0105 State: Iowa (19) Roadway or Route No.: US 61 Date of Construction: May 1992 Status: In Service Location: Longitude: 91.25 Latitude: 40.70 Elevation: 530 Pavement Cross Section:
Layer Material Type Thickness, inches 5 HMA Hot Mixed, Hot Laid AC, Dense Graded (1) 1.8 4 HMA Hot Mixed, Hot Laid AC, Dense Graded (1) 1.7 3 ATB Dense Graded Asphalt Treated Base (319) 4.7 3 GB Crushed Stone Base (303) 4.0 2 GS Embankment Soil; Clay with Gravel (104) 24 1 Subgrade Soil Clay with Gravel (104) ---
Traffic Data: Number of Years with Data: 4 AADTT (One-way): 425 Year: 1992 KESALS per year: Unbound Layers Resilient Modulus: Layer Material/Soil Type Equivalent Resilient Modulus, ksi
2 Lean Clay with Sand 6 1 Clay 5
Hot Mix Asphalt Mixtures: Equivalent Annual Modulus of HMA: Type of Asphalt: PG70-22 HMA HMA ATB Asphalt Content, % Air Voids, % Gradation; percent passing: #3/4 #3/8 #4 #40 #200 HMA HMA ATB Tensile Strain at Bottom of HMA Layer: Total Amount of Fatigue Cracking: Year Alligator Block Long. Transverse Year Alligator Block Long. Transverse 1995 0 0 18.5 1.0 2005 1.1 0 0 23.0 1999 0 0 105.0 25.7 2001 2.1 0 103.4 26.7 2002 0.7 0 0 8.9

140
LTPP Site Identification Number: 0115 State: Louisiana (22) Roadway or Route No.: US 171 Date of Construction: Nov. 1992 Status: In Service Location: Longitude: 93.20 Latitude: 30.33 Elevation: 27 Pavement Cross Section:
Layer Material Type Thickness, inches 5 HMA Hot Mixed, Hot Laid AC, Dense Graded (1) 1.7 4 HMA Hot Mixed, Hot Laid AC, Dense Graded (1) 5.3 3 ATB Hot Mixed, Hot Laid AC, Dense Graded (319) 9.0 2 GS Crushed Stone (131) 12.0 1 Subgrade Soil Lean Inorganic Clay (102) ---
Traffic Data: Number of Years with Data: AADTT (One-way): Year: KESALS per year: Unbound Layers Resilient Modulus: Layer Material/Soil Type Equivalent Resilient Modulus, ksi
2 Crushed Stone 8 1 Lean Inorganic Clay 5
Hot Mix Asphalt Mixtures: Equivalent Annual Modulus of HMA: 450 Type of Asphalt: HMA HMA ATB Asphalt Content, % 4.0 4.1 4.1 Air Voids, % 5.4 2.0 4.8 Gradation; percent passing: #3/4 #3/8 #4 #40 #200 HMA 100 82 58 24 6.0 HMA 100 83 57 25 5.3 ATB Tensile Strain at Bottom of HMA Layer: 69.98 Total Amount of Fatigue Cracking: Year Alligator Block Long. Transverse Year Alligator Block Long. Transverse 1998 0 0 0 0 1999 0 0 0 0 2004 0 0 0 0

141
LTPP Site Identification Number: 0116 State: Louisiana (22) Roadway or Route No.: US 171 Date of Construction: Nov. 1992 Status: In Service Location: Longitude: 93.20 Latitude: 30.33 Elevation: 27 Pavement Cross Section:
Layer Material Type Thickness, inches 5 HMA Hot Mixed, Hot Laid AC, Dense Graded (1) 1.9 4 HMA Hot Mixed, Hot Laid AC, Dense Graded (1) 2.8 3 ATB Hot Mixed, Hot Laid AC, Dense Graded (319) 11.3 2 GS Crushed Stone (131) 18.0 1 Subgrade Soil Lean Inorganic Clay (102) ---
Traffic Data: Number of Years with Data: AADTT (One-way): Year: KESALS per year: Unbound Layers Resilient Modulus: Layer No.
Material/Soil Type Equivalent Resilient Modulus
2 Crushed Stone 8 1 Lean Inorganic Clay 5
Hot Mix Asphalt Mixtures: Equivalent Annual Modulus of HMA: 450 Type of Asphalt: HMA HMA ATB Asphalt Content, % 4.0 4.1 4.1 Air Voids, % 2.1 3.3 6.1 Gradation; percent passing: #3/4 #3/8 #4 #40 #200 HMA 100 82 58 24 6.0 HMA 100 83 57 25 5.3 ATB Tensile Strain at Bottom of HMA Layer: 69.28 Total Amount of Fatigue Cracking: Year Alligator Block Long. Transverse Year Alligator Block Long. Transverse 1998 0 0 0 0 1999 0 0 0 0 2004 0 0 0 0

142
LTPP Site Identification Number: 0114 State: Louisiana (22) Roadway or Route No.: US 171 Date of Construction: Nov. 1992 Status: In Service Location: Longitude: 93.20 Latitude: 30.33 Elevation: 27 Pavement Cross Section:
Layer Material Type Thickness, inches 5 HMA Hot Mixed, Hot Laid AC, Dense Graded (1) 1.4 4 HMA Hot Mixed, Hot Laid AC, Dense Graded (1) 8.1 3 GB Crushed Stone (303) 11.4 2 GS Embankment, Silty Clay with Sand (133) 12.0 1 Subgrade Soil Lean Inorganic Clay (102) ---
Traffic Data: Number of Years with Data: AADTT (One-way): Year: KESALS per year: Unbound Layers Resilient Modulus: Layer No.
Material/Soil Type Equivalent Resilient Modulus
3 Crushed Stone 8 1 Lean Inorganic Clay 5
Hot Mix Asphalt Mixtures: Equivalent Annual Modulus of HMA: Type of Asphalt: HMA HMA Asphalt Content, % Air Voids, % Gradation; percent passing: #3/4 #3/8 #4 #40 #200 HMA HMA Tensile Strain at Bottom of HMA Layer: Total Amount of Fatigue Cracking: Year Alligator Block Long. Transverse Year Alligator Block Long. Transverse 1998 0 0 0 0 1999 0 0 0 0 2004 0 0 0 0

143
LTPP Site Identification Number: 0124 State: Louisiana (22) Roadway or Route No.: US 171 Date of Construction: Nov. 1992 Status: In Service Location: Longitude: 93.20 Latitude: 30.33 Elevation: 27 Pavement Cross Section:
Layer Material Type Thickness, inches 6 HMA Hot Mixed, Hot Laid AC, Dense Graded (1) 1.3 5 HMA Hot Mixed, Hot Laid AC, Dense Graded (1) 5.9 4 ATB Hot Mixed, Hot Laid, Plant Mix (319) 10.6 3 PATB Open Graded, Hot Mix, Hot Laid (325) 3.6 2 GS Embankment; Silt (141) 30 1 Subgrade Soil Lean Inorganic Clay (102) ---
Traffic Data: Number of Years with Data: AADTT (One-way): Year: KESALS per year: Unbound Layers Resilient Modulus: Layer Material/Soil Type Equivalent Resilient Modulus, ksi
2 Silt 8 1 Lean Inorganic Clay 5
Hot Mix Asphalt Mixtures: Equivalent Annual Modulus of HMA: 450 Type of Asphalt: HMA HMA ATB Asphalt Content, % 4.0 4.1 4.1 Air Voids, % 5.3 2.9 6.8 Gradation; percent passing: #3/4 #3/8 #4 #40 #200 HMA 100 82 58 24 6.0 HMA 100 83 57 25 5.3 ATB Tensile Strain at Bottom of HMA Layer: 41.06 Total Amount of Fatigue Cracking: Year Alligator Block Long. Transverse Year Alligator Block Long. Transverse 1998 0 0 0 0 1999 0 0 0 0 2004 0 0 0 0

144
LTPP Site Identification Number: 0116 State: Michigan (26) Roadway or Route No.: US 27 Date of Construction: Aug. 1995 Status: Out of Service; 10-2002 Location: Longitude: 84.52 Latitude: 42.99 Elevation: 810 Pavement Cross Section:
Layer Material Type Thickness, inches 4 HMA Hot Mixed, Hot Laid AC, Dense Graded 1.8 3 HMA Hot Mixed, Hot Laid AC, Dense Graded 2.1 2 ATB HMAC 12.0 1 Subgrade Soil Sandy Clay ---
Traffic Data: Number of Years with Data: AADTT (One-way): Year: KESALS per year: Unbound Layers Resilient Modulus: Layer Material/Soil Type Equivalent Resilient Modulus, ksi
1 Sandy Clay 4
Hot Mix Asphalt Mixtures: Equivalent Annual Modulus of HMA: 300 Type of Asphalt: HMA HMA ATB Asphalt Content, % 5.1 5.0 Air Voids, % 5.0 2.7 4.8 Gradation; percent passing: #3/4 #3/8 #4 #40 #200 HMA 100 78 47 HMA 86 58 42 5.5 ATB 4.8 Tensile Strain at Bottom of HMA Layer: 106.03 Total Amount of Fatigue Cracking: Year Alligator Block Long. Transverse Year Alligator Block Long. Transverse 1995 0 0 0 0 2000 0 0 0 0 1996 0 0 0 0 2001 0 0 0 0 1998 0 0 0 0 2002 30.5 0 0 0 1999 0 0 0 0 2003 0 0 0 0

145
LTPP Site Identification Number: 0115 State: Michigan (26) Roadway or Route No.: US 27 Date of Construction: Aug. 1995 Status: Out of Service; 10-2002 Location: Longitude: 84.52 Latitude: 42.99 Elevation: 810 Pavement Cross Section:
Layer Material Type Thickness, inches 5 HMA Hot Mixed, Hot Laid AC, Dense Graded 1.7 4 HMA Hot Mixed, Hot Laid AC, Dense Graded 1.6 3 HMA Hot Mixed, Hot Laid AC, Dense Graded 2.6 2 ATB HMAC 9.6 1 Subgrade Soil Sandy Clay ---
Traffic Data: Number of Years with Data: AADTT (One-way): Year: KESALS per year: Unbound Layers Resilient Modulus: Layer Material/Soil Type Equivalent Resilient Modulus, ksi
1 Sandy Clay 4
Hot Mix Asphalt Mixtures: Equivalent Annual Modulus of HMA: 300 Type of Asphalt: HMA HMA ATB Asphalt Content, % Air Voids, % Gradation; percent passing: #3/4 #3/8 #4 #40 #200 HMA HMA ATB Tensile Strain at Bottom of HMA Layer: Total Amount of Fatigue Cracking: Year Alligator Block Long. Transverse Year Alligator Block Long. Transverse 1995 0 0 0 0 2000 0 0 0 0 1996 0 0 0 0 2001 0 0 0 0 1998 0 0 0 0 2002 105.7 0 0 0 1999 0 0 0 0 2003 0 0 0 0

146
LTPP Site Identification Number: 0116 State: Montana (30) Roadway or Route No.: Interstate 15 Date of Construction: Oct. 1997 Status: In Service Location: Longitude: 111.53 Latitude: 47.41 Elevation: 3343 Pavement Cross Section:
Layer Material Type Thickness, inches 4 HMA Hot Mixed, Hot Laid AC, Dense Graded 4.7 3 ATB Hot Mixed, Hot Laid AC, Dense Graded 12.6 2 SS Embankment Soil; A2-4, (SP-SM) 24 1 Subgrade Soil Poorly Graded Sand with Silt; A-2-6 ---
Traffic Data: Number of Years with Data: 4 AADTT (One-way): 800 Year: 1998 KESALS per year: Unbound Layers Resilient Modulus: Layer Material/Soil Type Equivalent Resilient Modulus, ksi
1 Subgrade Soil 12
Hot Mix Asphalt Mixtures: Equivalent Annual Modulus of HMA: 450 Type of Asphalt: AC-10 HMA HMA ATB Asphalt Content, % 5.0 5.0 4.7 Air Voids, % 7.5 6.0 5.5 Gradation; percent passing: #3/4 #3/8 #4 #40 #200 HMA 100 85 45 6.0 HMA 88 57 39 4.2 ATB 84 48 32 4.5 Tensile Strain at Bottom of HMA Layer: 52.58 Total Amount of Fatigue Cracking: Year Alligator Block Long. Transverse Year Alligator Block Long. Transverse1998 0 0 0 0 2002 3 0 0 0 1999 0 0 0 0 2003 8.1 0 0 0 2000 0 0 0 0 2004 55.4 0 0 0 2001 0.4 0 0 0 2005 0 0 0 0

147
LTPP Site Identification Number: 0114 State: Montana (30) Roadway or Route No.: Interstate 15 Date of Construction: Oct. 1997 Status: In Service Location: Longitude: 111.53 Latitude: 47.41 Elevation: 3343 Pavement Cross Section:
Layer Material Type Thickness, inches 5 4 AC Seal Coat 0.2 3 HMA Hot Mixed, Hot Laid AC, Dense Graded 7.2 2 GB Granular Base, Crushed Stone (303) 12.4 1 Subgrade Soil Poorly Graded Sand with Silt; A-2-6 ---
Traffic Data: Number of Years with Data: 4 AADTT (One-way): 800 Year: 1998 KESALS per year: Unbound Layers Resilient Modulus: Layer Material/Soil Type Equivalent Resilient Modulus, ksi
1 Subgrade Soil 12
Hot Mix Asphalt Mixtures: Equivalent Annual Modulus of HMA: Type of Asphalt: AC-10 HMA Asphalt Content, % 5.0 Air Voids, % 7.5 Gradation; percent passing: #3/4 #3/8 #4 #40 #200 HMA Tensile Strain at Bottom of HMA Layer: Total Amount of Fatigue Cracking: Year Alligator Block Long. Transverse Year Alligator Block Long. Transverse1998 0 0 0 0 2002 20.0 0 1.5 0 1999 0 0 0 0 2003 46.6 0 0 0 2000 5.9 0 0 0 2004 47.8 0 2.7 3.8 2001 9.0 0 5.1 0 2005 1.4 0 0 7.0

148
LTPP Site Identification Number: 0115 State: Montana (30) Roadway or Route No.: Interstate 15 Date of Construction: Oct. 1997 Status: In Service Location: Longitude: 111.53 Latitude: 47.41 Elevation: 3343 Pavement Cross Section:
Layer Material Type Thickness, inches 5 4 AC Seal Coat 0.2 3 HMA Hot Mixed, Hot Laid AC, Dense Graded 7.4 2 ATB Hot Mixed, Hot Laid AC, Dense Graded 9.2 1 Subgrade Soil Poorly Graded Sand with Silt; A-2-6 ---
Traffic Data: Number of Years with Data: 4 AADTT (One-way): 800 Year: 1998 KESALS per year: Unbound Layers Resilient Modulus: Layer Material/Soil Type Equivalent Resilient Modulus, ksi
1 Subgrade Soil 12
Hot Mix Asphalt Mixtures: Equivalent Annual Modulus of HMA: Type of Asphalt: AC-10 HMA ATB Asphalt Content, % Air Voids, % Gradation; percent passing: #3/4 #3/8 #4 #40 #200 HMA ATB Tensile Strain at Bottom of HMA Layer: Total Amount of Fatigue Cracking: Year Alligator Block Long. Transverse Year Alligator Block Long. Transverse1998 0 0 0 0 2002 26.5 0 0 0 1999 0 0 0 0 2003 64.5 0 11.2 8.6 2000 0 0 0 0 2004 48.5 0 10.0 7.0 2001 23.1 0 0 0 2005 1.2 0 0 0

149
LTPP Site Identification Number: 0124 State: Montana (30) Roadway or Route No.: Interstate 15 Date of Construction: Oct. 1997 Status: In Service Location: Longitude: 111.53 Latitude: 47.41 Elevation: 3343 Pavement Cross Section:
Layer Material Type Thickness, inches 4 HMA Hot Mixed, Hot Laid AC, Dense Graded (1) 7.1 3 ATB HMAC, Hot Laid, Central Plant Mix (319) 13.7 2 PATB Open Graded, Hot Mixed, Hot Laid (323) 4.2 1 Subgrade Soil Poorly Graded Sand with Silt ---
Traffic Data: Number of Years with Data: 4 AADTT (One-way): 800 Year: 1998 KESALS per year: Unbound Layers Resilient Modulus: Layer Material/Soil Type Equivalent Resilient Modulus, ksi
1 Poorly Graded Sand with Silt 8
Hot Mix Asphalt Mixtures: Equivalent Annual Modulus of HMA: 400 Type of Asphalt: AC-10 HMA HMA ATB Asphalt Content, % 5.0 5.0 4.7 Air Voids, % 7.5 6.0 5.5 Gradation; percent passing: #3/4 #3/8 #4 #40 #200 HMA 100 85 45 6.0 HMA 88 57 39 4.2 ATB 84 48 32 4.5 Tensile Strain at Bottom of HMA Layer: 31.16 Total Amount of Fatigue Cracking: Year Alligator Block Long. Transverse Year Alligator Block Long. Transverse 1998 0 0 0 0 2002 8 0 1.4 0 1999 0 0 0 0 2003 14.8 0 0 0 2000 0.6 0 3.3 0 2004 29.0 0 0 2.3 2001 4.3 0 5.4 0 2005 0.2 0 0 3.7

150
LTPP Site Identification Number: 0124 State: Nebraska (31) Roadway or Route No.: US 281 Date of Construction: July 1995 Status: Out of Service; 9-2002 Location: Longitude: 97.62 Latitude: 40.07 Elevation: 1611 Pavement Cross Section:
Layer Material Type Thickness, inches 5 HMA Hot Mixed, Hot Laid AC, Dense Graded 7.4 4 ATB HMAC, Hot Laid, Central Plant Mix 10.5 3 PATB Open Graded, Hot Mixed, Hot Laid 3.4 2 GS Lean Inorganic Clay 24 1 Subgrade Soil Lean Inorganic Clay ---
Traffic Data: Number of Years with Data: 4 AADTT (One-way): 450 Year: 1997 KESALS per year: Unbound Layers Resilient Modulus: Layer No.
Material/Soil Type Equivalent Resilient Modulus
2 Lean Inorganic Clay 5 1 Lean Inorganic Clay 5
Hot Mix Asphalt Mixtures: Equivalent Annual Modulus of HMA: 450 Type of Asphalt: PG64-22 HMA ATB Asphalt Content, % 4.5 4.5 Air Voids, % 6.8 3.0 Gradation; percent passing: #3/4 #3/8 #4 #40 #200 HMA 100 87 74 6.9 ATB 97 72 53 3.9 Tensile Strain at Bottom of HMA Layer: 43.40 Total Amount of Fatigue Cracking: Year Alligator Block Long. Transverse Year Alligator Block Long. Transverse 1995 0 0 0 0 1999 0 0 0 0 2002 0 0 0 0

151
LTPP Site Identification Number: 0115 State: Nebraska (31) Roadway or Route No.: US 81 Date of Construction: July 1995 Status: In Service Location: Longitude: 97.62 Latitude: 40.07 Elevation: 1611 Pavement Cross Section:
Layer Material Type Thickness, inches 4 HMA Hot Mixed, Hot Laid AC, Dense Graded 6.5 3 ATB HMAC 8.6 2 GS Lean Inorganic Clay; A-6 24 1 Subgrade Soil Lean Inorganic Clay; A-7-5 ---
Traffic Data: Number of Years with Data: 4 AADTT (One-way): 450 Year: 1997 KESALS per year: Unbound Layers Resilient Modulus: Layer Material/Soil Type Equivalent Resilient Modulus, ksi
2 Lean Inorganic Clay 5 1 Lean Inorganic Clay 5
Hot Mix Asphalt Mixtures: Equivalent Annual Modulus of HMA: 450 Type of Asphalt: HMA ATB Asphalt Content, % 4.8 4.1 Air Voids, % 5.0 9.0 Gradation; percent passing: #3/4 #3/8 #4 #40 #200 HMA 100 87 74 6.9 ATB 97 72 53 3.9 Tensile Strain at Bottom of HMA Layer: 79.91 Total Amount of Fatigue Cracking: Year Alligator Block Long. Transverse Year Alligator Block Long. Transverse 1995 0 0 0 0 1999 0 0 0 0 2002 0 0 0 0

152
LTPP Site Identification Number: 0116 State: Nebraska (31) Roadway or Route No.: US 81 Date of Construction: July 1995 Status: In Service Location: Longitude: 97.62 Latitude: 40.07 Elevation: 1611 Pavement Cross Section:
Layer Material Type Thickness, inches 4 HMA Hot Mixed, Hot Laid AC, Dense Graded; (1) 4.1 3 ATB Hot Mixed, Hot Laid AC, Dense Graded (1) 12.2 2 GS Lean Inorganic Clay; A-6 24.0 1 Subgrade Soil Lean Inorganic Clay; A-7-6 ---
Traffic Data: Number of Years with Data: 4 AADTT (One-way): 450 Year: 1997 KESALS per year: Unbound Layers Resilient Modulus: Layer No.
Material/Soil Type Equivalent Resilient Modulus
2 Lean Inorganic Clay 5 1 Lean Inorganic Clay 5
Hot Mix Asphalt Mixtures: Equivalent Annual Modulus of HMA: 450 Type of Asphalt: PG64-22 HMA ATB Asphalt Content, % 4.7 4.1 Air Voids, % 4.5 7.0 Gradation; percent passing: #3/4 #3/8 #4 #40 #200 HMA 100 87 74 6.9 ATB 95 68 50 2.2 Tensile Strain at Bottom of HMA Layer: 70.02 Total Amount of Fatigue Cracking: Year Alligator Block Long. Transverse Year Alligator Block Long. Transverse 1995 0 0 0 0 1999 0 0 0 0 2002 0 0 0 0

153
LTPP Site Identification Number: 0104 State: Nevada (32) Roadway or Route No.: Interstate 80 Date of Construction: Aug. 1995 Status: In Service Location: Longitude: 117.01 Latitude: 40.69 Elevation: 4550 Pavement Cross Section:
Layer Material Type Thickness, inches 5 HMA Hot Mixed, Hot Laid AC, Dense Graded 7.3 4 ATB Hot Mixed, Hot Laid, Plant Mix 12.4 3 GS Soil Agg. Mix. 18.4 2 TS Lime Treated Soil 12.0 1 Subgrade Soil Silty Sand ---
Traffic Data: Number of Years with Data: 1 AADTT (One-way): 926 Year: 1996 KESALS per year: 492 Unbound Layers Resilient Modulus: Layer Material/Soil Type Equivalent Resilient Modulus, ksi
3 Lime Treated Soil 14 2 Soil Agg. Mix. 28 1 Silty Sand 10
Hot Mix Asphalt Mixtures: Equivalent Annual Modulus of HMA: 450 Type of Asphalt: PG64-22 HMA ATB Asphalt Content, % 4.7 4.6 Air Voids, % Gradation; percent passing: #3/4 #3/8 #4 #40 #200 HMA 96 73 62 21 5.6 ATB Tensile Strain at Bottom of HMA Layer: 37.37 Total Amount of Fatigue Cracking: Year Alligator Block Long. Transverse Year Alligator Block Long. Transverse 1996 0 0 0 0 2002 0 0 0 0 1998 0 0 18.8 0 2003 0 0 0 0.9 1999 5 0 0 0 2004 0 0 0 1.2 2000 0 0 0 0 2005 0 0 0 3.1 2001 0 0 0 0 2006 0 0 0 5.6

154
LTPP Site Identification Number: 0101 State: Nevada (32) Roadway or Route No.: Interstate 80 Date of Construction: Aug. 1995 Status: In Service Location: Longitude: 117.01 Latitude: 40.69 Elevation: 4550 Pavement Cross Section:
Layer Material Type Thickness, inches 5 HMA Hot Mixed, Hot Laid AC, Dense Graded 7.2 4 GB Crushed Gravel (304) 8.5 3 GS Soil Agg. Mix, predominately coarse grained (308) 22.8 2 TS Lime Treated Soil (338) 12.0 1 Subgrade Soil Silty Sand (214) ---
Traffic Data: Number of Years with Data: 1 AADTT (One-way): 926 Year: 1996 KESALS per year: 492 Unbound Layers Resilient Modulus: Layer Material/Soil Type Equivalent Resilient Modulus, ksi
2 Lime Treated Soil 14 3 Soil Agg. Mix. 28 1 Silty Sand 10
Hot Mix Asphalt Mixtures: Equivalent Annual Modulus of HMA: Type of Asphalt: PG64-22 HMA Asphalt Content, % Air Voids, % Gradation; percent passing: #3/4 #3/8 #4 #40 #200 HMA Tensile Strain at Bottom of HMA Layer: Total Amount of Fatigue Cracking: Year Alligator Block Long. Transverse Year Alligator Block Long. Transverse 1997 0 0 0 0 2002 1.2 0 10.6 0 1998 0 0 7.3 0 2003 0 0 12.0 0 1999 0 0 0 0 2004 0.9 0 0 1.3 2000 0.5 0 0.3 0 2005 1.6 0 0 2.5 2001 1.4 0 0 0 2006 2.0 0 0 6.5

155
LTPP Site Identification Number: 0103 State: Nevada (32) Roadway or Route No.: Interstate 80 Date of Construction: Aug. 1995 Status: In Service Location: Longitude: 117.01 Latitude: 40.69 Elevation: 4550 Pavement Cross Section:
Layer Material Type Thickness, inches 5 HMA Hot Mixed, Hot Laid AC, Dense Graded 4.1 4 ATB Hot Mixed, Hot Laid AC, Dense Graded 8.1 3 GS Soil Agg. Mix.; coarse grained (308) 24.5 2 TS Lime Treated Soil (338) 12.0 1 Subgrade Soil Clayey Sand (216) ---
Traffic Data: Number of Years with Data: 1 AADTT (One-way): 926 Year: 1996 KESALS per year: 492 Unbound Layers Resilient Modulus: Layer Material/Soil Type Equivalent Resilient Modulus, ksi
2 Lime Treated Soil 14 3 Soil Agg. Mix. 28 1 Clayey Sand 10
Hot Mix Asphalt Mixtures: Equivalent Annual Modulus of HMA: Type of Asphalt: PG64-22 HMA Asphalt Content, % Air Voids, % Gradation; percent passing: #3/4 #3/8 #4 #40 #200 HMA Tensile Strain at Bottom of HMA Layer: Total Amount of Fatigue Cracking: Year Alligator Block Long. Transverse Year Alligator Block Long. Transverse 1997 0 0 0 0 2002 28.8 0 0 0 1998 0 0 0 0 2003 32.9 0 0 0 1999 0 0 0 0 2004 34.1 0 0 0 2000 33.8 0 0 0 2001 16.5 0 0 0

156
LTPP Site Identification Number: 0105 State: Nevada (32) Roadway or Route No.: Interstate 80 Date of Construction: Aug. 1995 Status: In Service Location: Longitude: 117.01 Latitude: 40.69 Elevation: 4550 Pavement Cross Section:
Layer Material Type Thickness, inches 6 HMA Hot Mixed, Hot Laid AC, Dense Graded 4.2 5 ATB Hot Mixed, Hot Laid AC, Dense Graded 4.8 4 GB Crushed Gravel (304) 3.6 3 GS Soil Agg. Mix.; coarse grained (308) 23.7 2 TS Lime Treated Soil (338) 12.0 1 Subgrade Soil Silty Sand (214) ---
Traffic Data: Number of Years with Data: 1 AADTT (One-way): 926 Year: 1996 KESALS per year: 492 Unbound Layers Resilient Modulus: Layer Material/Soil Type Equivalent Resilient Modulus, ksi
2 Lime Treated Soil 14 3 Soil Agg. Mix. 28 1 Silty Sand 10
Hot Mix Asphalt Mixtures: Equivalent Annual Modulus of HMA: Type of Asphalt: PG64-22 HMA ATB Asphalt Content, % Air Voids, % Gradation; percent passing: #3/4 #3/8 #4 #40 #200 HMA ATB Tensile Strain at Bottom of HMA Layer: Total Amount of Fatigue Cracking: Year Alligator Block Long. Transverse Year Alligator Block Long. Transverse 1997 0 0 0 0 2002 0 0 1.5 0 1998 0 0 0 0 2003 1.3 0 0 0 1999 0.4 0 0 0 2004 1.5 0 0 0 2000 16.4 0 0 0 2001 10.4 0 0 0

157
LTPP Site Identification Number: 0106 State: Nevada (32) Roadway or Route No.: Interstate 80 Date of Construction: Aug. 1995 Status: In Service Location: Longitude: 117.01 Latitude: 40.69 Elevation: 4550 Pavement Cross Section:
Layer Material Type Thickness, inches 6 HMA Hot Mixed, Hot Laid AC, Dense Graded 7.2 5 ATB Hot Mixed, Hot Laid AC, Dense Graded 8.8 4 GB Crushed Gravel (304) 3.7 3 GS Soil Agg. Mix.; coarse grained (308) 18.3 2 TS Lime Treated Soil (338) 12.0 1 Subgrade Soil Clayey Sand (216) ---
Traffic Data: Number of Years with Data: 1 AADTT (One-way): 926 Year: 1996 KESALS per year: 492 Unbound Layers Resilient Modulus: Layer Material/Soil Type Equivalent Resilient Modulus, ksi
2 Lime Treated Soil 14 3 Soil Agg. Mix. 28 1 Clayey Sand 10
Hot Mix Asphalt Mixtures: Equivalent Annual Modulus of HMA: Type of Asphalt: PG64-22 HMA ATB Asphalt Content, % Air Voids, % Gradation; percent passing: #3/4 #3/8 #4 #40 #200 HMA ATB Tensile Strain at Bottom of HMA Layer: Total Amount of Fatigue Cracking: Year Alligator Block Long. Transverse Year Alligator Block Long. Transverse 1997 0 0 0 0 2002 0 0 1.3 1.0 1998 0 0 0 0 2003 0.2 0 0 1.3 1999 0 0 0 0 2004 0.2 0 0 1.7 2000 0 0 0 0 2005 0.3 0 0 2.3 2001 0 0 0 1.2 2006 0.5 0 0 3.9

158
LTPP Site Identification Number: 0112 State: Nevada (32) Roadway or Route No.: Interstate 80 Date of Construction: Aug. 1995 Status: In Service Location: Longitude: 117.01 Latitude: 40.69 Elevation: 4550 Pavement Cross Section:
Layer Material Type Thickness, inches 6 HMA Hot Mixed, Hot Laid AC, Dense Graded 4.5 5 ATB HMAC, Hot Laid, Central Plant Mix 12.4 4 PATB Open Graded, Hot Mixed, Hot Laid 4.2 3 GS Soil Agg. Mix. 15.1 2 TS Lime Treated Soil 12.0 1 Subgrade Soil Clayey Sand ---
Traffic Data: Number of Years with Data: 1 AADTT (One-way): 926 Year: 1996 KESALS per year: 492 Unbound Layers Resilient Modulus: Layer Material/Soil Type Equivalent Resilient Modulus, ksi
3 Lime Treated Soil 14 2 Soil Agg. Mix. 28 1 Clayey Sand 10
Hot Mix Asphalt Mixtures: Equivalent Annual Modulus of HMA: 450 Type of Asphalt: PG64-22 HMA ATB Asphalt Content, % 4.7 4.6 Air Voids, % Gradation; percent passing: #3/4 #3/8 #4 #40 #200 HMA 95 70 54 16 5.0 ATB Tensile Strain at Bottom of HMA Layer: 33.35 Total Amount of Fatigue Cracking: Year Alligator Block Long. Transverse Year Alligator Block Long. Transverse 1996 0 0 0 0 2002 0 0 0 1.1 1998 0 0 0 0 2003 0 0 0 1.1 1999 0 0 0 0 2004 0 0 0 1.1 2000 0 0 0 0 2005 0.3 0 0 4.8 2001 0 0 0 1.1 2006 0.3 0 0 4.6
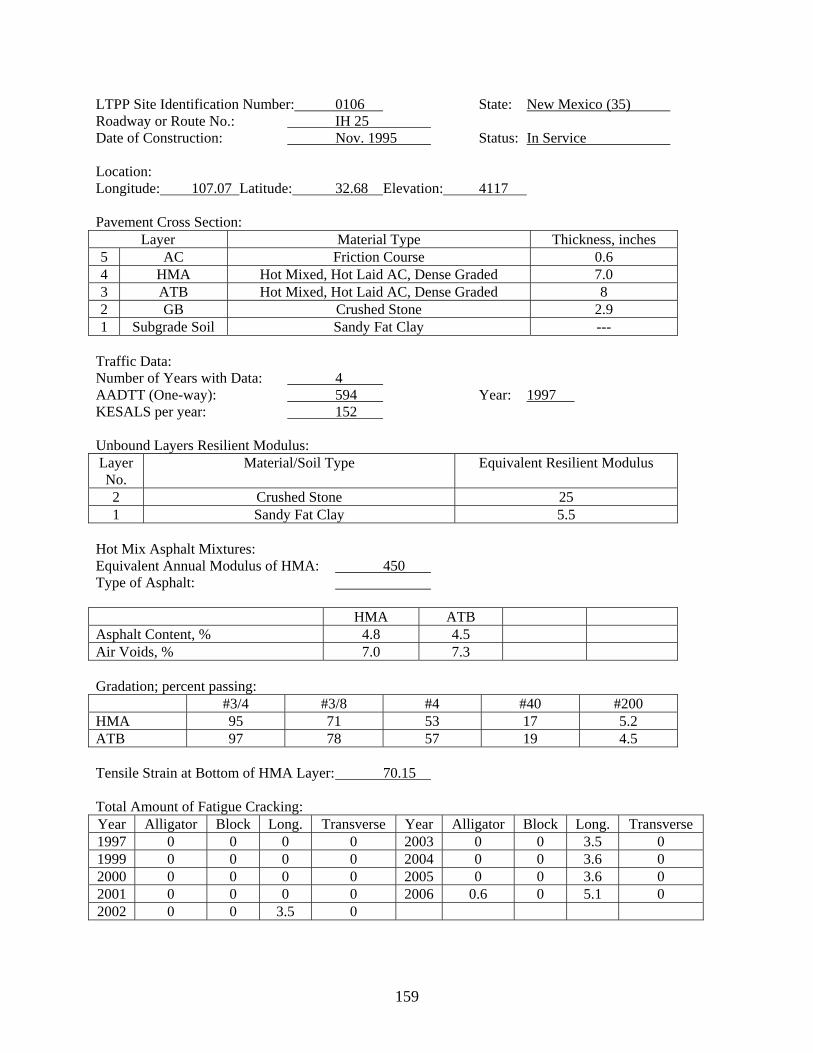
159
LTPP Site Identification Number: 0106 State: New Mexico (35) Roadway or Route No.: IH 25 Date of Construction: Nov. 1995 Status: In Service Location: Longitude: 107.07 Latitude: 32.68 Elevation: 4117 Pavement Cross Section:
Layer Material Type Thickness, inches 5 AC Friction Course 0.6 4 HMA Hot Mixed, Hot Laid AC, Dense Graded 7.0 3 ATB Hot Mixed, Hot Laid AC, Dense Graded 8 2 GB Crushed Stone 2.9 1 Subgrade Soil Sandy Fat Clay ---
Traffic Data: Number of Years with Data: 4 AADTT (One-way): 594 Year: 1997 KESALS per year: 152 Unbound Layers Resilient Modulus: Layer No.
Material/Soil Type Equivalent Resilient Modulus
2 Crushed Stone 25 1 Sandy Fat Clay 5.5
Hot Mix Asphalt Mixtures: Equivalent Annual Modulus of HMA: 450 Type of Asphalt: HMA ATB Asphalt Content, % 4.8 4.5 Air Voids, % 7.0 7.3 Gradation; percent passing: #3/4 #3/8 #4 #40 #200 HMA 95 71 53 17 5.2 ATB 97 78 57 19 4.5 Tensile Strain at Bottom of HMA Layer: 70.15 Total Amount of Fatigue Cracking: Year Alligator Block Long. Transverse Year Alligator Block Long. Transverse 1997 0 0 0 0 2003 0 0 3.5 0 1999 0 0 0 0 2004 0 0 3.6 0 2000 0 0 0 0 2005 0 0 3.6 0 2001 0 0 0 0 2006 0.6 0 5.1 0 2002 0 0 3.5 0

160
LTPP Site Identification Number: 0103 State: New Mexico (35) Roadway or Route No.: IH 25 Date of Construction: Nov. 1995 Status: In Service Location: Longitude: 107.07 Latitude: 32.68 Elevation: 4117 Pavement Cross Section:
Layer Material Type Thickness, inches 5 4 AC Friction Course (2) 0.6 3 HMA Hot Mixed, Hot Laid AC, Dense Graded 4.7 2 ATB Hot Mixed, Hot Laid AC, Dense Graded (319) 7.2 1 Subgrade Soil Fat Inorganic Clay (103) ---
Traffic Data: Number of Years with Data: 4 AADTT (One-way): 594 Year: 1997 KESALS per year: 152 Unbound Layers Resilient Modulus: Layer No.
Material/Soil Type Equivalent Resilient Modulus
1 Fat Inorganic Clay 5.5
Hot Mix Asphalt Mixtures: Equivalent Annual Modulus of HMA: 450 Type of Asphalt: HMA ATB Asphalt Content, % Air Voids, % Gradation; percent passing: #3/4 #3/8 #4 #40 #200 HMA ATB Tensile Strain at Bottom of HMA Layer: Total Amount of Fatigue Cracking: Year Alligator Block Long. Transverse Year Alligator Block Long. Transverse 1997 0 0 0 0 2003 0.1 0 12.5 0 1999 0 0 0 0 2004 0.2 0 20.4 0 2000 0 0 0 0 2005 0.3 0 26.7 0 2001 0 0 0 0 2006 0.3 0 36.2 0.4 2002 0.1 0 11.0 0
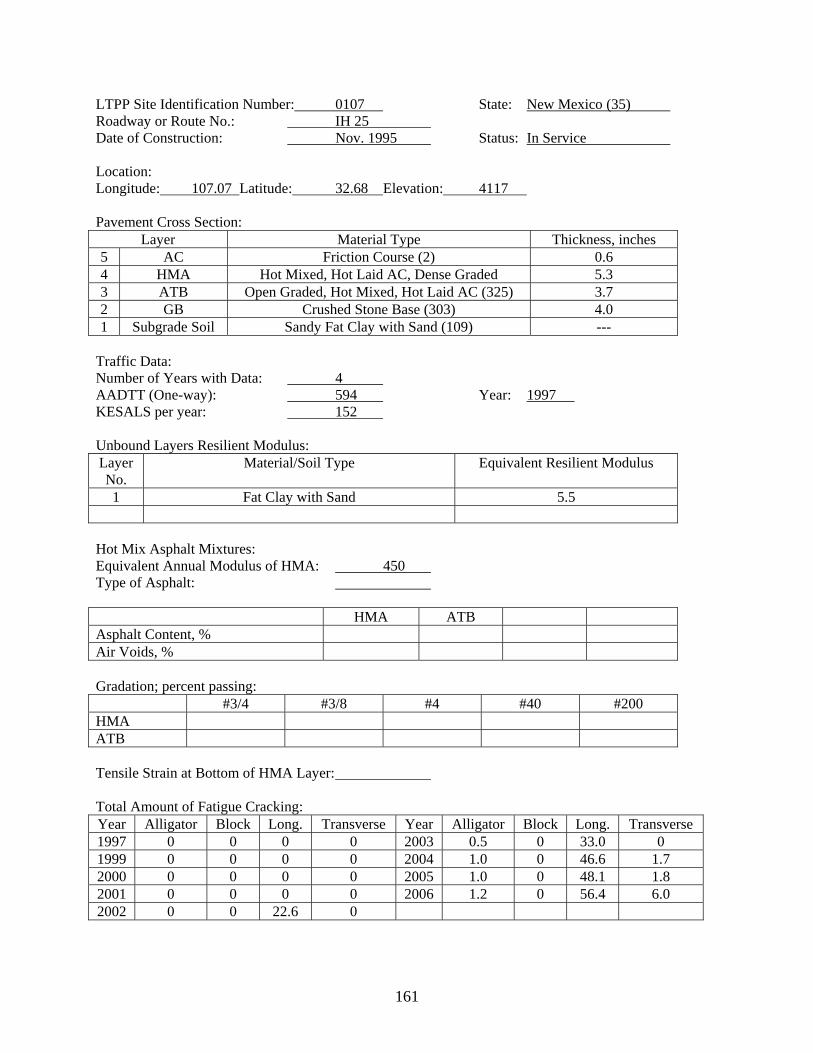
161
LTPP Site Identification Number: 0107 State: New Mexico (35) Roadway or Route No.: IH 25 Date of Construction: Nov. 1995 Status: In Service Location: Longitude: 107.07 Latitude: 32.68 Elevation: 4117 Pavement Cross Section:
Layer Material Type Thickness, inches 5 AC Friction Course (2) 0.6 4 HMA Hot Mixed, Hot Laid AC, Dense Graded 5.3 3 ATB Open Graded, Hot Mixed, Hot Laid AC (325) 3.7 2 GB Crushed Stone Base (303) 4.0 1 Subgrade Soil Sandy Fat Clay with Sand (109) ---
Traffic Data: Number of Years with Data: 4 AADTT (One-way): 594 Year: 1997 KESALS per year: 152 Unbound Layers Resilient Modulus: Layer No.
Material/Soil Type Equivalent Resilient Modulus
1 Fat Clay with Sand 5.5
Hot Mix Asphalt Mixtures: Equivalent Annual Modulus of HMA: 450 Type of Asphalt: HMA ATB Asphalt Content, % Air Voids, % Gradation; percent passing: #3/4 #3/8 #4 #40 #200 HMA ATB Tensile Strain at Bottom of HMA Layer: Total Amount of Fatigue Cracking: Year Alligator Block Long. Transverse Year Alligator Block Long. Transverse 1997 0 0 0 0 2003 0.5 0 33.0 0 1999 0 0 0 0 2004 1.0 0 46.6 1.7 2000 0 0 0 0 2005 1.0 0 48.1 1.8 2001 0 0 0 0 2006 1.2 0 56.4 6.0 2002 0 0 22.6 0

162
LTPP Site Identification Number: 0111 State: New Mexico (35) Roadway or Route No.: IH 25 Date of Construction: Nov. 1995 Status: In Service Location: Longitude: 107.07 Latitude: 32.68 Elevation: 4117 Pavement Cross Section:
Layer Material Type Thickness, inches 5 AC Friction Course 0.6 4 HMA Hot Mixed, Hot Laid AC, Dense Graded 4.3 3 ATB HMAC, Hot Laid, Central Plant Mix 7.6 2 PATB Open Graded Mix 3.7 1 Subgrade Soil Clayey Sand ---
Traffic Data: Number of Years with Data: 4 AADTT (One-way): 594 Year: 1997 KESALS per year: 152 Unbound Layers Resilient Modulus: Layer Material/Soil Type Equivalent Resilient Modulus, ksi
1 Clayey Sand 10
Hot Mix Asphalt Mixtures: Equivalent Annual Modulus of HMA: 450 Type of Asphalt: HMA ATB Asphalt Content, % 4.3 4.2 Air Voids, % 8.2 7.3 Gradation; percent passing: #3/4 #3/8 #4 #40 #200 HMA 95 73 51 16 4.0 ATB 97 78 57 19 4.5 Tensile Strain at Bottom of HMA Layer: 61.73 Total Amount of Fatigue Cracking: Year Alligator Block Long. Transverse Year Alligator Block Long. Transverse 1997 0 0 0 0 2003 0 0 0 0 1999 0 0 0 0 2004 0 0 0 0 2000 0 0 0 0 2005 0 0 0 0 2001 0 0 0 0 2006 0 0 0 0 2002 0 0 0 0
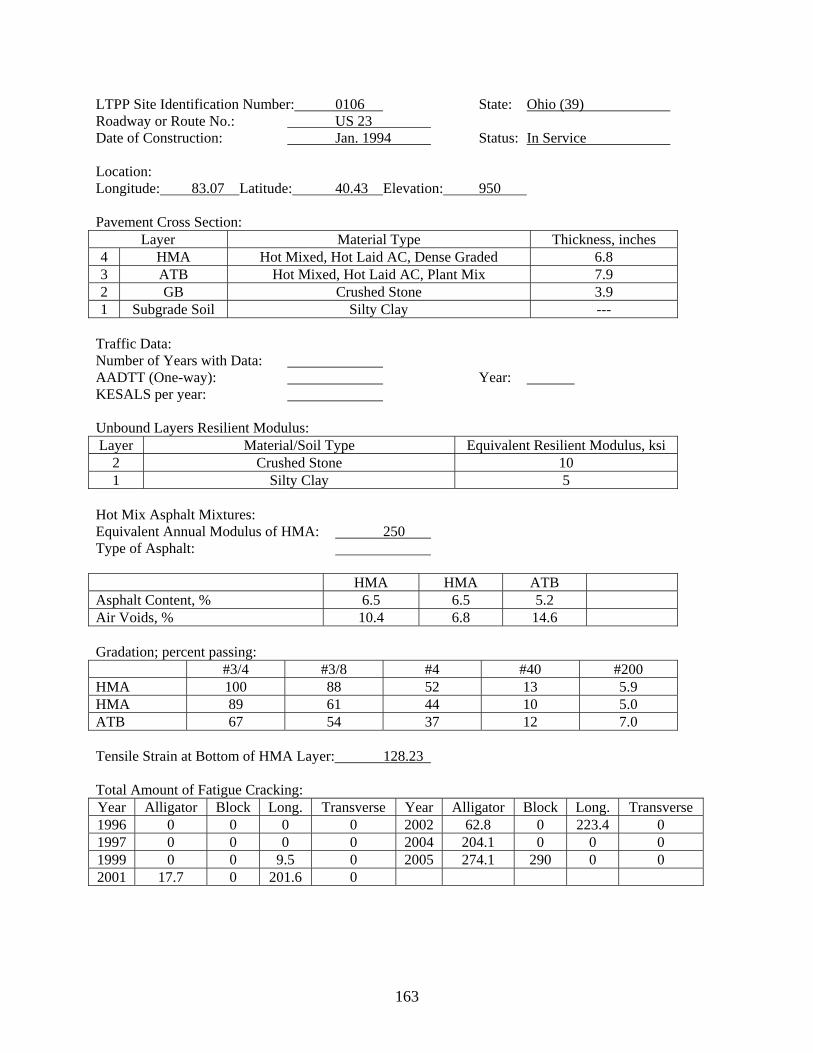
163
LTPP Site Identification Number: 0106 State: Ohio (39) Roadway or Route No.: US 23 Date of Construction: Jan. 1994 Status: In Service Location: Longitude: 83.07 Latitude: 40.43 Elevation: 950 Pavement Cross Section:
Layer Material Type Thickness, inches 4 HMA Hot Mixed, Hot Laid AC, Dense Graded 6.8 3 ATB Hot Mixed, Hot Laid AC, Plant Mix 7.9 2 GB Crushed Stone 3.9 1 Subgrade Soil Silty Clay ---
Traffic Data: Number of Years with Data: AADTT (One-way): Year: KESALS per year: Unbound Layers Resilient Modulus: Layer Material/Soil Type Equivalent Resilient Modulus, ksi
2 Crushed Stone 10 1 Silty Clay 5
Hot Mix Asphalt Mixtures: Equivalent Annual Modulus of HMA: 250 Type of Asphalt: HMA HMA ATB Asphalt Content, % 6.5 6.5 5.2 Air Voids, % 10.4 6.8 14.6 Gradation; percent passing: #3/4 #3/8 #4 #40 #200 HMA 100 88 52 13 5.9 HMA 89 61 44 10 5.0 ATB 67 54 37 12 7.0 Tensile Strain at Bottom of HMA Layer: 128.23 Total Amount of Fatigue Cracking: Year Alligator Block Long. Transverse Year Alligator Block Long. Transverse 1996 0 0 0 0 2002 62.8 0 223.4 0 1997 0 0 0 0 2004 204.1 0 0 0 1999 0 0 9.5 0 2005 274.1 290 0 0 2001 17.7 0 201.6 0

164
LTPP Site Identification Number: 0112 State: Ohio (39) Roadway or Route No.: US 23 Date of Construction: Jan. 1994 Status: In Service Location: Longitude: 83.07 Latitude: 40.43 Elevation: 950 Pavement Cross Section:
Layer Material Type Thickness, inches 5 HMA Hot Mixed, Hot Laid AC, Dense Graded 1.7 4 HMA Hot Mixed, Hot Laid AC, Dense Graded 2.3 3 ATB Hot Mixed, Hot Laid AC, Plant Mix 11.8 2 PATB Open Graded, Plant Mix 4.0 1 Subgrade Soil Silty Clay ---
Traffic Data: Number of Years with Data: AADTT (One-way): Year: KESALS per year: Unbound Layers Resilient Modulus: Layer Material/Soil Type Equivalent Resilient Modulus, ksi
1 Silty Clay 5
Hot Mix Asphalt Mixtures: Equivalent Annual Modulus of HMA: 250 Type of Asphalt: HMA HMA ATB Asphalt Content, % 6.5 6.5 5.2 Air Voids, % 11.3 7.6 5.0 Gradation; percent passing: #3/4 #3/8 #4 #40 #200 HMA 100 89 53 12 5.7 HMA 94 74 54 12 6.1 ATB 62 49 33 12 7.3 Tensile Strain at Bottom of HMA Layer: 128.23 Total Amount of Fatigue Cracking: Year Alligator Block Long. Transverse Year Alligator Block Long. Transverse 1996 0 0 0 0 2004 138.3 0 0 0 1999 0 0 3.5 0 2005 244.0 320 0 0 2001 0 0 107.5 0 2002 20.5 0 37.8 0

165
LTPP Site Identification Number: 0902 State: Ohio (39) Roadway or Route No.: US 23 Date of Construction: Jan. 1994 Status: In Service Location: Longitude: 83.07 Latitude: 40.43 Elevation: 950 Pavement Cross Section:
Layer Material Type Thickness, inches 6 HMA Hot Mixed, Hot Laid AC, Dense Graded 1.8 5 HMA Hot Mixed, Hot Laid AC, Dense Graded 2.3 4 ATB Asphalt Treated Mixture, Plant Mix 12.0 3 PATB Open Graded, Hot Laid, Central Plant Mix 3.7 2 GS Crushed Stone 6 1 Subgrade Soil Silty Clay ---
Traffic Data: Number of Years with Data: AADTT (One-way): Year: KESALS per year: Unbound Layers Resilient Modulus: Layer Material/Soil Type Equivalent Resilient Modulus, ksi
3 Open Graded, Hot Laid, Central Plant Mix 25 2 Crushed Stone 80 1 Silty Clay 8
Hot Mix Asphalt Mixtures: Equivalent Annual Modulus of HMA: 450 Type of Asphalt: HMA ATB Asphalt Content, % 6.4 5.4 Air Voids, % 7.1 9.1 Gradation; percent passing: #3/4 #3/8 #4 #40 #200 HMA 100 88 61 4.6 ATB 100 78 58 4.8 Tensile Strain at Bottom of HMA Layer: 49.22 Total Amount of Fatigue Cracking: Year Alligator Block Long. Transverse Year Alligator Block Long. Transverse 1996 0 0 0 0 2004 1.3 0 0 0 1999 0 0 0 0 2001 0 0 4.9 0

166
LTPP Site Identification Number: 0903 State: Ohio (39) Roadway or Route No.: US 23 Date of Construction: Jan. 1994 Status: In Service Location: Longitude: 83.07 Latitude: 40.43 Elevation: 950 Pavement Cross Section:
Layer Material Type Thickness, inches 6 HMA Hot Mixed, Hot Laid AC, Dense Graded 1.8 5 HMA Hot Mixed, Hot Laid AC, Dense Graded 2.2 4 ATB Asphalt Treated Mixture, Plant Mix 12.0 3 PATB Open Graded, Hot Laid, Plant Mix 3.7 2 GS Crushed Stone 6.0 1 Subgrade Soil Silty Clay ---
Traffic Data: Number of Years with Data: AADTT (One-way): Year: KESALS per year: Unbound Layers Resilient Modulus: Layer No.
Material/Soil Type Equivalent Resilient Modulus
3 Open Graded, Hot Laid, Central Plant Mix 25 2 Crushed Stone 80 1 Silty Clay 8
Hot Mix Asphalt Mixtures: Equivalent Annual Modulus of HMA: 450 Type of Asphalt: HMA ATB Asphalt Content, % 5.4 5.4 Air Voids, % 12.8 11.4 Gradation; percent passing: #3/4 #3/8 #4 #40 #200 HMA 100 86 51 4.7 ATB 100 67 49 7.0 Tensile Strain at Bottom of HMA Layer: 49.07 Total Amount of Fatigue Cracking: Year Alligator Block Long. Transverse Year Alligator Block Long. Transverse 1996 0 0 0 0 2004 154.1 0 0 0 1999 0 0 0 0 2001 0 0 123.8 0
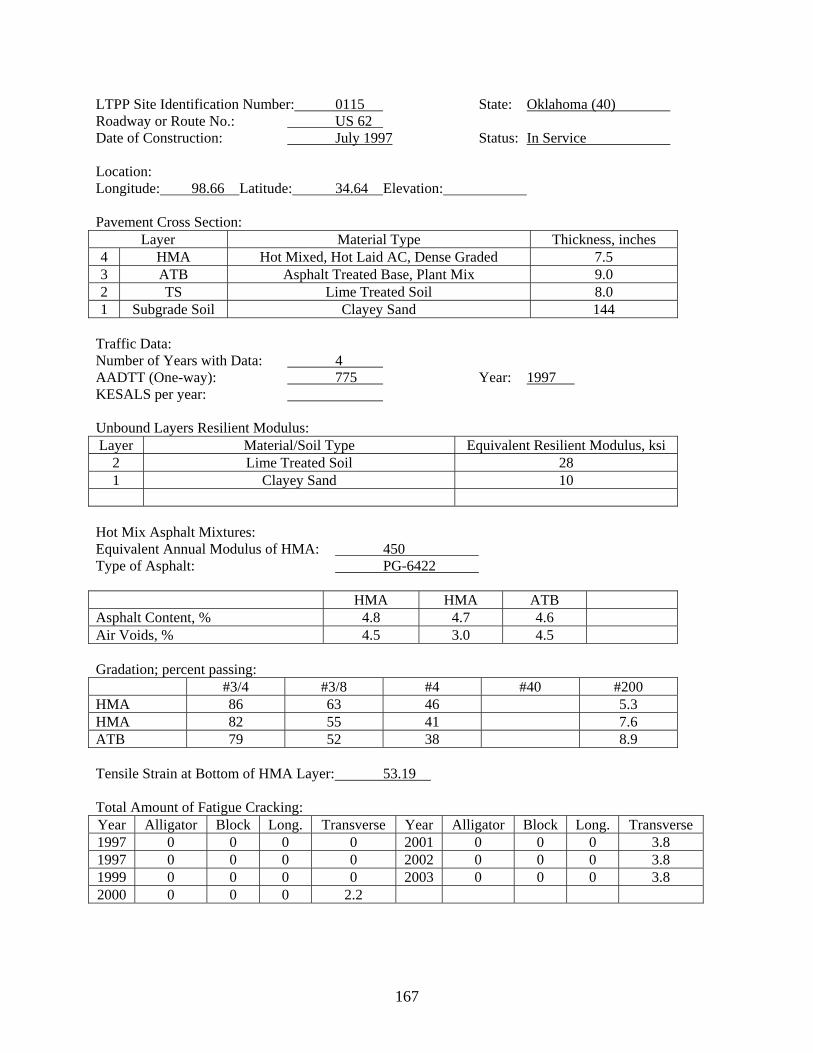
167
LTPP Site Identification Number: 0115 State: Oklahoma (40) Roadway or Route No.: US 62 Date of Construction: July 1997 Status: In Service Location: Longitude: 98.66 Latitude: 34.64 Elevation: Pavement Cross Section:
Layer Material Type Thickness, inches 4 HMA Hot Mixed, Hot Laid AC, Dense Graded 7.5 3 ATB Asphalt Treated Base, Plant Mix 9.0 2 TS Lime Treated Soil 8.0 1 Subgrade Soil Clayey Sand 144
Traffic Data: Number of Years with Data: 4 AADTT (One-way): 775 Year: 1997 KESALS per year: Unbound Layers Resilient Modulus: Layer Material/Soil Type Equivalent Resilient Modulus, ksi
2 Lime Treated Soil 28 1 Clayey Sand 10
Hot Mix Asphalt Mixtures: Equivalent Annual Modulus of HMA: 450 Type of Asphalt: PG-6422 HMA HMA ATB Asphalt Content, % 4.8 4.7 4.6 Air Voids, % 4.5 3.0 4.5 Gradation; percent passing: #3/4 #3/8 #4 #40 #200 HMA 86 63 46 5.3 HMA 82 55 41 7.6 ATB 79 52 38 8.9 Tensile Strain at Bottom of HMA Layer: 53.19 Total Amount of Fatigue Cracking: Year Alligator Block Long. Transverse Year Alligator Block Long. Transverse 1997 0 0 0 0 2001 0 0 0 3.8 1997 0 0 0 0 2002 0 0 0 3.8 1999 0 0 0 0 2003 0 0 0 3.8 2000 0 0 0 2.2
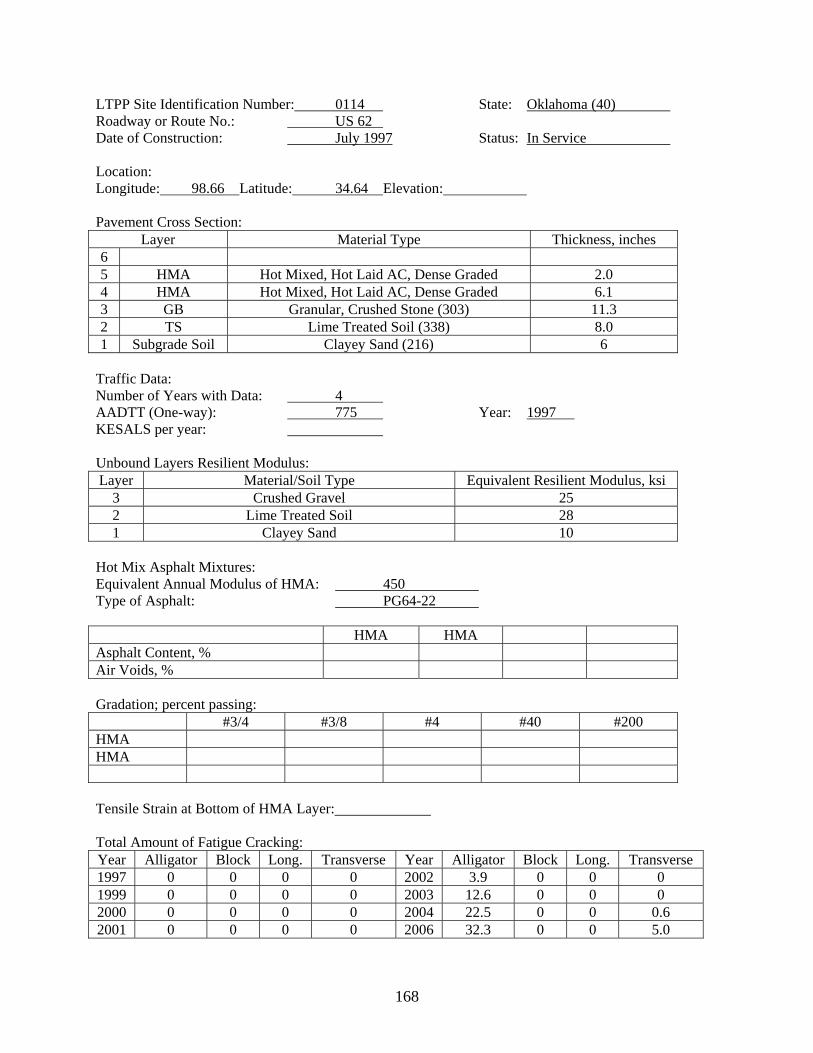
168
LTPP Site Identification Number: 0114 State: Oklahoma (40) Roadway or Route No.: US 62 Date of Construction: July 1997 Status: In Service Location: Longitude: 98.66 Latitude: 34.64 Elevation: Pavement Cross Section:
Layer Material Type Thickness, inches 6 5 HMA Hot Mixed, Hot Laid AC, Dense Graded 2.0 4 HMA Hot Mixed, Hot Laid AC, Dense Graded 6.1 3 GB Granular, Crushed Stone (303) 11.3 2 TS Lime Treated Soil (338) 8.0 1 Subgrade Soil Clayey Sand (216) 6
Traffic Data: Number of Years with Data: 4 AADTT (One-way): 775 Year: 1997 KESALS per year: Unbound Layers Resilient Modulus: Layer Material/Soil Type Equivalent Resilient Modulus, ksi
3 Crushed Gravel 25 2 Lime Treated Soil 28 1 Clayey Sand 10
Hot Mix Asphalt Mixtures: Equivalent Annual Modulus of HMA: 450 Type of Asphalt: PG64-22 HMA HMA Asphalt Content, % Air Voids, % Gradation; percent passing: #3/4 #3/8 #4 #40 #200 HMA HMA Tensile Strain at Bottom of HMA Layer: Total Amount of Fatigue Cracking: Year Alligator Block Long. Transverse Year Alligator Block Long. Transverse 1997 0 0 0 0 2002 3.9 0 0 0 1999 0 0 0 0 2003 12.6 0 0 0 2000 0 0 0 0 2004 22.5 0 0 0.6 2001 0 0 0 0 2006 32.3 0 0 5.0

169
LTPP Site Identification Number: 0117 State: Oklahoma (40) Roadway or Route No.: US 62 Date of Construction: July 1997 Status: In Service Location: Longitude: 98.66 Latitude: 34.64 Elevation: Pavement Cross Section:
Layer Material Type Thickness, inches 6 HMA Hot Mixed, Hot Laid AC, Dense Graded 1.9 5 HMA Hot Mixed, Hot Laid AC, Dense Graded 2.7 4 ATB Asphalt Treated Base, Plant Mix 8.3 3 GB Granular, Crushed Gravel 3.6 2 TS Lime Treated Soil 8.0 1 Subgrade Soil Clayey Sand 72
Traffic Data: Number of Years with Data: 4 AADTT (One-way): 775 Year: 1997 KESALS per year: Unbound Layers Resilient Modulus: Layer Material/Soil Type Equivalent Resilient Modulus, ksi
3 Crushed Gravel 25 2 Lime Treated Soil 28 1 Clayey Sand 10
Hot Mix Asphalt Mixtures: Equivalent Annual Modulus of HMA: 450 Type of Asphalt: PG64-22 HMA HMA ATB Asphalt Content, % 4.4 4.2 4.5 Air Voids, % 8.0 5.0 3.0 Gradation; percent passing: #3/4 #3/8 #4 #40 #200 HMA 100 82 63 4.1 HMA 85 50 47 4.8 ATB 82 55 41 8.3 Tensile Strain at Bottom of HMA Layer: 53.19 Total Amount of Fatigue Cracking: Year Alligator Block Long. Transverse Year Alligator Block Long. Transverse 1997 0 0 0 0 2002 0 0 0 0 1999 0 0 0 0 2003 0.5 0 0 0 2000 0 0 0 0 2001 0 0 0 0

170
LTPP Site Identification Number: 0160 State: Oklahoma (40) Roadway or Route No.: US 62 Date of Construction: July 1997 Status: In Service Location: Longitude: 98.66 Latitude: 34.64 Elevation: Pavement Cross Section:
Layer Material Type Thickness, inches 6 HMA Hot Mixed, Hot Laid AC, Dense Graded 1.5 5 HMA Hot Mixed, Hot Laid AC, Dense Graded 6.5 4 ATB Asphalt Treated Base, Plant Mix (319) 4.0 3 GB Granular, Crushed Stone (303) 5.4 2 TS Lime Treated Soil (338) 8.0 1 Subgrade Soil Clayey Sand (216) ---
Traffic Data: Number of Years with Data: 4 AADTT (One-way): 775 Year: 1997 KESALS per year: Unbound Layers Resilient Modulus: Layer Material/Soil Type Equivalent Resilient Modulus, ksi
3 Crushed Gravel 25 2 Lime Treated Soil 28 1 Clayey Sand 10
Hot Mix Asphalt Mixtures: Equivalent Annual Modulus of HMA: 450 Type of Asphalt: PG64-22 HMA HMA ATB Asphalt Content, % Air Voids, % Gradation; percent passing: #3/4 #3/8 #4 #40 #200 HMA HMA ATB Tensile Strain at Bottom of HMA Layer: Total Amount of Fatigue Cracking: Year Alligator Block Long. Transverse Year Alligator Block Long. Transverse 1997 0 0 0 0 2002 0 0 0 0 1999 0 0 0 0 2003 0 0 0 0 2000 0 0 0 0 2004 0 0 0 0 2001 0 0 0 0 2006 0 0 0 0
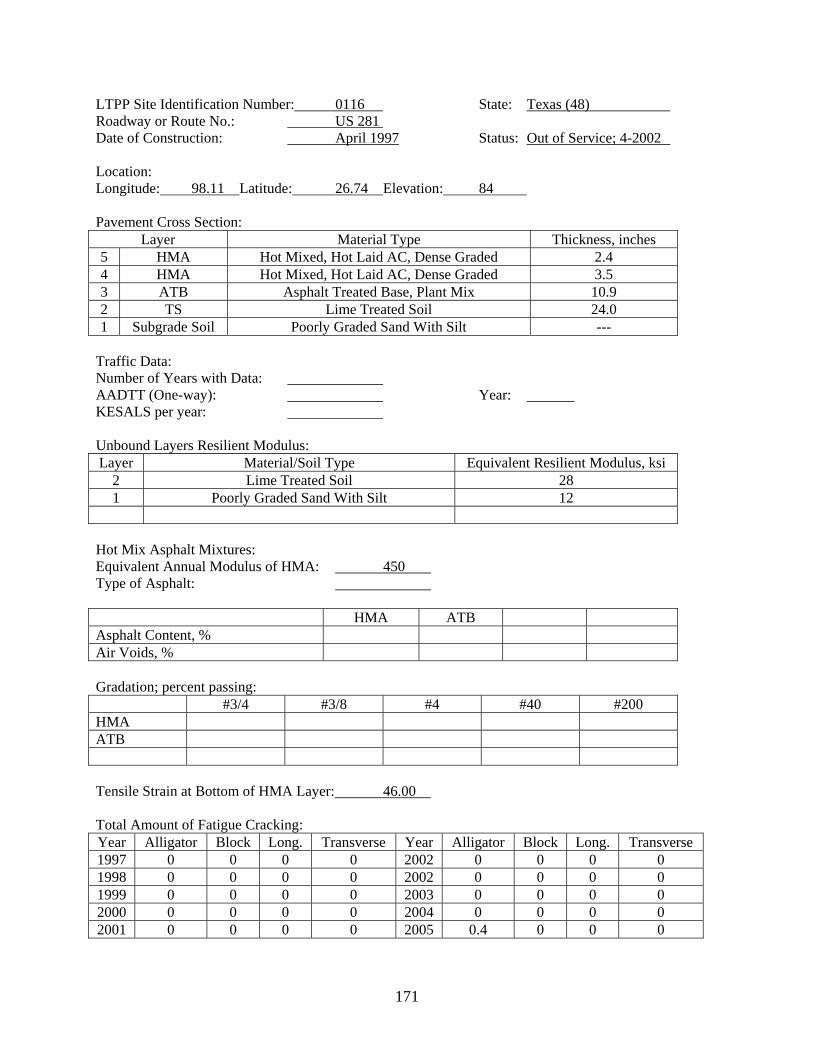
171
LTPP Site Identification Number: 0116 State: Texas (48) Roadway or Route No.: US 281 Date of Construction: April 1997 Status: Out of Service; 4-2002 Location: Longitude: 98.11 Latitude: 26.74 Elevation: 84 Pavement Cross Section:
Layer Material Type Thickness, inches 5 HMA Hot Mixed, Hot Laid AC, Dense Graded 2.4 4 HMA Hot Mixed, Hot Laid AC, Dense Graded 3.5 3 ATB Asphalt Treated Base, Plant Mix 10.9 2 TS Lime Treated Soil 24.0 1 Subgrade Soil Poorly Graded Sand With Silt ---
Traffic Data: Number of Years with Data: AADTT (One-way): Year: KESALS per year: Unbound Layers Resilient Modulus: Layer Material/Soil Type Equivalent Resilient Modulus, ksi
2 Lime Treated Soil 28 1 Poorly Graded Sand With Silt 12
Hot Mix Asphalt Mixtures: Equivalent Annual Modulus of HMA: 450 Type of Asphalt: HMA ATB Asphalt Content, % Air Voids, % Gradation; percent passing: #3/4 #3/8 #4 #40 #200 HMA ATB Tensile Strain at Bottom of HMA Layer: 46.00 Total Amount of Fatigue Cracking: Year Alligator Block Long. Transverse Year Alligator Block Long. Transverse 1997 0 0 0 0 2002 0 0 0 0 1998 0 0 0 0 2002 0 0 0 0 1999 0 0 0 0 2003 0 0 0 0 2000 0 0 0 0 2004 0 0 0 0 2001 0 0 0 0 2005 0.4 0 0 0

172
LTPP Site Identification Number: 0124 State: Texas (48) Roadway or Route No.: US 281 Date of Construction: April 1997 Status: Out of Service; 4-2002 Location: Longitude: 98.11 Latitude: 26.74 Elevation: 84 Pavement Cross Section:
Layer Material Type Thickness, inches 6 HMA Hot Mixed, Hot Laid AC, Dense Graded 2.2 5 HMA Hot Mixed, Hot Laid AC, Dense Graded 4.2 4 ATB HMAC, Hot Laid, Central Plant Mix 10.8 3 PATB Open Graded, Plant Mix 4.2 2 TS Lime Treated Soil 24.0 1 Subgrade Soil Poorly Graded Sand with Silt ---
Traffic Data: Number of Years with Data: AADTT (One-way): Year: KESALS per year: Unbound Layers Resilient Modulus: Layer Material/Soil Type Equivalent Resilient Modulus, ksi
2 Lime Treated Soil 28 1 Poorly Graded Sand with Silt 12
Hot Mix Asphalt Mixtures: Equivalent Annual Modulus of HMA: 450 Type of Asphalt: HMA ATB Asphalt Content, % Air Voids, % Gradation; percent passing: #3/4 #3/8 #4 #40 #200 HMA ATB Tensile Strain at Bottom of HMA Layer: 30.69 Total Amount of Fatigue Cracking: Year Alligator Block Long. Transverse Year Alligator Block Long. Transverse 1997 0 0 0 0 2002 0 0 0 0 1998 0 0 0 0 2003 0 0 0 0 1999 0 0 0 0 2004 0 0 0 0 2000 0 0 0 0 2005 0 0 0 0 2001 0 0 0 0

173
LTPP Site Identification Number: 1070 State: Texas (48) Roadway or Route No.: SH 175 Date of Construction: 7-1-1977 Status: Out of Service; 7-2003 Location: Longitude: 96.38 Latitude: 32.59 Elevation: 429 Pavement Cross Section:
Layer Material Type Thickness, inches 5 HMA Hot Mixed, Hot Laid AC, Dense Graded 1.2 4 HMA Hot Mixed, Hot Laid AC, Dense Graded 9.3 3 ATB Other; Treated Layer 13.5 2 TS Lime Treated Soil 10.0 1 Subgrade Soil Fat Inorganic Clay ---
Traffic Data: Number of Years with Data: 8 AADTT (One-way): 532 Year: 1997 KESALS per year: 153 Unbound Layers Resilient Modulus: Layer Material/Soil Type Equivalent Resilient Modulus, ksi
2 Lime Treated Soil 28 1 Fat Inorganic Clay 6
Hot Mix Asphalt Mixtures: Equivalent Annual Modulus of HMA: 450 Type of Asphalt: HMA ATB Asphalt Content, % Air Voids, % Gradation; percent passing: #3/4 #3/8 #4 #40 #200 HMA ATB Tensile Strain at Bottom of HMA Layer: 32.30 Total Amount of Fatigue Cracking: Year Alligator Block Long. Transverse Year Alligator Block Long. Transverse 1991 0 0 46 82 2000 1.8 216.7 25.6 215.2 1993 0 0 53.2 85.7 2002 1.5 220.8 23.6 215.0 1995 0 0 77.9 147.6 2003 1.7 211.6 16.1 245.9 1998 3.2 320.3 3 30.9

174
LTPP Site Identification Number: 1048 State: Texas (48) Roadway or Route No.: US 385 Date of Construction: 11-1-1974 Status: Out of Service; 8-1996 Location: Longitude: 102.38 Latitude: 31.88 Elevation: 2942 Pavement Cross Section:
Layer Material Type Thickness, inches 3 HMA Hot Mixed, Hot Laid, Dense Graded Mix (1) 1.2 2 ATB Open Graded, Plant Mix (319) 9.8 1 Subgrade Soil Coarse Grained Soil (215) ---
Traffic Data: Number of Years with Data: 6 AADTT (One-way): 103 Year: 1996 KESALS per year: 20 Unbound Layers Resilient Modulus: Layer No.
Material/Soil Type Equivalent Resilient Modulus
1 215 ---
Hot Mix Asphalt Mixtures: Equivalent Annual Modulus of HMA: --- Type of Asphalt: HMA ATB Asphalt Content, % Air Voids, % Gradation; percent passing: #3/4 #3/8 #4 #40 #200 HMA ATB Tensile Strain at Bottom of HMA Layer: Total Amount of Fatigue Cracking: Year Alligator Block Long. Transverse Year Alligator Block Long. Transverse 1991 0 0 0 56.4 1993 0 0 35.1 61.1 1995 0.7 0 46.2 63.5 1996 7 7.5 7 51.9

175
LTPP Site Identification Number: 0124 State: Wisconsin (55) Roadway or Route No.: US 29 Date of Construction: Nov. 1997 Status: Out of Service in 2008 Location: Longitude: 89.29 Latitude: 44.87 Elevation: 1239 Pavement Cross Section:
Layer Material Type Thickness, inches 6 HMA Hot Mixed, Hot Laid AC, Dense Graded 1.9 5 HMA Hot Mixed, Hot Laid AC, Dense Graded 5.2 4 ATB HMAC, Hot Laid, Central Plant Mix 11.7 3 PATB Open Graded, Plant Mix 3.3 2 GS Soil Agg. Mix.; A-1-b 8.0 1 Subgrade Soil Silty Sand; A-1-b ---
Traffic Data: Number of Years with Data: 4 AADTT (One-way): 260 Year: 1997 KESALS per year: Unbound Layers Resilient Modulus: Layer Material/Soil Type Equivalent Resilient Modulus, ksi
2 Soil Agg. Mix. 14 1 Silty Sand 10
Hot Mix Asphalt Mixtures: Equivalent Annual Modulus of HMA: 450 Type of Asphalt: AC-20 HMA HMA ATB Asphalt Content, % 4.9 5.0 3.3 Air Voids, % 7.5 6.2 5.9 Gradation; percent passing: #3/4 #3/8 #4 #40 #200 HMA 99 86 66 3.5 HMA 99 86 66 3.5 ATB 92 53 37 3.0 Tensile Strain at Bottom of HMA Layer: 34.73 Total Amount of Fatigue Cracking: Year Alligator Block Long. Transverse Year Alligator Block Long. Transverse 1998 0 0 0 0 2005 0 0 0 0 2000 0 0 0 0 2002 0 0 0 0 2004 0 0 0 0
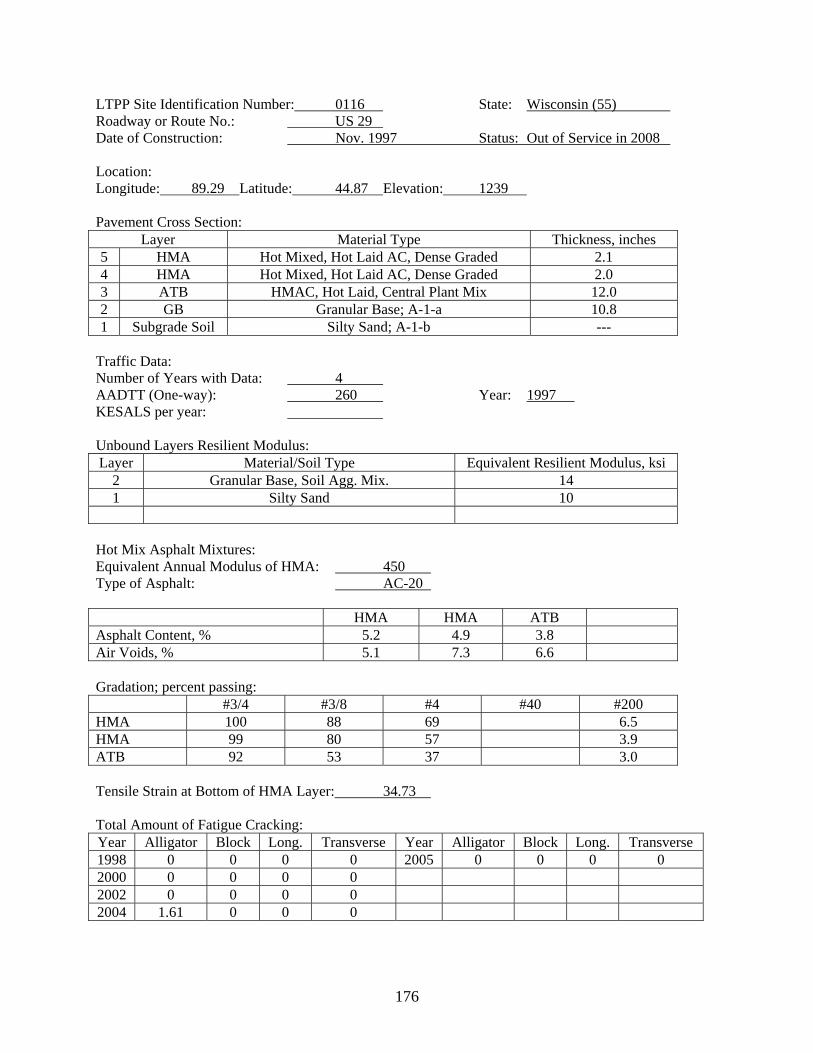
176
LTPP Site Identification Number: 0116 State: Wisconsin (55) Roadway or Route No.: US 29 Date of Construction: Nov. 1997 Status: Out of Service in 2008 Location: Longitude: 89.29 Latitude: 44.87 Elevation: 1239 Pavement Cross Section:
Layer Material Type Thickness, inches 5 HMA Hot Mixed, Hot Laid AC, Dense Graded 2.1 4 HMA Hot Mixed, Hot Laid AC, Dense Graded 2.0 3 ATB HMAC, Hot Laid, Central Plant Mix 12.0 2 GB Granular Base; A-1-a 10.8 1 Subgrade Soil Silty Sand; A-1-b ---
Traffic Data: Number of Years with Data: 4 AADTT (One-way): 260 Year: 1997 KESALS per year: Unbound Layers Resilient Modulus: Layer Material/Soil Type Equivalent Resilient Modulus, ksi
2 Granular Base, Soil Agg. Mix. 14 1 Silty Sand 10
Hot Mix Asphalt Mixtures: Equivalent Annual Modulus of HMA: 450 Type of Asphalt: AC-20 HMA HMA ATB Asphalt Content, % 5.2 4.9 3.8 Air Voids, % 5.1 7.3 6.6 Gradation; percent passing: #3/4 #3/8 #4 #40 #200 HMA 100 88 69 6.5 HMA 99 80 57 3.9 ATB 92 53 37 3.0 Tensile Strain at Bottom of HMA Layer: 34.73 Total Amount of Fatigue Cracking: Year Alligator Block Long. Transverse Year Alligator Block Long. Transverse 1998 0 0 0 0 2005 0 0 0 0 2000 0 0 0 0 2002 0 0 0 0 2004 1.61 0 0 0

177
LTPP Site Identification Number: 0118 State: Wisconsin (55) Roadway or Route No.: US 29 Date of Construction: Nov. 1997 Status: Out of Service in 2008 Location: Longitude: 89.29 Latitude: 44.87 Elevation: 1239 Pavement Cross Section:
Layer Material Type Thickness, inches 5 HMA Hot Mixed, Hot Laid AC, Dense Graded 1.9 4 HMA Hot Mixed, Hot Laid AC, Dense Graded 2.1 3 ATB HMAC, Hot Laid, Central Plant Mix 8.9 2 GB Granular Base; A-1-b 14.2 1 Subgrade Soil Silty Sand; A-1-a ---
Traffic Data: Number of Years with Data: 4 AADTT (One-way): 260 Year: 1997 KESALS per year: Unbound Layers Resilient Modulus: Layer Material/Soil Type Equivalent Resilient Modulus, ksi
2 Granular Base, Soil Agg. Mix. 14 1 Silty Sand 10
Hot Mix Asphalt Mixtures: Equivalent Annual Modulus of HMA: 450 Type of Asphalt: AC-20 HMA HMA ATB Asphalt Content, % 5.0 4.9 3.8 Air Voids, % 6.6 7.2 6.1 Gradation; percent passing: #3/4 #3/8 #4 #40 #200 HMA 99 86 66 3.5 HMA 99 86 66 3.5 ATB 88 68 58 4.1 Tensile Strain at Bottom of HMA Layer: 34.73 Total Amount of Fatigue Cracking: Year Alligator Block Long. Transverse Year Alligator Block Long. Transverse 1998 0 0 0 0 2005 0 0 0 0 2000 0 0 0 0 2002 0 0 0 0 2004 0 0 0 0

178
LTPP Site Identification Number: 0114 State: Wisconsin (55) Roadway or Route No.: US 29 Date of Construction: Nov. 1997 Status: Out of Service in 2008 Location: Longitude: 89.29 Latitude: 44.87 Elevation: 1239 Pavement Cross Section:
Layer Material Type Thickness, inches 5 HMA Hot Mixed, Hot Laid AC, Dense Graded 1.7 4 HMA Hot Mixed, Hot Laid AC, Dense Graded 6.4 3 GB Crushed Stone Base (303) 11.0 2 GS Soil Agg. Mix.; A-1-b (308) 10.0 1 Subgrade Soil Poorly Graded Sand with Gravel & Silt (205) ---
Traffic Data: Number of Years with Data: 4 AADTT (One-way): 260 Year: 1997 KESALS per year: Unbound Layers Resilient Modulus: Layer Material/Soil Type Equivalent Resilient Modulus, ksi
2 Soil Agg. Mix. 14 1 Poorly Graded Sand 10
Hot Mix Asphalt Mixtures: Equivalent Annual Modulus of HMA: 450 Type of Asphalt: AC-20 HMA HMA Asphalt Content, % Air Voids, % Gradation; percent passing: #3/4 #3/8 #4 #40 #200 HMA HMA Tensile Strain at Bottom of HMA Layer: Total Amount of Fatigue Cracking: Year Alligator Block Long. Transverse Year Alligator Block Long. Transverse 1998 0 0 0 0 2005 0 0 0 0 2000 0 0 0 0 2002 0 0 0 0 2005

179
LTPP Site Identification Number: C903 State: Wisconsin (55) Roadway or Route No.: US 29 Date of Construction: Nov. 1996 Status: In Service Location: Longitude: 89.29 Latitude: 44.87 Elevation: 1239 Pavement Cross Section:
Layer Material Type Thickness, inches 5 HMA Hot Mixed, Hot Laid AC, Dense Graded 2.0 4 HMA Hot Mixed, Hot Laid AC, Dense Graded 7.2 3 GB Crushed Stone Base; A-1-a 13.0 2 GS Embankment; Coarse-Fine soil; A-3 5.0 1 Subgrade Soil Silty Sand; A-1-b ---
Traffic Data: Number of Years with Data: 4 AADTT (One-way): 260 Year: 1997 KESALS per year: Unbound Layers Resilient Modulus: Layer Material/Soil Type Equivalent Resilient Modulus, ksi
2 Granular Base, Soil Agg. Mix. 14 1 Silty Sand 10
Hot Mix Asphalt Mixtures: Equivalent Annual Modulus of HMA: 450 Type of Asphalt: PG58-340 HMA HMA Asphalt Content, % 5.0 5.0 Air Voids, % 8.0 8.0 Gradation; percent passing: #3/4 #3/8 #4 #40 #200 HMA 100 73 42 3.7 HMA 99 69 51 3.4 Tensile Strain at Bottom of HMA Layer: 34.73 Total Amount of Fatigue Cracking: Year Alligator Block Long. Transverse Year Alligator Block Long. Transverse 1998 0 0 0 0 2005 5.2 0 0 1.0 2000 0 0 0 0 2002 0 0 0 0 2004 2.9 0 0 0

180
LTPP Site Identification Number: C901 State: Wisconsin (55) Roadway or Route No.: US 29 Date of Construction: Nov. 1996 Status: In Service Location: Longitude: 89.29 Latitude: 44.87 Elevation: 1239 Pavement Cross Section:
Layer Material Type Thickness, inches 5 HMA Hot Mixed, Hot Laid AC, Dense Graded 2.0 4 HMA Hot Mixed, Hot Laid AC, Dense Graded 7.8 3 GB Crushed Stone Base; A-1-a (303) 13.0 2 GS Embankment; Coarse-Fine soil; A-3 (210) 24.0 1 Subgrade Soil Well Graded Sand with Silt & Gravel (211) ---
Traffic Data: Number of Years with Data: 4 AADTT (One-way): 260 Year: 1997 KESALS per year: Unbound Layers Resilient Modulus: Layer Material/Soil Type Equivalent Resilient Modulus, ksi
2 Granular Base, Soil Agg. Mix. 14 1 Well Graded Sand 10
Hot Mix Asphalt Mixtures: Equivalent Annual Modulus of HMA: 450 Type of Asphalt: PG58-340 HMA HMA Asphalt Content, % Air Voids, % Gradation; percent passing: #3/4 #3/8 #4 #40 #200 HMA HMA Tensile Strain at Bottom of HMA Layer: Total Amount of Fatigue Cracking: Year Alligator Block Long. Transverse Year Alligator Block Long. Transverse 1998 0 0 0 0 2000 0 0 0 0 2002 0 0 0 0 2004 0 0 0 0

181
LTPP Site Identification Number: C960 State: Wisconsin (55) Roadway or Route No.: US 29 Date of Construction: Nov. 1996 Status: In Service Location: Longitude: 89.29 Latitude: 44.87 Elevation: 1239 Pavement Cross Section:
Layer Material Type Thickness, inches 5 HMA Hot Mixed, Hot Laid AC, Dense Graded 1.9 4 HMA Hot Mixed, Hot Laid AC, Dense Graded 6.4 3 GB Crushed Stone Base; A-1-a (303) 13.0 2 GS Embankment; Coarse-Fine soil; A-3 (210) 5.0 1 Subgrade Soil Silty Sand; A-1-b (214) ---
Traffic Data: Number of Years with Data: 4 AADTT (One-way): 260 Year: 1997 KESALS per year: Unbound Layers Resilient Modulus: Layer Material/Soil Type Equivalent Resilient Modulus, ksi
2 Granular Base, Soil Agg. Mix. 14 1 Silty Sand 10
Hot Mix Asphalt Mixtures: Equivalent Annual Modulus of HMA: 450 Type of Asphalt: PG58-340 HMA HMA Asphalt Content, % Air Voids, % Gradation; percent passing: #3/4 #3/8 #4 #40 #200 HMA HMA Tensile Strain at Bottom of HMA Layer: Total Amount of Fatigue Cracking: Year Alligator Block Long. Transverse Year Alligator Block Long. Transverse 1998 0 0 0 0 2000 52.4 0 0 0 2004 262.6 0 0 0