ncusif and tccusfncusif and tccusf statistics · $12.0 $3.9 $12 $3.9 56 $10m-$100m - dec-10 132 127...
TRANSCRIPT

NCUSIF and TCCUSFNCUSIF and TCCUSFNCUSIF and TCCUSFNCUSIF and TCCUSFStatisticsStatistics
JANUARY 31, 2011JANUARY 31, 2011(Preliminary/Unaudited)(Preliminary/Unaudited)
Mary Ann WoodsonMary Ann WoodsonChief Financial OfficerChief Financial OfficerNational Credit Union AdministrationNational Credit Union Administration

AGENDAAGENDA
I NCUSIFI. NCUSIF
II TCCUSFII. TCCUSF
2/16/2011 2

NCUSIFREVENUE AND EXPENSE
January 31 2011January 31, 2011(Preliminary & Unaudited)
(In Millions)
AnnualActual Budgeted Budget
Januaryg g
Gross Income: Investment Income 19.4 19.1 229.2 Other Income 0.0 0.0 0.3L ELess Expenses: Operating Expense 8.0 11.6 138.9 Insurance Loss Expense 0.0 54.2 650.0Net Income (Loss) 11 4 (46 7) (559 4)
2/16/2011 3Preliminary & subject to change
Net Income (Loss) 11.4 (46.7) (559.4)
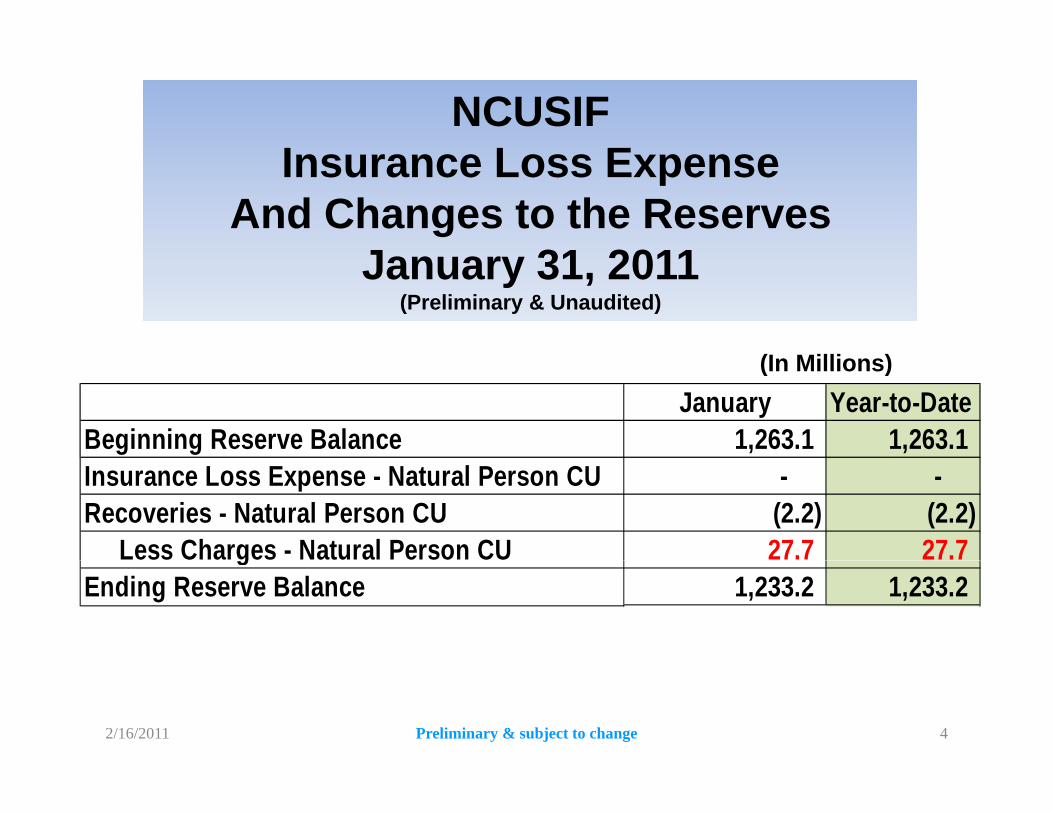
NCUSIFI L EInsurance Loss Expense
And Changes to the ReservesJ 31 2011January 31, 2011
(Preliminary & Unaudited)
(I Milli )(In Millions)January Year-to-Date
Beginning Reserve Balance 1,263.1 1,263.1 Insurance Loss Expense - Natural Person CU - - Recoveries - Natural Person CU (2.2) (2.2) Less Charges - Natural Person CU 27.7 27.7 gEnding Reserve Balance 1,233.2 1,233.2
2/16/2011 4Preliminary & subject to change

TREASURY YIELD CURVE
5 56.0
Percent
4 04.55.05.5
JANUARY 31, 2011JANUARY 31, 2011
2 53.03.54.0
JANUARY 31, 2010JANUARY 31, 2010
1 01.52.02.5
0 50.00.51.0
DECEMBER 31, 2010DECEMBER 31, 2010
-0.51 DAY 3 MO 6 MO 1 YR 2 YR 3 YR 5 YR 10 YR 30 YR
2/16/2011 5

YIELD COMPARISONSJANUARY 31 2011JANUARY 31, 2011
8.0Percent
6.0
7.0
3 0
4.0
5.0 4.58%4.58%
1.0
2.0
3.02.14%2.14%
0.0
1.0
Jan09 Apr09 Jul09 Oct09 Jan10 Apr10 Jul10 Oct10 Jan11
30 Y B d NCUSIF Yi ld 90 D T Bill
0.15%0.15%
30-Year Bond NCUSIF Yield 90-Day T- Bill
2/16/2011 6

1/31/2011 SIF Portfolio
Investment Balance: $10.365 Billion Weighted Average Life: 2.99 years
%
Maturity Schedule:
Weighted Average Yield: 2.14%
1 9702,500
nt
845600
800
1,600 1,600 1,7001,970
250 250 250 250 250500
1,000
1,500
2,000
Maturing Investmen
Balance (M
illions)
Overnight 1m‐6m 6m‐1yr 1yr‐2yr 2yr‐3yr 3yr‐4yr 4yr‐5yr 5yr‐6yr 6yr‐7yr 7yr‐8yr 8yr‐9yr 9yr‐10yr
M
68.93%
87.94% 90.35% 92.76% 95.18% 97.59% 100.00%
80%
100%
olio
8.15% 13.94%21.66%
37.10%52.53%
0%
20%
40%
60%
Overnight 1m‐6m 6m‐1yr 1yr‐2yr 2yr‐3yr 3yr‐4yr 4yr‐5yr 5yr‐6yr 6yr‐7yr 7yr‐8yr 8yr‐9yr 9yr‐10yrCumulative Po
rtfo
Percen
tage
7
Source: 1/31/2011 TAXLOT Report
g y y y y y y y y y y y y y y y y y y y

NCUSIF Equity Ratioq y1.26%1.26%1.26% 1.26%
1 26%
1.29%1.29%1.28% 1.28%
1.26%1.24%1.21%1.20%
1.18%1.18%
Capitalization deposit to be collected based on bi annual
8
Capitalization deposit to be collected based on bi-annual insured share adjustment
2/16/2011
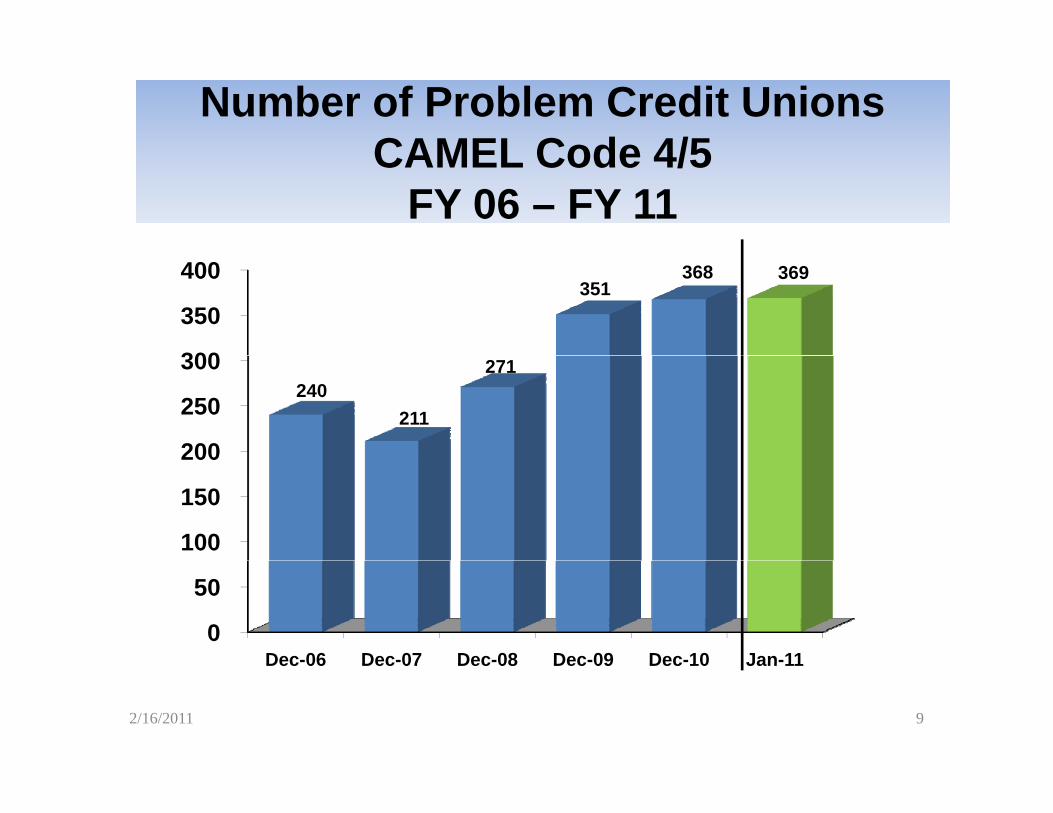
Number of Problem Credit Unions CAMEL Code 4/5CAMEL Code 4/5
FY 06 – FY 11
300
350
400 351
368 369
200
250
300 240
211
271
100
150
200
0
50
Dec-06 Dec-07 Dec-08 Dec-09 Dec-10 Jan-11Dec 06 Dec 07 Dec 08 Dec 09 Dec 10 Jan 11
2/16/2011 9

Percent of CAMEL Code 4/5Shares to Total Insured Shares
Percent
Shares to Total Insured SharesFY 06 – FY 11
6.00
7.005.72
5.08 5 00
4.00
5.005.00
2.00
3.00
1 00 1 04
2.70
0.00
1.00
Dec 06 Dec 07 Dec 08 Dec 09 Dec 10 Jan 11
1.00 1.04
Dec-06 Dec-07 Dec-08 Dec-09 Dec-10 Jan-11
2/16/2011 10

CAMEL Code 4&5 ComparisonDecember 31, 2010 to January 31, 2011
CU Si b
>$1B $17.7$17.6
CU Size byTotal Assets
1010
$3 9
1010
$100M $500M
$500M-$1B
Jan-11
6666
$12.0
$3.9
$12
$3.9
5656
$10M-$100M
$100M-$500M Dec-10
132132127127 $4.2
$12.5
$4.3
5757
January 31, 2011 December 31, 2010
< $10M 163163 $0.4$0.4170170
y , ,Total Shares: $38.2 Billion $38.9 Billion Total Assets: $42.9 Billion $43.8 Billion
Total Shares in Billions$10 $15 $20$5 $30$25
2/16/2011 11
$0
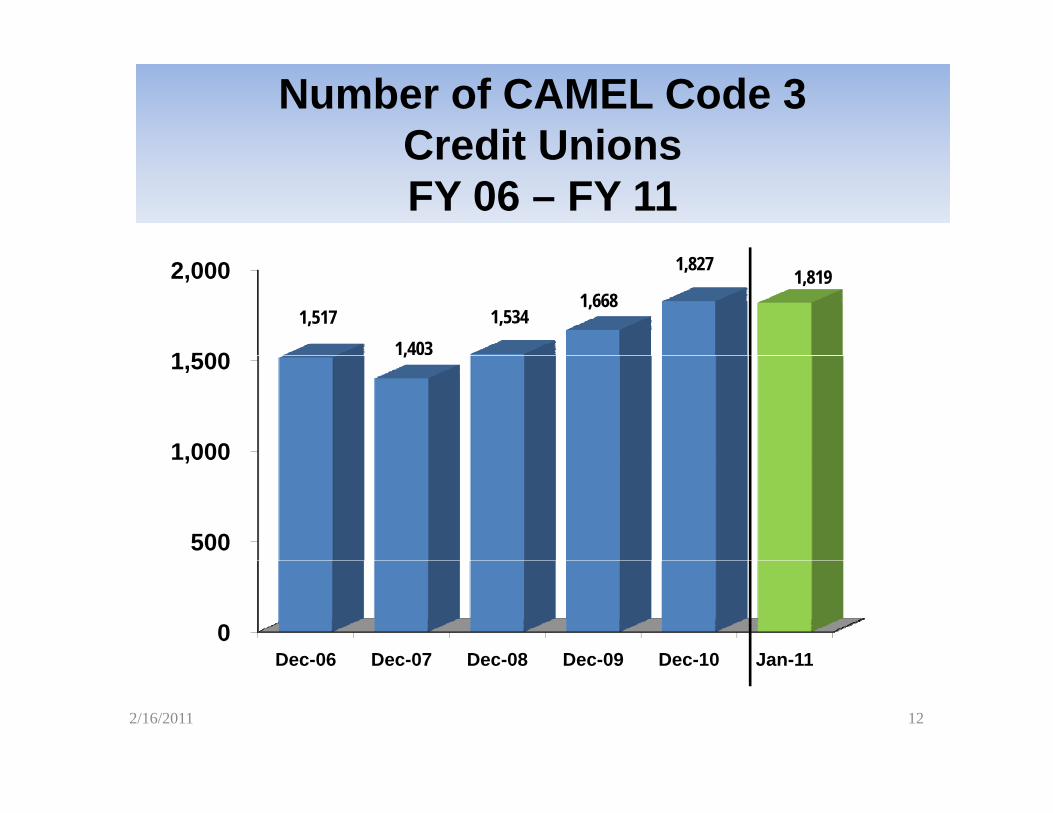
Number of CAMEL Code 3 Credit UnionsCredit Unions FY 06 – FY 11
1 500
2,000
1,5171,403
1,5341,668
1,8271,819
1,000
1,500 ,
500
1,000
0 Dec-06 Dec-07 Dec-08 Dec-09 Dec-10 Jan-11Dec 06 Dec 07 Dec 08 Dec 09 Dec 10 Jan 11
2/16/2011 12

Percent of CAMEL Code 3 Shares to Total Insured Shares
Percent
to Total Insured SharesFY 06 – FY 11
15 00
20.00 18.10 17.80
10 00
15.00
11.10
13.67
5.00
10.00
6.18 6.20
0.00Dec 06 Dec 07 Dec 08 Dec 09 Dec 10 Jan 11Dec-06 Dec-07 Dec-08 Dec-09 Dec-10 Jan-11
2/16/2011 13

CAMEL Code 3 ComparisonDecember 31, 2010 to January 31, 2011
$59 423CU Size by
Total Assets
$500M‐$1B
> $1B
$20 0
$59.6
$19.2
$59.42323
3233
Total Assets
$100M‐$500M
$500M $1B
$34.3
$20.0
$33.4Jan‐11
D 10
33
180185
$10M‐$100M $21.8
$2 7
$21.7Dec‐10
January 31, 2011 December 31, 2010Total Shares: $136 5 Billion $138 4 Billion
711712
873
$0 $10 $20 $30 $40 $50 $60 $70 $80
< $10M $2.7$2.7 Total Shares: $136.5 Billion $138.4 Billion
Total Assets: $154.5 Billion $156.7 Billion873874
Total Shares in Billions2/16/2011 14

Distribution of Assets in CAMEL C dCodes
0.97% 0.89% 0.87%
2 43%
93.86%
93.64%
93.68%
5.17%5.47%
5.44%9.90%
12.92% 12.94%13.24%
13.16% 13.68% 13.58%16.28% 16.60%17.62% 17.73% 17.73% 17.51% 17.34% 17.10%
2.43%
5.44% 5.38% 5.38% 5.35% 5.57% 5.75% 5.30% 5.04% 4.95% 5.01% 4.91% 4.80% 4.84% 4.75%
87.67%
81.64% 81.68% 81.37% 81.49% 80.75%80.68%
78.42% 78.36%77.43%
77.26% 77.36% 77.69% 77.82%78.15%78.15%
Dec‐05 Dec‐06 Dec‐07 Dec‐08 Dec‐09 Jan‐10 Feb‐10 Mar‐10 Apr‐10 May‐10 Jun‐10 Jul‐10 Aug‐10 Sep‐10 Oct‐10 Nov‐10 Dec‐10 Jan‐11
CAMEL 4‐5 CAMEL 3 CAMEL 1‐2
152/16/2011

Number of Credit Union FailuresFY 02 – FY 11
60
40
28 28
20 15 13
2115 16
1218
0 02 03 04 05 06 07 08 09 10 11
0
02 03 04 05 06 07 08 09 10 11
2/16/2011 16JanDec

TEMPORARY CORPORATE CREDIT UNION STABILIZATION FUND
PRELIMINARY & UNAUDITED BALANCE SHEETPRELIMINARY & UNAUDITED BALANCE SHEETJanuary 31, 2011
ASSETS Jan 2011 Dec 2010INTRAGOVERNMENTALFund Balance with Treasury 500 007$ 500 080$Fund Balance with Treasury 500,007$ 500,080$ Investments in U.S. Treasury Securities, Net 371,903,000 372,210,913 Amount Due from NCUSIF 258,214 257,077
Total Intragovernmental Assets 372,661,221 372,968,070 PUBLICAccounts Receivable Due from AMEs 4,479,636 - Accounts Receivable Due from NGN Guarantee - 3,196,603 Accounts Receivable Due from TCCULGP - 623,520 Premium Assessment Receivable 583 1,720
Total Public Assets 4,480,219 3,821,844 TOTAL ASSETS 377,141,440$ 376,789,913$
LIABILITIESPUBLICAccounts Payable -$ 852,547$ Reserve for TCCUSGP 6,365,500,000 6,365,500,000
Total Public Liabilities 6,365,500,000 6,366,352,547 TOTAL LIABILITIES 6,365,500,000 6,366,352,547
NET POSITIONCumulative Result of Operations (5,988,358,560) (5,989,562,634)
Total Net Position (5,988,358,560) (5,989,562,634)
2/16/2011 17Preliminary & subject to change
TOTAL LIABILITIES AND NET POSITION 377,141,440$ 376,789,913$

TEMPORARY CORPORATE CREDIT UNION STABILIZATION FUND
STATEMENT OF NET COST January 31, 2011
(Preliminary & Unaudited)
Jan 2011 Dec 2010 CY to Date 2011Jan 2011 Dec 2010 CY to Date 2011
GROSS COSTSInterest Expense on Borrowings -$ 863,014$ -$ Operating Expense 544,786 1,767,420 544,786 p g p , , , ,
Total Gross Costs 544,786 2,630,434 544,786
LESS EARNED REVENUES Special Premium Assessment - 10,341 - Fee Revenue - TCCULGP - 623,520 - Interest Revenue - On Loan - 863,014 - Interest Revenue - Investments 41,746 23,261 41,746 Guaranty Fee Revenue - NGNs 1,707,114 7,889,037 1,707,114
Total Earned Revenues 1,748,860 9,409,173 1,748,860
TOTAL NET COST OF OPERATIONS (1,204,074)$ (6,778,739)$ (1,204,074)$
2/16/2011 18Preliminary & subject to change

This presentation is availableThis presentation is availableto the public at:to the public at:to the public at:to the public at:www.ncua.govCredit Union DataCredit Union DataBy clickingBy clicking
NCUSIF InformationNCUSIF InformationNCUSIF StatementsNCUSIF Statements
Then clickingThen clicking
Then clickingThen clicking
2/16/2011 19