near-source observations and modeling of the kuril … · near-source observations and modeling of...
TRANSCRIPT

Adv. Geosci., 14, 105–116, 2008www.adv-geosci.net/14/105/2008/© Author(s) 2008. This work is licensedunder a Creative Commons License.
Advances inGeosciences
Near-source observations and modeling of the Kuril Islandstsunamis of 15 November 2006 and 13 January 2007
A. B. Rabinovich1,2, L. I. Lobkovsky 1, I. V. Fine2, R. E. Thomson2, T. N. Ivelskaya3, and E. A. Kulikov 1
1Russian Academy of Sciences, P.P. Shirshov Institute of Oceanology, 36 Nakhimovsky Pr., Moscow, 117997, Russia2Department of Fisheries and Oceans, Institute of Ocean Sciences, 9860 W. Saanich Rd., Sidney, B.C., V8L 4B2, Canada3Federal Service for Hydrometeorology and Environment Monitoring, Sakhalin Tsunami Warning Center, 78 Zapadnaya Str.,Yuzhno-Sakhalinsk, 693000, Russia
Received: 2 November 2007 – Revised: 21 November 2007 – Accepted: 21 November 2007 – Published: 2 January 2008
Abstract. Two major earthquakes near the Central KurilIslands (Mw=8.3 on 15 November 2006 andMw=8.1 on13 January 2007) generated trans-oceanic tsunamis recordedover the entire Pacific Ocean. The strongest oscillations,exceeding several meters, occurred near the source regionof the Kuril Islands. Tide gauge records for both tsunamishave been thoroughly examined and numerical models ofthe events have been constructed. The models of the 2006and 2007 events include two important advancements in thesimulation of seismically generated tsunamis: (a) the use ofthe finite failure source models by Ji (2006, 2007) whichprovide more detailed information than conventional mod-els on spatial displacements in the source areas and whichavoid uncertainties in source extent; and (b) the use of thethree-dimensional Laplace equation to reconstruct the initialtsunami sea surface elevation (avoiding the usual shallow-water approximation). The close agreement of our simulatedresults with the observed tsunami waveforms at the open-ocean DART stations support the validity of this approach.Observational and model findings reveal that energy fluxesof the tsunami waves from the source areas were mainly di-rected southeastward toward the Hawaiian Islands, with rel-atively little energy propagation into the Sea of Okhotsk. Amarked feature of both tsunamis was their high-frequencycontent, with typical wave periods ranging from 2–3 to 15–20 min. Despite certain similarities, the two tsunamis wereessentially different and had opposite polarity: the leadingwave of the November 2006 trans-oceanic tsunami was pos-itive, while that for the January 2007 trans-oceanic tsunamiwas negative. Numerical modeling of both tsunamis indi-cates that, due to differences in their seismic source proper-ties, the 2006 tsunami was more wide-spread but less focusedthan the 2007 tsunami.
Correspondence to:A. B. Rabinovich([email protected])
1 Introduction
Following the catastrophic 2004 Sumatra earthquake andglobal tsunami, seismic zones around the Pacific Ocean werethoroughly examined based on the seismic-gap theory (Mc-Cann et al., 1979). The Central Kuril seismic gap of about400 km length which last experienced a major earthquakein 1780 (Lobkovsky, 2005; Laverov et al., 2006a) was de-fined as the zone of highest risk for a catastrophic event. Toexplore this seismic zone, detailed marine geophysical ex-peditions were conducted by the Russian Academy of Sci-ences on the R/V “Akademik Lavrentiev” in 2005 and 2006(Laverov et al., 2006b). The main purpose of these expe-ditions was to examine the tectonic structure of the seismicgap, identify cross-shelf fault zones, and estimate possiblesource areas of the next expected earthquake. Based on theestimated seismic gap zone and preliminary results of theseexpeditions, numerical modeling of several scenarios involv-ing possible major tsunamis was undertaken (Lobkovsky andKulikov, 2006; Lobkovsky et al., 2006). The area of primaryconcern was the northeastern shelf of Sakhalin Island in theSea of Okhotsk, which is the principal region of the oil andgas industry in the Russian Far East. For the worst-case sce-nario, the expected wave heights were more than 16 m forthe coast of the Central Kuril Islands and more than 5 m forthe coast of Sakhalin.
The Mw=8.3 (USGS) earthquake of 15 November 2006occurred on the continental slope of the Central Kuril Islandsapproximately 90 km offshore from Simushir Island (Fig. 1);i.e., very close to the expected source region. The earthquakewas a thrust fault type that occurred at the inter plate bound-ary (cf. Fujii and Satake, 2007). Parameters of the earthquakeare: T0=11:14:13.6 UTC; ϕ=46.592◦ N; λ=153.266◦ E;h=26–30 km; Mb=6.6; Ms=8.3; andM0=3.37×10²¹ N m(Global CMT, 2006), whereT0 is the earthquake time(hour:min:sec),ϕ is the latitude,λ is the longitude,h is thedepth of the earthquake hypocenter, andM0 is the seismic
Published by Copernicus Publications on behalf of the European Geosciences Union.

106 A. B. Rabinovich et al.: Near-source observations and modeling of the Kuril Islands tsunamis
Tide gauge
Russian
Japanese
M =8.3
M =8.1
w
w
Magadan
Starodubsk
Kholmsk
Hachinohe
Hanasaki
TokachikoKushiro
Urakawa
Petropavlovsk-Kamchatsky
140° 145° 150° 155° 160° 165°E
40°
60°N
M =8.3
M =8.1
Hanasaki
Tokachiko
Starodubsk
Kholmsk
Magadan
Petropavlovsk-Kamchatsky
Pacific Ocean
Seaof
Okhotsk
Kamchatka
Sak
hal
in
Kuril Isl
ands
Kushiro
Urakawa
Hachinohe
WakkanaiWakkanai Urup I. Simushir I.
Busso
l Str.
Kru
zenste
rna S
tr.
45°
50°
55°
Kuriles-Figure 1.
1
1
2
2
3
4
5
Malokurilsk
Yuzhno-Kurilsk
Malokurilsk
Yuzhno-Kurilsk
w
w
Shikotan I.
Kunashir I.Ituru
p I.
Paramushir I.
LaPerouse
Str.
Fig. 1. Map of the northwestern Pacific showing epicenters(stars) of the 15 November 2006 (Mw=8.3) and 13 January 2007(Mw=8.1) Kuril Islands earthquakes and locations of tide gaugeson the coasts of the Russian Far East and northern Japan. Solid anddashed curved lines denote the 30-min isochrones of tsunami traveltime from the 2006 source area.
moment. The earthquake generated a trans-Pacific tsunamithat appears to have been the strongest since the 1964 Alaskatsunami 42.5 years ago. Parameters of the observed tsunamiare similar to those predicted, except that the northeasterncoast of Sakhalin Island was mainly sheltered from destruc-tive waves by the Simushir coast. Marked tsunami signalswere identified in records from the Kuril Islands, Japan,Alaska, Canada, Peru, New Zealand and a number of tropicalPacific islands. Wave heights exceeding 1 m were recordedon the coasts of the Hawaiian Islands, Oregon, Californiaand Mexico. Significant damage took place in the port ofCrescent City (California) located roughly 6600 km from thesource. The maximum wave recorded at this site was 177 cm(Kowalik et al., 2008). The tsunami was also recordedby a number of Deep ocean Assessment and Reporting ofTsunamis (DART) bottom pressure stations operated by theNational Oceanic and Atmospheric Administration (NOAA),USA, and by deep ocean cable stations operated by the JapanAgency for Marine Earth Science and Technology (JAM-STEC) (cf. Fujii and Satake, 2007).
On 13 January 2007, a second earthquake of comparablemagnitude (Mw=8.1; USGS) to the November 2006 earth-quake occurred in the same region but with a source lo-cated on the oceanic slope of the Kuril-Kamchatka Trench,
about 100 km southeastward of the site of the earlier earth-quake (Fig. 1). The 2007 earthquake was a normal faultevent that took place at the interior portion of the subduct-ing plate (cf. Fujii and Satake, 2007). The main parametersof the earthquake are:T0=04:23:21.2 UTC;ϕ=46.243◦ N;λ=154.524◦ E; h=10 km; andM0=1.65×10²¹ N m (GlobalCMT, 2007). Although less energetic than the 2006 tsunami,the 2007 tsunami was also clearly recorded at many sites inthe Pacific Ocean, including the Kuril, Aleutian, and Hawai-ian islands, Japan, Alaska, California, Peru and Chile. De-spite the close proximity of the two source areas and theirdegree of similarity, the two tsunamis were essentially differ-ent due to differences in their respective seismic sources andsign of the first seaward propagating wave: positive for theNovember 2006 tsunami and negative for the January 2007tsunami.
Both tsunamis were examined in detail using coastal tidegauges and bottom-pressure open-ocean stations. Numericalmodels were constructed for the local near-source area andfor the entire Pacific Ocean. Simulated tsunami waves werefound to agree closely with waves recorded at offshore islandand deep-ocean DART sites; the energy flux of the waveswas mainly directed southeastward toward the Hawaiian Is-lands and Chile. The present study focuses on the characterof tsunami waves near the source region of the Russian FarEast and northern Japan. Examination of the far-field char-acteristics of the 2006 and 2007 tsunamis is a subject of anindependent paper now in preparation.
2 Observations of the 15 November 2006 Tsunami
The 15 November 2006 (11:14 UTC) earthquake that oc-curred offshore of Simushir Island (Central Kuriles, NW Pa-cific) generated a trans-oceanic tsunami. Waves recordedaround the Pacific Ocean revealed the wide-spread reach ofthe 2006 tsunami. Especially high waves were identified inrecords of near-field stations in Russia and northern Japan(locations of the stations are shown in Fig. 1). Unfortunately,the Russian tide gauge network is still under reconstruc-tion. In the near-source region of the Central Kuril Islands,there are presently no working tide gauges and most of exist-ing tide gauges located more than 500 km from the source(Fig. 1) are archaic “pen-and-paper” analog instruments.Nevertheless, significant tsunami waves were identified inrecords from Malokurilsk, Yuzhno-Kurilsk, Petropavlovsk-Kamchatsky, Magadan, Starodubsk, and Kholmsk. The qual-ity of these records and the signal-to-noise ratio for most ofthe tide gauges are relatively good.
The analog records were digitized at an interval of 5 minand examined using the data analysis procedure for the2004 Sumatra tsunami records presented by Rabinovich etal. (2006) and Rabinovich and Thomson (2007). De-tidedrecords from five stations (except Starodubsk which was toonoisy) are shown in Fig. 2. These records were used to
Adv. Geosci., 14, 105–116, 2008 www.adv-geosci.net/14/105/2008/

A. B. Rabinovich et al.: Near-source observations and modeling of the Kuril Islands tsunamis 107
Table 1. Statistical characteristics of the 15 November 2006 Kuril Islands tsunami estimated from tide gauge records from Russian andJapanese stations near the source region.
Station Coordinates Sampling (min) First wave Maximum wave
Latitude Longitude Arrival time Travel time Sign Observed height Arrival time(◦ N) (◦ E) (UTC) (h:min) (cm) (UTC)
Magadan 59.52 150.80 5.0* 16:55 5:41 – 63 18:03Petropavlovsk 52.98 158.65 5.0* 12:52 1:38 + 11 19:20Starodubsk 47.42 142.85 5.0* ? ? ? 25 19:40Kholmsk 47.05 142.05 5.0* 15:50 4:36 – 24 18:00Yuzhno-Kurilsk 44.02 145.87 5.0* 13:12 1:58 + 55 15:05Malokurilsk 43.85 146.60 5.0* 12:22 1:08 + 155 16:10Wakkanai 45.42 141.68 0.25 14:36 3:22 + 31.1 19:50Abashiri 44.02 144.28 0.25 13:05 1:51 + 47.6 14:21Hanasaki 43.28 145.57 0.25 12:30 1:16 + 72.6 15:29Kushiro 42.97 144.38 0.25 12:40 1:26 + 52.7 16:07Tokachiko 42.30 143.32 1.0 12:51 1:37 + 73.3 18:58Urakawa 42.17 142.78 1.0 13:33 2:19 +? 118.2 18:47Hachinohe 40.53 141.53 0.25 13:12 1:58 + 106.3 18:01
∗ Analog digitized records from float-type tide gauges.
estimate the principal statistical parameters of the observedtsunami waves (Table 1). Due to a technical problem, therewas a∼4.5-hour gap in the record of Malokurilsk, the sitewhere the strongest oscillations were observed (Fig. 2). Thisprevented us from estimating exact statistical parameters fortsunami waves at this site. However, the general structureof the tsunami, in particular, the tsunami arrival times, werewell defined (Table 1).
Tsunami waves first arrived at Malokurilsk (Shikotan Is-land, Southern Kuril Islands) at 12:22 (UTC), 1 h 8 min afterthe main earthquake shock. The first wave at this tide gauge,as well as at the most of the other gauges indicated in Fig. 1(except Magadan), was positive (wave crest). However, themaximum wave at Malokurilsk occurred approximately fourhours after the first wave arrival (Table 1). This wave, withtrough-to-crest value of 155 cm, was the highest instrumen-tally recorded in the near-field zone and the second highestat all sites after the 177 cm wave at Crescent City, California.In fact, it is possible that even higher oscillations occurred atthis site: a 137-cm wave was observed at 19:40 (UTC), about8.5 h after the main shock, indicating the arrival of a newtrain of high waves (Fig. 2). Unfortunately, the instrumenthad stopped working for four hours and missed the passageof these waves.
The record at Malokurilsk is distinct in that the oscilla-tions were highly regular and monochromatic with a domi-nant period of about 18.6 min. Background oscillations withthis specific period are very common at this site (cf. Dju-magaliev and Rabinovich, 1993; Rabinovich and Monserrat,1998). The tide gauge of Malokurilsk is located on the north-western coast of a bottle-shaped bay with a narrow neck. Ra-binovich and Leviant (1992) and Djumagaliev et al. (1994)
00 06181206
10
0 c
m
Time (hours, days)
E
Re
lative
se
a le
ve
l
Malokurilsk
Yuzhno-Kurilsk
Petropavlovsk-Kamchatsky
Kholmsk
Magadan
15 Nov 16 Nov
TAT
Kuril Islands Earthquake (M = 8.3)of 15 November 2006
Tsunami
Russian stations
w
Kuriles-Figure 2.Fig. 2. Tsunami records for the November 2006 tsunami for fiveanalog tide gauges on the Russian Far East coast. Small arrowsindicate Tsunami Arrival Times (TAT). Solid vertical line labelled“E” denotes the time of the main earthquake shock (Mw=8.3).
www.adv-geosci.net/14/105/2008/ Adv. Geosci., 14, 105–116, 2008

108 A. B. Rabinovich et al.: Near-source observations and modeling of the Kuril Islands tsunamis5
0 c
m
Hanasaki
Wakkanai
Abashiri
Kushiro
Tokachiko
Urakawa
Hachinohe
00 12181206
Time (hours, days)15 Nov 16 Nov
06
ETAT
Kuril Islands Earthquake (M = 8.3)of 15 November 2006
Tsunami
Japanese stations
w
Kuriles-Figure 3.
Re
lative
se
a le
ve
l
Fig. 3. The same as in Fig. 2 but for seven digital tide gauges locatedon the coasts of Hokkaido Island and northeastern Honshu Island(Japan).
examined the eigen properties of this bay and demonstratedthat 18.6-min oscillations are associated with the fundamen-tal (Helmholtz) mode of the bay. The strong tsunami oscil-lations of 15 November 2006 observed at Malokurilsk areapparently related to specific resonant effects and to the highQ-factor of the bay (Q∼=12 in Malokurilsk Bay according tocomputations by Djumagaliev et al., 1994).
Tsunami oscillations at other Russian sites were muchweaker and less regular than at Malokurilsk. Tsunami Ar-rival Times (TAT) were in good agreement with calculatedExpected Tsunami Arrival times (ETA) (Fig. 1). Tsunamiwaves arrived at Petropavlovsk-Kamchatsky (KamchatkaPeninsula) located northeastward from the source area within1 h 38 min of the main shock and at Yuzhno-Kurilsk (Ku-nashir Island, Southern Kuril Islands) located southwestwardfrom the source within 1 h 58 min (∼50 min later than at Mal-okurilsk) of the main shock. The tsunami penetrated intothe Sea of Okhotsk and was recorded at Starodubsk on thesoutheastern coast of Sakhalin Island and at Magadan on
the northwestern coast of the Sea of Okhotsk. (The exactTAT at Starodubsk was difficult to delineate due to the highbackground noise level.) Once through La Perouse Strait(Soya Strait), the waves propagated into the Sea of Japanand, 4 h 36 min after the main earthquake, were recordedat Kholmsk on the southwestern coast of Sakhalin Island.Observed tsunami wave periods at the various sites weremarkedly different, ranging from 18 min at Malokurilsk to1 h at Magadan (Fig. 2), demonstrating that these periods aremainly determined by local topographic properties of the re-spective sites, rather than by the source characteristics (cf.Rabinovich, 1997).
The tsunami tide gauge data for Japanese sites for both the15 November 2006 and 13 January 2007 tsunamis were pro-vided by the Japan Meteorological Agency (JMA) and theWest Coast/Alaska Tsunami Warning Center (WC/ATWC).All data were from digital tide gauges with sampling inter-vals of 15 s or 1 min (Table 1). The tsunami waves wereclearly recorded at stations on the coasts of Hokkaido andnortheastern Honshu (Fig. 3). The waves arrived at sta-tions on the Pacific coast over the period from 12:30 UTC(Hanasaki) to 13:33 UTC (Urakawa); i.e. from 1 h 16 min to2 h 19 min after the earthquake. At 13:05 UTC (1 h 51 minafter the main earthquake) the first tsunami wave arrived atAbashiri on the northern (Sea of Okhotsk) coast of HokkaidoIsland and approximately 1 h 30 min later (14:36 UTC) atWakkanai, on La Perouse (Soya) Strait (Fig. 1). The high-est waves were recorded at Urakawa (118.2 cm) and Hachi-nohe (106.3 cm). We note that these maximum waves oc-curred a considerable time (∼5 h) after the first wave arrivals.Tanioka et al. (2008) attribute the late arrivals of maximumwaves to influence of the Emperor Ridge. According to theseauthors, the maximum observed oscillations constitute “sec-ondary” tsunami waves reflected from the Emperor Ridge.Kowalik et al. (2008) also suggest that the Emperor Ridge,Koko Guyot and the Hess Ridge in the northwestern Pacificplayed a primary role in reflection of the 2006 tsunami andsubsequent formation of new sets of high amplitude waves.Close agreement of the arrival times of the maximum wavesat Tokachiko, Urakawa and Hachinohe (Table 1) supports theabove suggestions.
A marked feature of tsunami waves observed on the coastof Hokkaido and the northeastern coast of Honshu is theirhigh-frequency content, with typical wave periods rangingfrom 3–5 to 20–25 min (Fig. 3). Equally important is thepositive sign of the first wave (Table 1, Fig. 3) which supportsthe proposition (e.g., Tanioka et al., 2008) that theMw=8.3,2006 Kuril Islands earthquake was a thrust fault event.
3 Observations of the 13 January 2007 Tsunami
The slightly weaker (Mw=8.1) earthquake of 13 January2007 occurred in close vicinity to the source area of the 2006earthquake but with its epicenter on the oceanic slope of the
Adv. Geosci., 14, 105–116, 2008 www.adv-geosci.net/14/105/2008/

A. B. Rabinovich et al.: Near-source observations and modeling of the Kuril Islands tsunamis 109
Kuril-Kamchatka Trench (Fig. 1). As with the November2006 event, the 2007 earthquake generated a trans-Pacifictsunami that was clearly recorded far from the source areain New Zealand, southern Chile and Easter Island. How-ever, hazardous impact of the 2007 tsunami at remote sitessuch as Crescent City was highly tempered compared to the2006 event due to its reduced energy (the typical ratio of2006/2007 far-field wave heights is 3:1). Nevertheless, theimpact of the 2007 tsunami at some islands of the North-western Pacific was quite significant. According to our anal-ysis, maximum observed wave heights were 83 cm at Chichi-jima Island, Japan, 71 cm at Miyakeshima Island, Japan, and69 cm at Shemya Island, Aleutian Islands, USA.
The 2007 tsunami went undetected in records from Rus-sian analog tide gauges at Petropavlovsk, Starodubsk, Ma-gadan and Kholmsk due to low signal-to-noise ratios butwas clearly detected by gauges at Yuzhno-Kurilsk and Mal-okurilsk. Tsunami waves at Malokurilsk were significant butpoorly recorded because of problems with the ink which leadto gaps in the record. Nevertheless, we were able to digi-tize the record at a time interval of 1 min (Fig. 4, Table 2).In addition, the Institute of Marine Geology and Geophysics(IMGG), Yuzhno-Sakhalinsk, in December 2006 (soon afterthe first event), deployed two digital bottom pressure gaugeswith sampling intervals of 1 min in Malokurilsk Bay andKrabovaya Bay (both on the northern coast of Shikotan Is-land, Southern Kuriles). On 13 January the two gauges accu-rately recorded tsunami waves (Grigory Bogdanov, IMGG,personal communication, 2007); these records are also usedfor analysis.
The 2007 tsunami waves entered Malokurilsk Bay at 05:32UTC (Table 2) and were recorded by two tide gauges almostsimultaneously (the analog tide gauge at Malokurilsk is lo-cated on the northwestern side of the bay; the digital bottompressure station is located near the eastern side of the bayabout 1 km from the first gauge). The tsunami travel timewas 1 h 9 min, which is only 1 min longer than the traveltime to this site for the 2006 tsunami. Maximum recordedwaves were 72 cm at the tide gauge and 57.7 cm at the bot-tom pressure gauge. As with the 2006 tsunami, tsunamiwaves recorded in Malokurilsk Bay in 2007 were regularand monochromatic with a dominant period of 18.6 min (atboth gauges). Nine minutes later tsunami waves arrived atthe bottom pressure gauge in Krabovaya Bay located about8 km from Malokurilsk Bay. Recorded oscillations were alsoregular and monochromatic with peak period of 29.5 min,which is the period of the fundamental (Helmholtz) modefor this bay (Djumagaliev and Rabinovich, 1993; Rabinovichand Monserrat, 1998). Maximum observed waves at Krabo-vaya Bay were 41.9 cm, which considerably smaller than inMalokurilsk Bay. This difference is probably related to dif-ferences in the fundamental periods of the two bays: the res-onant period of 18.6 min in Malokurilsk Bay was apparentlymuch more closely tuned to the characteristic periods of the2007 tsunami source.
181206
40 c
m
Time (hours, days)
Re
lative
se
a le
ve
l
Malokurilsk TG
13 Jan00
Malokurilsk Bay
Krabovaya Bay
E TAT
Kuril Islands Earthquake (M = 8.1)of 13 January 2007
Tsunami
Russian stations
w
Kuriles-Figure 4.
Yuzhno-Kurilsk TG
Fig. 4. Tsunami records for the January 2007 tsunami for coastaltide gauges at Yuzhno-Kurilsk (Kunashir Island) and Malokurilsk(Shikotan Island), and at two bottom pressure stations located inMalokurilsk and Krabovaya bays (Shikotan Island). Small arrowsindicate Tsunami Arrival Times (TAT). Solid vertical line labelled“E” denotes the time of the main earthquake shock (Mw=8.1).
The tsunami waves at Yuzhno-Kurilsk were weak, withmaximum recorded waves of only about 11 cm. We digitizedthis record with a 5-min step (Fig. 4) and estimated statisticalparameters from the resulting time series. The tsunami wavesarrived at Yuzhno-Kurilsk (Kunashir Island) at 06:12 UTC,1 h 49 min after the main 2007 shock and 40 min after arrivalat Malokurilsk Bay. This travel time is in good agreementwith the 2006 tsunami travel time at this site (1 h 58 min). Incontrast to the observed tsunami waves in Malokurilsk andKrabovaya bays, tsunami waves recorded at Yuzhno-Kurilskwere irregular and polychromatic, a typical feature for thissite (cf. Rabinovich and Leviant, 1992). Resonant propertiesof the local topography in the vicinity of Yuzhno-Kurilsk aremuch less pronounced than in the bays of Shikotan Island andthis probably is one of the main reasons why the observedtsunami waves at this site are much weaker than at other siteslocated in the same area (Table 2).
www.adv-geosci.net/14/105/2008/ Adv. Geosci., 14, 105–116, 2008
110 A. B. Rabinovich et al.: Near-source observations and modeling of the Kuril Islands tsunamis
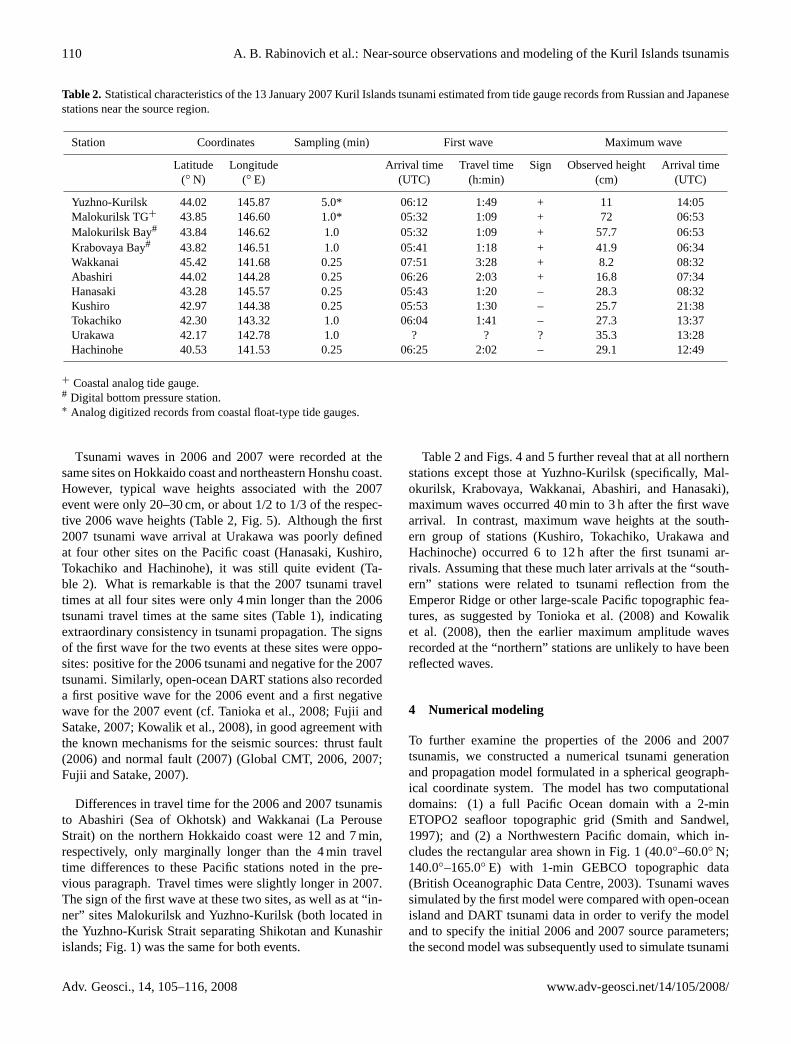
Table 2. Statistical characteristics of the 13 January 2007 Kuril Islands tsunami estimated from tide gauge records from Russian and Japanesestations near the source region.
Station Coordinates Sampling (min) First wave Maximum wave
Latitude Longitude Arrival time Travel time Sign Observed height Arrival time(◦ N) (◦ E) (UTC) (h:min) (cm) (UTC)
Yuzhno-Kurilsk 44.02 145.87 5.0* 06:12 1:49 + 11 14:05Malokurilsk TG+ 43.85 146.60 1.0* 05:32 1:09 + 72 06:53Malokurilsk Bay# 43.84 146.62 1.0 05:32 1:09 + 57.7 06:53Krabovaya Bay# 43.82 146.51 1.0 05:41 1:18 + 41.9 06:34Wakkanai 45.42 141.68 0.25 07:51 3:28 + 8.2 08:32Abashiri 44.02 144.28 0.25 06:26 2:03 + 16.8 07:34Hanasaki 43.28 145.57 0.25 05:43 1:20 – 28.3 08:32Kushiro 42.97 144.38 0.25 05:53 1:30 – 25.7 21:38Tokachiko 42.30 143.32 1.0 06:04 1:41 – 27.3 13:37Urakawa 42.17 142.78 1.0 ? ? ? 35.3 13:28Hachinohe 40.53 141.53 0.25 06:25 2:02 – 29.1 12:49
+ Coastal analog tide gauge.# Digital bottom pressure station.∗ Analog digitized records from coastal float-type tide gauges.
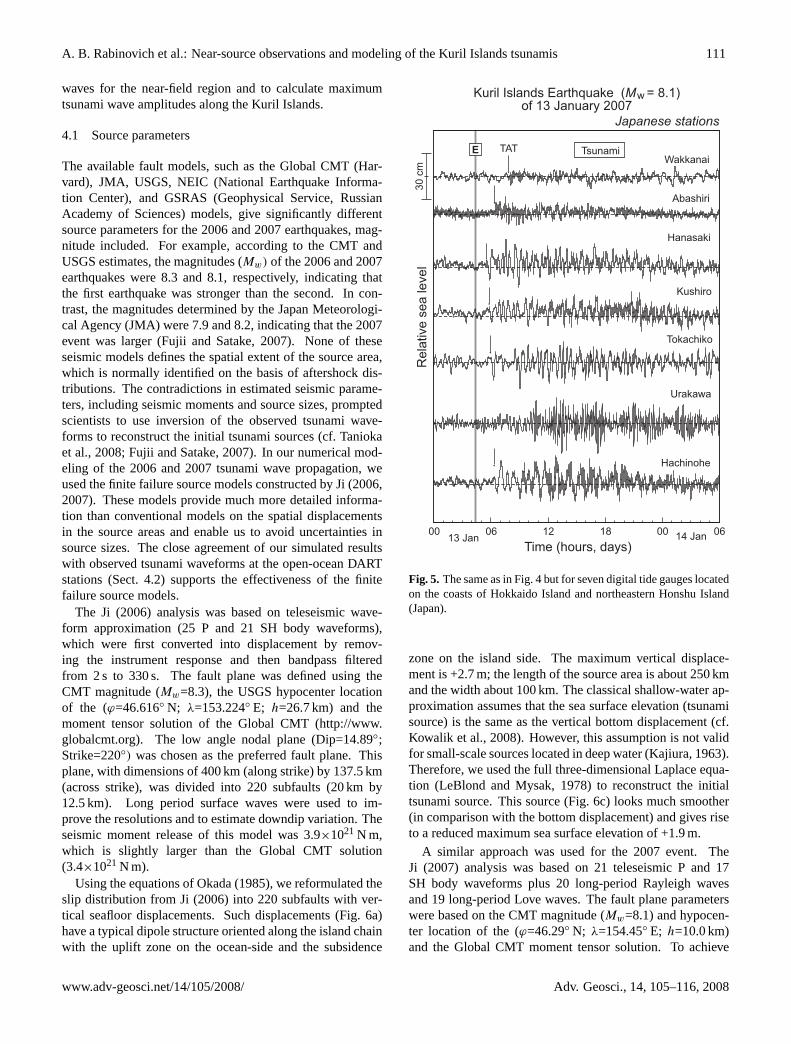
Tsunami waves in 2006 and 2007 were recorded at thesame sites on Hokkaido coast and northeastern Honshu coast.However, typical wave heights associated with the 2007event were only 20–30 cm, or about 1/2 to 1/3 of the respec-tive 2006 wave heights (Table 2, Fig. 5). Although the first2007 tsunami wave arrival at Urakawa was poorly definedat four other sites on the Pacific coast (Hanasaki, Kushiro,Tokachiko and Hachinohe), it was still quite evident (Ta-ble 2). What is remarkable is that the 2007 tsunami traveltimes at all four sites were only 4 min longer than the 2006tsunami travel times at the same sites (Table 1), indicatingextraordinary consistency in tsunami propagation. The signsof the first wave for the two events at these sites were oppo-sites: positive for the 2006 tsunami and negative for the 2007tsunami. Similarly, open-ocean DART stations also recordeda first positive wave for the 2006 event and a first negativewave for the 2007 event (cf. Tanioka et al., 2008; Fujii andSatake, 2007; Kowalik et al., 2008), in good agreement withthe known mechanisms for the seismic sources: thrust fault(2006) and normal fault (2007) (Global CMT, 2006, 2007;Fujii and Satake, 2007).
Differences in travel time for the 2006 and 2007 tsunamisto Abashiri (Sea of Okhotsk) and Wakkanai (La PerouseStrait) on the northern Hokkaido coast were 12 and 7 min,respectively, only marginally longer than the 4 min traveltime differences to these Pacific stations noted in the pre-vious paragraph. Travel times were slightly longer in 2007.The sign of the first wave at these two sites, as well as at “in-ner” sites Malokurilsk and Yuzhno-Kurilsk (both located inthe Yuzhno-Kurisk Strait separating Shikotan and Kunashirislands; Fig. 1) was the same for both events.
Table 2 and Figs. 4 and 5 further reveal that at all northernstations except those at Yuzhno-Kurilsk (specifically, Mal-okurilsk, Krabovaya, Wakkanai, Abashiri, and Hanasaki),maximum waves occurred 40 min to 3 h after the first wavearrival. In contrast, maximum wave heights at the south-ern group of stations (Kushiro, Tokachiko, Urakawa andHachinoche) occurred 6 to 12 h after the first tsunami ar-rivals. Assuming that these much later arrivals at the “south-ern” stations were related to tsunami reflection from theEmperor Ridge or other large-scale Pacific topographic fea-tures, as suggested by Tonioka et al. (2008) and Kowaliket al. (2008), then the earlier maximum amplitude wavesrecorded at the “northern” stations are unlikely to have beenreflected waves.
4 Numerical modeling
To further examine the properties of the 2006 and 2007tsunamis, we constructed a numerical tsunami generationand propagation model formulated in a spherical geograph-ical coordinate system. The model has two computationaldomains: (1) a full Pacific Ocean domain with a 2-minETOPO2 seafloor topographic grid (Smith and Sandwel,1997); and (2) a Northwestern Pacific domain, which in-cludes the rectangular area shown in Fig. 1 (40.0◦–60.0◦ N;140.0◦–165.0◦ E) with 1-min GEBCO topographic data(British Oceanographic Data Centre, 2003). Tsunami wavessimulated by the first model were compared with open-oceanisland and DART tsunami data in order to verify the modeland to specify the initial 2006 and 2007 source parameters;the second model was subsequently used to simulate tsunami
Adv. Geosci., 14, 105–116, 2008 www.adv-geosci.net/14/105/2008/
A. B. Rabinovich et al.: Near-source observations and modeling of the Kuril Islands tsunamis 111
waves for the near-field region and to calculate maximumtsunami wave amplitudes along the Kuril Islands.
4.1 Source parameters
The available fault models, such as the Global CMT (Har-vard), JMA, USGS, NEIC (National Earthquake Informa-tion Center), and GSRAS (Geophysical Service, RussianAcademy of Sciences) models, give significantly differentsource parameters for the 2006 and 2007 earthquakes, mag-nitude included. For example, according to the CMT andUSGS estimates, the magnitudes (Mw) of the 2006 and 2007earthquakes were 8.3 and 8.1, respectively, indicating thatthe first earthquake was stronger than the second. In con-trast, the magnitudes determined by the Japan Meteorologi-cal Agency (JMA) were 7.9 and 8.2, indicating that the 2007event was larger (Fujii and Satake, 2007). None of theseseismic models defines the spatial extent of the source area,which is normally identified on the basis of aftershock dis-tributions. The contradictions in estimated seismic parame-ters, including seismic moments and source sizes, promptedscientists to use inversion of the observed tsunami wave-forms to reconstruct the initial tsunami sources (cf. Taniokaet al., 2008; Fujii and Satake, 2007). In our numerical mod-eling of the 2006 and 2007 tsunami wave propagation, weused the finite failure source models constructed by Ji (2006,2007). These models provide much more detailed informa-tion than conventional models on the spatial displacementsin the source areas and enable us to avoid uncertainties insource sizes. The close agreement of our simulated resultswith observed tsunami waveforms at the open-ocean DARTstations (Sect. 4.2) supports the effectiveness of the finitefailure source models.
The Ji (2006) analysis was based on teleseismic wave-form approximation (25 P and 21 SH body waveforms),which were first converted into displacement by remov-ing the instrument response and then bandpass filteredfrom 2 s to 330 s. The fault plane was defined using theCMT magnitude (Mw=8.3), the USGS hypocenter locationof the (ϕ=46.616◦ N; λ=153.224◦ E; h=26.7 km) and themoment tensor solution of the Global CMT (http://www.globalcmt.org). The low angle nodal plane (Dip=14.89◦;Strike=220◦) was chosen as the preferred fault plane. Thisplane, with dimensions of 400 km (along strike) by 137.5 km(across strike), was divided into 220 subfaults (20 km by12.5 km). Long period surface waves were used to im-prove the resolutions and to estimate downdip variation. Theseismic moment release of this model was 3.9×10²¹ N m,which is slightly larger than the Global CMT solution(3.4×10²¹ N m).
Using the equations of Okada (1985), we reformulated theslip distribution from Ji (2006) into 220 subfaults with ver-tical seafloor displacements. Such displacements (Fig. 6a)have a typical dipole structure oriented along the island chainwith the uplift zone on the ocean-side and the subsidence
30 c
mR
ela
tive s
ea level
Hanasaki
Kushiro
Tokachiko
Urakawa
Hachinohe
18 06120600
Time (hours, days)13 Jan 14 Jan
00
E TAT Tsunami
Japanese stations
Kuriles-Figure 5.
Kuril Islands Earthquake (M = 8.1)of 13 January 2007
w
Wakkanai
Abashiri
Fig. 5. The same as in Fig. 4 but for seven digital tide gauges locatedon the coasts of Hokkaido Island and northeastern Honshu Island(Japan).
zone on the island side. The maximum vertical displace-ment is +2.7 m; the length of the source area is about 250 kmand the width about 100 km. The classical shallow-water ap-proximation assumes that the sea surface elevation (tsunamisource) is the same as the vertical bottom displacement (cf.Kowalik et al., 2008). However, this assumption is not validfor small-scale sources located in deep water (Kajiura, 1963).Therefore, we used the full three-dimensional Laplace equa-tion (LeBlond and Mysak, 1978) to reconstruct the initialtsunami source. This source (Fig. 6c) looks much smoother(in comparison with the bottom displacement) and gives riseto a reduced maximum sea surface elevation of +1.9 m.
A similar approach was used for the 2007 event. TheJi (2007) analysis was based on 21 teleseismic P and 17SH body waveforms plus 20 long-period Rayleigh wavesand 19 long-period Love waves. The fault plane parameterswere based on the CMT magnitude (Mw=8.1) and hypocen-ter location of the (ϕ=46.29◦ N; λ=154.45◦ E; h=10.0 km)and the Global CMT moment tensor solution. To achieve
www.adv-geosci.net/14/105/2008/ Adv. Geosci., 14, 105–116, 2008

112 A. B. Rabinovich et al.: Near-source observations and modeling of the Kuril Islands tsunamis
Kuriles-Figure 6.
2006 2007Bottom displacement
Displacement / elevation (m)
151° 152° 153° 154° 155°45°
45°
46°
46°
47°
47°
48°
48°
49°
49°N
151° 152° 153° 154° 155° 156°E
Sea surface elevation
SimushirI.
Extreme: +2.7 m
Extreme: -2.6 m
Extreme: -6.8 m
Extreme: +1.9 m
1.5
1
1086420-2-4-6-8-10
9000
8000
7000
6000
5000
4000
3000
2000
1000
0
De
pth
(m
)
Ku
r il
I sl a
nd
s
(a)
(c)
(b)
(d)
Fig. 6. Bottom displacements for(a) the 15 November 2006 and(b) the 13 January 2007 earthquakes constructed according to thesource models of Ji (2006, 2007);(c, d) the corresponding sea sur-face elevations. Numbers in the bottom righthand corner of theboxes indicate maximum displacements of the sea floor or sea sur-face.
better agreement with body waves the USGS hypocenterdepth was corrected toh=18.0 km. The nodal plane withDip=57.89◦ and Strike=42◦ was selected based on aftershockdistribution. The plane with 200 km length (along strike)and 35 km width was divided into 175 subfaults (8 km by5 km). The seismic moment estimated for this model was1.9×1021 N m, which is larger than the Global CMT solution(1.65×10²¹ N m) and USGS solution (0.78×10²¹ N m).
The vertical seafloor displacement during the 2007 eventwas based on the Okada (1985) model and calculated as forthe 2006 earthquake. The resulting displacement (Fig. 6b)also has a dipole structure but of the opposite sign, withthe subsidence zone on the ocean-side zone and the upliftzone on the island-side. This displacement generated a pro-nounced, small-scale trough of−6.8 m elevation; the lengthof the source area was about 170 km and the width about50 km. The reconstructed sea surface displacement basedon the three-dimensional Laplace equation (Fig. 6d) wassmoother and had a considerably smaller maximum trough(−2.6 m elevation).
4.2 Tsunami simulation
Figures 6c and d show the tsunami source areas used for nu-merical simulation of the 2006 and 2007 tsunamis. Simu-lations are based on a shallow-water finite difference modelsimilar to that described by Imamura (1996). For the full Pa-cific Ocean model, the spatial grid step is 2′ and the time step6 s; for the higher resolution Northwestern Pacific model, thegrid step is 1′ and the time step 3 s. Although a detaileddescription of the results for the Pacific model are out ofthe scope of the present paper (for which focus is on near-source observations), two aspects of the full model domainare worth noting:
1. Modeled energy fluxes for both tsunamis were directedsoutheastward from the source areas, in the directionof the Hawaiian Islands and Peru-Chile. These find-ings are in good agreement with the numerical resultsof other authors (cf. Tanioka et al., 2008; Kowalik etal., 2008) and with observations, which show signifi-cant wave heights (more than 1 m for the 2006 event)on the coasts of the Hawaiian Islands and substantialrecorded tsunami wave heights on the Pacific coast ofSouth America.
2. The simulated 2006 and 2007 tsunami waves for theopen-ocean DART buoy locations, in particular, buoynumbers 21 414, 46 413, 46 408, 46 402, 46 403, and21 413 (the last one only for the 2007 tsunami) closelymatched the observed records at these sites. In particu-lar, the simulated waveforms fitted the observed tsunamiwaveforms for the first three to four waves and correctlyreproduced the arrival times, the sign of the first wave(positive for the 2006 tsunami and negative for the 2007tsunami), and the recorded wave amplitudes.
Close agreement between the simulated and observedtsunamis, both in a qualitative sense (general character of thetsunami waves as the propagated across the Pacific Ocean)and in a quantitative sense (close agreement with the DARTrecords), support the validity of our constructed source re-gions and confirm the adequate performance of the numeri-cal models. The same models but with factor of two smallerspatial and time steps were used for more detailed numericalsimulation for the near-field zone.
The directions of energy propagation from the 2006 and2007 tsunami sources and the possible effects of topographicfeatures on this propagation have been determined from theenergy fluxes (Fig. 7):
E = ρghζu, (1)
whereE=E(ϕ, λ) is the energy flux vector,ρ is the wa-ter density,g is gravitational acceleration,h=h(ϕ, λ) is thewater depth,ζ=ζ(ϕ, λ) is the sea surface elevation, andu=u(ϕ, λ) is the water velocity (cf. Kowalik et al., 2008).
Adv. Geosci., 14, 105–116, 2008 www.adv-geosci.net/14/105/2008/

A. B. Rabinovich et al.: Near-source observations and modeling of the Kuril Islands tsunamis 113
In general, the energy fluxes for the two events are simi-lar (Fig. 7a, b): both fluxes are directed to the southeast(i.e., seaward) from the source area. Only a relatively smallamount of energy entered the Sea of Okhotsk due to effectivesheltering from the tsunami waves by Simushir Island. Thetwo deepest straits within the Kuril Islands, Bussol Strait andKruzensterna Strait (Fig. 1), provided the main “gateways”for the tsunami energy flux. Had the seismic sources for thetsunamis been located opposite either of these straits, the im-pacts on commercial oil and gas facilities on the northeast-ern shelf of Sakhalin Island could have been much worse.For both events, the tsunami energy “tongue” protrudes intothe Sea of Okhotsk (which was a little stronger for the 2006event) propagated northwestward toward the northern shoreof Sakhalin Island. Predictions were for amplification oftsunami waves hitting the northeastern shelf of Sakhalin Is-land with maximum calculated 2006 tsunami wave heightsof 0.5–1.0 m on the coast. Regrettably, there are no workingtide gauges in this region to compare simulated and recordedwaves, but it is known that no destruction was observed onthis coast.
Due to wave trapping (LeBlond and Mysak, 1978), partof the tsunami energy propagated southwestward and north-eastward along the Pacific shelf of the Kuril Islands. Thiseffect plays a crucial role in tsunami energy conservation,wave transmission distance, and long-term tsunami ringing(cf., Miller et al., 1962; Kajiura, 1972).
4.3 Maximum wave amplitudes
Results of our numerical modeling were used to estimatemaximum tsunami amplitudes (from mean sea level topeak) along the Pacific coasts of the Kuril Islands, northernHokkaido and southern Kamchatka. All calculations weremade for the 5-m isobath (the minimum permissible depthin the model). The results for the 2006 and 2007 events arepresented in Figs. 8 and 9, respectively. Because of relativelylarge spatial grid step (about one nautical mile), the modelscannot resolve small-scale resonant effects arising from localtopographic effects of individual islands, although the modeldo enable us to define general properties and to compare lo-cal responses for the two events.
For obvious reasons, maximum amplitudes occur in thevicinity of the Central Kuril Islands source areas. Accord-ing to our computations, highest waves should have been ob-served on Simushir, Ketoy, Srednego, Matua and Rasshua is-lands. Outside this region, wave amplitudes along the KurilIslands should gradually decay. We note that the distributionof tsunami amplitudes is not symmetric relative to the earth-quake epicenters in that wave amplitudes diminish muchmore slowly in the northeast direction than in the south-west direction. This asymmetry is apparently associated withtopographic differences between the northern and southernshelves of the Kuril Islands; historically, most catastrophictsunamis for this region (in particular the 1952 event) occur
2006 2007
Pacific Ocean Pacific Ocean
Sea of Okhotsk Sea of Okhotsk
Kamchatka Kamchatka
Sakh
alin
Sakh
alin
Hokkaido Hokkaido
Kuriles-Figure 7.
140° 145° 150° 155° 160° 165°E
40°
60°N
45°
50°
55°
140° 145° 150° 155° 160° 165°E
(a) (b)
0 10 20 30 40 50MJ/m
Fig. 7. Energy fluxes for tsunami waves generated by(a) theNovember 2006 and(b) the January 2007 earthquakes.
in the region of the Northern Kuril Islands (Soloviev and Go,1974).
Surprisingly, the highest calculated tsunami amplitudes(∼6 m) were associated with the smaller (Mw=8.1) 2007event rather than with the larger (Mw=8.3) 2006 event. How-ever, the spatial area impacted by the higher 2007 waves wasquite limited, in agreement with the narrower and more in-tensive tongue-like distribution of the energy flux associatedwith the 2007 event (Fig. 7b). Local areas affected by the2007 tsunami include Srednego Island and Rasshua Island.Outside of these areas, the maximum waves decayed rapidly(Fig. 9), much faster than for the 2006 event (Fig. 8). Thiseffect is probably attributable to the abrupt, escarpment-likebottom displacement of the 2007 source area (Ji, 2007) in thevicinity of Srednego Island and Rasshua Island.
We have likely underestimated maximum tsunami ampli-tudes. Top begin with, the relatively large spatial step (aboutone nautical mile) of our model does not allow us to re-solve small-scale features of the coast and bottom topogra-phy, which can be responsible for substantial local amplifi-cation of arriving tsunami waves1. Secondly, the length ofthe spatial grid step determines the minimum wavelengthand, therefore, the maximum wave frequency that can besimulated numerically. More precisely, the model grid stepplays the role of a low-frequency filter which effectively sup-presses high-frequency waves. Such waves were significantduring the 2006 and 2007 Kuril events due to the highly con-fined spatial extents of the source regions. Third, direct insitu comparison of actual depths on the Kuril Islands shelfwith the GEBCO bathymetry data reveals marked depth dif-ferences, which has the effect of attenuating the simulated
1A classical example of such an effect is the 32-m runup ob-served in a small valley on Okushiri Island during the 1993 tsunamiin the Sea of Japan. Numerical resolution of this runup required avery detailed fine grid model (Titov and Synolakis, 1997).
www.adv-geosci.net/14/105/2008/ Adv. Geosci., 14, 105–116, 2008

114 A. B. Rabinovich et al.: Near-source observations and modeling of the Kuril Islands tsunamis
02
46
8
Wave
height (m)
140° 145° 150° 155°E
42°
44°
46°
48°
50°
52°
54°N
Kunashir I.
Iturup I.
Shikotan I.
Simushir I.
Onekotan I.
Paramushir I.
Urup I.
0
2
4
Wave
heig
ht (m
)
Kuriles-Figure 8.
Pacific Ocean
Seaof
Okhotsk
Kamchatka
Sa
kh
ali
n
Hokkaido
2006
Simushir I. Ketoy I.Rasshua I.
Matua I.
Raykoke I.Srednego I.
0
2
4
6
Wave
heig
ht (m
)Iturup I.
Urup I.Chernyye Bratya Is.
Onekotan I.Kharimkotan I.
Shiashkotan I.
Paramushir I.Shumshu I.
Kamchatka
0
Wave
heig
ht (m
)
2
4
Fig. 8. Maximum simulated tsunami wave amplitudes along the coast of the Kuril Islands for the tsunami of November 2006.
2007
140° 145° 150° 155°E
42°
44°
46°
48°
50°
52°
54°N
Kunashir I.
Iturup I.
Shikotan I.
02
46
8
Wave
height (m)
Onekotan I.
Paramushir I.
Urup I.
0
2
4
Wave
heig
ht (m
)
0
2
4
6
Wave
heig
ht (m
)
0
2
4
Wave
heig
ht (m
)
Pacific Ocean
Seaof
Okhotsk
Kamchatka
Sakh
alin
Hokkaido
Kuriles-Figure 9.
Iturup I.
Urup I.Chernyye Bratya Is.
Onekotan I.Kharimkotan I.
Shiashkotan I.
Paramushir I.Shumshu I.
Kamchatka
Simushir I.
Simushir I. Ketoy I.Rasshua I.
Matua I.
Raykoke I.Srednego I.
Fig. 9. Same as Fig. 8 but for the tsunami of January 2007.
wave amplitudes (Michail Nosov, personal communication,2007). Much more accurate bathymetry and significantlysmaller grid steps are necessary for precise simulation of the2006 and 2007 tsunami events.
5 Discussion and conclusions
Two major tsunamigenic earthquakes with magnitudes ofMw=8.3 andMw=8.1 occurred within two months of one an-other within the same geographic region of the Central Kuril
Adv. Geosci., 14, 105–116, 2008 www.adv-geosci.net/14/105/2008/

A. B. Rabinovich et al.: Near-source observations and modeling of the Kuril Islands tsunamis 115
Islands. Despite the close proximity of the two source areas(separation of about 100 km) and the fact that the earthquakesappear to have been closely related, the earthquakes had sub-stantially different deformation characteristics; the earlier 15November 2006 event was a thrust fault earthquake whilethe later 13 January 2006 event was a normal fault earth-quake. As a consequence, the tsunamis generated by the twoevents had both similarities and differences. We can summa-rize these specific features as follows.
I. Similarities
(a) The tsunami sources for the 2006 and 2007 events werenearly co-located, the source region for the 2007 eventonly slightly eastward of that for the 2006 event.
(b) Both tsunamis were trans-oceanic, crossing the PacificOcean to be clearly recorded on the coasts of Peru, Chileand New Zealand.
(c) Tsunami energy fluxes originating from both the 2006and 2007 source areas were mainly directed southeast-ward toward the Hawaiian Islands and South America.
(d) Little energy propagated northwestward into the Sea ofOkhotsk where recorded tsunami waves were small.
(e) Both tsunamis had distinctive high-frequency content,with typical wave periods ranging from 2-3 to 15-20min.
(f) For both tsunamis at most sites (except those located inclose vicinity to the source areas), maximum waves oc-curred a considerable time (∼5 h) after the first wavearrivals, a finding that supports the notion that thelate-arrival maximum waves were “secondary” tsunamiwaves reflected from large-scale bottom features suchas the Emperor Ridge.
II. Differences
(a) Due the difference in polarity of the two seismicsources, the signs of the first waves were opposite: pos-itive for the 2006 tsunami and negative for the 2007tsunami.
(b) The hazardous impact of the 2007 tsunami at remotesites, such as Crescent City, was highly tempered com-pared to the 2006 tsunami due the reduced wave energy(the ratio of 2006/2007 far-field wave heights is typi-cally around 3:1).
(c) The extension and width of the 2007 source area weresignificantly smaller than those of the 2006 event; con-sequently the 2007 tsunami had higher dominant fre-quencies and likely experienced stronger dispersionduring propagation.
(d) Due to the specific parameters of the 2007 source area(narrow, with sharp local displacement) numerical mod-eling indicates that, due to differences in their seismicsource properties, the 2007 tsunami was more focusedand the 2006 tsunami was more wide-spread; the sim-ulated energy flux for the 2007 event has the focusedform of searchlight (Fig. 7b), while the more diffuseflux of the 2006 event has the appearance a floodlight(Fig. 7a).
(e) The 2006 source area was closer to shore than the 2007source area, resulting in more of the energy from the2006 event to become “trapped” over the Kuril shelfwhere it propagated as edge waves along the Kuril Is-lands. For the 2007 tsunami, a higher percentage ofthe energy radiated into the open ocean as non-trapped(leaky) waves.
The results of our analysis and numerical modeling high-light the fact that earthquakes of comparable magnitude fromadjacent source regions do not necessarily generate identicaltsunami wave fields. Differences in the spatial extent, depth,and fault structure of closely related earthquakes can leadto distinct tsunami responses, including differences in max-imum wave amplitude, dominant frequency content, leadingwave polarity, and directions of energy propagation. Thesedifferences can subsequently lead to markedly different res-onant responses at near and far-field locations. Such fac-tors must be taken into account when modeling the oceanresponse to earthquakes and when attempting to use tsunamiobservations to delineate possible source parameters.
We further emphasize that our numerical results are basedon a tsunami source model that is more comprehensive andhas fewer free parameters than most source models typicallyused for tsunami wave simulation. Our modeling results aredistinct in two major ways:
(a) In use of theFinite failure source modelsconstructedby Ji (2006, 2007). Because these models are “self-sufficient”, in that they do not require additional inde-terminate parameters such as source area extent, andhave more degrees of freedom than conventional seis-mic models, they provide better definition of seafloordisplacement in the source area. Specific small-scaleseafloor displacement features are likely responsible forsome of the observed structure in tsunami waveforms.Such structure cannot be resolved using conventionalsource models.
(b) In the Avoidance of the shallow-water approximationfor the sea surface elevations. For deep-ocean source re-gions with relatively confined spatial extent such as theKuril Islands earthquakes (especially, the 2007 sourcearea), use of the more generalized equations of motionis important.
www.adv-geosci.net/14/105/2008/ Adv. Geosci., 14, 105–116, 2008

116 A. B. Rabinovich et al.: Near-source observations and modeling of the Kuril Islands tsunamis
Features (a) and (b) constitute critical advancements in themodeling of the 2006 and 2007 events. It is also clear thatmuch more detailed and precise bathymetry is needed forthe Kuril shelf and straits if we are to provide more accu-rate simulation of tsunami propagation and wave heights forthe near-source zone.
Acknowledgements.We thank V. Kaistrenko and G. Bogdanov(IMGG, Yuzhno-Sakhalinsk, Russia) for permitting us to use thebottom pressure data for stations in Malokurilsk and Krabovayabays, Y. Tanioka (Hokkaido University, Sapporo, Japan) forproviding the coastal tide gauge data for Hokkaido and Honshuislands and Y. Hasegawa (JMA, Tokyo, Japan) for sending usadditional information on these tide gauges. We also thankP. Kimber (Sidney, BC) and M. Krassovski (University of Victoria,BC) for drafting the figures and C. Wright for coordinating theelectronic submissions. A. Rabinovich and E. Kulikov were partlysupported by the Russian Foundation on Basic Research (RFBR)grants 05-05-64585 and 06-05-08108.
Edited by: P. FabianReviewed by: J. McCloskey and another anonymous referee
References
British Oceanographic Data Centre: GEBCO Digital Atlas, 2003.Djumagaliev, V. A. and Rabinovich, A. B.: Long wave investiga-
tions at the shelf and in the bays of the South Kuril Islands, J.Korean Soc. Coastal Ocean Engineers, 5(4), 318–328, 1993.
Djumagaliev, V. A, Rabinovich, A. B., and Fine, I. V.: Theoreti-cal and experimental estimation of transfer peculiarities of theMalokurilsk Bay coast, the Island of Shikotan, Atmos. OceanicPhys., 30(5), 680–686, 1994.
Fujii, Y. and Satake, K.: Tsunami sources of November 2006 andJanuary 2007 great Kuril earthquakes, Bull. Seism. Soc. Amer.,accepted, 2007.
Global CMT Web Page:http://www.globalcmt.org/, 2006, 2007.Imamura, F.: Review of tsunami simulation with a finite difference
method, in: Long-Wave Run-up Models, edited by: Yeah, H.,Liu, P., and Synolakis, C., World Scientific, 25–42, 1996.
Ji, C.: Rupture process of the 2006 November 15 Magnitude 8.3Kuril Island Earthquake,http://earthquake.usgs.gov/eqcenter/eqinthenews/2006/usvcam/finitefault.php, 2006.
Ji, C.: Rupture process of the 2007 January 13 Magnitude 8.1Kuril Island Earthquake,http://earthquake.usgs.gov/eqcenter/eqinthenews/2007/us2007xmae/finitefault.php, 2007.
Kajiura, K.: The leading wave of a tsunami, Bull. Earthq. Res. Inst.,41, 535–571, 1963.
Kajiura, K.: The directivity of energy radiation of the tsunami gen-erated in the vicinity of a continental shelf, J. Oceanogr. Soc.Japan, 28, 260–277, 1972.
Kowalik, Z., Horillo, J., Knight, W., and Logan, T.: The Kuril Is-lands tsunami of November 2006: Part I: Impact at Crescent Cityby distant scattering, J. Geophys. Res., 213, in press, 2008.
Laverov, N. P., Lappo, S. S., Lobkovsky, L. I., Baranov, B. V.,Kulinich, R. G., and Karp, B. Ya.: The Central Kuril “Gap”:Structure and seismic potential, Doklady Earth Sciences, 409(6),787–790, 2006a.
Laverov, N. P., Lappo, S. S., Lobkovsky, L. I., and Kulikov, E.A.: Extreme earthquakes and catastrophic tsunamis: Analysis,modeling, and forecasting, (in Russian), in: Fundamental inves-tigations of oceans and seas, Vol. 1, Nauka, Moscow, 191–209,2006b.
LeBlond, P. H. and Mysak, L. A.: Waves in the Ocean, Elsevier,Amsterdam, 602 pp., 1978.
Lobkovsky, L. I.: A fully destructive wave (in Russian), in: Worldof Science, 5, 74–81, 2005.
Lobkovsky, L. and Kulikov, E.: Analysis of hypothetical strongearthquake and tsunami in the Central Kuril Arc, Geophys. Res.Abstr., 8, 04138, 2006.
Lobkovsky, L. I., Mazova, R. Kh., Kataeva, L. Yu., and Baranov, B.V.: Generation and propagation of catastrophic tsunamis in theSea of Okhotsk basin: Possible scenarios, Doklady Earth Sci-ences, 410(7), 1156–1159, 2006.
McCann, W. R., Nishenko, S. P., Sykes L. R., and Krause, J.: Seis-mic gaps and plate tectonics: Seismic potential for major bound-aries, Pure Appl. Geophys., 117, 1082–1147, 1979.
Miller, G. R., Munk, W. H., and Snodgrass F. E.: Long-periodwaves over California’s continental borderland, II, Tsunamis, J.Mar. Res., 20(1), 31–41, 1962.
Okada, Y.: Surface deformation due to shear and tenisle faults in ahalf-space, Bull. Seism. Soc. Amer., 75, 1135–1154, 1985.
Rabinovich, A. B.: Spectral analysis of tsunami waves: Separa-tion of source and topography effects, J. Geophys. Res., 102(C6),12 663–12 676, 1997.
Rabinovich, A. B. and Leviant, A. S.: Influence of seiche oscilla-tions on the formation of the long-wave spectrum near the coastof the Southern Kuriles, Oceanology, 32(1), 17–23, 1992.
Rabinovich, A. B. and Monserrat, S.: Generation of meteorologicaltsunamis (large amplitude seiches) near the Balearic and KurilIslands, Nat. Hazards, 18(1), 27–55, 1998.
Rabinovich, A. B., Thomson, R. E., and Stephenson, F. E.: TheSumatra Tsunami of 26 December 2004 as observed in the NorthPacific and North Atlantic oceans, Surv. Geophys., 27, 647–677,2006.
Rabinovich, A. B. and Thomson, R. E.: The 26 December 2004Sumatra tsunami: Analysis of tide gauge data from the WorldOcean Part 1. Indian Ocean and South Africa, Pure Appl. Geo-phys., 164(2/3), 261–308, 2007.
Smith, W. H. F. and Sandwell, D. T.: Global sea floor topogra-phy from satellite altimetry and ship depth soundings, Science,277(5334), 1956–1962, 1997.
Soloviev, S. L. and Go, Ch. N.: Catalogue of tsunamis on the west-ern shore of the Pacific Ocean, Nauka, Moscow, 310 pp., 1974(in Russian; English translation: Canadian Transl. Fish. AcuaticSci., No. 5078, Ottawa, 439 pp., 1984).
Tanioka, Y., Hasegawa, Y., and Kuwayama, T.: Tsunami wave-form analyses of the 2006 underthrust and 2007 outer-rise Kurileearthquakes, Adv. Geosci., 14 (this special volume), 2008.
Titov, V. V. and Synolakis C. E.: Extreme inundation flows duringthe Hokkaido-Nansei-Oki tsunami, Geophys. Res. Lett., 24(11),1315–1318, 1997.
Titov, V. V., Rabinovich, A. B., Mofjeld, H., Thomson, R. E., andGonzalez, F. I.: The global reach of the 26 December 2004Sumatra tsunami, Science, 309, 2045–2048, 2005.
Adv. Geosci., 14, 105–116, 2008 www.adv-geosci.net/14/105/2008/