“necessary but not sufficient”
TRANSCRIPT
“Necessary but not sufficient”
Adding voice and choice to Big Data
Associate Professor Susan Morton
Director
Centre for Longitudinal Research and
Growing Up in New Zealand
28 June 2018

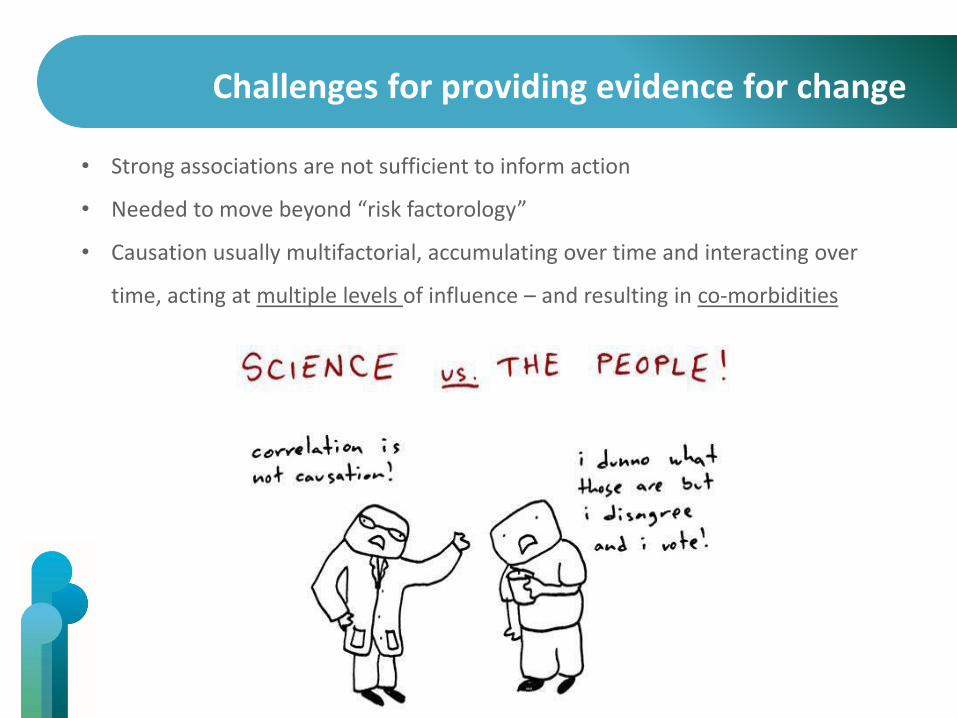
Challenges for providing evidence for change
• Strong associations are not sufficient to inform action
• Needed to move beyond “risk factorology”
• Causation usually multifactorial, accumulating over time and interacting over
time, acting at multiple levels of influence – and resulting in co-morbidities
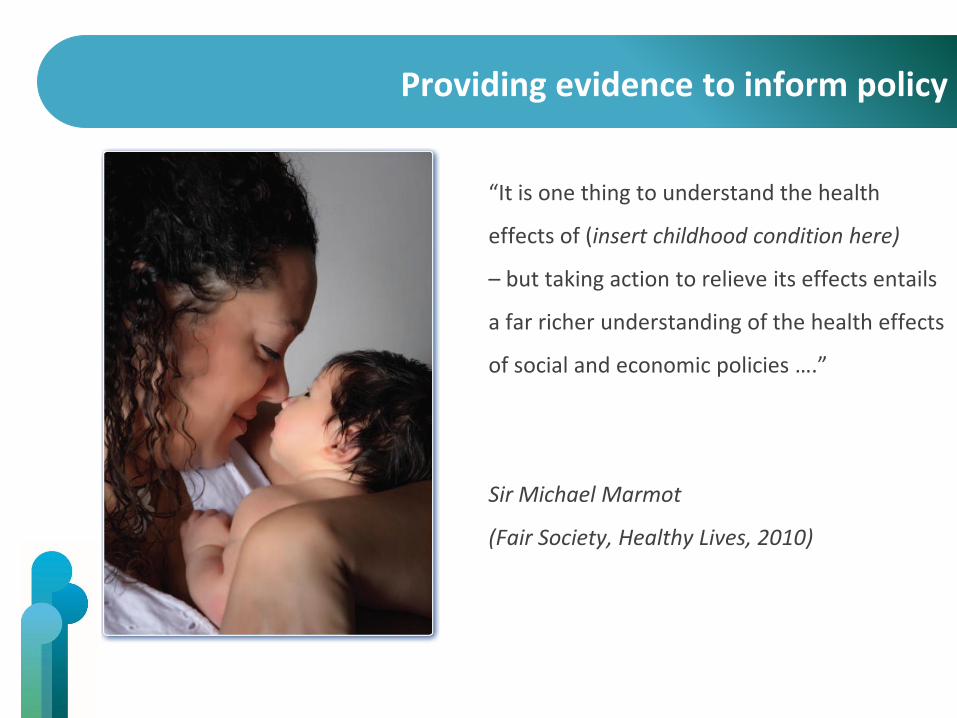
Providing evidence to inform policy
“It is one thing to understand the health
effects of (insert childhood condition here)
– but taking action to relieve its effects entails
a far richer understanding of the health effects
of social and economic policies ….”
Sir Michael Marmot
(Fair Society, Healthy Lives, 2010)
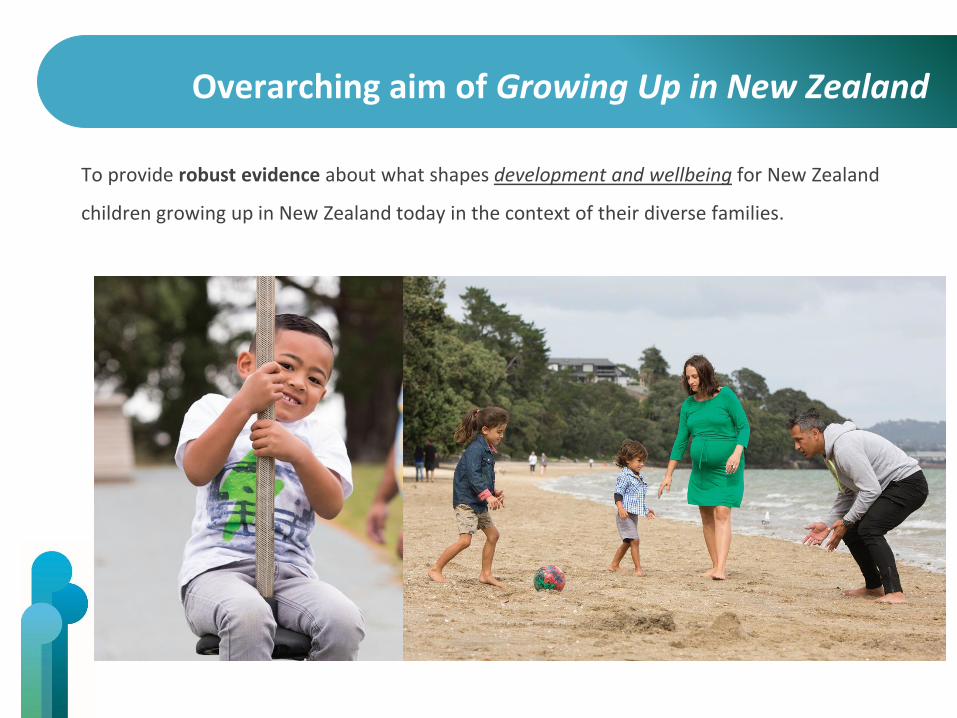
Overarching aim of Growing Up in New Zealand
To provide robust evidence about what shapes development and wellbeing for New Zealand
children growing up in New Zealand today in the context of their diverse families.
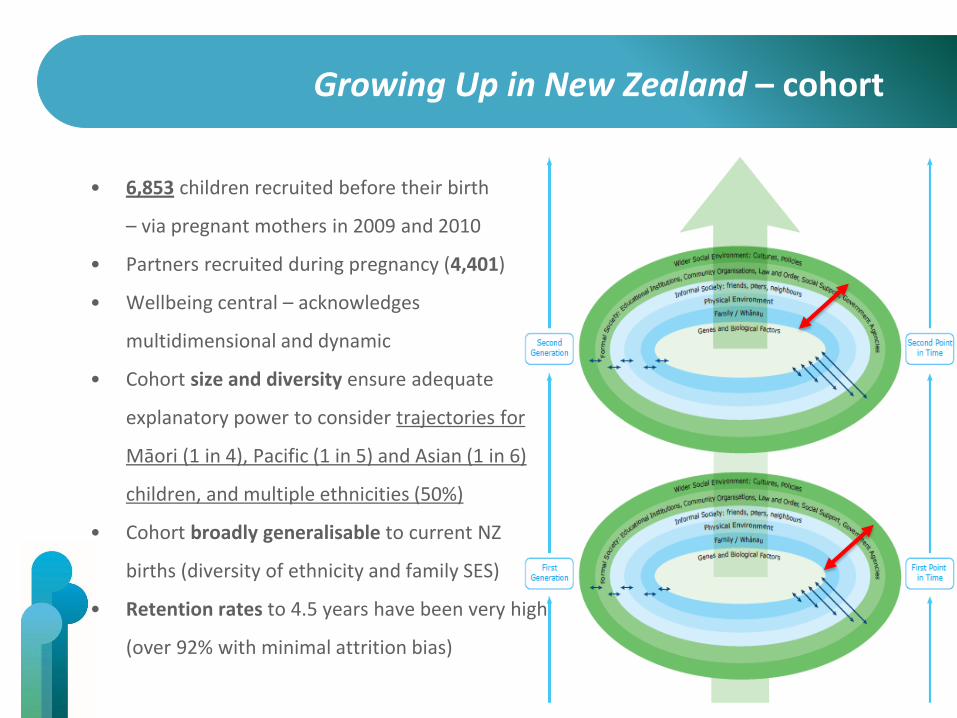
Growing Up in New Zealand – cohort
• 6,853 children recruited before their birth
– via pregnant mothers in 2009 and 2010
• Partners recruited during pregnancy (4,401)
• Wellbeing central – acknowledges
multidimensional and dynamic
• Cohort size and diversity ensure adequate
explanatory power to consider trajectories for
Māori (1 in 4), Pacific (1 in 5) and Asian (1 in 6)
children, and multiple ethnicities (50%)
• Cohort broadly generalisable to current NZ
births (diversity of ethnicity and family SES)
• Retention rates to 4.5 years have been very high
(over 92% with minimal attrition bias)

“Extraordinary things emerge from following ordinary people’s lives” Helen Pearson (Nature, 2015)
CHURN
Voice
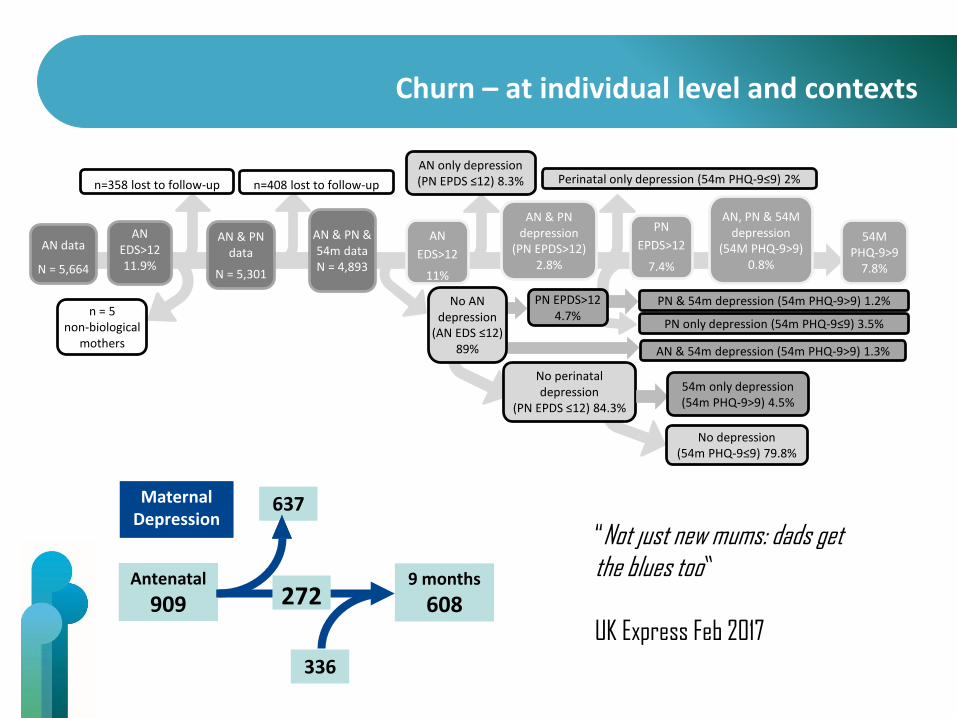
Churn – at individual level and contexts
Antenatal
909
637
9 months
608272
336
Maternal Depression
AN only depression(PN EPDS ≤12) 8.3%
AN data
N = 5,664
AN & PN data
N = 5,301
PN
EPDS>12
7.4%
n = 5non-biological
mothers
n=358 lost to follow-up
AN EDS>1211.9%
AN & PN depression
(PN EPDS>12) 2.8%
AN
EDS>12
11%
AN & PN & 54m dataN = 4,893
n=408 lost to follow-up
No perinatal depression
(PN EPDS ≤12) 84.3%
54m only depression(54m PHQ-9>9) 4.5%
No depression(54m PHQ-9≤9) 79.8%
54MPHQ-9>9
7.8%
AN, PN & 54M depression
(54M PHQ-9>9) 0.8%
Perinatal only depression (54m PHQ-9≤9) 2%
PN & 54m depression (54m PHQ-9>9) 1.2%
AN & 54m depression (54m PHQ-9>9) 1.3%
PN EPDS>12 4.7%
PN only depression (54m PHQ-9≤9) 3.5%
No AN depression
(AN EDS ≤12) 89%
“Not just new mums: dads get the blues too”
UK Express Feb 2017
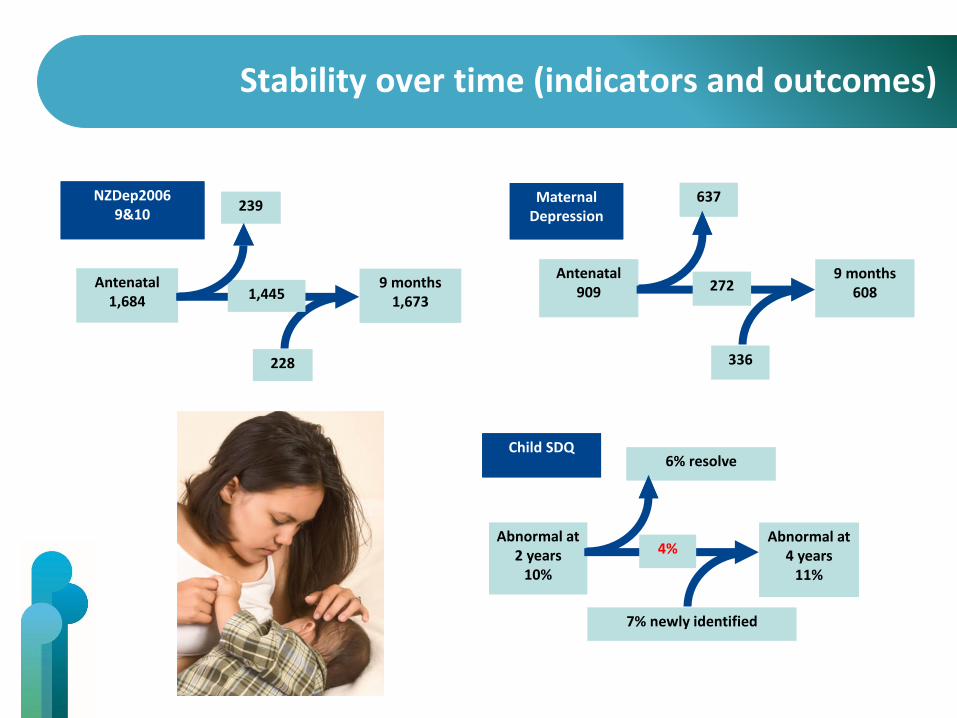
Stability over time (indicators and outcomes)
Antenatal1,684
239
9 months1,6731,445
228
NZDep2006 9&10
Antenatal909
637
9 months608272
336
Maternal Depression
Abnormal at 2 years
10%
6% resolve
Abnormal at 4 years
11%
4%
7% newly identified
Child SDQ
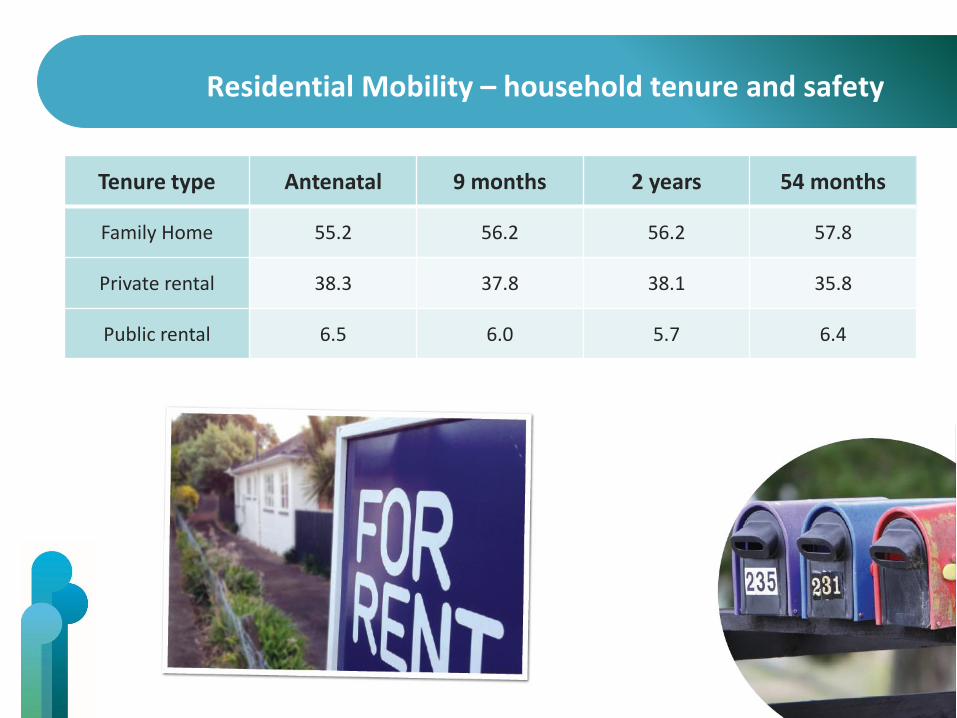
Residential Mobility – household tenure and safety
Tenure type Antenatal 9 months 2 years 54 months
Family Home 55.2 56.2 56.2 57.8
Private rental 38.3 37.8 38.1 35.8
Public rental 6.5 6.0 5.7 6.4
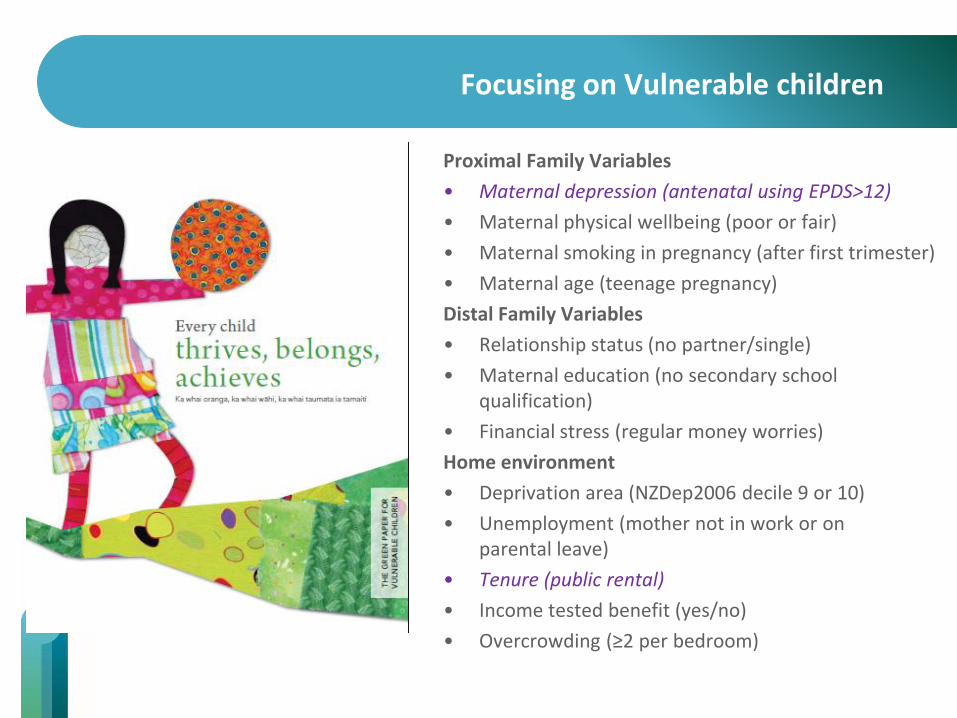
Focusing on Vulnerable children
Proximal Family Variables
• Maternal depression (antenatal using EPDS>12)
• Maternal physical wellbeing (poor or fair)
• Maternal smoking in pregnancy (after first trimester)
• Maternal age (teenage pregnancy)
Distal Family Variables
• Relationship status (no partner/single)
• Maternal education (no secondary school qualification)
• Financial stress (regular money worries)
Home environment
• Deprivation area (NZDep2006 decile 9 or 10)
• Unemployment (mother not in work or onparental leave)
• Tenure (public rental)
• Income tested benefit (yes/no)
• Overcrowding (≥2 per bedroom)
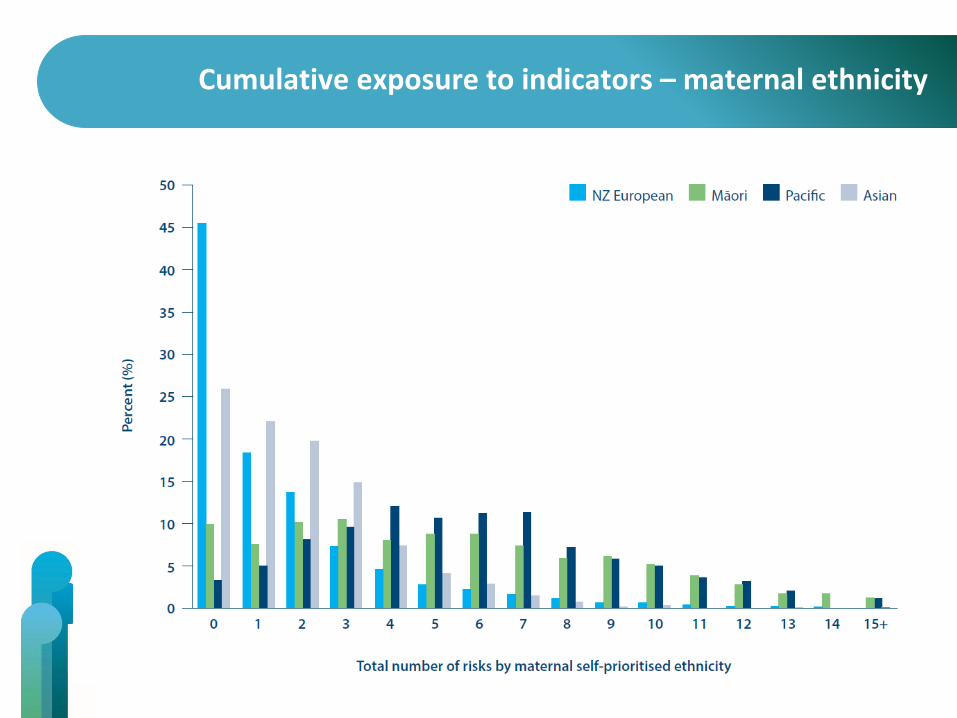
Cumulative exposure to indicators – maternal ethnicity
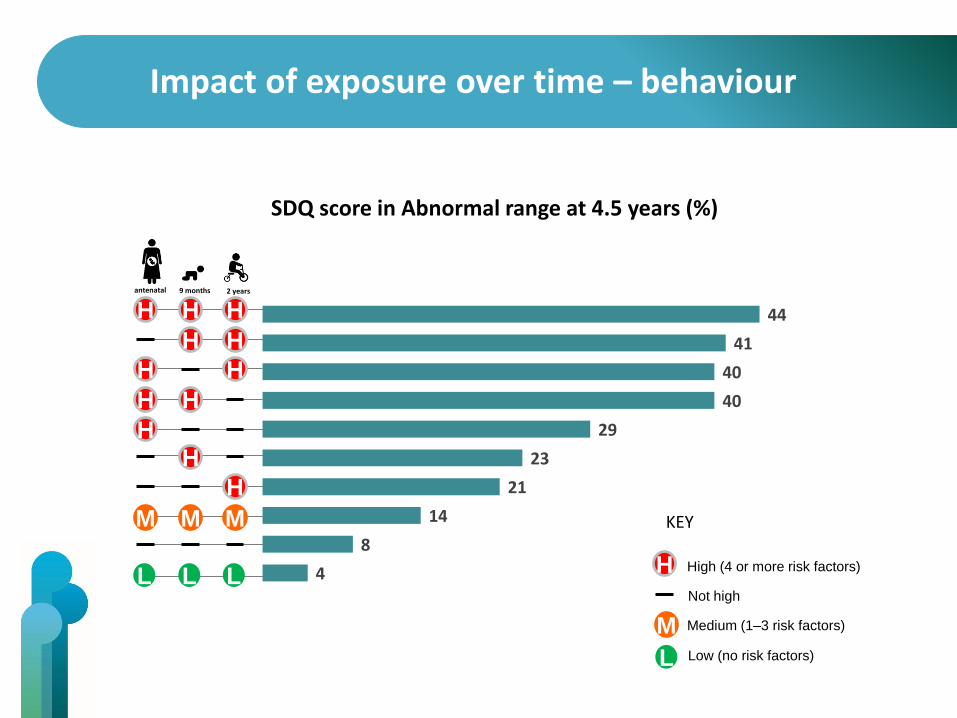
Impact of vulnerability on behavioural (SDQ) scores at4 years SDQ score in Abnormal range at 4.5 years (%)
H HH 44
41
40
40
29
23
21
14
8
4
HH
H H
HH
H
MMM
LLL
H H
antenatal 9 months 2 years
H High (4 or more risk factors)
Not high
M Medium (1–3 risk factors)
L Low (no risk factors)
KEY
Impact of exposure over time – behaviour
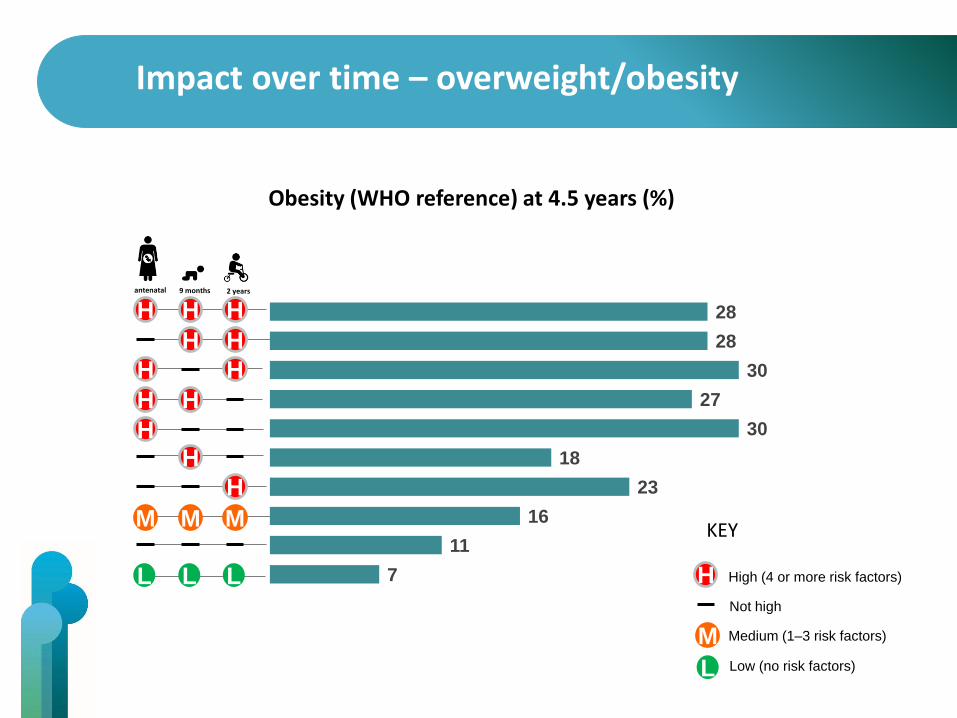
Impact of vulnerability on BMI at 4 years
H HH
HH
H H
HH
H
MMM
LLL
H H
Obesity (WHO reference) at 4.5 years (%)
antenatal 9 months 2 years
28
28
30
27
30
18
23
16
11
7 H High (4 or more risk factors)
Not high
M Medium (1–3 risk factors)
L Low (no risk factors)
KEY
Impact over time – overweight/obesity
Capturing resilience – “what works”
Collaborative partnership between Growing Up in New Zealand and the Southern Initiative (South Auckland) to facilitate the development of a community
intervention programme to promote story-reading and “talking” to the under-2’s– used a co-design process.
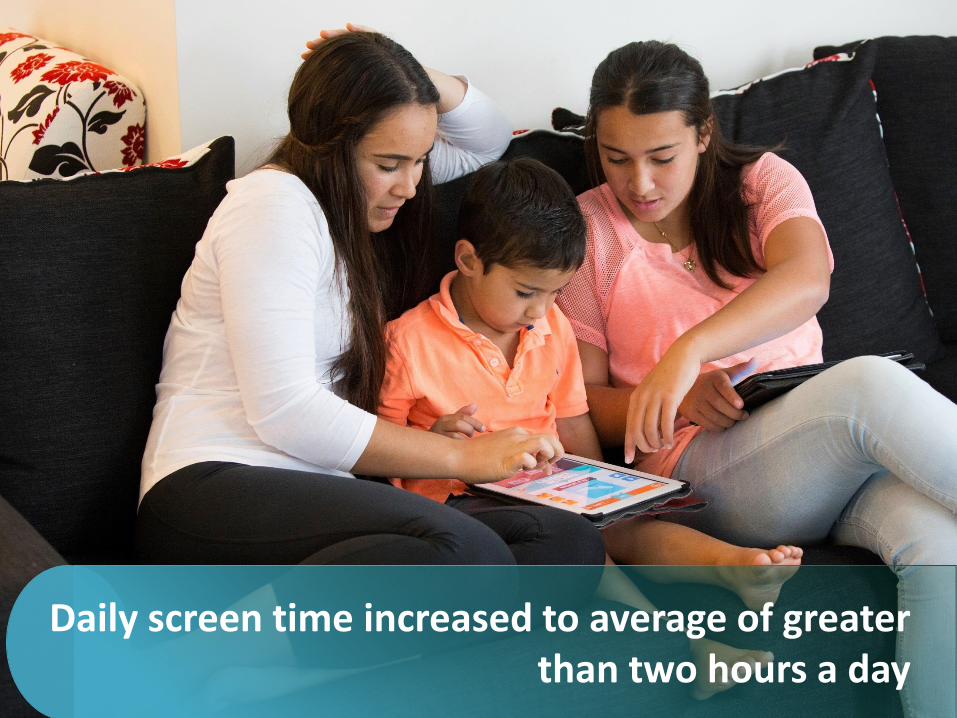
Daily screen time increased to average of greater than two hours a day
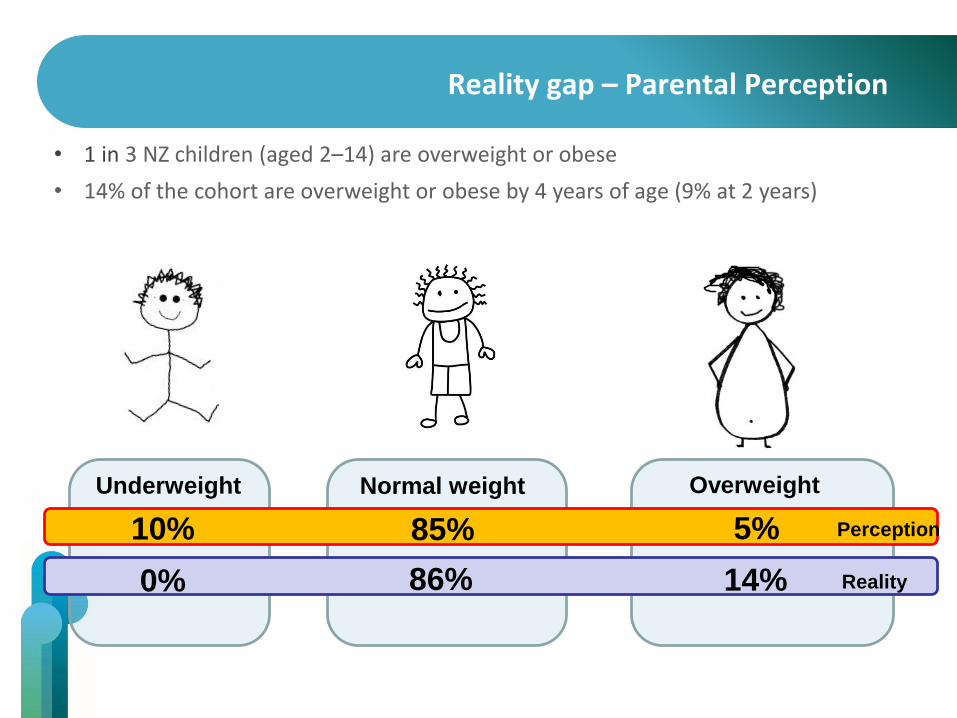
Reality gap – Parental Perception
Underweight Normal weight Overweight
10% 85% 5% Perception
0% 86% 14% Reality
• 1 in 3 NZ children (aged 2–14) are overweight or obese
• 14% of the cohort are overweight or obese by 4 years of age (9% at 2 years)
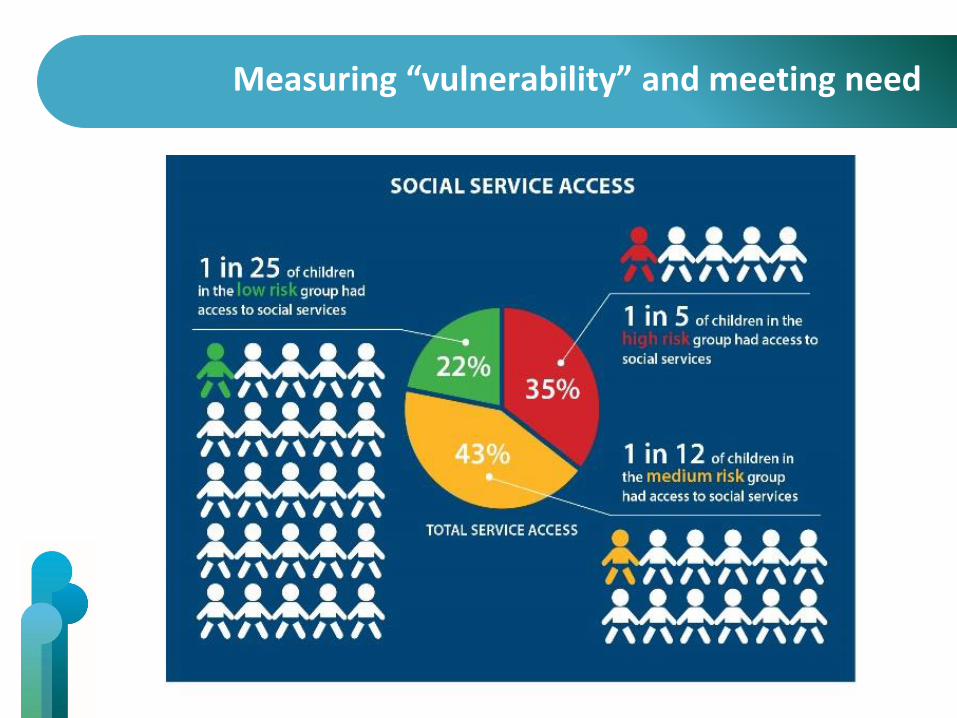
Measuring “vulnerability” and meeting need
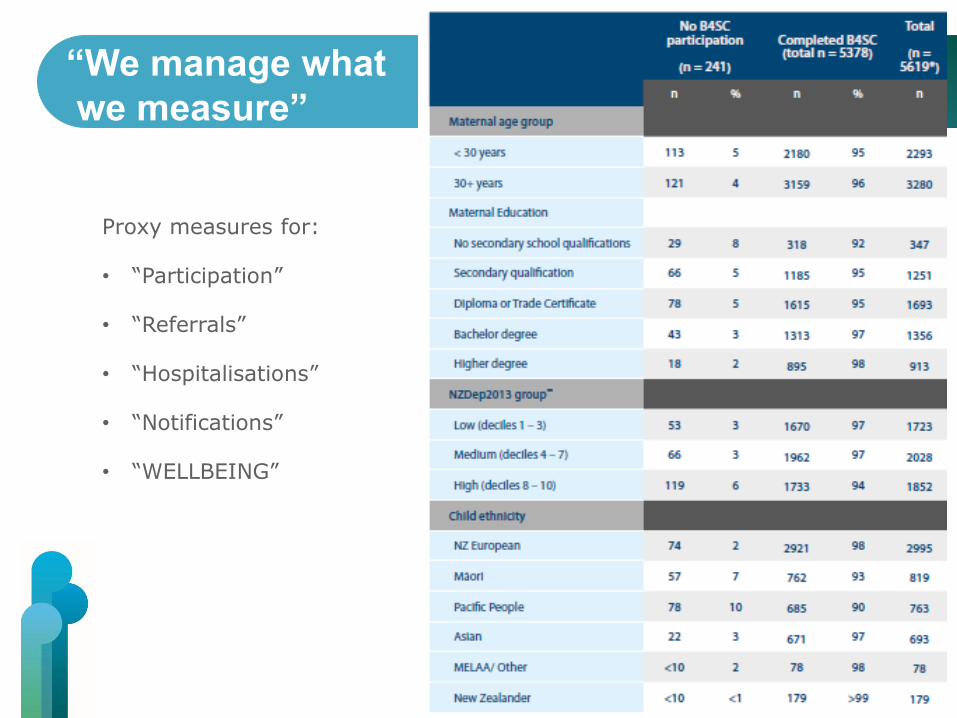
Proxy measures for:
• “Participation”
• “Referrals”
• “Hospitalisations”
• “Notifications”
• “WELLBEING”
“We manage what
we measure”
Context relevant solutions – understanding why and what works for whom, when and where
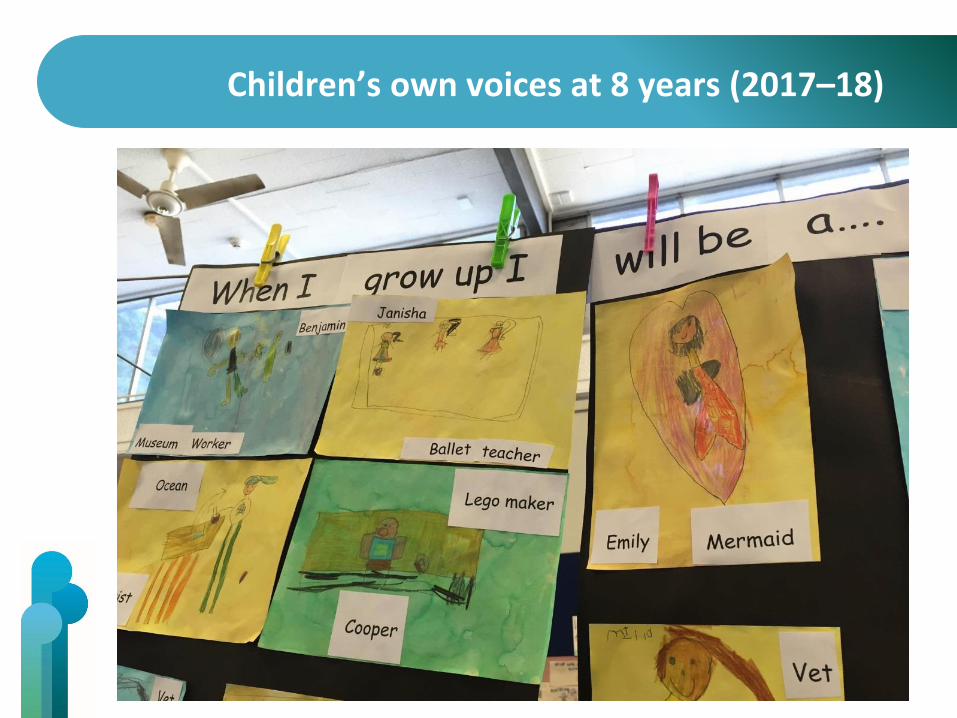
Children’s own voices at 8 years (2017–18)
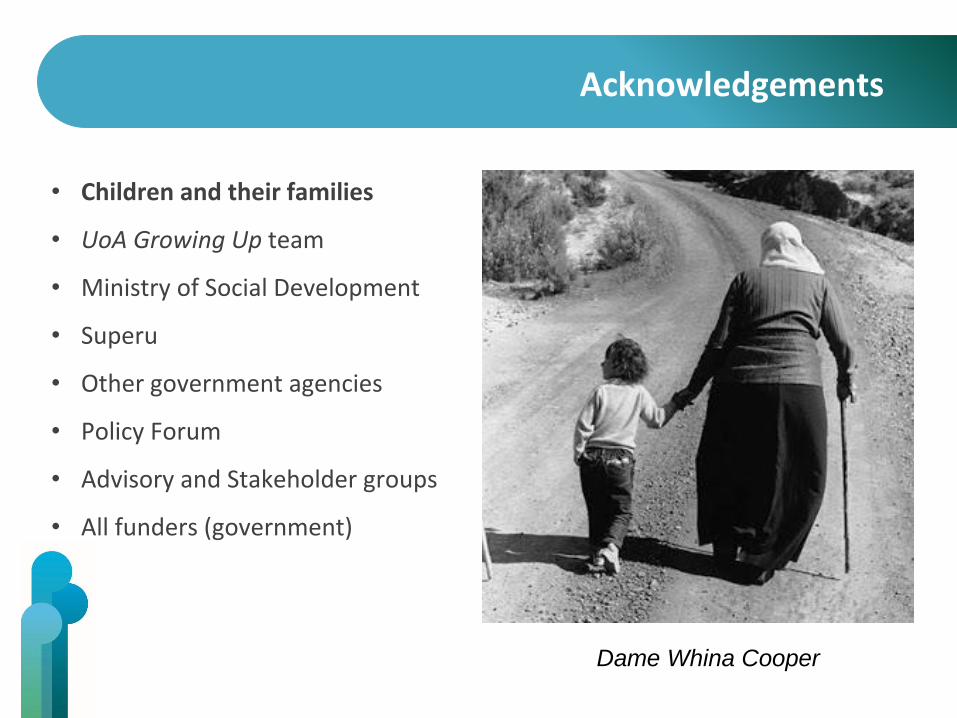
Acknowledgements
• Children and their families
• UoA Growing Up team
• Ministry of Social Development
• Superu
• Other government agencies
• Policy Forum
• Advisory and Stakeholder groups
• All funders (government)
Dame Whina Cooper