negative binomial and mixed poisson regressiondstephens/523/papers/lawless-1987...vol. 15, no. 3,...
TRANSCRIPT

The Canadian Journal of Statistics Vol. 15, No. 3, 1987, Pages 209-225 Lo Revue Canadienne de Statistique
Negative binomial and m i i i Poisson regression Jerald F. LAWLESS
University of Waterloo
Key words and phrases: Count data, efficiency, overdispersion, quasilikelihood,
AMS 1980 subject classifications: 62502,62’712. robustness.
ABSTRACT
A number of methods have been proposed for dealing with extra-Poisson variation when doing regression analysis of count data. This paper studies negative-binomial regression models and examines efficiency and robustness properties of inference procedures based on them. The methods are compared with quasilikelihood methods.
RESUME
Plusieurs mkthodes ont ktk propokes en vue de traiter le probltme de la variation extra- poissonnienne dans une analyse de regression pour donnkes de dknombrement. Cet article a pour objet l’etude de modtles de rkgression binomiale nkgative et se penche sur les propriktks d’efficacite et de robustesse des mtthodes infirentielles dkcoulant des mod&les. Ces dernitres sont comparkes aux mkthodes de quasi-vraisemblancce.
1. INTRODUCTION
Poisson models are widely used in the regression analysis of count data (e.g. Frome, Kutner, and Beauchamp 1973; Frome 1983; Haberman 1974; Holford 1983). At the same time it is recognized that counts often display substantial extra- Poisson variation, or overdispersion, relative to a Poisson model. Consequently there have been both studies of the effect of overdispersion on inferences made under a Poisson model (e.g. Paul and Plackett 1978; Cox 1983), and models proposed for accommodating overdispersion in statistical analysis. In the latter vein, certain types of negative-binomial regression models are perhaps the most convenient to deal with, and have been used by various authors ( e g Engel 1984; Lawless 1987; Manton, Woodbury, and Stallard 1981). Other parametric models have also been suggested (e.g. Hinde 1982), and in addition, analysis based on weighted least squares or quasilikelihood has been advocated (e.g. Breslow 1984, McCullagh and Nelder 1983).
Although negative-binomial regression methods have been employed in analyzing data, their properties have not been investigated in any detail. The purpose of this paper is to study negative-binomial regression models, to examine their properties, and to fill in some gaps in existing methodology. Section 2 introduces the model and reviews maximum-likelihood and moment estimation procedures. In Section 3 the asymptotic covariance matrix for weighted least-squares-moment estimators is obtained, and efficiency and robustness properties of them and of maximum-
209

21 0 LAWLESS Vol. 15, No. 3
likelihood estimators are studied. Section 4 presents some evidence on the adequacy of large-sample approximations. Section 5 discusses significance tests for Poisson assumptions, and Section 6 looks at some illustrative data sets. Section 7 concludes the paper with some additional remarks on the regression analysis of count data.
2. ESTIMATION FOR A NEGATIVE-BINOMIAL MODEL
Let Y be the response variable, which is a count, and x a p x 1 vector of explanatory variables. A Poisson model would stipulate that the distribution of Y given x is Poisson with mean equal to p(x) = Tg(x; p), where g(x; p) is a positive- valued function of x and a vector p of regression parameters, and T is a measure of exposure. We abbreviate this as Y - Poisson(&)). The log-linear specification g(x; p) = exp(x’p) is widely used. Our objective is to study analogous models which can handle extra-Poisson variation. For count data with no covariates, the negative- binomial distribution is popular for this purpose, and its relationship to the Poisson is well known (e.g. Anscombe 1950). The corresponding negative-binomial regres- sion model considered here is
where a 2 0 is often referred to as the index or dispersion parameter. (We remark that a more common parametrization uses k = a-I, and k is also referred to as an index parameter.) The mean and variance of Y are
8 ( Y Ix) = p(x) and % ( Y Ix) = p(x) + ap(x)’. (2.2)
I will write Y - NB(~(x),cz) for this model. In the limit as a goes to 0, (2.1) yields the model Poisson(p(x)), and a = 0 denotes the Poisson case.
The variance-mean relationship embodied in (2.2) often describes data well. More formally, (2.2) arises from a mixed, or random-effects, Poisson model: if v is a positive-valued random variable with mean 1 and variance a, and if the distribution of Y, given v and x, is Poisson(vp(x)), then the marginal mean and variance of Y given x are as in (2.2). Furthermore, when the distribution of v is gamma, the marginal distribution of Y is NB( p(x), a).
Maximum likelihood for (2.1) is implicit in the work of some earlier authors, but I have not found a full discussion of it. Because of this and the desire to compare maximum likelihood and moment estimates below, I review it briefly here. For simplicity and because of its importance I will work with the log-linear model where Y, - NB(p,,a), i = I , . . . , n, are independent, with p, = exp(xl’P). Results for other regression specifications are qualitatively similar. The likelihood function is proportional to
and noting that for any c > 0, r ( y + c)/T(c) = c(c + 1). . . (c + y - 1) if y is an integer 2 1, we can write log L(P, a) as
1987 NEGATIVE BINOMIAL REGRESSION MODELS 21 1
Y:
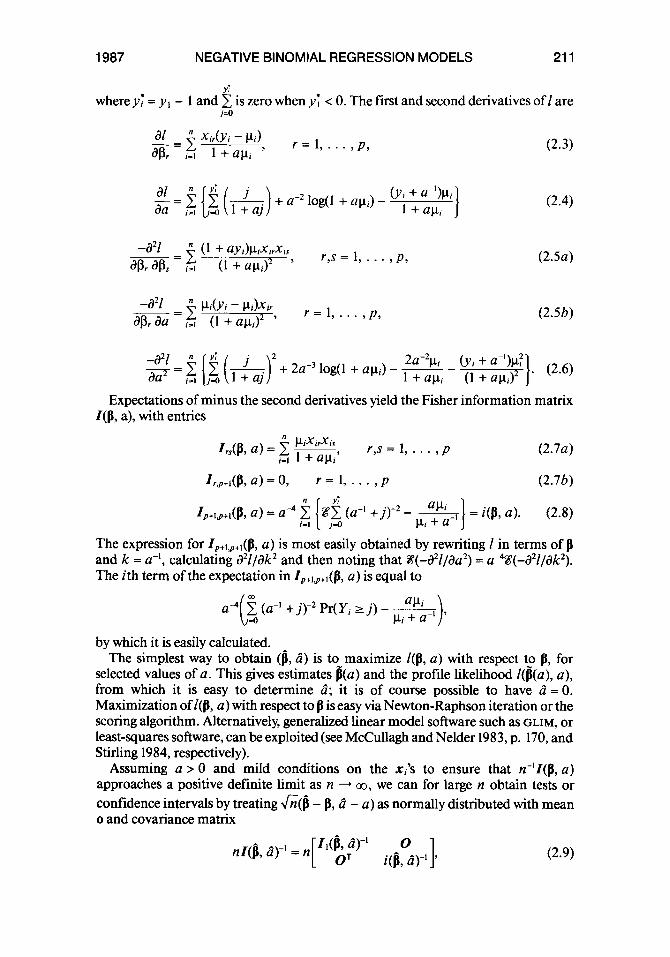
j=O where y ; = yI - 1 and is zero when y’; < 0. The first and second derivatives of 1 are
, r = l , . . . , p , = xir(Yi - pi) apr i- l 1 + api (2.3)
( 2 . 5 ~ )
(2.5b)
Expectations of minus the second derivatives yield the Fisher information matrix Z(p, a), with entries
( 2 . 7 ~ )
Zp+lg+l(B, a ) = a4 %‘I (a-’ +j) -2 - +} i=l j=O pi + a- = i(p, a). (2.8)
The expression for Ip+lg+l(j3, a) is most easily obtained by rewriting 1 in terms of p and k = a-’, calculating d21/akz and then noting that %‘(-dZl/da2) = a4$(-d21/ak2). The ith term of the expectation in Zp+lg+l(B, a) is equal to
by which it is easily calculated. The simplest way to obtain (fi, d ) is to maximize l(p, a ) with respect to p, for
selected values of a. This gives estimates @(a) and the profile likelihood @(a), a), from which it is easy to determine d ; it is of course possible to have a = 0. Maximization of l(p, a) with respect to fl is easy via Newton-Raphson iteration or the scoring algorithm. Alternatively, generalized linear model software such as GLIM, or least-squares software, can be exploited (see McCullagh and Nelder 1983, p. 170, and Stirling 1984, respectively).
Assuming a > 0 and mild conditions on the xi’s to ensure that n-’Z(p, a) approaches a positive definite limit as n - 00, we can for large n obtain tests or confidence intervals by treating &(B - fl, d - a) as normally distributed with mean o and covariance matrix
(2.9)
21 2 LAWLESS Vol. 15, No. 3
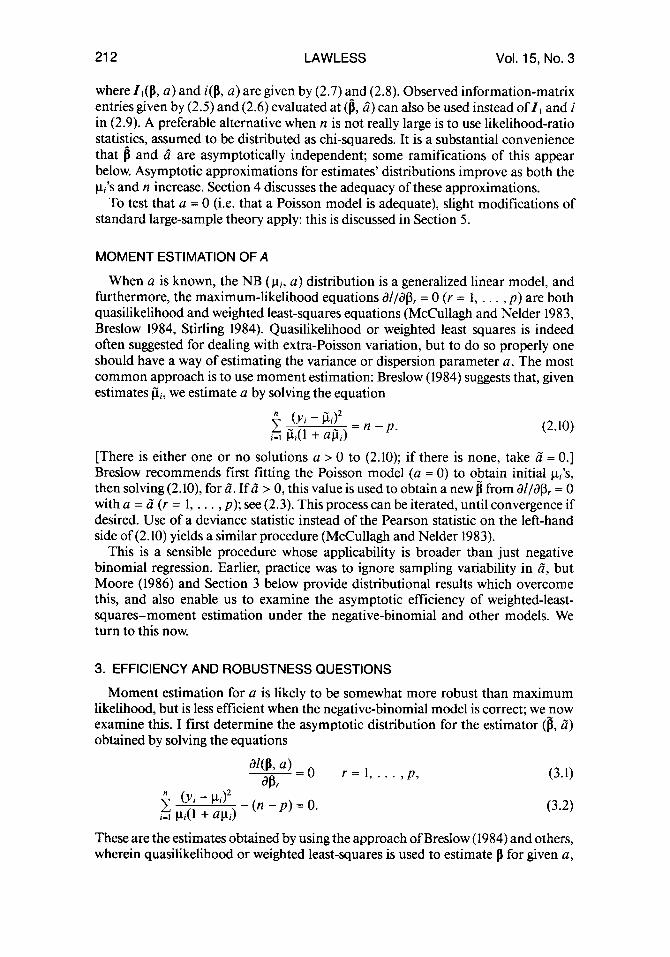
where I ,@, a ) and i(p, a ) are given by (2.7) and (2.8). Observed information-matrix entries given by (2.5) and (2.6) evaluated at (1, Ci) can also be used instead of I , and i in (2.9). A preferable alternative when n is not really large is to use likelihood-ratio statistics, assumed to be distributed as chi-squareds. It is a substantial convenience that 1 and 2 are asymptotically independent; some ramifications of this appear below. Asymptotic approximations for estimates' distributions improve as both the pi's and n increase. Section 4 discusses the adequacy of these approximations.
To test that a = 0 (i.e. that a Poisson model is adequate), slight modifications of standard large-sample theory apply: this is discussed in Section 5.
MOMENT ESTIMATION OF A
When a is known, the NB ( p i , a ) distribution is a generalized linear model, and furthermore, the maximum-likelihood equations all@, = 0 (Y = 1, . . . , p ) are both quasilikelihood and weighted least-squares equations (McCullagh and Nelder 1983, Breslow 1984, Stirling 1984). Quasilikelihood or weighted least squares is indeed often suggested for dealing with extra-Poisson variation, but to do so properly one should have a way of estimating the variance or dispersion parameter a. The most common approach is to use moment estimation: Breslow (1984) suggests that, given estimates pi, we estimate a by solving the equation
(2.10)
[There is either one or no solutions a > 0 to (2.10); if there is none, take a" = 0.1 Breslow recommends first fitting the Poisson model (a = 0) to obtain initial pi's, then solving (2.10), for a". If a" > 0, this value is used to obtain a new p from d l / d p r = 0 with a = a" ( r = 1, . . . , p ) ; see (2.3). This process can be iterated, until convergence if desired. Use of a deviance statistic instead of the Pearson statistic on the left-hand side of (2.10) yields a similar procedure (McCullagh and Nelder 1983).
This is a sensible procedure whose applicability is broader than just negative binomial regression. Earlier, practice was to ignore sampling variability in a", but Moore (1986) and Section 3 below provide distributional results which overcome this, and also enable us to examine the asymptotic efficiency of weighted-least- squares-moment estimation under the negative-binomial and other models. We turn to this now.
3. EFFICIENCY AND ROBUSTNESS QUESTIONS
Moment estimation for a is likely to be somewhat more robust than maximum likelihood, but is less efficient when the negative-binomial model is correct; we now examine this. I first determine the asymptotic distribution for the estimator (p, a") obtained by solving the equations
These are the estimates obtained by using the approach of Breslow (1984) and others, wherein quasilikelihood or weighted least-squares is used to estimate fl for given a,

1987 NEGATIVE BINOMIAL REGRESSION MODELS 21 3
and moment estimation is used for a. The results concerning the distribution of a" have also recently been obtained by Moore (1986), in a more general setting where pi is not necessarily of log-linear form; those for B are already known in connection with quasilikelihood (e.g. McCullagh 1983; McCullagh and Nelder 1983, Appendix C) or weighted least-squares estimation. I give both results, since to get results for a" it's necessary to consider B simultaneously.
Using results of Inagaki (1973), it can be shown that under the same conditions as for the maximum-likelihood asymptotics, 6 and a" are asymptotically independent and normally distributed, with
m - ( G ( B - B)) = zxp, a)-'
adG(6 - a)> = b;:'(cp+' - b'I;(p, a)-%),
(3.3)
(3.4) where I:@, a ) = lim (l/n)Il(P, a ) [see (2.9)] and b = (b l , . . . , bp), with
n-m
b, = lim - 1 ( + 2 y x i . , r = 1, . . . , p , n-m n i= l 1 +
1 " 1 n-m n i=l p;(l + ~1;) '
CP+' = 2 + 6a + lim - 1
The derivation of these results is outlined in Appendix A. In the case where there are no explanatory variables (i.e. p = 1, xil = 1) the expression for @-{&(a" - a)) is 2( 1 + a)( 1 + ~p)~ /p ' , which was given by Anscombe (1950).
The results above indicate that if we proceed as described by Breslow (1984), then the estimator obtained is asymptotically equivalent to the maximum-likelihood estimator @, and its asymptotic covariance matrix is consistently estimated by I , @ , a")-'. There is, however, some loss of efficiency in the estimation of a by a", compared to maximum likelihood. The asymptotic relative efficiency of a" to Ci is given by
(3.5j
where i*(f!, a ) = lim (l/n)i(B, a ) [see (2.8)].
Anscombe (1950) studied the efficiency of a" relative to Ci in the case where there are no covariates, that is, when pi = p(i = 1, . . . , n). He found that for any p, RE of (3.5) approaches 1 as a - 0, and that in most realistic situations, RE is over 0.90. For cases involving covariates this is no longer true: RE does not approach one as a - 0, and lower efficiencies than 0.90 are encountered in many situations. In general, the efficiency tends to be lower in cases where the pi's are not too large and where they vary a good deal (i.e. there is a strong regression effect). Figures 1 and 2 show curves of RE vs. a for several situations, as follows: Figure 1 shows results for three cases: (a) p = 1, p = 10, (b) p = 1, p = 40, (c) p = 2, pi = exp(Po + PlXi), with exp(Po) = 10, PI = 1 and 0.20 of the xi's each of -1, -0.5,0,0.5, 1. Figure 2 shows results
for p = 2, p i = exp(Po + Plxi) and one third of the xi's each of -1 ,O, 1: (a) exp(Po) = 10, P, = 1, (b) exp(Po) = 10, PI = 0.5, (c) exp(Po) = 50, P I = 0.5.
n-m

21 4
1.0 L LAWLESS Vol. 15. No. 3
:::I I I , I I
0.5 a 0.0 0.0 0.1 0.2 0.3 0.4
FIGURE 1: Relative efficiency of Ci(l).
1 .o c
I I I I I 0.0 0. I 0.2 0.3 0.4 0.5 a 0.0 I
FIGURE 2: Relative efficiency of Z(11).
I turn now to the question of robustness: how do the negative-binomial maxi- mum-likelihood or weighted least-squares and moment methods stand up when the negative binomial model is wrong? To study this I consider situations where the regression specification p, = ‘iR( r, 1 x,) = T, exp(xTp) is still correct, but the distribu- tion of r, given x, is not negative-binomial.
I x,) = o;, which may ofcourse depend on x,. Then, using results of Cox (1961), Inagaki (1973), and White (1982), we find (see Appendix B) under mild conditions on the distributions of the Y,’s that as n - co,
Suppose %(
(1) B and are both consistent estimators of b; (2) Ci 3 a: and a“ 3 a;, where a; and a; are nonnegative constants;

1987 NEGATIVE BINOMIAL REGRESSION MODELS
(3) we have
21 5
(3.6) where
(4) we have
a-(&(jj - p), = ZI1B21I1, (3.7) where Z2 and B 2 differ from ZI and B I only in that a; replaces a;.
If we use the negative-binomial model for estimation, we thus will get consistent estimates of b, but will have the covariance matrix wrong in general. (The estimates are of course also less efficient than maximum-likelihood estimates based on the correct model, but that is not our present concern.) The asymptotic covariance matrix we use for &(p - p) is I;(@, $)-I, which converges in probability to Zl(p, a;)-'. The correct asymptotic covariance matrix for &(p - p) is Z:'BIZT', as given by (3.6). Since a; and a; are complicated functions of the negative-binomial estimating equations and the true distribution for Y, it is not obvious how far wrong the variance estimates for 1 or 6 will be, but this can be evaluated numerically in any given situation. I provide an illustration below. I note also that if the form of the variance function is correct, so that
w x I&) = Pl + 4 (3.8) for some a > 0, then it can be shown that a; = a, i.e., that moment estimation gives consistent estimation of a and hence of o;, In this case ZI = Z2 = B2 in (3.7) and so aw{&(@ - p)) = ZI(p, a)-'. Thus, weighted least-squares-moment estimation yields an asymptotically correct covariance matrix for b. This appears to be an advantage of the moment estimator over the maximum-likelihood estimator for a; however, numerical calculations like those below suggest that the asymptotic covari- ance matrix obtained via ri is usually only slightly off. Moore (1985) also suggests through some simulation work that the moment procedure is relatively robust to misspecification of the variance function, as far as estimation of jl in finite samples is concerned.
To study the bias in estimation of a-C&(c - f!)} when the NB model is not correct, but (3.8) is, we note, following Cox (1961) or White (1982) that a; of (3.6) is the solution to
(3.9)
where the expectation is with respect to the true distribution of Y. Furthermore, as indicated above, the correct a- C&(b - p)) is VC = Z I ( ~ , af)-lB~(p, u7)Zl(p, a?)-', whereas the one actually used converges in probability to VNB = Z1(p, a?)-'. It is

21 6 LAWLESS Vol. 15, No. 3
TABLE 1: Comparison of VNB and I+ in a case with no covariates.
5 .5 ,432 0.903 5 . I ,098 0.994
20 .1 .096 0.974 20 .o I .o 100 1.000 50 . I .095 1 0.959 50 .o I .0100 0.999
TABLE 2: Comparison of VNB and Vc in a case with one covariate.
e b a
1 .5 1 . I 1 .o 1
10 .5 10 . I 10 .01 20 .5 20 . I 20 .o 1
.454 ,0989 .0100 .4 13 .0964 .0100 .404 .0957 ,0100
0.974 0.999 1.000 0.862 0.984 1 .ooo 0.83 1 0.974 1 .ooo
vNd2,2)/vC(2,2)
0.970 0.999 1 .ooo 0.863 0.983 1 .ooo 0.833 0.974 1.000
possible to obtain a? of (3.9) numerically in any given situation and thence to compare VNB with Vc. I do this below for some situations where the distribution of Y is a Poisson-inverse Gaussian mixture (e.g. Sichel 1982); this distribution has a longer tail than the negative binomial.
Table 1 shows values of a; and ratios VNB/ Vc for some situations with no covariates (i.e. p = 1, all p, = p). Table 2 shows results for situations with p = 2, p, = exp( Po + P,x,), where PI = 1 and one-third of the x,’s are each of -1,O, 1. It is seen from the two tables that the NB maximum-likelihood procedure underesti- mates the variance of &(fi - p) slightly in large samples. In practical situations quite small values of a tend to occur with larger p,’s, so that in fact the underestimation of asymptotic variances is for practical purposes rather inconsequential.
When %( YJ = of is of a quite different form than (3.8), the asymptotic covari- ance matrix used under the NB model can be substantially off. In practice, however, diagnostic checks are used to assess o f relative to p,, and evidence of gross departures from (3.8) would steer us away from the NB model. The results of this section indicate that, when (3.8) is reasonable, either the full NB maximum-likelihood approach of Section 2 or the combined quasilikelihood-method-of-moments approach can be trusted for inferences about p. In fact, the covariance-matrix estimates based on (3.7) are valid more generally, and apply to quasilikelihood weighted least-squares estimates for any model for which the p, specification and (3.8) are correct.
4. ADEQUACY OF LARGE-SAMPLE APPROXIMATIONS
For tests and confidence intervals based on standard large-sample methods, it is of interest to know about the adequacy in finite samples of the various distributional

1987 NEGATIVE BINOMIAL REGRESSION MODELS 21 7
approximations used. In thesis work currently in progress, C. Dean has examined by simulation the accuracy of asymptotic normal approximations to the distributions of (s, 2) and (c, a"), as given by (2.9), (3.3), and (3.4), and chi-squared approxima- tions for likelihood-ratio statistics. A very brief indication of results, and some rough guidelines, are given here.
Regarding inferences about fl, it appears that likelihood-ratio statistics, with their distributions approximated by x 2 distributions in the usual way, are satisfactory except possibly in very small samples. If the asymptotic standard normal distribu- tions of &(s - fl) or &@ - fl) are instead used, then it appears that the normal approximation for p is somewhat better in smaller samples than that for p, and is generally quite good for samples as small as 25 or 30. Even for sample sizes as big as 80 or 90, the distribution of &I@, a):@ - fl) appears to give slightly too many small negative values, relative to a standard normal distribution. For inferences about the regression coefficients, therefore, the use of likelihood-ratio statistics is preferable for smaller samples, with the use of normal approximations for &(I - fl) also being reasonable. None of the methods, however, are so inaccurate as to affect conclusions in a major way except possibly in very small samples.
For obtaining tests or confidence intervals for a , the likelihood ratio statistic is preferable. When a is close to zero, even it may not be well approximated by its asymptotic xtl, distribution unless n or the values of apt are fairly large. When a is quite close to zero, the normal approximations to the distributions of &(a - a) and &(a" - a) are also poor unless the apt's or n is large. The actual distributions of these quantities have shorter left tails, and longer right tails, than the approximating normal distributions. For testing the hypothesis that a = 0, the limiting distributions of &ri, &a" or the likelihood-ratio statistic have a probability mass of 0.5 at zero: see Section 5 . In this case, unless n or the p,s are quite large, any of the three statistics used with their asymptotic distributions will give significance levels that are too big. This is in large part due to the fact that the proportion of samples in which ri or a" equals zero appears to be well over 0.5 unless n or the p,'s are fairly large.
Table 3 presents a few simulation results for one of the scenarios represented in Table 2: that with one covariate, for which p = 2, eb = 10, and one-third of the pl's are equal to each of 3.7, 10, and 27. The table shows, for selected values of a and n, the proportion of times in 500 simulations that
Z(P,) = &@, - P,)/=(P,)i and Z@,), j = 0, 1, fell outside the 0.05 and 0.01 standard normal limits k1.96 and k2.58, respectively. Similar figures are shown for
Z ( d ) = &(d - a)/=(ri); and Z(a").
Asymptotic variances were based on (2.9) and on (3.3), (3.4) with c, a" used to estimate fl, a. Results are also shown for the likelihood-ratio statistic A(;) = 2@, Ci) - 2I(b(a), a), the figure given being the proportion of times that it exceeded the upper 0.05 and 0.01 percentage points of xtl,. For the cases with a = 0, the modified (half-normal and half-x&) limiting distributions discussed in Section 5 provided the nominal percentage points. The table displays the general qualitative features mentioned above, and provides some feel for the adequacy of the various approximations. I remark that it is rather uncommon to see an U-value as large as 0.5

21 8
a n %Pt
0.5 30 .05 .o 1
90 .05 .o 1
0. I 30 .05 .o 1
90 .05 .o 1
0.01 30 .05 .o 1
90 .05 .o 1
0 30 .05 .o 1
90 .05 .o 1
LAWLESS
Z ( 8 3 Z(Bd Z(Pd Z(Bd Z ( 4 N4 .096 .088 .094 .084 ,126 ,094 ,068 ,028 .024 ,030 ,028 ,016 ,046 ,014 .064 .056 ,068 ,062 .076 ,050 ,052 .016 .o 18 .024 ,020 .022 ,012 ,008 ,112 .064 .084 ,046 ,172 ,102 .062 ,046 .o 18 .024 ,010 ,118 .058 .010 .068 .054 .096 .058 .122 ,096 ,076 .024 .012 ,022 .006 ,054 ,034 ,010
.088 .050 .096 .044 ,000 .002 .008
.026 .008 .022 .004 ,000 .ooo .002
.120 .054 .lo8 .052 ,000 ,006 ,024 ,036 .o 18 .044 ,014 ,000 .ooo ,000
,058 .054 .048 .040 ,042 ,006 .020 ,014 .014 .006 ,006 .012 ,000 ,000 ,040 .038 .046 ,042 ,028 ,020 ,018 .006 .006 .008 .008 .008 ,002 ,008
Vol. 15, No. 3
when the pi’s are in the range represented here, and that with proportions in the table based on 500 samples, standard errors associated with them are about 0.0044 and 0.01 for YoPt. = 0.05 and 0.01, respectively.
The large-sample approximations are reasonably satisfactory; in most situations inferences about t3 will be of main interest, whereas interval estimates for a will not be as major a concern. Approximate confidence intervals for a which are based on the asymptotic xfl, distribution of A(2) should, however, be reliable except when a is close to zero. As a practical guideline, if the confidence interval includes the value a = 0, then we should expect that the right-hand end of the confidence interval is larger than it should be. Finally, tests of the Poisson hypothesis a = 0 will often be of interest; we discuss this in the next section.
5. TESTING A POISSON ASSUMPTION
Poisson regression models are very useful, and it is desirable to have a test of the Poisson assumption. One way to do this is to test that a = 0 within the negative- binomial model. Using results of Moran (1971) which apply to situations where the parameter is on the boundary of the parameter space, we have that when a = 0, the distribution of 2 = &hi@, 0); [see (2.9)] asymptotically has a (half) normal distri- bution for Z > 0 and a probability mass off at 0. Here, 6 is the m.1.e. of fi obtained under a = 0 (i.e. the Poisson model). Alternatively, one can use analogous results of Chernoff (1954), which show that the likelihood-ratio statistic for testing a = 0 is, under the null hypothesis, asymptotically like a random variable which has a probability mass of 4 at 0 and a : x $ distribution above 0.
Investigations described in Section 4 indicate that unless n or the p,’s are very large, the limiting asymptotic distributions just mentioned substantially overesti- mate the significance levels associated with these tests. Another way to test the Poisson model is via a partial-score [- C(a) or Lagrange-multiplier] test of a = 0. For

1987 NEGATIVE BINOMIAL REGRESSION MODELS 21 9
the situation with no covariates it is well known that this procedure leads to the Fisher dispersion test, based on the statistic
Collings and Margolin (1985) extend this to the case of a one-way layout, and to the general case of a single regressor variable. Furthermore, as Collings and Margolin and other authors note, this test arises more generally as a partial-score test for the Poisson model against rather arbitrary mixed Poisson alternatives, of which the negative-binomial is a special case. Dean and Lawless (1987) show that for general regression situations of the type discussed in this paper, where 8( I x i ) = pi = pi(xi, fl), the partial score leads to a test based on the standardized dispersion statistic
In addition, under the hypothesis that the Y,’s are independent Poisson ( pi) random variables, S is asymptotically standard normal. Large positive values of S indicate overdispersion relative to a Poisson distribution; as noted in Section 7, large negative values indicate underdispersion.
On a note of caution, S appears to approach normality rather slowly, and the normal approximation is not recommended unless n is at least 50 or so; work is under way on better approximations. We remark also that S is designed to test for extra-Poisson variation, whereas the familiar Pearson statistic Z ( Y , - fii)’/fii or deviance statistic 2E Y, log (Y , / f i i ) (cf. McCullagh and Nelder 1983, pp. 130- 131) are designed to test for inadequacy of the regression specification pi = pi (x i , fl) within the Poisson framework. It is clear, however, that these and the statistic S are to some extent interchangeable, and a study of their respective abilities to recognize different types of departures from a Poisson regression model is under way. As always, the examination of residuals and influence statistics (e.g. Frome 1983) should supple- ment formal tests.
6. EXAMPLES
Two sets of data will be examined briefly, to illustrate some of the points discussed earlier.
EXAMPLE 1 (Ship damage incidents). The responses Y, are the numbers of damage incidents for 35 individual ships over various five year periods, and the exposures
(i = 1, . . . ,35) are the total months in service for each ship. The yi’s ranged in size from 0 to 58. There are three qualitative factors: ship type (A, B, C, D, or E), year of construction (1960-64, 1965-69, 1970-74, or 1975-79), and period of operation (1960-74 or 1975-79). For the results reported below, binary indicator covariates were used to represent main effects (four for ship type, three for year of construction, one for period of operation, and one for an intercept), and a log-linear specification 8( Y, I x i ) = pi = T,exp(x$) was employed.
These data were analyzed in some detail by McCullagh and Nelder, so I report

220 LAWLESS Vol. 15. No. 3
only on a few points of interest. They fitted a log-linear model with the same p, as above by using quasilikelihood with a variance function %(Y, Ix,) = 02p, . Al- though this is different than the NB-model variance function, both approaches fit the data well; they give the same estimates of regression coefficients, give similar results for inferences about regression effects, and give similar standardized residu- als, using the definitions r , = ( Y , - fi,)/(fi, + dfif); for the NB model and I, =(y, - fi1)/(6'fi,): for the McCullagh-Nelder (MN) model. Briefly, both approaches indicate that main effects are significant, and there is some inconclusive evidence for an interaction of ship type by year of operation.
One point of note concerns the estimates of the variance or dispersion parameters. With the main-effects model, which has p = 9 covariates, the NB maximum likeli- hood gives 6 = 0; on the other hand, the method-of-moments estimate is a" = 0.149, with standard error 0.113. Table 4 shows under (i) and (ii), estimates ofthe regression coefficients and their standard errors, obtained under the two approaches. The estimates and standard errors obtained by McCullagh and Nelder are shown under (iii).
We remark first that although there is not strong evidence of extra-Poisson variation under either the NB or the MN model (i.e. that a > 0 or o2 > 1, respec- tively), which approach one uses has a fairly strong effect on the standard errors of the estimated regression coefficients. This is clearly seen in Table 4; the two estimates d = 0, a" = 0.149 yield quite different standard errors, and the MN standard errors are somewhere in between. In fact, effects under (ii) for ship type or service period do not show up as especially significant, whereas they do under (i) and to a little lesser extent, under the MN analysis, (iii). When n - p is not large (here it is 26), the dispersion parameter may not be estimated very precisely, and different methods can lead to rather different estimates of the standard error.
We remark that there is one fairly large residual, which naturally shows up as more extreme (with a value over 3.5) under analysis (i) than under (ii) or (iii) [e.g., under
TABLE 4: Estimates in the ship-damage example.
Estimates (standard errors)
(i) (ii) (iii) Parameter ci=O(ML) a" = 0.149 (moments) c2 = 1.69 (MN)
Intercept Ship type:
A B C D E
Year of construction:
60-64 65-69 70-74 75-79
60-74 75-79
Service period:
-6.4 1
0 -.54(. 18) -.69(.33) -.08( .29)
.33(.24)
0 .70(.15) .82(. 17) .45( .23)
0 .38(. 12)
-6.45
0 -.49(. 30) -.56(.42) -.11(.40)
.46(. 36)
0 .72(.35) .91(.34) .46(.41)
0 .34(.24)
-6.4 1
0 -.54(.23) -.69(.43) -.08(.38)
.33(.31)
0 .70(.19) .82(.22) .45(.30)
0 .38(. 15)

1987 NEGATIVE BINOMIAL REGRESSION MODELS 221
TABLE 5: Number of revertant colonies of salmonella ( YJ.
Y ,
Obs. x, = 0“ 10 33 100 333 I000
1 15 16 16 27 33 20 2 21 18 26 41 38 21 3 29 21 33 60 41 42
“Dose of quinoline (&plate).
(iii) it is 2.91. This residual is decreased a good deal if an interaction of ship type by year of construction is included, in which case the results of the three analyses also come a little more into line.
EXAMPLE 2 (Ames salmonella assay). Margolin et al. (1981) present data, shown in Table 5, from an Ames salmonella reverse mutagenicity assay; the data were also analyzed by Breslow (1984). The response variable Y is the number of revertant colonies observed on a plate, and covariates are based on x, the dose level of quinoline on the plate. In the assay in question, three observations were taken at each of six dose levels.
I will work with an approximation to Margolin et al.3 “single hit” model which is considered by Breslow; this has
‘iR( Y, Ixi) = pi = exp& + pIxi + pz log(xi + 10)).
Tests of H : p2 = 0 are of special interest, with p2 > 0 representing a mutagenic effect. Fitting the model - NB( pi,a) by maximum likelihood and by weighted least- squares-method of moments, respectively, yields the estimates (standard errors)
Ci = 0.0488 (0.0275), = 2.198 (0.321), = -0.000980 (0.000381), 8 2 = 0.313 (0.0868);
a“ = 0.0718 (0.0303), Pi, = 2.203 (0.359), D l = -0.000974 (0.000430), D 2 = 0.311 (0.0974).
The latter results agree with Breslow (1984). To test H : a = 0 we use the likelihood- ratio statistic R = 248, 6) - 21(8(0), 0), which asymptotically under H has a proba- bility mass of i at 0 and a ixfl, distribution for R > 0. From Section 4 we note that although this asymptotic approximation may not be highly accurate for the situation at hand, the tendency is for the significance level to be overestimated. The observed value of R here is 10.4, which provides strong evidence against the Poisson model. The actual estimates of PO, PI, p2 do not change drastically if the Poisson model (a = 0) is used, but their standard errors do. For example, the value of pz/se(pz) changes from 0.313/0.0868 = 3.6 under the NB model with B = 0.0488 to 0.320/0.057 = 5.6 under the Poisson model. Consequently, the Poisson model overstates the significance of the mutagenic effect.
7. CONCLUDING REMARKS
It is important to have methods of dealing with extra-Poisson variation in regression situations. Mixed Poisson models for which the mean-variance relation- ship is of the form (2.2) provide one way of doing this, and the negative-binomial

222 LAWLESS Vol. 15. No. 3
model discussed in this paper is particularly convenient. It allows the use of standard maximum-likelihood methods, and has good properties. The alternative use of quasilikelihood or weighted least-squares, along with moment estimation of the dispersion parameter a, is also recommended, although it does not allow the easy use of likelihood-ratio statistics that maximum likelihood does. Several authors have investigated maximum likelihood for other mixed Poisson models, for example log- normal (Hinde 1982) and log-student-t (Gaver and O’Muircheartaigh 1987) mix- tures. These are considerably more difficult to handle than the negative-binomial model.
Sometimes the variance-mean relationship 0‘ = %( Y, Ix) = pi + up! implied by a mixed Poisson model may clearly be inadequate. Indeed, many authors in fitting count data have noted that relationships such as 0’ = up! (e.g., Armitage 1957; Finney 1976) and 0’ = upi (e.g., McCullagh and Nelder 1983) often appear plausible. The evidence for such relationships is usually empirical, and in many cases a number of them will provide similar fits to the data. Usually when another variance function than (3.8) is employed, a semiparametric approach to estimation is used, which does not involve the specification of the full distribution for Y given x. Well-known approaches of this kind are quasilikelihood estimation (cf. McCullagh and Nelder 1983, Ch. 8) or weighted least squares, based on solving equations of the form
where the %L’s are weights, preferably equal to consistent estimates of 0 7 ~ . Some of these approaches do not naturally allow for the estimation of nuisance parameters in o?, but approaches such as extended quasilikelihood (Nelder and Pregibon 1987), pseudo-Gaussian estimation (Whittle 1961; Crowder 1985, the double-exponential family models of Efron (1986), and quadratic estimating functions (Crowder 1987; Godambe and Thompson 1987) can handle this. Some such methods have robust- ness advantages over maximum likelihood based on a fully specified model, but can be less efficient, and may be harder to adapt to specific tasks, such as prediction or assessing departures from a base model. Burridge (1986) and Firth (1987) examine some aspects of the gap between semiparametric and fully parametric estimation. Sometimes models with components of dispersion are required. Quasilikelihood or weighted least-squares methods can be adapted to this (e.g., McCullagh and Nelder 1983, p. 225; Crowder 1985), but fully parametric approaches based on NB or other models are also attractive.
Finally, a referee raised a question concerning the models (2.1) when a < 0. It is well known (e.g. Olkin et al. 1981) that by allowing a < 0 one obtains binomial or generalized binomial models, which are underdispersed relative to a Poisson distri- bution. Although the focus of this paper was overdispersion, or extra Poisson variation, I note that some of the discussion in this paper can be extended to the case a < 0. For example, the statistic (5.2) can detect underdispersion, large negative values of S indicating this.
APPENDIX A. THE ASYMPTOTIC DISTRIBUTION OF (b, a) UNDER THE NB MODEL
We suppose that Y, - NB(pl, a) with pi = T, exp(x$), and consider the estimating equations

1987 NEGATIVE BINOMIAL REGRESSION MODELS 223
which when p is fixed are asymptotically equivalent to (2.3), (2.10) as n -, co. Write 8 = (p, a). Then, from results of Inagaki (1973), the estimator 6 = (p, a") obtained by solving the equations above is, under conditions similar to those for which standard maximum-likelihood asymptotics hold, consistent and asymptotically normal with covariance matrix
{hi(& - 8)) = A (e)-IB(e)u (e)-IlT, (A31
where A(8) and B(8) are (p + 1) x (p + 1) matrices with respective entries
Noting that when X - N B (pi,a) we have 8 (K -pi> =0 , 8 ((Y, - pi)')
(1 + 3pi + 6api + 3ap: + 6a2p?), it follows after some algebra that A ( 8 ) and B(8) are the limits, respectively, of
= pi(l + api), ((X - pi)3) = Pi(1 + api)(l + 2api), 8 ((Y, - pi)4> = pi(l + api)
where II(B, a) is as in (2.7) and where b = ( bl , . . . , bJT and e = ( cI, . . . , c,)', with
b, = c, = lim - C fl ( 1 + 2 a p ~ ) x l r
bp+l = lim I 5 (A) cp+l = 2 + 6a + lirn -
r = l , . . . , p , n-m n ,=I 1 + U P ,
n-m n r=l 1 + U P , '
1 " 1 n-m n ,= I pl(l + apI)'
InvertingA(8) and using (A3), we get
where I7 (p, a) = lim (lln) II (fi, a). n-m
APPENDIX B. EFFECTS OF MODEL MlSSPEClFlCATlON
We consider maximum-likelihood estimation under the model Y; - NB( p,, a), when in fact the true distribution of is something else with, however 8( Y;) = pi = TedP correct. Denote % ( Y ; ) = of, 8 = (B, a), and let I(@) = /(p, a ) be the negative-binomial log likelihood. Define (p+l)x(p+l) matrices A (O), B(8) with entries

LAWLESS Vol. 15, No. 3 224
where 1, is the contribution to l(0) from the ith observation (x; x i ) and where expectations here and below are taken with respect to the true distribution ofthe x's.
The results of Cox (1961), Inagaki (1973), and White (1982) can be used to show that under mild conditions the NB maximum likelihood equations d l / d 0 , = 0 ( r = 1, . . . , p + 1) have solutions 6 = (b, 2) which converge in probability as n - co to a vector 8' = (p*, a?), and that & (6 - €J*) is asymptotically normal with covariance matrix
t&(e - e*)> = A(w-iB(e*pqe*)-i. (B2) Furthermore, it can be shown that p* = j3, that is, that b is consistent for p.
Straightforward calculations similar to those in Appendix A then yield
a 4 M B - PN = I d B , a7>-1Bi(p, a?YI(p, (B3) where
For the case of moment estimation of a , the estimating equations (Al), (A2) are used. In this case results are similar to those for the maximum-likelihood equations above, except that the estimating equation dl/d0,+, = d l / d a is replaced by (A2). Thus f, a" converge in probability to €J* = (p;, a;) , and urn C&(f - p;, a" - a;)} is given by (B2). Furthermore, p; = p, so that f is consistent for p, and urn {&(f - p)} is given by (B3), with a; replacing a:. Finally, if o? = pi + a$ for some a > 0, then (A2) is an unbiased estimating equation and a; = a. Thus moment estimation yields consistent estimation of 0' in this case, ZI(p, a ) = Bl(p, a), and so the NB variance estimate zI(f, a")-' for f is asymptotically correct.
ACKNOWLEDGMENTS
Thanks go to Charmaine Dean for computational assistance and to Jim Burridge, Martin Crowder, and Charmaine Dean for helpful discussions. This work was partially supported by a grant from the Natural Sciences and Engineering Research Council of Canada, and part of it was completed while the author was a visitor at Imperial and University Colleges, London.
REFERENCES
Anscombe, EJ. (1950). Sampling theory of the negative binomial and logarithmic series distributions.
Armitage, I? (1957). Studies in the variability of pock counts. J. Hygiene Carnb., 55,564-581. Breslow, N. (1984). Extra-Poisson variation in log-linear models. Appl. Statist., 33, 38-44. Bumdge, J. (1986). Mean-variance relationships, generalized linear models and GLIM. Unpublished. Chernoff, H. (1954). On the distribution of the likelihood ratio. Ann. Math. Statist., 25,573-578. Collings, B.J., and Margolin, B.H. (1985). Testing goodness of fit for the Poisson assumptions when
Cox, D.R. (1961). Tests of separate families of hypotheses. Proc. Fourth Berkeley Syrnp. Math. Statist.
Cox, D.R. (1983). Some remarks on over-dispersion. Biornetrika, 70,269-274. Crowder, M. (1985). Gaussian estimation for correlated binomial data. J. Roy Statist. SOC. Ser B , 47,
Biornetrika, 37,358-382.
observations are not identically distributed. J. Arner. Statist. Assoc., 80,411 -418.
Probab., 105- 123.
229-237.

1987 NEGATIVE BINOMIAL REGRESSION MODELS 225
Crowder, M. (1987). On linear and quadratic estimating functions. Biornetrika, 74,591 -598. Dean, C., and Lawless, J.E (1987). Testing for overdispersion in Poisson regression models. Unpublished. Efron, B. (1986). Double exponential families and their use in generalized linear regression. J. Arne,:
Engel, J. (1984). Models for response data showing extra-Poisson variation. Statist. Neerlandica, 38,159-
Finney, D.J. Radioligand assay. Biornetrics, 32,721 -740. Firth, D. (1987). On the efficiency of quasi-likelihood estimation. Biornetrika, 74,233-245. Frome, E.L. (1983). The analysis of rates using Poisson regression models. Biornetrics, 39, 665-674. Frome, E.L.; Kutner, M.H., and Beauchamp, J.J. (1973). Regression analysis of Poissondistributed data.
Gaver, D.F? and OMuircheartaigh, I.G. (1987). Robust empirical Bayes analysis of event rates.
Godambe, VE, and Thompson, M.E. (1987). An extension of quasi-likelihood estimation. J. Statist.
Haberman, S.H. (1974). The Analysis of Frequency Data. Univ. of Chicago Press, Chicago. Hinde, J. (1982). Compound Poisson regression models. GLZM 82: Proc. Internat. Conf Generalized
Holford, T.R. (1983). The estimation of age, period and cohort effects for vital rates. Biornetrics, 39,311 -
hagala, N. (1973). Asymptotic relations between the likelihood estimating function and the maximum
Lawless, J.E (1987). Regression methods for Poisson process data. J. Arne,: Statist. Assoc., Sept. 1987. Manton, K.G.; Woodbury, M.A., and Stallard, E. (1981). A variance components approach to categorical
data models with heterogeneous cell populations: Analysis of spatial gradients in lung cancer mortality rates in North Carolina counties. Biornetrics, 37,259-269.
Margolin, B.H.; Kaplan, N., and Zeiger, E. (1981). Statistical anayIsis of the Ames salmonella/microsome test. Proc. Nut. Acad. Sci. U.S.A., 76,3779-3783.
McCullagh, F? (1983). Quasi-likelihood functions. Ann. Statist., 11, 59-67. McCullagh, F?, and Nelder, J.A. (1983). Generalized Linear Models. Chapman and Hall, London. Moore, D.E (1985). Ph.D. Thesis, Univ. of Washington, Seattle. Moore, D.E (1986). Asymptotic properties of moment estimators for overdispersed counts and propor-
Moran, PA.€? (1971). Maximum likelihood estimation in non-standard conditions. Proc. Cambridge
Nelder, J.A., and Pregibon, D. (1987). Quasi-likelihood and generalized linear models. Biornetrika, to
Olkin, I.; Petkau, A.J., and Zidek, J.V (1981). A comparison of m estimators for the bionomial
Paul, S.R., and Plackett, R.L. (1978). Inference sensitivity for Poisson mixtures. Biornetrika, 65,591 -602. Sichel, H. (1982). Asymptotic efficiencies of three methods of estimation for the inverse Gaussian-
Stirling, W.D. (1984). Iteratively reweighted least squares for models with a linear part. Appl. Statist., 33,
White, H. (1982). Maximum likelihood estimation of misspecified models. Econornetrica, 50, 1-25. Whittle, F? (1961). Gaussian estimation in stationary time series. Bull. Internat. Statist. Inst., 39, 1-26.
Statist. Assoc., 81,709-721.
167.
J. Arner: Statist. Assoc., 68,935-940.
Technumetrics, 29, 1 - 15.
Plann. Inference, to appear.
Linear Models (R. Gilchrist, ed.), Springer, Berlin, 109- 121.
324.
likelihood estimator. Ann. Inst. Statist. Math., 265,l-26.
tions. Biornetrika, 23,583 -588.
Philos. Soc., 70,441 -450.
appear.
distribution. J. Arne,: Statist. Assoc. 76,637-642.
Poisson distribution. Biornetrika, 69,467-472.
I - 17.
Received 9 October 1986 Revised 18 June 1987 Accepted 18 June 1987
Department of Statistics and Actuarial Science University of Waterloo
Waterloo, Ontario N2L 3G1