negative social interactions and incident hypertension ... · nealey-moore, uchino, williams,...
TRANSCRIPT

Running Head: NEGATIVE INTERACTIONS & HYPERTENSION 1
Sneed, R. S., & Cohen, S. (2014). Negative social interactions and incident hypertension among older adults. Health Psychology, 33(6), 554-565. PMID: 24884909 Copyright 2014 American Psychological Association. This article may not exactly replicate the final version published in the APA journal. It is not the copy of record.
Negative Social Interactions and Incident Hypertension Among
Older Adults

Running Head: NEGATIVE INTERACTIONS & HYPERTENSION 2
Abstract
Objective: To determine if negative social interactions are prospectively associated with
hypertension among older adults.
Methods: This is a secondary analysis of data from the 2006 and 2010 waves of the Health and
Retirement Study, a survey of community-dwelling older adults (age >50). Total average
negative social interactions were assessed at baseline by averaging the frequency of negative
interactions across four domains (partner, children, other family, friends). Blood pressure was
measured at both waves. Individuals were considered to have hypertension if they reported use
of antihypertensive medications, had measured average resting systolic blood pressure ≥ 140
mmHg, or measured average resting diastolic blood pressure ≥90 mmHg. Analyses excluded
those hypertensive at baseline and controlled for demographics, personality, positive social
interactions, and baseline health.
Results: Twenty-nine percent of participants developed hypertension over the four-year follow-
up. Each one-unit increase in the total average negative social interaction score was associated
with a 38% increased odds of developing hypertension. Sex moderated the association between
total average negative social interactions and hypertension, with effects observed among women
but not men. The association of total average negative interactions and hypertension in women
was attributable primarily to interactions with friends, but also to negative interactions with
family and partners. Age also moderated the association between total average negative social
interactions and hypertension, with effects observed among those ages 51-64, but not those ages
≥65.
Conclusion: In this sample of older adults, negative social interactions were associated with
increased hypertension risk in women and the youngest older adults.

Running Head: NEGATIVE INTERACTIONS & HYPERTENSION 3
Keywords: negative interactions; social conflict; older adults; hypertension; Health and
Retirement Study;
Running Head: NEGATIVE INTERACTIONS & HYPERTENSION 4
Numerous studies have evaluated the role of social relationships in cardiovascular
outcomes. Most have focused on structural aspects of social ties, such as social network size
(number of social ties), social network diversity (number of different types of social ties), or
marital status. For example, individuals who are more socially isolated (i.e. have fewer types of
social ties) demonstrate higher resting blood pressure (Bland, Krogh, Winkelstein, & Trevisan,
1991), greater cardiovascular mortality risk (Eng, Rimm, Fitzmaurice, & Kawachi, 2002;
Kaplan, Salonen, Cohen, Brand, Syme, & Puska, 1988; Kawachi, Colditz, Ascherio, Rimm,
Giovannucci, Stampfer, & Willett, 1996), poorer prognosis following myocardial infarction
(Ruberman, Weinblatt, Goldberg, & Chaudhary, 1984) and poorer post-stroke recovery
(Colantonio, Kasl, Ostfeld, & Berkman, 1993) than their less isolated counterparts. Several
studies also link marital status with cardiovascular mortality, with unmarried persons
demonstrating greater mortality risk than married individuals (e.g., De Leon, Appels, Otten, &
Schouten, 1992; Malyutina, Bobak, Simonova, Gafarov, Nikitin, & Marmot, 2004).
Fewer studies, however, have focused on qualitative aspects of social relationships. Of
these, most have concentrated on the positive aspects. For example, individuals who perceive
that they have more social support available from their social networks demonstrate greater
survival after myocardial infarction (Berkman, Leo-Summers & Horwitz,1992), lower incidence
of coronary heart disease (Orth-Gomer, Rosengren, & Wilhelmsen,1993), lower resting blood
pressure (Dressler, Dos Santos, & Viteri, 1986; Uchino, Cacioppo, Malarkey, Glaser, & Kiecolt-
Glaser, 1995; Uchino, Uno, & Holt-Lunstad, 1999), and less cardiovascular reactivity to acute
stress (Kamarck, Manuck, & Jennings, 1990; Lepore, Allen & Evans, 1993; Uchino & Garvey,
1997).

Running Head: NEGATIVE INTERACTIONS & HYPERTENSION 5
The effects of negative aspects of social relationships on cardiovascular outcomes,
however, have received less attention. By negative social interactions, we mean exchanges or
behaviors that involve excessive demands, criticism, disappointment, or other unpleasantness.
Here we focus on the role of negative interactions in risk for hypertension. Up until now,
support for an association of negative interactions with elevated blood pressure has been limited
to a cross-sectional study (de Gaudemaris, Levant, Ehlinger, Hérin, Lepage, Soulat, et al. 2011),
a prospective study predicting self-reported hypertension (Wickrama, Lorenz, Wallace, Peiris,
Conger, & Elder, 2001) and several experimental studies (e.g., Ewart, Taylor, Kraemer, &
Agras, 1991).; Kiecolt-Glaser & Newton, 2001; Smith, Uchino, MacKenzie, Hicks, Campo,
Reblin et al., 2012). Cross-sectional studies provide evidence for an association between
negative interactions and blood pressure, but leave the temporal ordering uncertain. The study of
self-reported disease suffers in that, at best, self-report is a weak marker of objectively verified
hypertension. Finally, experimental studies are limited in that they do not reflect negative
interactions as they are experienced in natural social networks and assess short-term changes in
blood pressure that quickly return to baseline.
The purpose of the current study was to examine the effects of negative social
interactions on the incidence of hypertension, a major risk factor for cardiovascular disease,
stroke, and mortality among older adults. Negative social interactions may be especially relevant
for older adults, since they have smaller social networks and fewer types of social relationships
(Fung, Carstensen, & Lang, 2001), as well as greater (age-related) vulnerability to cardiovascular
disease. The study is prospective, uses objective assessments of blood pressure, pursues a range
of potential mechanisms that may link negative interactions to hypertension, tests whether the
association of negative interactions and onset of hypertension are moderated by sex or by age,

Running Head: NEGATIVE INTERACTIONS & HYPERTENSION 6
and evaluates whether associations are independent of stable individual differences in social
personality traits (e.g., extraversion, agreeableness, hostility, neuroticism) or by levels of positive
interaction.
Mechanisms Linking Negative Interactions to Hypertension
One possible mechanism through which negative social interactions might be linked to
hypertension among older adults is through their effects on psychological well-being. Exposure
to relationships with high levels of adverse exchange and conflict may induce psychological
distress, which has adverse effects on health (Cohen, 2004). Negative social interactions have
been linked to poor psychological outcomes, including greater depressed mood (Ingram, Jones,
Fass, Neidig, & Song, 1999; Lincoln, 2008; Schuster, Kessler, & Aseltine, 1990), decreased
psychological well-being (Finch, Okun, Barrera, Zautra, & Reich, 1989; Rook, 1984; Rook,
1998), and greater risk of major depressive disorder (Lincoln & Chae, 2012; Wade & Kendler,
2000). Depressed mood (Davidson, Jonas, Dixon, & Markovitz, 2000; Rutledge & Hogan,
2002), well-being (Levenstein, Smith, & Kaplan, 2001; Rutledge & Hogan, 2002) and major
depressive disorder (Patten, Williams, Lavorato, Campbell, Eliasziw, & Campbell, 2009) have
all been found to predict hypertension.
Negative social interactions may also be linked to increased hypertension risk through
their effects on health behaviors. By increasing psychological stress, negative social interactions
may promote harmful coping behaviors, including increased tobacco and alcohol use and
physical inactivity (Cohen, 2004. Tobacco use (Bowman, Gaziano, Buring, & Sesso, 2007;
Halperin, Gaziano, & Sesso, 2008); alcohol consumption (Witteman, Willett, Stampfer, Colditz,
Kok, Sacks et al., 1990), and physical inactivity (Paffenbarger, Wing, Hyde, & Jung, 1983) are
established risk factors for hypertension.
Running Head: NEGATIVE INTERACTIONS & HYPERTENSION 7
Effects of Negative Interactions may be Modified by Sex and Age
We were particularly interested in the possibility that negative social interactions might
be most harmful for women. Women are thought to be more sensitive to the quality of their
social interactions, particularly to negative ones. For example, women have more negative
psychological responses to social stress than men (Bakker, Ormel, Verhulst, & Oldehinkel, 2010;
Rudolph, Ladd & Dinella, 2007; Shih, Eberhart, Hammen, & Brennan, 2006), are more bothered
by negative social exchanges than men (Newsom, Rook, Nishishiba, Sorkin, & Mahan, 2005),
demonstrate more cortisol and cardiovascular reactivity to interpersonal laboratory stress
(Kiecolt-Glaser & Newton, 2001; Stroud, Salovey, & Epel, 2002) and have greater
parasympathetic withdrawal in response to interpersonal conflict (Bloor, Uchino, Hicks &
Smith,2004; Smith, Uchino, Berg, Florsheim, Pearce, Hawkins et al., 2009; Smith, Cribbet,
Nealey-Moore, Uchino, Williams, MacKenzie et al., 2011).
We also expected that age might moderate the association between negative social
interactions and hypertension risk. As people age, they decrease the size of their social
networks, possibly to devote more time, attention and emotional resources to relationships with
close friends and family (Carstensen, 1992; Carstensen, 1993; Carstensen, Gotman, & Levenson,
1995; Fung, Carstensen, & Lang, 2001). Having fewer social relationships may exacerbate the
effects of negative interactions, since there would be fewer other network members with whom
one may have positive interactions to buffer the effects of aversive ones.
Alternatively, increasing age may provide protection from the deleterious effects of
negative interactions. As people get older, they adapt to negative aspects of their relationships
and perceive them as less problematic (Akiyama, Antonucci, Takahashi, & Langfahl, 2003;
Hansson, R. O., Jones, W. H., & Fletcher, 1990). There are also age differences in the strategies

Running Head: NEGATIVE INTERACTIONS & HYPERTENSION 8
that individuals use for handling interpersonal difficulties that make older adults less vulnerable
to the adverse effects of negative interactions. For example, Birditt & Fingerman (2005) found
that older adults were more likely to report loyalty strategies (e.g. doing nothing) in response to
interpersonal conflict, while younger adults were more likely to report exit strategies (e.g.
yelling). Similarly, Diehl and colleagues (1996) observed that older people demonstrated more
impulse control, less outward aggression, and more positive appraisals of conflict situations than
younger people.
Alternative Explanations
We include a group of standard control variables because of the possibility that they may
cause or contribute to both the occurrence of negative interactions and risk for hypertension.
These include demographic characteristics (age, sex, marital status, race/ethnicity, education,
employment status), and markers of baseline health (history of chronic illnesses, baseline
systolic/diastolic blood pressure). We also consider the possibility that associations between
negative interactions and health may be attributable to personality characteristics that contribute
to both the quality of interactions and to health outcomes. For example, low extraversion and
agreeableness and high hostility and neuroticism have been associated with both higher levels of
conflictive social relationships (Berry, Willingham, and Thayer, 2000; Brondolo, Rieppi,
Erickson, Bagiella, Shapiro, McKinley, & Sloan, 2003; Lincoln, 2008) and dysregulated
cardiovascular function (extraversion: Miller, Cohen, Rabin, Skoner & Doyle, 1999; Shipley,
Weiss, Der, Taylor & Deary, 2007; agreeableness: Miller, Cohen, Rabin, Skoner, & Doyle,
1999; hostility: Suls & Bunde, 2005; Steptoe & Chida, 2009; Tindle, Chang, Kuller, Manson,
Robinson, Rosal et al., 2009; neuroticism: Shipley, Weiss, Der, Taylor & Deary, 2007).

Running Head: NEGATIVE INTERACTIONS & HYPERTENSION 9
Finally, those with higher levels of negative interactions are likely to also have lower
levels of positive ones (e.g., Okun & Keith, 1998). This inverse correlation leaves the possibility
that what appears to be an association with more negative experiences may in fact be attributable
to having fewer positive ones. Thus, we conduct additional analyses to evaluate the association
between negative social interactions and hypertension controlling for positive interactions.
Methods
Participants and Design
This study is a secondary analysis of data from the 2006 and 2010 waves of the Health
and Retirement Study (HRS), a large-scale longitudinal study of community-dwelling older
adults (aged > 50 years). The HRS sampling methods and study design have been previously
documented (Heeringa, & Connor, 1995; Juster & Suzman, 1995). Briefly, the HRS uses a
national area probability sample of U.S. households; the sample includes individuals aged >50
years and (when applicable) their partners. A total of 18,469 individuals provided data at
baseline (2006 wave). Fifty percent of this sample was randomly selected to participate in
enhanced face-to-face interviews including questions assessing demographics, health status,
health behaviors, negative interactions and psychological well-being. The interview period also
included a blood pressure assessment. Of the participants invited to be interviewed, 7,144
provided interview and blood pressure data at baseline (2006 wave). Of these 6,817 also
provided blood pressure data at the 4-year follow-up. The mean follow-up time was 50.18
months (SD 4.06; range 39-61 months).
From the sample with blood pressure data at both assessments, we excluded all participants who
were hypertensive at baseline, which included those using antihypertensive medications
(n=3,778) and those with baseline blood pressure readings in the hypertensive range (average
Running Head: NEGATIVE INTERACTIONS & HYPERTENSION 10
resting systolic blood pressure ≥ 140 mmHg or average resting diastolic blood pressure ≥90
mmHg; n=1023). Then, we excluded 371 individuals who were missing data on at least one of
our control variables and 1 individual who provided incomplete negative interaction data.
Finally, we excluded 142 individuals who died during the follow-up period. Our final sample
included 1502 participants (Table 1) who were 84.8% Non-Hispanic White, 6.8% Hispanic,
6.5% Non-Hispanic Black, and 1.9% other racial/ethnic backgrounds. Participants were 59.8%
female and ages 51-91 years at baseline (mean age 64.28; SD 8.95). When comparing our
sample to those who provided blood pressure data during the 2006 wave but were excluded, our
sample tended to be younger, employed, more educated, more likely to be nonsmokers, and
married (Table 1). These variables are all well-established associates of hypertension, the
screening variable responsible for over 90% of those not meeting criteria for inclusion in our
analysis. Our sample included a mixture of individuals (80.6%) and of couples who both
participated in the study (19.4%).
Negative Social Interactions
Negative social interactions were assessed in the self-administered psychosocial
questionnaire across four domains: relationships with spouse/partner, children, other family, and
friends (adapted from Krause, 1995). Four questions were used to evaluate negative interactions
in each domain: 1) How often do they make too many demands on you?; 2) How much do they
criticize you?; 3) How much do they let you down when you are counting on them?; and 4) How
much do they get on your nerves? Responses for each question were coded on a 4-point scale
ranging from 1 (not at all) to 4 (a lot). We calculated mean scores for each of the 4 domains
[friends (n=1437; mean=1.43; SD 0.48; range 1-4), partner (n=1141; mean=1.98; SD 0.66; range
1-4), children (n=1360; mean=1.75; SD 0.63; range 1-4), and other family (n=1441; mean=1.62;

Running Head: NEGATIVE INTERACTIONS & HYPERTENSION 11
SD 0.62; range 1-4)] by averaging across item scores within each domain. A domain score was
set to missing if more than two items had missing values in accordance with the scoring
guidelines established by the HRS coordinating center (Clarke, Fisher, House, & Weir, 2008).
To create a total average negative interaction score (range from 1 to 4), we averaged the scores
across the four domains. Total scores were calculated using only scored domains, and only for
those with a score for at least one of the 4 domains. This method for calculating an average
score for this questionnaire has been commonly used in studies of negative social interactions
and health (Friedman, Karlamangla, Almeida, & Seeman, 2012; Newsom, Mahan, Rook, &
Krause, 2008; Seeman, Berkman, Blazer, & Rowe, 1994; Tun, Miller-Martinez, Lachman, &
Seeman, 2013) and reflects the average level of negativity across interaction domains.
Outcome Measure
Blood pressure assessments were performed in both 2006 and 2010 by study staff who
underwent repeated training (Crimmins, Guyer, Langa, Ofstedal, Wallace, & Weir, 2008).
Resting blood pressure values were based on the average of the 3 blood pressure measurements,
45 seconds apart, taken on the respondent’s left arm using an automated blood pressure monitor
(Crimmins et al., 2008). Hypertension was defined as either self-reported use of
antihypertensive medications, or an average resting systolic blood pressure ≥ 140 mmHg, or
average resting diastolic blood pressure ≥90 mmHg (Chobanian, Bakris, Black, Cushman,
Green, Izzo et al., 2003).
Control Variables
Demographics, baseline blood pressure and health, personality variables and positive
social interactions were included as “standard” controls in all analyses. Hours of volunteering

Running Head: NEGATIVE INTERACTIONS & HYPERTENSION 12
(related to hypertension in previous analysis of this data set [Sneed & Cohen, 2013]), also
assessed at baseline, were added in separate analyses. All categorical breakdowns were based on
the original categories from the HRS dataset and were dummy coded in the analyses.
Baseline blood pressure assessments are described in the section on outcome measures.
Demographic controls included age (continuous), sex (male/female), self-reported race
(Non-Hispanic White, Non-Hispanic Black, Hispanic, Non-Hispanic Other), education (less than
high school, high school diploma, General Equivalency Diploma [GED], some college, college
and above), marital status (married, annulled, never married, divorced, separated, widowed), and
employment status (employed/not employed).
Self-reported history of illness included 7 separate dummy coded variables evaluating
history of diabetes (yes/no), cancer (yes/no), heart problems (yes/no), stroke (yes/no), memory
problems (yes/no), arthritis (yes/no) and lung problems (yes/no).
Personality characteristics included cynical hostility, neuroticism, extraversion, and
agreeableness. All were continuous variables assessed at baseline via self-report questionnaire.
Cynical hostility was measured by 5 items from the Cook-Medley Hostility Inventory (Cook &
Medley, 1954) as per HRS protocol. Participants rated the extent to which they agreed with each
item on a scale from 1 (strongly disagree) to 6 (strongly agree). An index of cynical hostility
was created by averaging the scores across all items. Neuroticism, extraversion, and
agreeableness were assessed using 16 adjectives (6 for neuroticism, 5 for extraversion, 5 for
agreeableness) from the Midlife Development Inventory (MIDI) personality scales (Lachman &
Weaver, 1997). Participants rated the extent to which each adjective described them on a scale
ranging from 1 (not at all) to 4 (a lot). Scores for each of these personality characteristics were
created by averaging the scores across the corresponding items.

Running Head: NEGATIVE INTERACTIONS & HYPERTENSION 13
Positive social interactions were assessed as social support and measured in each of the 4
social domains (partner, children, other family, friends). Within each domain, participants
answered the following 3 items on a scale from 1 (never) to 4 (a lot): 1) How much do they
really understand the way you feel about things?; 2) How much can you rely on them if you
have a serious problem?; and 3) How much can you open up to them if you need to talk about
your worries? We created a total average positive social interaction score by averaging
responses to these items across domains. Total scores were calculated using only scored
domains, and only for those with a score for at least one of the 4 domains.
Finally, we assessed self-reported hours of volunteer work in the 12 months prior to
baseline (none, 1 to 49 hours, 50 to 99 hours, 100 to 199 hours, 200 or more). The categories for
volunteerism were pre-established by HRS study staff.
Potential Mediating Variables
The following variables were assessed at baseline and follow-up and tested as potential
mediating variables: alcohol use, tobacco use, physical activity, body mass index, and 9
measures of psychological well-being.
Alcohol use (Witteman et al., 1990), tobacco use (Bowman et al., 2007; Halperin et al.,
2008), and physical activity (Paffenbarger et al., 1983) are all typically associated with blood
pressure. The measures used for evaluating these variables are based on standard instruments
typically used in large-scale epidemiological studies. Alcohol use was based on participant
responses to the following 3 questions: 1) Do you ever drink any alcoholic beverages such as
beer, wine, or liquor?; 2) In the last three months, on average, how many days per week have
you had any alcohol to drink?; and 3) In the last three months, on the days you drink, about how
many drinks do you have? The average number of drinks per week for each participant was

Running Head: NEGATIVE INTERACTIONS & HYPERTENSION 14
determined by multiplying average number of days per week drinking by average number of
drinks per day. Similarly, tobacco use was based on participant responses to the following 2
questions: 1) Do you smoke cigarettes now?; and 2) About how many cigarettes or packs do you
usually smoke in a day now? Responses were used to calculate the average number of cigarettes
per day for each participant, with each pack of cigarettes corresponding to 20 cigarettes.
Physical activity was assessed by questions regarding frequency of participation in
vigorous or moderate sports or activities using these categories: more than once a week, once a
week, one to three times a month, or hardly ever/never. Vigorous activities included the
following examples: running, jogging, swimming, cycling, aerobics, a gym workout, tennis, or
digging with a spade or shovel. Moderate activities included the following examples: gardening,
cleaning the car, walking at a moderate pace, dancing, or floor or stretching exercises. We used
a summary physical activity variable previously used in the English Longitudinal Study of Aging
(McMunn, Hyde, Janevic, & Kumari, 2003) to organize vigorous and moderate physical activity
into 5 ordinal categories ranging from 0 (sedentary) to 4 (active).
We also included body mass index as a potential mediator because it is a marker of
adiposity (Keys, Fidanza, Karvonen, Kimura, & Taylor, 1972) and a risk factor for adverse
cardiovascular outcomes (Wilson, D'Agostino, Sullivan, Parise, & Kannel, 2002). We
hypothesized that negative social interactions may cause changes in health behaviors (e.g. poor
diet, physical inactivity) that might lead to greater adiposity. Body mass index was calculated as
weight in kilograms divided by height in meters squared.
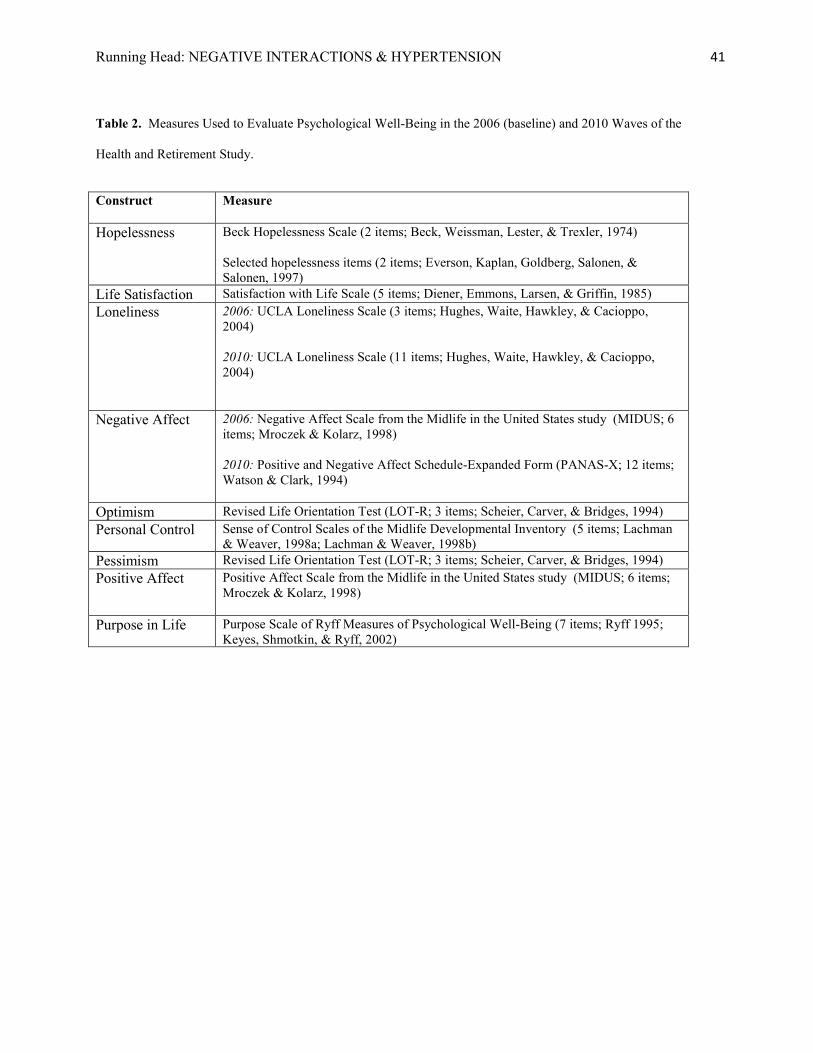
Standard scales representing nine individual psychological constructs (Table 2 ) were
used to measure psychological well-being at baseline and four-year follow-up: personal control,
purpose in life, life satisfaction, positive affect, optimism, loneliness, hopelessness, negative

Running Head: NEGATIVE INTERACTIONS & HYPERTENSION 15
affect, and pessimism. Scores on each measure were determined by averaging the scores across
the individual items. Scores were set to missing if more than 50% of individual items for each
respective measure had missing values.
Statistical Analyses
Our primary analytic strategy focused on evaluating the association between total average
negative social interactions and hypertension risk and on determining the extent to which age and
sex modified the association between negative social interactions and hypertension. A secondary
objective was to identify factors that might mediate the association between negative social
interactions and hypertension. Finally, we performed additional exploratory analyses based on
our initial primary analyses in order to better understand associations between total average
negative social interactions and hypertension risk.
Logistic regression was used to evaluate the relationship between total average negative
social interactions (across all 4 domains) and hypertension. Odds ratios and 95% confidence
intervals (CIs) were used to estimate the risk for each one-unit of increase in the total average
negative interaction score. We also calculated domain-specific odds ratios and 95% CIs to
determine if effects were driven by any particular domain. All odds ratios reflect a change in the
likelihood of developing hypertension for every one-unit increase in the negative interactions
scale (range 1 to 4).
To evaluate the extent to which the potential mediating variables linked negative social
interactions with hypertension, we used the PROCESS macro (Hayes, 2013), a computational
tool for path analysis-based mediation analysis with dichotomous outcomes. This analytical
method uses a logistic regression-based approach to estimate direct and indirect effects in
multiple mediator models. Bootstrap methods are used to draw inferences about indirect effects.

Running Head: NEGATIVE INTERACTIONS & HYPERTENSION 16
We standardized the average scores for all of the psychological variables, and tested for
mediation in three ways: 1) using baseline values of each individual mediator, 2) using values of
each individual mediator at follow-up, and 3) evaluating residual change (entering both baseline
and follow-up) in each potential mediator from baseline to follow-up. With each approach, the
potential mediators were entered into the model both individually and simultaneously.
Mediation was supported if addition of these covariates substantially reduced the association of
negative social interactions with hypertension (Sobel, 1982).
To determine if either age or sex moderate the associations observed between negative
social interactions (across all 4 domains and within each domain) and hypertension, we used
first-order cross product terms for total average negative social interactions and these proposed
modifier variables. Interaction terms were entered into individual regression equations with the
corresponding main effects and control variables.
Finally, since our sample included a mixture of individuals and couples, it is possible that
interdependence of data for partners might bias the results. To address this, we reanalyzed our
data including all individual participants in addition to a randomly selected member of each
couple (selected using a random sequence generator). This resulted in a reduction of power
(decreased sample size from 1502 to 1356) but eliminated the possibility of correlated partner
responses. We then repeated the analyses using the other member of each couple in the sample.
Results
Control Variables and Hypertension

Running Head: NEGATIVE INTERACTIONS & HYPERTENSION 17
Of the 1502 study participants included in our analyses, 445 (29.6%) were hypertensive
at follow-up. When entered into the logistic regression model simultaneously, the following
standard control variables were related to increased hypertension risk: older age: (B=.03,
p=<.001), Hispanic ethnicity (compared to Non-Hispanic Whites; B=0.79; p=.001), self-reported
history of diabetes (B=0.52; p=.008), greater average baseline systolic (B=0.04; p<.001) and
diastolic blood pressure (B=0.03; p=.003) and higher levels of agreeableness (B=0.38; p=.03).
Having less than a high school education was associated with decreased hypertension risk (B=-
0.75; p=0.04). The other covariates were not related to hypertension risk.
Negative Interactions and Hypertension
The mean total average negative interaction score for study participants was 1.67 (SD=
0.45; Table 3). In a regression including the standard covariates, total average negative
interactions across the 4 domains predicted greater hypertension risk (Table 3; OR: 1.38; 95%
CI: 1.00-1.89). Given that hours of volunteer work were related to hypertension risk in a
previous analysis of this data set (Sneed & Cohen, 2013), we performed additional analyses
simultaneously entering volunteerism and total average negative social interactions into a
regression model, adjusting for our standard controls. Here, total average negative social
interactions were independently associated with greater hypertension risk (OR: 1.39; 95% CI:
1.01-1.91). Further, even after adjusting for negative interactions, those who volunteered at least
200 hours per year were less likely to develop hypertension than nonvolunteers (OR: 0.57; 95%
CI: 0.36-0.89).
We were also interested in whether the association between negative interactions and
hypertension was driven by negative interactions in any particular social domain. Domain-
specific analyses demonstrated that negative interactions were associated with increased

Running Head: NEGATIVE INTERACTIONS & HYPERTENSION 18
hypertension risk when examining relationships with one’s friends (Table 3; OR 1.36; 95% CI:
1.04-1.78), and family other than children or partner (Table 3; OR: 1.33; 95% CI: 1.07-1.65).
There were no main effects of negative interactions with children (Table 3; 1.01; 95% CI: 0.80-
1.28) or partner (Table 3; OR 1.15; 95% CI: 0.90-1.48) on hypertension.
Sex and Age as Modifiers
We also evaluated how sex and age might modify the association between total average
negative interactions and hypertension risk. We found that sex moderated the association
between the total average negative interaction score and hypertension (Figure 1; B=0.7; p=.02).
The relationship between the total average negative interaction score and hypertension was not
observed among men (OR: 0.88; 95% CI=0.50-1.53), but was pronounced among women (OR:
1.87; 95% CI: 1.25-2.79). In domain-specific analyses, we observed that sex moderated the
association between negative interactions with friends and hypertension (B=0.93; p<.001).
Among men, there was no association between negative friend interactions and hypertension
(OR: 0.69; 95% CI: 0.43-1.12). Among women, however, negative interactions with friends
predicted increased hypertension risk (OR: 2.15; 95% CI: 1.51-3.08). Similar, but
nonsignificant patterns were found for the interactions of sex and negative interactions with
partner (B=0.31; p=0.15) and family (0.37; p=.07), but not children (B=.11; p=.61).
Age also moderated the association between total average negative social interactions and
hypertension (B=-0.03; p=.02). There was no association between total average negative social
interactions and hypertension among participants aged ≥ 65 years (OR: 1.16; 95% CI: 0.72-
1.86). Among those ages 51-64, however, total average negative social interactions were
associated with increased hypertension risk (OR: 1.67; 95% CI: 1.06-2.62). In domain-specific
analyses, we observed that age moderated the association between negative partner interactions

Running Head: NEGATIVE INTERACTIONS & HYPERTENSION 19
and hypertension (B=-0.03; p<.01). Further analyses suggest that the effects of negative partner
interactions were most potent for the youngest participants. Similar, but nonsignificant patterns
were found for the interactions of sex and negative interactions with children (B=-0.02; p=0.08)
and family (-0.12; p=.18), but not friends (B=-.006; p=.71).
Finally, we tested the three way interaction of age, sex, and negative interactions by
entering it into a model with all the main effects and 2-way interactions. There was no three-way
interaction of these variables in predicting hypertension (B=.009; p=0.31).
We considered the possibility that blood pressure measurements from study participants
might be artificially inflated due to the white coat effect (i.e. spuriously high blood pressure
readings in response to the clinical environment; Mancia, Grassi, Pomidossi, Gregorini,
Bertinieri, Parati et al., 1983; Mancia, Parati, Pomidossi, Grassi, Casadei, & Zanchetti, 1987).
To account for this, we repeated our main analyses by dropping the first blood pressure reading
and averaging the last 2 readings. In doing so, there is no longer a main effect of total average
negative interactions (OR: 1.15; 95% CI: 0.83-1.59) or friend interactions (OR 0.81; 95% CI
0.61-1.06). .The remaining results were the same for negative family interactions (OR 0.80;
95% 0.64-1.00), and there was still no association between negative partner (OR 0.87; 95% CI
0.68-1.11) or child (OR 1.07; 95% CI 0.85-1.36) interactions. The effects of negative social
interactions were still similarly modified by sex (B=0.66; p=0.03) and age (B=-0.03; p=0.03).
Accounting for Partners in Same Analysis
To address the issue of interdependence of date for partners, we reanalyzed our data
including all individual participants in addition to a randomly selected member of each couple.

Running Head: NEGATIVE INTERACTIONS & HYPERTENSION 20
We observed virtually identical results with total average negative interactions associated with
increased hypertension risk (OR: 1.42; 95% CI: 1.02-1.98) and statistical interactions of negative
social interactions by sex (B=0.72; p=.02) and age (B=-.03; p=.04). As in the analysis of the
entire sample, total average negative social interactions were associated with hypertension risk
among women (OR: 1.93 ; 95% CI: 1.27-2.94) but not men (OR: 0.90; 95% CI: 0.49-1.63) and
among those ages 51-64 (OR: 1.76; 95% CI: 1.09-2.84) but not those 65 and older (1.11; 95%
CI: 0.68-1.81). We repeated the analyses using the other member of each couple in the sample
and again found that total average negative interactions predicted greater risk for hypertension
(OR: 1.42; 95% CI: 1.02-1.96) and that age (B=-.04; p=.02) and sex (B=0.71; p=0.02) interacted
with negative interactions in the same manner as described above . Total average negative social
interactions were associated with increased hypertension risk among women (OR: 1.86; 95% CI:
1.23-2.81) but not men (OR: 0.93; 95% CI: 0.52-1.66) and among those ages 51-64 (OR: 1.64;
95% CI: 1.03-2.61) but not those 65 and older (OR: 1.22; 95% CI: 0.75-1.98).
Mediation
Finally, we explored factors that might mediate the association between negative
interactions and hypertension risk, conducting separate mediation analyses for the entire sample,
for women and for participants ages 51-64. There were no indirect effects of negative social
interactions on hypertension through any of our potential mediators (body mass index, alcohol
use, tobacco use, physical activity, or the 9 individual measures of psychological well-being).
Discussion
We found that total average negative social interaction scores were associated with
increased hypertension risk in a sample of community-dwelling adults aged >50 years.
Running Head: NEGATIVE INTERACTIONS & HYPERTENSION 21
Specifically, each one-unit increase in an individual’s score resulted in a 38% increased odds of
hypertension over a 4-year follow-up. This association persisted even after controlling for
demographics, personality variables, and positive social interactions. Importantly, this
association was independent of volunteerism, which had been associated with decreased
hypertension risk in a previous analysis of this dataset (Sneed & Cohen, 2013). Both negative
social interactions and volunteerism exerted distinct, independent effects on hypertension risk
when evaluated simultaneously. Our findings are consistent with literature linking acute negative
social interactions to short-term elevated blood pressure responses in younger adults (Ewart et
al., 1991; Kiecolt-Glaser & Newton, 2001; Smith et al., 2012) and suggest that negative
interactions may contribute to long-term alterations in blood pressure regulation.
Total average negative interaction scores predicted hypertension risk among women, but
not among men. This association was driven primarily by women’s negative interactions with
friends, and to a lesser degree, partners and family. There are several possible reasons why
women but not men were more impacted by negative relationships. There is evidence that
women care more about and pay more attention to their social interactions (Coriell & Cohen,
1995) and have greater expectations of their social relationships than men. In a study of older
adults ages 50-97 years, Felmlee & Muraco (2009) observed that women demonstrated greater
disapproval of behavior that violated friendship rules, such as betrayal of confidence, failure to
confide in them, or not standing up for them when someone criticized them. These greater
expectations may lead to greater distress among women when such relationship expectations are
not met. Further, women report more intimacy, closeness and self-disclosure in their social
relationships than men (Sheets & Lugar, 2006; Singleton & Vacca, 2007). This greater intimacy
may intensify reactions to conflict when it arises (Crick, 1995; Crick & Grotpeter, 1995).

Running Head: NEGATIVE INTERACTIONS & HYPERTENSION 22
Finally, women and men often have different strategies for responding to and resolving conflict.
In laboratory marital conflict discussions, for example, women are more likely to confront the
conflict directly, whereas men tend to withdraw (Carstensen, Gottman & Levenson ,1995). This
difference in conflict management style may also have implications for cardiovascular response
to aversive social situations.
We also found that age moderated the association between negative social interactions
and hypertension risk, with effects observed among younger (approximately 51 to 64 years) but
not older (>65 years) participants. These findings suggest that negative social interactions are
particularly potent for the “sandwiched generation”, those within the later years of midlife who
typically bear responsibility for both their own children as well as aging parents. Negative
social interactions may only exacerbate the adverse effects of existing life stressors among
individuals in this age group. Our observation that negative social interactions were not related to
hypertension risk among the oldest participants (≥65 years) is consistent with evidence that, as
people get older, they may adapt to negative aspects of their relationships and perceive them as
less problematic (Akiyama et al., 2003). It is also possible that the oldest adults have more
adaptive strategies for handling interpersonal difficulties that render such interactions less potent
with respect to hypertension risk.
We also found no main or interaction effects linking negative interactions with children
to hypertension. This is consistent with recent evidence from the MacArthur Study on Successful
Aging where regular interactions with spouse and other family members were associated with
pulmonary health in older adults, but interactions with children were not (Crittenden, Pressman,
Cohen, Smith, & Seeman, unpublished manuscript). It is possible that individuals in this age
group have lower expectations of their children than they do of other members of their social
Running Head: NEGATIVE INTERACTIONS & HYPERTENSION 23
networks. Studies have shown that adult children are willing to provide more support to their
parents than their parents expected (Hamon & Blieszner, 1990; Silverstein, Chen, & Heller,
1996). Parents may also have schemas about the nature of the parent/child relationship that lead
them to expect more difficult relationships with their children. They may also have greater
insight into their children’s behaviors and use this to justify negative interactions in ways that
reduce psychological distress. Finally, parents may simply have less face-to-face contact (or
contact of any kind) with their children than with other members of their social networks, thus
limiting the potential impact of any negative social interactions.
We found no psychological or behavioral explanations for the association between
negative interactions and hypertension risk. It is possible that our findings may be explained by
factors that were not measured in this study. For example, negative social interactions may
increase maladaptive health behaviors linked to hypertension risk, such as poor sleep quality
(Gangwisch, Heymsfield, Boden-Albala, Buijs, Kreier, Pickering et al., 2006) or unhealthy
nutritional habits (Reddy & Katan, 2004). Our measure of physical activity also may not have
been ideal for evaluating activity levels among the participants. Self-report questionnaires
gauging moderate and vigorous activity may not be adequate measures of physical activity
among elderly individuals, since most physical activity performed by older adults involves
walking in the context of regular daily activities rather than a formal exercise regimen (Walsh,
Rogot, Pressman, Cauley, & Browner, 2004). More sensitive, objective measures of physical
activity (e.g. accelerometry) might be more useful in this population. There may also be
physiological explanations for our findings. For example, acute conflictive social interactions
are associated with short-term increases in blood pressure, greater parasympathetic withdrawal,
activation of the sympathetic nervous system and the hypothalamic pituitary adrenal axis, and

Running Head: NEGATIVE INTERACTIONS & HYPERTENSION 24
increased production of inflammatory cytokines (Kiecolt-Glaser & Newton, 2001). Sustained
negative social interactions may cause long-term wear and tear in these physiological systems
(allostatic load), leading to an inability to effectively regulate blood pressure (McEwen, 1998).
Future research should explore how additional behavioral factors (e.g. sleep habits, physical
activity, diet) and physiological indicators (e.g increased sympathetic nervous system activity)
may mediate the association between negative social interactions and hypertension.
This study is not without limitations. Although the study sample is drawn from a larger,
nationally representative sample of older adults, the individuals who met the inclusion criteria for
this study were, in some ways, demographically different from the larger HRS sample.
Consequently, we do not employ the weighting and sampling design adjustments often used to
analyze HRS data (Heeringa & Connor, 1995). Thus, these findings should not be interpreted as
being representative of the U.S. population of older adults. Our findings, however, are consistent
with other work linking negative social interactions to adverse health outcomes (De Vogli,
Chandola, & Marmot, 2007; Krause, 2005). Further, the main effects of negative social
interactions were no longer significant when we reanalyzed the data by dropping the first blood
pressure reading. These analyses, however, reinforce the importance of negative social
interactions with family (irrespective of participant sex) and suggest that negative interactions
with friends mostly matter for women.
The negative interaction questionnaire assesses four social domains (partner, friends,
children, other family members) that are all traditionally considered to be close relationships.
People maintain fewer peripheral relationships as they grow older (e.g., Fung, Carstensen &
Lang, 2001), devoting more attention to relationships with close friends and family. Hence, the

Running Head: NEGATIVE INTERACTIONS & HYPERTENSION 25
measure used here reflects the largest and closest components of the social network in this age
group, making negative social interactions in these domains particularly salient.
This study is the first to prospectively evaluate negative social interactions as a predictor
of the onset of hypertension. The negative interactions reflect experiences in natural social
networks. The work includes controls for multiple alternative explanations for the results,
including the first test of the role of stable individual differences that could contribute to both the
occurrence of negative interactions and the onset of hypertension. It is also the first study of
negative interactions and hypertension to control for the potential overlap with positive social
interactions. Finally, it suggests that a range of predicted mediators do not play a role in this
association for this older sample.
Our sample included individuals ages 51-91 at baseline (mean age 64.28; SD 8.95).
Hypertension risk increases with age, with rates reaching 70% by age 65 (McDonald, Hertz,
Unger & Lustik, 2009). Thus, individuals from our sample were particularly at risk for
developing hypertension during the follow-up period. In fact, 29% of the sample developed
hypertension over the four-year follow-up. Given that hypertension is a major risk factor for
diseases of aging, including cardiovascular disease (the number one cause of death in the United
States), stroke, and mortality, the association of negative social interactions with increased
hypertension risk has important public health significance. Further, interpersonal conflict is one
of the most frequently reported types of chronic stress; thus, it is particularly important to
understand the role of interpersonal strain in health outcomes such as hypertension.

Running Head: NEGATIVE INTERACTIONS & HYPERTENSION 26
References
Akiyama, H., Antonucci, T., Takahashi, K., & Langfahl, E. S. (2003). Negative interactions in
close relationships across the life span. The Journals of Gerontology Series B: Psychological Sciences and Social Sciences, 58, P70-P79.
Bakker, M. P., Ormel, J., Verhulst, F. C., & Oldehinkel, A. J. (2010). Peer stressors and gender
differences in adolescents' mental health: the TRAILS study. Journal of Adolescent Health, 46, 444-450.
Beck, A. T., Weissman, A., Lester, D., & Trexler, L. (1974). The measurement of
pessimism: The hopelessness scale. Journal of Consulting and Clinical Psychology,
42, 861-865. Berkman, L. F., Leo-Summers, L., & Horwitz, R. I. (1992). Emotional support and survival after
myocardial infarctiona prospective, population-based study of the elderly. Annals of Internal Medicine, 117, 1003-1009.
Berry, D. S., Willingham, J. K., & Thayer, C. A. (2000). Affect and personality as predictors of
conflict and closeness in young adults' friendships. Journal of Research in Personality, 34, 84-107.
Birditt, K. S., & Fingerman, K. L. (2005). Do we get better at picking our battles? Age group
differences in descriptions of behavioral reactions to interpersonal tensions. The Journals of Gerontology Series B: Psychological Sciences and Social Sciences, 60, P121-P128.
Bland, S. H., Krogh, V., Winkelstein, W., & Trevisan, M. (1991). Social network and blood
pressure: a population study. Psychosomatic Medicine, 53, 598-607. Bloor, L. E., Uchino, B. N., Hicks, A., & Smith, T. W. (2004). Social relationships and

Running Head: NEGATIVE INTERACTIONS & HYPERTENSION 27
physiological function: The effects of recalling social relationships on cardiovascular reactivity. Annals of Behavioral Medicine, 28, 29-38.
Bowman, T. S., Gaziano, J. M., Buring, J. E., & Sesso, H. D. (2007). A prospective study of
cigarette smoking and risk of incident hypertension in women. Journal of the American College of Cardiology, 50, 2085-2092.
Brondolo, E., Rieppi, R., Erickson, S. A., Bagiella, E., Shapiro, P. A., McKinley, P., & Sloan, R.
P. (2003). Hostility, interpersonal interactions, and ambulatory blood pressure. Psychosomatic Medicine, 65, 1003-1011.
Carstensen, L. L. (1992). Social and emotional patterns in adulthood: Support for socioemotional
selectivity theory. Psychology and Aging, 7, 331–338.
Carstensen, L.L. (1993). Motivation for social contact across the life span: A theory of
socioemotional selectivity. In J.E. Jacobs (Ed.) Nebraska symposium on motivation:
1992, Developmental Perspectives on Motivation, Vol. 40, (pp. 209–254). Lincoln:
University of Nebraska Press. Carstensen, L. L., Gottman, J. M., & Levenson, R. W. (1995). Emotional behavior in long-term
marriage. Psychology and Aging, 10, 140–149. Chobanian, A.V., Bakris, G.L., Black, H.R., Cushman, W.C., Green, L.A., Izzo, J.L. Jr, Jones,
D.W., Materson, B.J., Oparil ,S., Wright, J.T. Jr, Rocella, E. J. (2003). The Seventh Report of the Joint National Committee on Prevention, Detection, Evaluation, and Treatment of High Blood Pressure: the JNC 7 report. Journal of the American Medical Association, 289, 2560–2572.
Clarke, P., Fisher, G., House, J., & Weir, D. (2008). Guide to content of the HRS Psychosocial

Running Head: NEGATIVE INTERACTIONS & HYPERTENSION 28
Leave-Behind Participant Lifestyle Questionnaires: 2004 & 2006. University of
Michigan. Survey Research Center. Available at http://hrsonline.isr.umich.edu/sitedocs/userg/HRS2006LBQscale.pdf
Cohen, S. (2004). Social relationships and health. American Psychologist, 59, 676-684. Colantonio, A., Kasl, S. V., Ostfeld, A. M., & Berkman, L. F. (1993). Psychosocial predictors of
stroke outcomes in an elderly population. Journal of Gerontology, 48, S261-S268. Cook, W. W., & Medley, D. M. (1954). Proposed hostility and pharisaic-virtue scales for
the MMPI. The Journal of Applied Psychology, 38, 414-418. Coriell, M., & Cohen, S. (1995). Concordance in the face of a stressful event: When do members
of a dyad agree that one person supported the other? Journal of Personality and Social Psychology, 69, 289-299.
Crick, N. R. (1995). Relational aggression: The role of intent attributions, feelings of distress,
and provocation type. Development and Psychopathology, 7, 313-322. Crick, N. R., & Grotpeter, J. K. (1995). Relational aggression, gender, and social-psychological
adjustment. Child Development, 66, 710-722. Crimmins, E.M., Guyer, H., Langa, K.M., Ofstedal, M.B., Wallace, R.B., Weir, D.R. (2008).
Documentation of Physical Measures, Anthropometrics and Blood Pressure in the Health and Retirement Study. Retrieved from http://hrsonline.isr.umich.edu/sitedocs/userg/dr-011.pdf
Crittenden, C.N., Pressman, S.D., Cohen, S., Smith, B.W., Seeman, T.E. (Unpublished
Manuscript). Social Integration, Specific Social Roles and Pulmonary Function in the Elderly.
Davidson, K., Jonas, B. S., Dixon, K. E., & Markovitz, J. H. (2000). Do depression symptoms

Running Head: NEGATIVE INTERACTIONS & HYPERTENSION 29
predict early hypertension incidence in young adults in the CARDIA study? Archives of Internal Medicine, 160, 1495-1500.
de Gaudemaris, R., Levant, A., Ehlinger, V., Hérin, F., Lepage, B., Soulat, J. M., ... & Lang, T.
(2011). Blood pressure and working conditions in hospital nurses and nursing assistants. The ORSOSA study. Archives of Cardiovascular Diseases, 104, 97-103.
De Leon, C. F. M., Appels, W. A., Otten, F. W., & Schouten, E. G. (1992). Risk of mortality and
coronary heart disease by marital status in middle-aged men in The Netherlands. International Journal of Epidemiology, 21, 460-466.
De Vogli, R., Chandola, T., & Marmot, M. G. (2007). Negative aspects of close relationships
and heart disease. Archives of Internal Medicine, 167, 1951-1957. Diehl, M., Coyle, N., & Labouvie-Vief, G. (1996). Age and sex differences in strategies of
coping and defense across the life span. Psychology and Aging, 11, 127-139. Diener, E., Emmons, R. A., Larsen, R. J., & Griffin, S. (1985). The satisfaction with life
scale. Journal of Personality Assessment, 49, 71-75. Dressler, W. W., Dos Santos, J. E., & Viteri, F. E. (1986). Blood pressure, ethnicity, and
psychosocial resources. Psychosomatic Medicine, 48, 509-519. Eng, P. M., Rimm, E. B., Fitzmaurice, G., & Kawachi, I. (2002). Social ties and change in social
ties in relation to subsequent total and cause-specific mortality and coronary heart disease incidence in men. American Journal of Epidemiology, 155, 700-709.
Everson, S. A., Kaplan, G. A., Goldberg, D. E., Salonen, R., & Salonen, J. T. (1997).
Hopelessness and 4-year progression of carotid atherosclerosis: The Kuopio Ischemic
Heart Disease Risk Factor Study. Arteriosclerosis, Thrombosis, and Vascular Biology,

Running Head: NEGATIVE INTERACTIONS & HYPERTENSION 30
17, 1490-1495.
Ewart, C. K., Taylor, C. B., Kraemer, H. C., & Agras, W. S. (1991). High blood pressure and
marital discord: not being nasty matters more than being nice. Health Psychology, 10, 155-163.
Felmlee, D., & Muraco, A. (2009). Gender and friendship norms among older adults. Research
on Aging, 31, 318-344.
Finch, J. F., Okun, M. A., Barrera, M., Zautra, A. J., & Reich, J. W. (1989). Positive and
negative social ties among older adults: Measurement models and the prediction of psychological distress and well-being. American Journal of Community Psychology, 17, 585-605.
Friedman, E. M., Karlamangla, A. S., Almeida, D. M., & Seeman, T. E. (2012). Social strain and
cortisol regulation in midlife in the US. Social Science & Medicine, 74, 607-615. Fung, H. H., Carstensen, L. L., & Lang, F. R. (2001). Age-related patterns in social networks
among European Americans and African Americans: Implications for socioemotional selectivity across the life span. International Journal of Aging and Human Development, 52, 185-206.
Gangwisch, J. E., Heymsfield, S. B., Boden-Albala, B., Buijs, R. M., Kreier, F., Pickering, T. G.,
... & Malaspina, D. (2006). Short Sleep Duration as a Risk Factor for Hypertension Analyses of the First National Health and Nutrition Examination Survey. Hypertension, 47, 833-839.
Halperin, R. O., Gaziano, J. M., & Sesso, H. D. (2008). Smoking and the risk of incident
hypertension in middle-aged and older men. American Journal of Hypertension, 21, 148-152.

Running Head: NEGATIVE INTERACTIONS & HYPERTENSION 31
Hamon, R. R., & Blieszner, R. (1990). Filial responsibility expectations among adult child–older
parent pairs. Journal of Gerontology, 45, P110-P112. Hansson, R. O., Jones, W. H., & Fletcher, W. L. (1990). Troubled relationships in later life:
Implications for support. Journal of Social and Personal Relationships, 7, 451-463.
Hayes, A. F. (2013). Introduction to mediation, moderation, and conditional process analysis: A
regression-based approach. Guilford Press. Heeringa, S.G. & Connor, J. (1995). Technical Description of the Health and Retirement Study
Sample Design. Retrieved from http://hrsonline.isr.umich.edu/sitedocs/userg/HRSSAMP.pdf
Hughes, M. E., Waite, L. J., Hawkley, L. C., & Cacioppo, J. T. (2004). A short scale for
measuring loneliness in large surveys: results from two population-based studies.
Research on Aging, 655-672. Ingram, K.M., Jones, D.A., Fass, R.J., Neidig, J.L., Song, Y. S. (1999). Social support and
unsupportive social interactions: Their association with depression among people living with HIV. AIDS Care, 11, 313-329.
Juster, F. T., & Suzman, R. (1995). An overview of the Health and Retirement Study.
Journal of Human Resources, 30, S7-S56. Kamarck, T. W., Manuck, S. B., & Jennings, J. R. (1990). Social support reduces cardiovascular
reactivity to psychological challenge: a laboratory model. Psychosomatic Medicine, 52, 42-58.
Kaplan, G. A., Salonen, J. T., Cohen, R. D., Brand, R. J., Syme, S. L., & Puska, P. (1988). Social
connections and mortality from all causes and from cardiovascular disease: prospective
Running Head: NEGATIVE INTERACTIONS & HYPERTENSION 32
evidence from eastern Finland. American Journal of Epidemiology, 128, 370-380. Kawachi, I., Colditz, G. A., Ascherio, A., Rimm, E. B., Giovannucci, E., Stampfer, M. J., &
Willett, W. C. (1996). A prospective study of social networks in relation to total mortality and cardiovascular disease in men in the USA. Journal of epidemiology and community health, 50, 245-251.
Keyes, C. L. M., Shmotkin, D., & Ryff, C. D. (2002). Optimizing well-being: The
empirical encounter of two traditions. Journal of Personality and Social Psychology,
82, 1007-1022. Keys, A., Fidanza, F., Karvonen, M. J., Kimura, N., & Taylor, H. L. (1972). Indices of relative
weight and obesity. Journal of Chronic Diseases, 25, 329-343.
Kiecolt-Glaser, J. K., & Newton, T. L. (2001). Marriage and health: His and hers. Psychological
Bulletin, 127, 472–503. Krause, N. (1995). Negative interaction and satisfaction with social support among older adults.
The Journals of Gerontology Series B: Psychological Sciences and Social Sciences, 50, P59-P73.
Krause, N. (2005). Negative Interaction and Heart Disease in Late Life Exploring Variations by
Socioeconomic Status. Journal of Aging and Health, 17, 28-55. Lachman, M. E., & Weaver, S. L. (1997). Midlife Development Inventory (MIDI)
personality scales: Scale construction and scoring. Unpublished Technical Report.
Brandeis University. Retrieved from http://www.brandeis.edu/projects/lifespan/scales.html
Lachman, M. E., & Weaver, S. L. (1998a). Sociodemographic variations in the sense of control
by domain: Findings from the MacArthur studies of midlife. Psychology and Aging, 13,

Running Head: NEGATIVE INTERACTIONS & HYPERTENSION 33
556-562.
Lachman, M. E., & Weaver, S. L. (1998b). The sense of control as a moderator of social
class differences in health and well-being. Journal of Personality and Social Psychology,
74, 763-773. Lepore, S. J., Allen, K. A., & Evans, G. W. (1993). Social support lowers cardiovascular
reactivity to an acute stressor. Psychosomatic Medicine, 55, 518-524. Levenstein, S., Smith, M.W., Kaplan, G.A. (2001). Psychosocial Predictors of Hypertension in
Men and Women. Archives of Internal Medicine, 161, 1341-1346.
Lincoln, K. D., & Chae, D. H. (2012). Emotional support, negative interaction and major
depressive disorder among African Americans and Caribbean Blacks: findings from the National Survey of American Life. Social Psychiatry and Psychiatric Epidemiology, 1- 12.
Lincoln, K. D. (2008). Personality, negative interactions, and mental health. The Social Service
Review, 82, 223-251. Malyutina, S., Bobak, M., Simonova, G., Gafarov, V., Nikitin, Y., & Marmot, M. (2004).
Education, marital status, and total and cardiovascular mortality in Novosibirsk, Russia: a prospective cohort study. Annals of Epidemiology, 14, 244-249.
Mancia, G., Grassi, Pomidossi, G., Gregorini, L., Bertinieri, G., Parati, G. ... & Zanchetti, A.
(1983). Effects of blood-pressure measurement by the doctor on patient's blood pressure and heart rate. The Lancet, 322, 695-698.
Mancia, G. Parati, G., Pomidossi, G., Grassi, G., Casadei, R.,.& Zanchetti, A. (1987). Alerting
reaction rise in blood pressure during measurement by physician and

Running Head: NEGATIVE INTERACTIONS & HYPERTENSION 34
nurse. Hypertension, 9, 209-215. McDonald, M., Hertz, R. P., Unger, A. N., & Lustik, M. B. (2009). Prevalence, awareness, and
management of hypertension, dyslipidemia, and diabetes among United States adults aged 65 and older. The Journals of Gerontology Series A: Biological Sciences and Medical Sciences, 64, 256-263.
McEwen, B.S. (1998). Protective and damaging effects of stress mediators. The New England
Journal of Medicine, 338, 171-179. McMunn, A., Hyde, M., Janevic, M., & Kumari, M. (2003). Health (Chapter 6). In M. Marmot,
J. Banks, R. Blundell, C. Lessof, & J. Nazroo, J. (Eds.), Health, Wealth and Lifestyles of
the Older Population: The 2002 English Longitudinal Study of Ageing (pp. 207-230).
London: Institute for Fiscal Studies. Retrieved from
http://www.ifs.org.uk/ELSA/reportWave1. Miller, G.E., Cohen, S., Rabin, B.S., Skoner, D.P., Doyle, W.J. (1999). Personality and Tonic
Cardiovascular, Neuroendocrine, and Immune Parameters. Brain, Behavior, and Immunity, 13, 109-123.
Mroczek, D. K., & Kolarz, C. M. (1998). The effect of age on positive and negative
affect: a developmental perspective on happiness. Journal of Personality and Social
Psychology, 75, 1333-1349. Newsom, J. T., Mahan, T. L., Rook, K. S., & Krause, N. (2008). Stable negative social
exchanges and health. Health Psychology, 27, 78.
Newsom, J. T., Rook, K. S., Nishishiba, M., Sorkin, D. H., & Mahan, T. L. (2005).
Understanding the relative importance of positive and negative social exchanges:

Running Head: NEGATIVE INTERACTIONS & HYPERTENSION 35
Examining specific domains and appraisals. The Journals of Gerontology Series B: Psychological Sciences and Social Sciences, 60, P304-P312.
Okun, M. A., & Keith, V. M. (1998). Effects of positive and negative social exchanges with
various sources on depressive symptoms in younger and older adults. Journal of Gerontology: Psychological Sciences, 53B, 4–20.
Orth-Gomér, K., Rosengren, A., & Wilhelmsen, L. (1993). Lack of social support and incidence
of coronary heart disease in middle-aged Swedish men. Psychosomatic Medicine, 55, 37- 43.
Paffenbarger, R. S., Wing, A. L., Hyde, R. T., & Jung, D. L. (1983). Physical activity and
incidence of hypertension in college alumni. American Journal of Epidemiology, 117, 245-257.
Patten, S. B., Williams, J. V., Lavorato, D. H., Campbell, N. R., Eliasziw, M., & Campbell, T. S.
(2009). Major depression as a risk factor for high blood pressure: epidemiologic evidence from a national longitudinal study. Psychosomatic Medicine, 71, 273-279.
Reddy, K. S., & Katan, M. B. (2004). Diet, nutrition and the prevention of hypertension and
cardiovascular diseases. Public Health Nutrition, 7, 167-186. Rook, K.S. (1984). The negative side of social interaction: Impact on psychological well-being.
Journal of Personality and Social Psychology, 46, 1097-1108. Rook, K. S. (1998). Investigating the positive and negative sides of
personal relationships:Through a glass darkly? In B. H. Spitzberg & W. R. Cupach (Eds.). The dark side of close relationships (pp. 369-393). Mahwah, N. J.: Lawrence Erlbaum.

Running Head: NEGATIVE INTERACTIONS & HYPERTENSION 36
Ruberman, W., Weinblatt, E., Goldberg, J. D., & Chaudhary, B. S. (1984). Psychosocial
influences on mortality after myocardial infarction. New England Journal of Medicine, 311, 552-559.
Rudolph, K. D., Ladd, G. W., & Dinella, L. (2007). Gender differences in the interpersonal
consequences of early-onset depressive symptoms. Merrill-Palmer Quarterly, 53, 461- 488.
Rutledge, T., & Hogan, B.E. (2002). A Quantitative Review of Prospective Evidence Linking
Psychological Factors With Hypertension Development. Psychosomatic Medicine, 64, 758-766.
Ryff, C. D., & Keyes, C. L. M. (1995). The structure of psychological well-being
revisited. Journal of Personality and Social Psychology, 69, 719-727. Scheier, M. F., Carver, C. S., & Bridges, M. W. (1994). Distinguishing optimism from
neuroticism (and trait anxiety, self-mastery, and self-esteem): A reevaluation of the Life
Orientation Test. Journal of Personality and Social Psychology, 67, 1063-1078.
Schuster, T.L., Kessler, R.C., Aseltine, R.H. (1990). Supportive interactions, negative
interactions, and depressed mood. American Journal of Community Psychology, 18, 423- 438.
Seeman, T. E., Berkman, L. F., Blazer, D., & Rowe, J. W. (1994). Social ties and support and
neuroendocrine function: The MacArthur studies of successful aging. Annals of Behavioral Medicine, 16, 95-106.
Sheets, V. L., & Lugar, R. (2005). Sources of conflict between friends in Russia and the United
States. Cross-cultural Research, 39, 380-398.

Running Head: NEGATIVE INTERACTIONS & HYPERTENSION 37
Shih, J. H., Eberhart, N. K., Hammen, C. L., & Brennan, P. A. (2006). Differential exposure and
reactivity to interpersonal stress predict sex differences in adolescent depression. Journal of Clinical Child and Adolescent Psychology, 35, 103-115.
Shipley, B. A., Weiss, A., Der, G., Taylor, M. D., & Deary, I. J. (2007). Neuroticism,
extraversion, and mortality in the UK Health and Lifestyle Survey: a 21-year prospective cohort study. Psychosomatic Medicine, 69, 923-931.
Silverstein, M., Chen, X., & Heller, K. (1996). Too much of a good thing? Intergenerational
social support and the psychological well-being of older parents. Journal of Marriage and the Family, 970-982.
Singleton, R. A., & Vacca, J. (2007). Interpersonal competition in friendships. Sex Roles, 57,
617-627. Smith, T. W., Cribbet, M. R., Nealey-Moore, J. B., Uchino, B. N., Williams, P. G., MacKenzie,
J., & Thayer, J. F. (2011). Matters of the variable heart: Respiratory sinus arrhythmia response to marital interaction and associations with marital quality. Journal of Personality and Social Psychology, 100, 103-119.
Smith, T. W., Uchino, B. N., Berg, C. A., Florsheim, P., Pearce, G., Hawkins, M., ... & Olsen-
Cerny, C. (2009). Conflict and collaboration in middle-aged and older couples cardiovascular reactivity during marital interaction. Psychology and Aging, 24, 274-286
Smith, T. W., Uchino, B. N., MacKenzie, J., Hicks, A., Campo, R. A., Reblin, M., ... & Light, K.
C. (2012). Effects of Couple Interactions and Relationship Quality on Plasma Oxytocin and Cardiovascular Reactivity: Empirical Findings and Methodological Considerations. International Journal of Psychophysiology.
Steptoe, A., & Chida, Y. (2009). The association of anger and hostility with future coronary

Running Head: NEGATIVE INTERACTIONS & HYPERTENSION 38
heart disease: a meta-analytic review of prospective evidence. Journal of the American College of Cardiology, 53, 936-946.
Sneed, R.S. & Cohen, S. (2013). A Prospective Study of Volunteerism and
Hypertension Risk in Older Adults. Psychology and Aging, 28, 578-586.
Sobel, M.E. (1982). Asymptotic confidence intervals for indirect effects in structural equation
models. Sociological Methodology, 13, 290-312. Stroud, L. R., Salovey, P., & Epel, E. S. (2002). Sex differences in stress responses: social
rejection versus achievement stress. Biological Psychiatry, 52, 318-327. Suls, J., & Bunde, J. (2005). Anger, anxiety, and depression as risk factors for cardiovascular
disease: the problems and implications of overlapping affective dispositions. Psychological Bulletin, 131, 260-300.
Tindle, H. A., Chang, Y. F., Kuller, L. H., Manson, J. E., Robinson, J. G., Rosal, M. C., ... &
Matthews, K. A. (2009). Optimism, cynical hostility, and incident coronary heart disease and mortality in the Women’s Health Initiative. Circulation, 120, 656-662.
Tun, P. A., Miller-Martinez, D., Lachman, M. E., & Seeman, T. (2013). Social strain and
executive function across the lifespan: The dark (and light) sides of social engagement. Aging, Neuropsychology, and Cognition, 20, 320-338.
Uchino, B. N., Cacioppo, J. T., Malarkey, W., Glaser, R., & Kiecolt-Glaser, J. K. (1995).
Appraisal support predicts age-related differences in cardiovascular function in women. Health Psychology, 14, 556-562.
Uchino, B. N., & Garvey, T. S. (1997). The availability of social support reduces cardiovascular
reactivity to acute psychological stress. Journal of Behavioral Medicine, 20, 15-27. Uchino, B. N., Uno, D., & Holt-Lunstad, J. (1999). Social support, physiological processes, and

Running Head: NEGATIVE INTERACTIONS & HYPERTENSION 39
health. Current Directions in Psychological Science, 8, 145-148. Wade, T.D., & Kendler, K.S. (2000). The Relationships between Social Support and Major
Depression: Cross-Sectional, Longitudinal, and Genetic Perspectives. Journal of Nervous & Mental Disease, 188, 251-258.
Walsh, J. M., Rogot Pressman, A., Cauley, J. A., & Browner, W. S. (2001). Predictors of
Physical Activity in Community‐dwelling Elderly White Women. Journal of General Internal Medicine, 16, 721-727.
Watson, D. & Clark, L.A. (1994). The PANAS-X: Manual for the
Positive and Negative Affect Schedule - Expanded Form. Retrieved from http://www.psychology.uiowa.edu/faculty/clark/panas-x.pdf
Wickrama, K. A. S., Lorenz, F. O., Wallace, L. E., Peiris, L., Conger, R. D., & Elder, G. H.
(2001). Family influence on physical health during the middle years: The case of onset of hypertension. Journal of Marriage and Family, 63, 527-539.
Wilson, P. W., D'Agostino, R. B., Sullivan, L., Parise, H., & Kannel, W. B. (2002). Overweight
and obesity as determinants of cardiovascular risk: the Framingham experience. Archives of internal medicine, 162, 1867-1872.
Witteman, J., Willett, W. C., Stampfer, M. J., Colditz, G. A., Kok, F. J., Sacks, F. M., ... &
Hennekens, C. H. (1990). Relation of moderate alcohol consumption and risk of systemic hypertension in women. The American Journal of Cardiology, 65, 633-637.

Running Head: NEGATIVE INTERACTIONS & HYPERTENSION 40
Table 1. Descriptive statistics of the study sample
. Variable
Study Sample (n=1502)
Excluded Participants with Blood Pressure Data at
Baseline (n=5930)
p value
Age, mean years (SD)
64.28 (8.95) 68.07 (10.99) <0.0001
Sex
Female, n (%)
899(59.9) 3448 (58.1) 0.23
Male, n (%)
603 (40.1) 2482 (41.9)
Race/Ethnicity
Non-Hispanic White, n (%)
1274 (84.8) 4394(74.4) <0.0001
Non-Hispanic Black, n (%)
97 (6.5) 860(14.6) <0.0001
Hispanic, n (%) 102 (6.8) 507 (8.6) 0.02
Non-Hispanic Other, n (%)
29(1.9) 134 (2.3) 0.43
Education
Less than high school, n (%)
168 (11.2) 1243 (21.0) <0.0001
GED, n (%)
69 (4.6) 282 (4.8) 0.78
High school graduate, n (%)
442 (29.4) 1871(31.6) 0.10
Some college, n (%)
378 (25.2) 1355 (22.9) 0.06
College and above (n, %)
445(29.6) 1168 (19.7) <0.0001
Marital Status
Married, n (%)
1072 (71.4) 3749 (63.2) <0.0001
Annulled, n (%)
0 (0.0) 2(0.0) 0.48
Never married, n (%)
52 (3.5) 193(3.3) 0.70
Separated, n (%)
17 (1.1) 119(2.0) 0.02
Divorced, n (%)
171 (11.4) 629 (10.6) 0.39
Widowed, n (%)
190 (12.6) 1224(20.7) <0.0001
Employment Status
Employed, n (%)
771 (51.3) 2042(34.4) <0.0001
Not Employed, n (%)
731 (48.7) 3887(65.6)
Smoking Status
Non-Smoker 701 (46.8) 2530 (42.9) 0.02
Former Smoker 595 (39.7) 2550 (43.2)
Current Smoker 201 (13.4) 820(13.9)
Average Baseline Systolic Blood Pressure, Mean ( SD) 118.34 (11.81) 134.81 (21.30) <0.0001
Average Baseline Diastolic Blood Pressure, Mean (SD) 74.26 (7.98) 80.99 (12.26) <0.0001
Running Head: NEGATIVE INTERACTIONS & HYPERTENSION 41
Table 2. Measures Used to Evaluate Psychological Well-Being in the 2006 (baseline) and 2010 Waves of the
Health and Retirement Study.
Construct Measure
Hopelessness Beck Hopelessness Scale (2 items; Beck, Weissman, Lester, & Trexler, 1974) Selected hopelessness items (2 items; Everson, Kaplan, Goldberg, Salonen, & Salonen, 1997)
Life Satisfaction Satisfaction with Life Scale (5 items; Diener, Emmons, Larsen, & Griffin, 1985) Loneliness 2006: UCLA Loneliness Scale (3 items; Hughes, Waite, Hawkley, & Cacioppo,
2004) 2010: UCLA Loneliness Scale (11 items; Hughes, Waite, Hawkley, & Cacioppo, 2004)
Negative Affect 2006: Negative Affect Scale from the Midlife in the United States study (MIDUS; 6 items; Mroczek & Kolarz, 1998) 2010: Positive and Negative Affect Schedule-Expanded Form (PANAS-X; 12 items; Watson & Clark, 1994)
Optimism Revised Life Orientation Test (LOT-R; 3 items; Scheier, Carver, & Bridges, 1994) Personal Control Sense of Control Scales of the Midlife Developmental Inventory (5 items; Lachman
& Weaver, 1998a; Lachman & Weaver, 1998b) Pessimism Revised Life Orientation Test (LOT-R; 3 items; Scheier, Carver, & Bridges, 1994) Positive Affect Positive Affect Scale from the Midlife in the United States study (MIDUS; 6 items;
Mroczek & Kolarz, 1998)
Purpose in Life Purpose Scale of Ryff Measures of Psychological Well-Being (7 items; Ryff 1995; Keyes, Shmotkin, & Ryff, 2002)

Running Head: NEGATIVE INTERACTIONS & HYPERTENSION 42
Table 3. Logistic Regression for Association of Negative Social Interactions with Hypertension Across Domains and Within Each Social Domain Variable Model 1 Model 2 Model 3 Model 4 Model 5
OR (95% CI) OR (95% CI) OR (95% CI) OR (95% CI) OR (95% CI) Total Average Negative Social Interactions (Average of 4 Domains)
1.38 (1.00-1.89)
Negative Interactions with Partner
1.15 (0.90-1.48)
Negative Interactions With Children
1.01 (0.80-1.28)
Negative Interactions with Other Family
1.33 (1.07-1.65)
Negative Interactions with Friends
1.36 (1.04-1.78)
All models adjust for age, race/ethnicity, sex, employment status, marital status, education, baseline systolic blood pressure, baseline diastolic blood pressure, extraversion, agreeableness, cynical hostility, neuroticism and self-reported history of diabetes, cancer, heart problems, arthritis, memory problems, lung problems, or stroke.

Running Head: NEGATIVE INTERACTIONS & HYPERTENSION 43
Figure 1. Association of Total Average Negative Social Interaction Scores With Hypertension By Sex.