nehrp clearing house
TRANSCRIPT
PB80191232 111111111111111111111 1111111111
~5~02~7~2_-:~.· ______________ ~ ________________ = ________ ~~ ________ __
PAGE NSF/RA-800043 REPOl'r DOCUMENTATION 1.1._ REPORT NO. 12.
7.1w;;-a~d-;:S~ub::::t;:;itl·e::------'-----------------'----------t-:s:-. -=-Re-p-ort-D-at-e --------;
Free Vibration Tests of Structural Concrete Walls and Analysis February 1980 of Free Vibration Tests of Structural Walls 6.
~~~~------------------------------=~-----------------------~------------~ 7. Author(s) 8. Performing Organization Rept. No.
R. G. Oesterle, A. E. Fiorato, J. D. Aristizabal-Ochoa 9. Performing Organization Name and Address
Portland Cement Association Construction Technology Laboratories 5420 Old Orchard Road Skokie, IL 60077
12. Sponsoring Organization Name and Address
Engineering and Applied Science (EAS) National Science Foundation 1800 G Street, N.W. Washington, D.C. 20550
15. Supplementary Notes
10. Project/Task/Work Unit No.
11. Contract(C) or Grant(G) No.
(C)
(G) PFR7715333 13. Type of Report & Period Covered
---.--.-- .. _----_ .. _ .. _-14.
1,--.------------------------------_· __ ·_·· __ ·_--· -.. --.... ---.---------\ -16. Abstract (Limit: 200 words)
This report describes experimental free vibration tests and results conducted during lateral load tests to determine frequency and damping characteristics of isolated wall specimens. This study is part of an experimental and analytical investigation of structural walls for earthquake-resistant buildings in which large isolated reinforced concrete wall specimens are tested under reversing in-plane lateral loads. Initial tests were conducted on specimens before applying lateral loads, whereas final tests were performed on specimens that had been cycled through large inelastic deformations. The report details test specimens, the test procudure, and test results. Small amplitude free vibration tests of isolated structural walls indicate that frequency and damping characteristics are sensitive to the development of structural cracks in the walls. With increasing damage levels, frequency decreases and damping increases. These observations need to be considered in analyzing the dynamic response of reinforced concrete wall systems.
~--------------------------.------~---~---------------~ 17. Document Analysis a. Descriptors
Earthquakes Buildings Damping Dynamic structural analysis b. Identifiers/Open·Ended Terms
Lateral loads
c. COSATI Field/Group
18. Availability Statement
NTIS
(See ANSI-Z39.18)
Frequency response Reinforced concrete Earthquake resistant structures
19. Security Class (This Report) 21. No. of Pages
~~-----------~-------------20. Security Class (This Page)
See Instructio!'s on Reverse
22. Price
OPTIONAL FORM 272 (4-77) (Formerly NTIS-35) Department of Commerce


Report to
NATIONAL SCIENCE FOUNDATION Washington, D.C.
Grant No. PFR 7715333
FREE VIBRATION TESTS OF STRUCTURAL CONCRETE WALLS
and
ANALYSIS OF FREE VIBRATION TESTS OF STRUCTURAL WALLS
by
R. G. Oesterle and A. E. Fiorato
and
J. D. Aristizabal-Ochoa
Any opinions, findings, conclusions or recommendations expressed in this publication are those of the author(s) and do not necessarily reflectthe views of the National Science Foundation.
Submitted by CONSTRUCTION TECHNOLOGY LABORATORIES
A Division of Portland Cement Association 5420 Old Orchard Road
Skokie, Illinois 60077
February 1980
1(L.

,....; ,
TABLE OF CONTENTS
TABLE OF CONTENTS
FREE VIBRATION TESTS OF STRUCTURAL CONCRETE WALLS
INTRODUCTION
EXPERIMENTAL PROGRAM
Test Specimens
Test Procedure
TESTS RESULTS
CONCLUSIONS
ACKNOWLEDGMENTS
APPENDIX I - REFERENCES
APPENDIX II - NOTATION
ANALYSIS OF FREE VIBRATION TESTS OF STRUCTURAL WALLS
INTRODUCTION
EXPERIMENTAL WORK
FREQUENCY CALCULATIONS
COMPARISON WITH TEST RESULTS
Fundamental Frequency
Stiffness Changes
Damping
CONCLUSIONS
ACKNOWLEDGMENTS
APPENDIX I - REFERENCES
APPENDIX II - NOTATION
APPENDIX III - FREQUENCY ANALYSIS
\ b
i
1
2
2
7
9
13
14
15
16
17
17
20
22
22
25
25
27
29
31
32
34
FREE VIBRATION TESTS OF STRUCTURAL CONCRETE WALLS
by
R. G. Oesterle, and A. E. Fiorato*
INTRODUCTION
As part of an experimental and analytical investigation of
structural walls for earthquake-resistant buildings, large
isolated reinforced concrete wall specimens have been tested
under reversing in-plane lateral loads. Free vibration tests
were carried out during the lateral load tests to determine the
frequency and damping character istics of isolated wall speci
mens. These tests were conducted at selected stages as the
number and magnitude of the reversed lateral load cycles
applied to the specimen were increased.
The objective of the free vibration tests was to evaluate
changes in natural frequency and damping that resulted from
damage caused by the reversing lateral loads. Initial tests
were conducted on specimens before applying the lateral loads.
Final tests were conducted on specimens that had been cycled
through large inelastic deformations.
The purpose of this paper is to describe the free vibration
tests and to present the test results. Analysis of the test
results is presented in a companion paper. (1) A detailed
description of the experimental program is given elsewhere. (2,3)
* Respectively, Senior Structural Engineer, Structural Development Department; Manager, Construction Methods Section; Portland Cement Association, Skokie, Illinois
-1-
EXPERIMENTAL PROGRAM
This section describes the test specimens and test procedure.
Test Specimens
Test specimens were detailed to represent full-size walls
al though no particular prototype walls were modeled. Table 1
provides a summary of physical and material properties for the
walls subjected to free vibration tests. Controlled var iables
for these spec imens included shape of the wall cross section,
amount of main flexural reinforcement, and confinement rein
forcement in the boundary elements. One wall was subjected to
monotonic loading and one wall was repaired and retested.
Dimensions of the test specimens are shown in Fig. 1.
Flanged, barbell, and rectangular cross sections have been in
vestigated. Nominal cross sectional dimensions are shown in
Fig. 2. The types of reinforcement used in the specimens are
shown in Fig. 3.
In proport ion ing the walls, design moment was calculated
following procedures in the 1971 ACI Building Code. (4)
Strain hardening of the steel was neglected. Horizontal shear
reinforcement was provided so that the calculated design moment
would be developed. Shear reinforcement was provided to sat
isfy the ACI Building Code requirements. (4) Design yield
stress of the steel was 60, 000 psi (414 MPa) and design con
crete strength was 6000 psi (41.4 MPa).
Transverse reinforcement around vertical reinforcement in
the boundary elements was designed either as ordinary column
ties (unconfined) or as special confinement reinforcement (con
fined) • For rectangular sections, the "boundary element" was
taken to extend 7.5 in. (190 mm) from each end of the wall.
Specimens Fl, Bl, B2, and Rl had ordinary ties as required
by Section 7.12 of the 1971 ACI Building Code. (4) All other
specimens had rectangular hoop and supplementary cross-tie
reinforcement proportioned to meet requirements of Appendix A
of the 1971 ACI Building Code. (4) This design resulted in a
-2-

I W I
TAB
LE
1 -
SUM
MA
RY
OF
TE
ST
SPE
CIM
EN
S
Sp
ecim
en
Sh
ape
Pf
(I)
(2)
(3)
F1
I
I 3
.89
B1
• •
1.1
1
B2
• •
3.6
7
B3
• •
1.1
1
B4
(a)
• •
1.1
1
B5
• •
3.6
7
B5R
(b)
•
• 1
.11
R1
1.
47
R2
4.0
0
(a)
Mo
no
ton
ic
load
ing
(b
) R
ep
air
ed
sp
ecim
en
Rein
forc
em
en
t (%
)
Ph
Pn
(4)
(5)
0.7
1
0.3
0
0.3
1
0.2
9
0.6
3
0.2
9
0.3
1
0.2
9
0.3
1
0.2
9
0.6
3
0.2
9
0.3
1
0.2
9
0.3
1
0.2
5
0.3
1
0.2
5
(c)
10
00
p
si
=
1.0
k
si
=
6.8
95
M
Pa
f'
Ps
c
(psi)
(6 )
(7)
--5
58
0
--7
69
0
--7
78
0
1.2
8
68
60
1.2
8
65
30
1.3
5
65
70
1.
28
62
00
--6
49
0
2.0
7
67
40
f fo
r E
'y
c
Pf
(ksi
) (k
si)
(8 )
(9)
36
90
6
4.5
40
80
6
5.2
42
00
5
9.5
39
60
6
3.5
41
00
6
5.3
39
70
6
4.4
40
10
--
40
30
7
4.2
38
90
6
5.3
i ~

15 1-0" (4.57m)
6 1- 3"
(1.9Im)
10 1 -0" (3.05 m)
a" (203mm)
Fig. 1 Nominal Dimensions of Test Specimen with Rectangular Cross Section
. - 4 -

lJl
(I0
2m
m)
L 4
" II
(I0
2m
m)
4"
j .. o ...
. r·
····
.....
; ..
00
I '
••
« "
'. ~ o . . ~.
~ .. I'"
~:
I •
~
• t
~" ,1:1
(I0
2m
m)
r" .
I '
4"
I ; •.
9: "
<?o"
. I
---1
-.
I. . 3
~:., .. J
~ .. ; .~
, . • ...
(O.9
Im)
-I
(a)
Fla
ng
ed
75
11
I. 9
1m)
~
L(I
02
mm
)
I 1
4"
• •
6"
: o:"r'~
' 12
" ·
" 0
~ ,
" . ~ ..
'---1
.0'
1 to
(30
5m
m)
• 0
.11 o.
'0 0" •
0 I I)
•
h • . · , · .. ~';~
305m
m )
---".
I .....
--. Q
' •
a',
..
, . '.
12
•
4, (
)
:.;.
tJ: .:
..-L
....
.-
l!D
(3
05
rri m
)
(b)
Ba
rbe
ll
75
11
(1.9
Im)
'q
".'
" ~ l'
00
4· , . o o
411
--:1
(I0
2m
m)
I--
(c)
Re
cta
ng
ula
r
Fig
. 2
No
min
al C
ross-S
ecti
on
al
Dim
en
sio
ns
of
Test
Sp
ecim
en
s
75
11
1/1.
9Im
)

0'\
Bo
un
da
r E
lem
en
t
Ma
in
IFlexR
ei~1
Wa
ll W
eb
Ve
rtic
al
Web
R
ein
.
Ho
rizo
nta
l S
he
ar
Re
in.
Tra
nsve
rse
C
on
fin
em
en
t R
ein
.
~
Sym
.ab
t.
Fig
. 3
Ty
pes
o
f W
all
R
ein
forc
em
en
t

hoop spacing of 1. 33 in. (34 mm). Confinement reinforcement
was used only over the first 6 ft (1.83 m) above the base of
the wall. Ordinary column ties were used over the remaining
height.
Specimen B5R was a retest of repaired Specimen B5. Follow
ing the test of B5, the wall was returned to its original
undeflected position. Then, the damaged web concrete was
removed up to a height of about 9 ft (2.74 m). New web
concrete was cast in three lifts. The boundary elements were
given a cosmetic repair by hand rubbing the surfaces with neat
cement paste.
Test Procedure
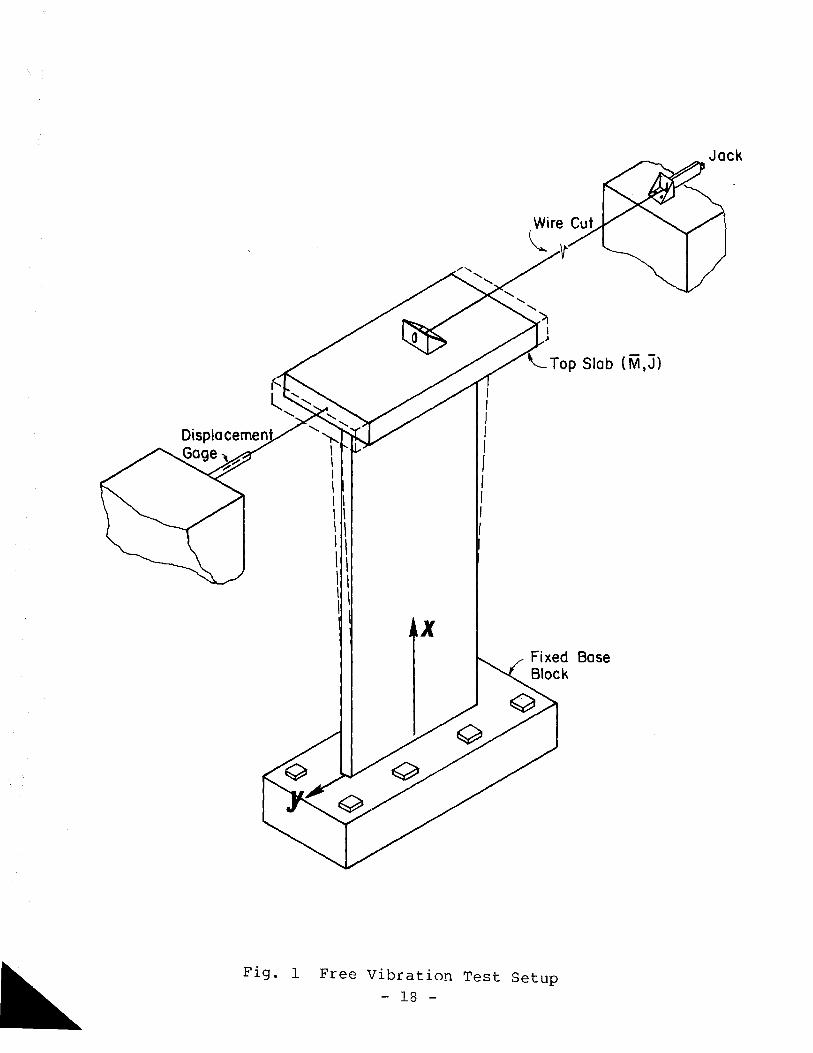
The apparatus for lateral load testing of the walls is
shown in Fig. 4. Each specimen was loaded as a vertical canti
lever with forces applied through the top slab. Walls were
loaded in a series of increments except for Specimen B4. Each
increment consisted of three complete reversed cycles. About
three increments of force were applied prior to initial
yielding. Subsequent to initial yielding, loading was
controlled by deflections in I-in. (25 mm) increments. Speci
men B4 was subjected to a monotonically increasing load.
Free vibration tests were conducted at selected stages as
the number and magnitude of lateral loading increments applied
to the specimen increased. The first vibration test was run
prior to the application of lateral loading. At this stage,
the specimen could have contained cracks as a result of
shrinkage and handling.
The second vibration test for Specimens FI, B5, B5R and RI
was conducted after cracking of the wall sections but before
the lateral loading increment in which the flexural reinforce
ment yielded. For all specimens, vibration tests were run
after the lateral loading cycles closest to the yield level had
been applied. Additional tests were run at later loading
stages depending on the physical condition of the test specimen.
-7-
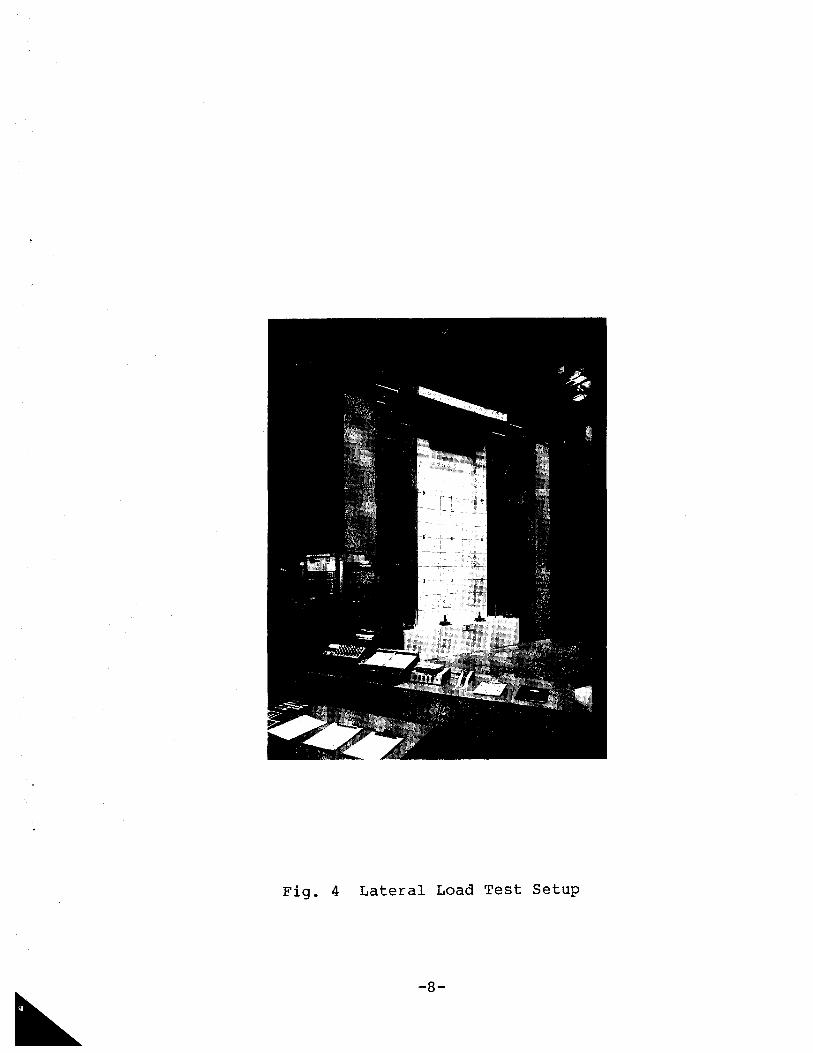
Fig. 4 Lateral Load Test Setup
-8-

Free vibration tests were performed using two methods.
Both are considered small amplitude tests. They were run with
the specimen disconnected from the hydraulic rams that applied
lateral loads.
In the first method, vibrations were initiated using an
"Initial Displacement-Sudden Release" system. A l/4-in.
(6.4 mm) diameter prestressing wire was attached to a bracket
on the top slab of the wall. The wire was pulled to a
predetermined force and then cut. The force used to displace
the wall was lower than the calculated cracking load. This
method is illustrated in Fig. 5.
In the second method, smaller ampli tude tests were per
formed using the impact force of a 8-lb. (3.63 kg) hammer to
initiate vibrations. These are termed "Hammer Impact Tests."
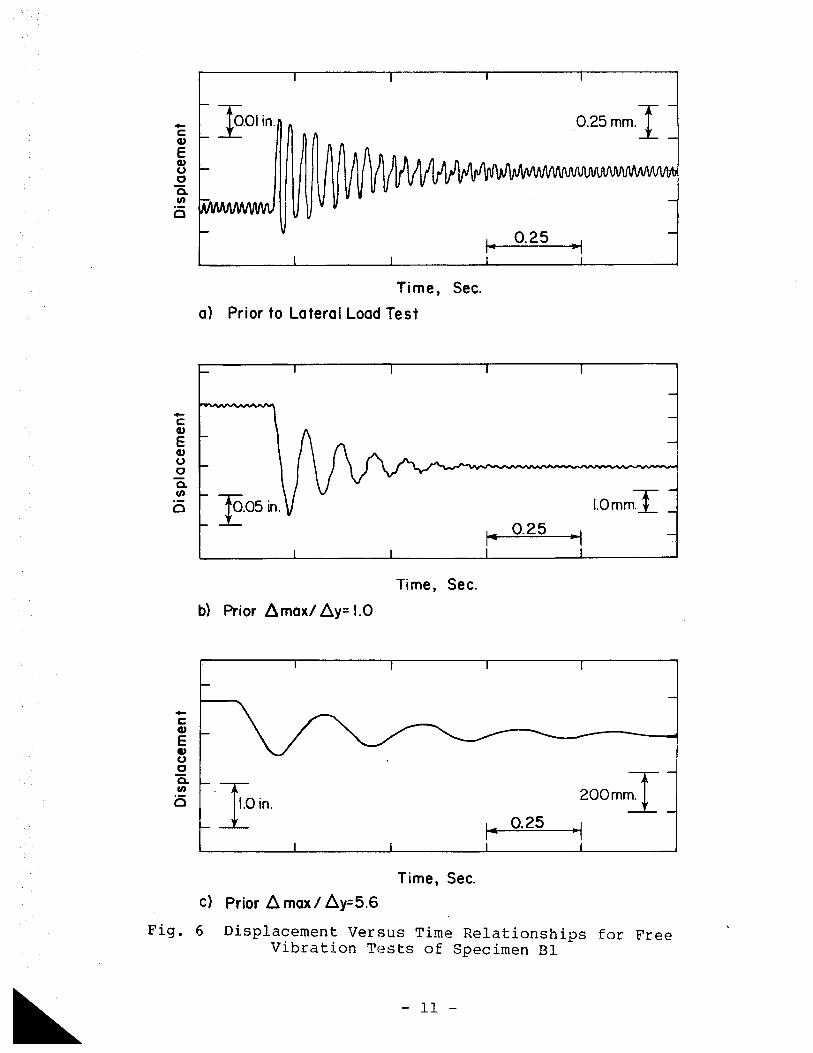
In both methods, the top lateral deflection of the test
specimen was plotted versus time using an oscillographic
recorder. An example of the time-displacement relationships
for Specimen Bl is shown in Fig. 6.
Each free vibration test consisted of two separate excita
tions resulting in two time-displacement plots. The natural
frequencies and damping coefficients reported for each test are
the averages of four separate values determined from the
positive and negative half of the two plots. The damping
coefficient was calculated as equivalent viscous damping from
the logar i thmic decrement taken over several of the ini tial
cycles.
TEST RESULTS
The results of the tests are presented in Table 2. Unless
otherwise indicated, all results are from "Initial Displacement
- Sudden Release" tests. Damping is presented as a percentage
of the critical viscous damping.
The following observations are made on the results of the
free vibrating tests.
-9-

\ \ Displacement \ \ Gage \\
1\ \ \ \ \ \
\
\
\/4" (6.4mm) dia. Wire
~
x
61-3" ( 1.9\ m)
Fig. 5 Free Vibration Test Setup
- 10 -
\51
(4.57m)
-c CI)
E CI) u o Q. III
o
-c CI)
E CI)
u o 0-III
o
~.Olin.
Time, Sec.
a) Prior to Lateral Load Test
~.05in.
Time, Sec.
b) Prior 8maxl l::,.y= 1.0
Time, Sec.
c) Prior l::,. max I l::,.y=5.6
0.25mm·I
0.25 ~I
1.0mmI
I" 0.25 -I
200m';:[
~I
Fig. 6 Displacement Versus Time Relationships for Free Vibration Tests of Specimen Bl
- 11 -

TABLE 2 - SUMMARY OF FREE VIBRATION TEST RESULTS
Loading History Excitation
Prior No. Prior Pi Initial
Specimen of Load 6.max Ampli tude ~ Cycles ~ (in. )
(1) (2) (3 ) (4 ) (5)
a -- 0.05 0.017 Fl 12 0.7 0.05 0.054
a -- 0.17 0.016 B1 12 1.0 0.17 0.098
24 5.6 0.17 0.681
a -- 0.07 0.014 B2 15 1.0 0.07 0.065
24 3.7 0.07 0.350
a -- 0.17 0.015 12 1.0 0.17 0.106
B3 24 5.8 0.17 0.598 35 11.2 H. I.T. (b)
a -- H.I.T. (b) B4 (c) a -- 0.13 0.018
a -- 0.20 0.023
a -- H.I.T. 0.004 a -- 0.07 0.026 6 0.4 H.I.T. 0.004 6 0.4 0.07 0.062
BS 15 1.1 H.I.T. 0.004 15 1.1 0.07 0.090 24 3.6 H.I.T. 0.004 24 3.6 0.05 0.290
a -- H.I.T. 0.005 a -- 0.07 0.075 6 0.4 H.I.T. 0.005
BSR(d) 6 0.4 0.07 0.110 15 1.1 H.I.T. 0.007 15 1.1 0.07 0.151
0 -- 0.36 0.026 R1 6 0.5 0.36 0.095
a -- 0.17 0.045 R2 15 1.0 0.17 0.121
NOTES:
(a) Based on Logarithmic decrement using five or more cycles.
(b) Initial amplitude not measured.
(c) Specimen B4 tested with monotonic lateral load.
(d) Specimen BsR was a repair of Specimen B5. Yielding in B5R taken at load Py , for B5.
1 in = 25.4 mm - 12 -
Measured Fundamental
Frequency
(Hertz) (6 )
33.8 13 .0
30.0 11.1
3.9
29.4 13 .0
3.9
29.7 10.9
4.3 5.2
29.4 29.4 28.8
30.6 29.5 20.4 15.2 18.2 12.0 11.8
6.4
16.0 13 .3 13 .2 10.8 11. 9
8.3
21. 8 10.5
17.8 8.8
Measured Damping
% of Critical (a)
(7)
2.0 9.8
2.2 8.5 9.1
3.6 10.0 14.5
2.7 9.6 8.1 9.0
2.8 2.4 2.7
2.9 4.0 9.2 9.6
11. 2 12.0 3.2
14 .5
3.1 4.0 4.0 5.7 3.6
11. a
3.4 6.7
5.5 6.8

1. Excluding Specimen B5R, the measured frequency de
creased by an average of 50% from the initial tests to
the tests carr ied out after significant cracking, but
prior to yielding. For the same conditions, the aver
age damping coefficient increased from 3% to 9%.
2. Specimen B5 results indicate that relatively small
decreases in frequency and increases in damping
occurred for tests made after cracking compared to
results for tests made close to yield.
3. Lateral load cycling through large inelast ic deforma-
tions significantly reduced the frequency. However,
the corresponding change in damping was generally
small.
4. The initial tests on the repaired wall, B5R, indicate
that frequency was approximately 50% of that of the
5.
or ig inal wall. Damping was the same order of magni-
tude in the original and the repaired wall.
In general, the smaller amplitude "Hammer
tests gave higher frequencies and lower
coefficients than "Initial Displacement
Impact"
damping
Sudden
Release" tests. The resul ts were particular ly sensi
tive to the magnitude of the initial displacement
after large inelastic lateral load cycles. This would
be expected because of differences in crack closure
that resulted from the magnitude of the initial dis
placement.
CONCLUSIONS
Small amplitude free vibration tests of isolated structural
walls ind ica te that frequency and damping character ist ics are
sensitive to the development of structural cracks in the
walls. This corresponds to the large change in stiffness that
occurs at this stage. with increasing damage levels, frequency
decreases and damping increases. These observations should be
considered in analyzing the dynamic response of reinforced con
crete wall systems. A detailed analysis of the free vibration
test results is presented in a companion paper. (1)
- 13 -

ACKNOWLEDGMENTS
This work was part of a combined exper imental and analyt
ical investigation on the earthquake resistance of structural
walls under the direction of Mr. M. Fintel and Dr. W. G.
Corley. The project was supported by the National Science Foun
dation under Grant Nos. ENV 74-14766 and PFR-77l5333 and by the
Portland Cement Association. Any opinions, findings and
conclusions expressed in this paper are those of the authors
and do not necessarily reflect the views of the National
Science Foundation. The tests were carr ied out in the Struc-
tural Development Department of the Portland Cement
Association, Dr. H. G. Russell, Director.
- 14 -
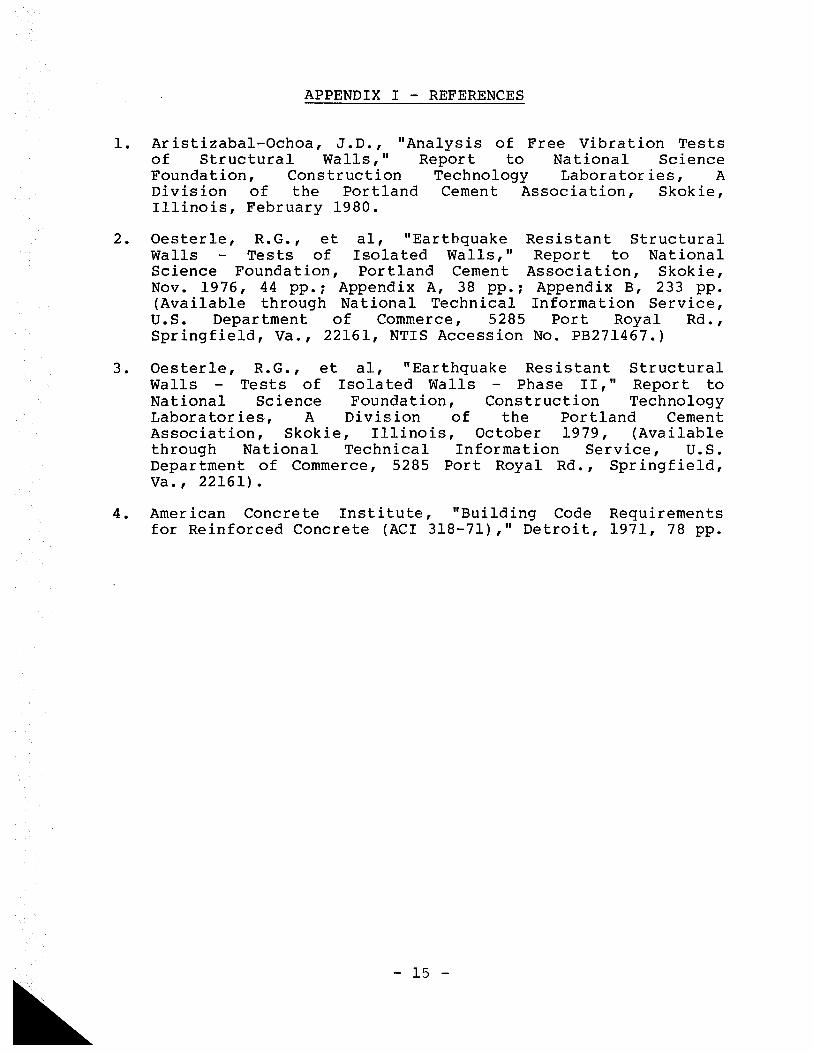
APPENDIX I - REFERENCES
1. Ar istizabal-Ochoa, J.D., IIAnalysis of Free Vibration Tests of Structural Walls,1I Report to National Science Foundation, Construction Technology Laboratories, A Division of the Portland Cement Association, Skokie, Illinois, February 1980.
2. Oesterle, R.G., et aI, IIEarthquake Resistant Structural Walls Tests of Isolated Walls,1I Report to National Science Foundation, Portland Cement Association, Skokie, Nov. 1976, 44 pp.; Appendix A, 38 pp.; Appendix B, 233 pp. (Available through National Technical Information Service, u. S. Department of Commerce, 5285 Port Royal Rd. , Springfield, Va., 22161, NTIS Accession No. PB271467.)
3. Oesterle, R.G., et aI, IIEarthquake Resistant Structural Walls Tests of Isolated Walls Phase II, II Report to National Science Foundation, Construction Technology Laboratories, A Division of the Portland Cement Association, Skokie, Illinois, October 1979, (Available through National Technical Information Service, u.S. Department of Commerce, 5285 Port Royal Rd., Springfield, Va., 22161).
4. American Concrete Institute, IIBuilding Code Requirements for Reinforced Concrete (ACI 318-71),11 Detroit, 1971, 78 pp.
- 15 -

APPENDIX II - NOTATION
The following symbols are used in this report:
EC = modulus of elasticity of concrete
H.I.T = hammer impact test
PI
P Y
f ' c ~
max
=
=
=
=
load applied to top of wall to initiate vibrations
load applied at top of wall corresponding to ~y
concrete compressive strength
maximum deflection at top wall during prior lateral
load cycles
~ = deflection at top of wall at which first yielding y
of main flexural steel was observed during lateral
load tests
Pf = ratio of main flexural reinforcement area to gross
concrete area of boundary element
Ph = ratio of horizontal shear reinforcement area to
gross concrete area of a vertical section of wall
web
P = ratio of vertical web reinforcement area to gross n
concrete area of a horizontal section of wall web
= ratio of effective volume of confinement rein-
forcement to the volume of core in accordance with
Eg. A.4 of ACI 318-71.
- 16 -
ANALYSIS OF FREE VIBRATION TESTS OF STRUCTURAL WALLS
by
J. D. Aristizabal-Ochoa*
INTRODUCTION
Determination of natural frequencies of a reinforced con
crete structural system and the implications of cracking and
yielding on dynamic characteristics are important in earthquake
resistant design. This paper evaluates free vibration tests of
nine reinforced concrete structural walls constructed and
tested at the Portland Cement Association. The free vibration
tests were carr ied out to determine the fundamental frequency
and critical damping ratio. Test specimens and free vibration
tests are described and reported elsewhere. (1)
This paper compares the measured frequencies of the un
damaged walls with values calculated by two methods. The first
method considers flexural deformations only. The second method
considers shear deformations, rotary inertia, and axial load in
addition to flexural deformations. Comparisons of measured and
calculated data show the effects of shear deformation on the
natural frequencies of the reinforced concrete walls. Based on
test results described in this paper, the first method modified
to include shear deformations is recommended to calculate the
fundamental frequency of thin-webbed structural walls.
EXPERIMENTAL WORK
Figure 1 shows schematically the
Flanged, barbell and rectangular walls
free
were
vibration setup.
tested. Figure 2
shows the nominal dimensions of the test specimens. The free
vibration tests were conducted at selected stages after apply-
* Former Structural Engineer, Structural Development Department; Portland Cement Association, Skokie, Illinois.
- 17 -
x
I I I I I I I I I I I
'--- Top Slab (M.J)
Fig. 1 Free Vibration Test Setup - 18 -

(a) Nominal Dimensions of Test Specimen with Rectangular Cross Section
Flanged k = 0.52
102mm) 4"
75" (1.9Im)
J L (102mm)
11 4 "
····ill ~: .:'~ ~'.:' 12" .. ~' .. ' .. ... (305mm
" .. " ','
"
liD (305 rri m)
Barbell k = 0.58
75" 1.91m) •
"
4"--...j I(102mmj
75" 1.91m)
Rectangular k = 0.83
(b) Nominal Cross-Sectional Dimensions and Shear Factors of Test Specimens
Fig. 2 Nominal Dimensions of Test Specimens
- 19 -

ing reversing in-plane lateral loads to the specimens. Small
ampli tude vibrations were ini tia ted by pulling the specimens
wi th a 1/4-in. (6. 4 mm) diameter wire and then cutting the wire
as shown in Fig. 1. These are termed. "Initial Displacement
Sudden Release Tests." Another method to exci te the walls was
to hit the specimens with an 8-lb (3.63 kg) hammer. These are
termed "Hammer Impact Tests." In both cases, the top lateral
deflection of the test specimens was plotted against time using
an oscillographic recorder. Fundamental frequencies and
damping ratios were calculated from the recorded signals using
fi ve or more cycles. Damping ratios were based on logar i thmic
decrement.
Further details of the specimens and test setup are given
elsewhere. (I) Table 1 summar izes concrete properties and
vertical reinforcement percentages used in the analysis
reported in this paper.
FREQUENCY CALCULATIONS
In the analysis of response to dynamic load ings, determin
ation of undamped natural frequencies of a structure is of a
vital importance. For this reason it is useful to develop
methods of evaluating natural frequencies. The "correctness" of
the assumptions may be determined by compar ing the calculated
results with experimental values.
Two methods of analysis were used to estimate the funda
mental frequency of undamaged walls in this program. Method 1
is an approximate analysis. Method 2 is a more elaborate
analysis developed primarily to investigate the effect of shear
deformations.
In Method 1, fundamental frequency was calculated using the
Rayleigh method. The derivation is available in standard
textbooks. (2,3) Only flexural deformations and gross section
properties were considered. The method was relatively simple
to apply.
- 20 -

TABLE 1 - CONCRETE PROPERTIES AND REINFORCEMENT PERCENTAGES
Compressive Modulus of Reinforcement
Specimen Strength, f' (a) Elasticity, ( a) Percentage (b) (psi) c E (ksi) (%)
(1) (2 ) c (3) (4)
I
Fl 5580 3690 2.16
Bl 7690 4080 0.77
B2 7780 4200 2.27
B3 6860 3960 0.77
B4 6530 4100 0.77
B5 6570 3970 2.27
B5R 6200 4010 2.27
Rl 6490 4030 0.49
R2 6740 3890 1.00
(a) Average properties are for lower 6 ft (1.83 m) of wall. For Specimen B5R average properties are for replaced web concrete
(b) Gross reinforcement ratio based on the total vertical reinforcement and the gross sectional area.
1000 psi = 1 ksi = 6.895 MPa
- 21 -
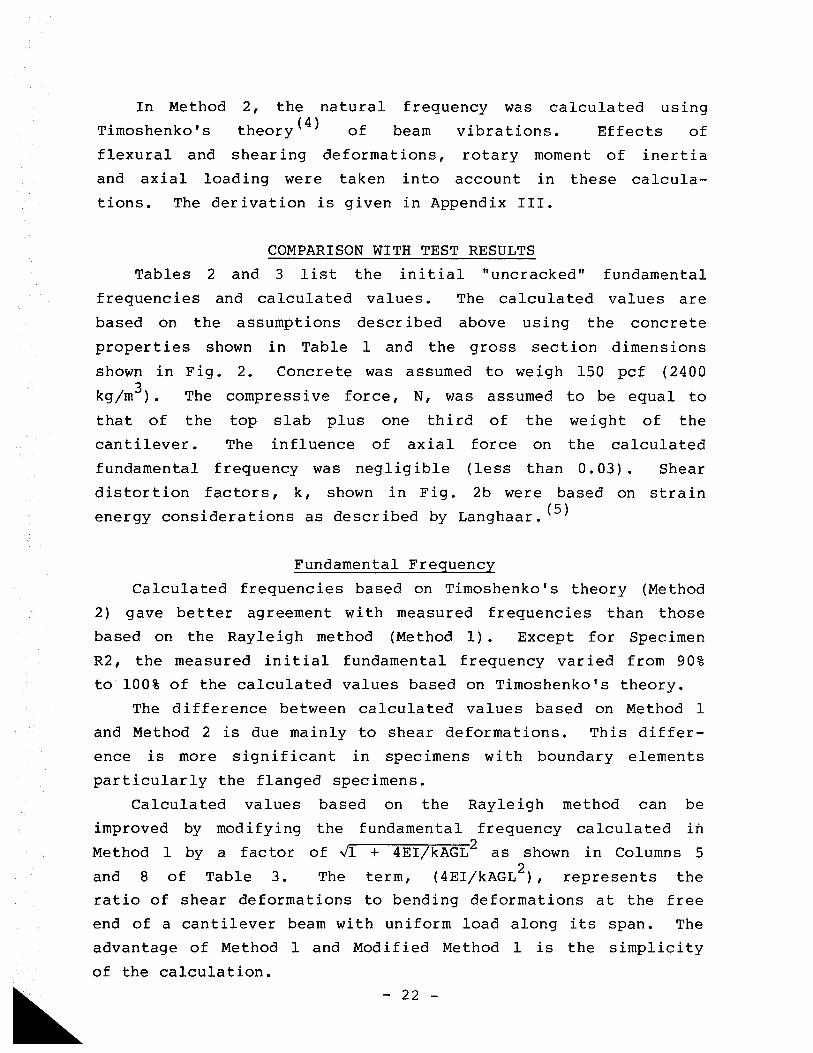
In Method
Timoshenko's
2, the natural theory (4) of
frequency was calculated using
beam vibrations. Effects of
flexural and shear ing deformations, rotary moment of inertia
and axial loading were taken into account in these calcula
tions. The derivation is given in Appendix III.
COMPARISON WITH TEST RESULTS
Tables 2 and 3 list the initial "uncracked" fundamental
frequenc ies and calculated values. The calculated values are
based on the assumptions descr ibed above using the concrete
properties shown in Table 1 and the gross section dimensions
shown in Fig. 2. Concrete was assumed to we igh 150 pcf (2400
kg/m3). The compressive force, N, was assumed to be equal to
that of the top slab plus one third of the weight of the
cantilever. The influence of axial force on the calculated
fundamental frequency was negligible (less than 0.03). Shear
distortion factors, k, shown in Fig. 2b were based on strain
energy considerations as described by Langhaar. (5)
Fundamental Frequency
Calculated frequencies based on Timoshenko's theory (Method
2) gave better agreement with measured frequencies than those
based on the Rayleigh method (Method 1). Except for Specimen
R2, the measured initial fundamental frequency varied from 90%
to 100% of the calculated values based on Timoshenko's theory.
The difference between calculated values based on Method 1
and Method 2 is due mainly to shear deformations. This differ
ence is more significant in specimens with boundary elements
particularly the flanged specimens.
Calculated values based on the Rayleigh method can be
improved by mod ifying the fundamental frequency calculated In
Method 1 by a factor of .../1 + 4EI/kAGL 2 as shown in Columns 5
and 8 of Table 3. The term, (4EI/kAGL2), represents the
ratio of shear deformations to bending deformations at the free
end of a cantilever beam with uniform load along its span. The
advantage of Method 1 and Modified Method 1 is the simplicity
of the calculation.
- 22 -
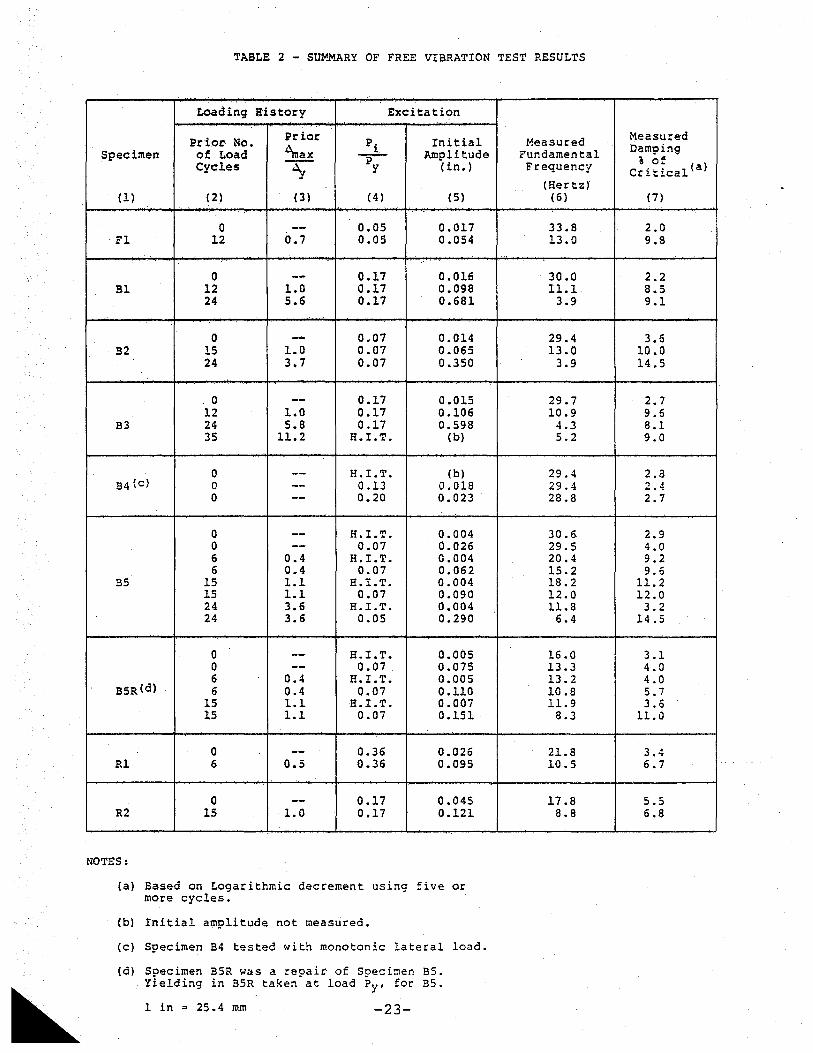
TABLE 2 - SU~~RY OF FREE VIBRATION TEST RESULTS
Load in9 Hi story Excitation
Prior No. Prior Pi Initial
Specimen of Load '1nax Amplitude Cycles -s; -v; (in.)
(1) (2) (3) (4) (5)
a -- 0.05 0.017 F1 12 0.7 0.05 0.054
a - 0.17 0.016 B1 12 1.0 0.17 0.098
24 5.6 0.17 0.681
0 - 0.07 0.014 B2 15 1.0 0.07 0.065
24 3.7 0.07 0.350
0 -- 0.17 0.015 12 1.0 0.17 .0.106
B3 24 5.8 0.17 0.598 35 11.2 H.LT. (b)
a -- H.LT. (b) B4 {cl 0 -- 0.13 0.018
a -- 0.20 0.023
0 -- H.LT. 0.004 a -- 0.07 0.026 6 0.4 H. LT. 0.004 6 0.4 0.07 0.062
B5 15 1.1 H.LT. 0.004 15 1.1 0.07 0.090 24 3.6 H.I.T. 0.004 24 3.6 0.05 0.290
0 -- H.I.T. 0.005 0 -- 0.07 0.075 6 0.4 H.LT. 0.005
B5R (d) 6 0.4 0.07 0.110 15 1.1 H.LT. 0.007 15 1.1 0.07 0.151
a -- 0.36 0.026 R1 6 0.5 0.36 0.095
a -- 0.17 0.045 R2 15 1.0 0.17 0.121
NOTES:
(a) Based on Logarithmic decrement using five or more cycles.
(b) Initial amplitude not measured.
(cl Specimen B4 tested with monotonic lateral load.
(d) Specimen BSR was a repair of Specimen Bs. Yielding in BsR taken at load Py , for Bs.
1 in = 25.4 mm -23-
Measured Fundamental Frequency
(Hertz) (6)
33.8 13.0
30.0 11.1
3.9
29.4 13.0
3.9
29.7 10.9
4.3 5.2
29.4 29.4 28.8
30.6-29.5 20.4 15.2 18.2 12.0 1l.8
6.4
16.0 13.3 13.2 10.8 11.9
8.3
21.8 10.5
17.8 8.8
Measured Damping
% of (a) Critical
(7)
2.0 9.8
2.2 8.5 9.1
3.6 10.0 14 .5
2.7 9.6 8.1 9.0
2.3 2.4 2.7
2.9 4.0 9.2 9.6
11.2 12.0 3.2
14.5
3.1 4.0 4.0 5.7 3.6
11.0
3.4 6.7
5.5 6.8

I tv
..l:: I
TA
BL
E
3 -
MEA
SUR
ED
AN
D
CA
LCU
LATE
D
FR
EQ
UE
NC
IES
Calc
ula
ted
F
un
dam
en
tal
(Measu
red
/Calc
ula
ted
) M
easu
red
F
req
uen
cy
, H
ert
z
Fu
nd
am
en
tal
Fre
qu
en
cy
i
Fu
nd
am
en
tal
Sp
ecim
en
Fre
qu
en
cy
M
od
ifie
d
Mo
dif
ied
M
eth
od
M
eth
od
M
eth
od
M
eth
od
M
eth
od
M
eth
od
Hert
z
1 (a
) 2
(b)
1 (c
) 1
2 1
(I)
(2)
(3 )
( 4)
(5)
(6)
(7)
(8 )
Fl
33
.8
41
.1
33
.9
34
.1
0.8
2
1.0
0
0.9
9
Bl
30
.0
37
.4
32
.2
32
.4
0.8
0
0.9
3
0.9
3
B2
29
.4
37
.9
32
.7
32
.8
0.7
8
0.9
0
0.9
0
B3
29
.7
36
.8
31
.7
31
.9
0.8
1
0.9
4
0.9
3
B4
29
.2(d
) 3
7.5
3
2.3
3
2.5
0
.78
0
.91
0
.90
B5
30
.1(d
) 3
6.9
3
1.8
3
2.0
0
.81
0
.95
0
.94
B5R
1
4.7
(d)
----
----
----
Rl
21
.8
25
.9
23
.8
24
.1
0.8
4
0.9
2
0.9
0
R2
17
.8
25
.4
23
.4
23
.6
0.7
0
0.7
6
0.7
5
--------
--------
---
NO
TE
S:
( a)
1·
/ 3
EI/
L3
Fu
nd
am
en
tal
Fre
qu
en
cy
=
F
=
2i\
l M
+
33
m
L/1
40
(b)
Bas
ed
on
T
imo
shen
ko
's
theo
ry.
(c)
Fu
nd
am
en
tal
Fre
qu
en
cy
=
F/~1+4EI/kAGL2
(d)
Av
era
ge in
itia
l m
easu
red
fu
nd
am
en
tal
freq
uen
cy
.
The measured fundamental frequency of Specimen R2 was low
even compared to that of similar Specimen Rl. Measured initial
damping ra tio of Spec imen R2 ind ica tes that it may have had
more cracks than the rest of the specimens before the first
free vibration test. These cracks may have been caused as the
specimen was prepared for test.
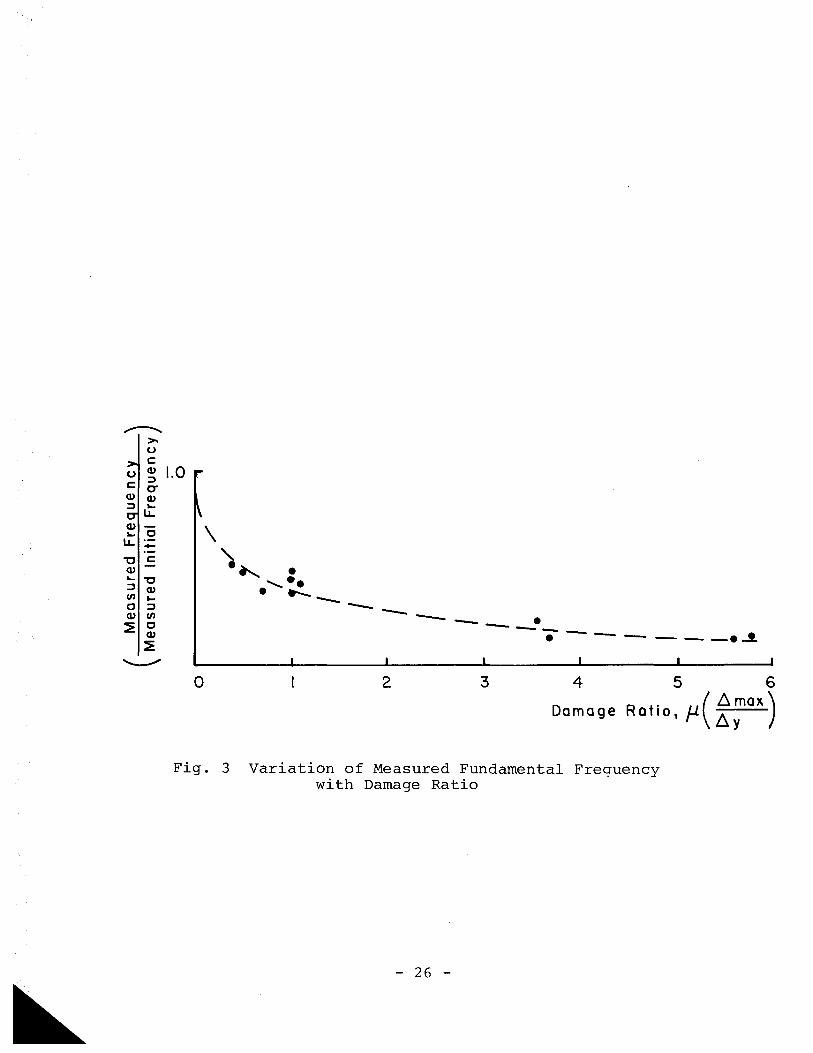
Stiffness Changes
A key character istic of the test specimens was the change
in measured fundamental frequency with the reduction in stiff
ness caused by the reversing lateral loads. Figure 3 shows the
change in the fundamental frequency with the damage ratio, de
fined as ~ = ~ / ~. The figure shows that small amounts max y of damage significantly reduced the fundamental frequency of
each specimen.
Most of the reductions in the measured frequencies were
caused by cracking before first yielding of main flexural
reinforcement (J:l<l). This is expected since the test
structures were lightly reinforced for flexure. Additional
damage (Ji 2 1) had relatively less influence on the fundamental
frequency.
As seen in Table 2, the magnitude and changes in the
measured frequency of repaired Specimen B5R are significantly
lower than those of Specimen B5. This is because only the web
of the Specimen B5R was repaired. The boundary elements were
already cracked and the reinforcement had experienced yield
excursions.
The lateral resisting stiffness of each specimen decreased
as the load level increased. (I) This explains the decrease
in the measured frequencies of Specimens B4, B5, and B5R wi th
increasing initial amplitude of free vibration.
Damping
Because of its convenience in dynamic analysis, viscous
damping is used traditionally to represent energy dissipation
in the linear range of response of structures subjected to
dynamic loading. Viscous damping is considered as a percentage
- 25 -
,..--..... >. u c Q,)
:J CT Q,) ~ u.
Q,) 0 ~
u. -"0 c Q,) ~ "0 :J Q,) (/) ~
0 ::::J Q,) (/)
~ 0 Q,)
~
"--""
1.0
0
\ "-e~ e
,ee e ___ __ -- ---2
___ e_
e --- ---e~
3 4 5 6
Damage Ratio, f-L(~;ax)
Fig. 3 Variation of Measured Fundamental Frequency with Damage Ratio
- 26 -

of the critical viscous damping. Critical damping is defined
as the smallest amount for which no oscillation occurs in a
system subjected to an initial disturbance.
Measured damping shown in Column (7) of Table 2 represents
the percentage of critical viscous damping of the test
spec imens at very low amplitudes only. The magn i tude of the
initial amplitude is given in Columns (4) and (5) of the same
table. It should be noted that the damping percentages are for
the structural walls alone. Therefore, they do not represent
overall damping of reinforced concrete buildings. Damping of a
building would depend on the damping of the structural systems
and nonstructural elements as well as on friction between
different elements.
Measured damping after the specimens were cracked was
primarily due to the energy dissipated by friction between
crack surfaces. Figure 4 shows the variation of damping
measured in the "Initial Displacement-Sudden Release
Tests" (1) with the damage ratio. As shown in Fig. 4, damping
increased significantly with initial cracking (11<1). Further
damage did not significantly influence measured damping.
Table 2 shows that the amount of damping increased with
initial amplitude of the free vibration. For "undamaged"
specimens or for very small amplitude vibrations, little
friction developed along the cracked surfaces and the measured
damping was small. This can be seen from the test results for
Specimens B4, B5, and B5R.
CONCLUSIONS
Initial frequencies are a good indicator of the impor
tance of the different structural actions on a specific struc
tural system. For structural walls similar to those tested,
the inclusion of shear deformations in the calculation of
natural frequencies has a significant effect. This is
particularly true for walls with large boundary elements.
- 27 -

15 0' c: a. E 0 -0
0 10 en (,) :::)
0 -(,) ~
en U > -- 0
c: ~ 5 Q) 0
0 -> :::)
CT ILl
•
• •
o
••
• •
I
• •
2 3 4
Fig. 4 Variation of Measured Damping with Damage Ratio
- 28 -
• •
5 6

Two methods are presented for the calculation of funda
mental frequency. The Rayleigh method when modified and the
Timoshenko method gave good compar ison between calculated and
measured values. The modified Rayleigh method is preferred
because the values can be calculated easily.
It ·should be noted that an exact calculation of the initial
natural frequencies of reinforced concrete structures is of
limited usefulness in predicting response to strong dynamic
motions. This is because of the considerable reductions in
frequency caused by cracking of the concrete and yielding of
the reinforcement.
Implications of various levels of structural damage are
particularly important in considering the response of rein
forced concrete structures subjected to earthquake motions. In
some cases reinforced concrete elements particularly structural
walls must remain elastic or nearly elastic to perform their
allocated safety function. Test results considered in this
paper indicate that nonlinearity occurs at load levels lower
than initial yield (~< 1) • This is sufficient to reduce
considerably the required design values. Therefore, linear
elastic analysis based on "uncracked" properties may be
unreasonably conservative particularly for lightly reinforced
concrete members.
ACKNOWLEDGMENTS
This work was part of a combined experimental and ana
lytical investigation on the earthquake resistance of struc
tural walls supported by the National Science Foundation under
Grant Nos. ENV 74-14766 and PFR-771533 and by the Portland
Cement Association. The investigation was under the direction
of Dr. W. G. Corley and Mr. M. Fintel. Any opinions, findings,
and conclusions expressed in this paper are those of the author
and do not necessarily reflect the views of the National
Science Foundation.
- 29 -

The work was carried out in the Structural Development
Department of the Portland Cement Association under the
direction of Dr. H. G. Russell, Director. Suggestions by the
author's colleagues, Dr. A. E. Fiorato, Dr. A. T. Derecho, and
Mr. R. G. Oesterle, are sincerely appreciated.
- 30 -

APPENDIX I - REFERENCES
1. Oesterle, R. G., and Fiorato, A. E., "Free Vibration Tests of Structural Concrete Walls", Report to National Science Foundation, Construction Technology Laboratories, A Division of the Portland Cement Association, Skok ie, Illinois, February, 1980.
2. Clough, R.W., and Penzien, J., "Dynamics of Structures," McGraw-Hill, Inc., 1975.
3. Flugge, W., Handbook of Engineer ing Mechanics, First Ed., McGraw-Hill, 1962.
4. Timoshenko, S. P., Vibration Problems in Engineering, Third Ed., Van Nostrand, Princeton, N.J., 1955.
5. Langhaar, H. L., Energy Methods in Applied Mechanics, John wiley and Sons, Inc., 1962, p. 41.
- 31 -

APPENDIX II - NOTATION
The following symbols are used in this report:
A = cross-sectional area of wall
Cl
, C2
, C3
, C4 = unknown coefficients in Eg. (9 )
Ec = modulus of elasticity of concrete
G E shear modulus of concrete = 2(1 + = u)
I = moment of inertia of wall cross section
J = rotary moment of inertia of top slab
L = span or wall height
M = flexural moment
M = mass of top slab
N = axial force
v = shear force
f' = concrete compressive strength c
k = shear distortion coefficient (= 5/6 for
rectangular section)
m = mass of wall per unit length
r = radius of gyration of wall cross section
t = time
x = independent variable
y = total deflection of the center line (including
bending and shear deformation)
- 32 -
acceleration of wall center line
total slope of wall center line
A = maximum deflection at top of wall during prior -max
lateral loads cycles.
Ay = deflection of top of wall at which first yielding
of main flexural steel was observed during lateral
load tests.
A damage ratio max
~ = = ~ y
'u = Poisson's ratio (taken as 0.15)
'P = slope of wall center line due to bending
<P = eigenfunction for total deflection
e = eigenfunction for bending slope
c.o = angular frequency
- 33 -

APPENDIX III - FREQUENCY ANALYSIS
To develop the second method, the
geometry for a differential wall element
free-body diagram and
shown in Fig. A were
used. Assuming as a first approximation that shear force causes
the element to deform into a diamond shape without rotation of the
cross sections, the slope of the center line caused by flexure is
diminished by the shear distortion (\jI - a y / ax) • If the shear
distortion is zero, the center line will coincide with a line
perpendicular to the face of the cross section.
Using notation in Appendix
rotation and translation of
respectively:
II, the equations of motion for
the differential element are,
mr2 6 = aM - v + N Qy
at 2 ax ax (1)
m ~ = _ av
at2 ax
(2)
Axial force, N, is assumed to be constant with respect to both
time and position.
The bending moment, M, and shear force, V, are related to
deformations by two relationships from elastic theory:
(3 )
,I, _ .£y = 'I' ax (4 )
Eliminating M and V from the four relationships above gives
the following pair of coupled equations:
~ (EI full) + kAG ( 2:i. - \jI) + N 2:i. - 2 D 0 mr = ax ax ax ax at2 (5 )
~ [kAG (~- 0/ ) ] - m ~ = 0 ax at2 (6)
-34-

w
U1
y
/'
_/
/'\
-
/' -
-r
~.-
, ~l
",
::::
=:.
...-
---m
r2- b
t 2
I.. dx
...
1 Ro
tary
In
ert
ia
Mo
me
nt
. ,:>
\0
Q\
eO
(
·0(\
(\\
~~S~
~,. 'b~
__
__
.-
by
= S
lope
of
Ce
nte
r L
ine
bX
o
r E
lasti
c A
xis
x
Fig
. A
D
efo
rmati
on
s an
d
Fo
rces
Acti
ng
o
n D
iffe
ren
tial
Ele
men
t

Equations (5) and (6) can be solved by assuming a solution of
the form:
y = <I> (x)sinoot
~ = e (x)sinoot
(7 )
(8 )
substituting into (5) and (6) and solving the resulting pair
of ordinary differential equations leads to the follo~ing general
expressions for the eigenfunctions <I> and e :
<I> (x) = Cl sin S x + C2 cos S x + C3
sinh Ox + C4 cosh Ox (9)
a4r2(~) _ 2
e (x) kG S [C 2 sin S x - Cl cos S x] + = S (10)
a4r2(~) _ 2 kG ° [C4 sinh ox + C3 cosh ox]
° where
a4r2 (1 EN) + --2-- + kG + 2 2 +
moo r
E N)2 4( 44 E) kG + 2 2 + a 1 - a r kG moo r
The three terms within the first parentheses of last expres
sion represent the effect of rotary moment of inertia, shear dis
tortion and axial force, respectively. The shear distortion is
E/kG times as important as rotary inertia.
Substituting Eqs. (9) and (10) into the four boundary condi
tions gives a set of four homogeneous algebraic equations in the
unknowns Cl , C2 , C3 , C4 . The frequencies are obtained by
equating the determinant of the set to zero.
- 36 -
The boundary conditions for the structural wall as a vertical
cantilever shown in Fig. I are as follows:
(a) at the fixed end (x = 0); yeO) = a and 'l' (0) = a (b) at the free end (x = L);
Shear Force = kAG ( jT - g;;) = - M,}y
Bending Moment = EI ~ = Jm2 ,l. ax 'I'
- 37 -
