neighborhood subprime lending and the performance of
TRANSCRIPT

J R E R � V o l . 3 2 � N o . 3 – 2 0 1 0
N e i g h b o r h o o d S u b p r i m e L e n d i n g a n d t h eP e r f o r m a n c e o f C o m m u n i t y R e i n v e s t m e n tM o r t g a g e s
A u t h o r s Lei Ding, Roberto G. Quercia , and
Janneke Ratcl i ffe
A b s t r a c t This study analyzes the spillover effect of the spatialconcentration of subprime lending on the performance ofrecently originated community reinvestment mortgages targetinglow- to moderate-income borrowers. The level of subprimelending in a census tract is found to be a significant predictor ofthe default and prepayment probability of the communityreinvestment loans in the same neighborhoods. The resultssuggest that the concentration of subprime lending and theresulting clusters of foreclosed properties reduce neighborhoodproperty values and increase price volatility. The loweredproperty values and the increased volatility increase the defaultprobability of borrowers holding any loan product, includingcommunity reinvestment mortgages. This study provides newevidence concerning the negative impacts of the concentrationof subprime lending in certain neighborhoods.
There have been an unprecedented number of defaults by subprime mortgages,with even more subprime foreclosures likely.1 However, the issues around how tokeep borrowers in their homes affect all market segments, not just subprime loans.One major concern is the spillover effect from the subprime crisis where thesubprime foreclosures are usually concentrated in certain markets andneighborhoods (Calem, Gillen, and Wachter, 2004). Because of the concentrationof subprime mortgage loans in certain areas, there is a potential for negativeexternalities from the subprime lending because of the reduced access to primelending, concentration of foreclosures, and the resulting reduced property values.In fact, the performance of other mortgage products, such as FHA loans and someprime loan products, has become worse, as indicated by recent evidence of sharpincreases in delinquencies and foreclosures.2 What caused the defaults of othermortgage products, especially the Community Reinvestment Act (CRA) loansserving low- and moderate-income (LMI) borrowers during the housing crisis? Inparticular, what is the spillover effect of the meltdown of the subprime market onthe default risk of CRA-type loan products, especially considering theconcentration of subprime loans in particular places?

3 4 2 � D i n g , Q u e r c i a , a n d R a t c l i f f e
Research has identified that subprime loans typically have higher delinquency anddefault rates (Gerardi, Shapiro, and Willen, 2007). Immergluck (2008) indicatesthat subprime loans foreclose at rates 10 to 20 times the rate of prime loans, whendifferent measures of foreclosures and different definitions of subprime loans areused. Research has also documented some evidence of the negative effects offoreclosures on property values, the community, the municipal government, andthe local economy (Apgar, Duda, and Gorey, 2005; Pennington-Cross and Ho,2006a; Immergluck and Smith, 2006; Shlay and Whitman, 2006; Lin, Rosenblatt,and Yao, 2008). However, the interplay between the concentration of subprimelending and the performance of other loan products in a neighborhood has receivedlittle attention. Only a few studies have investigated the impact of certainneighborhood characteristics on the performance of residential mortgages, but theimpact of subprime lending in a neighborhood has not been considered (e.g.,Cotterman, 2001). This is in part because subprime lending has grown significantlyonly since the early 2000s and the meltdown of the subprime market happenedvery recently.
To fill the gap in the literature, this study focuses on the relationship between theconcentration of subprime lending and the performance of a sample of CRA-typemortgages serving low- and moderate-income borrowers in the sameneighborhoods. Instead of using data at the aggregate level, this study uses micro-data to analyze how subprime lending impacts the performance of a sample ofCRA-type mortgage within the same neighborhood. The particular dataset comesfrom the Community Advantage Program (CAP) developed by a nonprofitcommunity development financial institution, Self-Help Ventures Fund (Self-Help), in partnership with a group of lenders, Fannie Mae, and the FordFoundation (Ding, Quercia, and Ratcliffe, 2008). Though borrowers in thisprogram usually have greater credit risk than traditional prime borrowers, the vastmajority of loans originated under this program features terms associated with theprime market: 30-year fixed-rate amortizing loans with prime-level interest rates,no prepayment penalties, no balloons, escrows for taxes and insurance,documented income, and standard prime-level fees. CAP borrowers are LMIhomebuyers, with high shares of minority households, households headed bysingle females, and first-time homebuyers. This program reflects a number ofaffordable lending programs stimulated by CRA, which target LMI and minorityborrowers across the country.
This study examined a sample of CAP loans originated from 2001 to 2006 fortheir performance during the January 2004 through March 2008 period. Thefindings reveal that the level of subprime activities, measured by the share ofsubprime originations in a census tract, is a significant predictor of theperformance of this sample of CRA-type loans. A higher level of subprime lendingin a neighborhood increases the probability of delinquency and default forborrowers holding affordable mortgages in the same neighborhoods. Other thingsequal, the predicted conditional probability of default for an affordable loan in atract with a high level of subprime lending (assumed 50% in 2005) would be over
N e i g h b o r h o o d S u b p r i m e L e n d i n g � 3 4 3
J R E R � V o l . 3 2 � N o . 3 – 2 0 1 0
34% higher than that for a loan with similar characteristics but in a tract with thenational average level of subprime activities. There is also some evidence that theprepayment probability would be lower for borrowers living in neighborhoodswith a higher level of subprime refinance lending. A two-stage probit least squares(2SPLS) analysis shows that a higher level of subprime activities causes a declinein neighborhood property values and increases the price volatility. Because of thedeclined property value, the default risk of CAP loans in the same neighborhoodsincreases significantly. Overall, this study provides new evidence concerning thenegative impacts of the concentration of subprime lending in certainneighborhoods, and offers some insight into the possible mechanisms throughwhich the concentration of subprime lending impacts the default risk of other loanproducts.
The next section reviews recent literature on residential mortgage default studies,especially the default risk of prime and subprime borrowers and the spillover effectof foreclosures on the neighborhood and community. The third section describesdata and methodology. Empirical results are given in the fourth section, followedby conclusions.
� L i t e r a t u r e R e v i e w
M o r t g a g e B o r r o w e r s ’ B e h a v i o r
There has been extensive literature on residential mortgage foreclosure since the1960s. Borrowers’ options usually include the choices of losing the home( foreclosure, or put option), paying off the mortgage (prepayment, or call option),and remaining active (Deng, Quigley, and Van Order, 2000). The main driver ofwhether the borrower exercises the put option is negative equity in the property,but usually a trigger, such as a sudden drop or loss of income or increase inexpenses, is also required (Vandell, 1995). If there is sufficient equity in the home,a trigger event is usually insufficient to cause default severe enough to lead toforeclosure, because borrowers can simply sell the property or refinance it whenthey experience negative trigger events. In addition, some environmental factors,such as local economic conditions and changes in underwriting standards, alsoinfluence borrowers’ decision to default (Cutts and Merrill, 2008). A downturn inthe local economy will slow home sales, depress prices, and increaseunemployment, thus increasing the default risk relative to stronger economicconditions.
D e f a u l t R i s k o f S u b p r i m e M o r t g a g e s
In general, research has documented that subprime loans typically have higherdelinquency and default rates than prime loans and government-insured products(Gerardi, Shapiro, and Willen, 2007). As summarized by Immergluck (2008),

3 4 4 � D i n g , Q u e r c i a , a n d R a t c l i f f e
subprime loans of all types generally foreclose at rates over 10 times that of primeloans. The high default rate reflects the high-risk characteristics of subprimeborrowers, such as impaired borrower credit scores, lower levels of householdincome and assets,3 or other attributes that increase the credit risk to lenders. Moreimportant, some features and loan terms prevalent in subprime products areassociated with higher default risk. For example, loans with prepayment penaltiesand balloon payments, which are common among subprime products, are foundto have higher default risk (Danis and Pennington-Cross, 2005; Quercia, Stegman,and Davis, 2007). Another feature common among subprime loans but not soamong prime loans is the adjustable rate mortgage (ARM), which periodicallyadjusts the interest rate on the note based on a variety of indices. There is someevidence that subprime ARMs have a higher risk of foreclosure likely because ofthe interest-rate risk they carry (Calhoun and Deng, 2002). At the aggregate level,the share of ARMs appears to be positively associated with market risk asmeasured by the probability of a property declining within two years (Immergluck,2008). Hybrid ARMs, which have fixed rates for the first few years before themortgage converts to annual ARMs and usually also carry a prepayment penalty,have been found to bear a particularly high risk of default when the interest rateresets (Ambrose, LaCour-Little, and Huszar, 2005; Pennington-Cross and Ho,2006b). A recent paper provides evidence that much of the poor performance ofsubprime loans can be attributed to mortgage types not borrower types (Ding,Quercia, Li, and Ratcliffe, 2008).
Foreclosure studies at the market or neighborhood level have also found a strongassociation between foreclosure and subprime lending shares. In their analysis oftract-level foreclosure levels in Chicago, Immergluck and Smith (2004) find thatthe best predictor of future foreclosure levels was the number of subprime loansoriginated over the previous five years. Mian and Sufi (2008) show that placeswith high mortgage rejection rates in the mid-1990s had higher than average priceincreases in the first half of this decade because the development of the nonprime4
sector enabled those who were previously shut out of the housing market topurchase a home. This suggests that the rapid development of nonprime loansbecause of looser underwriting was an important factor in the price bubble andthe subsequent high foreclosure rate. Immergluck (2008) indicates that recentchanges in mortgage markets have resulted in spatially concentrated patterns offoreclosures, particularly in neighborhoods where high-risk products—subprimemortgages, exotic mortgages (such as interest-only, payment-option loans, negativeamortization loans, piggy-back loans, and Alt-A loans), and zero-down-paymentmortgages—are more prevalent.
However, until very recently, subprime loans were a much smaller part of theoverall market and consequently their influence on overall loan performance wasnegligible. For many years, the subprime sector focused on serving credit-blemished borrowers in need of refinancing and was a minor part of the overallmortgage market. When subprime loans first hit a peak in serious delinquencyrates in 2003, they constituted only 4% of the outstanding loans (Cutts and Merrill,

N e i g h b o r h o o d S u b p r i m e L e n d i n g � 3 4 5
J R E R � V o l . 3 2 � N o . 3 – 2 0 1 0
2008). The sizable activity in subprime lending in more recent years should havea greater influence in the mortgage market. The volume of subprime lendingpeaked in 2005, representing about 20% of the dollars of all new loans originatedthat year. In 2007, however, the subprime market dropped sharply, to less than8% of all loan dollars (Inside Mortgage Finance, 2008). As of the fourth quarterof 2007, subprime loans constituted about one eighth of all outstanding loans but54% of the foreclosures started that quarter (Mortgage Bankers Association,2008).
S p i l l o v e r E f f e c t s o f F o r e c l o s u r e s o n N e i g h b o r h o o dP r o p e r t y Va l u e s
While the causal relationship between home prices and foreclosures may be two-directional, there is strong evidence of the negative effects of foreclosures onproperty values. Forgey, Rutherford, and VanBuskirk (1994) and Hardin andWolverton (1996) find that foreclosures are usually sold at a discount of price(about 23%) because of moral risk, deteriorated housing conditions, and othernegative features associated with foreclosure. Similarly, Pennington-Cross and Ho(2006a) find that foreclosed property appreciates on average 22% less than thearea average appreciation rate.
Foreclosures, particularly in lower-income neighborhoods, may lead to lowerproperty values because of abandoned foreclosed properties and the resultingphysical disorder and even crime in the community. One related study, focusingon the impact of delinquency on property values by Simons, Quercia, and Maric(1998), suggests that average sales prices of a given residence fell by $788 per1% increase in tax delinquencies within a one-to-two block area of a residence.Immergluck and Smith (2006) find that foreclosures of conventional single-family(one- to four-unit) loans have a significant impact on nearby property values. Theyestimate that each conventional foreclosure within an eighth of a mile of a single-family home results in a decline of 0.9% in property value, and may be as highas 1.5% in low- to moderate-income communities. Shlay and Whitman’s (2006)study on housing values in Philadelphia finds that an abandoned property loweredvalues on homes within a 150-foot radius by an average of 10% and loweredvalues on homes within a 450-foot radius by an average of 5%. A recent studybased on a 2006 sample in Chicago shows that one foreclosure may lower thevalue of neighboring properties by as much as 8.7% and that the negative spillovereffect on neighboring properties is significant within 0.9 km (about 10 blocks) ofthe property and within five years from the liquidation (Lin, Rosenblatt, and Yao,2009).
In many markets, large numbers of foreclosed properties or properties in theforeclosure process depress the price of all homes and increase the time it takesto dispose of any one property. As of late 2007, in some parts of California, nearly50% of home sales were foreclosed houses, and the share of foreclosed propertiesin Nevada, Colorado, Tennessee, and Michigan ranged from 9.3% in Tennessee

3 4 6 � D i n g , Q u e r c i a , a n d R a t c l i f f e
to 17.5% in Nevada (Zibel, 2008). Faced with the high costs of holding properties,sellers of foreclosed homes are cutting prices rather than holding their propertyfor any extended time. As more foreclosed homes go on sale at prices usuallylower than market values, both the competition and the sale time increases for allsellers.
B r o a d e r S p i l l o v e r E f f e c t f r o m C o n c e n t r a t e d F o r e c l o s u r e s
The concentration of foreclosures imposes significant costs not only on individualborrowers and properties, but also on communities, municipal governments, andthe local economy. Based on operational data from local agencies that handledforeclosures, an early study by Moreno (1995) estimates that a foreclosure, onaverage, costs the study city $27,000 and the neighborhood $10,000. Apgar, Duda,and Gorey (2005, p. 2) find within one single block in the Auburn/Greshamneighborhood of Chicago that ‘‘accounting for both the foreclosure costs paid forby City and County agencies, and the impact of foreclosure on area propertyvalues, a foreclosure on this block could impose direct costs on local governmentagencies totaling more than $34,000 and indirect effects on nearby propertyowners (in the form of reduced property values and home equity) of as much asan additional $220,000.’’
Ultimately, the spillover effects of concentrated foreclosures will likely impact theeconomic and social wellbeing of a community, as rising foreclosures and fallinghouse prices can easily squelch economic activities. The possible consequencesmay include lower consumption and production, increased unemployment, andultimately recession, and may eventually influence the behavior of borrowersholding outstanding mortgages. As a result, the economic conditions ofneighboring homeowners may also be negatively impacted, which could adverselyaffect their ability to make mortgage payments—another possible impact of theconcentration of subprime lending on the performance of other loan products.
In addition, the concentration of subprime lending in certain neighborhoodsreflects the lack of access to prime lending in these neighborhoods. Borrowers inriskier markets dominated by subprime lenders undoubtedly would find it difficultto refinance existing mortgages through the prime market. Immergluck and Wiles(1999) provide evidence that the failure of prime lenders to seek out credit-worthyborrowers in lower-income and minority communities leaves those communitiesvulnerable to subprime lenders.
Overall, the literature review confirms that subprime loans generally carry higherdefault risk and that the proportion of subprime lending in an area is the bestpredictor of future foreclosure levels. A concentration of subprime lending wouldresult in more foreclosures in certain neighborhoods, which very likely leads toreduced values of neighboring properties. If the current value of their propertyfalls below their outstanding loan balance (i.e., their home equity is zero or less),mortgagors are much more likely to default on their loans, no matter what kind

N e i g h b o r h o o d S u b p r i m e L e n d i n g � 3 4 7
J R E R � V o l . 3 2 � N o . 3 – 2 0 1 0
of mortgage products they hold. So the literature suggests that a concentration ofsubprime loans in a neighborhood greatly impacts the overall performance of alloutstanding mortgages. This study links the level of subprime lending to theperformance of a sample of CRA-type loans.
� D a t a a n d M e t h o d o l o g y
D a t a
Data for this study comes primarily from a subset of home purchase loansoriginated by a group of lenders under the Self-Help Ventures Fund’s CommunityAdvantage Program (CAP). Stimulated by the Community Reinvestment Act, CAPloans were originated under lender-crafted affordable mortgage programs. Theseprograms feature customized loan guidelines tailored to meet lenders’ CRA goals,as well as local market needs. Many of these loans are held in lenders’ portfoliosbecause most of them meet neither the underwriting guidelines used by secondarymortgage market institutions nor the underwriting guidelines for FHA loans.However, under the CAP program, participating lenders are able to sell thesenonconforming mortgages to Self-Help, which then securitizes and sells them toFannie Mae or other investors. Participating lenders originate and service the loansunder contract with Self-Help. It should be emphasized that, while many of theborrowers are somewhat credit impaired, the program cannot be characterized assubprime. The CAP portfolio, which is made up of retail (i.e., not broker)originations, features loans with prime terms and conditions, such as noprepayment penalties and no balloons.
A subset of 17,080 CAP loans originated from 2001 to 2006 was used in thisanalysis (Exhibit 1). Loans that had a delinquency or were terminated (eitherforeclosed or prepaid) before 2004 were dropped from the sample. In other words,for loans originated before 2004, only those that were still active and had notexperienced a delinquency before 2004 were included in the sample. All the loansin this sample are home purchase loans with fixed interest rates, withoutprepayment penalties or balloons; over 98% of them have a 30-year amortizationperiod. Loans in this sample are characterized by high original loan-to-value(LTV) ratios: over 79% of loans have an original LTV of 95% or higher, and withover 73% at 97% LTV or higher. This sample of borrowers also has relativelylow credit scores (average score of 680) and low household income (meanhousehold income at origination of about $35,700). The mean back-end ratio—that portion of a person’s monthly income that goes toward debt—was 36%.About 39% of borrowers are minorities, including are African Americans (14.4%)and Hispanics (14.7%). National in scope, this sample of 17,080 CAP loans wereoriginated in 44 states and 8,108 census tracts (Exhibit 2). As Exhibit 2 shows,most tracts (62%) have only one CAP loan; less than 9% of tracts have five ormore CAP loans. Because the number of CAP loans in each tract is very small,

3 4 8 � D i n g , Q u e r c i a , a n d R a t c l i f f e
Exhibi t 1 � Descriptive Statistics of Origination Information for CAP Loans
Variable Percent Mean
Credit ScoreNo Credit Score or missing 3.6%CScore � 620 11.9%CScore 620–659 21.1%CScore 660–719 32.3%CScore �720Credit Score 679.8
Loan CharacteristicsLTV 94.4%Backend Ratio 36.3%Frontend Ratio 27.7%Origination Amount $96,808Note Rate 6.70%
Borrower CharacteristicsFemale Borrower 40.4%Minority Borrower 39.5%African-American Borrower 14.4%Hispanic Borrower 14.7%Income at Origination $34,589
Neighborhood CharacteristicsTract MI �80% AMI 30.0%Tract MI 80–100% AMI 30.2%Tract MI 100–120% AMI 22.9%Tract MI �120% AMI 16.9%�10% Black 56.9%10–15% Black 9.2%15–30% Black 14.2%�30% Black 19.7%
GeographyNC 15.9%OH 13.5%GA 10.4%OK 9.7%IL 7.2%CA 7.2%Other States 36.2%
Origination Year (# of loans)2001 3,5062002 3,5732003 3,0152004 2,9542005 2,3012006 1,731Total 17,080

N e i g h b o r h o o d S u b p r i m e L e n d i n g � 3 4 9
J R E R � V o l . 3 2 � N o . 3 – 2 0 1 0
Exhibi t 1 � (continued)
Descriptive Statistics of Origination Information for CAP Loans
Note: Originated between January 1, 2001, and December 31, 2006. Loans that hadexperienced delinquency or terminated before January 2004 were not included; a few loans withadjusted rates and a number of other loans with missing data were dropped.
Exhibi t 2 � Number of Loans in Census Tract
Number of Loans Frequency Percent
1 5,015 61.9%
2 1,439 17.8%
3 631 7.8%
4 327 4.0%
�5 696 8.6%
Total 8,108 100.0%
Note: The total number of loans is 17,080.
it is safe to assume the performance of CAP loans will not significantly impactthe neighborhood.
This study focuses on the impact of subprime activities in recent years and thestudy period is from January 2004 to March 2008. It is generally accepted thatrecent subprime vintages are riskier than earlier ones: subprime loans thatoriginated in 2005 and 2006, especially subprime ARMs, have performed theworst because of a relaxed underwriting criteria to credit score, lax documentationand verification of income, higher combined loan-to-value ratios, and thepopularity of risky loan terms (Bernanke, 2008). So a concentration of 2005–2006subprime originations would seem to have greater negative externalities.In addition, beginning in late 2006, economic conditions significantly worsened,with a sharp deceleration—and outright decline in some markets—of houseprices, rising interest rates, and in more recent years a weakening economy. Allthese factors impacted the underwriting and performance of different mortgageproducts.
Further, sizable subprime lending activities after 2004 at the neighborhood levelallow a meaningful analysis. After being a minor part of the overall mortgage

3 5 0 � D i n g , Q u e r c i a , a n d R a t c l i f f e
market for many years, the subprime share of all mortgage originations by volumepeaked in 2005. That year subprime loans made up over 20% of the dollars of allmortgages originated (Inside Mortgage Finance, 2008). While the subprime shareof refinance loans decreased and flowed with interest rate fluctuations, thesubprime share of purchase loans grew steadily through 2006 (Immergluck, 2008).The level of subprime lending in 2005–2006 is hypothesized to have greaterimpact on communities because of its relatively larger market share.
HMDA data were used to construct different measures of subprime lending at thecensus tract level, including the share of subprime purchase loans and the shareof subprime refinance loans in census tracts. The term subprime in this analysisrefers to those rate-reported ‘‘higher-price’’ loans in HMDA. Subprime purchaseand refinance loans have different risk characteristics and this study tests thepossible differences empirically. Because changes in the shape of the yield curvecan affect the proportion of loans reported as higher priced in a given year,different measures based on both 2005 and 2006 HMDA data were examined.
As suggested in Mian and Sufi (2008), the subprime share may pick up the looseunderwriting in certain neighborhoods if the impact of recent subprimeoriginations on the performance of CAP loans originated in the same period isexamined. To test the robustness of the results, the sample was divided into twocohorts, with one focusing on 2001–2003 originations and the other on 2004–2006 originations. Using two cohorts supports the analysis of whetherneighborhood subprime lending impacts only loans originated in the softeningmarket or those seasoned loans as well.
M e t h o d o l o g y
Payment history data are used to identify when a loan was delinquent, foreclosed,or prepaid. This study follows the option theory, and views mortgage borrowersas having three options in each month:
� Default: Different measures of default (90-day delinquency orforeclosure/returned loans5) are used in different models.
� Prepaid: If a loan was prepaid before it defaults, it is considered aprepayment.
� Active: Active and not default (not seriously delinquent in some models).
A multinomial logit (MNL) is used to model outcomes with multiple possiblestates. In each month the loan can be in only one state or outcome (active,delinquent, or prepaid). Since the sum of the probabilities of each outcome mustequal one, the increase in the probability of one outcome necessitates a decreasein the probability of at least one competing outcome. Thus the multinomial logitmodel is a competing risk model. The probability of observing a particular loanoutcome is given by:

N e i g h b o r h o o d S u b p r i m e L e n d i n g � 3 5 1
J R E R � V o l . 3 2 � N o . 3 – 2 0 1 0
� Z �� Sj it j itePr(y � j) � for j � 1,22it
� Z �� Sk it k it1 � e�k�1
1Pr(y � j) � for j � 0 (1)2it
� Z �� Sk it k it1 � e�k�1
T N 2
ln L � d ln(Pr(y � j))� � � ijt itt�1 i�1 j�0
where j � 0,1,2 represents the three possible outcomes of a loan and the omittedcategory ( j � 0) is remaining active and not delinquent (ACTIVE). dijt is anindicator variable taking on the value 1 if outcome j occurs to loan i at time t,and zero otherwise. Z contains a set of explanatory variables and � is thecoefficient. S contains the measures of the level of subprime lending in theneighborhood. To control for the potential statistical problems associated withrepeated events, the model is estimated using Stata’s mlogit procedure with anadjustment to the standard errors for clustering by loan.
Many factors besides subprime lending influence the performance of residentialmortgages. Based on the literature, following variables are controlled in the MNLmodel (Exhibit 5 provides summary statistics):
� Value of the Put Option (put): According to the option-based theory,home equity plays a central role in determining the probability offoreclosure. The value of the put option of a loan for each month iscalculated using the unpaid mortgage balance, and the estimated houseprice is calculated using the house price index (HPI) of the Office ofFederal Housing Enterprise Oversight (OFHEO).6 The value of the putoption indicates the ratio of negative equity (unpaid balance minusestimated house price) to the original house price.
� Value of the Call Option (call): To determine whether the call optionis ‘‘in the money,’’ the present discounted value of the current mortgageis compared with the present discounted value of a prevailing market-rate mortgage.7 Falling interest rates will lead to faster prepayments anddrive down delinquency rates as borrowers refinance their way out ofpotential problems. Rising interest rates cause payment shocks at thereset date for adjustable-rate mortgages and reduce the ability ofborrowers to afford a fixed-rate refinance. Saving from refinancing isreported as a ratio, which indicates the fraction of saving by consideringa refinancing mortgage with the prevailing market rate.
� Credit History: Borrower credit scores at origination are controlled, andlower FICO scores are assumed to be associated with higher credit risk.

3 5 2 � D i n g , Q u e r c i a , a n d R a t c l i f f e
� Debt-to-Income Ratio (DTI): DTI variables are controlled in the model,and higher DTIs are also assumed to be associated with higher creditrisk.
� Loan Size (lupb): Loan size is measured by the amount of unpaid balancein the log.
� Loan Age (loanage): Since some early studies indicate that therelationship between loan age and default is not linear, this variable ismeasured by the log value of the number of months after origination.
� Borrower Race: As suggested in the literature, African-Americanborrowers may have higher default rates on conventional residentialmortgages than other borrowers, so dummy variables are included toidentify African-American borrowers and Hispanic borrowers.
� Neighborhood Controls: The following neighborhood controls areincluded to capture neighborhood demographic and economiccharacteristics include: the share of African Americans in a census tractand census tract median income relative to area median income. All thetract-level variables are from the 2000 Census and represent a singlepoint-in-time snapshot of the tract.
� Area Economic Indicators: The monthly unemployment rates at thecounty level from the Bureau of Labor Statistics (BLS) are controlled.
� Time Dummies: Dummies of 2001, 2002, 2004, and 2005 originationsare considered in different models
C a u s a l i t y I s s u e
The MNL model is able to test the association between neighborhood subprimelending and the performance of CAP loans. However, the actual transmissionmechanisms through which subprime activities influence the CAP loanperformance still need to be identified. Since subprime activities seem to influencethe CAP loan performance indirectly, failure to address this problem will resultin biased and inconsistent estimates. As suggested in the literature, the hypothesisin this study is that subprime lending negatively influences neighborhood propertyvalues: a higher level of subprime activities and the resulting high default rateswill lead to deterioration in the property values of the neighborhood. Due to thedeclined property values, the delinquency and foreclosure risk of borrowers inthese neighborhoods holding any type of mortgages, including CAP loans, willincrease significantly. For simplicity, the study focuses on the default behavior ofthe sample of CAP loans originated during 2004–2006 in the period fromorigination to the first quarter of 2008 so there is a cross-sectional dataset.
To control for this endogenous relationship of neighborhood house price dynamicsand CAP borrower default behavior, this study employs a simultaneous equationsmodel with an endogenous continuous variable for neighborhood house priceappreciation and a endogenous binary variable for CAP loan default ( y1 � 1 for

N e i g h b o r h o o d S u b p r i m e L e n d i n g � 3 5 3
J R E R � V o l . 3 2 � N o . 3 – 2 0 1 0
90�day delinquency or foreclosure after origination, 0 otherwise). The model ischaracterized by the structural equations:
y* � � y � � X � � X � u (2)1 1 2 12 12 11 11 1
y � � y � �� X � � X � u (3)2 1 1 12 12 22 22 2
Where is the binary variable for CAP loan default, X12 is a vector of exogenousy*1variables used in both equations, X11 and X22 are vectors of exogenous variablesused exclusively in (2) and (3), respectively. y2 represents neighborhood houseprice changes and two different measures are tried: the absolute change and theprice volatility. The rational for the volatility variables is that consumers usuallydo not observe home value in static terms and recent movement (trends andvolatility) matters as much as absolute changes. Borrower default is hypothesizedas a function of neighborhood house price change and the neighborhood houseprice dynamics is a function of MSA house price change, neighborhood subprimeactivities, and local economic conditions. Of course, the CAP default behavior ishypothesized to further depress neighborhood house property values.
Both a continuous and a dichotomous variable are hypothesized to simultaneouslydetermine each other and this can be estimated by the two-stage probit leastsquares (2SPLS), which has been discussed by Maddala (1983). The cdsimeqcommand in STATA was used to obtain consistent estimates for the coefficients,as well as their corrected standard errors (Keshk, 2003).
In the first stage of the analysis, the neighborhood housing price change isregressed on MSA house price change, neighborhood subprime activities, localeconomic conditions, and other explanatory variables in the model. It is assumedthat area house price change, subprime activities, and other neighborhood controlsare uncorrelated with unobserved determinants of the CAP loan default behaviorand that these instruments only influence the troublesome neighborhood houseprice change, controlling for the other covariates.8
In the second stage of the analysis, the CAP loan default is regressed on thepredicted value of neighborhood house price change, as well as other controls ofindividual borrower credit risk. The instruments, such as neighborhood subprimeactivities, are not included as regressors in the second stage, assuming they donot influence the default behavior directly.
It is difficult to observe the house price change at the neighborhood level.Fortunately, the neighborhood house price change can be proxied based on onequarterly data series that relate to the valuation of the CAP portfolio provided byFannie Mae. The data comprises redrawn mark-to-market loan-to-value ratios(MTMs) and property values can also be derived from the MTMs by means ofthe last observed principal balance on each loan. The full series of data extendfrom the first quarter of 2003 to the second quarter of 2008. Though Fannie Mae

3 5 4 � D i n g , Q u e r c i a , a n d R a t c l i f f e
did not provide the details of the methodology, the MTM data has been used forevaluating acquisitions, internal risk modeling, and fair value computations byFannie Mae. But the MTM property value data generally does not considerproperty-specific characteristics.9 So although the MTM data are assumed toprovide house price information for individual properties, housing price changesderived from the proprietary MTM data are assumed to be a better proxy of theneighborhood housing price dynamics than that based on other house priceindexes. Unfortunately, the MTM data are not available for all CAP loans and4,379 out of the 6,986 CAP loans originated during the 2004–2006 period areused in this analysis. The absolute change and volatility (standard deviation ofhouse price changes) measures of neighborhood house price are constructed foreach loan during the period of the first quarter of 2006 to the first quarter of 2008.
For the default model, except for the endogenous house price change variable, theimportant borrower and loan characteristics are controlled including borrowercredit score, LTV ratios, DTI ratios, race, and loan size. For the neighborhoodhousing price change model, the level of subprime activities is measured by theshare of home purchase/refinance subprime originations at the tract level.Differences in underlying economic conditions across local markets haveimportant implications for both the level and changes of housing price. Localeconomic conditions are measured by county unemployment rates and yearlychanges, as well as levels of per-capita income and its annual changes. The 2006county unemployment data and the yearly changes in unemployment rate from2004 through 2008 were collected from the Bureau of Labor Statistics. Levels ofper-capita income in 2006 and yearly changes for 2005 and 2006 were taken fromthe Bureau of Economic Analysis.10 Higher unemployment or lower incomegrowth (or income declines) are hypothesized to be negatively associated withhouse price appreciation.
� R e s u l t s a n d D i s c u s s i o n
Descriptive statistics suggest that loans in neighborhoods (tracts) with greatersubprime activities have higher delinquency rates and lower prepayment rates.Exhibit 3 shows the worst delinquencies for the CAP loans in this study. Morethan half (52%) were still active and had never experienced any delinquencies asof March 2008. About 32% of borrowers prepaid their mortgages. A total of 20%of the sample experienced different levels of delinquencies, and over 6.3% had atleast one 90�day delinquency. Exhibit 4 shows a crosstab of 90-day delinquencyrates and the level of subprime lending in census tracts. The 90-day delinquencyrate for loans in tracts with extensive subprime purchase lending (with �50%subprime purchase loans in 2005) is about 7%, about 1.5 times that of loans inneighborhoods with less subprime purchase lending (�15% subprime purchaseloans). When the level of subprime lending is measured by the share of subprimerefinance loans in census tracts, this pattern is consistent and more obvious.
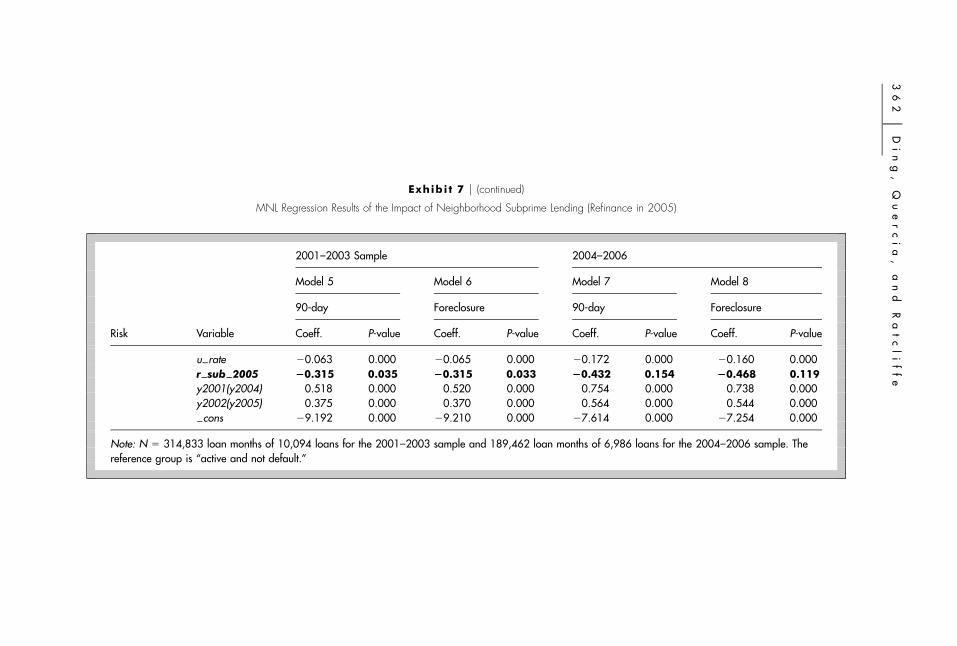
Exhibits 6–8 list the results of the multinomial logit models using differentdependent variables, different study samples, and different measures of subprime

N e i g h b o r h o o d S u b p r i m e L e n d i n g � 3 5 5
J R E R � V o l . 3 2 � N o . 3 – 2 0 1 0
Exhibi t 3 � Loan Performance: Worse Delinquency From January 2004 to March 2008
Number of Loans Percent
Current 8,796 51.5%
30-Days 1,831 10.7%
60-Days 457 2.7%
90� Days Delinquent 1,071 6.3%Returned 186 1.1%Foreclosure 239 1.4%
Prepayment 5,540 32.4%
Total 17,080
Note: The percentages do not sum to 100 because some loans may experience a delinquency firstand then prepay the loan.
Exhibi t 4 � CAP Loan Performance and Neighborhood Subprime Lending in 2005
Share of Subprime LendingDelinquency(90�Days) Foreclosure # of Loans
Purchase 0%–14.9% 4.7% 1.4% 2,63315%–19.9% 5.3% 2.2% 2,11420%–29.9% 6.9% 2.7% 4,21630%–49.9% 7.7% 2.8% 5,304�50% 7.0% 2.7% 2,813
Refinance 0–14.9% 3.1% 0.7% 1,27115–19.9% 3.7% 1.5% 1,50520–29.9% 5.9% 2.0% 5,44230–49.9% 7.5% 3.2% 7,095�50% 10.4% 3.3% 1,767
Note: Based on a sample of 17,080 CAP loans originated from 2001 to 2006 in 8,108 censustracts. If a loan experienced 90-day delinquency first and prepaid later, it was counted as a 90-day delinquency only. The share of subprime lending is based on 2005 HMDA data.
lending at the neighborhood level. Model 1 to Model 4 in Exhibit 6 focus on theimpact of neighborhood subprime purchase activities on default and prepaymentof CAP loans, while Model 5 to Model 8 in Exhibit 7 focus on the impact ofsubprime refinancing activities on the performance of CAP loans. In Models 1, 3,5, and 7, default is measured by 90-day delinquency, while in Models 2, 4, 6, and8 default is measured by whether a loan ends up in foreclosure or is returned. The

3 5 6 � D i n g , Q u e r c i a , a n d R a t c l i f f e
Exhibi t 5 � Variable Description and Means
2001–2003Sample
2004–2006Sample
Variable Mean Std. rr. Mean Std. rr. Description
refi 5.358 6.833 3.931 6.841 Call option, saving from refinancing inthe prime market (percentage)
put �29.201 18.917 �11.887 11.843 Put option: (unpaid balance-houseprice)/original price (percentage)
cred620 0.102 0.303 0.136 0.343 Borrower credit score less than 620
cred660 0.198 0.398 0.234 0.424 Borrower credit score 620–659
cred720 0.330 0.470 0.322 0.467 Borrower credit score 660–719
dti miss 0.072 0.259 0.065 0.247 Debt-to-income data missing
dti36 0.292 0.454 0.252 0.434 Debt-to-income ratio 28%–36%
dti42 0.284 0.451 0.296 0.456 Debt-to-income ratio 36%–42%
dti100 0.171 0.376 0.271 0.444 Debt-to-income ratio greater than 42%
af american 0.159 0.366 0.143 0.350 African-American borrower
hispanic 0.173 0.378 0.078 0.268 Hispanic borrower
lupb 11.237 0.472 11.395 0.445 Unpaid balance (in log)
loanage 3.636 0.516 2.730 0.812 Loan age in months (in log) fromorigination
tra inc80 0.305 0.460 0.278 0.448 Tract median income less than 80%AMI
tra inc120 0.529 0.499 0.548 0.498 Tract median income 80–120% AMI
tra black15 0.136 0.342 0.144 0.352 Af american resident share of 15%–30% in tract
tra black30 0.212 0.408 0.179 0.383 Af american resident share greaterthan 30% in tract
u rate 4.887 1.313 5.132 1.296 County unemployment rate
p sub 2005 0.325 0.172 0.301 0.162 Tract share of subprime purchaselending in 2005
r sub 2005 0.325 0.137 0.360 0.131 Tract share of subprime refinancelending in 2005
y2001 0.325 0.468 Dummy for 2001 originations
y2002 0.349 0.477 Dummy for 2002 originations
y2004 0.506 0.500 Dummy for 2004 originations
y2005 0.318 0.466 Dummy for 2005 originations
Sample size 314,833 loanmonths of 10,094loans
189,462 loanmonths of 6,986loans

Ne
ig
hb
or
ho
od
Su
bp
ri
me
Le
nd
in
g�
35
7
JR
ER
�V
ol
.3
2�
No
.3
–2
01
0
Exhibi t 6 � MNL Regression Results of the Impact of Neighborhood Subprime Lending (Home Purchase in 2005)
2001–2003 Sample 2004–2006
Model 1 Model 2 Model 3 Model 4
90-day Foreclosure 90-day Foreclosure
Risk Variable Coeff. P-value Coeff. P-value Coeff. P-value Coeff. P-value
Delinquent refi 0.069 0.000 0.094 0.000 0.029 0.001 0.017 0.238put 0.033 0.000 0.076 0.000 0.028 0.000 0.070 0.000cred620 0.939 0.000 0.144 0.532 1.989 0.000 1.679 0.000cred660 0.717 0.000 0.004 0.983 1.339 0.000 1.141 0.000cred720 0.339 0.007 �0.196 0.246 0.629 0.000 0.449 0.074dti miss 1.193 0.000 1.762 0.000 0.444 0.081 0.470 0.319dti36 0.444 0.004 0.477 0.041 0.375 0.023 0.434 0.142dti42 0.402 0.010 0.264 0.271 0.351 0.033 0.385 0.194dti100 0.272 0.131 0.204 0.467 0.517 0.002 0.683 0.019af american �0.026 0.852 �0.734 0.005 0.125 0.308 �0.606 0.016hispanic 0.227 0.085 0.275 0.132 0.193 0.202 0.296 0.211lupb �0.479 0.000 �0.517 0.005 �0.227 0.020 �0.043 0.821loanage 1.284 0.000 2.233 0.000 0.972 0.000 1.599 0.000tra inc80 0.100 0.558 0.009 0.972 0.125 0.437 0.426 0.144tra inc120 0.050 0.727 �0.057 0.783 0.208 0.124 0.608 0.019tra black15 0.100 0.443 0.057 0.779 �0.262 0.066 �0.418 0.112tra black30 0.057 0.681 0.239 0.238 �0.178 0.185 0.011 0.964u rate �0.097 0.021 �0.160 0.015 0.073 0.037 0.046 0.472p sub 2005 0.725 0.020 1.432 0.005 0.738 0.012 1.174 0.018y2001(y2004) �1.440 0.000 �2.045 0.000 �0.617 0.000 �0.211 0.375y2002(y2005) �0.887 0.000 �1.163 0.000 �0.352 0.003 �0.027 0.900
cons �5.341 0.000 �7.750 0.001 �7.534 0.000 �12.624 0.000

35
8�
Di
ng
,Q
ue
rc
ia
,a
nd
Ra
tc
li
ff
e
Exhibi t 6 � (continued)
MNL Regression Results of the Impact of Neighborhood Subprime Lending (Home Purchase in 2005)
2001–2003 Sample 2004–2006
Model 1 Model 2 Model 3 Model 4
90-day Foreclosure 90-day Foreclosure
Risk Variable Coeff. P-value Coeff. P-value Coeff. P-value Coeff. P-value
Prepayment refi 0.055 0.000 0.055 0.000 0.055 0.000 0.052 0.000put �0.015 0.000 �0.015 0.000 �0.021 0.000 �0.022 0.000cred620 �0.183 0.004 �0.185 0.003 �0.152 0.193 �0.178 0.118cred660 0.124 0.006 0.133 0.003 �0.038 0.661 �0.041 0.630cred720 0.106 0.006 0.108 0.005 �0.004 0.961 �0.008 0.914dti miss �0.251 0.003 �0.258 0.002 0.078 0.587 0.080 0.574dti36 0.048 0.338 0.055 0.272 �0.325 0.003 �0.310 0.004dti42 0.139 0.006 0.140 0.006 �0.260 0.015 �0.250 0.019dti100 0.080 0.160 0.083 0.143 �0.169 0.128 �0.146 0.185af american �0.482 0.000 �0.481 0.000 �0.516 0.000 �0.512 0.000hispanic 0.071 0.090 0.071 0.090 �0.155 0.211 �0.166 0.179lupb 0.509 0.000 0.514 0.000 0.194 0.036 0.167 0.065loanage �0.422 0.000 �0.435 0.000 0.271 0.000 0.245 0.000tra inc80 �0.004 0.935 0.002 0.968 �0.143 0.177 �0.180 0.089tra inc120 0.042 0.358 0.050 0.276 �0.029 0.723 �0.039 0.636tra black15 0.044 0.363 0.038 0.430 �0.243 0.016 �0.255 0.011tra black30 �0.050 0.332 �0.045 0.376 0.122 0.228 0.123 0.222

Ne
ig
hb
or
ho
od
Su
bp
ri
me
Le
nd
in
g�
35
9
JR
ER
�V
ol
.3
2�
No
.3
–2
01
0
Exhibi t 6 � (continued)
MNL Regression Results of the Impact of Neighborhood Subprime Lending (Home Purchase in 2005)
2001–2003 Sample 2004–2006
Model 1 Model 2 Model 3 Model 4
90-day Foreclosure 90-day Foreclosure
Risk Variable Coeff. P-value Coeff. P-value Coeff. P-value Coeff. P-value
u rate �0.069 0.000 �0.071 0.000 �0.172 0.000 �0.160 0.000p sub 2005 0.232 0.035 0.224 0.041 �0.210 0.365 �0.205 0.373y2001(y2004) 0.516 0.000 0.518 0.000 0.756 0.000 0.740 0.000y2002(y2005) 0.371 0.000 0.366 0.000 0.565 0.000 0.544 0.000
cons �9.420 0.000 �9.443 0.000 �7.963 0.000 �7.624 0.000
Note: N � 314,833 loan months of 10,094 loans for the 2001–2003 sample and 189,462 loan months of 6,986 loans for the 2004–2006 sample. Thereference group is ‘‘active and not default.’’

36
0�
Di
ng
,Q
ue
rc
ia
,a
nd
Ra
tc
li
ff
e
Exhibi t 7 � MNL Regression Results of the Impact of Neighborhood Subprime Lending (Refinance in 2005)
2001–2003 Sample 2004–2006
Model 5 Model 6 Model 7 Model 8
90-day Foreclosure 90-day Foreclosure
Risk Variable Coeff. P-value Coeff. P-value Coeff. P-value Coeff. P-value
Delinquent refi 0.070 0.000 0.097 0.000 0.030 0.001 0.017 0.236put 0.032 0.000 0.074 0.000 0.028 0.000 0.072 0.000cred620 0.936 0.000 0.152 0.502 1.987 0.000 1.681 0.000cred660 0.709 0.000 �0.009 0.961 1.339 0.000 1.145 0.000cred720 0.340 0.007 �0.193 0.254 0.626 0.000 0.447 0.076dti miss 1.180 0.000 1.765 0.000 0.472 0.064 0.530 0.257dti36 0.443 0.004 0.483 0.040 0.379 0.021 0.445 0.132dti42 0.391 0.012 0.243 0.311 0.355 0.032 0.389 0.189dti100 0.258 0.151 0.173 0.536 0.523 0.002 0.696 0.017af american �0.007 0.961 �0.714 0.006 0.152 0.214 �0.547 0.030hispanic 0.253 0.049 0.308 0.079 0.204 0.180 0.320 0.177lupb �0.406 0.001 �0.354 0.064 �0.189 0.066 �0.004 0.984loanage 1.274 0.000 2.235 0.000 0.972 0.000 1.604 0.000tra inc80 0.050 0.780 �0.141 0.589 0.155 0.338 0.496 0.096tra inc120 0.031 0.827 �0.109 0.600 0.225 0.097 0.647 0.013tra black15 0.118 0.363 0.099 0.627 �0.260 0.069 �0.394 0.134tra black30 0.079 0.567 0.284 0.162 �0.146 0.278 0.099 0.675u rate �0.081 0.042 �0.134 0.033 0.083 0.018 0.064 0.300r sub 2005 0.852 0.027 1.931 0.001 0.617 0.114 0.771 0.250y2001(y2004) �1.446 0.000 �2.072 0.000 �0.604 0.000 �0.187 0.430y2002(y2005) �0.904 0.000 �1.191 0.000 �0.343 0.004 �0.015 0.946
cons �6.284 0.000 �9.925 0.000 �8.027 0.000 �13.150 0.000

Ne
ig
hb
or
ho
od
Su
bp
ri
me
Le
nd
in
g�
36
1
JR
ER
�V
ol
.3
2�
No
.3
–2
01
0
Exhibi t 7 � (continued)
MNL Regression Results of the Impact of Neighborhood Subprime Lending (Refinance in 2005)
2001–2003 Sample 2004–2006
Model 5 Model 6 Model 7 Model 8
90-day Foreclosure 90-day Foreclosure
Risk Variable Coeff. P-value Coeff. P-value Coeff. P-value Coeff. P-value
Prepayment refi 0.056 0.000 0.055 0.000 0.055 0.000 0.052 0.000put �0.015 0.000 �0.015 0.000 �0.021 0.000 �0.022 0.000cred620 �0.183 0.004 �0.185 0.003 �0.147 0.210 �0.172 0.133cred660 0.131 0.004 0.140 0.002 �0.036 0.680 �0.038 0.655cred720 0.109 0.005 0.111 0.004 0.000 0.998 �0.004 0.959dti miss �0.279 0.001 �0.286 0.001 0.078 0.584 0.082 0.561dti36 0.043 0.389 0.050 0.317 �0.325 0.003 �0.310 0.004dti42 0.136 0.007 0.137 0.007 �0.258 0.016 �0.247 0.020dti100 0.077 0.174 0.080 0.156 �0.168 0.132 �0.144 0.190af american �0.459 0.000 �0.458 0.000 �0.510 0.000 �0.504 0.000hispanic 0.113 0.006 0.112 0.006 �0.152 0.221 �0.162 0.192lupb 0.494 0.000 0.499 0.000 0.169 0.076 0.140 0.130loanage �0.415 0.000 �0.428 0.000 0.274 0.000 0.249 0.000tra inc80 0.055 0.330 0.060 0.278 �0.122 0.253 �0.153 0.149tra inc120 0.069 0.132 0.077 0.096 �0.018 0.830 �0.025 0.764tra black15 0.057 0.230 0.051 0.281 �0.237 0.019 �0.247 0.013tra black30 0.003 0.958 0.007 0.891 0.141 0.169 0.145 0.152
36
2�
Di
ng
,Q
ue
rc
ia
,a
nd
Ra
tc
li
ff
e
Exhibi t 7 � (continued)
MNL Regression Results of the Impact of Neighborhood Subprime Lending (Refinance in 2005)
2001–2003 Sample 2004–2006
Model 5 Model 6 Model 7 Model 8
90-day Foreclosure 90-day Foreclosure
Risk Variable Coeff. P-value Coeff. P-value Coeff. P-value Coeff. P-value
u rate �0.063 0.000 �0.065 0.000 �0.172 0.000 �0.160 0.000r sub 2005 �0.315 0.035 �0.315 0.033 �0.432 0.154 �0.468 0.119y2001(y2004) 0.518 0.000 0.520 0.000 0.754 0.000 0.738 0.000y2002(y2005) 0.375 0.000 0.370 0.000 0.564 0.000 0.544 0.000
cons �9.192 0.000 �9.210 0.000 �7.614 0.000 �7.254 0.000
Note: N � 314,833 loan months of 10,094 loans for the 2001–2003 sample and 189,462 loan months of 6,986 loans for the 2004–2006 sample. Thereference group is ‘‘active and not default.’’

Ne
ig
hb
or
ho
od
Su
bp
ri
me
Le
nd
in
g�
36
3
JR
ER
�V
ol
.3
2�
No
.3
–2
01
0
Exhibi t 8 � MNL Regression Results of the Impact of Neighborhood Subprime Lending (2006)
2001–2003 2004–2006
90-day Foreclosure 90-day Foreclosure
Risk Variable Coeff. P-value Coeff. P-value Coeff. P-value Coeff. P-value
Default p sub 2006 1.001 0.002 1.783 0.000 0.649 0.025 1.020 0.050Prepay p sub 2006 0.448 0.000 0.430 0.000 �0.199 0.369 �0.220 0.330
Default r sub 2006 0.877 0.020 1.651 0.002 0.979 0.011 0.719 0.275Prepay r sub 2006 �0.393 0.008 �0.401 0.006 �0.523 0.064 �0.528 0.060
Note: The results of other variables are similar to those in Exhibit 6 and Exhibit 7 so they are omitted in this table.

3 6 4 � D i n g , Q u e r c i a , a n d R a t c l i f f e
same regression models are run for both the 2001–2003 (old originations) and the2004–2006 (recent originations) cohorts. Since the qualitative results for all othervariables do not change when the 2006 subprime lending measures are used,Exhibit 8 only lists the results for the subprime lending variables. A positivecoefficient means that the odds of the particular outcome rather than the referencegroup (Active) increase as the independent variable increases; a negativecoefficient means the odds decrease. Exhibits 9 and 10 provide the results of thetwo-stage model using the MTM data.
The results from the MNL model indicate that subprime purchase lending issignificantly (at the 0.05 level) and positively associated with the default risk(Exhibit 6). This result is consistent when different measures of default (eithermeasured by 90-day delinquency or default) are used and when data of old andrecent originations are employed. A higher level of subprime purchase lending ina neighborhood increases the probability of serious delinquency and default forCAP loans. As Exhibit 11 shows, for an average borrower holding a CAP loanoriginated in 2003, the conditional probability of default increases with the shareof subprime purchase loans in tracts where the property is located. Other thingsbeing equal, if the borrower lives in a tract with 25% subprime purchase loans in2005 (the national average share), the predicted probability of default is 0.11% at48 months after origination. However, if the person lives in a tract with a higherlevel of subprime purchase activities, for example, 50% in 2005, the predictedprobability of default would be 0.16%. In other words, other things equal, thepredicted probability of default for a borrower living in a tract with relativelyhigher level of subprime purchase lending (50% in 2005) would be 42% higherthan for the borrower living in an average tract. For more recent originations, thepredicted probability of default for a borrower living in a tract with a higher levelof subprime purchase lending would be 34% higher than for a similar borrowerliving in an average tract (Exhibit 12).
There is also consistent evidence that the share of subprime refinancing mortgagesis negatively associated with the probability of default for old originations (Exhibit6). For recent originations, the share of subprime refinancing mortgages isgenerally insignificant (only significant in Exhibit 8), but the signs of thecoefficients are consistent. As Exhibit 11 shows, the predicted probability ofdefault for a CAP loan originated in 2003 in a tract with a higher level of subprimerefinance activities would be 62% higher than for the borrower living in an averagetract. One possible explanation for the significant and larger negative impact ofsubprime refinance lending on old originations is that subprime lenders havedirected their attention at borrowers with some equity in their houses in morewell-established neighborhoods.
Generally, the share of subprime refinance mortgages is significantly andnegatively associated with the risk of prepayment (except the insignificantcoefficients for Models 7 and 8 in Exhibit 7). One possible explanation is that thehigher level of subprime refinancing activities may reflect a lack of access to primeor FHA activities. In some neighborhoods with previous concentrated subprime

N e i g h b o r h o o d S u b p r i m e L e n d i n g � 3 6 5
J R E R � V o l . 3 2 � N o . 3 – 2 0 1 0
Exhibi t 9 � Estimates of Two-Stage Probit Model
(Volatility of Neighborhood House Price Change)
Home Purchase Refinance
Coeff. P-value Coeff. P-value
default cred620 1.125 0.000 cred620 1.124 0.000cred660 0.864 0.000 cred660 0.863 0.000cred720 0.421 0.000 cred720 0.421 0.000dti miss �0.010 0.947 dti miss �0.004 0.976dti36 �0.015 0.850 dti36 �0.015 0.849dti42 0.049 0.502 dti42 0.049 0.497ltv95 0.441 0.047 ltv95 0.441 0.049ltv97 0.235 0.346 ltv97 0.235 0.350ltv100 0.571 0.005 ltv100 0.570 0.005ltv120 0.682 0.001 ltv120 0.682 0.001af american 0.165 0.081 af american 0.167 0.077hispanic 0.037 0.778 hispanic 0.038 0.771lupb �0.198 0.007 lupb �0.197 0.007tra inc80 0.205 0.083 tra inc80 0.211 0.076tra inc120 0.248 0.012 tra inc120 0.252 0.011tra black15 �0.258 0.012 tra black15 �0.259 0.012tra black30 �0.061 0.528 tra black30 �0.059 0.538y2004 �0.013 0.937 y2004 �0.010 0.952y2005 0.073 0.668 y2005 0.076 0.654I volatility 0.119 0.002 I volitality 0.113 0.005
cons �0.865 0.313 cons �0.867 0.312
volatility p sub 2005 2.195 0.000 r sub 2005 2.299 0.000vol msa 0.445 0.000 vol msa 0.455 0.000pi 2004 0.008 0.046 pi 2004 0.017 0.000pi 0405 3.973 0.003 pi 0405 4.734 0.000pi 0506 5.959 0.000 pi 0506 4.112 0.002unemp 2006 0.232 0.000 unemp 2006 0.257 0.000unemp 0506 0.332 0.000 unemp 0506 0.283 0.000unemp 0607 0.982 0.000 unemp 0607 0.953 0.000unemp 0708 0.281 0.000 unemp 0708 0.295 0.000I default �0.087 0.122 I default �0.111 0.053
cons �0.489 0.076 cons �1.024 0.000
Notes: N � 4,379. volitality represents the price volatility (the standard deviation) during the firstquarter 2006 to the first quarter 2008. I default and I volatility are estimated values from thefirst-stage regressions. Results for the first-stage regression not listed here.

3 6 6 � D i n g , Q u e r c i a , a n d R a t c l i f f e
Exhibi t 10 � Estimates of Two-Stage Probit Model
(Neighborhood House Price Change)
Home Purchase Refinance
Coeff. P-value Coeff. P-value
default cred620 1.144 0.000 cred620 1.143 0.000cred660 0.815 0.000 cred660 0.815 0.000cred720 0.400 0.000 cred720 0.400 0.000dti miss �0.003 0.984 dti miss �0.001 0.993dti36 0.012 0.867 dti36 0.011 0.881dti42 0.054 0.438 dti42 0.053 0.440ltv95 0.356 0.097 ltv95 0.361 0.095ltv97 0.321 0.175 ltv97 0.326 0.173ltv100 0.545 0.005 ltv100 0.550 0.005ltv120 0.652 0.001 ltv120 0.658 0.001af american 0.142 0.119 af american 0.146 0.109hispanic �0.074 0.556 hispanic �0.072 0.565lupb �0.264 0.000 lupb �0.263 0.000tra inc80 0.196 0.065 tra inc80 0.198 0.062tra inc120 0.192 0.034 tra inc120 0.195 0.032tra black15 �0.143 0.153 tra black15 �0.145 0.150tra black30 0.025 0.786 tra black30 0.026 0.782y2004 �0.002 0.986 y2004 �0.002 0.984y2005 0.066 0.483 y2005 0.067 0.478I appre mtm �3.105 0.000 I appre mtm �3.047 0.000
cons 3.317 0.005 cons 3.236 0.007
appre mtm p sub 2005 �0.082 0.000 r sub 2005 �0.042 0.000vol msa 0.012 0.000 vol msa 0.012 0.000pi 2004 �0.003 0.000 pi 2004 �0.004 0.000pi 0405 �0.340 0.000 pi 0405 �0.406 0.000pi 0506 0.624 0.000 pi 0506 0.700 0.000unemp 2006 �0.014 0.000 unemp 2006 �0.016 0.000unemp 0506 �0.025 0.000 unemp 0506 �0.022 0.000unemp 0607 �0.053 0.000 unemp 0607 �0.051 0.000unemp 0708 �0.028 0.000 unemp 0708 �0.028 0.000I default 0.017 0.076 I default 0.015 0.020
cons 1.152 0.000 cons 1.154 0.000
Notes: N � 4,379. appre mtm represents the neighborhood house price change during the firstquarter 2006 to the first quarter 2008. I default and I appre mtm are estimated values from thefirst-stage regressions. Results for the first-stage regression not listed here.

N e i g h b o r h o o d S u b p r i m e L e n d i n g � 3 6 7
J R E R � V o l . 3 2 � N o . 3 – 2 0 1 0
Exhibi t 11 � Conditional Probability of Default Old Originations by Tract Subprime Purchase
Lending (2005)
0.00%
0.05%
0.10%
0.15%
0.20%
0.25%
0.30%
0.35%
0.40%
0% 20% 40% 60% 80% 100%
Sh
Conditional Prob of Default and Tract Subprime Purchase Share
are of Subprime Purchase Loans in Tract (2005)
Note: Based on Model 2 in Exhibit 6 for the 2001–2003 sample. The predicted conditional probability is asof 48 months after origination for a borrower holding a CAP loan originated in 2003, with the mean value ofother regressors.
activities, borrowers may find themselves without access to credit with favorableterms. The results are consistent for both old originations: the level of subprimelending not only impacts the performance of recent originations but also that ofold outstanding CAP mortgages.
R e s u l t s o f t h e Tw o - s t a g e M o d e l
Parameter estimates of the default and housing price change equation with theendogenous variables using the MTM property value data are presented in Exhibit9 (volatility) and Exhibit 10 (neighborhood housing price appreciation). Resultssuggest the endogenous housing price change variable is a significant predictor ofthe default behavior of CAP loans but the endogenous default variable is generallyinsignificant and the only one significant one has a sign different from thehypothesis. It is likely that many of these defaulted CAP (90�days) loans did notend up in foreclosure so their impact on housing price change had beeninsignificant. It is also possible that the impact of the default of CAP loans on

3 6 8 � D i n g , Q u e r c i a , a n d R a t c l i f f e
Exhibi t 12 � Conditional Probability of Default for Old Originations by Tract Subprime Refinance
Lending (2005)
0.00%
0.05%
0.10%
0.15%
0.20%
0.25%
0.30%
0.35%
0.40%
0.45%
0.50%
0% 10% 20% 30% 40% 50% 60% 70% 80% 90% 100%
Share of Subprime Refi Loans in Tract (2005)
Conditional Prob of Default and Tract Subprime Refi Share
Note: Based on Model 2 in Exhibit 7 for the 2001–2003 sample. The predicted conditional probability is asof 48 months after origination for a borrower holding a CAP loan originated in 2003, with the mean value ofother regressors.
neighborhood house price has been marginal since there has been no significantconcentration of CAP loans.
The results suggest that subprime purchase lending activities significantly reducethe neighborhood house price appreciation and increase the house price volatility.For a 1% increase in the share of subprime home purchase originations in theneighborhood in 2005, the house price declines by 0.08% and the price volatilitymeasured by the standard deviation of the housing price index during the studyperiod increases by 2.2%. Considering the fact that most CAP loans are verysensitive to house price changes because of their very high loan-to-values, thehouse price changes due to the concentration of subprime lending will inevitablyinfluence the performance of CAP loans.
The CAP loan default model confirms that the deterioration in neighborhoodproperty values significantly increases the default risk of CAP loans. Based onthe results in the second stage of regression, the house price appreciation

N e i g h b o r h o o d S u b p r i m e L e n d i n g � 3 6 9
J R E R � V o l . 3 2 � N o . 3 – 2 0 1 0
Exhibi t 13 � Conditional Probability of Default for Recent Originations by Tract Subprime Refinance
Lending (2005)
0.00%
0.10%
0.20%
0.30%
0.40%
0.50%
0.60%
0.70%
0% 10% 20% 30% 40% 50% 60% 70% 80% 90% 100%
Share of Subprime Refi Loans in Tract (2005)
Conditional Prob of Default and Tract Subprime Refi Share
Note: Based on Model 2 in Exhibit 6 for the 2004–2006 sample. The predicted conditional probability is asof 48 months after origination for a borrower holding a CAP loan originated in 2004, with the mean value ofother regressors.
significantly reduced the default risk of CAP loans (with an odds ratio of 0.04).The house price volatility also significantly increases the default risk of CAP loans(with an odds ratio of 1.13). The results are robust when different house pricemeasures and different measures of subprime activities at the tract level are usedincluding the share of purchase subprime originations in 2005.11 The onlyexception is that the share of subprime refinance lending in 2005 has aninsignificant impact on the neighborhood house price appreciation but it doesincreases the house price volatility. This is somewhat consistent with the resultsfrom the MNL regression that the refinance subprime activities only have amarginal impact on the performance of recently originated CAP loans.
Several of the variables that reflect local economic conditions were also associatedwith the change in property values between 2006 and 2008. As expected, theunemployment rate in 2006 and the subsequent increase in unemployment ratesignificantly increase the house price volatility and are also significantly andnegatively associated with the house price appreciation. The per capital personalincome in 2004 and the subsequent change cause a higher level of house price

3 7 0 � D i n g , Q u e r c i a , a n d R a t c l i f f e
volatility but are negatively associated with the house price appreciation. It seemsboth the unemployment and income level and shocks increases volatility. But themost recent changes in the level of income per-capita (from 2005 to 2006, pi0506) is positively associated with the house price appreciation. The results aregenerally consistent with Mian and Sufi’s (2008) finding that the rapiddevelopment of nonprime loans in areas with very high denial rates previouslywas an important factor in the price bubble and the subsequent concentration offoreclosures. Very likely these previously underserved neighborhoods had a lowerincome and a high unemployment rate before the housing boom.
The results from the 2SPLS model confirm the negative relationship betweensubprime lending and CAP loan performance from the MNL model. Furthermore,it supports the hypothesis that one mechanism of the impact of the concentratedsubprime lending is by lowering the neighborhood property value or increasingthe house price volatility. The empirical results are consistent with the increasingevidence in the literature that subprime loans have a much higher foreclosure rateand that foreclosures lower the value of neighboring properties and imposesignificant costs on communities. Therefore, the negative spillover effects fromthe concentrated subprime lending contribute to the increased default risk ofCAP loans and one important mechanism is its negative spillover effect onneighborhood property values.
R e s u l t s o f O t h e r C o n t r o l s
As noted previously, many variables other than subprime lending may influencethe performance of residential mortgages. Here are some interpretations of someimportant variables based primarily on results in Exhibit 6 and Exhibit 7, sincethe qualitative results of these variables do not change when different subprimemeasures are used.
� Value of the Put Option: Borrowers with less or negative equity in theirhomes (larger value of put) are more likely to default and less likely toprepay. The results confirm the common wisdom that the level of equityin a home is a strong predictor for prepayment and default.
� Value of the Call Option: The call option (call), which measures thesaving from refinancing in the prime market, has a significant effect onthe outcome of both prepayment and default. The results confirm that ifthe call option is ‘‘in the money,’’ borrowers are more likely to prepaytheir mortgages. The value of the call option is also positively associatedwith the probability of default. This may be explained by the fact thatmany borrowers have greater values of the call option primarily becausemortgage note rates are higher. Since a higher note rate may be regardedas a measure of credit risk, so borrowers whose mortgages have highernote rates may be more likely to default on their mortgages.
� Credit History: Generally, borrowers with lower credit scores are morelikely to experience serious delinquency and default and less likely toprepay.

N e i g h b o r h o o d S u b p r i m e L e n d i n g � 3 7 1
J R E R � V o l . 3 2 � N o . 3 – 2 0 1 0
� DTI: Borrowers with higher debt ratios are more likely to experienceserious delinquencies and less likely to prepay. But borrowers with higherDTI ratios are not necessarily more likely to end up in default.
� Borrower Race: African Americans are significantly less likely to prepaybut not significantly different in their delinquency probability and evenless likely to end up with foreclosure. For Hispanics, the coefficients forboth default and prepayment are insignificant.
� Neighborhood Controls: Greater black representation in neighborhoods(tracts) appears to have no statistically significant impact on both defaultand prepayment. Neighborhood median income level does not havesignificant impact on prepayment. Income level of neighborhood isgenerally insignificant (with one exception of borrowers in the median-income neighborhoods for the outcome of default). Generally, the resultssuggest there is no consistent evidence that racial composition andincome of the neighborhood matter in individual default behavior.12
� Unemployment Rate: County unemployment rate is negativelyassociated with probability of prepayment in all models and positivelyassociated with the probability of delinquency for recent originations. Butfor old originations, county unemployment rate is negatively associatedwith the probability of delinquency and default, which may be explainedby some locational information not fully captured by the model.
� Time Dummies: Older originations are less likely to experience defaultand more likely to prepay according to the MNL model.
� C o n c l u s i o n s a n d I m p l i c a t i o n s
The subprime crisis has significant consequences on the entire housing marketand the overall economy. The impact of the subprime crisis was examined byfocusing on its spillover effect on a segment of community reinvestmentmortgages serving LMI borrowers. This study finds that the neighborhoodsubprime lending level, as measured by the share of subprime purchase orrefinance loans, is positively associated with the probability of default for theborrowers holding CRA-type CAP loans in the same neighborhoods. The level ofsubprime refinance lending is also found to be negatively associated with theprobability of prepayment. While this study sample has some particular features,this study shows how CRA-type borrowers suffer from the subprime mortgagecrisis.
There are some possible explanations for these relationships. One of the possibletransmission mechanisms through which the concentration of subprime lendingimpacted the performance of CAP loans was identified. By employing a 2SPLSmodel, the concentration of subprime lending and the resulting clusters offoreclosed properties in certain neighborhoods was found to reduce propertyvalues and increases volatility. The lowered neighborhood property values increase

3 7 2 � D i n g , Q u e r c i a , a n d R a t c l i f f e
the default probability of borrowers holding any loan products, including CAPloans. The results suggest that the negative spillover effect from the spatialconcentration of subprime lending contributes, at least partially, to the increaseddefault risk of CAP mortgages. By showing that previous subprime activities haveaffected the behavior of other homeowners, the results suggest that in weakerneighborhoods where subprime loans and foreclosures are concentrated,borrowers, no matter what kind of products they have, may have fewer resourcesand opportunities and may be more vulnerable to default.
The results also suggest that the level of subprime activities can serve as a measureof neighborhood risk in the current housing market and can point to previousloose underwriting, rising subprime foreclosures, or falling neighborhood houseprices. Using the share of subprime purchase or refinance loans in each censustract, based on readily available HMDA data, researchers and policymakers canroughly track local lending activities, identify potential hot spots, and better targetintervention efforts, such as foreclosure prevention counseling or other services.Although private lenders are originating few subprime loans at any terms now,the spatial concentration of risky loan products should be monitored more closely.Future research would also benefit from identifying threshold effects of the impactof subprime lending and other risky loan products; this could have importantpolicy implications.
� E n d n o t e s1 The Mortgage Banker Association reports that subprime loans in the second quarter of
2008 had a serious delinquency rate 7.6 times higher than that for prime loans (17.9 vs.2.35). In addition, subprime mortgages represent 48% of the newly started foreclosureswhile they only represent 12% of the loans outstanding (MBA, 2008).
2 Since the first quarter of 2005, the foreclosure start rates for prime ARMs increasedfrom 0.17% to 1.06% in the fourth quarter of 2007 and the foreclosure starts rate forprime fixed loans increased from 0.15% to 0.22% (MBA, 2008).
3 Based on data from the Loan Performance, Cutts and Merrill (2008) estimate that theshare of loans in the subprime segment with limited or no income or asset documentationgrew from less than 30% in 2001 to over 50% by 2006 while in the Alt-A segmentthese loans increased to over 80%.
4 The term ‘‘Nonprime’’ includes both loans to borrowers with weak credit histories, aswell as what have come to be called ‘‘A-,’’ ‘‘Alt-A,’’ and other loan types that fail to beeligible for GSE purchase due to factors other than credit.
5 Some seriously delinquency loans were returned to original lenders based on the‘‘limited indemnity’’ rule, which usually requires lenders to retain the main recourse onloans until 12 consecutive on-time payments are made. For this study sample, the 186returned loans are treated as defaults, although Self-Help could not track theirperformance after they were returned to original lenders. This treatment mayoverestimate the incidence of foreclosure, but all these loans had experienced seriousdelinquencies (90�day) and many of them should have ended up in foreclosure in the

N e i g h b o r h o o d S u b p r i m e L e n d i n g � 3 7 3
J R E R � V o l . 3 2 � N o . 3 – 2 0 1 0
current softening housing market although they would not cause further credit losses forSelf-Help.
6 Since the OFHEO house price index (HPI) at metropolitan statistical area (MSA) levelis available quarterly, it is assumed that each month in the same quarter has the sameappreciation rate. If the property is located in an area outside an MSA, state-level HPIare used. Given the MSA house price index HPIi0 at origination and HPIit in month t,the value of the put option for house i with an original purchase price Pi0 can becalculated for each month, t:
(upb � P * (HPI /HPI ))it i0 it i0put � . (2)it Pi0
7 Given the original balance (OBi), the term of the mortgage (TMi), and the interest rateon the mortgage (Ri) for a fixed rate mortgage i, the monthly payments can be calculated:
TMi(1 � R )iPAY � R * OB . (3)� �i i i TMi(1 � R ) � 1i
The future monthly payments (PAYi) are then discounted by the interest rate (Ri) andprevailing interest rate (PRi) separately. The Freddie Mac Primary Mortgage MarketSurvey (PMMS) is used to proxy for prevailing interest rates on prime, conventional,and fixed-rate mortgages:
TM TMi iPAY PAYi iPDC � PDC � . (4)� �cit ritm m(1 � R ) (1 � PR )m�t m�ti i
The call option is defined as the difference in the present values of the payment streamat the mortgage note rate and the prevailing interest rate:
PDC � PDCrit citcall � . (5)it PDCrit
8 The variables selected should meet two requirements. First, conditional on thetroublesome regressor, the instruments must be uncorrelated with the outcome of interest.The second requirement is that the instruments be correlated with the troublesomeregressors.
9 Except the MTM data, Fannie Mae also provides the RPS housing price data, whichincorporates information concerning property transaction, property characteristics, andproperty tax. Because this additional information arrives sporadically, it has morevolatility in individual RPS house price than in individual MTM records.

3 7 4 � D i n g , Q u e r c i a , a n d R a t c l i f f e
10 Since the per capita income data is still unavailable for the years after 2006, the 2004data at the county level are used as a proxy for the neighborhood income level.
11 The same regressions were tried using RPS data and the 2006 subprime lendingvariables. The results are quite consistent with those in Exhibit 9 and 10. The resultsare available upon request.
12 Of course, there is a potential multicollinearity among the neighborhood subprimelending variable and other neighborhood characteristics measure. However, even afterthe subprime lending variables were dropped, the neighborhood characteristics measuresare still insignificant.
� R e f e r e n c e s
Ambrose, B.W., M. LaCour-Little, and Z.R. Huszar. A Note on Hybrid Mortgages. RealEstate Economics, 2005, 33:4, 765–82.
Apgar, W.C., M. Duda, and R. Gorey. The Municipal Cost of Foreclosures: A ChicagoCase Study. Homeownership Preservation Foundation, Housing Finance Policy Research.2005.
Bernanke, B.S. Reducing Preventable Mortgage Foreclosures. Speech at the IndependentCommunity Bankers of America Annual Convention, Orlando, Florida March 4, 2008.Available at: http: / /www.federalreserve.gov/newsevents/speech/bernanke20080304a.htm.
Calem, P.S., K. Gillen, and S.M. Wachter. The Neighborhood Distribution of Sub-prime Mortgage Lending. Journal of Real Estate Finance and Economics, 2004, 29:4, 393–410.
Calhoun, C.A. and Y. Deng. A Dynamic Analysis of Fixed- and Adjustable-Rate MortgageTerminations. The Journal of Real Estate Finance and Economics, 2002, 24:1/2, 9–33.
Cotterman, R.F. Neighborhood Effects in Mortgage Default Risk. U.S. Department ofHousing and Urban Development, Office of Policy Development and Research, 2001.
Cutts, A.C. and W.A. Merrill. Interventions in Mortgage Default: Policies and Practices toPrevent Home Loss and Lower Costs. In N.P. Retsinas and E.S. Belsky (eds.), Borrowingto Live: Consumer and Mortgage Credit Revisited. Brookings Institution Press. Washington,DC, 2008, 203–354.
Danis, M.A. and A. Pennington-Cross. The Delinquency of Subprime Mortgages. FederalReserve Bank of St. Louis, 2005, Research Division Working Paper 2005-022A.
Ding, L., R.G. Quercia, W. Li, and J. Ratcliffe. Risky Borrowers or Risky Mortgages:Disaggregating Effects Using Propensity Score Models. University of North Carolina,Center for Community Capital, Working Paper, 2008. Available at: http: / /www.ccc.unc.edu/documents/RiskyBorrowers RiskyMortgages 1008.pdf.
Ding, L., R.G. Quercia, and J. Ratcliffe. Post-Purchase Counseling and Default ResolutionsAmong Low- and Moderate-Income Borrowers. Journal of Real Estate Research, 2008,30:3, 315–44.
Forgey, F., R. Rutherford, and M. VanBuskirk. Effect of Foreclosure Status on ResidentialSelling Price. Journal of Real Estate Research, 1994, 9, 313–18.
Gerardi, K., A.H. Shapiro, and P. Willen. Subprime Outcomes: Risky Mortgages,Homeownership Experiences, and Foreclosures. Federal Reserve Bank of Boston WorkingPapers 07-15, 2007.
N e i g h b o r h o o d S u b p r i m e L e n d i n g � 3 7 5
J R E R � V o l . 3 2 � N o . 3 – 2 0 1 0
Hardin, W. and M. Wolverton. The Relationship between Foreclosure Status and ApartmentPrice. Journal of Real Estate Research, 1996, 12, 101–09.
Immergluck, D. From the Subprime to the Exotic: Excessive Mortgage Market Risk andForeclosures. Journal of the American Planning Association, 2008, 74:1, 59–76.
Immergluck, D. and G. Smith. Risky Business—An Econometric Analysis of theRelationship between Subprime Lending and Neighborhood Foreclosures, Chicago, IL:Woodstock Institute. 2004. Available at: http: / /woodstockinst.org/document/riskybusiness.pdf.
——. The External Costs of Foreclosure: The Impact of Single-Family MortgageForeclosures on Property Values. Housing Policy Debate, 2006, 17:1, 57–79.
Immergluck, D. and M. Wiles. Two Steps Back: The Dual Mortgage Market, PredatoryLending, and the Undoing of Community Development. Chicago, IL: The WoodstockInstitute, 1999.
Inside Mortgage Finance. The 2008 Mortgage Market Statistical Annual. Bethesda, MD:Inside Mortgage Finance Publications, 2008.
Keshk, O.M.G. CDSIMEQ: A Program to Implement Two-Stage Probit Least Squares. TheStata Journal, 2003, 3:2, 1–11.
Lin, Z., E. Rosenblatt, and V. Yao. Spillover Effects of Foreclosures on NeighborhoodProperty Values. Journal of Real Estate Finance and Economics, 2009, 38:4, 387–407.
Maddala, G.S. Limited Dependent and Qualitative Variables in Econometrics. Cambridge,UK: Cambridge University Press, 1983.
Mian, A. and A. Sufi. The Consequences of Mortgage Credit Expansion: Evidencefrom the 2007 Mortgage Default Crisis. 2008. Available at: http: / /ssrn.com/abstract�1072304.
Moreno, A. The Cost-Effectiveness of Mortgage Foreclosure Prevention. Minneapolis:Family Housing Fund. 1995.
Mortgage Bankers Association. National Delinquency Survey. 2008, Fourth Quarter 2007.Available at: http: / /www.mortgagebankers.org/NewsandMedia/PressCenter /60619.htm.
Pennington-Cross, A. and G. Ho. The Value of Foreclosed Property. Journal of Real EstateResearch, 2006a, 28:2, 193–214.
. The Termination of Subprime Hybrid and Fixed-Rate Mortgages. Federal ReserveBank of St. Louis. Research Division Working Paper 2006-042A, July, 2006b.
Quercia, R.G., M.A. Stegman, and W.R. Davis. The Impacts of Predatory Loan Terms onSubprime Foreclosures: The Special Case of Prepayment Penalties and Balloon Payments.Housing Policy Debate, 2007, 18:2, 311–46.
Shlay, A. and G. Whitman. Research for Democracy: Linking Community Organizing andResearch to Leverage Bright Policy. City and Community, 2006, 5:2, 153–77.
Simons, R.A., R.G. Quercia, and I. Maric. The Value of Residential Construction andNeighborhood Disinvestment in Residential Sales Price. Journal of Real Estate Research,1998, 15:1/2, 147–61.
Vandell, K.D. How Ruthless Is Mortgage Default: A Review and Synthesis of the Evidence.Journal of Housing Research, 1995, 6:2, 245–64.

3 7 6 � D i n g , Q u e r c i a , a n d R a t c l i f f e
Zibel, A. Banks Unloading Abandoned Houses at Cut-rate Prices: Trend Putting Pressureof Regular Home Sale. The Toronto Star, Feb 19, 2008. Available at: http: / /www.thestar.com/Business/article/304689.
Lei Ding, Wayne State University, Detroit, MI 48202 or lei [email protected].
Roberto G. Quercia, University of North Carolina, Chapel Hill, NC 27599 [email protected].
Janneke Ratcliffe, University of North Carolina, Chapel Hill, NC 27599 or [email protected].