neinor homes full year 2019 results
TRANSCRIPT

ATRIA HOMES – MADRIDDELIVERED Q1 2019
2019ANNUAL RESULTS PRESENTATION
27th FEBRUARY 2020

2
DISCLAIMER
This Presentation has been prepared by Neinor Homes, S.A. (“Neinor”) for information purposes only and it is not regulated information or information which has been subject to prior registration or control by the Spanish Securities Market Commission. “Presentation”
means this document, its contents or any part of it, as well as any oral presentation, any question or answer session and any written or oral material discussed or distributed during meetings carried out in connection with this document This Presentation may not be
reproduced in any form, used or further distributed to any other person or published, in whole or in part, for any purpose without the express and prior written consent of Neinor. Failure to comply with this obligation may constitute a violation of applicable securities
laws and/or may result in civil, administrative or criminal penalties.
Neither Neinor nor any of its employees, officers, directors, advisers, representatives, agents or affiliates shall have any liability whatsoever (in negligence or otherwise, whether direct or indirect, in contract, tort or otherwise) for any loss howsoever arising from any use
of this Presentation or its contents or otherwise arising in connection with this Presentation.
Neither this Presentation nor any part of it constitutes a contract, nor may it be used for incorporation into or construction of any contract or agreement.
This Presentation may include forward-looking statements about revenue and earnings of Neinor and about matters such as its industry, business strategy, goals and expectations concerning its market position, future operations, margins, profitability, capital
expenditures, capital resources and other financial and operating information. The words “believe”, “expect”, “anticipate”, “intends”, “estimate”, “forecast”, “project”, “will”, “may”, “should” and similar expressions may identify forward-looking statements. Other
forward looking statements can be identified from the context in which they are made. These forward-looking statements are based on numerous assumptions regarding the present and future business strategies of Neinor and the environment in which Neinor expects
to operate in the future. These forward-looking statements involve known and unknown risks, uncertainties and other factors, which may cause the actual results, performance or achievements of Neinor, or industry results, to be materially different from those
expressed or implied by these forward-looking statements. Forward-looking statements should not be taken as forecasts or promises and they should not be taken as implying any indication, assurance or guarantee that the assumptions on which such forward-looking
statements have been prepared are correct or exhaustive or, in the case of the assumptions, fully stated in the Presentation. As a result, you should not place undue reliance on these forward-looking statements as a prediction of actual results or otherwise.
The information in this Presentation, which does not purport to be comprehensive, has not been independently verified and will not be updated. The information in this Presentation, including but not limited to forward-looking statements, applies only as of the date of
this Presentation and is not intended to give any assurances as to future results. Neinor expressly disclaims any obligation or undertaking to disseminate any updates or revisions to the information, including any financial data and any forward-looking statements
contained in this Presentation, and will not publicly release any revisions that may affect the information contained in this Presentation and that may result from any change in its expectations, or any change in events, conditions or circumstances on which these
forward-looking statements are based or any change in whichever other events or circumstances arising on or after the date of this Presentation.
Market data and competitive position used in this Presentation not attributed to a specific source are estimates of Neinor and have not been independently verified. In addition this Presentation may contain certain information in relation to other companies operating in
the same sector and industry. This information has been derived from publicly-available sources and Neinor accepts no responsibility whatsoever and makes no representation or warranty expressed or implied for the fairness, accuracy, completeness or verification of
such information.
Certain financial and statistical information contained in this Presentation is subject to rounding adjustments. Accordingly, any discrepancies between the totals and the sums of the amounts listed are due to rounding. Certain management financial and operating
measures included in this Presentation have not been subject to a financial audit or have been independently verified by a third party. In addition, certain figures contained in this Presentation, which have also not been subject to financial audit, may be combined and
pro forma figures.
The financial information contained herein may include items which are not defined under the International Financial Reporting Standards as adopted by the European Union (IFRS-EU) and which are considered to be “alternative performance measures”. Other
companies may calculate such financial information differently or may use such measures for different purposes, limiting the usefulness of such measures as comparative measures. Such financial information must be considered only in addition to, and not as a
substitute for or superior to, financial information prepared in accordance with IFRS-EU.
IMPORTANT INFORMATION: This Presentation does not constitute or form part of any purchase, sales or exchange offer, nor is it an invitation to draw up a purchase, sales or exchange offer, or advice on any stock issued by Neinor. In particular, this Presentation and the
information contained herein do not form part of or constitute (i) an offer to acquire or subscribe shares, in accordance with the Spanish Securities Market Act and its implementing regulation or (ii) an offer to purchase, sell or exchange securities, a solicitation of any
offer to purchase, sell or exchange securities or a solicitation of any kind of voting rights in the United States or any other jurisdiction.
The securities of Neinor have not been and will not be registered under the U.S. Securities Act of 1933, as amended (the “US Securities Act") or the laws of any state or other jurisdictions of the United States. Such securities may not be offered or sold in the United States
except on a limited basis, if at all, to Qualified Institutional Buyers (as defined in Rule 144A under the US Securities Act, as amended) in reliance on an exemption from, or transaction not subject to, the registration requirements of the US Securities Act. The securities of
Neinor have not been and will not be registered under the applicable securities laws of any state or jurisdiction of Australia, Canada, Japan or Switzerland and, subject to certain exceptions, may not be offered or sold within Australia, Canada, Japan or Switzerland or to
or for the benefit of any national, resident or citizen of Australia, Canada, Japan or Switzerland.
The information contained in this Presentation does not constitute investment, legal, accounting, regulatory, taxation or other advice and the information does not take into account your investment objectives or legal, accounting, regulatory, taxation or financial
situation or particular needs. You are solely responsible for forming your own opinion and conclusions on such matters and the market and for making your own independent assessment of the information included in this Presentation. You are solely responsible for
seeking independent professional advice in relation to the information contained herein and any action taken on the basis of the information contained herein. No responsibility or liability is accepted by any person for any of the information or for any action taken by
you or any of your officers, employees, agents or associates on the basis of the information included in this Presentation.

3
Member of:
IBEX MID CAP®
Borja García
Egotxeaga
Chief Executive Officer
Jordi Argemí
García
Deputy CEO / CFO
Business & Financial Review
1Launching Neinor Rental
2 AAppendixQ&A
5ESG Reporting
3Guidance 2020
4
Juan Gómez Vega
Chief Investor
Relations Officer

RIVERSIDE HOMES – MADRIDDelivered Q4 2019
Business & Financial Review
1

5
SOLID PERFORMANCE IN 2019
Guidance exceeded:
Developer gross margin: 30% vs. 28% target
€104m EBITDA Adjusted vs. €70m target
First dividend anticipated: €40m (€0.51 per share) to be paid
during 2020
80% of 11,000-unit land bank in production - Very high cash-flow /
dividend visibility
Strong asset base: NAV(1): €1,288m / NAV per share: €16.30
Proven profitability:
€489m revenues and €64m Net Income
(1) Unadjusted NAV + €38.5m net equity swap debt associated with share buy-back program
0% 0%
46%
70% 65%
19%
0% 0%
87%100%
90%
0% 0%
25%40% 40%
15%
2019 Year-End TargetQ4 2019Q1 2019
Coverage 2019
Coverage 2020
Coverage 2021
Coverage 2019
Coverage 2020
Coverage 2021
Coverage 2019
Coverage 2020
Coverage 2021
+5%
+10%
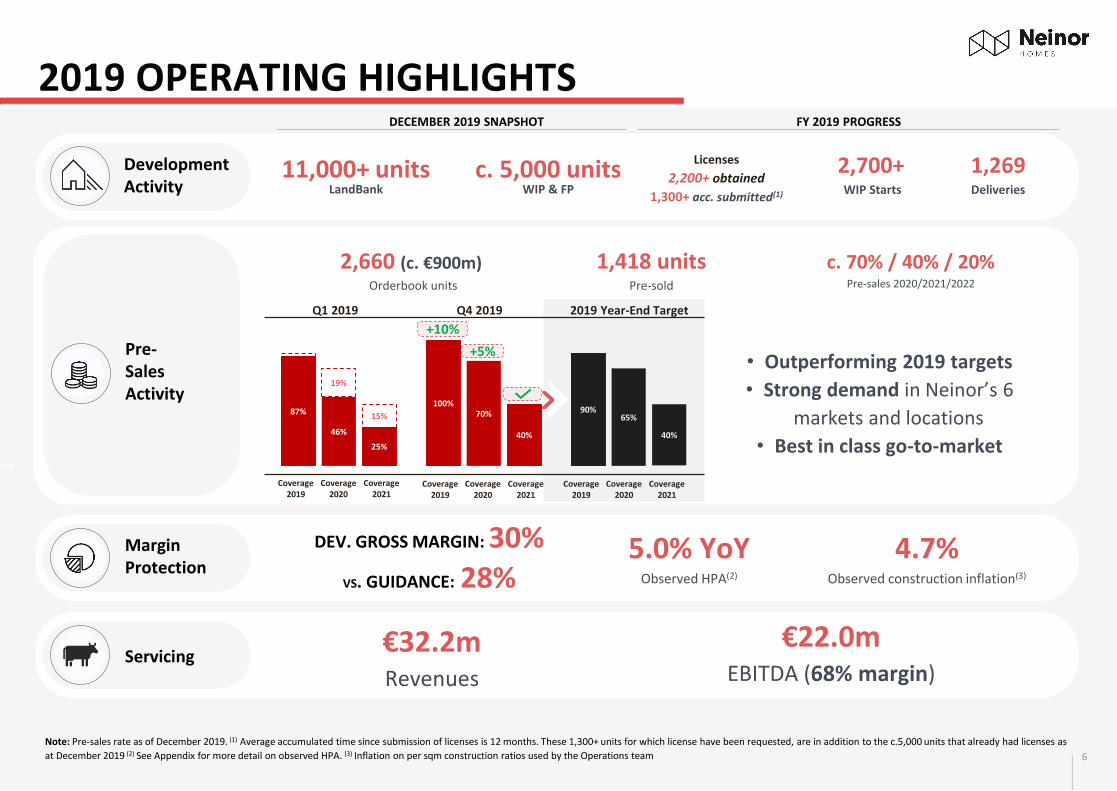
2019 OPERATING HIGHLIGHTS
6
Note: Pre-sales rate as of December 2019. (1) Average accumulated time since submission of licenses is 12 months. These 1,300+ units for which license have been requested, are in addition to the c.5,000 units that already had licenses as
at December 2019 (2) See Appendix for more detail on observed HPA. (3) Inflation on per sqm construction ratios used by the Operations team
Servicing€32.2mRevenues
€22.0mEBITDA (68% margin)
Pre-Sales Activity
c. 70% / 40% / 20%Pre-sales 2020/2021/2022
1,418 unitsPre-sold
2,660 (c. €900m) Orderbook units
Margin Protection
5.0% YoYObserved HPA(2)
4.7%Observed construction inflation(3)
DEV. GROSS MARGIN: 30%
VS. GUIDANCE: 28%
DECEMBER 2019 SNAPSHOT FY 2019 PROGRESS
c. 5,000 unitsWIP & FP
Development Activity
Licenses
2,200+ obtained
1,300+ acc. submitted(1)
2,700+WIP Starts
11,000+ unitsLandBank
1,269Deliveries
• Outperforming 2019 targets
• Strong demand in Neinor’s 6
markets and locations
• Best in class go-to-market
Comments

2019 performance allows anticipation of initial annual dividend of €40m, to be paid in 2020
7
Year on Year ProgressFinancial KPIs
€1.2bnDevelopment
Stock
80%Of Development
Stock is Active
€173m(2)
CashBalance Sheet
€104mEBITDA Adjusted
€489mRevenues(1)
€64mNet Income
P&L
€180mNet Debt
€261mAdjusted Net Debt
16%LTV
Leverage
€1.65bnGAV
€1.3bn(3)
NAV
€1.2bnNNAV
Valuation
c. €90mof €250-300m‘19-’22 plan
€49.3mShare buy-back executed
(out of max. €100m)
€40m €0.51 p.s.
Dividend PayablePay-out >60%
Dividends &Buy-Back
(1)Legacy represented sales of €14.3m in 2019. As of 31st of Decembe 2019r, €11m remaining book value to be sold-down in 2020, associated with GAV (Savills 2016) of €14m. (2)Includes €43m of restricted cash (3)Unadjusted NAV + €38.5m net equity
swap debt associated with share buy-back program
2019 FINANCIAL HIGHLIGHTS
442313
FY2019FY2018
+41% Development Revenues
10458
FY2019FY2018
c.2x EBITDA adjusted
6450
FY2019FY2018
Net Income +28%
16%19%
FY2019FY2018
Reduction of Leverage Ratios
Initial
dividend

8
(1) Status as of end of December 2019 (2) CFO stands for Certificado Final de Obra, last milestone before requesting the first occupancy license (LPO, see next footnote). (3) LPO stands for “Licencia de Primera Ocupación”, the municipal certificate
that allows developers to notarize and deliver the units to the buyers. (4) Includes sites that were anticipated from 2020 (Abra Homes and Leioandi Homes)
HIGH VISIBILITY TO ACHIEVE TARGETS
STATUS
2020
100% WIP
100% WIP100% LICENSES
WIP STATUS(1)
37%
49%
100% FOUNDATION WORKS
12% LPO(3)
5% CFO(2)
84% FAÇADE WORKS
15% FAÇADE WORKS
37% STRUCTURE WORKS
49% FOUNDATION WORKSCURRENT PRE-SALES
40%
EXPECTED PRESALES BY
YEAR-END
~65%
CURRENT PRE-SALES
20%
EXPECTED PRESALES
BY YEAR-END
~40%
REVENUE VISIBILITY
• <1,000 pending licenses
• Focus on reaching pre-sales milestones for
works start
• 100% of the units already in WIP
• Intense focus on construction progress and
steady pre-sales
• c. 200 units in the process of being delivered
• c. 300 units awaiting CFO
• On track to deliver targets
20% WIP42% LICENSES
38% PENDING LICENSES
15%
84%5%
12%
20%
42%
38%
CURRENT PRE-SALES
C. 70%(4)
EXPECTED PRESALES BY
YEAR-END
~90%
2021
2022
1,700+ UNITS
2,400+ UNITS
2,500+ UNITS

9
Focus on 7 top locations in Spain
Pipeline by geographical distribution (35,000 units)
Strategy:
o Location: Focus only on the
top performing markets and
locations
o Equity-efficient, accretive
opportunities
Global pipeline: c. 35k units and
€1.4bn
• Type: 80% 1st residence /
20% second residence
• Planning status: fully and
non-fully permitted
LAND ACQUISITIONS – ACTIVE PIPELINE & STRATEGY€250m / 2,500 units being negotiated under exclusivity
Under exclusivity: €250m / 2,500
units
2020 acquisitions fire power:
€110m+ cash
50% Center
25% South East
15% North
5% Levante5% East
Active pipeline
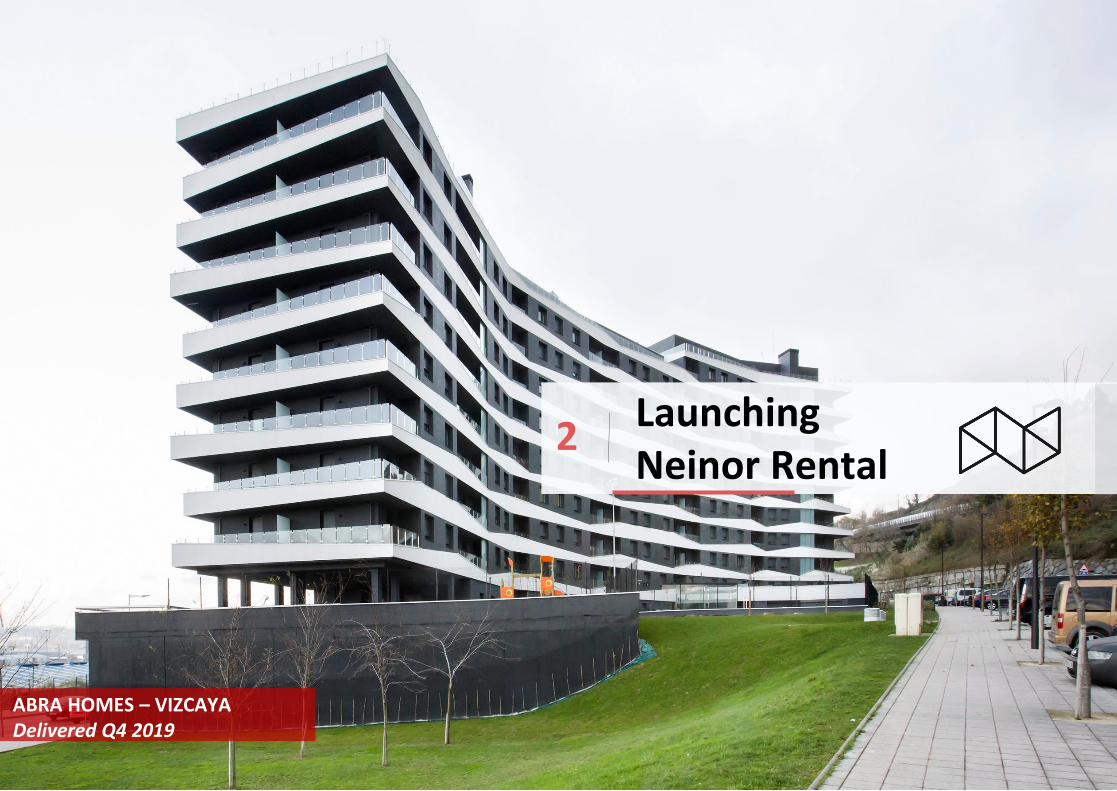
ABRA HOMES – VIZCAYADelivered Q4 2019
Launching Neinor Rental
2

11
STRATEGIC STEP INTO THE BIGGEST RESIDENTIAL OPPORTUNITY
• 23% of Spaniards rent, up from 16% in 2001 (1)
• Limited supply: A rental unit is rented in just 1.5 months (1)
• Affordability + generational choice: 75% of renters are
under 35 years old(1)
THE PRIVATE RENTED
SECTOR (PRS)
• Initiated from a proven operational base
• Become a full-fledged residential platform
• Leverage on existing build-to-sell operations
• Partnership with top rental operator
STRATEGIC COMPLEMENT
TO CORE BUSINESS
• Clear benefits of combined business lines: realize value
sooner for plots with for-sale and for rent components
• Become a market leader
• Target ~5,000 units, generating ~€40m FFO
MEDIUM TERM GOAL
(1) Source: Eurostat; Servihabitat
Become
leader
Añadir
-
sooner from land plots
both for sale & for rent
development
12
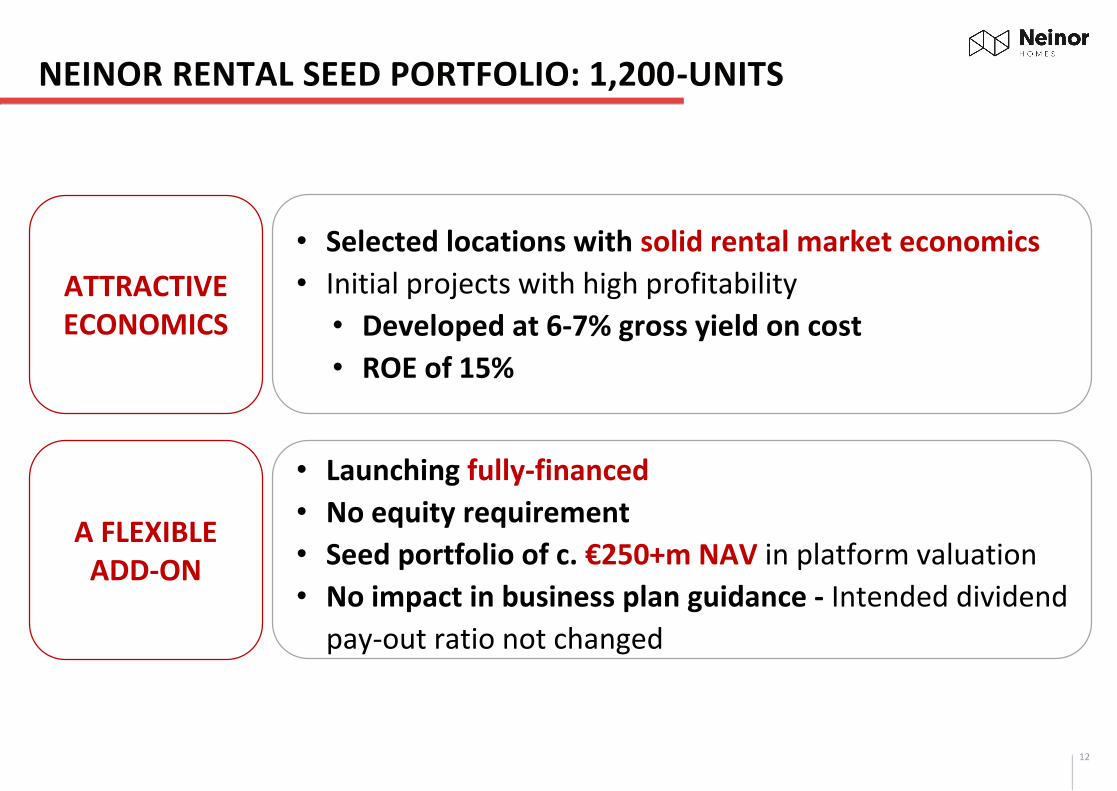
NEINOR RENTAL SEED PORTFOLIO: 1,200-UNITS
• Selected locations with solid rental market economics
• Initial projects with high profitability
• Developed at 6-7% gross yield on cost
• ROE of 15%
ATTRACTIVE ECONOMICS
• Launching fully-financed
• No equity requirement
• Seed portfolio of c. €250+m NAV in platform valuation
• No impact in business plan guidance - Intended dividend
pay-out ratio not changed
A FLEXIBLE ADD-ON
Important
impact
plan
to
Confirm
high

13
INITIAL PROJECTS IN TOP PERFORMING RENTAL MARKETS
284
214
113
LOCATION OF INITIAL 611 UNITSOPERATING ASSUMPTIONS
• Delivery: ’21: 113# /’22: 498#
• Occupancy: 95% in Year 2
• Monthly rent 2019 psm: €9,1
• Monthly rent 2019 per unit: €1,045
• Stabilized rent: €8.7m
• FFO: ~€4.8m
FINANCIAL CONSIDERATIONS
• €95m CapEx, 100% financed with banks
• Gross Yield on Cost: 6-7%
• Tax efficient (@4% CIT and reduced VAT)
• PRS decided as the most profitable use – Brings
forward the use of plots
• ROE: 15%
SS de los Reyes – MadridHacienda Homes – Málaga Sky Homes – Valencia Parla – Madrid
• One of the wealthiest regions ofMadrid A. Com., 5 mins car/Tube/bus from major office hub of North Madrid (Telefonica, BBVA, etc) and nearby Infanta Sofia Hospital
• Limited rental supply, with avg. 7% annual rent increase last 4 years
• Contrasted sales demand with avg of 6,5 units/sold per month last 2 years (Dehesa, Alea, Bulevar)
• Parla is a dormitory city South ofMadrid with c. 130,000 inhabitants,demographic growth and almost50% below 35 years old. Plots in afully consolidated neighborhood
• Direct trains to center every 15 min.
• Limited rental supply in the area,with avg. 8% annual rent increaselast 4 years
• In Valencia city. Main expansion neighborhood in front of La Fe Hospital with 6,000+ employees and 300,000 patients per year.
• Non-existent new product rental supply in an area with avg. 8% annual rent increase the last 4 years
• Contrasted sales demand with avg of 7 units/sold per month last year (Phase 1)
• In Malaga city, walking distance from main universities, the Malaga Justice complex and Virgin Victoria Hospital
• Great tube and bus connections
• Very low rental stock in an area with avg. +10% annual rent increase over the last 4 years
• Contrasted sales demand with avg of 4 units/sold per month last 2 years (Phase 1)
SELECTED LOCATIONS IN TOP-PERFORMING RENTAL MARKETS WITH GROWTH POTENTIAL

Guidance2020
ATRIA HOMES –MADRIDDelivered Q1 2019
3

15
GUIDANCE 2020
Dividend pay-out ratio on FY2020 net income: 50%
Neinor Rental: 1,200 units launched
Profitability: EBITDA €100+ m
Pre-sales coverage year-end: ’20-90%/’21-65%/’22-40%

ESGReporting4
AIGUADOLÇ HOMES – SITGES Delivered Q2 2019

17
ESG REPORTING
The sustainability leader : 84 BREEAM
certificates granted, for 7,600 units. 1
out of every 3 residential BREEAM
certificates in Spain is given to a Neinor
development
BREEAM is a European certification that
ensures that units have been built in a
way that increase comfort while
reducing the environmental impact: 7-
56% carbon emission reduction and 20-
35% water consumption reduction.
Implementation of “Green Loan
Agreement” with BBVA and LaCaixa:
loan with reduced interest rate for
buyers of homes with high green ratings.
Top 20% of Global Sector on ESG by
MSCI: Reiterated the “A” Rating for
Neinor Homes.
Sustainability
Renewed certifications
Quality (ISO 9001)
Environmental management (ISO
14001)
R&D+I management (UNE
166002).
Additionally, our White Paper (first
residential design and construction
manual in Spain), now in its 14th
version, shows our commitment to
cutting edge, efficient and
sustainable processes and
technology for our customers.
High Quality Product
Appointment of new proprietary Board
Members: Mr. Van J. Stults and Aref H.
Lahham, founding partners of Orion
Capital (holders of 28% of the voting
shares), joined the Board in Q4,
bringing in over 30 years experience in
Real Estate.
Board approved
Anticipation of first dividend, to be
paid during 2020
Long-term Management Incentive
Program, to be ratified by the
General Shareholders’ Meeting (GSM)
Calling GSM for April 1st, 2020
Governance

Q&A5
LEOANDI HOMES –VIZCAYA Delivered Q4 2019

AppendixA
RIVERSIDE HOMES – MADRIDDelivered Q4 2019

Supply below demand | Population growth | Room for employment improvement
0
1,250
2,500
3,750
2013 2015 2017 2019
STRONG DEMAND IN OUR MARKETS
1Source: INE. *2018 to 2019 2 BdE, data for each Comunidad autonoma
20
Vizcaya• Ranking: 9• Population: 1.1m• Pop. Increase(1): 0.2%• GDP per capita: 30.900• Unemployment: 10.9%• Demand est(2).: 4,400
End of works certificates (supply)
0
1,500
3,000
4,500
2013 2015 2017 2019
Sevilla• Ranking: 4• Population: 1.9m• Pop. Increase(1): 0.1%• GDP per capita: 19.600• Unemployment: 21.4%• Demand est(2).: 33,300
End of works certificates (supply)
Madrid• Ranking: 1• Population: 6.6m• Pop. Increase(1): 1.3%• GDP per capita: 34,000• Unemployment: 10.3%• Demand est(2).: 32,500
End of works certificates (supply)
5,000
10,000
15,000
20,000
2013 2015 2017 2019
Malaga• Ranking: 6• Population: 1.6m• Pop. Increase(1): 1.2%• GDP per capita: 18.000• Unemployment: 18.1%• Demand est(2).: 33,300
End of works certificates (supply)
0
2,000
4,000
6,000
2013 2015 2017 2019
Alicante• Ranking: 5• Population: 1.8m• Pop. Increase(1): 1.0%• GDP per capita: 19,800• Unemployment: 13.6%• Demand est(2).: 11,300
End of works certificates (supply)
1,000
2,500
4,000
5,500
2013 2015 2017 2019
Valencia• Ranking: 3• Population: 2.5m• Pop. Increase(1): 0.7%• GDP per capita: 22.800• Unemployment: 14.6%• Demand est(2).: 11,300
End of works certificates (supply)
1,000
1,500
2,000
2,500
2013 2015 2017 2019
Barcelona• Ranking: 2• Population: 5.6m• Pop. Increase(1): 1.0%• GDP per capita: 29.800• Unemployment: 11.3%• Demand est(2).: 17,700
End of works certificates (supply)
0
5,000
10,000
15,000
2013 2015 2017 2019

21
MACRO CASE FOR PRIVATE RENTED SECTOR (PRS)
€870m Joint Venture to
recapitalise Lazora
Sep-2018
15.6%22.9% 27.6% 30.2%
35.6% 35.0% 37.8%48.6%
33.9%
2001 2017
2.7 2.5 2.4 2.3 2.3 2.2 2.0
2006 2017 2031 2017 2017 2017 2017
Source: Fotocasa, Institute for Public Policy Research (Germany avg. tenant age); INE,Newsrun and Fotocasa, Bundesbank. (1)Source: Fotocasa. Growth based on blended average of GAV per region for 1,200 units rental portfolio (Barcelona, Madrid, Valencia,
Malaga, Bilbao Cordoba and Sevilla). (2) German annual rents for owner-occupied apartments; transaction-based property and regional weighting / 127 cities from Bundesbank from 2007 until 2017. (3) Spain annual rental figures from Fotocasa from 2007 until
2018. (4) Alquiler Seguro as of 2018.
29 Years
Spain(4)
52 Years
Germany
Average Household Size (# members)
Affordability Expected to Improve as Age of Tenant Base Converges to EU Averages
Average Tenant Age
(%) of Rented Primary Housing
€330m Investment in Tempore
Transaction
(Rented Residential Assets Spain)
July-2019
€500m Investment in BTR
Residential Assets in
Madrid
H1- 2019
Acquisition of Testa for c.€2.5bn
Sep-2018
Supportive Long
Term Macro
Trends
Growth potential
Attractive
demographics
and affordability
Emerging
investor appetite
Progressive conversion to European household size standards with plenty of room for growth
Second Hand finished product Portfolios
<3% Net Yields
BTR Portfolios
Opportunistic Mid-Teens IRR
Macro Supportive
14%
Unemplo.
Dec ‘19
2% GDP
2019
Rental Prices y-o-y Monthly Growth (%)(1)
6.0€
9.0€
12.0€
15.0€
3.0€
20192018201720162015201420132012201120102009200820072006
10.7€/sqm/ month
Rent price evolution trend
2019
Spain MadridAndalusiaValencia Catalonia Basque C.
€256m Investment in
Residential Assets in
Spain
2019
5,000 units BTR
program to be
launched
H2-2019
21
0%
5%
10%
15%
Jan-17 Jul-17 Jan-18 Jul-18 Jan-19 Jul-19

401 units pre-sold in Q4 with 5.0% Observed HPA(1) in last 12 months
1,418 UNITS SOLD IN 2019 – IN LINE WITH TARGET
0% 1% 2% 3% 4% 5% 6% 7% 8% 9% 10%
Center
East
Levante
North
South
Q4 '19
Q3 '19
Q2 '19
Q1 '19
Q4 '18
5.0%
22
PRE-SALES 2019 SECURED YEAR-END COVERAGE TARGETS
46%55% 60%
70% 65%
19%10% 5%
87% 90% 95% 100%90%
3%
25% 30% 35% 40% 40%
15% 10% 5%
22(1) Measured by 1) developments that have been on the market for most of the year and 2) that had pre-sales in comparable units in Q4 2018 and Q4 2019.Sample of 12 units in 11 developments
Q1 2019 2019 Year-End TargetQ4 2019Q3 2019Q2 2019
Coverage 2019
Coverage 2020
Coverage 2021
Coverage 2019
Coverage 2020
Coverage 2021
Coverage 2019
Coverage 2020
Coverage 2021
Coverage 2019
Coverage 2020
Coverage 2021
Coverage 2019
Coverage 2020
Coverage 2021
+5%
+10%

ALMOST 1,300 UNITS NOTARIZED IN 2019
High execution power across 5 different offices to surpass guidance
28%331
Units
35%406
Units
16%193
Units
21%247
Units
• Sant Just Homes (Q3)• Sant Just, Barcelona• 118 Units
• Riverside (Q4)• Madrid, Madrid• 30 Units
• Medina Homes (Q4)• Córdoba, Córdoba• 102 Units
(1) Deliveries for each region exclude land sale-as-is and tails from previous years.
HIGH EXECUTION POWER
700+ units notarized in Q4
GUIDANCE SURPASSED
Total deliveries above the
minimum 1,200 units
GEOGRAPHICALLY DIVERSE
Notarizations across 5 regional
offices(1)
23
• Abra Homes (Q4)• Santurtzi, Bizkaia• 76 Units
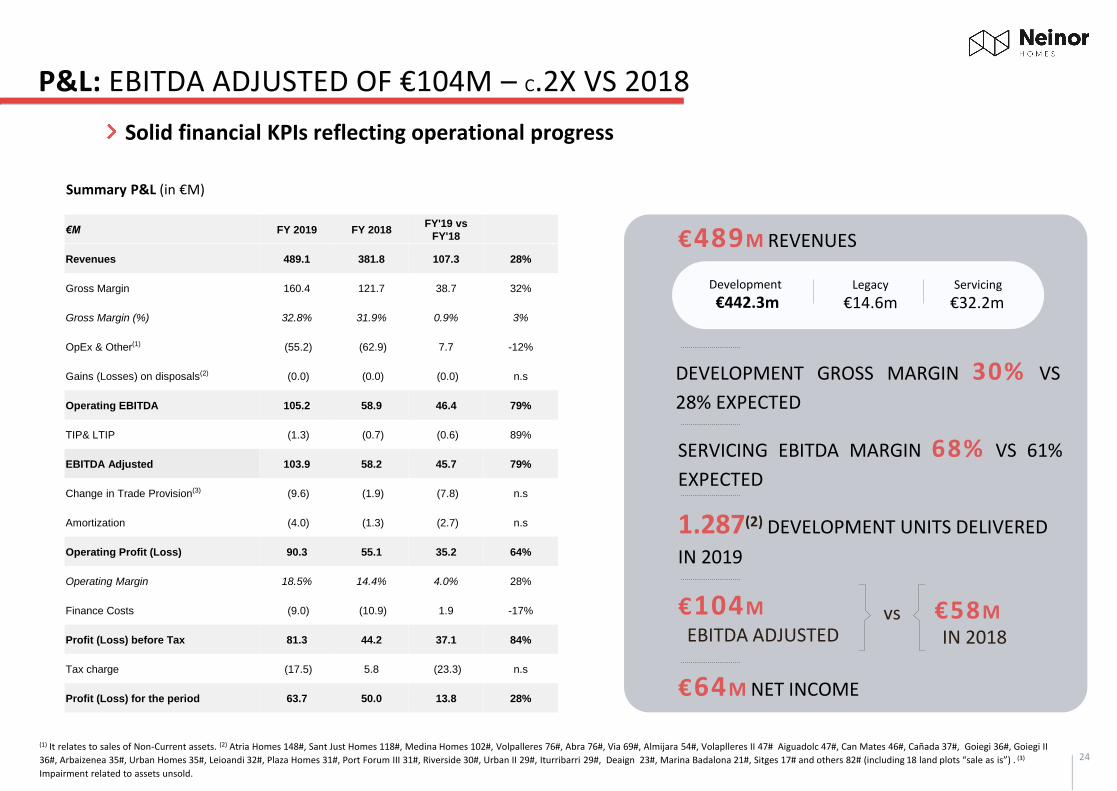
Solid financial KPIs reflecting operational progress
(1) It relates to sales of Non-Current assets. (2) Atria Homes 148#, Sant Just Homes 118#, Medina Homes 102#, Volpalleres 76#, Abra 76#, Via 69#, Almijara 54#, Volaplleres II 47# Aiguadolc 47#, Can Mates 46#, Cañada 37#, Goiegi 36#, Goiegi II
36#, Arbaizenea 35#, Urban Homes 35#, Leioandi 32#, Plaza Homes 31#, Port Forum III 31#, Riverside 30#, Urban II 29#, Iturribarri 29#, Deaign 23#, Marina Badalona 21#, Sitges 17# and others 82# (including 18 land plots “sale as is”) . (3)
Impairment related to assets unsold.
24
P&L: EBITDA ADJUSTED OF €104M – C.2X VS 2018
€489M REVENUES
1.287(2) DEVELOPMENT UNITS DELIVERED
IN 2019
€104M
€64M NET INCOME
Development
€442.3mLegacy
€14.6mServicing
€32.2m
EBITDA ADJUSTED€58MvsIN 2018
Summary P&L (in €M)
€M FY 2019 FY 2018FY'19 vs
FY'18
Revenues 489.1 381.8 107.3 28%
Gross Margin 160.4 121.7 38.7 32%
Gross Margin (%) 32.8% 31.9% 0.9% 3%
OpEx & Other(1) (55.2) (62.9) 7.7 -12%
Gains (Losses) on disposals(2) (0.0) (0.0) (0.0) n.s
Operating EBITDA 105.2 58.9 46.4 79%
TIP& LTIP (1.3) (0.7) (0.6) 89%
EBITDA Adjusted 103.9 58.2 45.7 79%
Change in Trade Provision(3) (9.6) (1.9) (7.8) n.s
Amortization (4.0) (1.3) (2.7) n.s
Operating Profit (Loss) 90.3 55.1 35.2 64%
Operating Margin 18.5% 14.4% 4.0% 28%
Finance Costs (9.0) (10.9) 1.9 -17%
Profit (Loss) before Tax 81.3 44.2 37.1 84%
Tax charge (17.5) 5.8 (23.3) n.s
Profit (Loss) for the period 63.7 50.0 13.8 28%
DEVELOPMENT GROSS MARGIN 30% VS
28% EXPECTED
SERVICING EBITDA MARGIN 68% VS 61%
EXPECTED

€130M+ OF FREE CASH FLOW AND NET CASH FLOW OF 57M
Summary Cash Flow (in €M)
(1) It excludes MIP accrual paid by LS. (2) Book value sold includes €310m of Development Book Value and €19m of Legacy Book.
+€143M OPERATING CASH FLOW VS €52 M IN 2018
CAPEX GROWTH: €318M€ VS €225M IN 2018
25
CF I ACCELERATING CAPEX
Operating & Inv. Cash Flow Variations Financing Cash Flow Variations
Cash Flow Bridge (in €M)
€M FY 2019 FY 2018FY'19 vs
FY'18
Profit (Loss) before Tax(1) 81.3 44.2 37.1 83.9%
Adjustments 22.1 23.7 (1.6) -6.7%
Amortization 4.0 1.3 2.6 n.s.
Finance Costs/Revenues 9.0 10.4 (1.4) -13.9%
Change in provisions 7.8 10.8 (3.0) -28.1%
Incentive plans 1.4 0.7 0.7 102.6%
Own share depreciation - 0.4 (0.4) -100.0%
Gains (Losses) on disposals (0.0) 0.0 (0.1) n.s.
CF from Operating Activities 103.4 67.9 35.5 52.3%
Working Capital Variation 39.7 (15.2) 54.9 -360.7%
Change in Inventories 9.5 (89.3) 98.8 -110.6%
Book Value Sold(2) 328.8 260.1 68.6 26.4%
Land Acquisition(3) (4.0) (95.1) 91.1 -95.8%
Capex (318.2) (224.5) (93.7) 41.7%
Other 2.8 (29.9) 32.7 -109.5%
Other WC Variations 30.2 74.1 (43.9) -59.2%
Net Operating Cash Flow 143.1 52.7 90.4 171.6%
CF from Investments Activities (13.6) (6.5) (7.1) 109.2%
Free Cash Flow 129.5 46.2 83.3 180.4%
CF from Financing Activities (72.6) (8.7) (63.8) n.s.
Change in Share Capital/Premium 1 (0.9) 1.9 n.s.
Change in Bank Borrowing (64.2) (34.2) (30.0) 87.6%
Change in Deferred Land Debt 0.9 36.8 (35.9) -97.5%
Finance Costs/Revenues (8.9) (10.4) 1.5 -14.6%
Proceeds (payments) from leasing (1.4) - (1.4) n.s.
Net Cash Flow 56.9 37.4 19.5 52.0%
Change in Cash Not-Available 2.8 (0.4) 3.2 n.s.
Cash BoP 113.8 76.8 36.9 48.1%
Cash EoP 173.4 113.8 59.7 52.4%

Development stock of €1.2bn
RIVERSIDE HOMES – MADRIDDelivered Q4 2019
BS I €1.47BN ASSET BASE
€1.47BN BALANCE SHEET
€1.2BN DEVELOPMENT STOCK
€950M ACTIVE DEV STOCK
€€57M Finished Product, €684M WIP, €127M under pre-
commercialization and €82M already launched
€1.0BN WORKING CAPITAL
Summary Balance Sheet (in € m)
€M FY 2019 FY 2018 Change
WC Adjusted 1.015.9 1.084.2 -68.3 -6.3%
€M FY 2019 FY 2018 FY'19 vs FY'18
PPE 7.2 7.7 (0.4) -5.8%
Right of use assets 3.3 - 3.3 100.0%
Investment Property 0.2 1.0 (0.8) -78.2%
Other Non-Current Assets 2.3 2.7 (0.4) -16.2%
Deferred Tax assets 25.5 22.3 3.2 14.5%
Non-Current Assets 38.5 33.7 4.9 14.5%
Inventories 1,210.7 1,229.7 (19.1) -1.5%
ow Liquidation 11.1 41.8 (30.7) -73.5%
ow Development 1,199.6 1,187.9 11.7 1.0%
Other Current Assets 12.8 0.0 12.7 n.s
Cash & Equivalents 173.4 113.8 59.7 52.4%
ow Not Available 43.5 40.7 2.8 6.8%
Current Assets 1,430.5 1,384.0 46.5 3.4%
Total Assets 1,469.0 1,417.6 51.4 3.6%
Equity 789.4 772.7 16.8 2.2%
Bank Borrowings 50.0 - 50.0 0.0%
Lease Liabilites 2.2 - 2.2 100.0%
Other Non-Current Liabilities 0.0 0.1 (0.1) -92.4%
Non-Current Liabilities 52.2 0.1 52.1 n.s
Bank Borrowings 315.7 380.5 (64.8) -17.0%
Lease Liabilites 1.3 - 1.3 100.0%
Creditors 196.8 160.3 36.5 22.8%
Other Current Liabilities 113.6 104.0 9.5 9.2%
Current Liabilities 627.4 644.9 (17.5) -2.7%
Total Liabilities 1,469.0 1,417.6 51.4 3.6%

Debt in check as we delivered, paid and extended Corporate Debt and drew-down buy-back line
27
CONTINUING WITH CONSERVATIVE DEBT RATIOS
Net debt (in € m)
Key Ratios (%)
CONSERVATIVE DEBT RATIOS
LTV AT 16%
NET DEBT OF €180M
NET DEBT ADJUSTED €261M
RIVERSIDE HOMES – CENTER REGION
CAPEX FINANCING OF €59M VS
€24M IN 2018
LTV LTC Net Debt Adjusted / Equity
Buy Back Program: 4.5M shares, €49.3M deployed and pro-
forma NAV per share up to €16.77(1)
(1) Assuming cancellation of the Treasury shares held, up from €15.82 per current outstanding shares (79,005,034). (2) The Corporate line with Deutsche Bank has been extended to a final maturity of December 2022
€M FY 2019 FY 2018Change FY '19 vs
FY'18
Gross Debt 365.7 380.5 (14.8) -3.9%
Non-Current Bank Borrowing 50.0 - 50.0 0.0%
Corporate Financing(2) 50.0 - 50.0 0.0%
Current Bank Borrowing 315.7 380.5 (64.8) -17.0%
Land Financing 181.4 224.6 (43.2) -19.2%
WIP 110.9 109.4 1.4 1.3%
No WIP 70.5 115.1 (44.6) -38.7%
Capex Financing 58.8 24.1 34.7 144.3%
Corporate Financing 74.3 124.0 (49.7) -40.1%
VAT Financing 0.0 7.3 (7.3) -100.0%
Interests 1.2 0.5 0.6 116.0%
Current financial Assets 12.8 1.1 11.7 n.s
Cash & Equivalents 173.4 113.8 59.7 52.4%
Net Debt 179.5 265.7 (86.2) -32.4%
Net Debt 179.5 265.7 (86.2) -32.4%
Adjustments 81.1 77.5 3.7 4.8%
Deferred Land Payment 37.7 36.8 0.9 2.5%
Restricted Cash 43.5 40.7 2.8 6.8%
Net Debt Adjusted 260.7 343.2 (82.5) -24.0%
33%
44%
FY2019FY2018
22%28%
FY2019FY2018
16%19%
FY2019FY2018

28
Fully permitted land GAV at €1.6bn
NAV down to €1,249m due to construction cost adjustment, taxes, legacy sales and impairment.
NORTH
EAST
CENTER
LEVANTE
SOUTH EAST
SOUTH WEST
15% c. 1,700units
8% c. 1,250units
22% 2,700units
9% 1,050units
18% c.2,200units
27% 2,200units
Neinor’s Land Bank – National Footprint
% over GAV value of Land Bank Assets
Savills GAV Split by Regional Office – Fully-permitted land bank(1)
Bridge from GAV to NNAV€ millions
(1) Strategic (non fully-permitted) land amounts to 1,000+ units, thus taking the total land bank to 11,000+
(2) Other adjustments is the working capital (excluding inventories) change. Main components of the increase (EUR 49m) from 2018: c. €19m increase in payables (suppliers) and the balance due to deposits received + restricted cash used for development
(2)
SAVILLS APPRAISAL – DECEMBER 2019
1,650
260
140
1,249
65
1,184
GAV Net Debt Other Adjustments NAV Adjustment (DTAs & Tax) NNAV
North Center East Levante South EastSouth West
Total FY2019
Number of units 1,932 1,967 1,286 1,353 2,140 1,421 10,099
Buildability Area (sqm) 206,423 260,653 145,333 155,447 286,026 194,284 1,248,166
GDV (€m) 600 843 451 361 780 387 3,423
ASP (k €) 311 429 350 267 364 273 339
Average Price per sqm (€) 2,908 3,236 3,101 2,324 2,727 1,993 2,742
Costs pending to complete (€m) 244 308 172 175 356 195 1,450
Costs pending per unit (k €) 126 156 134 129 166 137 144
Costs pending per sqm (€) 1,184 1,181 1,186 1,126 1,243 1,002 1,162
Valuation (EUR m) 290 420 240 133 351 150 1,583
Valuation per sqm (EUR) 1,407 1,611 1,649 854 1,226 771 1,268
Strategic Land on Balance Sheet GAV (EUR m) 53
Remaining Legacy GAV (EUR m) 14
GAV reported 31st of December 2019 (EUR m) 1,650

GAV € million
1,650
29
Asset to construction cost adjustment, taxes, buy-back and legacy explaining the evolution of NAV from June to December
VALUATION at 31st December 2019
VALUATION at 30th June 2019
CONSTRUCTION COST ADJUSTMENT
CORPORATE TAXES
SHARE BUY-BACK PROGRAM
LEGACY ASSETS: SALE BELOW SAVILLS GAV (DEC 2016 VALUATION) AND IMPAIRMENT
OF €10M
VALUATION EFFECT
ACCOUNTING EFFECT
NAV IMPACT-€33M
-€0.42 p.s.
NAV IMPACT-€29M
-€0.37 p.s.
NAV IMPACT-€14M
-€0.18 p.s.
NAV € million€ p.s.(1)
1,24915.82
GAV € million
1,803NAV
€ million€ p.s.
1,32516.77
(1) The NAV per share assuming cancellation of shares bought back until December 31st (c. 4.5m shares) would be €16.78
SAVILLS APPRAISAL – DECEMBER 2019

The Leading Residential Group
"When you think of a Home, think of Neinor Homes"
Video ENG / ESP