nel powerpoint template - aug 2019 · 2020-02-18 · 2 this presentation has been produced by nel...
TRANSCRIPT

Nel ASACompany presentation
January 2020
2
This Presentation has been produced by Nel ASA (the “Company” or “Nel”) in connection with a potential private placement and may not be reproduced or redistributed, in whole or in part, to any other person. This presentation is strictly confidential, has not been reviewed or registered with any public authority or stock exchange, and may not be reproduced or redistributed, in whole or in part, to any other person. To the best of the knowledge of the Company, the information contained in this Presentation is in all material respect in accordance with the facts as of the date hereof, and contains no material omissions likely to affect its import. However, no representation or warranty (express or implied) is made as to, and no reliance should be placed on, any information, including projections, estimates, targets and opinions,
contained herein, and no liability whatsoever is accepted as to any errors, omissions or misstatements contained herein, and, accordingly, neither the Company nor any of its subsidiary companies or any such person’s officers or employees accepts any liability whatsoever arising directly or indirectly from the use of this Presentation.
This Presentation contains information obtained from third parties. Such information has been accurately reproduced and, as far as the Company is aware and able to ascertain from the information published by that third party, no facts have been omitted that would render the
reproduced information to be inaccurate or misleading. This Presentation contains certain forward-looking statements relating to the business, financial performance and results of the Company and/or the industry in which it operates. Forward-looking statements concern future circumstances and results and other statements that are not historical facts, sometimes identified by the words “believes”, expects”, “predicts”, “intends”, “projects”, “plans”, “estimates”, “aims”, “foresees”, “anticipates”, “targets”, and similar expressions. The forward-looking statements contained in this Presentation, including assumptions, opinions and views of the Company or cited from third party sources are solely opinions and forecasts which are subject to risks, uncertainties and other factors that may cause actual events to differ materially
from any anticipated development. None of the Company or any of its parent or subsidiary undertakings or any such person’s officers or employees provides any assurance that the assumptions underlying such forward-looking statements are free from errors nor does any of them accept any responsibility for the future accuracy of the opinions expressed in this Presentation or the actual occurrence of the forecasted developments. The Company assumes no obligation, except as required by law, to update any forward-looking statements or to conform
these forward-looking statements to our actual results.
The Presentation is not for publication or distribution, in whole or in part directly or indirectly, in or into Australia, Canada, Japan or the United States (including its territories and possessions, any state of the United States and the District of Columbia) or any other jurisdiction in
which the release, publication or distribution would be unlawful. The distribution of this Presentation may in certain jurisdictions be restricted by law. Persons into whose possession this release comes should inform themselves about and observe any such restrictions. Any failure to comply with these restrictions may constitute a violation of the securities laws of any such jurisdiction. The Managers are acting for the Company and no one else in connection with the matters discussed in this Presentation and will not be responsible to anyone other than the
Company for providing the protections afforded to their respective clients or for providing advice in relation to any matter referred to in this Presentation.
AN INVESTMENT IN THE COMPANY INVOLVES RISK, AND SEVERAL FACTORS COULD CAUSE THE ACTUAL RESULTS, PERFORMANCE OR ACHIEVEMENTS OF THE COMPANY TO BE MATERIALLY DIFFERENT FROM ANY FUTURE RESULTS, PERFORMANCE OR ACHIEVEMENTS THAT MAY BE EXPRESSED OR IMPLIED BY STATEMENTS AND INFORMATION IN THIS PRESENTATION, INCLUDING, AMONG OTHERS, RISKS OR UNCERTAINTIES ASSOCIATED WITH THE COMPANY’S BUSINESS, SEGMENTS, DEVELOPMENT, GROWTH MANAGEMENT, FINANCING, MARKET ACCEPTANCE AND RELATIONS WITH CUSTOMERS, AND, MORE GENERALLY, GENERAL ECONOMIC AND BUSINESS CONDITIONS, CHANGES IN DOMESTIC AND FOREIGN LAWS AND REGULATIONS, TAXES, CHANGES IN COMPETITION AND PRICING ENVIRONMENTS, FLUCTUATIONS
IN CURRENCY EXCHANGE RATES AND INTEREST RATES AND OTHER FACTORS.
SHOULD ONE OR MORE OF THESE RISKS OR UNCERTAINTIES MATERIALISE, OR SHOULD UNDERLYING ASSUMPTIONS PROVE INCORRECT, ACTUAL RESULTS MAY VARY MATERIALLY FROM THOSE DESCRIBED IN THIS PRESENTATION. THE COMPANY DOES NOT INTEND, AND DOES NOT ASSUME ANY OBLIGATION, TO UPDATE OR CORRECT THE INFORMATION INCLUDED IN THIS PRESENTATION.
Any decision to invest must only be made with careful consideration and not in reliance solely on the introductory information provided herein which does not purport to be complete. Any application to invest will be subject to a term sheet setting out the terms and conditions of the securities and an application form to which any investment will be subject. The Managers, their parent or subsidiary undertakings or affiliates or any such person’s directors, officers, employees, advisors or representatives shall not have any liability whatsoever arising directly
or indirectly from the use of this Presentation and to the extent an investment is made, such investment will be made subject to this exclusion of liability. By attending or receiving this Presentation you acknowledge that you will be solely responsible for your own assessment of the market and the market position of the Company and that you will conduct your own analysis and be solely responsible for forming your own view of the potential future performance of the Company’s business. This Presentation does not constitute an offer to sell or a
solicitation of an offer to buy any securities in any jurisdiction to any person to whom it is unlawful to make such an offer or solicitation in such jurisdiction.
Disclaimer
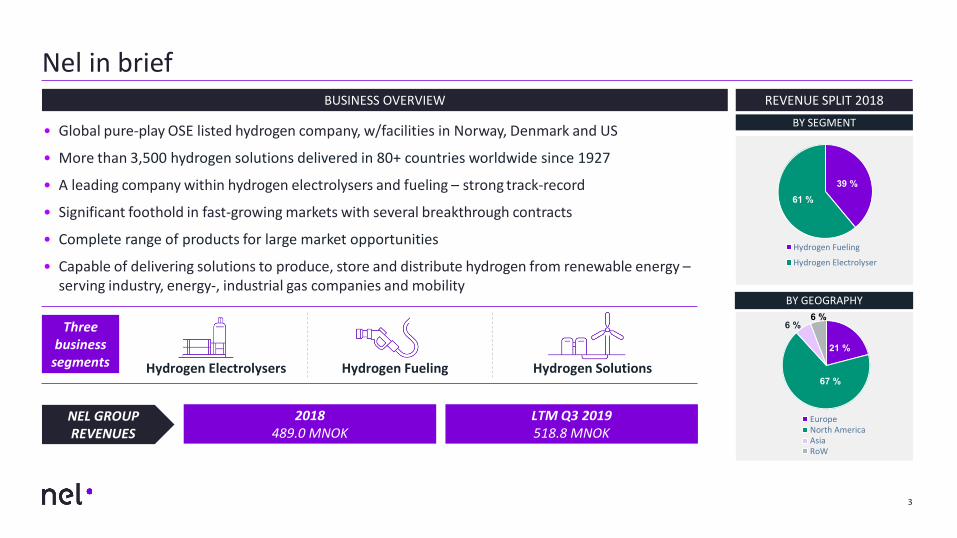
• Global pure-play OSE listed hydrogen company, w/facilities in Norway, Denmark and US
• More than 3,500 hydrogen solutions delivered in 80+ countries worldwide since 1927
• A leading company within hydrogen electrolysers and fueling – strong track-record
• Significant foothold in fast-growing markets with several breakthrough contracts
• Complete range of products for large market opportunities
• Capable of delivering solutions to produce, store and distribute hydrogen from renewable energy –serving industry, energy-, industrial gas companies and mobility
BUSINESS OVERVIEW
Hydrogen Electrolysers Hydrogen Fueling Hydrogen Solutions
3
REVENUE SPLIT 2018
NEL GROUP REVENUES
2018489.0 MNOK
LTM Q3 2019518.8 MNOK
Three business
segments
39 %61 %
Hydrogen Fueling
Hydrogen Electrolyser
BY SEGMENT
BY GEOGRAPHY
21 %
67 %
6 %6 %
EuropeNorth AmericaAsiaRoW
Nel in brief
Transaction and Nel update
5
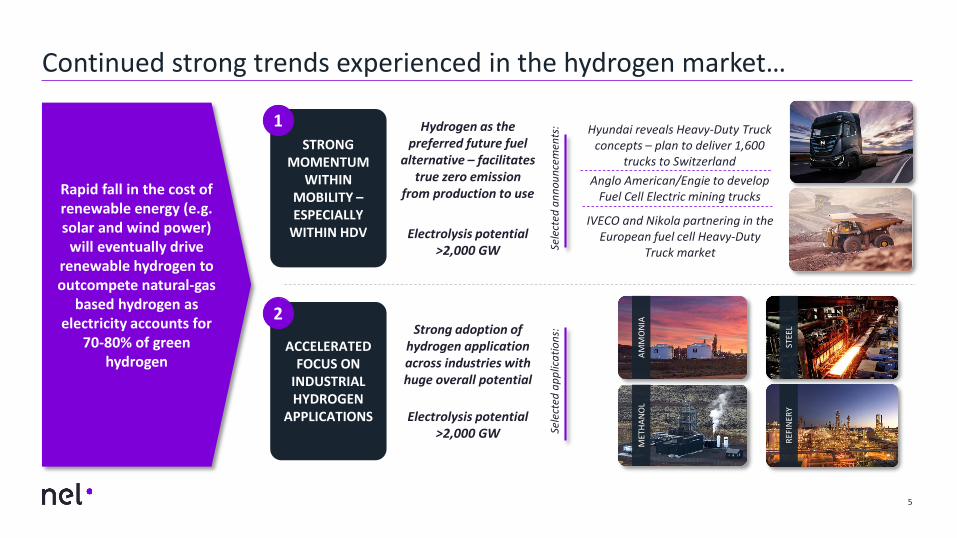
Continued strong trends experienced in the hydrogen market…
Rapid fall in the cost of renewable energy (e.g. solar and wind power)
will eventually drive renewable hydrogen to outcompete natural-gas
based hydrogen as electricity accounts for
70-80% of green hydrogen
ACCELERATED FOCUS ON
INDUSTRIAL HYDROGEN
APPLICATIONS
STRONG MOMENTUM
WITHIN MOBILITY –ESPECIALLY
WITHIN HDV
Hyundai reveals Heavy-Duty Truck concepts – plan to deliver 1,600
trucks to SwitzerlandAnglo American/Engie to develop
Fuel Cell Electric mining trucks
Sele
cted
ann
ounc
emen
ts:Hydrogen as the preferred future fuel
alternative – facilitates true zero emission
from production to use
Electrolysis potential >2,000 GW
IVECO and Nikola partnering in the European fuel cell Heavy-Duty
Truck market
1
2
Sele
cted
app
licat
ions
:Strong adoption of hydrogen application across industries with huge overall potential
Electrolysis potential >2,000 GW
AMM
ON
IA
REFI
NER
YST
EEL
MET
HAN
OL

6
…with fast-growing interest in green hydrogen – strong attention from several of the world’s largest industry- and energy companies
Industrial gas companies positioning within the hydrogen segment
• Large industry- and energy companies have engaged in green hydrogen projects recently
• Some of the companies own and operate hydrogen solutions, while others also engage in development and manufacturing of electrolysers and/or hydrogen refueling stations
• In addition, several EPC companies are also positioning themselves to build green hydrogen production plants
• The activity of Nel’s competitors is growing, with selected competitors receiving considerable capital injections from large industrial companies during 2019
Recent investments by gas heavyweights illustrate the increasing emphasis placed on hydrogen as part of
the clean energy transition
20% stake in British electrolyser manufacturer
ITM Power
10% stake in Swiss green hydrogen producer and
supplier Hydrospider
18.6% stake in the capital of the Canadian company
Hydrogenics Corporation
Undisclosed stake in FirstElement Fuel, a retail hydrogen station operator

7
Nel is today one of the leading players within green hydrogen as a manufacturer of electrolysers and hydrogen refueling stations
• Strong interest in green hydrogen for an increasing number of markets leads to a need for Nel to step up the activity level even faster than previously envisioned
• The work related to the Herøya expansion (new alkaline manufacturing plant) goes according to plan
– Significant opportunities for cost reductions identified – realization of these will require considerable resources both related to engineering and testing, and Nel has chosen to increase the use of resources accordingly
• Capacity can upon completion be rapidly increased beyond 1GW/yrfrom initial 360MW/yr to serve existing contracts, and to open up for other large-scale green hydrogen projects with high probability of being realized in the relatively near future
Nel is today the world’s largest manufacturer of both alkaline and PEM electrolysers, and is also one of the leading hydrogen refueling
station manufactures
Nel will increase use of resources related to the electrolyser manufacturing expansion project to realise significant cost reductions and to maintain and improve its position, especially in connection with new large-scale projects

Increase investment in technology development, both for improving existing as well as developing future platforms
To maintain and strengthen its position in a growing market, Nel will accelerate investments in technology and organization
8
Continue to develop the organization, both within engineering, project execution, production and process improvements
Prepare for rapid capacity expansions and entry into new markets/regions
• Development of pressurized electrolysers continues, both for alkaline and PEM, with need for continued innovation alongside cost reductions in order to maintain leading position
• Increased focus on heavy duty mobility application (trucks, buses, ferries, etc.), with new demands for fueling capacity and speed, has triggered a step-up of product development
• Nel has built up and will further strengthen the management systems and organization for development, engineering, commissioning and construction management of large-scale hydrogen production facilities
• Work to reduce cost further while increasing efficiency, together with sub-suppliers and EPC companies, by reviewing total process from design/manufacturing to installation/operation
• Positioning for increased use of renewable hydrogen for various industrial applications, e.g.:
• Replacement of natural gas-based hydrogen in refineries and ammonia production
• Replacement of coal with hydrogen as reducing agent in steel production etc.
9
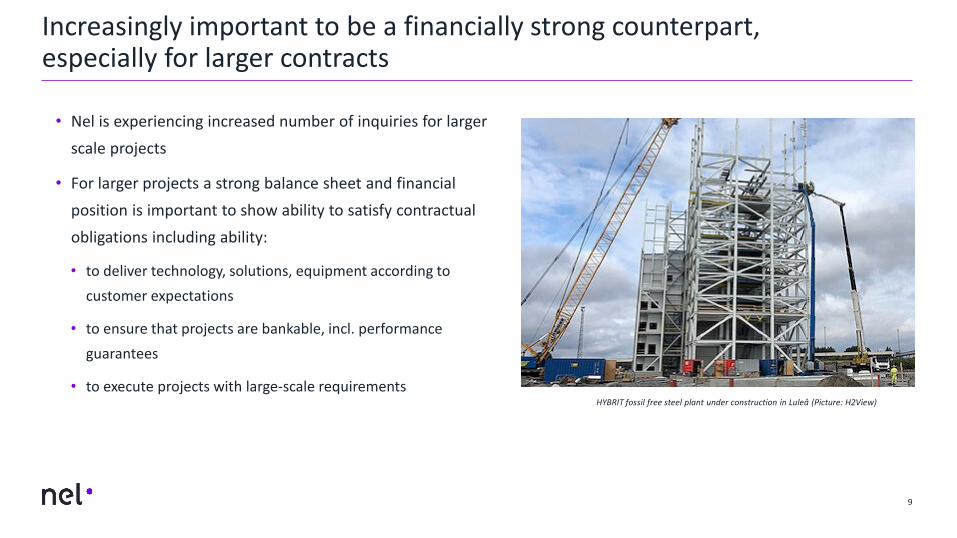
• Nel is experiencing increased number of inquiries for larger scale projects
• For larger projects a strong balance sheet and financial position is important to show ability to satisfy contractual obligations including ability:
• to deliver technology, solutions, equipment according to customer expectations
• to ensure that projects are bankable, incl. performance guarantees
• to execute projects with large-scale requirements
Increasingly important to be a financially strong counterpart, especially for larger contracts
HYBRIT fossil free steel plant under construction in Luleå (Picture: H2View)

The contemplated transaction
10
• Private placement • Maintain and strengthen market position through accelerated investments in technology and organization to take advantage of the attractive market opportunities
• Strengthening investment in development and innovation across segments and technologies to stay on the technological forefront
• Continue to develop the organization, both within management systems, engineering, project execution, production and process improvement
− Additional focus on people and safety
• Strengthening the balance sheet and financial position to satisfy counterpart requirements on large scale projects
• Ability to satisfy contractual obligations
• Ability to provide required bonds/guarantees
• The proceeds will also fund additional working capital in response to increased order volumes and contract sizes, as well as general corporate purposes
KEY TRANSACTION DETAILS USE OF PROCEEDS
CONTEMPLATED TRANSACTION
OFFER SIZE
• Up to 89,000,000 new ordinary shares (approx. 7.3% of the outstanding capital)
OFFER PRICE • To be determined through book building
MINIMUM SUBSCRIPTION
• NOK equivalent of EUR 100,000
CONDITIONS
• Board approval of the transaction based on the authorization to issue shares from the annual general meeting

11
TRADING UPDATE
Trading update
EBITDA(reported)
Cash reserve
Backlog
Sales
Update on Uno-X Hydrogen
Uno-X Hydrogen AS is a JV owned 39% by Nel, which owns and operates hydrogen infrastructure in Norway. Since the incident at one of its stations in June, the remaining two JV-stations have been out of operation. In the event of the JV ceasing operations, Nel could incur write down cost of the investment in the range of NOK 30 mill.
Q4 EBITDA (reported) is negatively impacted by significant ramp-up costs and other non-recurring costs as a result of increased activity. Including year-end closing judgements and evaluation of various projects, EBITDA may end around NOK -45 million. In terms of adjusted EBITDA, this may end around NOK -25 million.
Q4 cash reserve of NOK ~520 million
Current order backlog NOK ~510 million in combination with an all time high pipeline
Q4 sales slightly higher than Q3

12
Recent Nel announcements, Q4 2019
• Purchase order from Everfuel Europe A/S for the delivery of a H2Station® fueling solution for a fleet of taxis in Copenhagen,Denmark
27 DECEMBER 2019PURCHASE ORDER
• Purchase order for the delivery of two H2Station® units for fueling of vehicles in Europe• EUR ~2 million contract value (further details will be released in Q1-2020)
20 DECEMBER 2019PURCHASE ORDER
• Establishment of Green H2 Norway, a JV together with H2 Energy AS, Greenstat AS and Akershus Energi Infrastruktur AS• Renewable hydrogen production facilities to supply hydrogen to Hyundai trucks which are expected in Norway from 2020
20 DECEMBER 2019ESTABLISHES JOINT VENTURE
• Purchase order from OrangeGas for the delivery of multiple H2Station® units for fueling of predominately light duty fuel cellelectric vehicles in the Netherlands (EUR ~3 million)
17 DECEMBER 2019PURCHASE ORDER
• Purchase order, following a previously announced contract, for a 3.5 MW electrolyser from ENGIE (~USD 4m contract value)• Part of solution to produce renewable hydrogen for the world’s largest fuel cell electric mining haul truck for Anglo American
9 DECEMBER 2019PURCHASE ORDER
• Purchase order from Hydrogen Energy Network Co., Ltd. (HyNet) for two additional H2Station® hydrogen fueling stations in Korea (EUR ~2.7 million) – Nel is up to a total of 12 H2Station® orders in Korea in 2019
4 DECEMBER 2019PURCHASE ORDER
A unique opportunity in the hydrogen space

14
Nel - a unique opportunity in the hydrogen space
1 Hydrogen – a large market opportunityHydrogen market is set to grow by 10x by 2050, today electrolysis represents only ~1% of the market
2 Hydrogen from renewables becoming competitiveLarge cost reductions for renewable energy combined with falling electrolyser capex leads to total cost of renewable hydrogen approaching fossil parity
3 Nel positioned as one of the global leadersAmong the largest electrolyser and hydrogen fueling station manufacturers with >3,500 electrolyser solutions delivered in ~80 countries worldwide
4 Broad portfolio covers relevant technologies & sizes One-stop-shop offering solutions for production and fueling of hydrogen
5 Nel will continue to invest to maintain and strengthen leadership position and capture attractive market opportunities
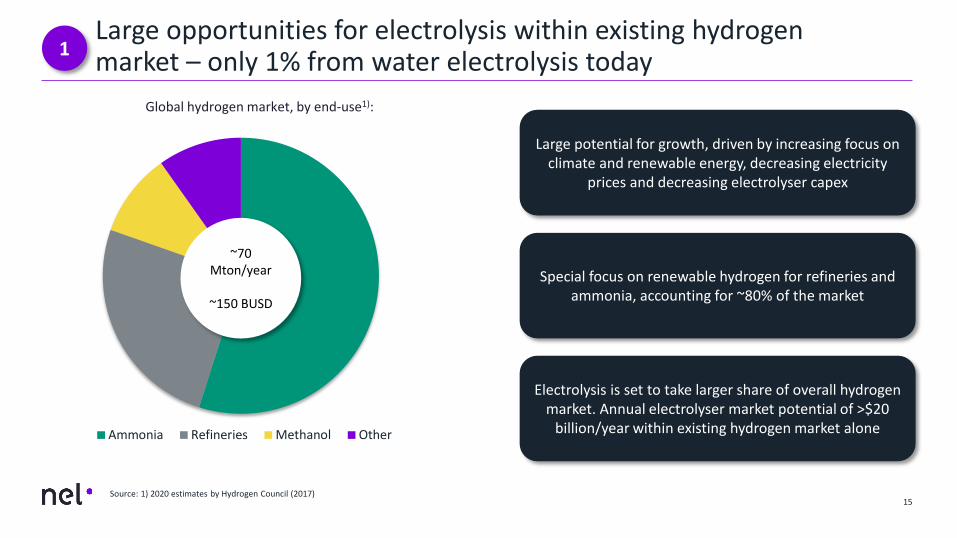
Large opportunities for electrolysis within existing hydrogen market – only 1% from water electrolysis today
Large potential for growth, driven by increasing focus on climate and renewable energy, decreasing electricity
prices and decreasing electrolyser capex
15
1
Global hydrogen market, by end-use1):
Special focus on renewable hydrogen for refineries and ammonia, accounting for ~80% of the market
Electrolysis is set to take larger share of overall hydrogen market. Annual electrolyser market potential of >$20
billion/year within existing hydrogen market aloneAmmonia Refineries Methanol Other
~70 Mton/year
~150 BUSD
Source: 1) 2020 estimates by Hydrogen Council (2017)

Hydrogen demand is changing longer-term, transportation and industry to be largest demand sources in the future
16
156
114
79
70
63
63
20402020
70
2015
9856
2030 2050
196
545
Power generation, buffering Industrial energy
Building heat and powerNew feedstock (CCU, DRI)
Existing feedstock users
Transportation
• Hydrogen market continues to develop, both within industrial applications as well as within transportation and power-to-gas
• Development seen over last few years points to the fact that the hydrogen market will grow substantially over the next years
• Growth in hydrogen market primarily driven by:
ꟷ Regulations to lower sulphur demands for fuel
ꟷ Decreased crude quality, requires more hydrogen for processing
ꟷ Electrification of transport sector
ꟷ A move from coal to hydrogen for various industries (e.g. steel manufacturing)
• Transport sector expected to dominate as of 2050, accounting for ~29% of the hydrogen demand
• Depending on cost development and penetration of renewable energy, electrolysis market can potentially grow by >500x by 2050
1
Global energy demand supplied with Hydrogen (mill tons)1)
CAGR (2020-2050)
10.9%
n.a.
8.4%
CAGR (2030-2050)
16.8%
15.0%
12.9%
1.1%
11.6%
7.8%
0.7%
n.a.
n.a.
Note: 1) Converted from EJ to million tons (1 EJ = 7m tons) | Source: 2) Hydrogen Council, November 2017

17
Chemical vapor deposition
Thermal processing
Chemical Industry
Power IndustrySteel Industry
Food Industry
Glass Industry
Polysilicon Industry
Laboratories
Life support
CONVENTIONAL INDUSTRY MOBILITY POWER-TO-X
• Conventional industries represents “traditional” hydrogen markets
• Steady demand for hydrogen
• Key market going forward – both within hydrogen production and fueling
• Heavy duty sector developing faster than anticipated – hydrogen now relevant fuel for all forms of mobility
• Decreasing cost of renewables & electrolysers is accelerating market
• Vast opportunities within existing & new sectors
Mobility(transportation)
Power-To-X(renewable hydrogen)
Steady growing market Markets expected to see fast growth going forward
Hydrogen is expanding its areas of application1

Growth expected to be accelerated by transportation – hydrogen is becoming relevant in all forms of mobility
18
1
FORK
LIFT
TRAI
N
BUS
DELI
VERY
TRU
CK
CRU
ISE
SHIP
TRU
CK
CAR
FERR
Y
Hydrogen as the preferred future fuel alternative:− True zero emission from production to use− Can beat fossil fuel applications on a TCO-basis− Low weight (compared to e.g. batteries),
especially relevant in the heavy duty segment− Fast recharging (fueling) time− Long driving range− Low/no need for electric grid upgrades− Not dependent on rare earth metals
(e.g. cobalt, lithium)− Global standards for fueling established− Same quality fuel used for small to large
applications− Cleans the surrounding airElectrolysis potential > 2,000 GW
PASS
ENGE
R CA
R
Photos: Hyundai, ALSTOM, Brødrene AA, Ruter, FedEx, Viking Cruises, Nikola Motor Company, Toyota, Norled
FAST
FERR
Y

19
• Heavy duty vehicles responsible for 47% of
CO2 emissions from land based mobility
and ~8% of total global CO2-emissions
• Freight activity (ton-km) projected to
double by 2050
• Hydrogen most promising zero-emission
fuel for heavy trucks
Source: Miller, J., & Façanha, C. (2014, August). The state of clean transport policy, ICCT
Freight activity / heavy duty transport projected to double by 20501
0
10
20
30
40
2015 2020 2025 2030 2035 2040 2045 2050
Frei
ght a
ctiv
ity (t
rillio
n m
etric
ton-
km)
Light commercial truck activity Medium truck activity
Heavy truck activity

Power-To-X to drive additional growth – decreasing cost of renewable hydrogen (and oxygen) is opening up new business areas
20
1AM
MO
NIA
REFI
NER
Y
MET
HAN
OL
TITA
NIU
M O
XIDE
STEE
L
REM
OTE
PO
WER
GAS
PIP
ELIN
ES
ENER
GY
EXPO
RT
FISH
FARM
ING
Hydrogen as a big decarbonizing vector in industry
• Wide variety of existing and new markets where electrolysis can play a major role
– Exchanging fossil hydrogen with renewable hydrogen (e.g. fertilizer)
– Exchanging coal with renewable hydrogen (e.g. steel manufacturing)
– Oxygen & heat adds value
• Electrolysis “bridges the gap” between the power and industry sector, increasing the value of electrons
• Ability to adapt to diverse and intermittent renewable energy sources becoming increasingly important
Electrolysis potential >2,000 GW
Photos: Yara, Equinor, IAV, Tizir, SSAB, Nexofin, TU, DN, SinkabergHansen

Cost of wind and solar has dropped by 70% and 89% respectively during last decade – renewable hydrogen following the same path
21
Wind and solar on a trajectory to become the cheapest sources for electricity generation
2
Global average wind (onshore) LCOE Unsubsidised levelized cost of energy ($/MWh) 2)
Global average solar PV LCOEUnsubsidised levelized cost of energy ($/MWh)2)
• With falling LCOE1) of wind and solar prices, renewable hydrogen follows the same path, as electrical power constitutes 70-80% of the total cost of hydrogen
• Record low auction prices for solar PV and wind has seen prices as low as $14.99/MWh and $17.86/MWh respectively3,4
• Prices are expected to drop further, LCOE of solar PV and onshore wind are expected to fall by 71% and 58% respectively by 20505)
• At $50/MWh renewable hydrogen is becoming competitive with fossil fuels and at $30/MWh renewable hydrogen is becoming competitive in most markets
Note: 1) LCOE = Levelised cost of energy, which is a way of calculating the total production cost of building and operating an electricity-generating plantSource: 2) Lazard; Renewables Now, 3)Elpasoheraldpost 4) IRENA (International Renewable Energy Agency); 5) BloombergNEF New Energy Outlook 2018
$135 $124
$71$72 $70 $59 $55 $47 $45 $42 $41
2009 2010 2011 2012 2013 2014 2015 2016 2017 2018 2019
$359
$248
$157$125
$98$79
$64 $55 $50 $43 $40
2009 2010 2011 2012 2013 2014 2015 2016 2017 2018 2019

• Hydrogen industry (electrolysis and fueling stations) can become as large as we currently see within wind and solar, however, maturity (market/technology) is far behind
− Will see same focus on cost reductions
• Early stage maturity leads to several technologies competing to be the “winning technology”, like previously seen within e.g. solar
− For electrolysis, it is still unclear whether atmospheric or pressurized alkaline or PEM will be the winning technology
• Increased volumes will reduce costs, e.g.:
− Swanson’s Law, prices of solar PV tend to drop 20% for every doubling of cumulative shipped volume
2222
2
TIME
MAT
URI
TY O
F EN
ERG
Y SO
URC
E
Hydrogen technology is behind solar and wind on the maturity curve, but catching up – key technology going forward to be decided
SOLAR WIND
HYDROGEN
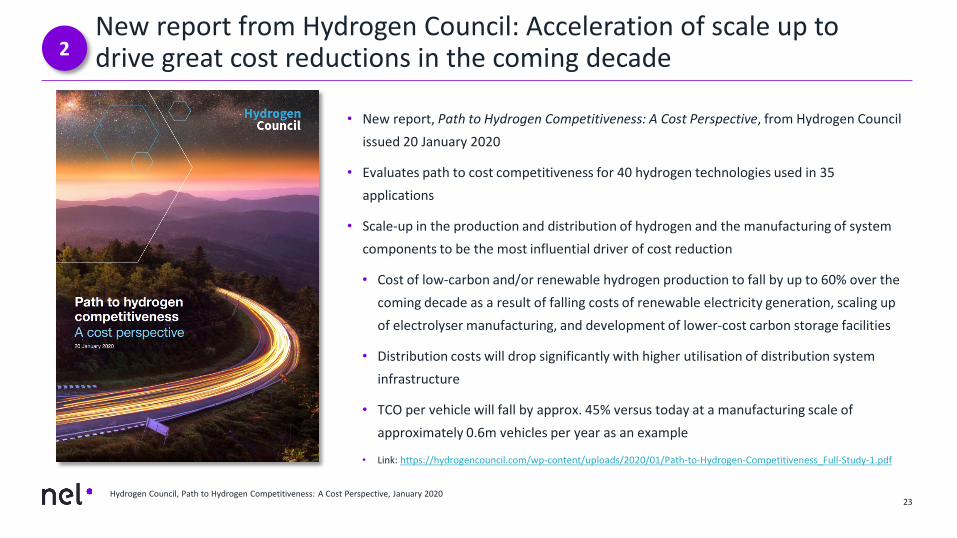
23Hydrogen Council, Path to Hydrogen Competitiveness: A Cost Perspective, January 2020
2New report from Hydrogen Council: Acceleration of scale up to drive great cost reductions in the coming decade
• New report, Path to Hydrogen Competitiveness: A Cost Perspective, from Hydrogen Council issued 20 January 2020
• Evaluates path to cost competitiveness for 40 hydrogen technologies used in 35 applications
• Scale-up in the production and distribution of hydrogen and the manufacturing of system components to be the most influential driver of cost reduction
• Cost of low-carbon and/or renewable hydrogen production to fall by up to 60% over the coming decade as a result of falling costs of renewable electricity generation, scaling up of electrolyser manufacturing, and development of lower-cost carbon storage facilities
• Distribution costs will drop significantly with higher utilisation of distribution system infrastructure
• TCO per vehicle will fall by approx. 45% versus today at a manufacturing scale of approximately 0.6m vehicles per year as an example
• Link: https://hydrogencouncil.com/wp-content/uploads/2020/01/Path-to-Hydrogen-Competitiveness_Full-Study-1.pdf

Growth in renewable hydrogen will accelerate with reduced capex for electrolysers....
24
200
300
400
500
600
700
800
historic under construction future scale up
Large scale natural gas reformers Nel large scale alkaline electrolysis
$/kW
SMR – capex range
2
• SMR – “steam methane reforming” is dominating hydrogen production today, using natural gas and steam
• Nel is establishing a new manufacturing plant targeting a >40% cost reduction
− Expect to see further reduction in capex with increased production volume, and further size scaling of products
• Nel targets capex to drop below SMR over time
• Electrolysis expected to be the preferred production method if opex (i.e. power prices) is low enough (or at parity) with the alternative production methods (see next page)
Capex of hydrogen production ($/kW) of SMR vs Nel alkaline electrolysers
Fossil parity at $500/kW
capex level
Source: Nel
With current ongoing expansion (360 MW/year)
Historic Future large scale (1 GW/year) (New products / technology development)
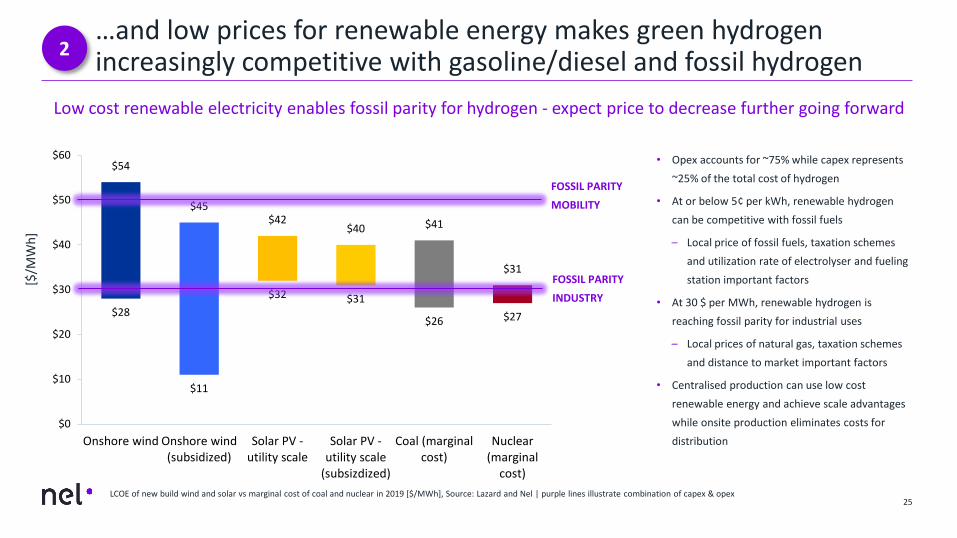
…and low prices for renewable energy makes green hydrogen increasingly competitive with gasoline/diesel and fossil hydrogen
25
• Opex accounts for ~75% while capex represents ~25% of the total cost of hydrogen
• At or below 5¢ per kWh, renewable hydrogen can be competitive with fossil fuels
– Local price of fossil fuels, taxation schemes and utilization rate of electrolyser and fueling station important factors
• At 30 $ per MWh, renewable hydrogen is reaching fossil parity for industrial uses
– Local prices of natural gas, taxation schemes and distance to market important factors
• Centralised production can use low cost renewable energy and achieve scale advantages while onsite production eliminates costs for distribution
2
Low cost renewable electricity enables fossil parity for hydrogen - expect price to decrease further going forward
LCOE of new build wind and solar vs marginal cost of coal and nuclear in 2019 [$/MWh], Source: Lazard and Nel | purple lines illustrate combination of capex & opex
$28
$11
$32 $31
$26 $27
$54
$45$42
$40 $41
$31
$0
$10
$20
$30
$40
$50
$60
Onshore wind Onshore wind(subsidized)
Solar PV -utility scale
Solar PV -utility scale
(subsizdized)
Coal (marginalcost)
Nuclear(marginal
cost)
[$/M
Wh]
FOSSIL PARITYMOBILITY
FOSSIL PARITYINDUSTRY

Nel among the global market leaders within electrolysers
26
• Nel is the largest manufacturer of electrolysers globally
• Nel has an unmatched track record with more than 3,500 hydrogen solutions delivered in ~80 countries world wide since 1927
• Nel continues to strengthen its position through continued high sales activity
26
3
36,7
18,3
13,611,1
96,8 6,1
Nel (electrolyser) Company 1 Company 2 Company 3 Company 4 Company 5 Company 6
Electrolyser manufacturers2018 revenues, USD million
Source: Company websites, 2018 annual reports and market intelligence
2727
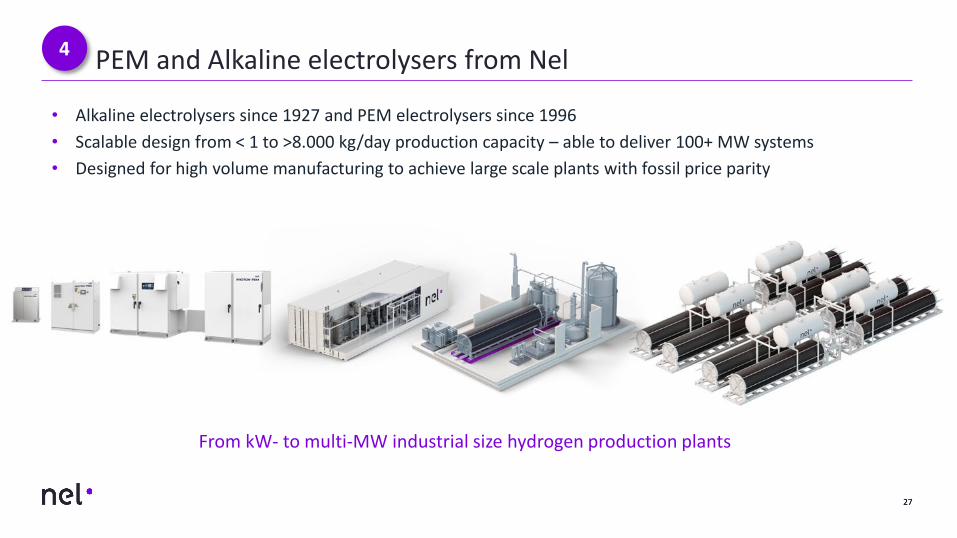
PEM and Alkaline electrolysers from Nel4
• Alkaline electrolysers since 1927 and PEM electrolysers since 1996• Scalable design from < 1 to >8.000 kg/day production capacity – able to deliver 100+ MW systems• Designed for high volume manufacturing to achieve large scale plants with fossil price parity
From kW- to multi-MW industrial size hydrogen production plants

Summary
28
5
To maintain and strengthen its leading position in a growing market, Nel will accelerate investments in organization and technology
The hydrogen market is expected to grow significantly and renewable hydrogen is on a trajectory to outcompete fossil hydrogen
Strong momentum within mobility –especially within HDV. Hydrogen as the preferred future fuel alternative – facilitates true zero emission from production to use
Increasing adoption of industrial hydrogen applications with huge overall potential
Markets in which Nel operates show high activity and strong growth momentum – increasingly important to be a financially strong counterpart, especially for larger contracts
Nel targets to maintain its current leading position in the electrolysis sector, continuing to developboth PEM and alkaline technologies to satisfy specific customer needs and preferences
Going from small to large scale manufacturing

Secured location for low-cost alkaline electrolyser manufacturing at Herøya, Norway
30
Alkaline electrolyser manufacturing plant with possibility to grow beyond 1 GW/year
The new manufacturing facilities are located in Herøya Industrial Park, in a 15,000m2 building in one of the largest industry parks in Norway
Possible set-up for 3 production lines at the Herøya facilities, each line with an initial name-plate capacity of 360 MW/year
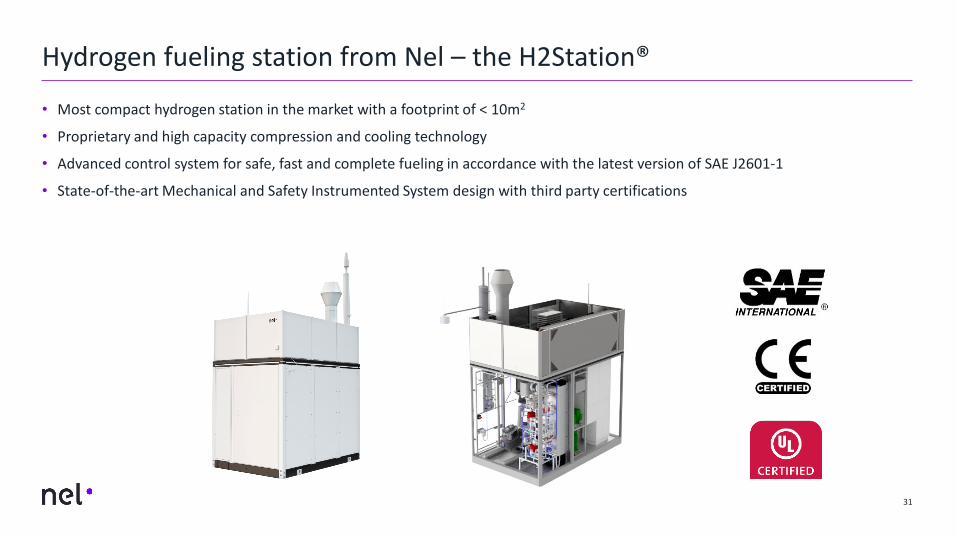
• Most compact hydrogen station in the market with a footprint of < 10m2
• Proprietary and high capacity compression and cooling technology
• Advanced control system for safe, fast and complete fueling in accordance with the latest version of SAE J2601-1
• State-of-the-art Mechanical and Safety Instrumented System design with third party certifications
Hydrogen fueling station from Nel – the H2Station®
31
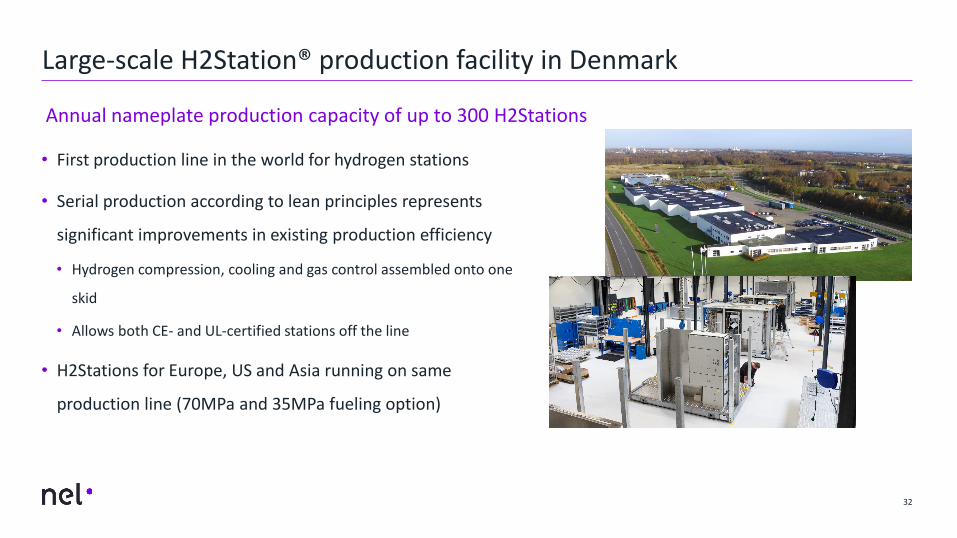
• First production line in the world for hydrogen stations
• Serial production according to lean principles represents
significant improvements in existing production efficiency
• Hydrogen compression, cooling and gas control assembled onto one
skid
• Allows both CE- and UL-certified stations off the line
• H2Stations for Europe, US and Asia running on same
production line (70MPa and 35MPa fueling option)
32
Annual nameplate production capacity of up to 300 H2Stations
Large-scale H2Station® production facility in Denmark
Key risks to the Nel investment case

34
Nel cannot know for certain whether hydrogen will become a major energy carrier, or whether renewable energy will be a large source of hydrogen production for industrial purposes in the future
There is still uncertainty regarding which electrolyser technologies that will become the “winning technologies” in the future. In the meantime Nel will pursue multiple technology tracks (like atmospheric alkaline, pressurized alkaline and PEM) which demands significant capital investments
There is no guarantee that the price of renewable electricity will continue to decrease, hence there is no guarantee for the future competitiveness of renewable hydrogen vs f.ex hydrogen from natural gas w/carbon capture and storage (blue hydrogen)
There is no guarantee that there will be enough production capacity and high enough capacity utilization to drive down manufacturing costs according to envisaged target levels. Further cost reductions are critical for the overall success of Nel and renewable hydrogen
There is still uncertainty within the area of mobility, especially heavy duty (e.g. trucks, busses, trains, boats, ferries), where development of new technology elements will require significant capital investments. To what extent fuel cell based technology will be the winning solution or not is still uncertain
Key risks to the Nel investment case (1 of 2)
35
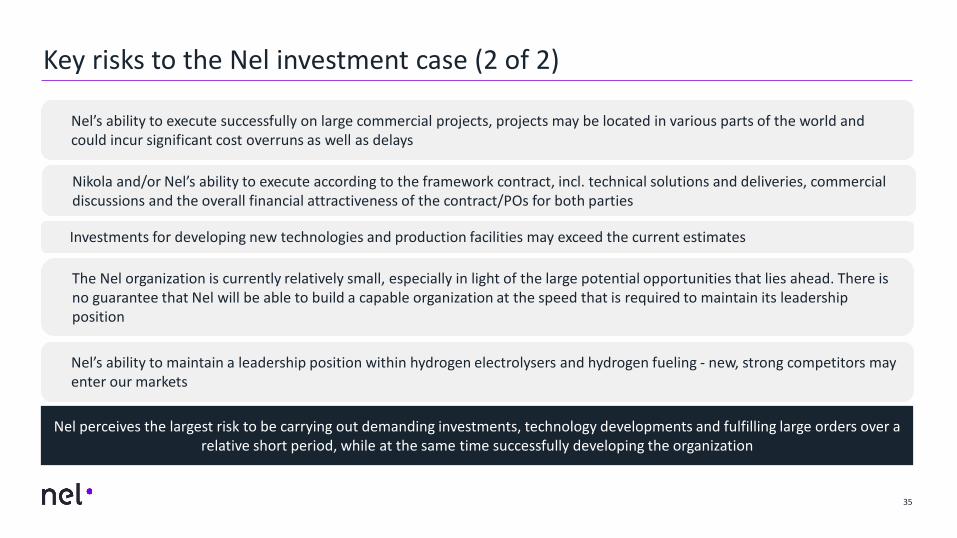
Nel’s ability to execute successfully on large commercial projects, projects may be located in various parts of the world andcould incur significant cost overruns as well as delays
The Nel organization is currently relatively small, especially in light of the large potential opportunities that lies ahead. There is no guarantee that Nel will be able to build a capable organization at the speed that is required to maintain its leadership position
Nel perceives the largest risk to be carrying out demanding investments, technology developments and fulfilling large orders over a relative short period, while at the same time successfully developing the organization
Nel’s ability to maintain a leadership position within hydrogen electrolysers and hydrogen fueling - new, strong competitors mayenter our markets
Investments for developing new technologies and production facilities may exceed the current estimates
Key risks to the Nel investment case (2 of 2)
Nikola and/or Nel’s ability to execute according to the framework contract, incl. technical solutions and deliveries, commercialdiscussions and the overall financial attractiveness of the contract/POs for both parties

Appendix

Appendix: Profit and loss
37
(NOK million) 2019Q3*
2018Q3**
2018Full year
2017Full year***
Operating revenue 148.9 116.0 489.0 302.2
Total operating costs 197.3 182.2 685.1 419.4
EBITDA -28.9 -53.3 -131.6 -77.4
EBIT -48.4 -66.3 -196.1 -117.2
Pre-tax loss -34.3 -67.4 -197.5 -124.4
Net loss -32.4 -65.5 -188.9 -52.4
Net cash flow from operating activities -31.0 -37.4 -142.6 -113.0
Cash balance at end of period 651.0 434.1 349.7 295.0
* The numbers for 2019 include effects of IFRS 16 and comparative figures have not been re-stated
** EBITDA negatively impacted in Q3 18, total non-recurring and other cost of NOK 36.5 million
*** The figures include Proton OnSite from the acquisition date, 30 June 2017
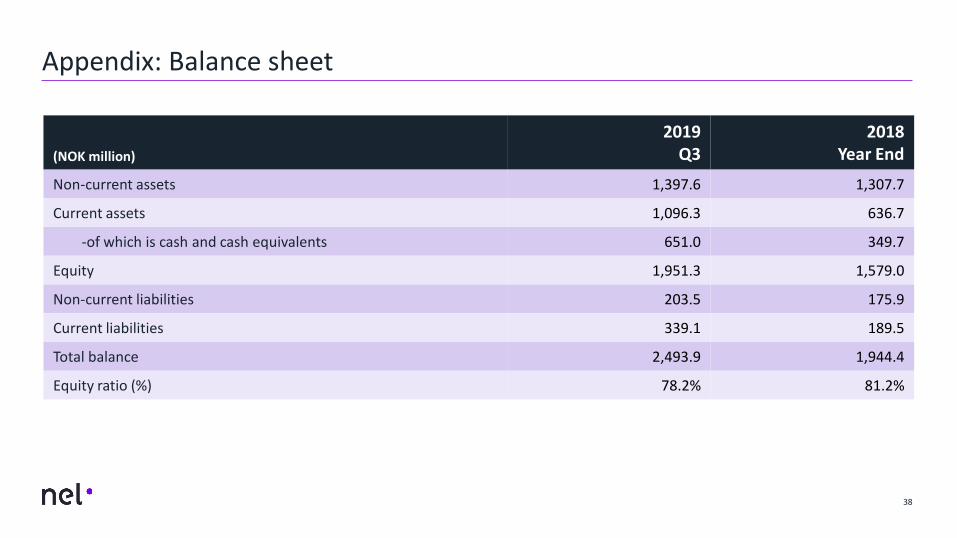
Appendix: Balance sheet
38
(NOK million)
2019Q3
2018Year End
Non-current assets 1,397.6 1,307.7
Current assets 1,096.3 636.7
-of which is cash and cash equivalents 651.0 349.7
Equity 1,951.3 1,579.0
Non-current liabilities 203.5 175.9
Current liabilities 339.1 189.5
Total balance 2,493.9 1,944.4
Equity ratio (%) 78.2% 81.2%

Appendix: Cash flow
39
(NOK million) 2019
Q32018
Full year
Pre-tax loss -34.3 -197.5
Net cash from operations -31.0 -142.6
Net cash from investments -26.4 -143.5
Net cash from financing 10.7 340.8
Net change in cash and cash equivalents -46.7 54.7
Cash at end of period 651.0 349.7

number one by nature