nepal development update investing in people to close the
TRANSCRIPT

NEPAL DEVELOPMENT UPDATEInvesting in People to Close the Human Capital Gap
June 6, 2019
Pub
lic D
iscl
osur
e A
utho
rized
Pub
lic D
iscl
osur
e A
utho
rized
Pub
lic D
iscl
osur
e A
utho
rized
Pub
lic D
iscl
osur
e A
utho
rized


Standard Disclaimer:
Copyright Statement:
Photo Credits:
This volume is a product of the staff of theInternational Bank for Reconstruction andDevelopment/The World Bank. The findings,interpretations, and conclusions expressed inthis paper do not necessarily reflect the view ofthe Executive Directors of The World Bank orthe governments they represent.
The World Bank does not guarantee theaccuracy of the data included in this work.The boundaries colors, denominations, and other information shown on any map in thiswork do not imply any judgement on the partof The World Bank concerning the legal statusof any territory or the endorsement oracceptance of such boundries.
All other queries on rights and licenses, including subsidiary rights, should be addressedto the Office of the Publisher, The World Bank, 1818 H Street NW, Washington, DC 20433, USA, fax 202-522-2422, e-mail [email protected].
The material in this publication is copyrighted.Copying and/or transmitting portions or all ofthis work without permission may be a violation of applicable law. The InternationalBank for Reconstruction and Development/The World Bank encourages dissemination ofits work and will normally grant permission toreproduce portions of the work promptly.
For permission to photocopy or reprint anypart of this work, please send a request with complete information to the Copyright Clearance Center, Inc., 222 Rosewood Drive, Danvers, MA 01923, USA, telephone 978-750-8400, fax 978-750-4470http://www.copyright.com/
Cover Photo © Rajendra Malla/World BankAll other photos in report © Narendra Shrestha/World Bank
Acknowledgments
The Nepal Development Update is produced twice a year to report on key economic developments over the preceding months, placing them in a longer-term and global perspective; and to examine (in the Special Focus section) topics of particular policy significance. The Update is intended for a wide audience including policy makers, business leaders, the community of analysts and professionals engaged in economic debate, and the general public.
This Update was produced by the World Bank Macroeconomics Trade and Investment (MTI) team for Nepal consisting of Kene Ezemenari and Nayan Krishna Joshi. Tekabe Belay, Aline Coudouel, Shwetlena Sabarwal; Manav Bhattarai; Kari L. Hurt; Jasmine Rajbhandary; Zelalem Debebe;
Kathryn Andrews; Mohan Aryal; Jyoti Pandey; Anastasiya Denisova; Phillippe Leite; Soyesh Lakhey contributed to the Special Focus section under the guidance of Cristian Aedo, Gail Richardson, and Stefano Paternostro. Christian Eigen-Zucchi and Sabin Shresthra provided extremely useful comments. Oversight in preparing the report was provided by Mona Prasad under the overall guidance of Manuela Francisco, Faris Hadad-Zervos, and Idah Pswarayi-Riddihough. Richa Bhattarai managed media relations and dissemination. Diane Stamm edited the document. Sunita Kumari Yadav managed the publication process.
The cut-off date for data included in this report was May 15, 2019.
i

Abbreviations
BFI Banks and Financial InstitutionsCAD Current Account Deficit CBS Central Bureau of StatisticsCCD Credit to Core Capital Plus Deposit DOC Department of CustomsDoFE Department of Foreign EmploymentDRM Disaster Risk ManagementECD Early Childhood DevelopmentECED Early Childhood Education and DevelopmentEPI Expanded Program on ImmunizationFCGO Financial Comptroller General OfficeFDI Foreign Direct InvestmentGDP Gross Domestic ProductGoN Government of NepalHCI Human Capital IndexIRC Interest Rate CorridorMOAD Ministry of Agriculture and Livestock DevelopmentBMTEF Medium-Term Expenditure Framework MTI Macroeconomics Trade and InvestmentMW MegawattNDU Nepal Development UpdateNEPSE Nepal Stock ExchangeNRB Nepal Rastra Bank, the central bank of NepalNTIS Nepal Trade Integration StrategyPPE Pre-Primary EducationSEZ Special Economic Zone SLF Standing Liquidity Facilityy/y year-on-year
ii

Table of Contents
Acknowledgments.............................................................................................iAbbreviations....................................................................................................iiExecutive Summary...........................................................................................1A. Recent Economic Developments................................................................17B. Outlook, Risks and Challenges...................................................................29C. Special Focus – Investing in People to Close the Human Capital Gap for Higher and Sustained Inclusive Growth....................................................33 C.1. Measuring Nepal’s Human Development Outcomes – the Human Capital Index.......36 C.2. Nepal’s human capital index ranks relatively well against that of other countries.........39 C.3. For Nepal to realize its full human capital potential, renewed efforts are needed along three fronts: reducing inequity, improving service quality, and minimizing vulnerabilities........................................................................................................................42
Figure 1. Private investment is estimated to pick up in FY2019 while public investment contracts, and......................................................................................................18Figure 2. … new post-earthquake housing reconstruction is tapering off........................18Figure 3. Agriculture and services drove growth…...........................................................18Figure 4. …as production of paddy, maize, and wheat crops reached historic highs......18Figure 5. Inflation was kept low due to low food prices....................................................19Figure 6. …and closely follows India’s inflation...............................................................19Figure 7. Money supply growth picked up as private sector credit growth increased…..19Figure 8. …and government deposits shrank....................................................................19
Table ES1 : Priority interventions to invest in people and scale-up human capital investments......................................................................................................14Table 1 : Macroeconomic Projections of Selected Key Indicators................................31Table 2 : Top 10 causes of death for adults age 15 to 49, by gender..............................40Table 3 : Top 10 risk factors contributing to the cause of death of adults age 15 to 49, by gender.........................................................................................................40Table 4 : Health outcomes and access to health services by caste................................46Table 5 : Average government social sector spending by region, 2012–16.....................50Table 6 : Key labor market indicators by age and gender..............................................53Table 7 : Priority interventions to invest in people and scale-up human capital investments......................................................................................................65
List of Figures:
List of Tables:
References........................................................................................................68

Figure 9. Credit growth remains high…...........................................................................20Figure 10. … and deposit growth also increased................................................................20Figure 11. Credit continued to be directed to working capital, overdraft, and real estate activities..............................................................................................................20Figure 12. Exposure to the real estate sector continues to increase....................................20Figure 13. The CCD ratio exceeded its regulatory limit in December 2018 for the first time since April 2012...........................................................................................22Figure 14. …contributing to higher deposit and lending rates...........................................22Figure 15. The inter-bank rate remained within the IRC corridor only in February and March 2019..........................................................................................................23Figure 16. The NEPSE reached a three-year low................................................................23Figure 17. Exports growth has recovered............................................................................24Figure 18. …as exports to India and China increased........................................................24Figure 19. Industrial and consumer goods drove export growth........................................24Figure 20. …while, the growth rate of imports declined....................................................24Figure 21. The growth of imports from India, China, and other countries contracted.....25Figure 22. The import of industrial goods and transport equipment also contracted.......25Figure 23. …and total oil imports increased.......................................................................25Figure 24. Migrant outflows continue to decline................................................................26Figure 25. …but remittances remain well above the five-year monthly average................26Figure 26. The current account deficit widened as the trade deficit remains high............26Figure 27. …but foreign exchange reserves remain comfortable ......................................26Figure 28. Government revenue picked up due to significant growth in value addedtax, income tax, excise, and custom duties..............................................27Figure 29. Government expenditure declined driven with contraction in capital expenditure contracted.......................................................................................27Figure 30. Underspending of capital expenditure continues at the federal level...............28Figure 31. ...and also at the provincial level.........................................................................28Figure 32. Efforts are needed across sectors to scale-up quality investments in human capital.................................................................................................................34Figure 33. Circumstances of birth can determine investments in a child’s education......35Figure 34. Composition of indicators that make up Nepal’s Human Capital Index.........38Figure 35. Nepal’s child and adult survival rates compare favorably with some middle- income countries................................................................................................39Figure 36. The fraction of non-stunted children is low or, conversely, the stunting rate is high at 36 percent................................................................................................41Figure 37. Stunting rates are decreasing over time..............................................................41Figure 38. Nepal’s expected years of schooling is higher than the South Asia regional average................................................................................................................41Figure 39. …but performance worsens with learning-adjusted years based on harmonized learning outcomes..........................................................................42Figure 40. The gender gap for schooling, survival, and stunting is generally low in Nepal..................................................................................................................44

List of Boxes:Box 1 : The HCI measures the human capital a child born today can expect to attain by age 18………………………….................................................................................37
Figure 41. Institutional delivery and stunting rates in Nepal are lowest for the poorest households..........................................................................................................45Figure 42. Pupil-teacher ratio by region, 2015/2016............................................................46Figure 43. Stunting prevalence............................................................................................47Figure 44. Poverty rate.........................................................................................................47Figure 45. Adult literacy rates..............................................................................................47Figure 46. General government health expenditure as a percentage of current health expenditure.........................................................................................................48Figure 47. Government domestic spending on social sectors (percent of GDP)...............50Figure 48. Key Interventions for the Early Years at Different Stages of development.......56Figure 49. Social registries serve multiple programs and sectors in the world...................61Figure 50. Nepal is vulnerable to shocks that can erase years of progress made in human development.......................................................................................................62Figure 51. Adaptive social protection protects against destitution after a shock occurs....63Figure 52. Percentage of households’ total health and medical expenditures as a share of non-food household consumption expenditures using different thresholds: Nepal (NLSS 2010/2011).....................................................................................63

Recent Economic Developments
Executive Summary............................................................................................................................................................................................................................................................................................................................................................
............................................................................................................................................................................................................................................................................................................................................................
Gross domestic product (GDP) growth in Nepal is estimated at 7.1 percent in FY2019, driven mainly by the service and agriculture sectors. The service sector is likely to grow by 7.5 percent due to a boost in the retail, hotel, and restaurant subsectors, driven by an uptick in tourist arrivals and remittance-fueled private consumption. Agriculture is estimated to grow by 5 percent in FY2019, well above its 30-year average of 3.1 percent, due to good monsoons, increased commercialization, availability of fertilizers and seeds, and improved irrigation facilities. Industrial growth is also likely to be strong at 8.1 percent, well above its 30-year average of 5 percent, mainly due to improved power availability from increased electricity generation. Private investment and consumption are likely to be the main contributors to growth on the demand side. However, public investment is projected to contract due to a slowdown in post-earthquake reconstruction and delays in national pride projects like Melamchi water supply and Upper Tamakoshi hydroelectric.
Average inflation remained low, despite an increase in the money supply by 18.7 percent.
1
Investing in People to Close the Human Capital Gap
June 2019
Nepal Development Update
World Bank Group
Inflation, which typically mirrors the trend in India, has remained subdued throughout FY2019 due to low food prices and stood at 4.2 percent in March 2019. Growth in the money supply exceeded the monetary policy target of 18 percent, driven largely by private sector credit which grew by 22.5 percent (y/y) in March 2019. Most of the credit is directed to working capital, overdraft, and real estate, which together account for almost 80 percent of total credit. Early in FY2019, Nepal Rastra Bank adopted macroprudential measures that helped reduce lending to the real estate sector and on overdraft facilities. Deposits grew by more than 20 percent in March 2019 but lagged credit growth. The growth in deposits was driven by the provision allowing local governments to deposit 50 percent of their fiscal transfers in local commercial banks. It was also supported by higher individual deposits, underpinned by remittance inflows. The higher levels of credit relative to deposits caused the credit to core capital plus deposit ratio to breach the 80 percent regulatory limit in December 2018, for the first time since 2012.

Imports growth decelerated, but the trade deficit remained high because of high imports relative to persistently low exports. The growth in imports decelerated during FY2019 but remained high at 18 percent (y/y). Imports were primarily driven by industrial goods, oil, and transport equipment, which were needed to support the growth in the industrial and service sectors. In contrast, exports grew by only 7.5 percent (y/y) in the first eight months of FY2019, led by food and beverages and industrial supplies. The current account was supported by higher remittances which grew by 14.4 percent (y/y) in the first eight months of FY2019. This was primarily because of increased use of formal channels to remit money, a depreciation of the Nepalese rupee, and outmigration to destinations like Japan and the Republic of Korea, where wages are higher. Foreign exchange reserves fell to US$9.6 billion in March 2019 as the higher external deficit was partly financed by drawing down international reserves. However, reserves remain comfortable at 7.9 months of imports.
Continued underspending of the budget coupled with reforms to raise revenues are likely to result in a lower fiscal deficit in FY2019, compared with the previous year. Consolidated government revenues grew by 17.5 percent (y/y) in the first eight months of FY2019. This growth was led by tax revenues, especially, the value-added tax (VAT), and customs, income, and excise taxes. The recent reforms by the government to increase tax revenues by removing VAT exemptions, raising taxes on luxury items and high-earning households, and higher excise on tobacco and vehicles supported growth in tax collection. In contrast, consolidated expenditures increased marginally by 0.3 percent (y/y) in the first eight months of FY2019, and was primarily driven by recurrent spending. The limited number of staff at the provincial and local levels along with constraints on capacity led to weak execution of the budget at the subnational levels. The execution of the capital budget by the central government was also low because of a tapering off of reconstruction spending and further delays in national pride projects. Although capital spending
Outlook
GDP growth is projected to average 6.5 percent over the medium term, driven by services and underpinned by a steady inflow of remittances. New international job markets for Nepalese migrants are opening up, while migrants are increasingly using formal channels to remit money. The continued inflow of remittances will support domestic trade and private consumption. In addition, high tourist arrivals expected under the Visit Nepal 2020 program, the completion of the second international airport, and the construction of big hotels will also support the service sector. Assuming normal monsoons, agricultural growth isexpected to average 4.4 percent over the forecast period supported by programs to promote improved inputs, storage facilities, irrigation, and agribusiness value chains. In addition, recent structural reforms will provide an impetus to private investment. The signing of the protocol to implement the Transit and Transport Agreement with China will enable Nepal to use China’s seaports and improve regional connectivity and transit. Newly enacted laws including the Foreign Investment and Technology Transfer Act, the Public-Private Partnership and Investment Act, and the Special Economic Zone Act will help ease restrictions on foreign investment and reduce transaction costs. In addition, 13 Special Economic Zones are being constructed in various parts of the country. These efforts will further support growth.
The trade deficit is expected to decline as imports growth slows and exports begin to pick up. As the one-time spending on federalism-related infrastructure and post-earthquake reconstruction taper down, the growth in imports will slow. A continued shift to investment-led growth will bring with it some demand for related imports that will translate to the trade deficit. Someincrease in exports, particularly of hydroelectricity, is anticipated in the next few years that would help contain the trade deficit, and reduce the current
2
Investing in People to Close the Human Capital Gap
June 2019
Nepal Development Update
World Bank Group
typically picks up in the last quarter of the year, the fiscal deficit is likely to remain lower than last year at 3.4 percent of GDP in FY2019.

account deficit. Broader growth in overall exports will happen only in the longer term as structural reforms start yielding results. Remittances as a share of GDP are expected to stabilize at 27 percent over the medium term. By FY2021, the current account deficit is expected to moderate to 5.5 percent of GDP, and international reserves are likely to cover around five months of imports. The external gap will be financed primarily by long-term borrowing and a drawdown of foreign exchange reserves. There are negligible portfolio investments in the country, and despite some expected increase in foreign direct investment, it will continue to remain low.
The fiscal deficit is projected to average around 4 percent of GDP, over the medium term. Recent underspending has helped reduce the fiscal deficit. In subsequent years, as the provincial and local governments become fully functional, the fiscal deficit is projected to increase, rising to 5.1 percent of GDP in FY2021. The government has set up a commission to review and suggest measures to improve spending efficiency. Reforms to broaden the tax base will help increase revenues to 30 percent of GDP by FY2021. Non-tax revenues are also expected to increase because of royalties from new hydropowerprojects. At the subnational levels, efforts are underway to establish the legal and institutional framework to support enhanced own-tax revenue collection. The fiscal deficit is likely to persist as the government proceeds with key reforms to implement fiscal federalism and ease constraints to investment and finance. Public debt is projected to increase to 32.7 percent of GDP by FY2021. Despite the increase, Nepal continues to remain at low risk of debt distress. Debt sustainability stress tests show a vulnerability to growth shocks and natural disasters and underscore the importance of implementing sound macroeconomic policies and structural reforms.
Risks and Challenges
3
Investing in People to Close the Human Capital Gap
June 2019
Nepal Development Update
World Bank Group
A sudden reduction in remittance inflows could lower deposits, limiting the availability of loanable funds in the economy. This could affect private investment and imports, consumption
and growth. Remittance inflows have supported household consumption, helping to reduce poverty. It has also helped the economy to earn foreign exchange for imports. The lower outflow of migrants may continue and conditions in migrant-receiving countries could deteriorate, with increasing geopolitical tensions in the Gulf region and uncertain oil prices. These trends could put pressure on remittance inflows, especially if new markets attract only a limited number of laborers from Nepal. Lower credit to the economy that leads to lower growth would also reduce exports. This points to the need to reduce the heavy reliance on remittances as a source of foreign exchange and savings. Greater focus is needed onincentivizing and diversifying exports.
Risks from climate-related natural disasters are also high and may impact Nepal’s growth trajectory, requiring early action to ensure that sources of growth are climate resilient to the extent possible. Erratic monsoons can lead to climate-related disasters such as drought, floods, and landslides that undermine agricultural production, negatively impact infrastructure, and reverse gains in poverty reduction. The Global Climate Risk Index ranks Nepal as the 11th most affected country in the world in the last 20 years. The vulnerability to climate change is further reinforced by the country’s first tornado that hit two Terai districts in March 2019 and resulted in a loss of US$4.6 million worth of crops and livestock. To mitigate these risks, the implementation of the 2017 Disaster Risk Reduction and Management Act will be crucial at all three levels of government.
The implementation of federalism is expected to improve service delivery in the medium to longer term, but capacity challenges persist and need to be addressed immediately. These challenges could manifest themselves through the under-execution of the provincial and local budgets, which could impact service delivery. Therefore, efforts are needed on two fronts: (a) the move of civil servants to the provincial and local level under the Civil Servants Adjustment Ordinance, and (b) capacity building of these staff.

Finally, an acceleration of and greater consistency and coordination in reform implementation, particularly those reforms that boost investment in physical and human capital, will be necessary to sustain growth. Nepal needs infrastructure investments of around 10 to 15 percent of GDP annually for the next 10 years. To boost investments, the government organized the Nepal Investment Summit in March 2019, which resulted in investment proposals worth about US$17.5 billion from both domestic and foreign investors. The success of these investments will depend on the timely implementation of investment-related legislations that meet good practices. It is equally important to ensure the availability of skilled labor to meet the needs of the private sector, complement investments in infrastructure, and facilitate innovation. The Special Focus section of this edition of the Nepal Development Update outlines the key issues and reforms, to support scaled up investments in people and lay the foundation for increasing human capital and labor productivity.
Special Focus – Investing in People to Close the Human Capital Gap for Higher and Sustained Inclusive Growth
4
Investing in People to Close the Human Capital Gap
June 2019
Nepal Development Update
World Bank Group
Investing in people and building human capital are critical if Nepal is to accelerate its growth and rapidly reduce poverty. Human capital investments raise individual earnings potential, which in turn contributes to aggregate economic growth. For instance, one additional year of schooling in Nepal can raise an individual’s earnings by 8 to 10 percent. Undernutrition reduces learning potential and productivity and can reduce GDP by as much as 11 percent. Investing in psychosocial stimulation during a child’s early years can raise his or her adult income by up to 25 percent. School deworming can have a large and sustained impact on labor market outcomes in adulthood. Increases in life expectancy are positively correlated with economic growth.
Investing in people is also critical for increasing Nepal’s competitiveness. Firms note that the lack of skills aligned to the needs of the private sector is a key constraint to firm growth
and movement up the value chain. Inability to scale-up production affected firm competitiveness. Human capital also affects growth indirectly through its effect on the productivity of capital, technological change, and innovation. Thus, investments in both the future and current workforce, combined with policies to increase labor productivity and encourage labor force participation, matter for higher, sustained, and inclusive growth. Now is an opportune time for Nepal to scale-up its investments in human capital before the demographic dividend window closes. According to the World Bank’s 2015/16 Global Monitoring Report,1 Nepal is an early dividend country, defined to include countries where total fertility is below four births per woman. When a country finds itself with a working-age population or labor force that is growing faster than the population that depends on it (such as children and the aged), it creates a window for higher economic growth because the economy can potentially employ more people, savings grow and become a financing source for economic growth, and lower fertility rates result in healthier women. When there are fewer economic pressures and more resources to invest in children, GDP per capita increases due to a decreasing dependency rate. For the demographic transition to be accompanied by significant improvements in per capita GDP, it is therefore essential to scale-up investments in human capital to raise the productivity of future generations and existing cohorts of youths and adults.
A child born in Nepal today will be only 49 percent as productive when she grows up as she could be if she enjoyed complete education and full health. This is based on the estimate of Nepal’s Human Capital Index, developed by the World Bank’s Human Capital Project. Nepal’s GDP can be compared under two scenarios, one in which the current status quo continues and another in which a child gets full education and health. Under the scenario in which a child gets full education and health, Nepal’s GDP could be as much as two times larger than the GDP under the status quo scenario. Achieving the full

For Nepal to realize its full human capital potential, renewed efforts are needed to reduce inequity, improve service quality, and minimize vulnerabilities
Priority number 1: Reduce inequity across gender, social, income, and geographicgroups
5
Investing in People to Close the Human Capital Gap
June 2019
Nepal Development Update
World Bank Group
education and health scenario will require a significant reduction in stunting beyond past progress that led to a reduction of stunting from 57 percent in 2001 to 36 percent in 2016. At 36 percent, the stunting rate remains a public healthconcern. Similarly, significant improvements wouldbe needed for schooling outcomes. A child who starts school at age four can expect to complete 11.7 years of school by her 18th birthday. However,if what children actually learn is factored in, expected years of schooling drops from 11.7 years to 6.9 years. This means that, on average, around 4.8 years of schooling are lost due to poor quality.
Attention to labor market effects, particularly for youth and women, will be an important catalyst of investment in human capital. Labormarket outcomes and earnings can affect human capital investment decisions, which in turn affect skills, productivity, and earnings. Increased investments in the human capital of youth and women is important given Nepal’s recent history and the interplay between poor labor market conditions, the prospects for youth, and social unrest. Unemployment is highest among young people, who account for 48 percent of the labor force but make up 69 percent of those unemployed. Among all age groups, women’s labor force participation (on average 26 percent) ismuch lower than men’s participation rate (54 percent). Also, the share of young women whoneither work nor study has increased in rural areas.Cross-country surveys suggest that only 41 percent of working Nepalese youth are satisfied with their employment status. This contrasts with youth inBangladesh, Cambodia, and Vietnam (where over 80 percent are satisfied).
1 World Bank 2016b.
Inequity, or disparity across social, income, and geographic dimensions, limits access to quality services and increases the vulnerability to shocks that can erode years of human
capital investment. Addressing these inequities is critical to boosting human capital outcomes in Nepal and reducing the confounding effect of disparities from different sources that often overlap and work together to keep households from realizing their full potential. These disparities are observed almost systematically for all dimensions of the Human Capital Index and broader labor market outcomes. Improved human capital outcomes will also require better quality of service and access to services (which often depends as well on the socioeconomic status of beneficiaries). Finally, measures to minimize the vulnerability to shocks are critical to ensure acquired gains in human capital are sustained and further built upon. Given these three key factors, to realize its full human capital potential Nepal will have to address the following priorities.
Gender parity has been achieved at the secondary education level and below (with male and female expected years of schooling at 11.5 years and 11.9 years, respectively), but has not translated to labor force outcomes. The differences in labor force outcomes between males and females can lead to gender-based differences in the ability to build on and further develop skills, which impacts earnings, which in turn influence investments in human capital. For every 100 men in the working-age population, there are 125 women. Yet, for every 100 employed men there are only 59 employed women. Gender disparities also exist among the unemployed, and women earn on average 70 percent of what men earn. Many of these differences are driven by prevailing social norms. But part of the reason could also be due to the gender disparities that emerge at the tertiary education levels in the fields of science and technology. There could also be gender differences linked to the quality in services for males and females. Policies and programs have enabled women to participate more in decision making, with greater access to assets and resources. But

women continue to experience greater vulnerability and risks to certain aspects of their human development outcomes.
Income and social disparities are correlated with human capital outcomes. For example, more than 86 percent of children aged three to five in the richest quintile achieve composite early childhood development milestones, while only about 60 percent of children in the poorest quintile do. Girls and children from disadvantaged groups have disproportionately low access to schooling and high repetition and dropout rates, indicating systematic and limited exposure to enabling learning conditions. This is particularly problematic because the returns to targeted early investment are highest for disadvantaged children. Decomposition analysis has revealed that by 2016, wealth explained 72 percent of the differences in stunting (up from 61 percent in 1996), while mother’s health accounted for 12 percent of the disparities. Similarly, stunting rates among the poor are about 2.9 times higher than the rate among the rich. Disparities are also observed along social lines; for example, Dalit children have almost double the rate of mortality (63 percent) as the national average (49 percent). The above inequities can have adverse effects on labor market outcomes, which in turn lead to unequal access to social and human capital. Personal networks are an essential element for youth and adults who seek employment and the quality of these networks are often linked to levels of income or social status.
Geographic disparities are also correlated with human capital outcomes. For example, stunting rates are high in Province 6 (55 percent) and low in Provinces 3 and 4 (29 percent). These patterns are also correlated with regional differences in malnutrition and food insecurity, and in educational attainment. Important variations in poverty across geographic areas explain part of the geographic disparity in human capital outcomes. Remoteness, density, and accessibility are also factors that can explain some of the regional differences. The recent adoption of federalism could exacerbate regional disparities, unless care is taken to address
(i) Eliminate barriers for the poor in accessing human capital services
Income is an essential determinant of consumption and living conditions. In addition, addressing the income constraints of the poor can also represent barriers to accessing services. This is a particular challenge in the health and education sectors. In FY2015/16, households’ out-of-pocket payments represented the main source of funding for the country’s health system, at 55 percent of all health care spending. This is high relative to that of countries like Thailand (12 percent), Vietnam (43 percent), and Sri Lanka (38 percent), which exhibit better health outcomes. In education, low access to quality means that there is a need to focus on the demand side or interventions that incentivize the poor, vulnerable, and excluded to increase their access and use of services.
Demand-side programs have been effective in reducing inequalities in access to education and health in Nepal. Per child financing and scholarship programs such as the scholarship program for students from poor and underdeveloped communities played a crucial role in helping bring children from marginalized groups to schools. According to the 2014 public expenditure tracking survey, stipends have been given to about 98 percent of Dalit students.2 Such interventions have also been effective in tertiary education. Similarly, in health, programs such as AamaSurakshyaKaryakram (ASK) were instrumental in expanding access to maternal
2 World Bank 2014.
them in the formula used to estimate needs and allocate resources and in strengthening the capacityof the poorest areas to manage and deliver qualityservices.
To address the challenge of inequity in access to services and resulting outcomes, it will be necessary to (i) eliminate barriers linked to low income and social status that lead to exclusion of the poor and vulnerable, and (ii) increase the availability of services in poorer or underserved areas.
6
Investing in People to Close the Human Capital Gap
June 2019
Nepal Development Update
World Bank Group

(ii) Increase availability of services in poor or underserved areas
health services, by providing care for women to deliver in health institutions and paying service providers for the services rendered.
In addition, social protection programs can be used to address income barriers and incentivize households to invest more in human capital and related services. Such programs are implemented in over 150 countries and have demonstrated their impact on nutrition, health, education, empowerment, labor market outcomes, and productivity. They typically combine some form of transfers with information or incentives to promote behavioral changes, such as feeding or hygiene practices, early childhood stimulation, investments in education, changes in employment, and investments in productive assets. In Nepal, a national-level policy would help to achieve broader poverty reduction and human capital development (or health and education) goals; clarify the roles of the three level of government in the design and delivery of programs; outline institutional mechanisms to ensure coordination; and provide guidance for standards linked to improved coordination, delivery systems, and responsiveness to shocks. The policy or strategy could build on the National Social Protection Framework draft prepared by the National Planning Commission and would require further engagement with various line ministries and subnational governments.
A social registry would contribute to improving the targeting of programs to those most in need and to coordinating interventions. A social registry could be used by programs to identify poor and vulnerable households and connect them to multiple programs. Nepal has been working on establishing a database of poor households, though this has yet to be linked to benefits or programs. A social registry could help direct vulnerable households to specific interventions – grants, cash transfers, public works programs, scholarships, and various health schemes including health insurance aimed at protecting the poor and vulnerable, as well as economic inclusion programs. A social registry would also help connect households with employment and income-earning opportunities.
Equally important to raising human capital outcomes are interventions to raise labor productivity and employability, particularly for today’s youth, who will become tomorrow’s income-earning adults and parents. It is essential to ensure that investments in human capital support the development of skills that increase employability and respond to the needs of the private sector. Furthermore, when parents and youth today see the returns in terms of earnings, it reinforces the value of investing in health and education for young children. Equally important to quality job creation is ensuring there is increased knowledge of and access to these jobs. It is also essential to improve productivity in sectors where the poor are focused (such as agriculture), to ensure the energy and knowledge of returnee migrants are harnessed and invested in employment-generating growth. It requires adequate and complementary investments in both physical and human capital since both are necessary complements for increasing productivity.
Increasing the availability of services for poor and underserved areas needs investments to expand the supply of those services. Estimates of overall average spending across the 753 localities and 7 provinces suggest that more local resources and their efficient use are critical to improve outcomes and reduce regional disparities. In FY2018, fiscal transfers amounting to 8.3 percent of GDP were made to both local governments and provinces. Given the estimated historical spending levels for education, health, social protection, and nutrition (a combined estimate of 7.5 percent of GDP), clearly the current levels of transfers are insufficient to meet local needs. With federalism, it will also be important to assess local needs and costs for service delivery and to use this to adjust the basis for fiscal transfers to provinces and localities. It will be important to refine the basis for fiscal transfers to be more effectively aligned to needs, local costs, and capacity; develop the revenue capacity of local governments; and ensure local governments are efficiently applying
7
Investing in People to Close the Human Capital Gap
June 2019
Nepal Development Update
World Bank Group

3 Mohan et al., forthcoming.4 Ministry of Education, “Nepal National Assessment of Student Achievement,” various years.5 World Bank 2017. 6 Ministry of Education, Flash Reports, various years.7 Ajwad 2007.
the resources received to improve the quality of service delivery, including the effective targeting of resources to the poor and vulnerable. For instance, a recent study shows that head teachers and teachers are worried that scholarships targeted at poor and marginalized families may be particularly vulnerable under federalism.3
Priority number 2: Improve the quality of education, health, nutrition, labor, and social protection services from early childhood to adulthood
Improved quality and relevance of education requires more investments in early childhood education, and early grade reading. As noted, an average of around 4.8 years of schooling up tothe secondary level is lost due to poor quality. Among young children, literacy and numeracy are severely lagging. Fewer than 20 percent of children in grades 3, 5, and, 8 can master competencies in problem solving and reasoning.4 Even more concerning, 19 percent of third graders could not read a single word of Nepali, while less than 13 percent were able to read with fluency and comprehension. This is a huge problem since the ability to read by age 10 lays the foundation for future learning.5 Deficits in foundational skills are primarily driven by two factors. First, children are often not ready for school. Robust early childhood education and development (ECED) helps children acquire key foundational cognitive skills that will launch them on higher learning trajectories,making them more adaptable, resilient, and productive. Currently, about 16 percent of four-year-old children do not have access to, or have not been enrolled in, ECED/pre-primary education.6 Second, teachers are not trained to teach to the level of the child and/or provide additional support to those lagging behind. Programs that address these issues can help improve both learning outcomes and expected years of schooling in Nepal.
Improved learning also requires better alignment of teachers and student assessment systems with the goal of learning for all. The prevailing institutional structure gives school administrators little leverage over centrally hired teachers, and the accountability of the school system to households has been low.7 There are no effective accountability mechanisms in the system that focus adequately on teaching-learning processes in the classrooms. This results often inclassroom instruction that occurs at a level thatmost students cannot follow. Finally, improved data can help identify which schools need more resources, which teachers need more training, and which students need more instruction. Nepal has taken positive steps toward better measurement of learning. To this end, several rounds of the National Assessment of Student Achievement (NASA) have been completed. However, there is limited use of these data in guiding policy or practice. For instance, learning data can be useful in helping policy makers decide which schools need additional resources and which teachers need additional training. Similarly, these data can help teachers see which areas of instruction and which students need greater attention. Currently, even though learning data are being produced, they could be much better used to improve policy and practice. One way to ensure this is to devote resources (including effort) to timely distribution of understandable results to key stakeholders.
Improving the quality of health services needs investment to ensure availability of essential and priority drugs, adequate training of health workers, and proper facilities and equipment. Quality of health services is largely constrained by the availability of critical inputs such as essential drugs and adequately trained health workers. For example, the National Health Facility survey found that only 3 percent of the health facilities providing outpatient care for children have all the infection prevention items needed to control infection among sick children. Only 55 percent of health
8
Investing in People to Close the Human Capital Gap
June 2019
Nepal Development Update
World Bank Group

facilities have proper expanded program on immunization (EPI) guidelines, 20 percent of staff is trained in EPI, 3 percent have a needle destroyer, and less than 8 percent have all the training and equipment needed for EPI services. Moreover, there is a shortage of qualified workers, worker absenteeism, stock-outs of essential drugs, and limited physical infrastructure (such as health facility buildings with water and electricity and equipment). These supply-side factors are exacerbated by the high out-of-pocket costs that further limit the quality of services most households can access.
Addressing malnutrition requires improving people’s behavior toward adopting good nutrition practices and improving the quality of nutrition services. Currently, only 42 percent of women age 15 to 45 with a child born in the past five years took iron tables for at least 180 days.8 Only 36 percent of children 6 to 23 months met the criteria of a minimum acceptable diet. The National Micronutrient Status Survey 2016 also shows that multiple micronutrient supplementation besides iron/folic acid is needed to combat anemia. As per the survey, anemia in pregnant women is high at 27 percent. The same survey shows that zinc deficiency in children 6 to 59 months is as high as 21 percent, and only 7 percent of these children with diarrhea had received zinc supplements.
The quality of social protection services needs to be improved to support higher investments in human capital. Despite significant spending, access to social protection is uneven. Also, despite covering around 35 percent of the population, social assistance schemes are not targeted explicitly toward the monetarily poor. Instead, they rely on targeting based on ethnic and social categories. Thebenefits provided by some programs are also too small to effectively remove the income barrier most of the poor face when trying to access services. Improved targeting could promote greater efficiency in reaching the poor and also help release more resources for the poor. The flexibility of programs to respond to changing circumstances,
including disasters or shocks, would also contribute to increasing their impacts and efficiency. Finally, most programs would have greater impacts on investments in human capital if the income support they provided was accompanied with information, incentives, or nudges to adopt behaviors that promote greater investments in the nutrition, health, and education of children, and in the productive and earning capacity of adults.
Quality labor market interventions are also essential to ensure human capital investments effectively support inclusive growth. Currently, such interventions are relatively limited in Nepal, especially for the poor and vulnerable. Improving the situation of youths and adults, especially adolescent girls and women, will require addressing the challenge of low-productivity employment (which is an area where efforts both on labor supply and demand sides are needed) through comprehensive programs. In addition to translating increased human capital into growth, these policies will also motivate households to invest in the human capital of their children by showing that there are potentially large returns to this investment.
To raise the quality of service, it is necessary to (i) invest early in human capital and early childhood development, adopting a multisectoral approach, (ii) ensure the availability of essential drugs and adequately trained health workers; (iii) invest in the human capital and skills of the existing generations of youths and adults; (iv) adopt transparent performance management measures to incentivize service providers, and (v) strengthen coordination across government and programs and ensure policy continuity.
8 National Demographic Health Survey 2016.
(i) Invest early in nutrition and early childhood development, adopting a multisectoral approach
A multisectoral approach to early childhood development has been demonstrated to be most effective in enabling children to reach their full potential. This includes interventionsnot only from health and education but also from
9
Investing in People to Close the Human Capital Gap
June 2019
Nepal Development Update
World Bank Group
(ii) Invest in the supply of health services
(iii) Invest in the human capital and skills of existing generations of youths and adults
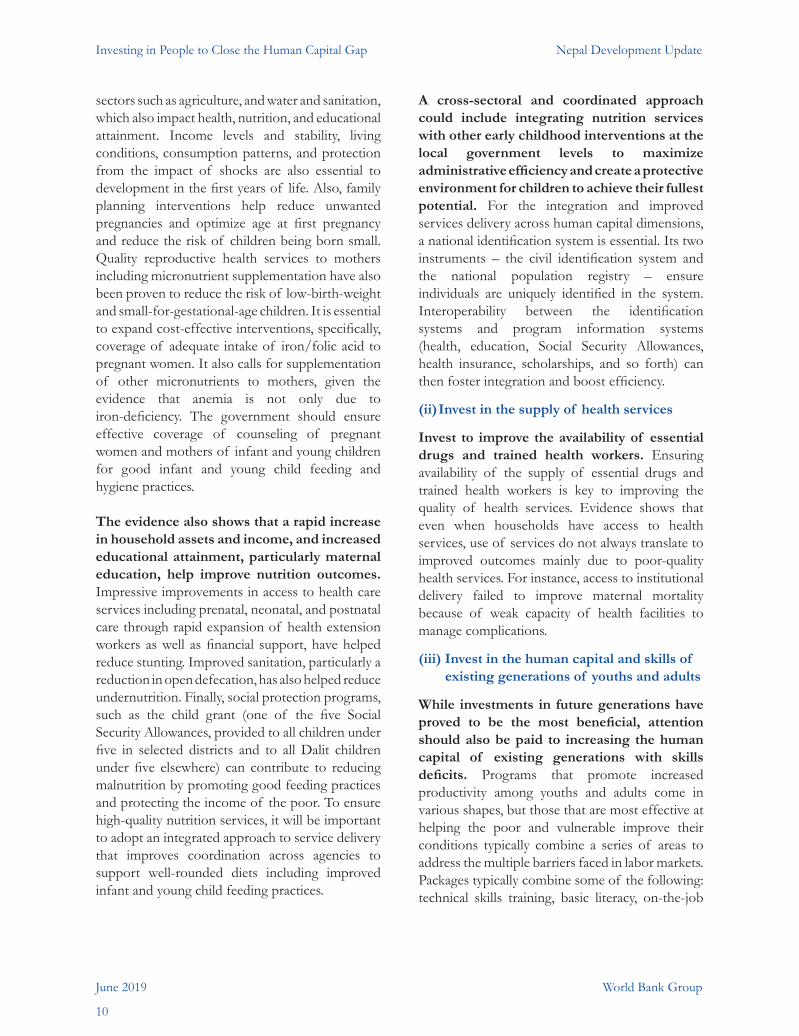
sectors such as agriculture, and water and sanitation, which also impact health, nutrition, and educational attainment. Income levels and stability, living conditions, consumption patterns, and protection from the impact of shocks are also essential to development in the first years of life. Also, family planning interventions help reduce unwanted pregnancies and optimize age at first pregnancy and reduce the risk of children being born small. Quality reproductive health services to mothers including micronutrient supplementation have also been proven to reduce the risk of low-birth-weight and small-for-gestational-age children. It is essential to expand cost-effective interventions, specifically, coverage of adequate intake of iron/folic acid to pregnant women. It also calls for supplementation of other micronutrients to mothers, given the evidence that anemia is not only due to iron-deficiency. The government should ensure effective coverage of counseling of pregnant women and mothers of infant and young children for good infant and young child feeding and hygiene practices.
The evidence also shows that a rapid increase in household assets and income, and increased educational attainment, particularly maternal education, help improve nutrition outcomes. Impressive improvements in access to health care services including prenatal, neonatal, and postnatal care through rapid expansion of health extension workers as well as financial support, have helped reduce stunting. Improved sanitation, particularly a reduction in open defecation, has also helped reduce undernutrition. Finally, social protection programs, such as the child grant (one of the five Social Security Allowances, provided to all children under five in selected districts and to all Dalit children under five elsewhere) can contribute to reducing malnutrition by promoting good feeding practices and protecting the income of the poor. To ensurehigh-quality nutrition services, it will be important to adopt an integrated approach to service delivery that improves coordination across agencies to support well-rounded diets including improved infant and young child feeding practices.
Invest to improve the availability of essential drugs and trained health workers. Ensuring availability of the supply of essential drugs and trained health workers is key to improving the quality of health services. Evidence shows that even when households have access to health services, use of services do not always translate to improved outcomes mainly due to poor-quality health services. For instance, access to institutional delivery failed to improve maternal mortality because of weak capacity of health facilities to manage complications.
While investments in future generations have proved to be the most beneficial, attention should also be paid to increasing the human capital of existing generations with skills deficits. Programs that promote increased productivity among youths and adults come in various shapes, but those that are most effective at helping the poor and vulnerable improve their conditions typically combine a series of areas to address the multiple barriers faced in labor markets. Packages typically combine some of the following: technical skills training, basic literacy, on-the-job
A cross-sectoral and coordinated approach could include integrating nutrition services with other early childhood interventions at the local government levels to maximize administrative efficiency and create a protective environment for children to achieve their fullest potential. For the integration and improved services delivery across human capital dimensions, a national identification system is essential. Its two instruments – the civil identification system and the national population registry – ensure individuals are uniquely identified in the system. Interoperability between the identification systems and program information systems (health, education, Social Security Allowances, health insurance, scholarships, and so forth) can then foster integration and boost efficiency.
10
Investing in People to Close the Human Capital Gap
June 2019
Nepal Development Update
World Bank Group

(iv) Adopt transparent performance management measures to incentivize service providers
(v) Strengthen coordination across the government and programs and ensure policy continuity
experience, development of agency and self-efficacy (socio-emotional skills), preparation of business plans, coaching for microentrepreneurs or self-employed, grants or loans, and access to financial services.
The newly announced Prime Minister’s Employment program is establishing Employment Service Centers in every local government and boosting the employability of youths. These Employment Service Centers have the potential to address inequities in access to information related to employment opportunities. Partnerships with the private sector to both identify skills areas that are needed and provide the skills training both directly and on-the-job need to be explored. With a large number of youths entering the labor market everyyear, it is also essential that the private sector generates new and better jobs. Government policies can be used to incentivize the private sector to develop labor-intensive jobs.
Transparent performance management and incentives could be used to improve the response of service providers at the facility and local government levels. For example, performance-based awards (to teachers, schools, or local governments) could be linked to student learning and time-on-task. The Government of Nepal, through its School Sector Development Program, is initiating processes and systems to track time teachers spend teaching and improve existing policies around teacher deployment. The school grants management system could be significantly improved by basing grant allocations on a robust funding formula, introducing a performance-based component, and building a system to verify compliance on funds eligibility and use. Similarly, health providers could be paid based on improving access to or quality of services either at the individual provider level or the health facility level.
There is extensive global experience on a wide variety of health provider payment systems that incentivize providers. In addition to payment systems that reward performance, the local government can adopt a social accountability system to manage the performance of providers. Local governments that are responsible for the provision of basic health services are better positioned to hold health service providers accountable. Local governments are more likely to be responsive to the demand of the community. This can be done through drawing on the experience of social accountability systems that were piloted in the health sector, to improve accountability of health service providers. Linked to this is the need to ensure there are sufficient and well-equipped facilities, and this will require having adequate levels of resources that are efficiently deployed.
Promote coordination within the government and among different levels of government. Promote strong coordination within the federal government and among the federal and local governments and with development partners for effective investment in human capital. Such coordination will ensure complementarity of investments, enable synergies among the various interventions exploited, and most importantly, allow for convergence of interventions in geographic areas and beneficiaries. Ethiopia is one example where the coordination within the government and between government and development partners around the government-led social protection program harnessed synergies. The program brought more than 10 development partners to establish a unified stream of technical assistance in support of the program’s implementation. The program is credited with lifting more than 1.4 million people out of poverty.
Ensure policy continuity over successive governments. Improving human capital outcomes
11
Investing in People to Close the Human Capital Gap
June 2019
Nepal Development Update
World Bank Group

by programs. Efficiency and effectiveness could be improved by improving targeting across programs that aim at supporting the poor, by establishing a social registry containing information on households, and used by all social programs focused on the poor to identify their beneficiaries. A shared social registry would ensure improved targeting, more efficient delivery of services, and greater coordination. Interoperability between the identification systems and program information systems (health, education, Social Security Allowances, health insurance, scholarships, and so forth) can then foster integration and boost efficiency.
requires sustained investments over a long period of time, a time horizon usually not well aligned with the political cycle. Often countries’ efforts fail to produce the desired human capital outcomes because of a lack of sustained effort over the political cycle. Key to sustaining efforts over successive governments is to build a national consensus on key national human capital priorities.
Harness the devolution of many basic service delivery functions to local-level governments to strengthen the coordination of programs and delivery systems. For most human development outcomes – nutrition, education, health, skills, and employment, among others – multisectoral interventions are the most effective. These combine elements focused on the supply side, ensuring services are available and at the quality required, with elements focused on the demand side, ensuring households have the resources and incentives to use the services. They also combine complementary interventions, which together can effectively move the needle for key outcomes. The fact that many basic services will be managed locally provides an opportunity to break sectoral silos and integrate interventions. In social protection, the government could assess the possibility of increased coordination across multiple programs and the opportunity to set objectives for programs that go beyond income support and include targets in terms of promoting the use of health or education services or adopting particular behaviors (such as good hygiene, or good cooking or feeding practices, which are essential to nutrition outcomes). For example, one such approach could be to establish national and local health assemblies, to coordinate decisionmaking and service delivery.
Finally, develop well-coordinated and integrateddelivery systems to improve impact and efficiency. For the integration and improved services delivery across human capital dimensions, a national identification system is essential. It comprises the national identification system and the civil registration system, which ensure individuals have a unique and robust identity that ensures their uniqueness and their authentication
Priority number 3: Promote households’ and services’ resilience to shocks
For a large proportion of the population, exposure to shocks can erase years of gains in human capital investment. Covariate shocks, which affect numerous households simultaneously, may be natural (drought, floods, earthquakes, landslides, fires), economic (price increases, a decline in remittances), or political. These shocks can have long-term effects on human capital, especially for children, through their effects on nutrition, education, and assets. Almost half the households in Nepal reported experiencing a shock in FY2014/15 and FY2015/16, and about 30 percent reported two or more shocks during the same period. Shocks affect poorer households more than richer households, thereby reinforcing inequalities.
The lack of poverty focus of Nepal’s existing social protection programs is compounded by the inflexibility of services in times of disasters. The 2015 earthquake and the recent floods have demonstrated that while the government was able to mobilize significant external aid, the existing programs could not be mobilized to provide disaster relief. International experience has shown that regular, adequate, and well targeted social protection programs can help build community and household resilience to shocks, and adaptive social protection programs can provide timely and efficient assistance to protect the well-being of households when shocks occur. The
12
Investing in People to Close the Human Capital Gap
June 2019
Nepal Development Update
World Bank Group

“adaptive” approach to social protection requires integration with disaster risk management and climate change adaptation strategies.
When societies face disasters, fragility, or conflict, education and health are often the areas that suffer most. This in turn prevents entire generations from achieving their potential. To prevent this, it is important to put in place measures that ensure continuous provision of educational opportunities and health services as early as possible during a crisis. One way to do this is to ensure school and health facility construction is done with disaster-resilient materials. This is especially important for Nepal, which is vulnerable to earthquakes and climate change.
(i) Establish adaptive social protection programming as part of the disaster risk management strategy
(ii) Ensure facilities and infrastructure are resilient to shocks
Recent institutional developments position the government to efficiently use social protection as one of its instruments to respond to shocks and disasters. The 2017 Disaster Risk Reduction and Management Act includes a provision to target response to vulnerable groups. It also provides for the establishment of a National Disaster Risk Reduction Management Authority to coordinate all disaster management actions. In addition, the Ministry of Home Affairs is now responsible for administering the largest social protection program (the Social Security Allowances Program), on top of its ongoing responsibility for planning and implementing all disaster-risk-management-related activities. This provides a unique window of opportunity to establish “adaptive” social protection programs as an integral part of the government’s disaster risk management strategy. This would require activities that: (a) establish mechanisms to use a social registry for the identification of households vulnerable to shocks that would need temporary support when shocks occur, (b) implement adaptive programs that build resilience and that can be scaled up for rapid response, (c) develop financing mechanisms to ensure timely response, and (d) establish institutional links between disaster risk
management and social protection at all three levels of government.
Building resilience in school and health systems involves ensuring facilities are resilient to shocks, putting in place measures to ensure continuous provision of services, ensuring disaster-resilient materials are used in construction, developing disaster management plans, securing safe environments, and building the capacity of health workers, school teachers, and local educational officers.
13
Investing in People to Close the Human Capital Gap
June 2019
Nepal Development Update
World Bank Group

Improving Competitiveness and Integration with Global MarketsTable ES1: Priority interventions to invest in people and scale-up human capital investments
Eliminate barriers for the poor in accessing human capital services
Increase the availability of services in poor and underserved geographic areas
Invest early in human capital and early childhood development, adopting a multisectoral approach
• Across all services design programs that incentivize investments in human capital (education and skills, health, nutrition) by households, while reducing out-of-pocket costs for the poor• Health. Increase public financing to ensure the availability of a standardized and basic health care service package• Reorient the current health insurance system to provide effective coverage of the poor and other vulnerable groups, starting with a systematic means of defining and identifying the poor and vulnerable, in coordination with the social protection system• Social protection. Design or expand social protection programs that incentivize investments in education, health, nutrition for poor households while reducing their out-of-pocket costs• Link design to information or incentives that promote behavioral changes that improve access to services and human capital outcomes• Establish a social registry that includes information on poor households, so that beneficiaries can be effectively identified and targeted
• Increase resources allocated to the local level to ensure sufficient and well-equipped facilities for provision of basic health, education, nutrition, labor, and social protection services by local governments • Assess local needs and revenue capacity to refine the basis for fiscal transfers• Provide capacity support to local governments to improve planning, budgeting, implementation, and monitoring of programs• Support local governments to develop own-revenue capacity • Define and establish a minimum standard of social protection
ECD/Education• Increase the quality and coverage of early childhood education (ECD) • Build capacity of local governments to monitor the quality of early ECD programs• Expand early reading programs that help ensure all children can read by age 10• Evaluate the child grant to strengthen household incentives for investing in human capital.Nutrition• Scale-up cost-effective essential nutrition interventions including iron/folic acid intake for pregnant women and promote the same for non-pregnant women/adolescent girls • Consider prenatal supplementation of other micronutrients for pregnant women and mothers of infant and young children • Increase counseling of pregnant women and mothers of infant and young children for good infant and young child feeding and hygiene practices • Integrate nutrition services with other interventions of early childhood development at the local government levels • Generate evidence of and scale-up effective nutrition-sensitive interventions
Support local government capacity to address geographic disparities
Reform Areas Selected Key Recommendations and Priority InterventionsPriority Number 1: Reduce inequity across gender, social, income, and geographic groups
Priority number 2: Improve the quality of education, health, nutrition, labor, and social protection services from early childhood to adulthood
14
Investing in People to Close the Human Capital Gap
June 2019
Nepal Development Update
World Bank Group

Invest in the systems necessary to deliver qualityhealth services
Invest in the human capital and skills of existing generations of youths and adults
Adopt transparent performance management measures to incentivize service providers
Health• Develop a national- and local-level Health Assembly as a means of coordination across different levels of the health system and to resolve problems• Invest in systems needed by all tiers of government for service delivery and informed decision making such as quality assurance systems for supplying drugs, qualification systems for public and private education and training, logistics management and information systems and framework agreements for centralized procurement for local purchasing• Develop testing and dissemination of tools for providing and measuring service quality such as simple decision charts, checklists, and citizen accountability and redressal mechanisms• Promote innovations to address shortages and motivate performance, particularly in harder-to-reach areas, such as strengthening community health workers, telemedicine, drone deliveries, and performance bonuses.
Labor market programs • Strengthen programs that address the multiple constraints faced by the poor and vulnerable in labor markets, especially for youths and women, including skills training, basic literacy, on-the-job experience, development of socio-emotional skills, business development, coaching for the self-employed, grants or loans, and/or access to financial services • Implement the Prime Minister’s employment program, which is establishing an Employment Service Center in every local government and boosting youth employability
Education• Update curriculums and develop an exam system that develops conceptual understanding and cognitive skills, instead of rote learning • Implement a performance-based approach that links teacher rewards to student learning • Adopt performance-based approaches at the school facility and local government levels, to promote quality and equity improvements through the School Sector Development Plan • Strengthen the formula for the school grants management system by introducing a performance-based component, and building a system to verify compliance on funds eligibility and utilization• Implement capacity building and conditional grants to local governments tied to open data or information on conditional grants released to local governments and schools, to strengthen accountability.Health• Draw on past experience with social accountability systems piloted in Nepal’s health sector to improve the accountability of health service providers • Clarify services to be provided where and service standards of the facility• Help subnational governments align with agreed national priorities with development of dashboards and monitoring tools for delivery of specified services• Scale-up and improve performance-based contracting of national hospitals using block grants received as a potential model for Provinces.
15
Investing in People to Close the Human Capital Gap
June 2019
Nepal Development Update
World Bank Group

Strengthen administrative efficiency in health, education, nutrition, and social protection• Build local capacity to plan, budget, and implement in the key sectors • Strength administrative and other data to improve monitoring and evaluation to inform the design of performance-based incentive mechanisms.
Strengthen coordination across government and programs and ensure policy continuity
Establish adaptive social protection programming as part of the disaster risk management strategy
Ensure facilities and infrastructure are resilient to shocks
Across all services • Use conditional grants to strengthen national standards and ensure consistency across regions• Develop simple monitoring tools to assess progress and provide feedback to implementation• Build a national consensus on key national human capital priorities to ensure policy continuity over successive governmentsSocial Protection• Develop a national identification system comprising the national population registry and the civil registry system, to ensure individuals can be uniquely identified• Ensure interoperability between the national identification systems and program information systems (health, education, social security, health insurance, scholarships, etc.) • Develop a social registry to be used by programs in identifying the poor and vulnerable • Increase coordination across programs and set objectives that go beyond income support to include targets to promote use of health or education services or particular behaviors • Establish a social registry to be used by all programs to improve targeting. • Develop a national social protection strategy, building on the National Social Protection Framework, that clarifies the roles of the three levels of government.
Social protection • Establish mechanisms for using the social registry to identify vulnerable households that need temporary support when shocks occur• Build adaptive programs that can be scaled up for rapid response• Develop financing mechanisms to ensure a timely response• Establish institutional links between disaster risk management and social protection at all three levels of governments. • Invest in disease surveillance and disaster preparedness in case of mass casualty events.
Health, education, social protection• Ensure disaster-resilient materials are used in constructing service facilities • Adopt measures to ensure continuous provision of education, health and social protection services and labor market interventions, as early as possible during a crisis• Build resilience by developing disaster management plans, securing safe environments, and building the capacity of health workers, school teachers, local educational officers, local social protection staff, and all local government workers.
Priority Number 3: Promote households’ and services’ resilience to shocks
16
Investing in People to Close the Human Capital Gap
June 2019
Nepal Development Update
World Bank Group

Real Sector
A. Recent Economic Developments............................................................................................................................................................................................................................................................................................................................................................
............................................................................................................................................................................................................................................................................................................................................................
Real gross domestic product (GDP) is estimated to grow by 7.1 percent in FY2019, driven mainly by the service and agriculture sectors. This will be the third year in a row that the country has grown by more than 6 percent. Output expansion in the current year was driven by good monsoons, a surge in private sector investment, and increased consumption fueled by remittances.
On the demand side, private investment and consumption were the main drivers of growth (Figure 1). Both contributed 4.9 percentage points each to overall GDP growth in FY2019. Private consumption grew on the back of higher remittances (discussed below), while private investment expanded because of the regular
supply of electricity9 and political stability. Public investment, however, contracted, reducing growth by 0.5 percentage points, as post-earthquake housing reconstruction slowed10 (Figure 2) and national pride projects like Melamchi water supply and Upper Tamakoshi hydroelectric got delayed.
On the supply side, growth was driven by the service sector (a 3.9-percentage-point contribution to GDP growth) and the agriculture sector (a 1.6-percentage-point contribution) (Figure 3). The service sector grew by 7.5 percent (y/y) in FY2019, boosted by higher remittance inflows and an uptick in tourist arrivals. Remittance inflows supported the expansion of retail trade (10.9 percent, y/y) and real estate (6.1 percent, y/y) whereas higher tourist arrivals
9 The 22 megawatts from the Bagmati Hydropower project have been added to the national grid, and the 60 megawatts from the Upper Trishuli 3A will be added in FY2019. 10 There has also been a growing concern that post-earthquake housing reconstruction is contributing to the increase in household debt as households increasingly borrow from informal sources (family, relatives, neighbors, and cooperatives) at high interest rates to construct their houses. Increased household borrowing from informal sources is due to insufficient government housing grants (NPR 300,000) and the inability of households to borrow from formal sources (banks and financial institutions) (see United Nations [2018] for details). In addition, there is a significant variation in the cost of housing reconstruction across earthquake-affected districts. This is why even after four years, only around 23.8 percent of earthquake survivors in the Kathmandu Valley have completed reconstruction works compared with 63.1 percent for all the other 11 earthquake-affected districts.
17
Investing in People to Close the Human Capital Gap
June 2019
Nepal Development Update
World Bank Group

Figure 3. Agriculture and services drove growth…
Sources: Central Bureau of Statistics and World Bank staff calculations.
Source: MoAD and World Bank staff calculations.
Figure 4. …as production of paddy, maize, andwheat crops reached historic highs.
Figure 1. Private investment is estimated to pick up in FY2019 while public investment contracts, as
Figure 2. … new post-earthquake housing reconstruction is tapering off.
Sources: CBS and World Bank staff calculationsNote: Figures for FY2019 are preliminary estimates.
Sources: MoUD and World Bank staff calculations.
Inflation
Low food prices helped keep inflation in check throughout FY2019 (Figure 5). In the first eight months of FY2019, inflation averaged 4.1 percent (y/y). This rate was lower than the revised monetary policy target of 5.5 percent.
Owing to higher housing and utility prices, nonfood price inflation averaged 5.8 percent (y/y), and contributed to more than one-third of headline inflation. Food price inflation remained low at 2 percent (y/y), on average, over the first
boosted the transport (5.9 percent, y/y) and hotels and restaurant (8.3 percent, y/y) subsectors. The agriculture sector expanded by 5 percent (y/y) in FY2019, well above its 30-year average of 3.1 percent. Good monsoons together with increased commercialization of agriculture, the availability of fertilizers and seeds, and irrigation
facilities helped raise production of rice paddy by 8.9 percent to the historic high of 5.6 million tons in FY2019 (Figure 4). In addition, maize and wheat production picked up by 3.5 percent and 4.5 percent, respectively. These three crops together constitute more than 30 percent of agricultural GDP.
18
Investing in People to Close the Human Capital Gap
June 2019
Nepal Development Update
World Bank Group

Monetary Policy and the Financial Sector
Figure 5. Inflation was kept low due to low food prices…
Figure 6. …and closely follows India’s inflation
Sources: NRB and World Bank staff calculations. Sources: NRB, Ministry of Statistics and Program Implementation of India, and World Bank staff calculations.
eight months of FY2019, as a result of strong growth in agriculture. These trends coupled with
the peg to the Indian rupee has helped keep inflation subdued in FY2019 (Figure 6).
Money supply (M2) growth was slightly above the FY2019 monetary policy target (Figure 7). M2 grew by 18.7 percent (y/y) in March 2019 and remained above the FY2019 target of 18 percent. Private sector credit was the key driver of M2
Private sector credit growth remained high in FY2019. It reduced marginally to 22.5 percent (y/y) in March 2019, after peaking at 25.2 percent in October 2018 (Figure 9). Most of the credit is directed to working capital, overdraft, and real
growth, contributing 18.3 percentage points. Net claims on the government contributed another 5.5 percentage points as government deposits declined (Figure 8).
Figure 7. Money supply growth picked up as private sector credit growth increased…
Figure 8. …and government deposits shrank
Sources: NRB and World Bank staff calculations. Sources: NRB and World Bank staff calculations.
estate (including residential), which together account for almost 80 percent of the total credit of banks and financial institutions (BFIs, Figure 11). While credit growth remains high, the slowdown from October last year is driven largely by lower
19
Investing in People to Close the Human Capital Gap
June 2019
Nepal Development Update
World Bank Group

contribution to growth of lending to agriculture (8.3 percent), services (7.1 percent) and households(consumption loans11, 45.8 percent). This was because of the adoption of macroprudential measures by the Nepal Rastra Bank (NRB). Nevertheless, more lending continues to be channeled to priority sectors12 (agriculture, energy,
and tourism) to meet the FY2019 monetary policy requirement of extending at least 25 percent of total credit to these sectors. In addition, the Commercial Agriculture and Livestock Credit Program of the Government of Nepal has also contributed to the surge in agricultural growth.
Figure 9. Credit growth remains high… Figure 10. … and deposit growth also increased
Sources: NRB and World Bank staff calculations. Sources: NRB and World Bank staff calculations.
Figure 11. Credit continued to be directed to working capital, overdraft, and real estate activities
Figure 12. Exposure to the real estate sector continues to increase
Sources: NRB and World Bank staff calculations. Sources: NRB and World Bank staff calculations.
11 The “Others” sector (Figure 9) accounts for 17.3 percent of total credit in March 2019 and includes personal consumption related to hire purchase and others. The NRB does not disaggregate the “others” sector. 12 According to a directive issued by the NRB on March 21, 2019, BFIs that failed to meet the minimum requirements of 25 percent will be penalized on the deficit amount by applying the maximum lending rate of that institution.
20
Investing in People to Close the Human Capital Gap
June 2019
Nepal Development Update
World Bank Group

13 To attract individual deposits, some BFIs have been offering prizes including gold and silver coins on deposits, accepting fixed deposits with a maturity of less than three months, and allowing depositors to withdraw fixed deposits before maturity. The NRB issued two circulars, one on May 9, 2019, and one on May 12, 2019, barring banks and financial institutions from engaging in such activities.14 https://thehimalayantimes.com/business/bankers-to-bring-down-deposit-rate/15 As per the NRB, the interest rate on call deposits cannot be greater than the interest rate on savings deposits.16 Under the new provision, the base rate is calculated as follows: cost of fund + mandatory cash reserve ratio + statutory liquidity ratio + operating cost. Commercial banks are not allowed to lend below the base rate.
To reduce lending to the real estate sector and on overdraft facilities, the NRB adopted macroprudential measures in July 2018. The maximum limit for overdrafts was set to NPR 5 million, from the previous level of NPR 7.5 million, which brought down the share of overdrafts in total credit to 16.3 percent in March 2019 (compared with 17.7 percent in April 2018). The NRB also reduced the loan-to-value threshold from 50 percent to 40 percent for real estate loans and from 60 percent to 50 percent for residential loans disbursed in the Kathmandu Valley. As a result, the share of BFI credit to real estate (including residential) decreased from 15.4 percent in December 2016 to 13.3 percent in March 2019, both below the regulatory requirement of 25 percent. Despite these macroprudential actions, as of March 2019, nearly 64 percent of the loans were backed by real estate collateral, which is a source of vulnerability for the financial sector, should there be a real-estate bubble (Figure 11). To mitigate this risk, close monitoring of housing prices will be needed which requires developing a real-estate property price index. The FY2019 monetary policy made provisions for a survey to construct a real-estate (housing) price index but progress has been slow.
Deposits grew by more than 20 percent in March 2019 but lagged credit growth (Figure 10). The growth in deposits was driven by the provision allowing local governments to deposit 50 percent of their fiscal transfers in local commercial banks. It was also supported by higher individual deposits, underpinned by remittance inflows.13
Commercial banks kept deposit rates high to attract more funds. During FY2019, the average deposit rate remained above 6.3 percent and peaked at 6.7 percent in January and February 2019
(Figure 14). To reduce interest rates, in October 2018, the Nepal Bankers’ Association, the umbrella organization of all commercial banks in Nepal, made an informal gentlemen’s agreement to cap interest rates on fixed deposits at 10 percent for institutional depositors and 10.5 percent for individuals14, and cap interest rates on savings at 7 percent and call deposits15 at 5 to 7 percent. This was done to enable banks to charge lower interest rates on loans. The cap on individual fixed deposits however did not hold. The agreement was broken by banks that were newly entering the market in Nepal to help them attract depositors, especially from the established banks.
Higher deposit rates led to higher lending rates, despite measures introduced by NRB to keep interest rates in check. These included the following: First, NRB issued a directive requiring commercial banks to bring the interest rate spread from the existing 5 percent to 4.75 percent by mid-April 2019 and to 4.5 percent by mid-July 2019. Second, commercial banks were required to exclude the return on assets (0.75 percent) in calculating the base rate16. Despite these corrective steps, industrialists (especially of the eastern region in Nepal) started protesting and demanding that interest rates on commercial loans be reduced to 9 percent. The NRB introduced further changes through their FY2019 mid-term review of monetary policy to reduce the interest rate spread. These include: (i) revising the calculation of interest rate spreads to include pure loans and exclude investments made on government securities; (ii) fixing the maximum interest rate on loans disbursed under the general refinancing facility at 8 percent (from the previous 9 percent) and loans for the export refinancing facility at 3 percent (from the previous 4.5 percent); and (iii) fixing the premium on the base rate for loans disbursed to priority sectors.
21
Investing in People to Close the Human Capital Gap
June 2019
Nepal Development Update
World Bank Group

The higher levels of credit relative to deposits caused the credit to core capital plus deposit (CCD) ratio to breach the 80 percent regulatory limit in December 2018, for the first time since 2012 (Figure 13). In response, the NRB took measures to release more loanable funds. These include (i) allowing BFIs to deduct concessional loans17 (that were floated under the central bank’s working procedures on interest
17 The concessional loans are provided to the following loan categories as per the budget of FY2019: loans to youth with higher education to start their own business; project loans for returnee migrants; project loans for women; business loans to the Dalit community; education loans to economically deprived, marginalized, and targeted communities for pursuing higher studies and for technical and vocational education; loans for the construction of private housing of earthquake victims; and commercial agriculture and livestock loans. 18 The IRC was introduced in the monetary policy of FY2017. The upper and lower bounds of the IRC are defined by the standing liquidity facility (SLF) rate and the two-week deposit collection rate. Initially, the SLF was fixed at 7 percent, while the deposit collection rate was set to a weighted average interbank rate of the market prior to two working days minus 10 basis points. The monetary policy of FY2018, however, set the deposit collection rate to 3 percent while keeping the SLF at the previous rate of 7 percent.
subsidies) from credit when computing the CCD ratio; and (ii) allowing BFIs to include loans obtained through the interbank window as deposits when calculating the CCD ratio. Although BFIs with CCD ratios that exceed the 80 percent regulatory limit are penalized on the excess loan amount at the bank rate (6.5 percent), BFIs still have an incentive to breach the limit if their lending rates exceed the bank rate.
Figure 13. The CCD ratio exceeded its regulatory limit in December 2018 for the first time since April 2012...
Figure 14. …contributing to higher deposit andlending rates
Sources: NRB and World Bank staff calculations. Sources: NRB and World Bank staff calculations.
Monetary policy remained accommodative to support the government’s growth targets. For most transactions (68 percent during the first eight months of FY2019), the interbank rate was below the lower bound of the interest rate corridor (IRC), indicating that the open market operations of the NRB were not able to “mop up” excess liquidity from the market. The interbank interest rate remained within the IRC only during February and March 2019 (Figure 15). This accommodative monetary policy has increased the interest rate gap with India (where the interbank rate was mostly above 6.0 percent in the first eight months of
FY2019) and this has put pressure on the exchange rate peg.
Financial inclusion in Nepal has improved significantly but remains below the regional level. According to the World Bank Global Financial Index database, the percent of Nepalese adults (more than 15 years old) with a bank account increased from 25 percent to 45 percent between 2011 and 2017. However, this is still lower than the average of 70 percent for the South Asia region. The World Bank Global Financial Index database also shows that 35 percent of Nepalese
22
Investing in People to Close the Human Capital Gap
June 2019
Nepal Development Update
World Bank Group

19 Effective April 14, 2019, the NEPSE made a permanent account number compulsory for traders conducting daily transactions above NPR 500,000 but optional for those conducting daily transaction below NPR 500,000. The requirement has created disincentives for traders with daily transactions above NPR 500,000 due to their concerns about transparency in reporting income and the implications for taxes they may have to pay.
Figure 15. The interbank rate remained within the IRC corridor only in February and March 2019
Figure 16. The NEPSE reached a three-year low
Sources: NRB and World Bank staff calculations. Sources: NRB, NEPSE, and World Bank staff calculations.
adults without a bank account in 2017 attributed the distance to financial institutions as the primary reason for not having an account. The NRB has been focusing on reducing distance barriers by encouraging the BFIs to open branches in rural areas. As a result, BFIs now have branches in 713 out of the 753 local governments. In April 2019, the NRB introduced more measures to expand financial inclusion. This included a
simplification of the paperwork required for opening new bank accounts. In particular, individuals who are likely to have financial transactions under NPR 100,000 per year are not required to fill in the know-your-customer form when opening a new account. In addition, BFIs are required to deposit NPR 100 as an incentive for new customers.
Stock Market
Despite strong growth, the Nepal Stock Exchange (NEPSE) index contracted by 18.3 percent in February 2019 to a three-year low. The index fell to 1,155 points in March 2019 (Figure 16) on account of: (i) ongoing glitches in the newly introduced online system which has hampered trading to some degree; (ii) diversion of funds to fixed deposits because of higher returns on them; and (iii) the decline in overdrafts. In addition, in April 2019, the government introduced a policy requiring all investors in the secondary market to have a permanent account number whichcould lower the lending against shares.19 The NRB
also undertook measures to stem the decline in theNEPSE which included the following: (i) increasing the loan-to-value ratio to 65 percent from 50 percent (valuation being done as the lower of either the average 180 days price or the prevailing market price of the stock); (ii) reducing the weight assigned to the risk for such a loan to 100 percent from 150 percent; (iii) increasing the loan ceiling, as a share of core capital, to 40 percent from 25 percent; and (iv) provision of margin loans through stockbrokers. However, secondary market investors did not respond favorably to these measures.
23
Investing in People to Close the Human Capital Gap
June 2019
Nepal Development Update
World Bank Group

External Sector
The growth in exports recovered during FY2019, driven by industrial supplies and food and beverages (Figures 17 and 19). The average growth in exports during the first eight months of FY2019 was 7.5 percent (y/y) with increased sales to India and China (Figure 18). Industrial supplies, and food and beverages constitute more than three-fourths of total exports. While exports of food and beverages have recovered since the trade blockade in 2015, industrial goods exports have not. To incentivize exports, the government introduced the following
measures in FY2019: a cash incentive scheme for exporters; measures to improve the quality of products identified in the Nepal Trade Integration Strategy (NTIS), and lower non-tariff barriers with many countries including India. However, these efforts have not had much impact as labor costs have increased making the NTIS listed goods like footwear expensive relative to similar goods from China. In addition, production volumes are low in Nepal and promotional activities on NTIS listed goods are limited.
Figure 17. Exports growth have recovered…. Figure 18. …as exports to India and China increased
Sources: NRB, DoC, and World Bank staff calculations. Sources: NRB, DoC, and World Bank staff calculations.
Figure 19. Industrial supplies and food and beverages drove export growth
Figure 20. However, the growth rate of imports declined
Sources: DoC and World Bank staff calculations. Sources: NRB, DoC, and World Bank staff calculations.
24
Investing in People to Close the Human Capital Gap
June 2019
Nepal Development Update
World Bank Group

The growth rate of imports declined in FY2019 but remained strong (Figure 20). During the first eight months of FY2019, the average growth of imports was 18 percent (y/y), which was lower than the 24 percent seen in FY2018. Nearly 78 percent of the imports are from India, and China (Figure 21). There was a deceleration in the growth of imports of industrial goods and oil products as reconstruction efforts tapered off and public investments were delayed (Figures 22 and 23). However, imports of transport equipment grew by 57 percent (y/y) in the first eight months of FY2019 and were driven by the purchase of two Airbuses by Nepal Airlines Corporation, to cater to international tourists traveling to Nepal.
Figure 21. The growth of imports from India, China, and other countries contracted
Sources: NRB, DoC, and World Bank staff calculations
Figure 22. The growth of import of industrial goods slowed but that of transport equipment increased
Figure 23. Total oil imports growth also declined marginally
Sources: DoC and World Bank staff calculations. Sources: DoC and World Bank staff calculations.
Despite the lower outflow of migrant workers, remittance growth remained strong in FY2019. During the first eight months of FY2019, an average of 18,915 Nepalese workers per month departed for employment opportunities abroad (Figure 24). This is the lowest monthly average outflow of migrant workers since October 2009. Among the many reasons for this decline is the ban imposed by the Nepalese government on migration to Malaysia, which is the top destination for Nepalese migrants. The ban was imposed because outsourcing agencies were overcharging Malaysia-bound workers for visa processing and health and security screening. Although a memorandum of understanding was signed between the two countries in October 2018 to
resume outmigration to Malaysia, the Government of Nepal has not lifted the ban, as some agencies continue to overcharge. To provide increased employment opportunities at home, the government introduced the Commercial Agriculture and Livestock Credit Program which provides subsidized loans (at 5 percent interest rate) to its citizens. Despite the decline in the number of outmigrants, remittances grew by 14.4 percent during the first eight months of FY2019. This was because of increased use of formal channels to remit money, a depreciation of the Nepalese rupee and outmigration to destinations like Japan and South Korea where wages are higher (Figure 25).
25
Investing in People to Close the Human Capital Gap
June 2019
Nepal Development Update
World Bank Group

Figure 24. Migrant outflows continue to decline… Figure 25. …but remittances remain well abovethe five-year monthly average
Sources: DoFE and World Bank staff calculations. Sources: NRB and World Bank staff calculations.
Although remittances were higher, the current account deficit remained elevated because of a persistent trade deficit. The current account deficit increased to US$1.7 billion in the first eight months of FY2019, up from US$1.5 billion in the corresponding period of FY2018. The increase in remittances was insufficient to cover the large
trade deficit. Foreign exchange reserves fell to US$9.6 billion in March 2019 as the higher external deficit was partly financed by drawing down international reserves. However, reserves remain comfortable and cover 7.9 months of imports (Figure 27).
Figure 26. The current account deficit widened as the trade deficit remains high...
Figure 27. …but foreign exchange reserves remain comfortable
Sources: NRB and World Bank staff calculations. Sources: NRB and World Bank staff calculations.
Fiscal Sector
Nepal recently transitioned to a federal structure. Under the 2015 Constitution, Nepal transitioned to a federal structure with the creation of 7 provinces and 753 local governments, in addition to the central government. Under this new arrangement, the provision of basic services (including education, health, local transportation,
and water and sanitation) has been assigned to the local governments. Since most of revenue raising powers are still with the central government, the provincial and local governments rely on fiscal transfers from the center. In addition, local governments and provinces also receive revenues in line with the provisions outlined in the
26
Investing in People to Close the Human Capital Gap
June 2019
Nepal Development Update
World Bank Group

Intergovernmental Fiscal Arrangement Act 2017. Tax revenues are now shared among the central, provincial, and local governments in the ratio of 70:15:15 while royalties are shared in the ratio of 50:25:25. Taxes on property, and rental income, and vehicle registration fees are collected and retained by local governments. FY2018 was the first year of making fiscal transfers and during FY2019, local governments established their Consolidated Funds as mandated in the Local Government Operations Act and adopted their local budget legislation governing the implementation of their budget.
Under the new federal arrangements, consolidated government revenues grew by 17.5 percent (y/y) in the first eight months of
FY2019. This growth was led by tax revenues, especially, VAT, customs, income and excise taxes, all of which grew by more than 20 percent (Figure 28). Various tax enhancement measures were implemented this year which included: (i) rationalization of VAT related refunds and exemptions, (ii) wider tax base for property taxes, (iii) an increased tax on tobacco and vehicles (iv) revision of import reference prices based on market signals, and (v) higher taxes on luxury items and high-earning households. In addition, the growth in total nontax revenues was led by 13 percent service charges levied on telecommunication services such as internet and voice call. However, own-revenue generation at the local and provincial levels is likely to face constraints in the short to medium term from limited capacity.
Figure 28. Government revenue picked up due to significant growth in value added, income, and excise taxes, and in custom duties
Figure 29. Government expenditure declined driven by the contraction in capital expenditure
Sources: NRB and World Bank staff calculations. Sources: FCGO and World Bank staff calculations.
The growth in consolidated expenditures was however negligible as capital spending by the central government remained weak and subnational governments were unable to spend much because of capacity constraints and lack of staff. Consolidated spending increased marginally by 0.3 percent (y/y) in the first eight months of FY2019 (Figure 29). Recurrent expenditure grew by 1.3 percent (y/y) as delays in the devolution of staff to provincial and local levels remained constrained. In addition, the implementation capacity at the subnational levels is also limited, which impacted overall spending at the subnational levels. Capital expenditure, in
contrast, contracted in the first eight months of FY2019 as reconstruction efforts tapered off and national pride projects were delayed further. The capital spending of provincial and local governmentswas also low.
The underspending of the budget in the provinces has been large. In the first eight months of FY2019, only 7.1 percent of the capital budget, 16 percent of the recurrent budget, and 10.8 percent of the total budget of provincial governments was spent (Figure 31). This was primarily because of a lack of staff in the Provinces. In terms of spending, Province 3 had
27
Investing in People to Close the Human Capital Gap
June 2019
Nepal Development Update
World Bank Group

the highest recurrent spending; and 5, had the highest capital spending (as a share of the budget). Provincial governments have recently adopted measures to strengthen the Medium Term Expenditure Framework as well as public investment, public-private partnerships, and procurement. These measures are likely to help improve spending efficiency over the medium term. However, there will be an ongoing need for capacity building.
As in previous years, capital spending is likely to pick up in the last quarter of the fiscal year. Procurement processes and the tendency to delay initiating contracts to the latter part of the fiscal year, have led to underspending over the years. In addition, limited progress in transferring staff to
With strong revenue performance and a marginal increase in spending, the fiscal deficit is likely to narrow in FY2019. Although capital spending typically picks up in the last quarter of the year, the fiscal deficit is likely to remain lower than last year and is estimated at 3.4
the provincial and local levels has also exacerbated the situation. In the first eight months of FY2019, only 28.8 percent of the capital budget was spent, 48.3 percent of the recurrent budget was spent, and 43 percent of the total budget was spent (Figure 30). Although underspending was expected to improve with the timely presentation of the budget and political stability, this has not been the case. In contrast, presenting an overambitious budget that is revised down during the midterm review has become the new norm. For example, the Ministry of Finance in its FY2019 midterm budget has revised its expenditure estimate to 91.7 percent of the original FY2019 budget.
Figure 30. Underspending of capital expenditurecontinues at the federal level…
Figure 31…and at the provincial level
Sources: FCGO and World Bank staff calculations. Sources: FCGO and World Bank staff calculations.
percent. This calls for comprehensive efforts aimed at building capacity at the provincial and local levels to help achieve efficiency and effectiveness in spending and to raise higher local revenues.
28
Investing in People to Close the Human Capital Gap
June 2019
Nepal Development Update
World Bank Group

Outlook
B. Outlook, Risks and Challenges............................................................................................................................................................................................................................................................................................................................................................
............................................................................................................................................................................................................................................................................................................................................................
GDP growth is projected to average 6.5 percent over the medium term. On the supply side, growth will be driven by services, underpinned by steady remittance inflows as new international job markets open (for example, Japan), and existing markets resume (especially in Malaysia and South Korea, Qatar, Saudi Arabia). In addition, high tourist arrivals expected under the Visit Nepal 2020 program, the completion of the second international airport, and the construction of big hotels will also support the service sector. Assuming a normal monsoon with no climate-related disasters such as drought, floods, and landslides, agricultural growth is projected to average 4.4 percent over the forecast period, supported by programs to promote improved inputs, storage facilities, irrigation, and agribusiness value chains.
20 National pride projects like Melamchi water supply and Upper Tamakoshi hydroelectric are expected to be completed by FY2020, while Pokhara International Airport is expected to be completed by FY2021. 21 One example is the cement industry Huasin Cement Narayani that is expected to be constructed by January 2020 and has the investments amounting to NPR 15 billion. The government has prioritized cement as one of the major exportable goods in its policies and programs for FY2020. 22 Nepal Infrastructure Bank came into operation in March 2019.
On the demand side, growth will continue to be driven by private investment and consumption. Private consumption will be supported by remittance inflows. The gradual transition from a consumption to an investment-based growth model will continue in the long term20 with an emphasis on engaging the private sector and raising the low levels of foreign direct investment.21 The establishment of the Nepal Infrastructure Bank in March 2019,22 signing of the Protocol on Implementing Agreement on Transit and Transport with China on April 28, 2019, and the enactment of three key laws in 2019 (the Foreign Investment and Technology Transfer Act, the Public-Private Partnership and Investment Act, and the Special Economic Zone Act [First Amendment]) are first steps in this regard. The infrastructure bank, mostly privately held, will help finance large and critical infrastructure projects.
29
Investing in People to Close the Human Capital Gap
June 2019
Nepal Development Update
World Bank Group

The Transit and Transport Agreement will allow Nepal to use four Chinese seaports (Tianjin, Shenzhen, Lianyungang, and Zhanjiang) and three land ports (Lanzhou, Lhasa, and Shigatse) for third-country imports and six dedicated transit points (between Nepal and China) for exports. At present, the trade between Nepal and China occurs through only two Nepalese entry points -Rasuwagadhi and Tatopani. The Foreign Investment and Technology Transfer Act provides a one-stop service23 and equal treatment of foreign investors. Equal treatment allows foreign investors to avail themselves of benefits received by domestic investors such as tax concessions and other incentives. The Public-Private Partnership and Investment Act allows the Investment Board of Nepal to approve and provide full support to the implementation of any investment that is more than NPR 6 billion or a hydropower project of over 200 -megawatt capacity. This will help reduce transaction costs for large investors. The Special Economic Zone Act (First Amendment) allows industries within the special economic zones (SEZ) to sell their entire production in the domestic market in the first year and export 60 percent of their production from the second year onward. This contrasts with the earlier provision which required mandatory exports of 75 percent from the first year. At present there is only one special economic zone in Bhairahawa but 13 more are being constructed.
Inflation is expected to pick up slightly but will remain below 5 percent during the forecast period. With growth forecasted to remain above 6 percent over the medium-term, inflation is likely to increase from the current level. However, continued underspending of the budget,
23 In line with the Industrial Enterprises Act 2016, the government established a one-stop service center through the official gazette on April 29, 2019. The center has started providing one-stop facility, for both domestic and foreign investors with capital between NPR100 million to NPR 5 billion from May 15, 2019. 24 The completion of the 456-megawatt capacity Upper Tamakoshi hydropower project in December 2019 will generate surplus energy in the wet season which will be exported to India under the energy banking mechanism. 25 The completion of the cross-border Nepal-India oil pipeline project by the end of FY2019 is also expected to save the import cost of petroleum products by more than NPR 2 billion besides ensuring the regular supply of these products to Nepal.
stable agricultural production, regular supply of electricity, and low inflation in India will help subdue inflationary pressures.
The current account deficit, which grew in FY2018, is expected to narrow over the medium term. Most of the growth in the external deficit in FY2018 was driven by strong import demand (from federalism related costs, reconstruction post-earthquake, and general construction) and higher oil prices. However, Nepal continues to have adequate reserves and its external debt is low. Over the medium term, as the one-time spending on federalism related infrastructure and post-earthquake reconstruction taper down, the growth in imports will slow. Investments are likely to remain high and keep the current account in deficit. Electricity exports could pick up in the near term as Nepal is expected to double its electricity production by FY2020.24 This will also help reduce the import bill and expand industrial capacity through the regular supply of electricity25. Broader growth in overall exports will happen in the longer term as structural reforms start yielding results. Remittances as a share of GDP are expected to stabilize at 27 percent over the medium-term as new international job markets open up and remittances from formal channels increase. By FY2021, the current account deficit is expected to moderate to 5.5 percent of GDP and international reserves are likely to cover around 5 months of imports. The external gap will be financed primarily by long term borrowing and a drawdown of international reserves. There are negligible portfolio investments in the country and despite some expected increase in foreign direct investment, it will continue to remain low.
30
Investing in People to Close the Human Capital Gap
June 2019
Nepal Development Update
World Bank Group

Table 1. Macroeconomic Projections of Selected Key Indicators
Source: MoF, NRB, and CBS for history and estimates. World Bank staff for forecasts. Notes: e = estimate, f = forecast. Inflation, current account balance, fiscal balance, debt, and primary balance are forecasts for 2019
Fiscal Balance (% of GDP)Debt (% of GDP)Primary Balance (% of GDP)
Real GDP growth, at constant market prices 0.6-0.7-0.4
-12.3-13.7
2.8
0.20.2
-6.42.3
9.9
6.2
1.427.9
1.8
20168.22.6
10.544.311.327.2
7.75.2
12.48.1
4.4
-0.4
-3.126.3-2.7
20176.72.5
13.418.17.8
19.0
6.32.89.67.6
4.2
-8.1
-5.730.3-4.9
20187.16.58.3
14.37.9
17.9
6.85.08.17.5
5.0
-8.0
-3.430.0-2.4
2019e6.45.2
11.816.311.011.5
6.44.48.07.2
4.7
-6.6
-3.631.1-2.8
2020f6.54.8
13.814.411.010.7
6.54.58.87.0
5.0
-5.5
-5.132.7-4.3
2021f
Real GDP growth, at constant factor prices
Inflation (Consumer Price Index)Current Account Balance (% of GDP)
Private ConsumptionGovernment ConsumptionGross Fixed Capital InvestmentExports, Goods and ServicesImport, Goods and Services
AgricultureIndustryServices
The fiscal deficit is projected to average 4 percent of GDP over the next few years. The challenges related to the transition to federalism have resulted in lower-than-budgeted spending in FY2019. As a result, the fiscal deficit is estimated to decline to 3.4 percent of GDP. In the subsequent years, as the provincial and local governments become fully functional, the fiscal deficit is projected to increase, rising to 5.1 percent of GDP in FY2021. The government has set up a commission to review and suggest measures to improve spending efficiency. In addition, reforms to broaden the tax base will help increase revenues to 30 percent of GDP by FY2021. Non-tax revenues are also expected to increase because of royalties from new hydropower projects. At the subnational levels, efforts are being focused on establishing the legal and institutional framework to support enhanced own-tax revenue collection. The fiscal deficit will be financed by a mix of domestic and international borrowing. Therefore, a further rise in total public debt is projected, to 32.7 percent of GDP by FY2021. Despite the increase, Nepal continues to remain at low risk of debt distress. Debt sustainability stress tests show a vulnerability to growth shocks and natural disasters and underscore the importance of implementing sound macroeconomic policies including structural reforms in support of
31
Investing in People to Close the Human Capital Gap
June 2019
Nepal Development Update
World Bank Group
productivity-led growth and improved spending efficiency.
Risks and Challenges
A sudden reduction in remittance inflows could lower deposits, limiting the availability of loanable funds in the economy. This could affect private investment and imports, consumption and growth. Remittance inflows have supported household consumption, helping to reduce poverty. It has also helped the economy to earn foreign exchange for imports. The lower outflow of migrants may continue and conditions in migrant-receiving countries could deteriorate, with increasing geopolitical tensions in the Gulf region and uncertain oil prices. These trends could put pressure on remittance inflows, especially if new markets attract only a limited number of laborers from Nepal. Lower credit to the economy that leads to lower growth would also reduce exports. This points to the need to reduce the heavy reliance on remittances as a source of foreign exchange and savings. Greater focus is needed on incentivizing and diversifying exports.
Risks from climate-related natural disasters are high. Erratic monsoons could lead to climate-related disasters such as drought, floods, and landslides that undermine agricultural production which could negatively impact infrastructure,

and reverse gains in poverty reduction. The GlobalClimate Risk Index ranks Nepal as the 1th-most-affected country in the world in the last 20 years and the 4th most affected country in the world in 2017. The vulnerability to climate change is further reinforced by the country’s first tornado that hit two Terai districts (Bara and Parsa) in March 2019 and resulted in a loss of US$ 4.6 million worth of crops and livestock. The implementation of the 2017 Disaster Risk Reduction and Management Act will help mitigate some of these risks. The act governs coordination and management of all activities pertaining to disaster management, disaster risk reduction, disaster recuperation and disaster response as well as monitoring and mitigation measures on climate change and global warming. Follow-on legislation and policy guidelines have been adopted at the local level to incorporate disaster risk management in local government development plans, which also define the procedures for responding to disasters. The upcoming Catastrophe-Deferred Drawdown Option (CAT-DDO) operation supports further reforms to help reduce risks from natural disasters.
The implementation of federalism is expected to improve service delivery, but capacity challenges persist. These challenges have manifested in the underexecution of budgets, especially at the provincial and local levels, and this poses a risk to service delivery. Capacity challenges have impeded the functioning of subnational governments in other areas too. As an example, the Medium-Term Expenditure Framework, which serves as a bridge between the annual budget and the periodic plan, existed in only one province as of March 2019. This is primarily because staff lack skills to forecast revenue and expenditure. The Integrated Public Financial Management Reform Program, supported by the World Bank, is providing technical support to the government and also helping to build capacity in public financial management areas.
Finally, there is a risk that growth will slow down if Nepal is unable to increase investments in physical and human capital and adopt institutional reforms required to raise productivity. Nepal needs infrastructure investments of around 10 to 15 percent of GDP annually for the next 10 years. To boost investments, the government organized the Nepal Investment Summit in March 2019 which resulted
32
Investing in People to Close the Human Capital Gap
June 2019
Nepal Development Update
World Bank Group
in investment commitments worth about US$ 17.5 billion from both domestic and foreign investors. The realization of these investments will depend upon the timely implementation of investment-related legislation that meets international standards. It is equally important to ensure adequate levels of skilled labor to meet the needs of the private sector, complement investments in infrastructure and facilitate innovation. The Special Focus of this edition of the Nepal Development Update outlines the key issues and reforms, to support scaled up investments in people and lay the foundation for increasing human capital and labor productivity.

C. Special Focus – Investing in People to Close the Human Capital Gap for Higher and Sustained Inclusive Growth
............................................................................................................................................................................................................................................................................................................................................................
............................................................................................................................................................................................................................................................................................................................................................
Investing in people and building human capital26 are critical if Nepal is to accelerate its growth and rapidly reduce poverty. The empirical evidence27 indicates that higher levels of human capital directly affect productivity, because individuals who benefit from good nutrition and healthy lives can more effectively benefit from education and develop greater cognitive, technical, and life skills, which make them more productive workers. Policies related to education, adult learning, job training, health, social protection, early childhood development, and other areas influencing an individual’s productivity affects human capital accumulation and, in turn, growth. Human capital investments raise individual earnings potential. For instance, one additional year of schooling in Nepal raises an individual’s earnings by 8 to 10 percent. Globally, the returns to education are even higher in countries such as Rwanda (22 percent), South Africa (19 percent), Ethiopia (19 percent), and Burundi (17 percent).
33
Investing in People to Close the Human Capital Gap
June 2019
Nepal Development Update
World Bank Group
Undernutrition reduces learning potential and productivity and can reduce GDP by as much as 11 percent. Investing in psychosocial stimulation during a child’s early years can raise his or her adult income by up to 25 percent.28 School deworming can have a large and sustained impact on labor market outcomes in adulthood.29 Increases in life expectancy are positively correlated with economic growth.30
Investing in people is also critical for increasing Nepal’s competitiveness. Firm interviews conducted for the World Bank’s publication “Creating Markets in Nepal – Country Private Sector Diagnostic”31 noted that the lack of skills aligned to the needs of the private sector is a key constraint to firm growth and movement up the value chain. Inability to scale-up production affects firm competitiveness. Human capital also affects growth indirectly through its effect on technological change and innovation and through
26 Human capital is a broad concept encompassing “education, training, medical care, and other additions to knowledge and health” (Becker 1992, p.43). It may also refer to proper development of neural connections in the brain (Romer 2015). 27 Flabbi and Gatti 2018.28 Gertler et al. 2014.29 Gertler et al. 2014.30 Acemoglu and Johnson 2007. Note there is no correlation, however, with GDP per capita. [pdf] 31 World Bank 2018.

its effect on the productivity of capital. Thus, investments in both the future and current workforce, combined with policies to increase labor productivity and encourage labor force participation, matter for higher, sustained, and inclusive growth. Now is an opportune time for Nepal to scale-up its investments in human capital before the demographic dividend window closes. According to the World Bank’s 2015/16 Global Monitoring Report,32 Nepal is an early demographic dividend country, defined to include countries where total fertility is below four births per woman. When a country finds itself with a working-age population or labor force that is growing faster than the population that depends on it (such as children and the aged), it creates a window for higher economic growth because the economy can potentially employ more people, savings grow and become a financing source for economic growth, and lower fertility rates result in healthier women. When there are fewer economic pressures and more resources to invest in children, GDP per capita increases due to a decreasing
32 World Bank 2016b.33 Kraay 2018.
dependency rate. For the demographic transition to be accompanied by significant improvements in per capita GDP, it is therefore essential to scale-up investments in human capital to raise the productivity of future generations and existing cohorts of youths and adults.
Nepal has the potential to double its GDP per capita in the long term if it can achieve the benchmarks of complete education and full health. The World Bank Human Capital Index estimates that a child born in Nepal today will be only 49 percent as productive when she grows up as she could be if she enjoyed complete education and full health. Nepal’s GDP can be compared under two scenarios, one in which the current status quo continues, and another in which a child gets full education and health. Under the latter scenario, Nepal’s GDP could be as much as two times larger than the GDP under the status quo scenario.33 Although the assumptions imposed to get to this calculation are very strong (see Box 1, below), the point is that Nepal is missing a huge potential for growth if it fails to invest in its people.
Figure 32. Efforts are needed across sectors to scale-up quality investments in human capital
Source: Authors, drawing from World Bank. 2019, “Africa Human Capital Plan”. World Bank.Washington, D.C. and World Bank. 2016.Snapshot: Investing in the early years for growth and productivity (English). Washington, D.C. : World Bank Group.
DELIVERING ON THE ESSENTIAL INTERVENTIONS ABOVE REQUIRES EFFORTS ACROSS SECTORS
AgricultureWater
and Sanitation
Health Education Social protection Infrastructure Response to
Shocks
• Caring practices • Hygiene practices• Diet • Gender • Social-cultural practices
Household behaviors and practices
• Natural disasters • Conflict and displacement • Environment and climate • Pathogens• Economic shocks • Poverty
• Health and family planning • Nutrition • Social protection • Education• Energy• Water and sanitation • Transport
Coverage and quality of essential services Exposure to risk factors
ALL INDIVIDUALS REACH THEIR FULL POTENTIAL(With the physical, social and emotional capacities for them to learn, earn, innovate and compete)
REDUCE POVERTY AND INEQUALITY INCREASE COMPETITIVENESS
34
Investing in People to Close the Human Capital Gap
June 2019
Nepal Development Update
World Bank Group

The empirical evidence shows that a high-impact and cost-effective approach to building human capital is to invest early in life. Investments should ensure children are born healthy and are well-nourished throughout childhood, receive stimulation and learning opportunities, and are protected from stresses that could affect their productivity well into adulthood. As Figure 32 shows, efforts are needed across sectors to ensure children have access to the resources and services that will help them develop their human capital and reach their fullest potential. These include a broad range of sectors – from water and sanitation to education, from agriculture to health and nutrition, and from labor market interventions to social protection. This Special Focus section, however, concentrates exclusively on a subset of these, namely health, education, nutrition, labor markets, and social protection.
Three key challenges could hold back efforts to scale-up human capital: inequity in access to services, poor quality of service, and vulnerabilities to shocks that can erode
progress in human capital. Access to quality services is affected by a variety of factors. For example, a child’s gender, location, and parental income and education determine whether a child is well-nourished, has clean water to drink, starts and finishes primary school on time, and is protected from shocks. Figure 33 illustrates these challenges for Goma, a girl born in rural Kalikot to poor and illiterate parents from the Dalit community, and Avidit, a Kathmandu boy born to wealthy, educated parents. Goma has less than a 40 percent chance of finishing primary school on time, while Avidit has almost a 95 percent chance of doing so. Social, economic, and geographic barriers form mutually reinforcing and compounding factors that can trap particular groups in poverty and low human capital conditions. Public policy can help level the field and facilitate inclusion in the acquisition and use of human capital. This is essential, not only for taking advantage of opportunities for growth and poverty reduction, but also for addressing vulnerability and fragility.
Figure 33. Circumstances of birth can determine investments in a child’s education
Source: World Bank 2016a.
35
Investing in People to Close the Human Capital Gap
June 2019
Nepal Development Update
World Bank Group
Goma is a girl, born in rural Kalikot. Her parents are illiterate, belong to the Dalit community and are in the bottom 20 percent of Nepal’s wealth distribution.
Champa is also a girl born into a household otherwise very similar to Goma’s. But, Champa’s parents are from a village in Siraha.
Avidit is a boy born to an upper caste household in urban Kathmandu. Both his parents have a university education and come from affluent backgrounds.
0
20
40
60
80
100
120
Startedprimary on
time
Finishedprimary on
time
Fullyimmunized
Notstunted
Cleanwater
Adequatesanitation
Electricity
Avidit Goma Champa
70
95 96
80
69
95100
53
44
85
48
96
36
47
39
84
48
6 5
31

Federalism provides opportunities and challenges for addressing inequities, improving service quality, and reducing vulnerabilities. Nepal’s transition to a federal system raises opportunities as well as risks. Risks to the disruption of services during the transition are likely to be compounded by persistent challenges stemming from spatial/regional disparities in access, quality, and sustainability of human development services. As in many other countries in the region, remote, rural, mountainous, and other hard-to-reach communities often end up with limited availability of quality staffing, harder conditions given the limited access to infrastructure, roads, electricity, and the limited supply of other resources required for effective service delivery (drugs, textbooks, and so forth). Geographic inequities may be exacerbated by the varying conditions of service delivery and local capacity. The transition can also increase the risk of service delivery disruptions, given the capacitychallenges of local governments34 including varying abilities to absorb and institutionalize thedevolved responsibilities for delivering basic services.
The shift to a federal system reflects a strong desire by the government to promote greater social inclusion. And the transition provides an opportunity to address some of these weaknesses, especially for the poor and vulnerable, through fiscal rules, capacity building, representation and voice, incentives, and better targeting of interventions to address equity concerns. It also allows opportunities to systematically integrate services at the local level across health, education, and social protection, that were previously provided by different ministries. As such, government interventions can work both on the supply and the demand sides, combining improved services with income support and the provision of
34 Local-level governments are the 753 rural municipalities, urban municipalities, sub-metropolitan, and metropolitan authorities.35 Raju and Rajbhandary 2018.
C.1. Measuring Nepal’s Human Development Outcomes – the Human Capital Index
The Human Capital Index (HCI) is a composite of three components that together provide a proxy for the productivity of a future worker (Box 1). The HCI quantifies the contribution of nutrition, health, and education to the productivity of the next generation of workers. The index can help assess how much income a country is foregoing because of human capital gaps, and how fast it can turn losses into gains by acting now. It quantifies the contribution of human capital to the productivity of the next generation of workers. One limitation of the HCI is that it does not value education, nutrition, and health as an end in themselves or as a right. Instead, the value is linked to their contribution to future income or labor earnings. Also, focusing on the indicator may lead to the tendency to overfocus solely on its subcomponents, to the detriment of other equally important inputs to human development or indicators of human capital. The HCI, therefore, provides a composite indicator on key elements that constitute human capital and provides a single indicator to assess the performance of a country. Nepal’s performance can be compared with similar countries as well as with the frontier of complete education and full health to see the potential for improvement. As mentioned, a child born today in Nepal will be only 49 percent as productive when she grows up as she could be if she enjoyed complete education and full health. Globally, 56 percent of all children born today will grow up to be, at best, 50 percent as productive as they could be, and 92 percent will grow up to be, at best, 75 percent as productive as they could be.
36
Investing in People to Close the Human Capital Gap
June 2019
Nepal Development Update
World Bank Group
information and services, to provide incentives for the use of education, health, and other services.35
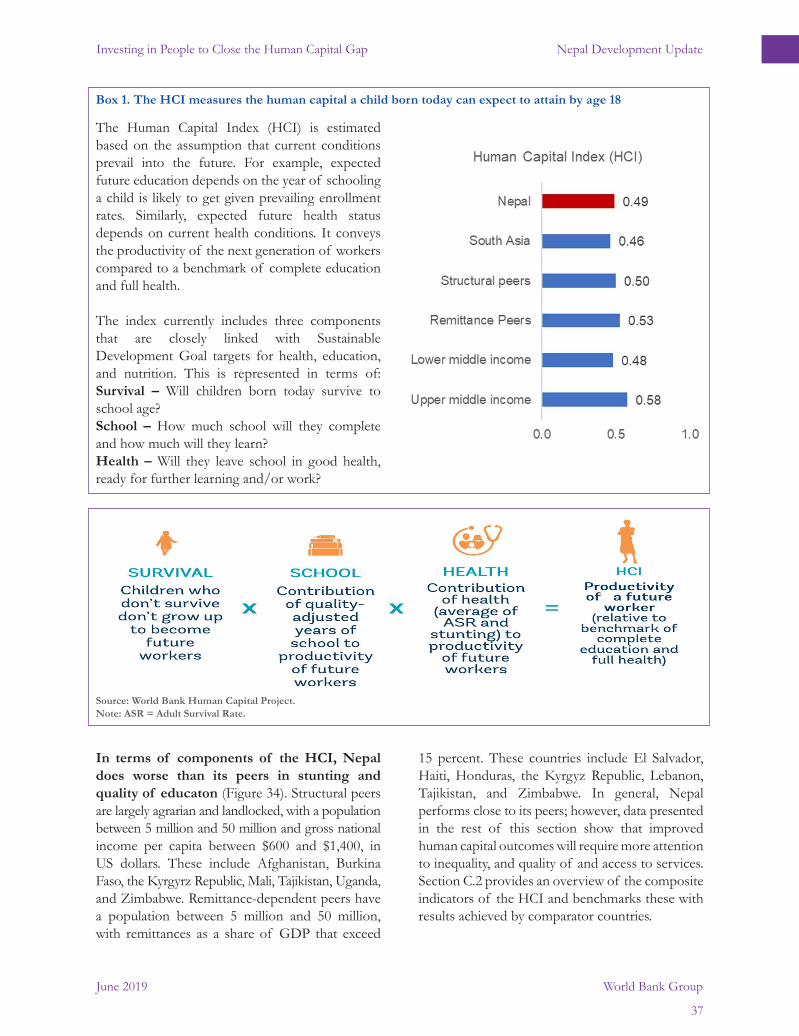
The Human Capital Index (HCI) is estimated based on the assumption that current conditions prevail into the future. For example, expected future education depends on the year of schooling a child is likely to get given prevailing enrollment rates. Similarly, expected future health status depends on current health conditions. It conveys the productivity of the next generation of workers compared to a benchmark of complete education and full health.
The index currently includes three components that are closely linked with Sustainable Development Goal targets for health, education, and nutrition. This is represented in terms of: Survival – Will children born today survive to school age? School – How much school will they complete and how much will they learn?Health – Will they leave school in good health, ready for further learning and/or work?
Box 1. The HCI measures the human capital a child born today can expect to attain by age 18
Source: World Bank Human Capital Project.Note: ASR = Adult Survival Rate.
In terms of components of the HCI, Nepal does worse than its peers in stunting and quality of educaton (Figure 34). Structural peers are largely agrarian and landlocked, with a population between 5 million and 50 million and gross national income per capita between $600 and $1,400, in US dollars. These include Afghanistan, Burkina Faso, the Kyrgyrz Republic, Mali, Tajikistan, Uganda, and Zimbabwe. Remittance-dependent peers have a population between 5 million and 50 million, with remittances as a share of GDP that exceed
15 percent. These countries include El Salvador, Haiti, Honduras, the Kyrgyz Republic, Lebanon, Tajikistan, and Zimbabwe. In general, Nepal performs close to its peers; however, data presented in the rest of this section show that improved human capital outcomes will require more attention to inequality, and quality of and access to services.Section C.2 provides an overview of the composite indicators of the HCI and benchmarks these with results achieved by comparator countries.
37
Investing in People to Close the Human Capital Gap
June 2019
Nepal Development Update
World Bank Group

Figure 34. Composition of indicators that make up Nepal’s Human Capital Index
Source: World Bank Human Capital Project.Note: ASR = Adult Survival Rate.
38
Investing in People to Close the Human Capital Gap
June 2019
Nepal Development Update
World Bank Group

C.2. Nepal’s human capital index ranks relatively well against that of other countries
Child and Adult Survival Rates
36 Nepal Demographic and Health Survey data as reported by the Nepal Ministry of Health and Population Health Sector Progress Report (Ministry of Health and Population 2018).37 Nepal Demographic and Health Survey data as reported by the Nepal Ministry of Health and Population Health Sector Progress Report (Ministry of Health and Population 2018).38 Institute for Health Metrics and Evaluation – Burden of Disease.
Child and adult survival rates in Nepal compare favorably with that of other countries in the same income group (Figure 35). There has been a large decline in child mortality in Nepal in recent years, with under-five mortality decreasing from 54 deaths per 1,000 live births in 2011 to 39 deaths per 1,000 live births in 2016.36 Similarly, neonatal deaths – within the first 28 days of life – have declined from 33 deaths per 1,000 live births
in 2011 to 21 deaths per 1,000 live births in 2016.37 There are vulnerabilities though. Causes of death under age five stem largely from complications at birth, which also reflects the underlying health of the mother. Respiratory and other infections also have remained the top reasons for death over the last several years.38 These factors contribute to Nepal’s 97 percent survival rate for children up to age five. These rates are similar to what is observed in Bangladesh (97 percent), Rwanda (96 percent), and Cambodia (97 percent). In contrast, a child born in Sri Lanka (99 percent), Malaysia (99 percent), Thailand (99 percent), and Vietnam (98 percent) has a higher chance of survival up to age five.
Adult survival compares favorably with other countries of similar income, but understanding the main causes of death reveals areas for improvement. For a Nepalese child born in 2017, life expectancy is 73.3 years for girls and 68.7 years for boys, and this has been increasing appreciably in recent years. As shown in Figure 35, Nepal compares well in terms of the expectation that a 15-year-old alive today will reach age 60 (adult survival rate). Figure 35 also shows that measurable improvement is possible, but not automatic, at even
slightly higher income levels. A starting point for understanding how to improve adult mortality is to look at the main causes of mortality, which differ by gender and age group, and then to look at the underlying risk factors that need to be addressed.For the age group 15 to 49, which is the most productive in terms of labor market contributions and the reproductive age of women, transport injuries or road traffic accidents are the leading cause of death for men. Female-related cancers are the leading cause of death for women (Table 2).
39
Investing in People to Close the Human Capital Gap
June 2019
Nepal Development Update
World Bank Group
Figure 35. Nepal’s child and adult survival rates compare favorably with some middle-income countries
Source: World Bank Human Capital Project.
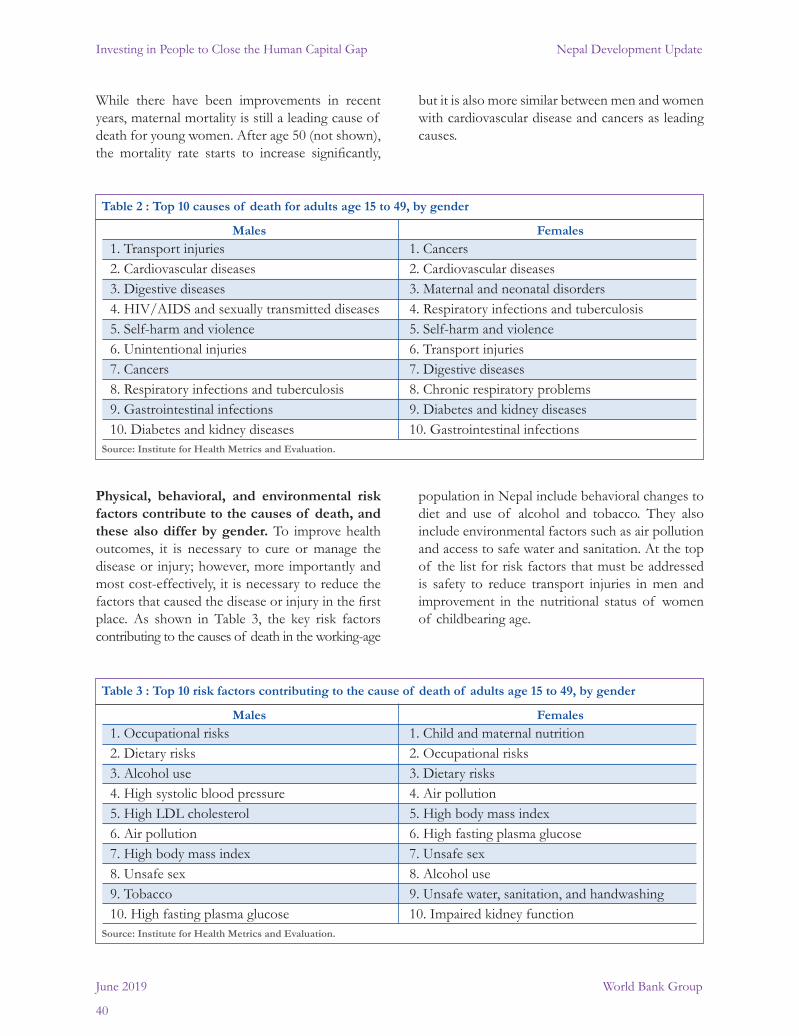
While there have been improvements in recent years, maternal mortality is still a leading cause of death for young women. After age 50 (not shown), the mortality rate starts to increase significantly,
Physical, behavioral, and environmental risk factors contribute to the causes of death, and these also differ by gender. To improve health outcomes, it is necessary to cure or manage the disease or injury; however, more importantly and most cost-effectively, it is necessary to reduce the factors that caused the disease or injury in the first place. As shown in Table 3, the key risk factors contributing to the causes of death in the working-age
Table 2 : Top 10 causes of death for adults age 15 to 49, by gender
Males Females
Source: Institute for Health Metrics and Evaluation.
1. Transport injuries 1. Cancers2. Cardiovascular diseases 2. Cardiovascular diseases3. Digestive diseases 3. Maternal and neonatal disorders4. HIV/AIDS and sexually transmitted diseases 4. Respiratory infections and tuberculosis5. Self-harm and violence 5. Self-harm and violence6. Unintentional injuries 6. Transport injuries7. Cancers 7. Digestive diseases8. Respiratory infections and tuberculosis 8. Chronic respiratory problems9. Gastrointestinal infections 9. Diabetes and kidney diseases10. Diabetes and kidney diseases 10. Gastrointestinal infections
but it is also more similar between men and women with cardiovascular disease and cancers as leading causes.
population in Nepal include behavioral changes to diet and use of alcohol and tobacco. They also include environmental factors such as air pollution and access to safe water and sanitation. At the top of the list for risk factors that must be addressed is safety to reduce transport injuries in men and improvement in the nutritional status of women of childbearing age.
Table 3 : Top 10 risk factors contributing to the cause of death of adults age 15 to 49, by gender
Males Females
Source: Institute for Health Metrics and Evaluation.
1. Occupational risks 1. Child and maternal nutrition2. Dietary risks 2. Occupational risks3. Alcohol use 3. Dietary risks4. High systolic blood pressure 4. Air pollution5. High LDL cholesterol 5. High body mass index6. Air pollution 6. High fasting plasma glucose7. High body mass index 7. Unsafe sex8. Unsafe sex 8. Alcohol use9. Tobacco 9. Unsafe water, sanitation, and handwashing10. High fasting plasma glucose 10. Impaired kidney function
40
Investing in People to Close the Human Capital Gap
June 2019
Nepal Development Update
World Bank Group

Stunting among children under age five Figure 36. The fraction of non-stunted children is low or, conversely, the stunting rate is high at 36 percent
Source: World Bank Human Capital Project.
Figure 37. Stunting rates are decreasing over time
Source: Ministry of Health 2017. Nepal Demographic and Health Survey 2016.
Nepal’s stunting rate of 36 percent is high compared to international benchmarks (Figure 36). Nepal performs better than some other South Asian countries like Pakistan (45 percent) and Afghanistan (41 percent), but is behind Sri Lanka (17 percent) and Bhutan (21 percent). Stunting rates for Nepal are also high compared to Thailand or Mongolia, for example, each of which has a stunting rate of 11 percent.
Although Nepal has made remarkable progress in reducing stunting from 57 percent in 2001 to 36 percent in 2016, the current rate is still high and is a public health concern (Figure 37). Anemia continues to be a significant problem for children and women. In 2016, 53 percent of children and 41 percent of women were anemic. About 17percent of women aged 15 to 49 were undernourished, as defined by a body mass index (BMI) of less than 18.5. At the same time, a growing problem for Nepalese women is overweight; 22 percent of women were overweight or obese according to the 2016 Nepal Demographic and Health Survey, up from 9 percent in 2006. Malnutrition, resulting from a low-quality diet that lacks diversity, poor caring practices, education, and utilization of health services, is a key cause of stunting. Early childbearing (below age 18) is also a contributing factor.
Expected Years of School and Learning-Adjusted Years of School
In Nepal, a child who starts school at age four can expect to complete 11.7 years of school by her 18th birthday, which is higher than the South Asia regional average (Figure 38). The expected years of schooling is 11 in Bangladesh 10.2 in India. The only country in South Asia with stronger performance in expected years of schooling is Sri Lanka, with 13. Globally, the top performers in this dimension have 14 expected years of schooling. Nepal is performing better than most other countries like Rwanda (6.6 years), Zambia (9.2 years), Bangladesh (11 years), and India (10.2 years), but not as well as Mongolia (13.6 years), Sri Lanka (13 years), Vietnam (12.3 years), and Thailand (12.4 years).
Figure 38. Nepal’s expected years of schooling ishigher than the South Asia regional average…
Source: World Bank Human Capital Project, 2018.
41
Investing in People to Close the Human Capital Gap
June 2019
Nepal Development Update
World Bank Group
Percentage of children under age 5 who are malnourished

However, Nepal’s performance worsens when one accounts for quality measured by learning-adjusted years of schooling, or globally benchmarked harmonized learning outcomes (Figure 39). This measure provides a more accurate picture of the human capital generated through education, as it accounts for not just the quantity of schooling but also the quality. Factoring in what children actually learn, expected years of schooling drops from 11.7 years to 6.9 years. This means that on average, around 4.8 years of schooling are lost due to poor quality. Nepal’s learning-adjusted years of schooling, at 6.9 years, is at par with Cambodia (6.9 years) and Myanmar (6.7 years), but is significantly lower than in Vietnam (10.2 years), Malaysia (9.1 years), Thailand (8.6 years), and Mongolia (9.4 years).
Figure 39. …but performance worsens with learning-adjusted years based on harmonized learning outcomes
Source: World Bank Human Capital Project, 2018.
Nepal has been successful getting children into school but needs to ensure that schooling translates into learning. The gap between expected years of schooling and learning-adjusted years of schooling underscores the need to improve quality. In Nepal’s public schools, acquisition of key foundational skills, like literacy, language proficiency, and numeracy, are compromised. Several rounds of the National Assessment of Student Achievement data from 2011 to 2014 show that in grades 3, 5, and, 8 fewer than 20 percent of students can master competencies in problem-solving and reasoning. Almost 40 percent of students repeat grade 1.39 This also leads to dropping out. According to the Nepal Living Standard Survey 2010, the reason most frequently cited by primary-school-aged children (ages 5 to 10) for dropping out of school is poor academic progress.40 Addressing the challenges around learning outcomes will help lay the foundation for broader skills development and increase labor productivity.
39 Ajwad 2007.40 World Bank 2013.41 World Bank 2016a.
C.3. For Nepal to realize its full human capital potential, renewed efforts are needed to reduce inequity, improve service quality, and minimize vulnerabilities
Overall, the performance summarized above masks important differences across social, economic, and geographic dimensions. Addressing these differences will be critical to further boost human capital outcomes in Nepal and reduce the confounding effect of disparities from different sources that often overlap and work together to prevent households from realizing their full potential. In-depth analysis41 shows that both household characteristics (education of parents, wealth, ethnicity, and so forth) and supply factors matter for human development outcomes. These disparities are observed almost systematically for all dimensions of human capital. Improvements will require reducing inequity by focusing on the poor, the vulnerable, excluded groups, or particular regions and localities. It will also require addressing issues of quality of service delivery, which needs to be improved for all services. Finally, measures
42
Investing in People to Close the Human Capital Gap
June 2019
Nepal Development Update
World Bank Group
42 Asian Development Bank CPS 2013–2017.
to reduce vulnerability to shocks are critical to ensure gains made in human capital are sustained and further developed.
Given the above priorities, to realize its full human capital potential Nepal will have to (a) reduce inequity across gender, social status, income, and geographic groups; (b) improve the quality of human capital services (in education, health, nutrition, social protection, and labor market programs) from early childhood to adulthood, with a focus on a multisectoral approach, improved coordination, capacity support, and increased accountability of service providers; and (c) promote resilience to shocks for households and services. These priority areas and related interventions are discussed below.
Priority number 1: Reduce inequity across gender, social status, income, and geographic groups
Gender parity has been achieved for some indicators but not for others, and women continue to experience lower outcomes. Decomposing the HCI components by gender reveals parity (in terms of survival, stunting, and schooling) (Figure 40). For example, in Nepal, the adult survival rate is 87 percent for females and 83 percent for males. The 4-percentage-point difference is smaller than that observed among its structural or remittance-dependent peers, where women have a stronger advantage over men in terms of survival (a 6-percentage-point difference on average). This suggests there could be more improvements for women to bring the gender difference closer to that of Nepal’s peers. However, the adult survival rates for Nepalese men is significantly lower than that for higher-income countries (where it exceeds 90 percent). This highlights the need to improve survival rates for
both men and women. Gender parity in education has been attained for children at the basic grade levels (grades 1–8) and at the secondary education level (for males, expected years of schooling are 11.5 and for females, 11.9 years), but is yet to be achieved for younger children (where gender parity stands at 0.89 for early childhood education and pre-primary).
The progress in gender parity of the HCI indicators (particularly those linked to education) has not translated to gender parity in labor force participation. Differences in outcomes between males and females in terms of labor outcomes can lead to gender-based differences in the ability to build on and further develop skills. This impacts earnings, which in turn influences investments in human capital. For every 100 males in the working-age population there are 125 females. Yet, for every 100 employed males there are only 59 employed females. Gender disparities also exist among the unemployed, and women earn on average 70 percent of what men earn. Part of the reason could be due to the gender disparities that emerge at the tertiary education levels in the fields of science and technology, and it could be that it takes until the postsecondary education level for the effects of disparities linked to early childhood and pre-primary to emerge. The differences in outcomes are also likely driven by social norms regarding the roles men and women can play in society. Overall, while policies and programs have enabled women to participate more in decision making and have greater access to assets and resources, women continue to experience greater vulnerability and risks to certain aspects of their human development outcomes.42
43
Investing in People to Close the Human Capital Gap
June 2019
Nepal Development Update
World Bank Group

Figure 40. The gender gap for schooling, survival, and stunting is generally low in Nepal
Source: World Bank Human Capital Project, 2018.
In addition to gender, income disparities are a major factor that limit access to quality education, nutrition, and health services. While more than 86 percent of children aged three to five in the richest quintile achieve composite early childhood development milestones, only about 60 percent of children in the poorest quintile do.
Girls and children from economically disadvantaged groups have disproportionately low access to schooling and high repetition and dropout rates, indicating systematic and limited exposure to enabling learning conditions. This is particularly problematic because the returns to targeted early investment are highest for disadvantaged children.
44
Investing in People to Close the Human Capital Gap
June 2019
Nepal Development Update
World Bank Group

Figure 41. Institutional delivery are lowest and stunting rates in Nepal are highest for the poorest households
Source: Nepal Demographic and Health Survey.
Stunting is disproportionately concentrated in poorer households (Figure 41).43 Stunting is relatively high among children from the lowest wealth quintile (49 percent) compared with the highest wealth quintile (17 percent). Decomposition analysis has revealed that by 2016, wealth explained 72 percent of the differences in stunting (up from 61 percent in 1996), while mother’s health (measured by her body mass index [BMI]) accounted for 12 percent of the disparities.
43 Angdembe et al. 2019.44 Asian Development Bank CPS 2013–2017.
Finally, data on health service utilization show utilization is much lower among poorer groups. Figure 41 shows disparities in institutional delivery (a key determinant of maternal mortality) and stunting rates. Nationally, 57 percent of women give birth at health institutions. This average figure masks the huge disparities between high- and low-income households: almost 90 percent of women in the richest quintile have institutional deliveries, but only about one-third of the poorest do so.
Disparities are also evident across social classes and groups. Table 4 shows, for instance, that children from the Dalit community have significantly higher rates of child mortality, lower rates of immunization, and higher stunting than those in other groups. This mirrors the poverty
incidence by caste and ethnicity, which is highest among the hill and Terai Dalits: 43.6 percent of the hill Dalits and 38.2 percent of the Terai Dalits are poor compared to the national average of 25.5 percent.44
45
Investing in People to Close the Human Capital Gap
June 2019
Nepal Development Update
World Bank Group

Table 4 : Health outcomes and access to health services by caste
Source: Institute for Health Metrics and Evaluation.
Caste Groups Child Neonatal Children Children Fully Institutional Anemic Mortality Mortality Stunted Immunized Delivery Rate WomenBrahmin/Chhetri 39 23 35 87.3 68.4 36.5Dalit 63 43 40 73.2 45.4 38.4Janajati 42 24 32 82.9 57.9 39.7Muslim 47 25 38 68.1 51.6 51.8Newar 33 9 27 88.7 74.6 26.4Other Terai castes 51 27 42 64.3 48.1 55.6
45 World Bank 2016a.46 Ministry of Health 2017.
There are important geographic disparities in education, especially at higher levels. For example, the net enrollment rate at the secondary level is significantly higher in Kathmandu Valley (49 percent) than other regions, especially Terai (27 percent). Pupil-teacher ratios (Figure 42) are significantly higher in the Terai region than other regions, and Province 2 still lags behind other provinces (with primary enrollment rates ranging from 93 to 98 percent), both for girls (84 percent primary enrollment) and boys (86 percent primary enrollment). In addition, several rounds of the National Assessment of Student Achievement data from 2011 to 2014 reveal inequality in learning outcomes across districts (in addition to differences by socioeconomic status, ethnicity, and language spoken).45
Geographic disparities in health and nutrition are important and tend to be correlated with poverty (Figures 43, 44, 45). The relatively poor performance of Provinces 1 and 2 is well documented. While Province 3 has the highest concentration of public and private services, it still performed less well in terms of rates of women giving birth at facilities and children who are fully immunized, as well as in proxies for quality such as postpartum mothers receiving vitamin A and children treated with oral rehydration and salts and zinc for diarrhea. Nutritional outcomes also vary by geographic region, wealth, and education status. Stunting rates are high in Province 6 (55 percent) and low in
Figure 42. Pupil-teacher ratio by region, 2015/2016
Source: Flash Reports, various years.
Provinces 3 and 4 (29 percent). These trends are partly explained by the regional variations in poverty. A higher percentage of children are malnourished because they come from severely food-insecure households (46 percent stunted, and 35 percent underweight) compared with children from food-secure households (29 percentstunted and 22 percent underweight).46
46
Investing in People to Close the Human Capital Gap
June 2019
Nepal Development Update
World Bank Group

Geographic variations in stunting, poverty, and literacy are highly correlated
Figure 43. Stunting prevalence Figure 44. Poverty rate
Figure 45. Adult literacy rates
Source: Nepal Demographic Health Survey 2016.
Source: World Bank Staff Calculation using Nepal LivingStandard Survey 2010/11
Source: Nepal Demographic and Health Survey 2016.
47 Central Bureau of Statistics 2019.
Consumption Poverty (2010/11)
Inequities linked to gender, social status, income, and geography can also have adverse effects on labor market outcomes, which in turn lead to unequal access to social and human capital. For example, social status determines the types of personal networks individuals can access. In the context of low-performing labor markets, personal networks are an essential element for youth and adults who seek employment. The quality of family and friend networks that workers can tap into to look for employment, or their family’s position in terms of having an income-generating activity, are essential to labor market success. This is also critical for labor migrants, who mostly find employment through informal personal networks. The most common job search method in Nepal is seeking
help from relatives and friends – at least 57 percent of those looking for work did so by contacting relatives and friends. This is followed by applications to prospective employers and checking at factories and other work sites (20 percent). Only a negligible share used public or private employment services or job advertisements.47 Among youth, most found employment by either joining their family’s income-generating activity or asking friends or family for assistance.
Priority interventions for promoting equity in access to servicesTo address the challenge of inequity in access to services and resulting outcomes, it will be necessary to (a) eliminate barriers linked to low income, gender, and social status that lead to
47
Investing in People to Close the Human Capital Gap
June 2019
Nepal Development Update
World Bank Group

exclusion of the poor and vulnerable; and (b) increase the availability of services in poorer and/or underserved areas.
(a) Eliminate barriers linked to low income, gender, and social status that lead to exclusion of the poor and vulnerable
As noted, gender, income, and social disparities can interact to undermine investments in human capital. Removing barriers for the poor and vulnerable therefore requires interventions that identify and target these groups, in order to address the particular constraints that keep them from accessing services. Income plays a central role in defining households’ well-being and their ability to invest in human capital. Income also affects households’ ability to decide to use services (a demand-side factor). For both reasons, it will be important to incorporate income support programs.
Income barriers arise from high out-of-pocket payments, which are most constraining for the poor. In 2015/16, general government health expenditure from all sources represented 27 percent of total health expenditure, 22 percent of current health expenditure, and 1.8 percent of GDP. Households’ out-of-pocket payments represented the main source of funding for the country’s health system, at 55 percent of all spending for health care. Indeed, the government’s share has been decreasing over the past decade (Figure 46). Nepal’s out-of-pocket health spending (as a share of total health spending) is high relative to, for example, Thailand (12 percent), Vietnam (43 percent), and Sri Lanka (38 percent), which exhibit better health outcomes. This points to the need to increase public spending in health to the level comparable to Nepal’s peers. More generally, as discussed, socioeconomic status is a key factor in determining human capital indicators. In education, in addition to lack of services and to quality of services, there is a need to focus on the demand side, to identify interventions that support and provide incentives to the poor, vulnerable, and those excluded from access to services. Also as discussed earlier, removing income barriers is critical to improving nutrition outcomes.
Figure 46. General government health expenditure as a percentage of current health expenditure
Sources: National Health Accounts 2012/13 to 2015/16.
Social protection programs, including safety nets and insurance, can play an essential role in promoting the take-up of services by the poor and vulnerable. Fundamentally, social protection programs provide income support, which allows households to adopt healthy food consumption patterns; have decent living conditions; and have some protection from shocks and stress. In addition, social protection programs can be designed to address the gender- and income-related barriers to accessing services by supporting the incomes of the poor and vulnerable, to ensure their income is regular and by ensuring the poor and vulnerable have access to services and are not constrained by their ability to pay out of pocket. Safety nets can also help defray the cost of access (for example, transport costs to get to services, out-of-pocket costs for services, foregone income if individuals need to miss work to get their benefits, and so forth). Safety nets can also help the poor and vulnerable invest in productive strategies that can help them lift themselves out of the poverty trap. There is strong evidence from around the world on the impact of safety nets on human capital investments.
To increase the impact of social protection programs on human capital, a significant transformation is needed to explicitly link programs to human capital and to focus on the poor and vulnerable. This would require ensuring programs are designed to effectively reach the poor, vulnerable, and excluded, and are designed to encourage and support investments in human
48
Investing in People to Close the Human Capital Gap
June 2019
Nepal Development Update
World Bank Group
(b) Increase the availability of services in poorer and underserved areas
capital. Effective programs, implemented in over 150 countries, typically combine transfers with information or incentives to promote behavioral changes (including those linked to gender), and address some of the constraints to service utilization. As further developed below, a social registry could be used to identify poor and vulnerable households and link them to multiple programs. A social registry could help direct vulnerable households to specific interventions – grants, cash transfers, public works programs, scholarships, and various health schemes including health insurance aimed at protecting the poor and vulnerable, as well as economic inclusion programs. This would also help in the efficient allocation of resources to those most in need.
An essential step could be the development of a national social protection strategy or policy. Recent legislation on delivering constitutional rights for the social protection of certain groups has provided a legal foundation to provide services to targeted groups. However, the law remains narrow in its focus on cash transfers and lacks clarity on the broader poverty reduction or human development goals it aims to achieve for the targeted groups. A strategy would provide a coherent and integrated vision to achieve these outcomes. A national-level policy would help establish social protection as integral to achieving broader poverty reduction and human capital development goals, clarify the roles of the three level of governments in the design and delivery of programs, outline institutional mechanisms to ensure coordination, provide guidance to develop standards, improve coordination and delivery systems, and improve shock-responsiveness. The policy/strategy could build on the National Social Protection Framework draft prepared by the National Planning Commission, and engagement with line ministries and subnational governments.
Addressing the income constraints of the poor and vulnerable also requires ensuring individuals
(particularly women) can improve their productivity and employability. This means both improving productivity in sectors where the poor and women are concentrated (such as in agriculture), ensuring the energy and knowledge of returnee migrants are harnessed, and investing in employment-generating growth. Critical to the investment is ensuring adequate and complementary investment in both physical and human capital since both are necessary complements to increasing productivity. Employment-generating growth is particularly important for today’s youth who will become tomorrow’s income-earning adults and parents. It also helps to highlight the value of investing in health and education (when parents and youth today see the returns in terms of earnings). Equally important to quality job creation is ensuring there is increased knowledge and access to these jobs, through preparing potential employees by investing in health and education services. These investments will support the poor and vulnerable in fully realizing their productive potential while helping to build human capital. It is also important to help youth and adult members develop income-generating activities that can sustain their families and further investments in human and physical capital.
Addressing geographic differences in access to services will require attention to improved resource allocation and use. In the long term, the process of decentralization could be an effective means to address the geographic differences to access and could be used to improve targeting. This will require both improvements in the allocation of resources, and a focus on underserved areas. Table 6 shows regional average spending (during 2012–16) for health, education, and social protection,48 while Figure 47 presents trends in public spending for nutrition, education, social protection, and health.
48 The sample used to calculate the averages exhibits a large degree of variation over time and sector.
49
Investing in People to Close the Human Capital Gap
June 2019
Nepal Development Update
World Bank Group
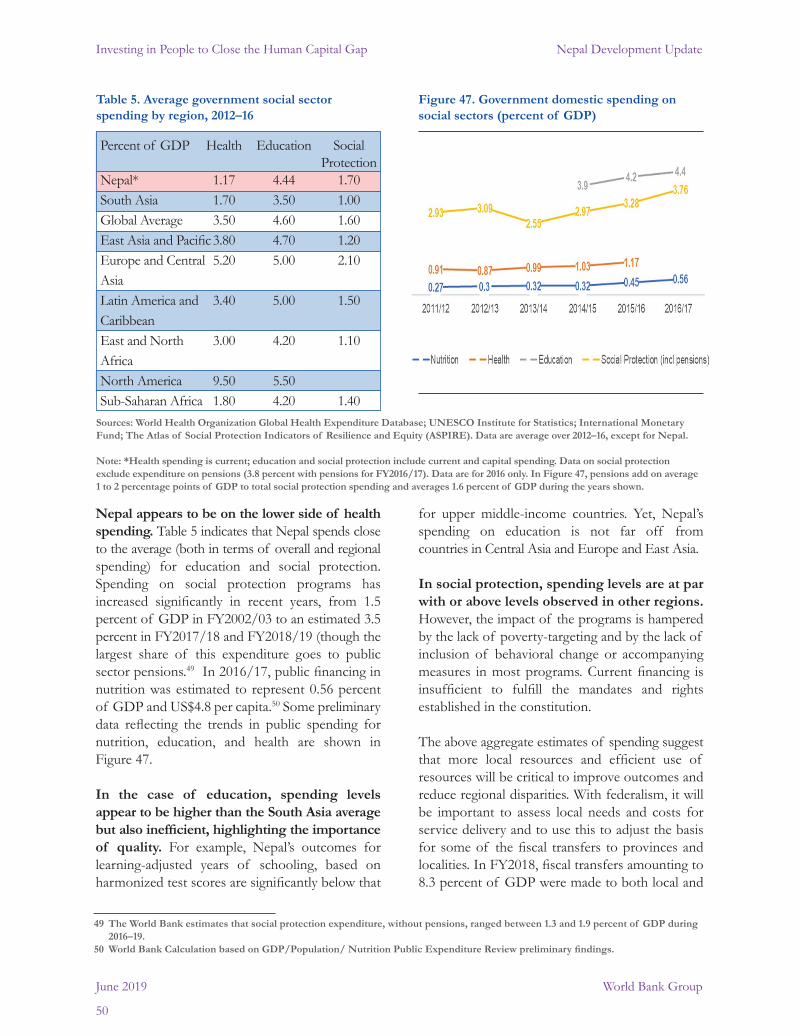
Table 5. Average government social sector spending by region, 2012–16
Figure 47. Government domestic spending on social sectors (percent of GDP)
Sources: World Health Organization Global Health Expenditure Database; UNESCO Institute for Statistics; International Monetary Fund; The Atlas of Social Protection Indicators of Resilience and Equity (ASPIRE). Data are average over 2012–16, except for Nepal.
Note: *Health spending is current; education and social protection include current and capital spending. Data on social protection exclude expenditure on pensions (3.8 percent with pensions for FY2016/17). Data are for 2016 only. In Figure 47, pensions add on average 1 to 2 percentage points of GDP to total social protection spending and averages 1.6 percent of GDP during the years shown.
Percent of GDP Health Education Social ProtectionNepal* 1.17 4.44 1.70South Asia 1.70 3.50 1.00Global Average 3.50 4.60 1.60East Asia and Pacific 3.80 4.70 1.20Europe and Central 5.20 5.00 2.10Asia Latin America and 3.40 5.00 1.50Caribbean East and North 3.00 4.20 1.10Africa North America 9.50 5.50 Sub-Saharan Africa 1.80 4.20 1.40
Nepal appears to be on the lower side of health spending. Table 5 indicates that Nepal spends close to the average (both in terms of overall and regional spending) for education and social protection. Spending on social protection programs has increased significantly in recent years, from 1.5 percent of GDP in FY2002/03 to an estimated 3.5 percent in FY2017/18 and FY2018/19 (though the largest share of this expenditure goes to public sector pensions.49 In 2016/17, public financing in nutrition was estimated to represent 0.56 percent of GDP and US$4.8 per capita.50 Some preliminary data reflecting the trends in public spending for nutrition, education, and health are shown in Figure 47.
In the case of education, spending levels appear to be higher than the South Asia average but also inefficient, highlighting the importance of quality. For example, Nepal’s outcomes for learning-adjusted years of schooling, based on harmonized test scores are significantly below that
49 The World Bank estimates that social protection expenditure, without pensions, ranged between 1.3 and 1.9 percent of GDP during 2016–19.50 World Bank Calculation based on GDP/Population/ Nutrition Public Expenditure Review preliminary findings.
for upper middle-income countries. Yet, Nepal’s spending on education is not far off from countries in Central Asia and Europe and East Asia.
In social protection, spending levels are at par with or above levels observed in other regions. However, the impact of the programs is hampered by the lack of poverty-targeting and by the lack of inclusion of behavioral change or accompanying measures in most programs. Current financing is insufficient to fulfill the mandates and rights established in the constitution.
The above aggregate estimates of spending suggest that more local resources and efficient use of resources will be critical to improve outcomes and reduce regional disparities. With federalism, it will be important to assess local needs and costs for service delivery and to use this to adjust the basis for some of the fiscal transfers to provinces and localities. In FY2018, fiscal transfers amounting to 8.3 percent of GDP were made to both local and
50
Investing in People to Close the Human Capital Gap
June 2019
Nepal Development Update
World Bank Group
51 Ajwad 2007.52 World Bank 2013. 53 Camilli et al. 2010; Nores and Barnett 2010.54 World Bank 2018.55 World Bank 2007.56 Chen 2012.
provincial governments. Given the estimated historical spending levels for education, health, social protection, and nutrition (estimated 7.5 percent of GDP), it is clear that the current levels of transfers will not be sufficient to meet local needs. It will be equally important to develop the revenue capacity of local governments, and to ensure they are more efficiently applying the resources received to improve the quality of service delivery and reduce inequities.
Federalism provides an opportunity to address geographic disparities by promoting improvements in the allocation of resources to better target the poorest areas and those with deficits in services. As noted, it will be important to assess local needs and costs for service delivery and to use this to adjust the basis for some of the fiscal transfers to provinces and localities. A review of the budget allocation formula for conditional grants from the perspective of equity of outcomes could be a step toward improved resource allocation across local and provincial governments. It will be important to refine the basis for fiscal transfers to be more effectively aligned to needs, local costs, and capacity; develop the revenue capacity of local governments; and ensure local governments are efficiently applying the resources received to improve the quality of service delivery, including the effective targeting of resources to the poor and vulnerable. For those functions that remain under the responsibility of the central government (as is the case for social protection, which is a concurrent function across the three levels of government), an essential step toward ensuring equity would be for the federal government to ensure a minimum level of social protection services to all, to which local governments could add as required.
Priority number 2: Improve the quality of human capital services (in education, health, nutrition, labor, and social protection) from early childhood to adulthood
The quality of education services is evident from the low learning achievements at all levels of education (kindergarten to tertiary) and is one of the foremost challenges in the education sector. Concerns about the quality and relevance of education become even more pronounced in a global economic backdrop, where demand for advanced skills and innovation is continuously increasing. Among young children, literacy and numeracy are severely lagging. Fewer than 20 percent of children in grades 3, 5, and, 8 can master competencies in problem-solving and reasoning.,51 52 This is driven mainly by three factors. First, children are often not ready for school. Robust early childhood education and development (ECED) helps children acquire key foundational cognitive skills53 and helps launch children on higher learning trajectories,54 making them more adaptable, resilient, and productive. The gross enrollment ratio for ECED/pre-primary education (PPE) has increased from 12 percent in 1999 to 84 percent in 2017. Still, about 16 percent of four-year-old children do not have access to, or have not been enrolled in, ECED/PPE.
Education quality is also impacted by weak accountability and incentives in the system. The prevailing institutional structure gives school administrators little leverage over centrally hired teachers, and there is weak accountability of the school system to households.55 Government teachers are sometimes perceived as unresponsive to parents and students and indifferent toward the quality of their teaching.56 There are no effective accountability mechanisms in the system that focus adequately on teaching-learning processes in the classroom. A specific way this challenge manifests is that very often classroom instruction happens at a level that most students cannot follow. Teachers do not have either the time, skills, or motivation to address different learning needs, or the pedagogical tools to identify learning levels and then to calibrate their teaching accordingly.
51
Investing in People to Close the Human Capital Gap
June 2019
Nepal Development Update
World Bank Group

57 Ministry of Health 2017.
Improved learning also requires better alignment of teachers and student assessment systems with the goal of learning for all. The prevailing institutional structure gives school administrators little leverage over centrally hired teachers, and the accountability of the school system to households has been low. There are no effective accountability mechanisms in the system that focus adequately on teaching-learning processes in the classrooms. This often results in classroom instruction that occurs at a level that most students cannot follow. Finally, improved data can help identify which schools need more resources, which teachers need more training, and which students need more instruction. Nepal has taken positive steps toward better measurement of learning. To that end, several rounds of the National Assessment of Student Achievement have been completed. However, there is very limited use of these data in guiding policy or practice. For instance, learning data can be useful in helping policy makers decide which schools need additional resources and which teachers need additional training. Similarly, these data can help teachers see which areas of instruction and which students need greater attention. Currently, even though learning data are being produced, they could be much better used to improve policy and practice. One way to ensure this is to devote resources and effort to the timely distribution of understandable results to key stakeholders.
Improving the quality of health services needs investment to ensure availability of essential and priority drugs, adequate training of health workers, and proper facilities and equipment. Quality of health services is largely constrained by the availability of critical inputs such as essential drugs and adequately trained health workers. For example, the National Health Facility survey found that only 3 percent of the health facilities providing outpatient care for children have all the infection prevention items needed to control infection among sick children. Only 55 percent of health facilities have a proper expanded program on immunization (EPI) guidelines; 20 percent of staff are trained in EPI; 3 percent have a needle destroyer, and less than 8 percent have all the training and equipment
needed for EPI services. Moreover, there is a shortage of qualified workers, worker absenteeism, stock-outs of essential drugs, and limited physical infrastructure (such as health facility buildings with water and electricity, and equipment). These supply-side factors are exacerbated by the high out-of-pocket costs that further limit the quality of services most households can access.
Addressing malnutrition requires improving people’s behavior toward adopting good nutrition practices and improving the quality of nutrition services. Currently, only 42 percent of women age 15 to 45 with a child born in the past five years took iron tablets for at least 180 days.57 Only 36 percent of children 6 to 23 months met the criteria for a minimum acceptable diet. The National Micronutrient Survey 2016 shows that multiple micronutrient supplementation besides iron/folic acid is needed to combat anemia. As per the survey, anemia in pregnant women is high at 27 percent. The same survey shows that zinc deficiency in children 6 to 59 months is as high as 21 percent, and only 7 percent of these children with diarrhea had received zinc supplements.
Strengthening the multisectoral approach for delivering nutrition services will require addressing the challenge of coordination failures in implementing the national multisectoral action plan. Reducing stunting and other forms of malnutrition by investing in nutrition is a national agenda in Nepal. Nepal’s World Health Assembly target for stunting reduction is 25 percent (by 2025) and the Sustainable Development Goal target is 15 percent (by 2030). The Government of Nepal has committed to reducing malnutrition by cultivating a proper investment climate for nutrition interventions, and donors have committed to financing nutrition programming. It has made nutrition and food security a national priority by undertaking a Nutrition Assessment and Gap Analysis (NAGA 2011), developing Multisector Nutrition Plans (MSNP 2013 and MSNP 2018), and creating a National Nutrition and Food Security Secretariat under the umbrella of the National Planning Commission to
52
Investing in People to Close the Human Capital Gap
June 2019
Nepal Development Update
World Bank Group

58 Raju and Rajbhandary 2018.59 Raju and Rajbhandary (2018) based on Elder et al. (2015).
strengthen coordination and integrated delivery of services, as well as guide and oversee nutrition activities. Despite such policy commitments, implementation is lagging mainly due to coordination failure. The new federal structure provides an opportunity to coordinate implementation at the local level, where all the implementing agencies can converge.
The quality of social protection services is also in need of improvement to support higher investments in human capital. Despite significant spending, access to social protection is uneven. Based on the Nepal Living Standard Survey II, social insurance covers only 7 percent of the population, mostly public sector employees and richer segments of the population. Despite covering around 35 percent of the population, social assistance schemes are not targeted explicitly toward the monetarily poor. Instead, it relies on targeting based on ethnic and social categories. The benefits provided by some programs are too small to effectively remove the income barrier most of the poor face when trying to access services. Improved targeting could promote greater efficiency in reaching the poor and also help release more resources for the poor. Finally, most programs would have greater impacts on investments in human capital if the income support they provided was accompanied with information and incentives to adopt behaviors that promote greater investments in the nutrition, health, and education of children and in the productive and earning capacity of adults.
Quality labor market interventions are also essential to ensure that human capital investments effectively support inclusive growth. The human capital situation of youth is both an opportunity and a challenge. Nepal is in the middle of a youth bulge in its demographic structure, and these dynamics present real opportunities for Nepal’s economic growth and development. To realize this potential, Nepal needs to provide sufficient and suitable employment that is productive and adequately remunerative for the country’s youth. Attention to labor markets, particularly for youth and women, will be important
for catalyzing investments in human capital. Labor market outcomes and earnings can affect human capital investment decisions, which in turn effect skills, productivity, and earnings. Increased investments in the human capital of youth and women is therefore important given Nepal’s recent history, and the interplay between poor labor market conditions, the prospects for youth, and social unrest.
Labor force participation among youth is limited, especially among women (Table 6). On average, only 29 percent of those age 15 to 24, and 53 percent of those age 25 to 34, participate in the labor market. Also, the unemployment rate is highest among young people; while young people accounted for 48 percent of the labor force, they made up 69 percent of those unemployed. Among all age groups, women’s labor force participation (on average 26 percent) is much lower than men’s (54 percent). While trends show increased education among the younger cohort (and hence decreasing labor force participation), the share of young women who neither work nor study has increased in rural areas.58 Cross-country surveys suggest that working Nepalese youth are particularly dissatisfied with their employment status (only 41 percent are satisfied compared to over 80 percent in Bangladesh, Cambodia, and Vietnam).59
Table 6: Key labor market indicators by age and gender
Source: Central Bureau of Statistics 2019, Table 3.6.
Male Female Male Female
Age Group Labor Force Unemployment(Years) Participation Rate Rate
Total 53.8 26.3 10.3 13.115–24 38.9 20.3 19.7 23.925–34 74.9 37.6 11.9 13.935–44 76.8 36.7 7.5 9.945–54 63.4 28.0 5.2 7.655–64 42.2 16.9 5.5 3.565+ 21.1 7.0 3.5 0.6
53
Investing in People to Close the Human Capital Gap
June 2019
Nepal Development Update
World Bank Group

Currently, labor market interventions are relatively limited in Nepal, especially for the poor and vulnerable. Improving the situation of youths and adults, especially adolescent girls and women, will require addressing the challenge of low-productivity employment (which is an area where efforts both on the labor supply and demand sides are needed) through comprehensive programs. In addition to translating increased human capital into growth, these policies will also motivate households to invest in the human capital of their children by showing that there are potential large returns to this investment.
Priority interventions for improving the quality of services
Federalism provides an opportunity to improve access to and quality of services, and to adopt a multisectoral approach to investing in human capital. But there are both opportunities and challenges. Being closer to the people, local governments can adopt a more community-centric approach while planning and budgeting for social services. Thus, resources and services can be targeted more to where they are most needed. Citizens are more empowered to hold elected representatives of the local governments and providers accountable. Federalism also provides an opportunity for services to be delivered in a more coordinated fashion – when they are all delivered by local governments (rather than by multiple central ministries that work in isolation). However, there are also challenges arising from inadequate human resources and weak capacity to plan, budget, and implement programs. In addition to the risks of disruption in service delivery, there are also risks of divergence in the package of services offered throughout the territory, which would jeopardize national objectives in terms of human capital.
To raise the quality of service, it is necessary to (a) invest early in human capital and early childhood development, adopting a multisectoral approach; (b) invest in building the systems that would ensure the availability of quality-assured essential drugs and adequately trained health workers, including in more hard-to-reach areas; (c) invest in the human capital and skills of existing
generations of youths and adults; (d) adopt transparent performance management measures to incentivize service providers; and (e) strengthen coordination across government programs and ensure policy continuity.
(a) Invest early in human capital and early childhood development, adopting a multisectoral approach
A multisectoral approach to early childhood development has been demonstrated to be most effective in enabling children to reach their full potential. This includes interventions not only from health and education, but also from sectors such as agriculture, and water and sanitation, that also impact health, nutrition, and educational attainment. Although this Special Focus has concentrated on the components of the Human Capital Index, Box 2 highlights the importance of a multisectoral approach to investments in human development, including the importance of early childhood development for establishing the foundation for improved human capital. The empirical evidence shows that family planning interventions will help reduce unwanted pregnancies and optimize age at first pregnancy and reduce the risk of children being born small. Quality reproductive health services to mothers including micronutrient supplementation have also been proven to reduce the risk of low-birth-weight children and small-for-gestational-age children.
It is essential to expand cost-effective interventions, specifically, coverage of adequate intake of iron/folic acid to pregnant women. A multisectoral approach also calls for supplementation of other micronutrients to mothers, given the evidence that anemia is not due only to iron deficiency. The government should ensure effective coverage of counseling of pregnant women and mothers of infant and young children for good infant and young child feeding and hygiene practices, including increased access to zinc supplementation during periods of diarrhea. The analysis of the progress of nutrition-sensitive interventions in Nepal during the Multi-Sector Nutrition Plan 2013–2017 (prepared by the NPC) found that the majority of selected nutrition-
54
Investing in People to Close the Human Capital Gap
June 2019
Nepal Development Update
World Bank Group

sensitive indicators increased their coverage. The increases in coverage were for secondary school enrolment, disposal of child feces, handwashing with soap and water, and access to improved sanitation. More remains to be done on reducing early marriage and installing well-functioning water supply systems, which currently cover only one-third of targeted populations. Nutrition-
Box 2. The importance of early childhood development programs for building human capital
Boosting Nepal’s human capital will require critical investments to increase the coverage and quality of early childhood development (ECD) interventions. There is compelling scientific and economic evidence that shows that experiences in the early years have a profound impact on brain development, affecting learning, health, adult productivity and, ultimately, the economic competitiveness of nations. Focusing on human capital during the first 1,000 days of a child’s life, therefore, is one of the most cost-effective investments governments can make. Boosting early childhood outcomes requires a multisectoral approach, focusing on the provision of services as well as focusing on providing incentives and removing barriers for households to access these services. Examples of interventions include services for pregnant and lactating mothers; maternal, and child pre- and postnatal care; daycare, preschool, health, and nutrition programs for mothers or children; parental education on how to engage in early stimulation activities with young children; and safety nets to support welfare and nudge households to invest.
Global evidence provides some lessons for effective ECD provision, highlighting the need for an integrated approach. In some contexts, community-based playgroups have generated sustained outcomes at a low cost. In Indonesia, one such program positively affected children’s language, socioemotional, and cognitive skills; those from disadvantaged backgrounds benefited more in the short and long term.a In others, cash transfers can be an effective way to support early childhood development for the poorest children. A cash transfer program in Bangladesh significantly reduced the incidence of
Sources: a. Brinkman et al. 2017. b. Ferre and Sharif 2014.
sensitive programs of other sectors can help scale-up nutrition-specific interventions and create a stimulating environment in which young children can grow and develop to their full potential, so it is equally important to generate evidence of, and implement at scale, effective nutrition-sensitive interventions.
wasting among children 10 to 22 months old.b Finally, holistic multisectoral approaches are effective. Chile’s Crece Contigo program integrates the services provided by the health, education, welfare, and protection services so that a child’s first contact with the system occurs in utero, during the mother’s first prenatal visit.
The government is taking steps to expand the provision of quality early education. Under the School Sector Development Plan, early grade reading assessments were undertaken in 3,600 schools across the country and results disseminated within communities. The government is also implementing the national early grade reading program, which aims to address the problem of low school preparedness. The programincludes provision of free textbooks and supplementary early grade reading materials, teacher training in early grade reading, and book corners. Through the child grant (see below), the government is also providing support to promote investments in young children’s capital. To boost the impacts of these investments, it will be essential to ensure social safety nets reach the poor and vulnerable and provide information and incentives to use services. Nepal has made significant progress in expanding maternal and child health services, including the coverage of vaccinations, prenatal care visits, and institutional delivery. Furthermore, the government has prepared a national multisectoral action plan for nutrition to guide sectoral investments for maximum coordination and convergence of interventions. Recognizing the importance of investing in the early years, a multisectoral nutrition project targeting the first 1,000 days of a child’s life is being implemented with the support of the World Bank.
55
Investing in People to Close the Human Capital Gap
June 2019
Nepal Development Update
World Bank Group

Figure 48. Key Interventions for the Early Years at Different Stages of development
Source: Denboba et. al. 2014.
NUTRITION
SOCIAL PROTECTION
EDUCATION
WATER AND SANITATION
HEALTH
Pregnancy 24 Months12 MonthsBirth 72 Months54 Months36 Months
Complementary Feeding Adequate Nutritious and Safe Diet
Therapeutic zinc supplementation for diarrhrea
Prevention and treatment and acute malnutrition (moderate and severe)
Micronutrients: supplementation and fortification
Exclusive breast feeding
Counseling on adequate diet during pregnancy
Iron folic acid for pregnant mothers
Antenatal visits safe wa
Attended deliveries
Immunizations
Deworming
Planning for family size and spacing; Access to healthcare; Prevention and treatment of parental depression
Access to safe water; Adequate sanitation; Hygiene/Handwashing
Maternal education
Education about early stimulation, growth and development
Early childhood and pregnancy programs
Continuity to quality primary education
Birth Registration
Parental leave and adequate childcare
Child protection services; Social assistance transfer programs
There should also be attention to adolescent health and nutrition and to maternal health and nutrition before and during pregnancies, which have long-lasting impacts on the development of children. Nutrition-specific priority interventions targeted to pregnant women and mothers of infants and young children should focus on cost-effective and evidence-informed interventions. Nepal should strengthen critical interventions that focus on reducing stunting and anemia, including prenatal micronutrient supplementation, protein supplementation, counseling on infant and young child feeding and hygiene, and intermittent presumptive treatment of malaria in pregnancy in malaria-endemic regions. This includes nutrition-specific interventions for all women of reproductive age focused on iron and folic acid supplementation for non-pregnant women, as well as staple food fortification for the general population that supports overall balanced nutrition.
To further reduce stunting, Nepal needs to adopt an integrated approach to improved nutrition. A recent study60 reported that rapid
60 Headey and Hoddinott 2015.
asset accumulation, consistent with a rapid growth in household income, was important for increasing all nutrition indicators. Second, educational improvement, particularly maternal education, also helped to improve nutrition outcomes. In addition, impressive improvements in access to health care services including prenatal, neonatal, and postnatal care through rapid expansion of health extension workers as well as financial incentives have helped reduce stunting. Improved sanitation, particularly a reduction in open defecation, has also helped reduce undernutrition. Finally, social protection programs, such as the child grant (one of the five Social Security Allowances, which is provided to all children under five in selected districts and to all Dalit children under five elsewhere) can contribute positively to reducing malnutrition by promoting good feeding practices and protecting the income of the poor. Looking forward, to ensure high-quality nutrition services, it will be important to adopt an integrated approach to service delivery that improves coordination across agencies to support well-rounded diets including improved infant and young child feeding practices.
56
Investing in People to Close the Human Capital Gap
June 2019
Nepal Development Update
World Bank Group

A cross-sectoral and coordinated approach could include integrating nutrition services with other early childhood interventions at the local government levels to maximize administrative efficiency and create a protective environment for children to thrive to their fullest potential. For the integration and improved delivery of services across human capital dimensions, a national identification system comprising two instruments – the civil identification system and the national population registry – is essential to ensure individuals are uniquely identified in the system. Interoperability between the identification systems and program information systems (health, education, Social Security Allowances, health insurance, scholarships, and so forth) can then foster integration and boost efficiency.
(b) Invest in the systems needed to supply quality health services
(c) Invest in the human capital and skills of existing generations of youths and adults
Invest in the systems necessary to improve the availability of key inputs for the delivery of quality health services. Evidence shows that even when households have access to health services, use of services does not always translate to improved outcomes mainly due to the poor quality of the services. For instance, access to institutional delivery failed to improve maternal mortality because of weak capacity of health facilities to manage complications. To improve access to quality health services, Nepal plans to expand the Basic Health Services Package that is to be available to all citizens, and to set minimum facility standards to deliver those services. This will require capital investments, but construction and purchasing of equipment is fairly easy. The more challenging task involves the logistics of ensuring all the necessary inputs are in the right place at the right time and are of sufficient quality.
Two inputs in particular that are absolutely essential for the delivery of quality services are (i) quality health commodities, including pharmaceuticals, medical supplies, vaccines, family planning commodities, and the like; and (ii) knowledgeable and competent health workers. Ensuring the availability of these inputs in sufficient quantity and timeliness, and that meet the necessary
standards, was already a challenge. The transition to a federal system presented the possibility for subnational governments to derive their own solutions and possible innovations. At the same time, the federal structure has become more complex in its need to define responsibilities, coordinate necessary action, deal with hundreds more stakeholders, compete in local markets for supplies and human resources, and other complicating factors. Addressing these challenges requires (i) developing a process by which coordination across levels of government can coordinate functions and resolve problems such as a national health assembly; (ii) investing in systems that would be useful across the different stakeholders for making informed and coordinated decisions such as a quality assurance system for key health inputs such as drugs and health education and training, logistics, and management information systems and framework agreements for centralized procurement for local purchasing; (iii) supporting the development of tools that would make it easier to provide and measure the delivery of quality services, such as simple decision charts, checklists, and citizen accountability and redressal mechanisms; and (iv) promoting innovations to address shortages, particularly in order to reach areas, such as strengthening community health workers, telemedicine, and drone deliveries.
Ensuring human capital investments effectively support inclusive growth requires labor market policies that address challenges linked to labor market participation (especially for adolescent girls and women). It also requires addressing the challenge of low-productivity employment (which is an area where efforts both on the labor supply and demand sides are needed). In addition to translating increased human capital into growth, these policies can also motivate households to invest in the human capital of their children by showing that there are potential large returns to this investment.
While investments in future generations have proven to be the most beneficial, attention
57
Investing in People to Close the Human Capital Gap
June 2019
Nepal Development Update
World Bank Group

should also be paid to increasing the human capital of existing generations with skills deficits. Programs that promote increased productivity among youths and adults come in various shapes, but those that are most effective at helping the poor and vulnerable improve their living conditions typically combine a series of areas to address the multiple barriers faced in labor markets. Packages typically combine some of the following: technical skills training, basic literacy, on-the-job experience, development of agency and self-efficacy (socio-emotional skills), preparation of business plans, coaching for microentrepreneurs or the self-employed, grants or loans, and access to financial services.
The newly announced Prime Minister’s Employment program is establishing Employment Service Centers in every local government and boosting the employability of youth. These Employment Service Centers have the potential to address inequities in access to information related to employment opportunities. Partnerships with the private sector to both identify skills areas that are needed and to provide the skills training both directly and on-the-job need to be explored. With a large number of youths entering the labor market every year, it is also essential that the private sector generates new and better jobs. Government policies can be used to incentivize the private sector to develop labor-intensive jobs.
(d) Adopt transparent performance management measures to incentivize service providers
61 Sabarwal et al. 2019.
Strong incentives and accountability mechanisms will be critical across all sectors. Nepal could establish incentive mechanisms that motivate teachers or health care providers, engage students in learning, and encourage households to invest in various aspects of human capital. There is a need to realign and synergize incentives at each level of access to services and service delivery toward the same objective.
In the education sector, reforms are needed to update curriculums and develop an exam system
that encourages conceptual understanding and development of cognitive skills, instead of rote learning. It also requires addressing the challenges of inadequate teacher performance management systems, a supply-driven approach to school financing, and insufficient support to the training of science and math teachers. Targeted support to teachers that enhances their skills and motivation to teach to the level of the child would yield strong results. This necessitates aligning incentives at each level of the education service delivery chain toward a common goal – improved learning. A key measure would entail implementing transparent performance management where teacher rewards are linked to student learning and time on task. This would help stimulate better teaching effort in the classroom (see Chile example in the next paragraph). Similar performance-based incentives could be implemented at the school and local government levels. The Government of Nepal through its School Sector Development Program is putting in place processes and systems to track teacher time spent teaching and improve existing policies around teacher deployment.
Recent data show that school leadership can be significantly enhanced in terms of the extent to which head teachers take ownership of the learning of lagging students and of improving teacher performance.61 There is also potential to significantly improve the school grants management system by basing grant allocations on a robust funding formula, introducing a performance-based component, and building a system to verify compliance on funds eligibility and utilization. For example, in the 1990s, Chile implemented a similar program that awards a bonus to schools and to all teachers in the school for outperforming other schools on a national student exam. Schools serving students with similar demographic characteristics in similar settings are grouped together. Teachers receive a bonus (not a permanent salary increase) equivalent to 5 to 7 percent of their annual salary. As much as 90 percent of the bonus award is divided among teachers, and the school director determines how to use the remaining 10 percent. Chile’s program has had a cumulative positive
58
Investing in People to Close the Human Capital Gap
June 2019
Nepal Development Update
World Bank Group

62 Thapa et al. 2019. 63 Shrestha 2017.
impact on student performance in schools with reasonably good chances of winning the award. Nepal is building on some of the lessons from countries around the world to improve accountability and efficiency in the education sector. Some of the measures include the introduction of capacity building and performance-based incentives for local governments to pursue quality and equity improvements through activities embedded within the School Sector Development Plan. Notable activities include implementing targeted scholarship schemes for poor and marginalized children at the secondary level, expanding school-based early childhood education, tracking teacher time spent teaching, conducting social audits, and administering conditional grants to community schools that meet minimum accountability requirements with regard to indicators on time spent teaching, student attendance and retention, and textbook availability, among other indicators. Capacity building and conditional grants to local governments are also being tied to open data or information on the flow of conditional grants released from local governments to schools on accessible websites and/or physical spaces, to help strengthen accountability.
Incentives and accountability in health services could be strengthened through the federalism process. The local governments that are responsible for the provision of basic services are better positioned to hold health service providers accountable and are more likely to be responsive to the demands of the community. However, such systems need to be established early on in order to avoid the pitfalls of decentralization in service delivery that are observed in other countries.62 The government can exploit the past experience with piloting social accountability systems in the health sector and build on these to improve accountability of health service providers. Linked to this is the need to ensure there is clarity on what services are to be available, the service standards of the facility, and that the facility has the inputs necessary to deliver those standards. To help subnational governments align with national-level efforts, simple monitoring tools should be developed to
identify and monitor the progress of basic service delivery. The federal Ministry of Health and Population can also lead the way to using improved contracts with autonomous service providers by increasing the use of contracts – with defined service standards and performance benchmarks – with the national-level hospitals that currently receive block grants.
Overall, more evidence-based policy formulation and interventions will require improved monitoring and evaluation functions. In education, this includes measuring learning outcomes, and enhanced assessments, curriculums, and certification. Nepal has taken positive steps toward better measurement of learning by completing several rounds of the National Assessment of Student Achievement. However, there is limited use of these data in guiding policy or practice. This will involve enhanced learning assessment systems that (i) monitor progress in learning outcomes, and (ii) feed this information back, not just to policy makers but also to school administrators and teachers. For example, in Chile, all students in grades 4 and 8 take the Sistema de Medición de la Calidad de la Educación each year. The test identifies the 900 schools scoring in the lowest 10 percent on the tests, and the schools receive special resources. Hence, the data are clearly linked to action. It will also include complementary curriculum and examination reforms. Similar approaches could be adopted for health facilities and the delivery of essential services or preventive care.
Across all sectors, federalism could be used to strengthen accountability and improve efficiency in service delivery tailored to local conditions. Global evidence suggests that building capacity, adopting the right incentives, and strengthening accountability of local leaders are each important for improved service delivery. In Bangladesh, local-level upazilas (administrative regions) implement education plans, but lack of upward flow of accountability creates few incentives for improving education quality.63 Another important lesson is that the federal government can play a
59
Investing in People to Close the Human Capital Gap
June 2019
Nepal Development Update
World Bank Group

role in establishing performance- based goals and targets to support and incentivize local governments. For example, the federal government in Brazil created a uniform tool to measure school-level and municipal performance, based on their national student assessment and pass rates. This was used to set custom targets for each municipality. Various municipalities have independently used this tool to introduce incentive programs in their schools.64 Community-based services and performance-based incentives for service providers could also be adopted for health and nutrition services.
64 Bruns, Evans, and Luque 2011.
(e) Strengthen coordination across the levels of government and programs and ensure policy continuity
Promote coordination within the government and between different levels of government. Promote strong coordination within the federal government and between the federal and local governments and with development partners for effective investment in human capital. Such coordination will ensure complementarity of investments, enable synergies among the various interventions exploited, and most importantly, allow for convergence of interventions in geographic areas/beneficiaries. Ethiopia is one example where the coordination within the government and between government and development partners around the government-led safety net program harnessed synergies. The program brought more than 10 development partners to establish a unified stream of technical assistance in support of the program implementation. The success of the program is such that it was credited with lifting more than 1.4 million people out of poverty. Ensure policy continuity over successive governments. Improving human capital outcomes requires sustained investment over a long period of time, a time horizon usually not well aligned with the political cycle. As such, sustained effort that is beyond the political cycle is required. Often the efforts of countries fail to produce the desired human capital outcomes because of a lack of sustained effort over the political cycle. Key to sustaining efforts over successive governments is
to build a national consensus on key national human capital priorities.
The devolution of many basic service delivery functions to local-level governments is also an opportunity to strengthen the coordination and integration of programs and delivery systems. This integration can contribute to improving the impact of interventions. Indeed, as mentioned, for most human development outcomes – nutrition, education, health, skills, and employment, among others – multisectoral interventions are the most effective. These combine elements focused on the supply side, ensuring services are available and have the quality required, with elements focused on the demand side, ensuring households have the resources and incentives to use the services. They also combine complementary interventions, which together can effectively move the needle for key outcomes (combining education of parents with supply of nutrition services, and with income support for the poorest, for instance). The fact that many basic services will be managed locally provides an opportunity to break sectoral silos and integrate interventions. For instance, scaling up early childhood development programs could include integrating nutrition services with other early childhood interventions at the local government level to maximize administrative efficiency andcreate a protective environment for children to realize their fullest potential. In social protection, the government could assess the possibility of increased coordination across multiple programs and the opportunity to set objectives for programs that go beyond income support and include targets in terms of promoting use of health or education services or adopting particular behaviors (such as good hygiene, or cooking or feeding practices, which are essential to nutrition outcomes).
Well-coordinated and integrated delivery systems can also improve quality, as well as administrative efficiency and oversight. For the integration and improved delivery of services across human capital dimensions, a national identification system is essential. It comprises the national identification system and the civil
60
Investing in People to Close the Human Capital Gap
June 2019
Nepal Development Update
World Bank Group
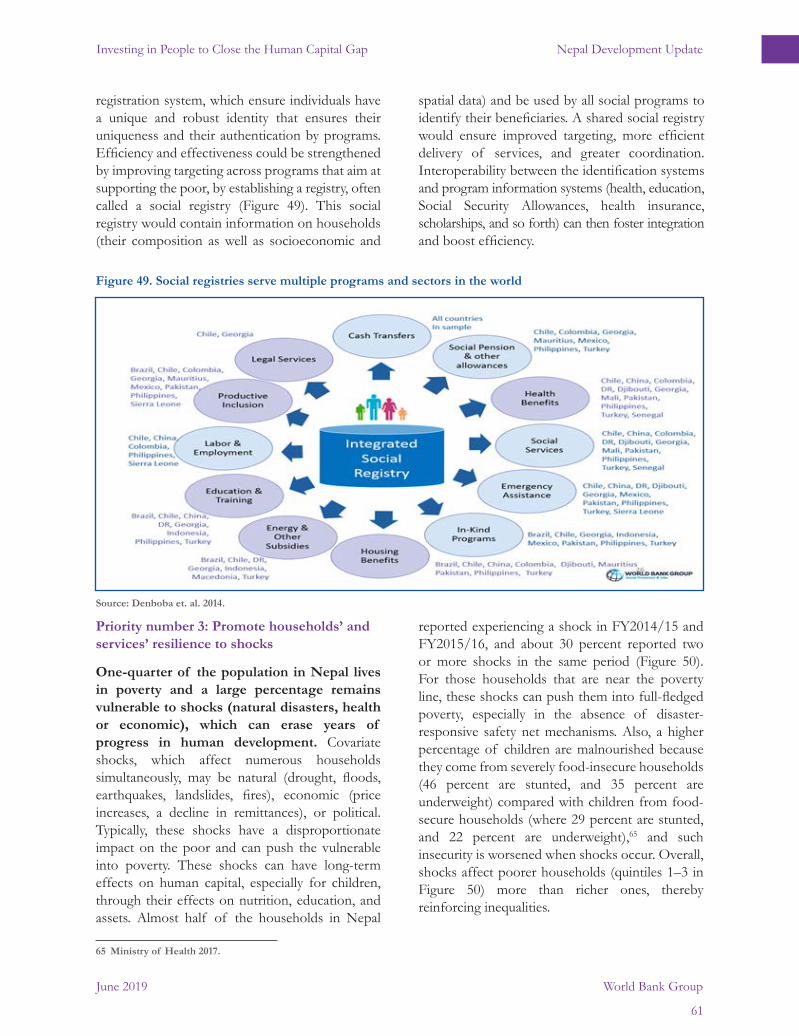
registration system, which ensure individuals have a unique and robust identity that ensures their uniqueness and their authentication by programs. Efficiency and effectiveness could be strengthened by improving targeting across programs that aim at supporting the poor, by establishing a registry, often called a social registry (Figure 49). This social registry would contain information on households (their composition as well as socioeconomic and
Figure 49. Social registries serve multiple programs and sectors in the world
Source: Denboba et. al. 2014.
Priority number 3: Promote households’ and services’ resilience to shocks
One-quarter of the population in Nepal lives in poverty and a large percentage remains vulnerable to shocks (natural disasters, health or economic), which can erase years of progress in human development. Covariate shocks, which affect numerous households simultaneously, may be natural (drought, floods, earthquakes, landslides, fires), economic (price increases, a decline in remittances), or political. Typically, these shocks have a disproportionate impact on the poor and can push the vulnerable into poverty. These shocks can have long-term effects on human capital, especially for children, through their effects on nutrition, education, and assets. Almost half of the households in Nepal
reported experiencing a shock in FY2014/15 and FY2015/16, and about 30 percent reported two or more shocks in the same period (Figure 50). For those households that are near the poverty line, these shocks can push them into full-fledged poverty, especially in the absence of disaster-responsive safety net mechanisms. Also, a higher percentage of children are malnourished because they come from severely food-insecure households (46 percent are stunted, and 35 percent are underweight) compared with children from food-secure households (where 29 percent are stunted, and 22 percent are underweight),65 and such insecurity is worsened when shocks occur. Overall, shocks affect poorer households (quintiles 1–3 in Figure 50) more than richer ones, thereby reinforcing inequalities.
spatial data) and be used by all social programs to identify their beneficiaries. A shared social registry would ensure improved targeting, more efficient delivery of services, and greater coordination. Interoperability between the identification systems and program information systems (health, education, Social Security Allowances, health insurance, scholarships, and so forth) can then foster integration and boost efficiency.
65 Ministry of Health 2017.
61
Investing in People to Close the Human Capital Gap
June 2019
Nepal Development Update
World Bank Group

Figure 50. Nepal is vulnerable to shocks that can erase years of progress made in human development
Source: Denboba et. al. 2014.
The lack of a poverty focus of Nepal’s existing social protection programs is compounded by the inflexibility of services in times of disasters. The 2015 earthquakes and the recent floods have demonstrated that while the government was able to mobilize significant external aid, the existing programs could not be mobilized to provide disaster relief. International experience shows that social protection programs can be effective channels for the delivery of disaster relief, and that it can also reduce loss of productive assets by providing immediate assistance post-disaster. The existing programs in Nepal are not flexible during disasters due to rigid program design and fund flow arrangements, and limited coordination between government agencies responsible for disaster management and social protection.
To promote resilience to shocks, it will be necessary to establish adaptive social protection programming
as part of the national disaster risk management strategy, and to ensure infrastructure and facilities for human capital services are resilient to shocks.
(a) Establish adaptive social protection programming as part of the disaster risk management strategy.
Adaptive social protection programming should be established as an integral part of a disaster risk management (DRM) strategy and implementation plan. International experience has shown that regular, adequate, and well-targeted social protection programs can help build community and household resilience to shocks, and adaptive social protection programs can provide timely and efficient assistance to protect well-being after shocks occur (as illustrated by the green line in the bottom of Figure 51). The “adaptive” approach to social protection requires integration with disaster risk management and climate change adaptation
62
Investing in People to Close the Human Capital Gap
June 2019
Nepal Development Update
World Bank Group

strategies. Existing programs in Nepal are neither explicitly designed to reduce poverty and build resilience, nor to be scalable in the aftermath of a shock.
66 Based on recommendations of policy note on “Adaptive Social Protection for Effective Disaster Risk Management,” Pandey and Lakhey (2018).67 Xu et al. 2005, p1.
Recent institutional developments position the government to efficiently use social protection as one of its instruments to respond to shocks and disasters. The 2017 Disaster Risk Reduction and Management Act includes a provision to target response to vulnerable groups. It also provides for the establishment of a National Disaster Risk Reduction Management (DRRM) Authority to coordinate all disaster management actions. In addition, the Ministry of Home Affairs is now responsible for administering the largest social protection program (the Social Security Allowances Program), in addition to its ongoing responsibility for planning and implementing all DRM-related activities. This provides a unique window of opportunity to establish “adaptive” social protection programs as an integral part of the government’s DRM strategy. The following activities would be required: (a) establish mechanisms for a social registry to identify vulnerable households that would need temporary support when shocks occur, (b) implement adaptive programs that build resilience and can be scaled up for rapid response, (c) develop financing mechanisms to ensure timely response, and (d) establish institutional links between DRM and social protection at all three levels of government.66
Figure 51. Adaptive social protection protects against destitution after a shock occurs
Figure 52. Percentage of households’ total health and medical expenditures as a share of non-food household consumption expenditures using different thresholds: Nepal (NLSS 2010/2011)
Source: Pandey and Lakhey 2018.
Source: Adapted from Adhikari and Sapkota 2018.
The risk of catastrophic health expenditures in Nepal due to an illness or injury is high. As shown in Figure 52, 55 percent of total health spending is spent directly by households out of pocket (OOP). According to the World Health Organization, “when people have to pay fees or copayments for health care, the amount can be so high in relation to income that it results in financial catastrophe for the individual or the household. Such high expenditure can mean that people must cut down on necessities such as food and clothing or are unable to pay for their children’s education.”67 At the same time, and as shown in Figure 50, illness or injury of a household member is a shock, not
foreseeable as to when it will happen or the magnitude of the severity. The data from the Nepal Living Standards Survey (NLSS) 2010/11 (the last available) allow an analysis of catastrophic health spending in Nepal. Considering non-food consumption expenditures as a denominator (Figure 52), the proportion of households with
63
Investing in People to Close the Human Capital Gap
June 2019
Nepal Development Update
World Bank Group

catastrophic health spending varies from 20.3 percent (using a threshold of 15 percent) to 9.8 percent (using a threshold of 40 percent for total health expenditures). Detailed analysis using the NLSS 2010/11 highlights some factors that could increase the likelihood of catastrophic health expenditures: (a) households with a greater number of children under age five and of elderly people, (b) Dalit households, (c) residents of the Terai, (d) increased household size, (e) households in the three poorest income quintiles, and (f) no or minimum educational attainment by the head of a household.68
A reoriented health insurance system – with the priority to ensure effective coverage of the poor and vulnerable – could be a means of increasing access to health care and reducing the risk of impoverishment in case of illness or injury. In 2017, the Nepal Health Insurance Act, which established a national health insurance system, was signed into law. The law mandates coverage to all families (including formal and informal workers, and the poorest families). The health insurance system received a block grant to cover the “poor” and collects premiums from other households. The health insurance system has been rolled out to about two-thirds of the country. An average of 5 percent of the total population of Nepal and 17 percent of the total population of the districts that implemented health insurance are currently covered by the system.
In theory, the health insurance system could be a mechanism for increasing access to health care and protecting the poor and vulnerable from catastrophic health expenditures. However, there is no functional system currently operating for defining and identifying the poor. The current system relies on a household survey that is more than seven years old and that only covered part of the country. The principle is good. However, the countries that have such systems that target the poor and other vulnerable groups, such as India, with the PMJAY National Health Protection Scheme, or Vietnam, with the Vietnam Social Health Insurance System, have a regular and credible system of
68 Adhikari and Sapkota 2018.
identifying the poor and other vulnerable groups. Similarly, international experience has shown that national coverage requires the collection of premiums from the formal sector through a taxation system, and a high subsidy without automatic enrollment of those individuals not in the formal sector. Nepal has a good basis to transition to such a system and now has valuable institutional capacity to contract public and private providers to provide an explicit benefits package to an explicit beneficiary group. However, certain fundamental changes are required to transform the system into one that would be effective in mitigating health shocks for the poor and vulnerable. This includes (a) a robust system for defining and identifying the poor in a regular and systematic way, in coordination with the social protection system; and (b) a political and financial agreement to highly subsidize the informal sector above the poverty line and who are at high risk of impoverishment in case of illness or injury. The health insurance system also needs to be coordinated with the free health services and other health and social security schemes to reduce duplication and fragmentation.
(b) Ensure facilities and infrastructure are resilient to shocks and invest in emergency preparedness
When societies face disasters, fragility, or conflict, education and health often suffer the most. This in turn prevents entire generations from achieving their potential. To prevent this, it is important to put in place measures that ensure continuous provision of educational opportunities and health services as early as possible during a crisis. One way to do this is to ensure that disaster-resilient materials are used in the construction of schools and health facilities. This is especially important for Nepal, which is vulnerable to earthquakes and climate change. Building resilience in school and health systems also involves plans for the provision of health services, developing emergency preparedness to support the response and recovery effort, disaster education, securing safe school environments, developing school disaster management plans, and building the capacity of health workers, school teachers, and local educational officers.
64
Investing in People to Close the Human Capital Gap
June 2019
Nepal Development Update
World Bank Group

Improving Competitiveness and Integration with Global MarketsTable 7: Priority interventions to invest in people and scale-up human capital investments
Eliminate barriers for the poor in accessing human capital services
Increase the availability of services in poor and underserved geographic areas
Invest early in human capital and early childhood development, adopting a multisectoral approach
• Increase resources allocated to the local level to ensure sufficient and well-equipped facilities for provision of basic health, education, nutrition, labor, and social protection services by local governments • Assess local needs and revenue capacity to refine the basis for fiscal transfers• Provide capacity support to local governments to improve planning, budgeting, implementation, and monitoring of programs• Support local governments to develop own-revenue capacity • Define and establish a minimum standard of social protection
ECD/Education• Increase the quality and coverage of early childhood education (ECD) • Build capacity of local governments to monitor the quality of early ECD programs• Expand early reading programs that help ensure all children can read by age 10• Evaluate the child grant to strengthen household incentives for investing in human capital.Nutrition• Scale-up cost-effective essential nutrition interventions including iron/folic acid intake for pregnant women and promote the same for non-pregnant women/adolescent girls • Consider prenatal supplementation of other micronutrients for pregnant women and mothers of infant and young children • Increase counseling of pregnant women and mothers of infant and young children for good infant and young child feeding and hygiene practices • Integrate nutrition services with other interventions of early childhood development at the local government levels • Generate evidence of and scale-up effective nutrition-sensitive interventions
Support local government capacity to address geographic disparities
Reform Areas Selected Key Recommendations and Priority InterventionsPriority Number 1: Reduce inequity across gender, social, income, and geographic groups
Priority number 2: Improve the quality of education, health, nutrition, labor, and social protection services from early childhood to adulthood
65
Investing in People to Close the Human Capital Gap
June 2019
Nepal Development Update
World Bank Group
• Across all services design programs that incentivize investments in human capital (education and skills, health, nutrition) by households, while reducing out-of-pocket costs for the poor• Health. Increase public financing to ensure the availability of a standardized and basic health care service package• Reorient the current health insurance system to provide effective coverage of the poor and other vulnerable groups, starting with a systematic means of defining and identifying the poor and vulnerable, in coordination with the social protection system• Social protection. Design or expand social protection programs that incentivize investments in education, health, nutrition for poor households while reducing their out-of-pocket costs• Link design to information or incentives that promote behavioral changes that improve access to services and human capital outcomes• Establish a social registry that includes information on poor households, so that beneficiaries can be effectively identified and targeted

66
Investing in People to Close the Human Capital Gap
June 2019
Nepal Development Update
World Bank Group
Invest in the systems necessary to deliver qualityhealth services
Invest in the human capital and skills of existing generations of youths and adults
Adopt transparent performance management measures to incentivize service providers
Health• Develop a national- and local-level Health Assembly as a means of coordination across different levels of the health system and to resolve problems• Invest in systems needed by all tiers of government for service delivery and informed decision making such as quality assurance systems for supplying drugs, qualification systems for public and private education and training, logistics management and information systems and framework agreements for centralized procurement for local purchasing• Develop testing and dissemination of tools for providing and measuring service quality such as simple decision charts, checklists, and citizen accountability and redressal mechanisms• Promote innovations to address shortages and motivate performance, particularly in harder-to-reach areas, such as strengthening community health workers, telemedicine, drone deliveries, and performance bonuses.
Labor market programs • Strengthen programs that address the multiple constraints faced by the poor and vulnerable in labor markets, especially for youths and women, including skills training, basic literacy, on-the-job experience, development of socio-emotional skills, business development, coaching for the self-employed, grants or loans, and/or access to financial services • Implement the Prime Minister’s employment program, which is establishing an Employment Service Center in every local government and boosting youth employability
Education• Update curriculums and develop an exam system that develops conceptual understanding and cognitive skills, instead of rote learning • Implement a performance-based approach that links teacher rewards to student learning• Adopt performance-based approaches at the school facility and local government levels, to promote quality and equity improvements through the School Sector Development Plan • Strengthen the formula for the school grants management system by introducing a performance-based component, and building a system to verify compliance on funds eligibility and utilization• Implement capacity building and conditional grants to local governments tied to open data or information on conditional grants released to local governments and schools, to strengthen accountability.Health• Draw on past experience with social accountability systems piloted in Nepal’s health sector to improve the accountability of health service providers • Clarify services to be provided where and service standards of the facility• Help subnational governments align with agreed national priorities with development of dashboards and monitoring tools for delivery of specified services• Scale-up and improve performance-based contracting of national hospitals using block grants received as a potential model for Provinces.

67
Investing in People to Close the Human Capital Gap
June 2019
Nepal Development Update
World Bank Group
Strengthen administrative efficiency in health, education, nutrition, and social protection• Build local capacity to plan, budget, and implement in the key sectors • Strength administrative and other data to improve monitoring and evaluation to inform the design of performance-based incentive mechanisms.
Strengthen coordination across government and programs and ensure policy continuity
Establish adaptive social protection programming as part of the disaster risk management strategy
Ensure facilities and infrastructure are resilient to shocks
Across all services • Use conditional grants to strengthen national standards and ensure consistency across regions• Develop simple monitoring tools to assess progress and provide feedback to implementation• Build a national consensus on key national human capital priorities to ensure policy continuity over successive governmentsSocial Protection• Develop a national identification system comprising the national population registry and the civil registry system, to ensure individuals can be uniquely identified• Ensure interoperability between the national identification systems and program information systems (health, education, social security, health insurance, scholarships, etc.) • Develop a social registry to be used by programs in identifying the poor and vulnerable • Increase coordination across programs and set objectives that go beyond income support to include targets to promote use of health or education services or particular behaviors • Establish a social registry to be used by all programs to improve targeting. • Develop a national social protection strategy, building on the National Social Protection Framework, that clarifies the roles of the three levels of government.
Social protection • Establish mechanisms for using the social registry to identify vulnerable households that need temporary support when shocks occur• Build adaptive programs that can be scaled up for rapid response• Develop financing mechanisms to ensure a timely response• Establish institutional links between disaster risk management and social protection at all three levels of governments. • Invest in disease surveillance and disaster preparedness in case of mass casualty events.
Health, education, social protection• Ensure disaster-resilient materials are used in constructing service facilities • Adopt measures to ensure continuous provision of education, health and social protection services and labor market interventions, as early as possible during a crisis• Build resilience by developing disaster management plans, securing safe environments, and building the capacity of health workers, school teachers, local educational officers, local social protection staff, and all local government workers.
Priority Number 3: Promote households’ and services’ resilience to shocks

References............................................................................................................................................................................................................................................................................................................................................................
............................................................................................................................................................................................................................................................................................................................................................
Acemoglu, D. and S. Johnson. 2007. ”Disease and Development: The Effect of Life Expectancy on Economic Growth.” Journal of Political Economy 115 (6): 925-985.
ADB (Asian Development Bank). CPS 2013–2017. Asian Development Bank, Manila.
Adhikari S. R., and V. P. Sapkota. 2018. Dynamics of Impoverishment Impact of Health Care Payments in Nepal: An Analysis of Synthetic Panel Data. Kathmandu: Social Science Baha.
Ajwad, Mohamed Ihsan. 2007. “Attaining the Health and Education Millennium Development Goals inNepal.” South Asia Human Development Sector. World Bank, Washington, DC.
Angdembe, Mirak Raj, Bishnu Prasad Dulal, Kreepa Bhattarai, and Sumit Karn. 2019. “Trends and predictors of inequality in childhood stunting in Nepal from 1996 to 2016.” International Journal for Equity in Health 18:42. https://doi.org/10.1186/s12939-019-0944-z.
Aryal Mohan, Sabarwal Shwetlena, Sharma Uttam, and Maya Sherpa. Forthcoming. “What might Federalism mean for education service delivery in Nepal?” World Bank, Washington, DC. Asian Development Bank CPS 2013–2017.
Baird, S., J. H. Hicks, M. Kremer, and E. Miguel. 2016. “Worms at work: Long-run impacts of a child health investment.” The Quarterly Journal of Economics 131 (4): 1637–1680.
Becker. 1992. The Economic Way of Looking at Life. Department of Economics, University of Chicago, Nobel Lecture. December 9, 1992.
Brinkman, Sally Anne, Amer Hasan, Haeil Jung, Angela Kinnell, and Menno Pradhan. 2017. “The Impact of Expanding Access to Early Childhood Education Services in Rural Indonesia.” Journal of Labor Economics 35 (S1): 305–35.
Bruns, B., D. Evans, and J. Luque. 2011. Achieving world-class education in Brazil: The next agenda. Washington, DC: World Bank.
Camilli, Gregory, Sadako Vargas, Sharon Ryan, and W. Steven Barnett. 2010. “Meta-Analysis of the Effects of Early Education Interventions on Cognitive and Social Development.” Teachers College Record 112(3): 579–620.
Chen, Andrew. 2012. “The Costs of Class: Private Schooling, Parental Choice, and Class Aspirations among Kathmandu’ s Working Poor.” SIT Study Abroad. https://digitalcollections.sit.edu/cgi/viewcontent.cgi?referer=https://www.google.bt/&httpsredir=1&article=2665&context=isp_collection.
68
Investing in People to Close the Human Capital Gap
June 2019
Nepal Development Update
World Bank Group

Central Bureau of Statistics. 2019. “Report on the Nepal Labor Force Survey 2017/18.” Central Bureau of Statistics, Kathmandu.
Denboba, Amina, Rebecca K. Sayre, Quentin T. Wodon, Leslie K. Elder, Laura B. Rawlings, and Joan Lombardi. 2014. Stepping up Early Childhood Development: Investing in Young Children for High Returns. Washington, D.C.: World Bank and Children’s Investment Fund.
Elder, Sara, Valentina Barcucci, Yonca Gurbuzer, Yves Perardel, and Marco Principi. 2015. Labor Market Transitions of Young Women and Men in Asia and the Pacific. Work4Youth Publication 19. Geneva: International Labor Office. Ferre, Celine, and Sharif Iffath. 2014. “Can Conditional Cash Transfers Improve Education and Nutrition Outcomes for Poor Children in Bangladesh? Evidence from a Pilot Project.” World Bank, Washington, DC.
Flabbi and Gatti. 2018. A Primer on Human Capital. Policy Research Working Paper 8309. Washington, DC: World Bank. Flash Reports. Various Years. Nepal Education Management Information System. Ministry of Education, Kathmandu, Nepal.
Gertler, P., J. Heckman, R. Pinto, A. Zanolini, C. Vermeerch, S. Walker, S. M. Chang, and S. Grantham-McGregor. 2014. “Labor Market Returns to an Early Childhood Stimulation Intervention in Jamaica.” Science 344 (6187): 998–1001.
Headey, D. D., and J. Hoddinott. 2015. “Understanding the Rapid Reduction of Undernutrition in Nepal, 2001–2011.” PLOS ONE 10 (12). e0145738. https://doi.org/10.1371/journal.pone.0145738.
Kraay, A. 2018. Methodology for a world bank human capital index. Policy Research Working Paper 8593. Washington, DC: World Bank.
Leite, Phillippe, T. George, C. Sun, T. Jones, and K. Lindert. 2017. “Social registries for social assistance and beyond: a guidance note and assessment tool.” In English. Social Protection and Labor Discussion Paper No. 1704. World Bank Group, Washington, DC.
Ministry of Agriculture. 2018. “Status Report on Food and Nutrition Security in Nepal.” Ministry of Agriculture, Land Management and Cooperatives, Kathmandu, Nepal.
Ministry of Education. Various Years. Flash Reports. Nepal Education Management Information System, Ministry of Education, Kathmandu, Nepal.
Ministry of Education. Various Years. “Nepal National Assessment of Student Achievement.” Ministry of Education, Kathmandu, Nepal.
Ministry of Health and Population. 2018. “Progress of the Health Sector in FY 2017/18. National Annual Review Report – 2018 (2075 BS).” Government of Nepal Ministry of Health and Population, Kathmandu, December. https://nhssp.org.np/Resources/HPP/Health_Sector_Progress_Report_2018.pdf.
69
Investing in People to Close the Human Capital Gap
June 2019
Nepal Development Update
World Bank Group

Ministry of Health, Nepal; New ERA; and ICF. 2017. Nepal Demographic and Health Survey 2016. Ministry of Health, Kathmandu, Nepal. https://www.dhsprogram.com/pubs/pdf/fr336/fr336.pdf
Mohan, Aryal, Sabarwal Shwetlena, Sharma Uttam, and Maya Sherpa. Forthcoming. “What Might Federalism Mean for Education Service Delivery in Nepal?” World Bank, Washington, DC.
NDHS (National Demographic Health Survey). 2016. “Nepal Human Development Note.” 2013. World Bank, Washington, DC.
Nores, Milagros, and W. Steven Barnett. 2010. “Benefits of Early Childhood Interventions Across the World: (Under) Investing in the Very Young.” Economics of Education Review 29: 271-82.
Pandey, J., and S. Lakhey. 2018. “Adaptive Social protection for Effective Disaster Risk Management.” World Bank, Washington, DC.
Raju, Dhushyanth, and Jasmine Rajbhandary. Eds. 2018. Youth Employment in Nepal. International Development in Focus. Washington, DC: World Bank.
Romer. 2015. Human Capital and Knowledge. https://paulromer.net/human-capital-and-knowledge/.Sabarwal, S., T. M. Asaduzzaman, Deepika Ramachandran, and Unika Srestha. 2019. “How Do School Leaders Approach Decision-making? Vignettes from Nepal & Bangladesh.” World Bank, Washington, DC.
Shrestha, Unika. 2017. “Beyond Politics: The Role of Teachers’ Unions in Promoting Quality Education.” Background note, World Bank, Washington, DC
Thapa, R., K. Bam, P. Tiwari, T. K. Sinha, and S. Dahal. 2019. “Implementing Federalism in the Health System of Nepal: Opportunities and Challenges.” International Journal of Health Policy and Management 8 (4): 195–198.
Walker, T., U. Khadka, and J. Pandey. 2017. “Risk and vulnerability in Nepal.” World Bank, Washington, D.C.
World Bank. 2007. Global Monitoring Report – Millenium Development Goals: Confronting the Challenges of Gender Equality and Fragile States. World Bank. Washington, D.C.
World Bank. 2018. “Creating Markets in Nepal – Country Private Sector Diagnostic.” World Bank, Washington, DC.
World Bank. 2013. “Nepal Human Development Note.” World Bank, Washington, DC.
World Bank. 2014. “Public Expenditure Tracking and Quantitative Service Delivery Surveys in Nepal’s Education Sector.” World Bank, Washington, DC.
World Bank. 2016a. “Moving up the Ladder: Poverty Reduction and Social Mobility in Nepal.” World Bank,Washington, DC.
70
Investing in People to Close the Human Capital Gap
June 2019
Nepal Development Update
World Bank Group

World Bank. 2016b. 2015/16 Global Monitoring Report. Washington, DC: World Bank.
World Bank. 2017. World Development Report 2018: Learning to Realize the Education’s Promise. Washington, DC: World Bank.
World Bank Human Capital Project. 2018. http://www.worldbank.org/en/publication/human-capital. World Bank. 2019. “Africa Human Capital Plan.” World Bank. Washington, DC.
Xu, K., D. B. Evans, G. Carrin, and A. M. Aguilar-Rivera. 2005. Designing Health Financing Systems to Reduce Catastrophic Health Expenditures. Geneva: World Health Organization.
71
Investing in People to Close the Human Capital Gap
June 2019
Nepal Development Update
World Bank Group
