nersc xt3/xt4 benchmarking
TRANSCRIPT

NERSC XT3/XT4 Benchmarking
Harvey WassermanNERSC
Lawrence Berkeley National Laboratory
The 1st Annual Cray Technical Workshop - USANashville, TN
February 28, 2007This work was supported by the Director, Office of Science, Office of Advanced Scientific Computing Research of the U.S. Department of Energy under Contract No. DE-AC02-05CH11231.
NATIONAL ENERGY RESEARCH SCIENTIFIC COMPUTING CENTER
Overview
• Benchmarking @ NERSC
• XT4 Description
• XT3 Results

NATIONAL ENERGY RESEARCH SCIENTIFIC COMPUTING CENTER
Advertisement
• SC07 submissions open March 12• 2-part submission process for papers:
– Paper abstracts due Friday, April 6– Manuscript upload due Monday, April 9
• Submissions: http://www.sc-submissions.org• Info: http://sc07.supercomputing.org
SC07.SUPERCOMPUTING.ORG NOVEMBER 10 -16, 2007 RENO, NEVADA
NATIONAL ENERGY RESEARCH SCIENTIFIC COMPUTING CENTER
Science-Driven Computing Strategy
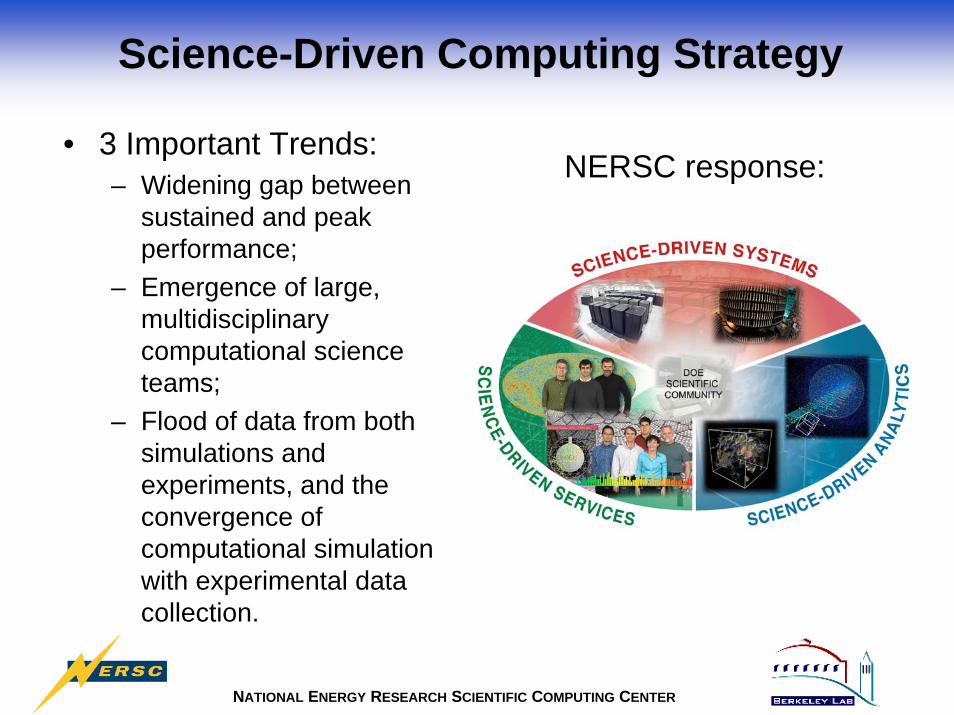
• 3 Important Trends:– Widening gap between
sustained and peak performance;
– Emergence of large, multidisciplinary computational science teams;
– Flood of data from both simulations and experiments, and the convergence of computational simulation with experimental data collection.
NERSC response:

NATIONAL ENERGY RESEARCH SCIENTIFIC COMPUTING CENTER
Science Driven System Architecture Group
• Combines the resources of NERSC with the Computational Research Division's Future Technologies group and Scientific Computing Groupto – better understand the requirements of the NERSC workload,
– assess emerging system technologies, and
– use the NERSC workload to drive changes in computing architecture.
• http://www.nersc.gov/projects/SDSA

NATIONAL ENERGY RESEARCH SCIENTIFIC COMPUTING CENTER
SDSA Group Activities (1 of 2)
• Improve selection process for new systems through stewardship of NERSC benchmark codes.
• Establish a systematic process for using workload characterization data to select future benchmarks.
• Improve understanding of the NERSC workload through development of non-invasive data collection tools and data mining methods for extracting useful information from accumulated workload data.

NATIONAL ENERGY RESEARCH SCIENTIFIC COMPUTING CENTER
SDSA Group Activities (2 of 2)
• Apply performance modeling to characterize system performance and application requirements.
• Work with the NERSC User Services Group to refine "best practices” in parallel programming and I/O techniques to fully exploit the performance potential of current systems.
• Encourage vendors to design systems better suited to scientific computation by supplying analyses of algorithm requirements (current and future), bottleneck analyses, and better understanding of the NERSC workload.
NATIONAL ENERGY RESEARCH SCIENTIFIC COMPUTING CENTER
NERSC 5

NATIONAL ENERGY RESEARCH SCIENTIFIC COMPUTING CENTER
January 16, 2007
NERSC-5: franklin.nersc.gov
• 9762 Dual Core Nodes = 19,524 CPUs (40 service)• 102 cabinets• 2.6-GHz Opterons at 2.6 GHz• 4 GB of DDR-2 memory per compute node• Seastar 2.1 Interconnect• Cray Storage and Resource Management Center of
Excellence

NATIONAL ENERGY RESEARCH SCIENTIFIC COMPUTING CENTER
Franklin Status
• Installation underway, system unavailable.
• All XT4 results mentioned here are from Jaguar XT4 and Cray internal system.

NATIONAL ENERGY RESEARCH SCIENTIFIC COMPUTING CENTER
NERSC-5 Benchmarks• Application Benchmarks (concurrencies):
– CAM3 - Climate model, NCAR (56, 240)– GAMESS - Computational chemistry, Iowa State (64, 384)– GTC - Fusion, PPPL (64, 256)– MADbench - Astrophysics (CMB analysis), LBL (64, 256, 1024)– MILC - QCD, multi-site collaboration (64, 256, 2048)– Paratec - Materials science,developed LBL/UCB (64 & 256)– PMEMD – Life Science, U NC-Chapel Hill (64, 256)
• Micro benchmarks test specific system features:– Processor, Memory, Interconnect, I/O, Networking
• Composite Benchmarks:– Sustained System Performance Test (SSP), Effective System
Performance Test (ESP), Full Configuration Test, Throughput Testand Variability Tests
• All codes used for selection, factory tests, on-site acceptance tests, and continual monitoring.

NATIONAL ENERGY RESEARCH SCIENTIFIC COMPUTING CENTER
NERSC’s SSP Metric
• Sustained System Performance– Geometric Mean of the processing rates for 7 of the
benchmarks with concurrencies in the range 64 - 1024 processors.
• Franklin SSP: expected to be ~16 TF– Almost 10 Times all of NERSC’s Sustained Performance.– Seaborg = .89 TF– Bassi ~ .8 TF

NATIONAL ENERGY RESEARCH SCIENTIFIC COMPUTING CENTER
LBNL-62500 (2007)

NATIONAL ENERGY RESEARCH SCIENTIFIC COMPUTING CENTER
Code CI % of Peak Note
CAM 0.56 9-11 Larkin/Levesque
GAMESS 0.17 4-5 “GTC 1.2 15-21 “MADBENCH 1.7 65-70 “MILC 2.1 15-20 “PARATEC 1.5 62-66 “PMEMD 1.4 22 HJW*
NERSC-5 Benchmarks
• Data obtained using PAT on Cray XT3 (*XT4) Jaguar.
• CI = Computational Intensity = FLOPS / Memory Reference
NATIONAL ENERGY RESEARCH SCIENTIFIC COMPUTING CENTER
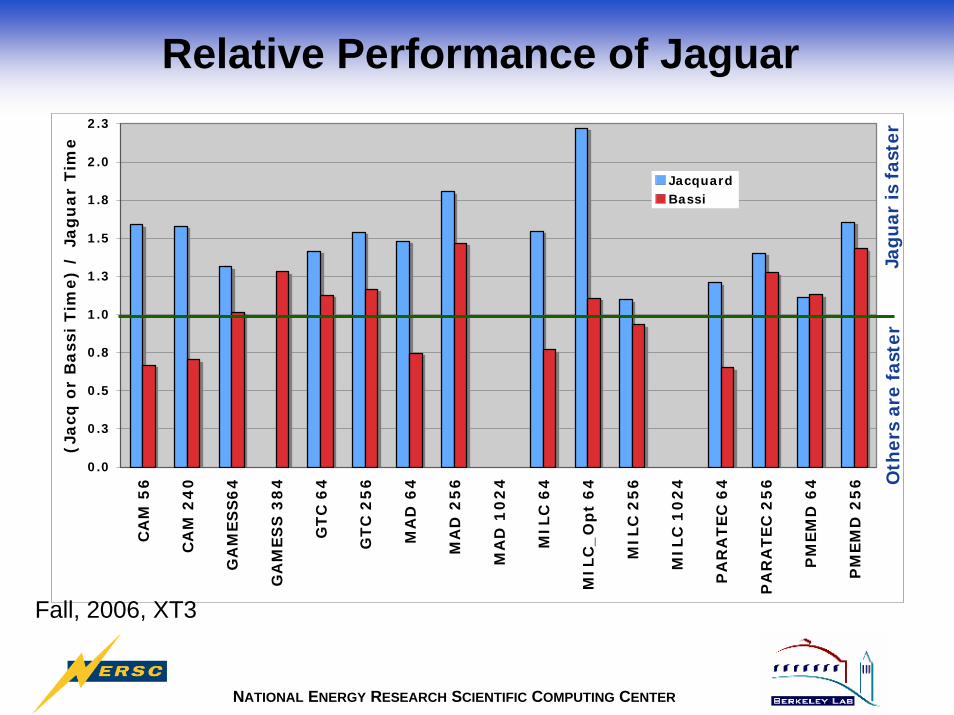
Systems
• Jacquard: Linux Networx 2.2-GHz dual-processor (single-core) AMD Opteron, Infiniband 4x, 6 GB memory per node, pathscale/2.4, 712 processors total, 4.4 GFLOPS/processor.
• Bassi: IBM p575 1.9- GHz POWER 5 system, 8-processor nodes (with 32GB memory each), 888 processors total, 7.6 GFLOPS/processor.
• Jaguar: CRAY XT3: 2.6-GHz dual-core AMD Opteron, 4 GB memory per node, pgi/6.1.6, 5.2 GFLOPS/processor,
NATIONAL ENERGY RESEARCH SCIENTIFIC COMPUTING CENTER
0.0
0.3
0.5
0.8
1.0
1.3
1.5
1.8
2.0
2.3
CA
M 5
6
CA
M 2
40
GA
MES
S6
4
GA
MES
S 3
84
GTC
64
GTC
25
6
MA
D 6
4
MA
D 2
56
MA
D 1
02
4
MIL
C 6
4
MIL
C_
Op
t 6
4
MIL
C 2
56
MIL
C 1
02
4
PA
RA
TEC
64
PA
RA
TEC
25
6
PM
EM
D 6
4
PM
EM
D 2
56
(Jacq
or
Bass
i Tim
e)
/ J
ag
uar
Tim
e
JacquardBassi
Relative Performance of Jaguar
Jagu
ar is
fas
ter
Oth
ers
are
fast
er
Fall, 2006, XT3
NATIONAL ENERGY RESEARCH SCIENTIFIC COMPUTING CENTER
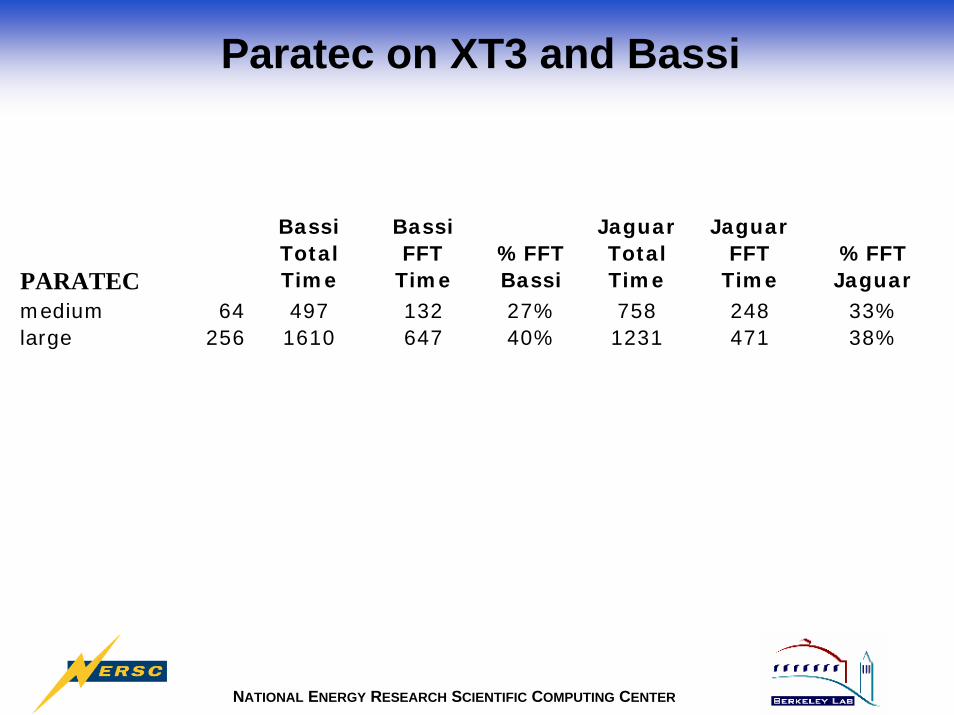
Paratec on XT3 and Bassi
PARATEC
Bassi Total Time
Bassi FFT
Time%FFT Bassi
Jaguar Total Time
Jaguar FFT
Time%FFT Jaguar
medium 64 497 132 27% 758 248 33%large 256 1610 647 40% 1231 471 38%

NATIONAL ENERGY RESEARCH SCIENTIFIC COMPUTING CENTER
Additional Paratec Results
NATIONAL ENERGY RESEARCH SCIENTIFIC COMPUTING CENTER
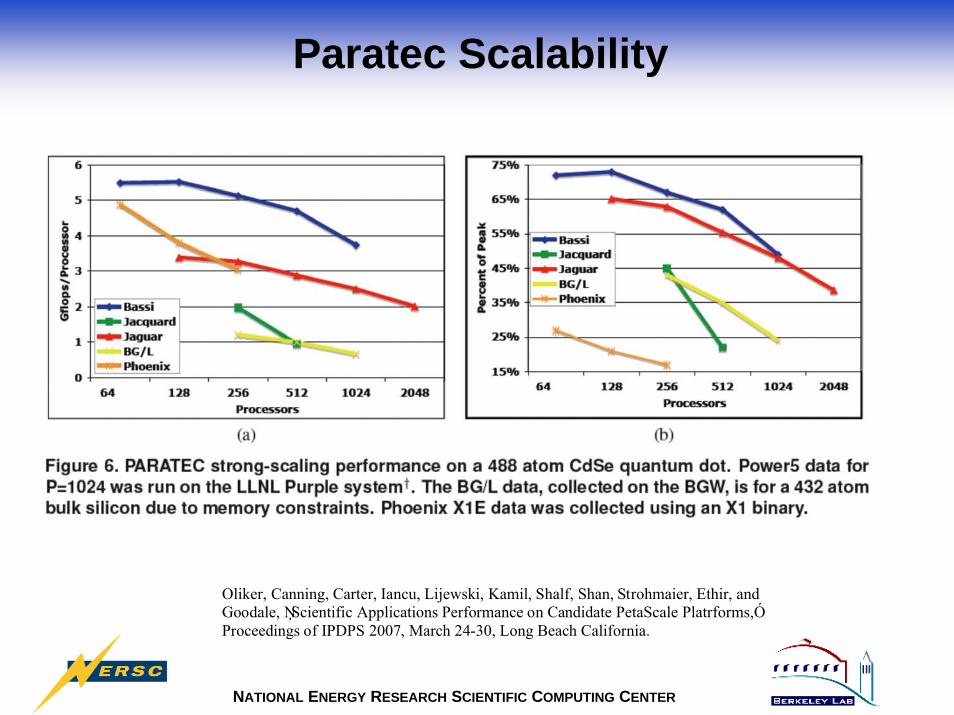
Paratec Scalability
Oliker, Canning, Carter, Iancu, Lijewski, Kamil, Shalf, Shan, Strohmaier, Ethir, and Goodale, ŅScientific Applications Performance on Candidate PetaScale Platrforms,Ó Proceedings of IPDPS 2007, March 24-30, Long Beach California.
NATIONAL ENERGY RESEARCH SCIENTIFIC COMPUTING CENTER
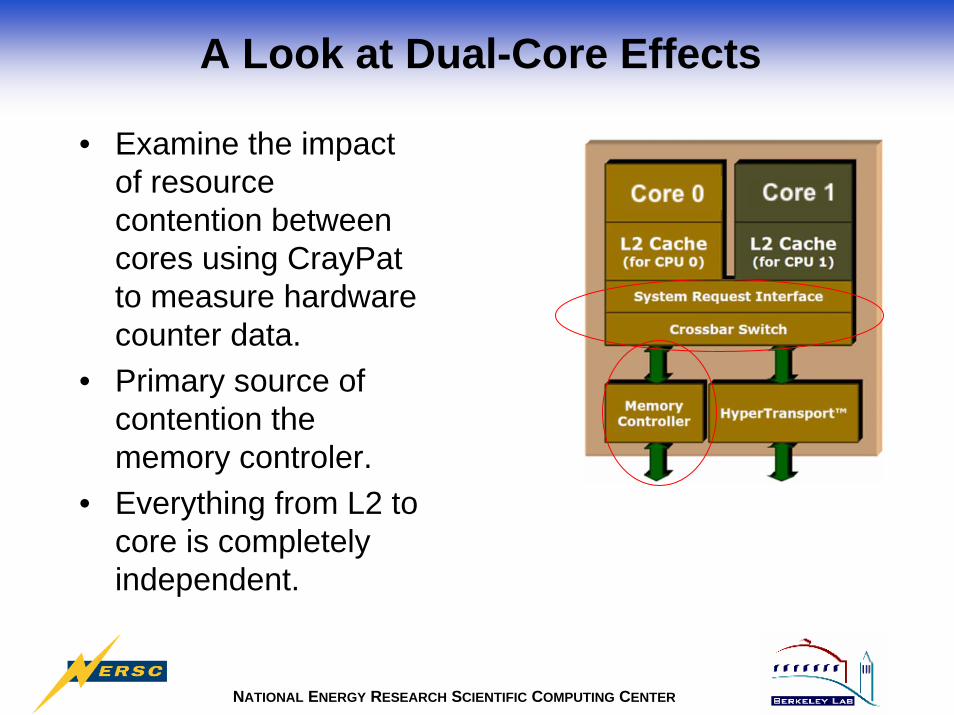
A Look at Dual-Core Effects
• Examine the impact of resource contention between cores using CrayPatto measure hardware counter data.
• Primary source of contention the memory controler.
• Everything from L2 to core is completely independent.
NATIONAL ENERGY RESEARCH SCIENTIFIC COMPUTING CENTER
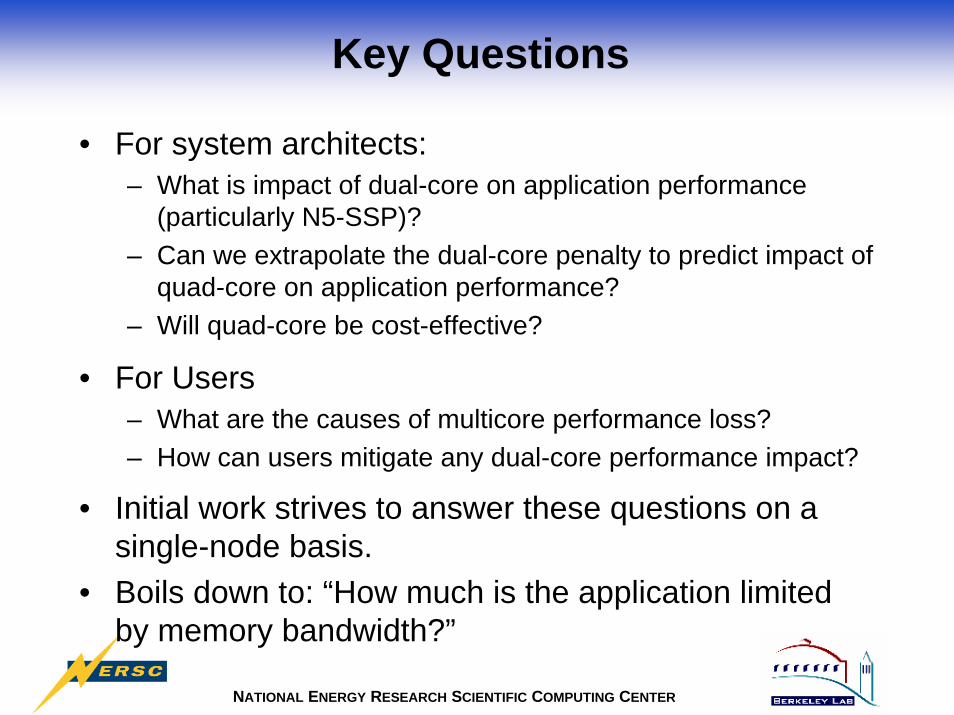
Key Questions
• For system architects:– What is impact of dual-core on application performance
(particularly N5-SSP)?– Can we extrapolate the dual-core penalty to predict impact of
quad-core on application performance?– Will quad-core be cost-effective?
• For Users– What are the causes of multicore performance loss?– How can users mitigate any dual-core performance impact?
• Initial work strives to answer these questions on a single-node basis.
• Boils down to: “How much is the application limited by memory bandwidth?”
NATIONAL ENERGY RESEARCH SCIENTIFIC COMPUTING CENTER
LBNL-62500 (2007)

NATIONAL ENERGY RESEARCH SCIENTIFIC COMPUTING CENTER
Membench Memory BandwidthMEMBENCH: Cray XT3 and XT4
-
2,000
4,000
6,000
8,000
10,000
12,000
1.0E+03 1.0E+04 1.0E+05 1.0E+06 1.0E+07 1.0E+08
Size (bytes)
1core XT3
1core XT4
2core XT3
2core XT4
ftn-tp k8-64 -fastsse -Minfo -MnontemporalMprefetch=distance:8,nta
Independent L2 caches

NATIONAL ENERGY RESEARCH SCIENTIFIC COMPUTING CENTER
STREAM Benchmark Results
Array size = 53,687,091Memory = 1228 MB
(30% of node)
0.00
0.20
0.40
0.60
0.80
1.00
1.20
1.40
1.60
1.80
2.00
1-Core XT4 (relative to XT3)
2-Core XT4(relative to 2-Core
XT3)
2-Core XT3(relative to XT3)
2-Core XT4(relative to XT4)
Copy
Scale
Add
Triad

NATIONAL ENERGY RESEARCH SCIENTIFIC COMPUTING CENTER
MILC• MIMD Lattice QCD
Calculation• Extensive double-complex
matrix-vector multiplies.• Problem: 324 lattice.• SSE Inlined assembly with
aggressive prefetching.• Largest dual-core penalty
(~40% slower on both machines).
• Oddly, relatively little data reuse but still high computational intensity.
• Unoptimized version shows lower dual-core penalty.
• VN XT4/XT3: 1.27
Small Pages Large Pages XT3 Single Dual Single Dual Wall Clock Time 160 230 166 232 Sustained MFLOPS 69370 48402 67138 47976 Percent of Peak 21% 15% 20% 14% Computational Intensity 2.1 2.1 2.1 2.1 OPS/TLB Miss 308 309 68 68 OPS/D1 Cache Miss 16 16 16 16 OPS/L2 Cache Miss 32 32 31 31 XT4 Single Dual Single Dual Wall Clock Time 127 181 130 184 Sustained MFLOPS 87840 61482 85447 60538 Percent of Peak 26% 18% 26% 18% Computational Intensity 2.1 2.1 2.1 2.1 OPS/TLB Miss 307 308 106 106 OPS/D1 Cache Miss 16 16 16 16 OPS/L2 Cache Miss 33 33 33 33

NATIONAL ENERGY RESEARCH SCIENTIFIC COMPUTING CENTER
MILC
• Compare optimized and unoptimized versions along with SN/VN on XT3 and XT4.
• Optimization to make better use of memory bandwidth results in greater dual-core penalty.
XT3/XT4Single Core Orig 1.19Single Core Opt 1.26
Dual Core Orig 1.29Dual Core Opt 1.27
SN 1.71 1.81VN 1.56 1.53
Orig/OptXT3 XT4
Orig 1.31 1.20Opt 1.44 1.43
SN/VN
ImprovementsPenalties
NATIONAL ENERGY RESEARCH SCIENTIFIC COMPUTING CENTER
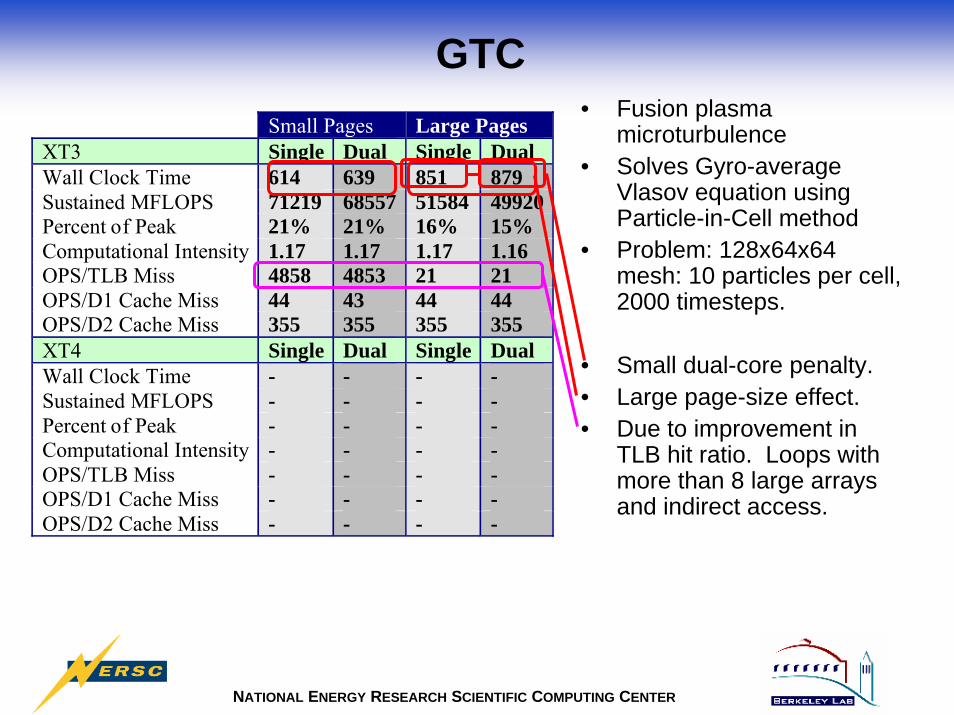
GTC• Fusion plasma
microturbulence• Solves Gyro-average
Vlasov equation using Particle-in-Cell method
• Problem: 128x64x64 mesh: 10 particles per cell, 2000 timesteps.
• Small dual-core penalty.• Large page-size effect.• Due to improvement in
TLB hit ratio. Loops with more than 8 large arrays and indirect access.
Small Pages Large Pages XT3 Single Dual Single Dual Wall Clock Time 614 639 851 879 Sustained MFLOPS 71219 68557 51584 49920 Percent of Peak 21% 21% 16% 15% Computational Intensity 1.17 1.17 1.17 1.16 OPS/TLB Miss 4858 4853 21 21 OPS/D1 Cache Miss 44 43 44 44 OPS/D2 Cache Miss 355 355 355 355 XT4 Single Dual Single Dual Wall Clock Time - - - - Sustained MFLOPS - - - - Percent of Peak - - - - Computational Intensity - - - - OPS/TLB Miss - - - - OPS/D1 Cache Miss - - - - OPS/D2 Cache Miss - - - -
NATIONAL ENERGY RESEARCH SCIENTIFIC COMPUTING CENTER
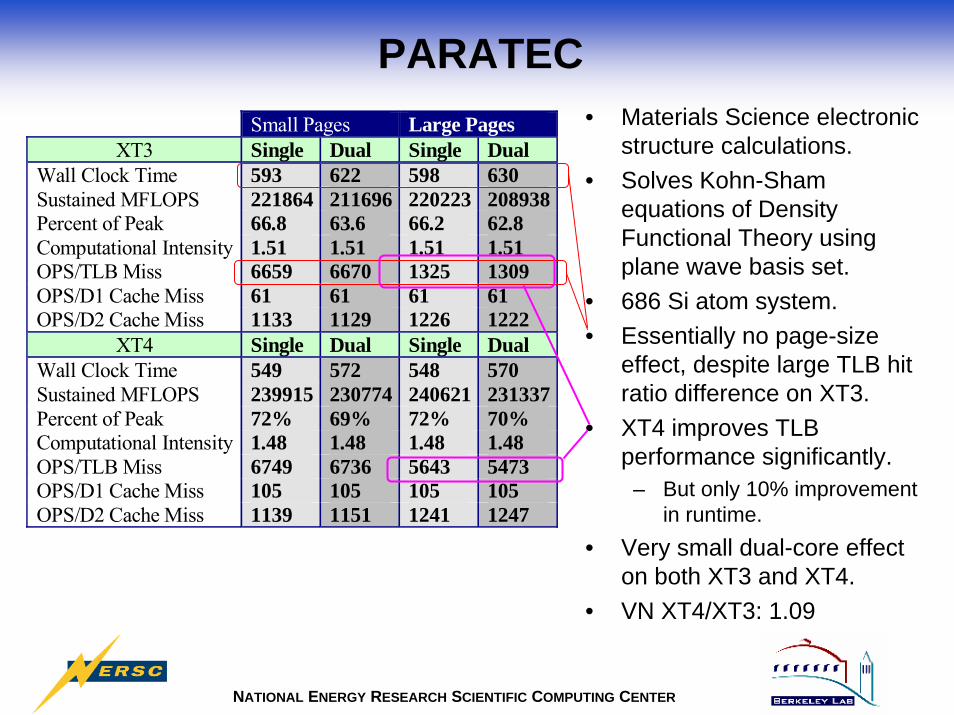
PARATEC• Materials Science electronic
structure calculations.• Solves Kohn-Sham
equations of Density Functional Theory using plane wave basis set.
• 686 Si atom system.• Essentially no page-size
effect, despite large TLB hit ratio difference on XT3.
• XT4 improves TLB performance significantly.
– But only 10% improvement in runtime.
• Very small dual-core effect on both XT3 and XT4.
• VN XT4/XT3: 1.09
Small Pages Large PagesXT3 Single Dual Single Dual
Wall Clock Time 593 622 598 630Sustained MFLOPS 221864 211696 220223 208938Percent of Peak 66.8 63.6 66.2 62.8Computational Intensity 1.51 1.51 1.51 1.51OPS/TLB Miss 6659 6670 1325 1309OPS/D1 Cache Miss 61 61 61 61OPS/D2 Cache Miss 1133 1129 1226 1222
XT4 Single Dual Single DualWall Clock Time 549 572 548 570Sustained MFLOPS 239915 230774 240621 231337Percent of Peak 72% 69% 72% 70%Computational Intensity 1.48 1.48 1.48 1.48OPS/TLB Miss 6749 6736 5643 5473OPS/D1 Cache Miss 105 105 105 105OPS/D2 Cache Miss 1139 1151 1241 1247
NATIONAL ENERGY RESEARCH SCIENTIFIC COMPUTING CENTER
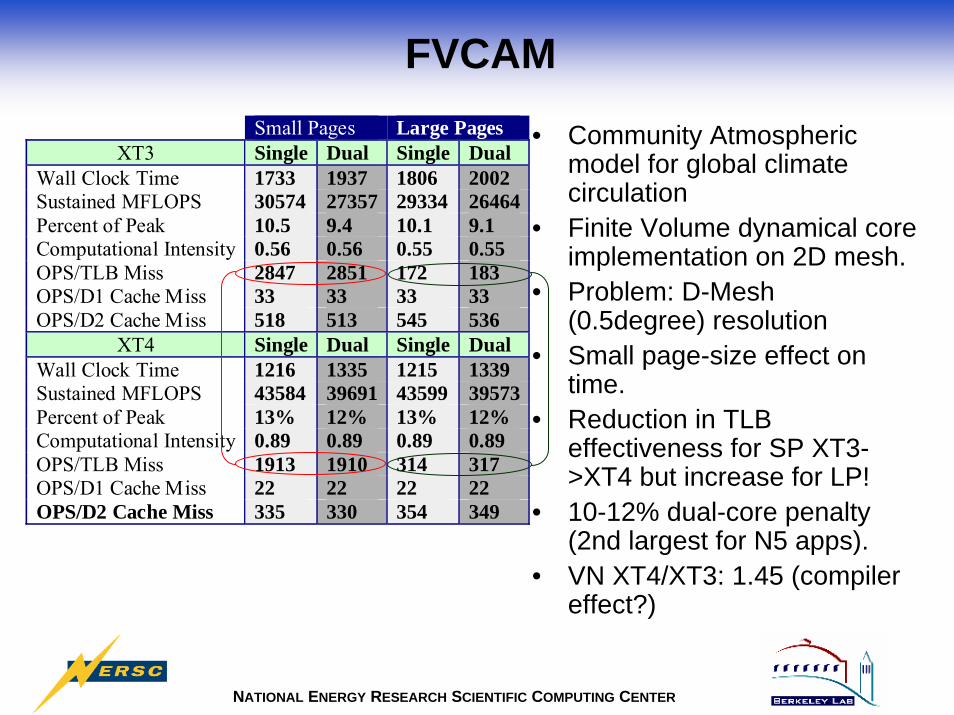
FVCAM
• Community Atmospheric model for global climate circulation
• Finite Volume dynamical core implementation on 2D mesh.
• Problem: D-Mesh (0.5degree) resolution
• Small page-size effect on time.
• Reduction in TLB effectiveness for SP XT3->XT4 but increase for LP!
• 10-12% dual-core penalty (2nd largest for N5 apps).
• VN XT4/XT3: 1.45 (compiler effect?)
Small Pages Large PagesXT3 Single Dual Single Dual
Wall Clock Time 1733 1937 1806 2002Sustained MFLOPS 30574 27357 29334 26464Percent of Peak 10.5 9.4 10.1 9.1Computational Intensity 0.56 0.56 0.55 0.55OPS/TLB Miss 2847 2851 172 183OPS/D1 Cache Miss 33 33 33 33OPS/D2 Cache Miss 518 513 545 536
XT4 Single Dual Single DualWall Clock Time 1216 1335 1215 1339Sustained MFLOPS 43584 39691 43599 39573Percent of Peak 13% 12% 13% 12%Computational Intensity 0.89 0.89 0.89 0.89OPS/TLB Miss 1913 1910 314 317OPS/D1 Cache Miss 22 22 22 22OPS/D2 Cache Miss 335 330 354 349

NATIONAL ENERGY RESEARCH SCIENTIFIC COMPUTING CENTER
MADBench
• Used for data-processing of CMB experimental data.
• MADBench is a stripped down version of Microwave Anisotropy Dataset Computational Analysis Package (MADCAP).
• Parallel out-of-core dense linear algebra.
• Test Case: 18000 pixel dataset with 24 bins
• No dual-core degradation.• Excellent TLB and L2 reuse
due to ACML lib routines.• Huge improvement in TLB
reuse XT4 relative to XT3 but not reflected in runtime.
• VN XT4/XT3: 1.02
Small Pages Large PagesXT3 Single Dual Single Dual
Wall Clock Time 1318 1336 1248 1291Sustained MFLOPS 219981 216986 232294 224640Percent of Peak 66% 65% 70% 68%Computational Intensity 1.73 1.7 1.72 1.72OPS/TLB Miss 7807 7880 3281 3265OPS/D1 Cache Miss 122 124 121 121OPS/D2 Cache Miss 2481 2348 2922 2880
XT4 Single Dual Single DualWall Clock Time 1248 1272 1236 1263Sustained MFLOPS 230868 226415 233129 228185Percent of Peak 69% 68% 70% 69%Computational Intensity 1.67 1.67 1.67 1.67OPS/TLB Miss 7911 7918 12521 12721OPS/D1 Cache Miss 122 122 121 122OPS/D2 Cache Miss 2407 2399 2989 2968
NATIONAL ENERGY RESEARCH SCIENTIFIC COMPUTING CENTER
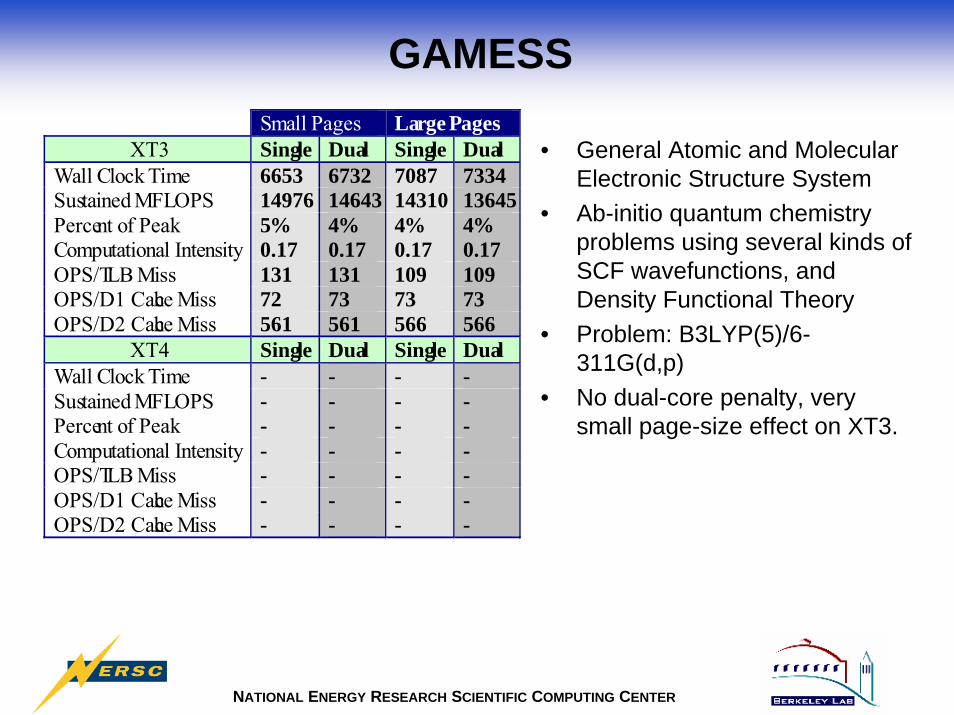
GAMESS
• General Atomic and Molecular Electronic Structure System
• Ab-initio quantum chemistry problems using several kinds of SCF wavefunctions, and Density Functional Theory
• Problem: B3LYP(5)/6-311G(d,p)
• No dual-core penalty, very small page-size effect on XT3.
Small Pages Large Pages XT3 Single Dual Single Dual
Wall Clock Time 6653 6732 7087 7334 Sustained MFLOPS 14976 14643 14310 13645 Percent of Peak 5% 4% 4% 4% Computational Intensity 0.17 0.17 0.17 0.17 OPS/TLB Miss 131 131 109 109 OPS/D1 Cache Miss 72 73 73 73 OPS/D2 Cache Miss 561 561 566 566
XT4 Single Dual Single Dual Wall Clock Time - - - - Sustained MFLOPS - - - - Percent of Peak - - - - Computational Intensity - - - - OPS/TLB Miss - - - - OPS/D1 Cache Miss - - - - OPS/D2 Cache Miss - - - -
NATIONAL ENERGY RESEARCH SCIENTIFIC COMPUTING CENTER
Two Additional LBNL Codes

NATIONAL ENERGY RESEARCH SCIENTIFIC COMPUTING CENTER
Two Additional LBNL Codes
• ELBM3D: Lattice Boltzmann Fluid Dynamics– ~25% of peak on dual-core Jaguar XT3, 64 cores.– Essentially no degradation due to dual-core (512^3 problem
on 64-512 cores), strong scaling.
• BB3D: 3D PIC with FFT; more complicated than GTC– ~6% of peak on dual-core Jaguar XT3, 64 cores.– Large (25%-60%) degradation due to dual-core (512^3
problem on 64-512 cores), strong scaling.
• More data collection required.
NATIONAL ENERGY RESEARCH SCIENTIFIC COMPUTING CENTER
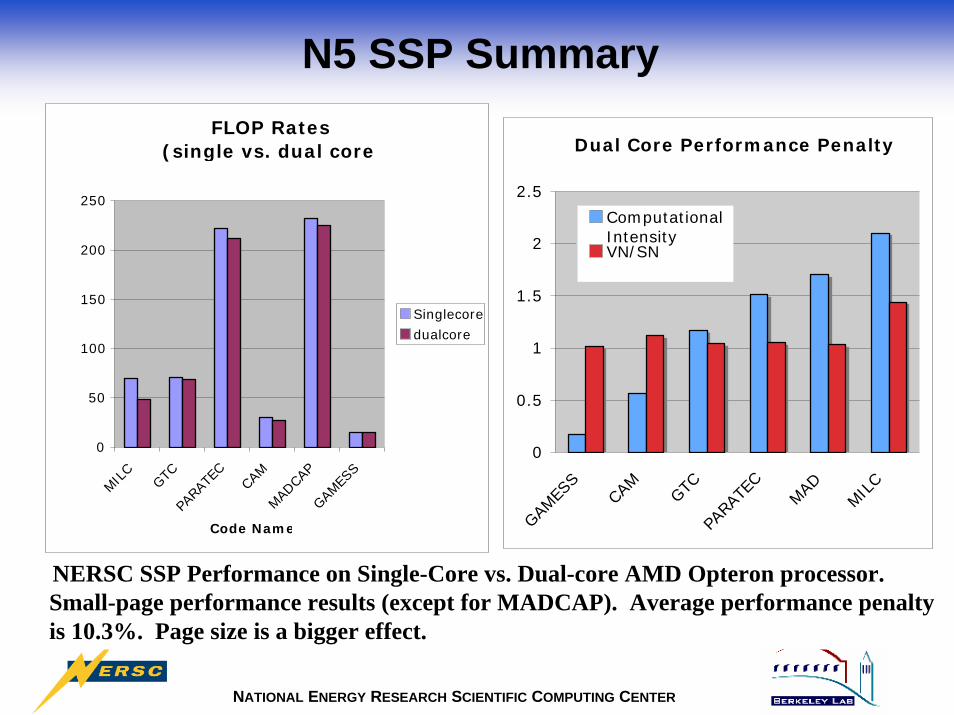
N5 SSP SummaryFLOP Rates
(single vs. dual core
0
50
100
150
200
250
MILC
GTCPA
RATE
C
CAM
MADCA
PGAM
ESS
Code Name
Singlecore
dualcore
NERSC SSP Performance on Single-Core vs. Dual-core AMD Opteron processor. Small-page performance results (except for MADCAP). Average performance penalty is 10.3%. Page size is a bigger effect.
Dual Core Performance Penalty
0
0.5
1
1.5
2
2.5
GAMES
S
CAM
GTCPA
RATE
C
MAD
MILC
ComputationalIntensityVN/SN

NATIONAL ENERGY RESEARCH SCIENTIFIC COMPUTING CENTER
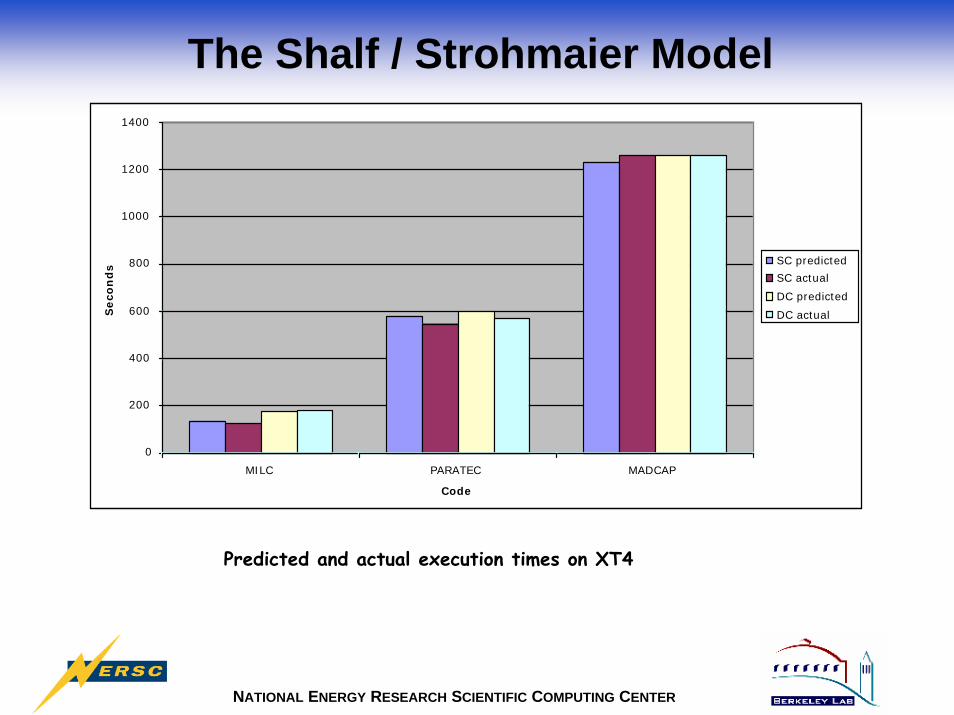
The Shalf / Strohmaier Model
• Objective is to predict quad-core times (exclusive of MPI)
• Assumption: Memory contention is the only source of performance difference.– Cores run at same speed, experience same stall behavior.– Memory latency and all L2 effects are identical.– Can break down execution time into portion that is stalled on
shared resources (memory bandwidth) and portion that is stalled on non-shared resources (everything else).
– Derive time spent on memory contention from XT3 single/dual core studies.
– Use model to predict quad-core (and XT4) times.– Validate the model by using XT3 times to predict XT4 times.

NATIONAL ENERGY RESEARCH SCIENTIFIC COMPUTING CENTER
The Shalf / Strohmaier Model
Other Exec Time Memory BW Time
Time=160s
Cray XT3 [email protected] DDR400
Single Core
Dual Core
Time=230s
Memory BW Contention TimeOther Exec Time
MILC

NATIONAL ENERGY RESEARCH SCIENTIFIC COMPUTING CENTER
The Shalf / Strohmaier Model
Cray XT4 [email protected] DDR2-66790s .36GB/8GB/s Time=90+0.36GB/8GBs = 134sSingle Core
Dual Core 90s Time=90+0.36GB/4GB/s = 178s.36GB/4GB/s
Cray XT3 [email protected] DDR400
Estimated Bytes Moved = 0.36 GB
Other Exec Time=90s 70s @5 GB/sSingle Core
Dual Core 140s @2.5 GB/sOther Exec Time=90s
Time=160
Time=230s
ErrorMILC Prediction for XT4 SC=134s
actual = 127serror = 5%
MILC Prediction for XT4 DC = 178sactual = 181serror = 1.5%
NATIONAL ENERGY RESEARCH SCIENTIFIC COMPUTING CENTER
The Shalf / Strohmaier Model
0
200
400
600
800
1000
1200
1400
MILC PARATEC MADCAP
Code
Seco
nd
s
SC predicted
SC actual
DC predicted
DC actual
Predicted and actual execution times on XT4

NATIONAL ENERGY RESEARCH SCIENTIFIC COMPUTING CENTER
The Shalf / Strohmaier Model
• Predictions good for MILC, PARATEC, MADBench• Not shown: poor prediction for CAM (but compiler version changed)• Need more XT4 results to see how other codes fare

NATIONAL ENERGY RESEARCH SCIENTIFIC COMPUTING CENTER
Quad Core Prediction
Net increase in runtime predicted for the NERSC-5 SSP benchmarks assuming that memory bandwidth contention can be
treated exclusively from the other components of the runtime and that Quad-core systems have no additional improvement in memory bandwidth.

NATIONAL ENERGY RESEARCH SCIENTIFIC COMPUTING CENTER
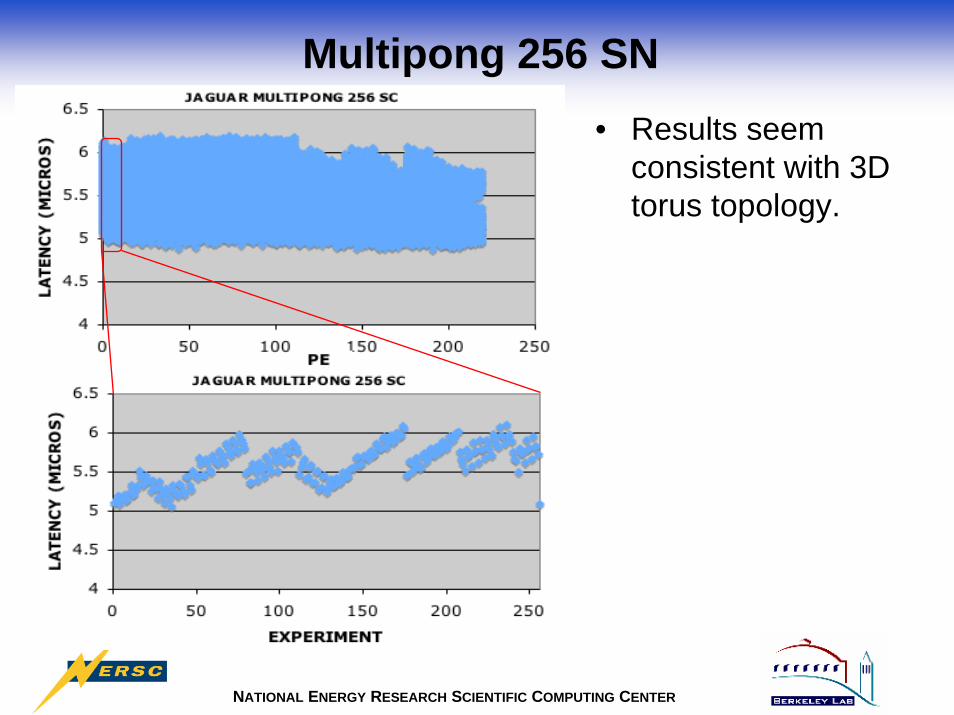
MultiCore MPI Latency Effect
• 256-node Multipong run on Jaguar XT3• David Skinner’s N-way Ping-Pong test
– Pairs run their tests one at a time w/o contending for switch resources.
– Intent is to examine the hierarchy of interconnect latencies.
• Run in SN mode:– Latency MIN: 4.9 micros– Latency MAX: 6.2 micros
• Run in VN mode:– Latency MIN: 3.1 micros– Latency MAX: 7.8 micros
NATIONAL ENERGY RESEARCH SCIENTIFIC COMPUTING CENTER
Multipong 256 SN• Results seem
consistent with 3D torus topology.

NATIONAL ENERGY RESEARCH SCIENTIFIC COMPUTING CENTER
Multipong 256 VN

NATIONAL ENERGY RESEARCH SCIENTIFIC COMPUTING CENTER
Lustre Benchmarking with Madbench2
• Based on production code used to analyze multi-petabyte CMB datasets.
• Preserves full computational complexity.• Benchmark IO for a number of systems to assess
suitability for CMB analysis• O-o-C dense linear algebra on distributed matrices.• Writes synchronously/asynchronously to shared/non-
shared files using Posix or MPI-IO. (8 different combinations)

NATIONAL ENERGY RESEARCH SCIENTIFIC COMPUTING CENTER
Madbench2 I/O Benchmarking Jaguar
• Shows the default performance of writing synchronously to a shared file vs. to non-shared files.
• I/O to shared files is not scalable using the default settings.
• I/O to one-file-per-processor is able to saturate the maximum filesystemperformance at 256-way concurrency (SN mode).

NATIONAL ENERGY RESEARCH SCIENTIFIC COMPUTING CENTER
Madbench2 I/O Benchmarking Jaguar
• Using the Lustrelfs setstripecommand to stripe across all 96 OSTs results in reading/writing concurrently and the rate jumps dramatically -- even out-performing the read/writes to unique files.
• But not shown: max 300 file creates/second, regardless of concurrency.
NATIONAL ENERGY RESEARCH SCIENTIFIC COMPUTING CENTER
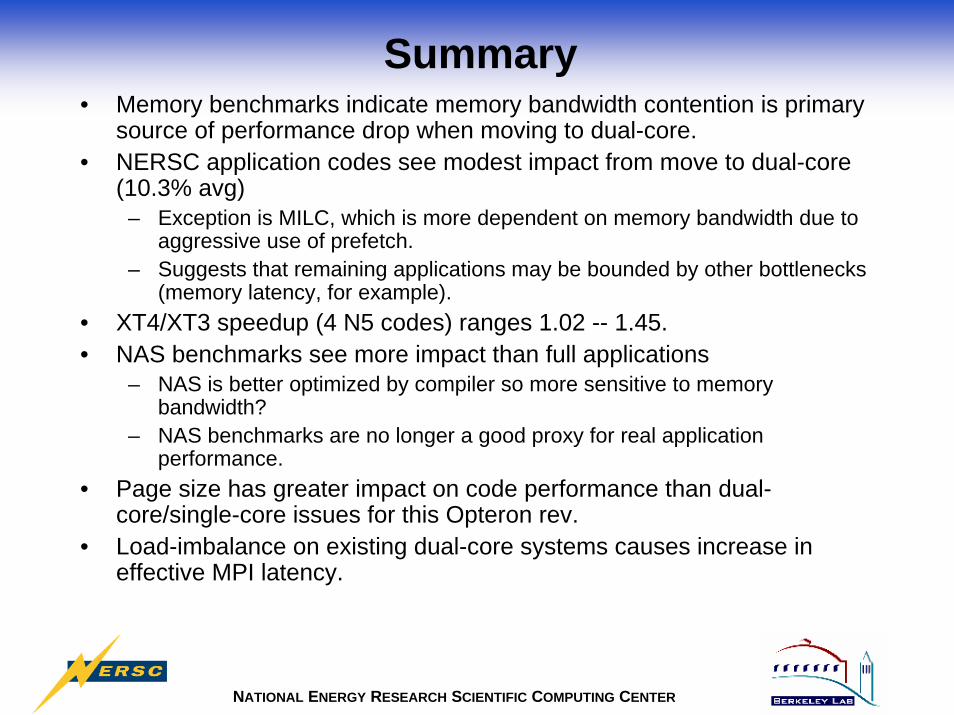
Summary• Memory benchmarks indicate memory bandwidth contention is primary
source of performance drop when moving to dual-core.• NERSC application codes see modest impact from move to dual-core
(10.3% avg)– Exception is MILC, which is more dependent on memory bandwidth due to
aggressive use of prefetch.– Suggests that remaining applications may be bounded by other bottlenecks
(memory latency, for example).• XT4/XT3 speedup (4 N5 codes) ranges 1.02 -- 1.45.• NAS benchmarks see more impact than full applications
– NAS is better optimized by compiler so more sensitive to memory bandwidth?
– NAS benchmarks are no longer a good proxy for real application performance.
• Page size has greater impact on code performance than dual-core/single-core issues for this Opteron rev.
• Load-imbalance on existing dual-core systems causes increase in effective MPI latency.
NATIONAL ENERGY RESEARCH SCIENTIFIC COMPUTING CENTER
“Backup” Slides

NATIONAL ENERGY RESEARCH SCIENTIFIC COMPUTING CENTER
Multipong 256 SN

NATIONAL ENERGY RESEARCH SCIENTIFIC COMPUTING CENTER
Multipong 256 VN

NATIONAL ENERGY RESEARCH SCIENTIFIC COMPUTING CENTER
Franklin ConfigurationQuantity Type
9672 Compute Nodes – 4 GB memory32 Spare Compute Nodes.16 Login Nodes. Each node configured with 8 GB of memory, 1
dual port GigE Ethernet adapter (copper). And configure d with 1 Single port 4 gb/sec Fiber Channel Host Bus Adapter.
20 I/O Server nodes. Each node configured with 8 GB of memory, 2 Single port 4 gb/sec Fiber Channel Host Bus Adapter.
2 Boot Nodes. Each configured with 8 GB of memory, 1 GigE Ethernet adapter (copper) and 1 Dual port 2 gb/sec Fiber Channel Host Bus Adapter.
2 Syslog and System Database Nodes. Each configured with 8 GB of memory, 1 Dual port 2 gb/sec Fiber Channel Host Bus Adapter.
4 Network Nodes. Each configured with 8 GB of memory, 1 10 GigE Ethernet adapter (optical). And configured with 1 Single port 4 gb/sec Fiber Channel Host Bus Adapter.

NATIONAL ENERGY RESEARCH SCIENTIFIC COMPUTING CENTER
Final Software Configuration
• SuSE SLES 9.0 Linux on Service Nodes• Compute Node Linux O/S for all compute nodes
– Cray’s light weight Linux kernel• Portals communication layer
– MPI, Shmem • GPFS
– GPFS directly accessible from compute nodes with a “Petascale I/O Interface”• PBS with Moab
– Most expected functions including Backfill, Fairshare, advanced reservation• Checkpoint Restart
– Based on Berkeley Linux Checkpoint/Restart (Hargrove)• Application Development Environment
– PGI compilers - assembler, Fortran, C, UPC, and C++ – Parallel programming models include MPI, and SHMEM. – Libraries include SCALAPACK, SuperLU, ACML, Portals, MPICH2/ROMIO. – Languages and parallel programming models shall be extended to include OpenMP, and Posix threads but are
dependent on compute node Linux – Totalview to 1,024 tasks– Craypat and Cray Apprentice – PAPI and Modules
NATIONAL ENERGY RESEARCH SCIENTIFIC COMPUTING CENTER
Madbench2 I/O Benchmarking Jaguar
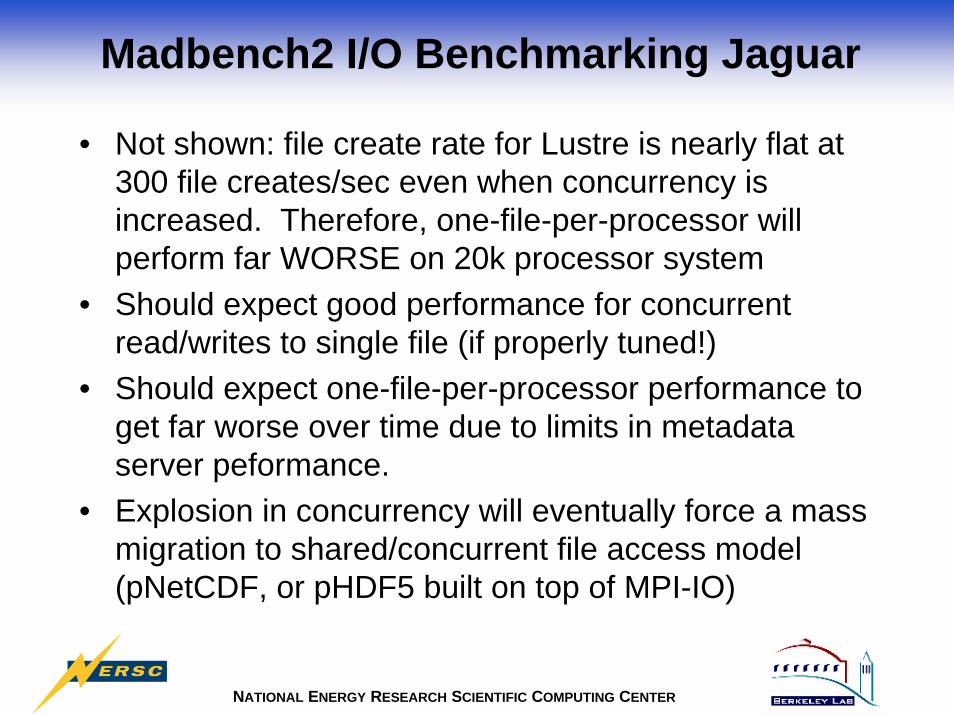
• Not shown: file create rate for Lustre is nearly flat at 300 file creates/sec even when concurrency is increased. Therefore, one-file-per-processor will perform far WORSE on 20k processor system
• Should expect good performance for concurrent read/writes to single file (if properly tuned!)
• Should expect one-file-per-processor performance to get far worse over time due to limits in metadata server peformance.
• Explosion in concurrency will eventually force a mass migration to shared/concurrent file access model (pNetCDF, or pHDF5 built on top of MPI-IO)
NATIONAL ENERGY RESEARCH SCIENTIFIC COMPUTING CENTER
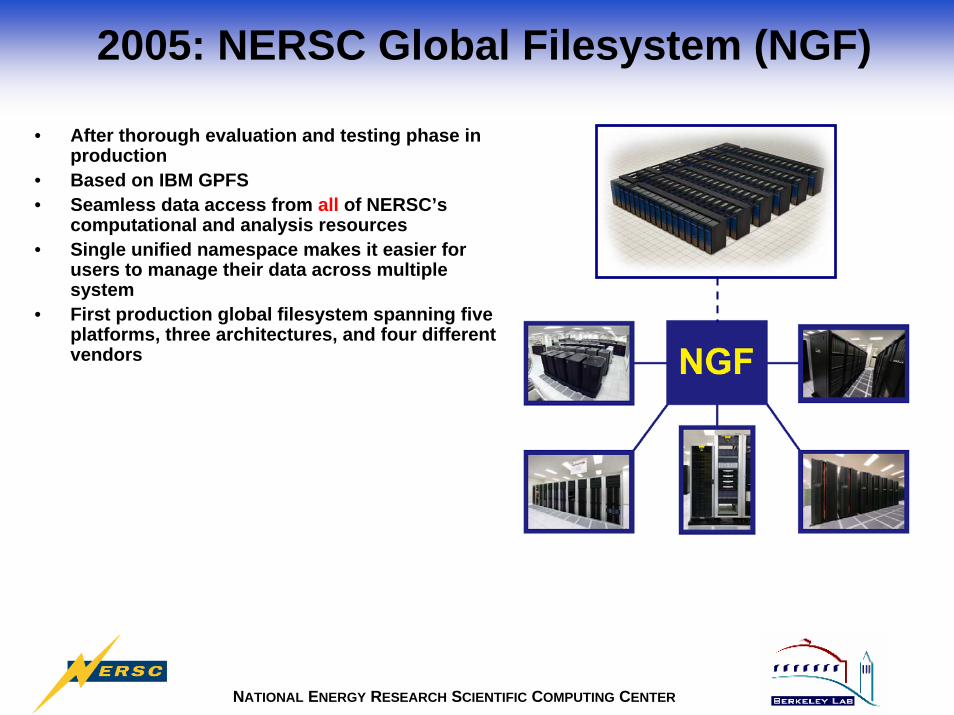
2005: NERSC Global Filesystem (NGF)
• After thorough evaluation and testing phase in production
• Based on IBM GPFS• Seamless data access from all of NERSC’s
computational and analysis resources• Single unified namespace makes it easier for
users to manage their data across multiple system
• First production global filesystem spanning five platforms, three architectures, and four different vendors

NATIONAL ENERGY RESEARCH SCIENTIFIC COMPUTING CENTER
XT3/XT4 Page Size Effect
• L1 TLB has 40 entries, 8 for 2-MB (large) pages and 2 4-KB (regular) pages. 2 Large pages are pinned.
• L2 TLB has 512 entries for regular pages.• TLB coverage:
– (8-2) * 2MB = 12 MB for large pages.– 512 * 4KB = 2 MB for regular pages.
• => If a program’s data fit within 16 MB the program may run faster by selecting large pages.
• => If the data exceed 16 MB selecting small pages may actually be better, in part because of so few entries in the L1 TLB.