nesreen ph.d. presentation
TRANSCRIPT

A STUDY ON BACTERIAL CONTROL
OF BRACHIODONTES VARIABILIS THE
BIOFOULING CAUSATIVE IN SOME
PETROLEUM REFINERIES

Nesreen Abd-Elhameed Fatth-Allah Supervisors:
Late Prof. Dr. Erian George Kamel,
Prof. of Zoology , Zoology Dept., Women College for Arts, Science and
Education, Ain Shams Uinversity.
Prof. Dr. Mohamed Fouad Abd-Elaziz Salama,
Prof. of Applied Organic Chemistry, Dept. of Processes Development ,
Petroleum Biotechnology Lab, Egyptian Petroleum Research Institute
(EPRI).
Prof. Dr.Faika Ibrahim Kossa,
Prof. of Zoology , Zoology Dept., Women College for Arts, Science and
Education, Ain Shams Uinversity.
Dr. Mohamed Ahmed Zaki
Researcher of Marine Toxins, National Institute of Oceanography and
Fisheries, Suez.

Fouling
Fouling is a leading cause of diminished efficiency and productivity in refineries.
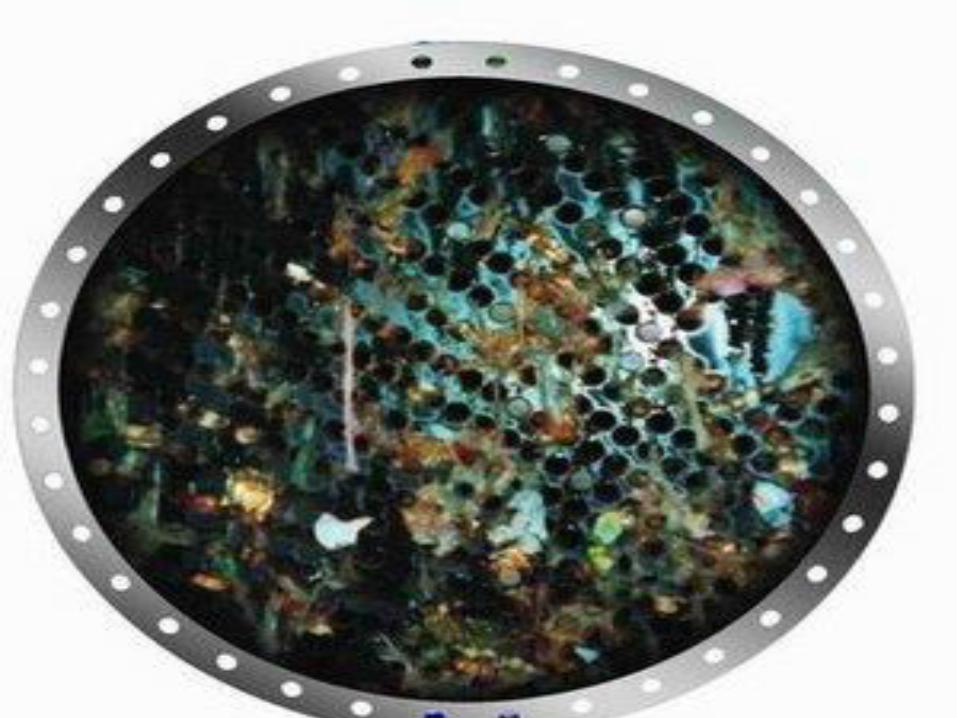
Fouling of a heat transfer equipment is defined as the formation of deposits on heat exchanger surfaces which impede the transfer of heat and increase the resistance to fluid flow. The accumulation of these deposits causes thermal and hydrodynamic performance of heat transfer equipment to decline with time.


The total fouling cost results in
1. Need for additional costs for anti fouling equipment,
such as the installation of on-line cleaning devices,
2.Extra fuel costs due to increase in fuel burning,
3. Maintenance costs for removing fouling deposits,
and coasts for chemicals or other operating costs of
antifouling .
4.Production losses during planned and unplanned shut-
down due to fouling .

Fouling Classification 1. Precipitation Fouling.
2. Particulate Fouling.
3. Chemical reaction Fouling.
4. Corrosion Fouling.
5. Biological Fouling.
6. Freezing Fouling.

Fouling Mechanism

A: Initially clean surface exposed to a turbulent flow of fluid containing
microorganisms and associated material.
B: Adsorption of organic material from the bulk fluid.

C: Flux and attachment of microbial cells to the surface from the bulk fluid.
D: Continued flux of microbial cells to the surface with simultaneous growth process occurring.

E: Continued flux of microbial cells to the surface and simultaneous growth opposed by attachment of biomass due to fluid shear.
F: Summary of biofouling process: organic adsorption ; particle transport ; attachment ; growth .

COMMON BIOFOULING
BIVALVES
Brachidontes variabilis
Brachidontes striatulus
Corbicula fluminea
Modiolus auriculatus
Modiolus barbatus
Mytilus edulis
Mytilus galloprovincialis
Perna viridis

PREDOMINANT BIOFOULING
MUSSEL IN PETROLEUM
REFINERIES AT SUEZ Brachidontes variabilis

Brachidontes variabilis
It is considered to be the principal macro-
biofoulant in petroleum refineries at Suez.
These mussels are pest organisms because they
not only attach to one another, but also to man-
made objects, including water intakes, cooling
systems, heat exchangers and power stations in
different companies that deal with water.


3◦ Paints and Coatings
2◦ Physical
4◦ Chemical
1◦ Mechanical
Fouling Control Methods

1. Mechanical Control
Screens.
Strainers.
Filters.

2. Physical Control
Thermal treatment.
Salinity.
pH.

3. Paints and Coatings
TBTO Based Coatings.
TBTF Based Coatings.
Zinc Based Coatings.

4. Chemical Control
Metals.
Oxidizing materials.
Non- Oxidizing materials.

Metals Copper
Zinc

Oxidizing Materials
Chlorine ( gas and sodium hypochlorite).
Chloramines.
Bromine.
Chlorine Dioxide.
Hydrogen Peroxide.
Ozone.
Potassium Permenganate.

Aim of the work

It was aimed to control the mussel Brachidontes variabilis, the
causative agent of biofouling using different bacterial strains.
Optimization of the different cultural conditions for growth of the
strain having the higher molluscicidal capacity (including pH,
temperature, nutrients, salinity, mutation ….etc.) was an essential target.
Extraction of the crude toxins out of that bacterium was also another
target to evaluate the molluscicidal potency against the mussel
Brachidontes variabilis.
However, it was essential to investigate the different histological and
histochemical alterations which might affect the organs of the mussel
Brachidontes variabilis, a sub-lethal dose of the highly potent
bacterium is applied.
It was substantial when regarding the ecological considerations, to
assay the bacterial toxicity of the tested species having the higher
mortality against the non-target sea organisms.

Screening of Efficacy of some Bacteria against Brachidontes variabilis

Fig. 1: Growth curve of Bacillus alvei using media in distilled and sea
water
0.0
2.0
4.0
6.0
8.0
10.0
12.0
14.0
16.0
0 20 40 60 80 100 120
Time / hours
Lo
g c
ell n
um
ber
Distilled water
sea water

Fig. 2: Growth curve of Bacillus brevis using media in distilled and sea
water
0.0
2.04.0
6.08.0
10.0
12.014.0
16.0
0 20 40 60 80 100 120
Time / hours
Lo
g c
ell n
um
ber
Distilled water
Sea water

Fig. 3: Growth curve of Bacillus thuringiensis using media in distilled
and sea water
10.010.511.0
11.512.012.513.0
13.514.014.515.0
15.516.0
0 20 40 60 80 100 120
Time / hours
Lo
g c
ell n
um
ber
Distilled water
Sea water

Fig. 4: Growth curve of Bacillus subtilis using media in distilled and
sea water
0.0
2.0
4.0
6.0
8.0
10.0
12.0
14.0
16.0
0 20 40 60 80 100 120
Time / hours
Lo
g c
ell n
um
be
r
Distilled water
Sea water

Fig. 5: Growth curve of Bacillus megatarium using media in distilled
and sea water
0.0
2.0
4.0
6.0
8.0
10.0
12.0
14.0
16.0
0 20 40 60 80 100 120
Time / hours
Lo
g c
ell n
um
be
r
Distilled water
Sea water

Optimization of Different Parameters Controlling Cultural Conditions of Bacillus thuringiensis on
Mortality of Brachidontes variabilis 1. Inoculum size
2. pH value
3. Temperature 4. Different carbon sources
5. Different nitrogen sources
6. Salinity
7. -Irradiation

Table 1: Effect of inoculum size of Bacillus thuringiensis on mortality of Brachidontes
variabilis
Mortality
%
Number of killed mussels Inoculum Size (ml) Time / hrs
8 6 4 2
t c t c t c t c
10 0 0 0 0 0 0 1.0 0 5.0
30 0 0 0 0 2.0 0 1.0 0 5.5
40 0 0 0 0 2.0 0 2.0 0 6.0
40 0 0 0 0 2.0 0 2.0 0 6.5
60 1.0 1.0 1.0 1.0 2.0 0 2.0 0 7.0
70 1.0 0 1.0 0 3.0 0 2.0 0 7.5
70 1.0 0 1.0 0 3.0 0 2.0 0 8.0
80 1.0 0 2.0 0 3.0 0 2.0 0 8.5
90 1.0 0 2.0 0 3.0 0 3.0 0 9.0
100 1.0 0 2.0 0 3.0 0 3.0 0 9.5
c: control samples (10) t: treated samples (10)

Table 2: Effect of pH values on Bacillus thuringiensis affecting mortality of
Brachidontes variabilis
Mortality %
Number of killed mussels
pH
value
Time / hrs
8 6 4 2
t c t c t c t c
10 1.0 0 0 0 0 0 0 0 6.50
10 1.0 0 0 0 0 0 0 0 6.75
10 1.0 0 0 0 0 0 0 0 7.00
10 1.0 0 0 0 0 0 0 0 7.25
30 3.0 0 0 0 0 0 0 0 7.50
40 1.0 0 3.0 0 0 0 0 0 7.75
40 0 0 2.0 0 2.0 1.0 0 0 8.0
80 2.0 0 2.0 0 2.0 0 2.0 0 8.25
100 2.0 1.0 2.0 0 3.0 0 3.0 0 8.50
c: control samples (10)
t: treated samples (10)

Table 3: Effect of temperature on Bacillus thuringiensis affecting mortality of Brachidontes
variabilis
Mortality %
Number of killed mussels
Temp. oC
Time / hrs
8 6 4 2
t c t c t c t c
0 0 0 0 0 0 0 0 0 20
40 4.0 0 0 0 0 0 0 0 25
80 2.0 0 2.0 0 2.0 0 2.0 0 30
100 0 1.0 0 0 10.0 0 0 0 35
100 0 0 0 0 0 0 10.0 0 40
100 0 0 0 0 0 0 10.0 0 45
c: control samples (10) t: treated samples (10)

Table 4: Effect of carbon source on Bacillus thuringiensis affecting mortality
of Brachidontes variabilis
Mortality %
Number of killed mussels
Carbon Source (5g/lit.)
Time / hrs
8 6 4 2
t c t c t c t c
100 0 0 2.0 0 4.0 0 4.0 0 Glycerol
100 0 0 2.0 0 0 0 8.0 0 Glucose
100 0 0 6.0 0 2.0 0 2.0 0
Water sol. starch
100 0 0 4.0 0 4.0 0 2.0 0
Malt extract
100 0 0 6.0 0 0 4.0 0
Sun flower oil
100 0 0 0 0 6.0 0 4.0 0 Molasses
c: control samples (10)
t: treated samples (10)

Table 5: Effect of concentration of the nutrient molasses on Bacillus thuringiensis affecting
mortality of Brachidontes variabilis
Mortality %
Number of killed mussels
Concentration g/lit.
Time / hrs
8 6 4 2
t c t c t c t c
100 6.0 0 4.0 0 0 0 0 0 2.0
100 0 0 6.0 0 4.0 0 0 0 4.0
100 0 0 0 0 6.0 0 4.0 0 6.0
100 0 0 0 0 5.0 0 5.0 0 8.0
100 0 0 0 0 4.0 0 6.0 0
10.0
100 0 0 0 0 0 0 10.0 0 12.0
c: control samples (10) t: treated samples (10)

Table 6: Effect of different nitrogen sources on Bacillus thuringiensis affecting mortality of
Brachidontes variabilis
Nitrogen Source (peptone base)
Nitrogen Source (beef extract base)
Mortality %, 2hrs Nitrogen nutrient Mortality %, 2hrs Nitrogen nutrient
30 Ammonium chloride 30 Ammonium chloride
100 Amm.dihydrogen orthophosphate 100 Amm.dihydrogen orthophosphate
20 Amm. Oxalate 20 Amm. Oxalate
40 Amm. Carbonate 40 Amm. Carbonate
40 Corn steep liquor 40 Corn steep liquor
60 Glutamic acid 60 Glutamic acid

Table 7: Effect of salinity on Bacillus thuringiensis affecting mortality of Brachidontes
variabilis
Mortality %
Number of killed mussels, 2 hrs Salinity
‰ t c
100 10.0 0 20
100 10.0 0 25
40 4.0 0 30
20 2.0 0 35
0 0 0 40
100 10.0 0 45
100 10.0 0 50
70 7.0 0 55
50 5.0 0 60
c: control samples (10) t: treated samples (10)

Table 8: Effect of γ-irradiation on Bacillus thuringiensis affecting mortality of
Brachidontes variabilis
Mortality % , 2hrs
γ-irradiation (Gy)
t
c
10.0 0 0.5
0 0 0.2
0 0 10.0
0 0 50.0
0 0 70.0
c: control samples (10) t: treated samples (10)

Effect of Bacillus thuringiensis toxins against
Brachidontes variablilis

Table 9: Effectiveness of Bacillus thuringiensis crude toxins on mortality of Brachidontes
variabilis
Mortality %
Number of killed mussels
Dose
(ppm)
Time / hrs
24 18 12 8 6 4 2
t c t c t c t c t c t c t c
100 0 0 0 0 2.0 0 2.0 0 2.0 0 2.0 0 2.0 0 2
100 0 0 0 0 1.0 0 1.0 0 3.0 0 3.0 0 2.0 0 5
100 0 0 0 0 0 0 2.0 0 2,0 0 3.0 0 3.0 0 10
100 0 0 0 0 0 0 0 0 2.0 0 4.0 0 4.0 0 15
100 0 0 0 0 0 0 0 0 0 0 4.0 0 6.0 0 20
100 0 0 0 0 0 0 0 0 0 0 4.0 0 6.0 0 25
c: control samples (10) t: treated samples (10)

Estimation of total proteins and nitrogen percentage in crude toxins of Bacillus thuringiensis

26.8%

0.45 %

Histological Alterations in
Infected Brachidontes variabilis

Histological alterations in gills


Histological alterations in digestive gland


Histological alterations in ovary


Histochemical Analysis of
Infected Mussels

Table 10: Histochemical analysis of infected mussels
Treated
Control
Biochemcial Composition
25.5 12.75 Total protein (µg /µl)
2.48 5.12 Total carbohydrates (mg/dl)
114.7 93.2 Total lipid (mg/dl)
0.0557 0.1125 Phospholpid phosphorus (mg/dl)


Bioassay of Bacillus thuringiensis Against Non-Target Sea Organisms
Fish larvae
Amphipode larvae
Isopode larvae ≥16.7 %
15% mortality
≥16.7 % 20% mortality
2hrs
72hrs
