nestle purina customer engagement - asqasq.org/.../former/nestle_purina-customer_engagement.pdf ·...
TRANSCRIPT
1
Customer EngagementNestle Purina PetCare
Quest for ExcellenceApril 9, 2013
Overview of Nestlé S.A.
• Largest and most admired food company in world
• A nutrition, health and wellness company
• Baby foods, coffee, dairy products, breakfast cereals, confectionary, bottled water, ice cream, health sciences, pet food, etc.
• 98B USD Annual revenue
• 13B USD Operating Income
• 468 factories in 86 countries
• 330,000 worldwide employees
• Products sold on almost every country in world
Nestlé Purina PetCare
Pet Food Category– Worldwide - 324MM Dogs; 263MM Cats
– Worldwide $61B; U.S. & Canada $20B
– 42% U.S. Households own a dog (1.7/HH)
– 35% U.S. Households own a cat (2.2/HH)
NPPC No. 1 in U.S. Pet Category Sales
Market Share
Trust
2
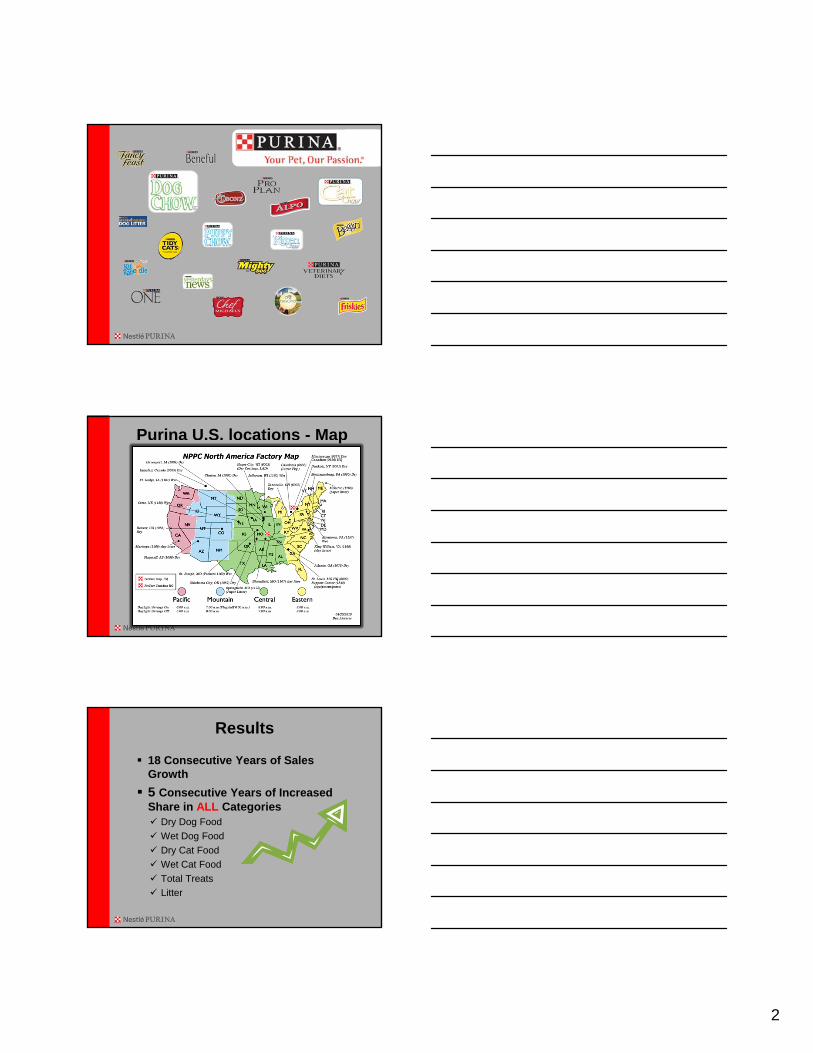
Purina U.S. locations - Map
Results
18 Consecutive Years of Sales Growth
5 Consecutive Years of Increased Share in ALL Categories Dry Dog Food
Wet Dog Food
Dry Cat Food
Wet Cat Food
Total Treats
Litter
3
Culture - The Foundation
William H. DanforthFounder
Culture
The Four TallsStand Tall
Think Tall
Smile Tall
Live Tall
4
Westminster Dog Show Winners
Our Vision
A Checkerboard in every involved pet owner’s home
We stand for trust. We earn it every day as we enrich the lives of pets and the people who love them.
5
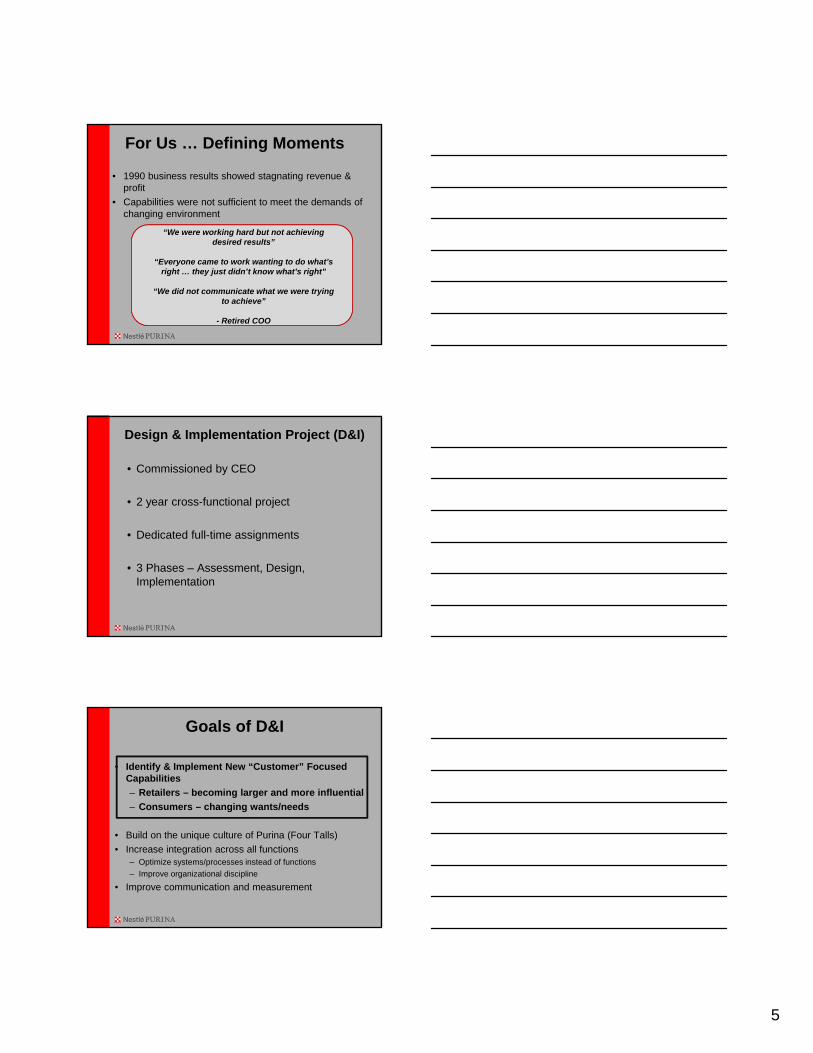
For Us … Defining Moments
• 1990 business results showed stagnating revenue & profit
• Capabilities were not sufficient to meet the demands of changing environment
“We were working hard but not achieving desired results”
“Everyone came to work wanting to do what’s right … they just didn’t know what’s right”
“We did not communicate what we were trying to achieve”
- Retired COO
Design & Implementation Project (D&I)
• Commissioned by CEO
• 2 year cross-functional project
• Dedicated full-time assignments
• 3 Phases – Assessment, Design, Implementation
Goals of D&I
• Identify & Implement New “Customer” Focused Capabilities
– Retailers – becoming larger and more influential
– Consumers – changing wants/needs
• Build on the unique culture of Purina (Four Talls)
• Increase integration across all functions– Optimize systems/processes instead of functions
– Improve organizational discipline
• Improve communication and measurement
6
NPPC’s “Customers” Defined Expansively:
• Retail customers (i.e. Walmart, PetSmart, Kroger, Giant, Safeway, etc.)
• Consumers
• Customers of customers (shoppers)
• Internal “customers”
• Pets
Key Supporting “Mechanism”
Quality Systems:– Customer focused (non-financial) performance measures and
systems that support continuous improvement in customer relations, consumer products and our workplace.
Guiding Principles– Linkage: Continually evaluated by the ability to predict/produce
business results.
– System-based: Implemented with systems that support on-going decision making.
– Model-based: Developed in context with an overall conceptual model.
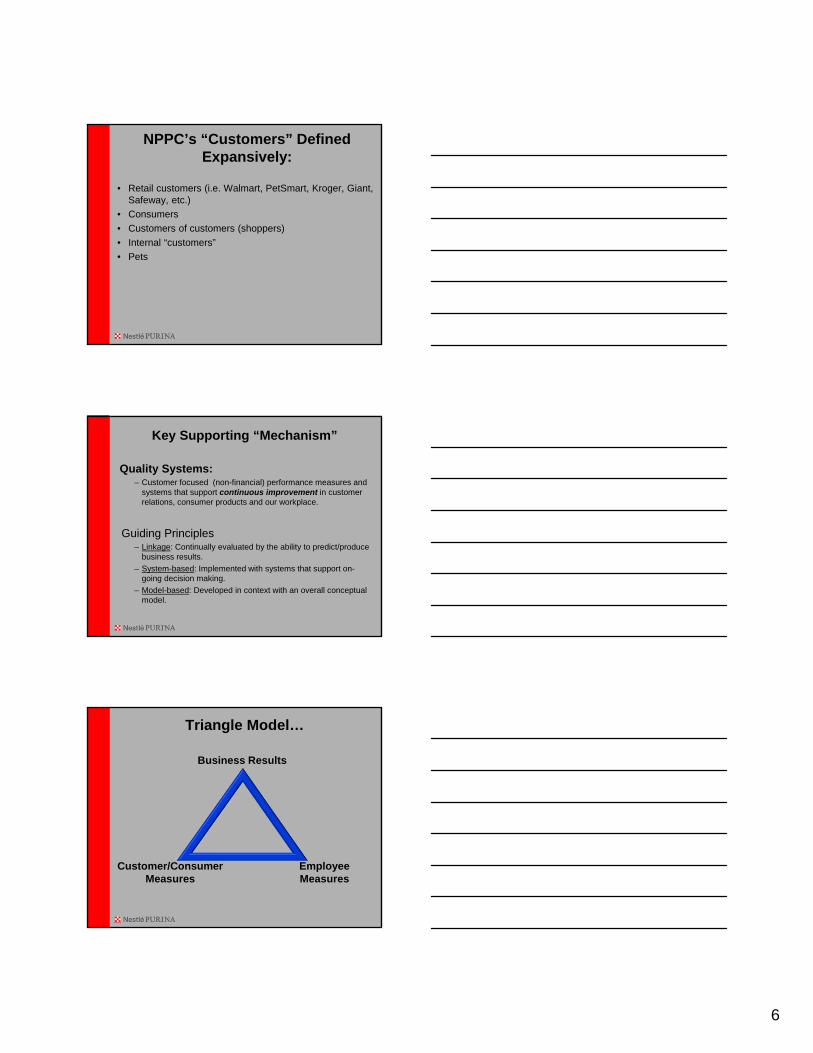
Triangle Model…
Customer/Consumer Measures
Employee Measures
Business Results
7
Listening Posts…
• Product Quality Function Deployment (QFD) (consumer)
• Retail Quality Function Deployment (QFD) (shopper)
• Customer Satisfaction Measurement (retail customer)
• Organizational Capabilities Questionnaire (associates)
• Retailer Advocacy Measurement Project (retail associates)
• Retail Organizational Capabilities Questionnaire
• Internal Customer Satisfaction Surveys
• Leadership Skills Inventory
• Project “Ninja”
• Customer Integration Assessment
• Pet-Decelerators
• Project “Kvetch”
• Etc.
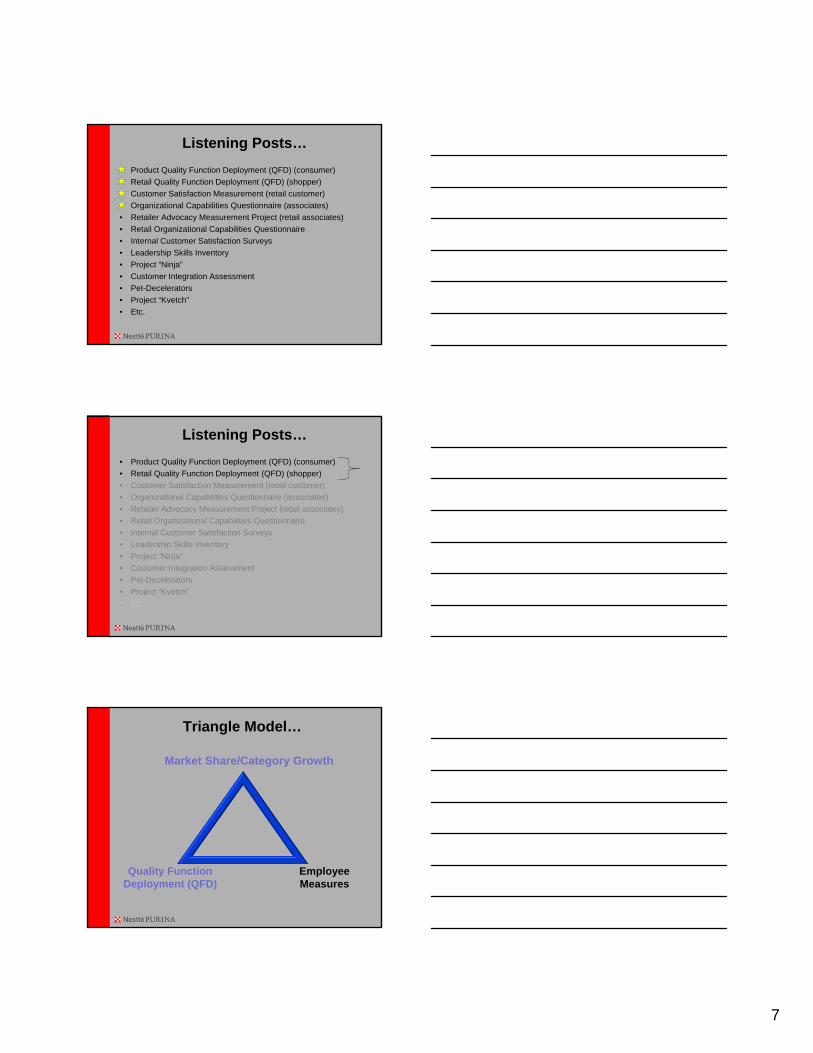
Triangle Model…
Quality Function Deployment (QFD)
Employee Measures
Market Share/Category Growth
8
What is QFD going to tell us?
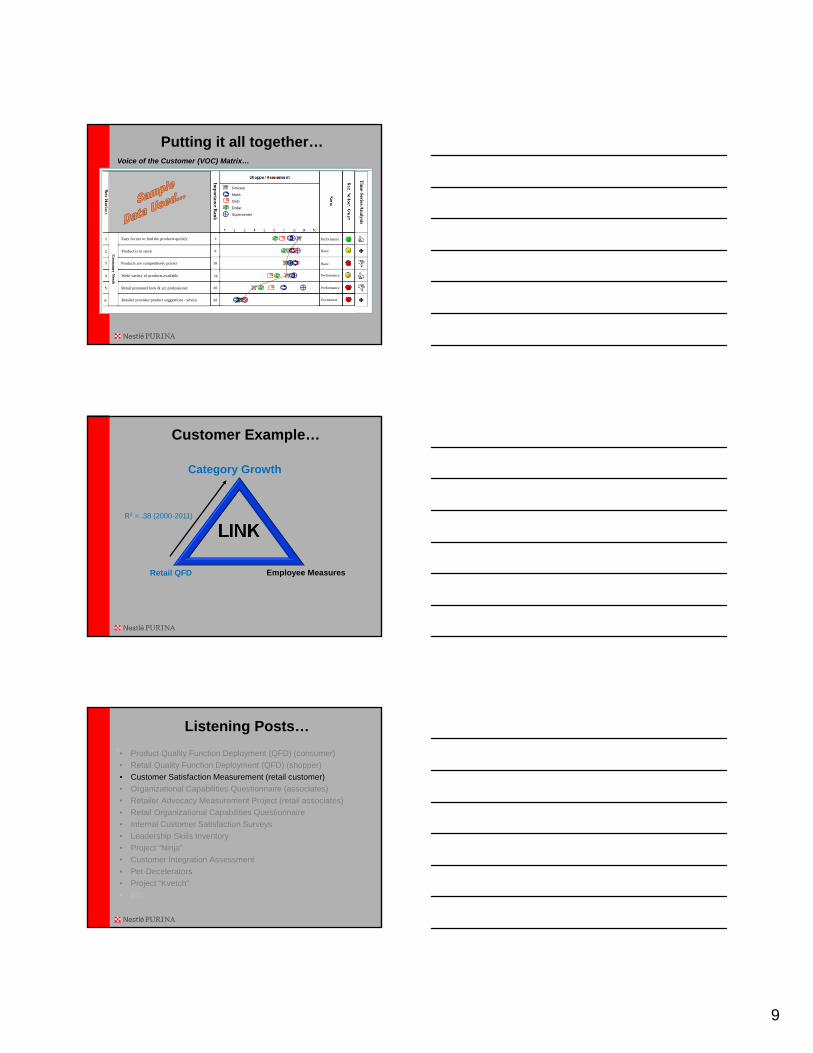
1. What’s important to your customers relative to a product/service?
2. How do your customers rate your product/service on these criteria?
3. How do customers rate your competitions’ product/service on these criteria?
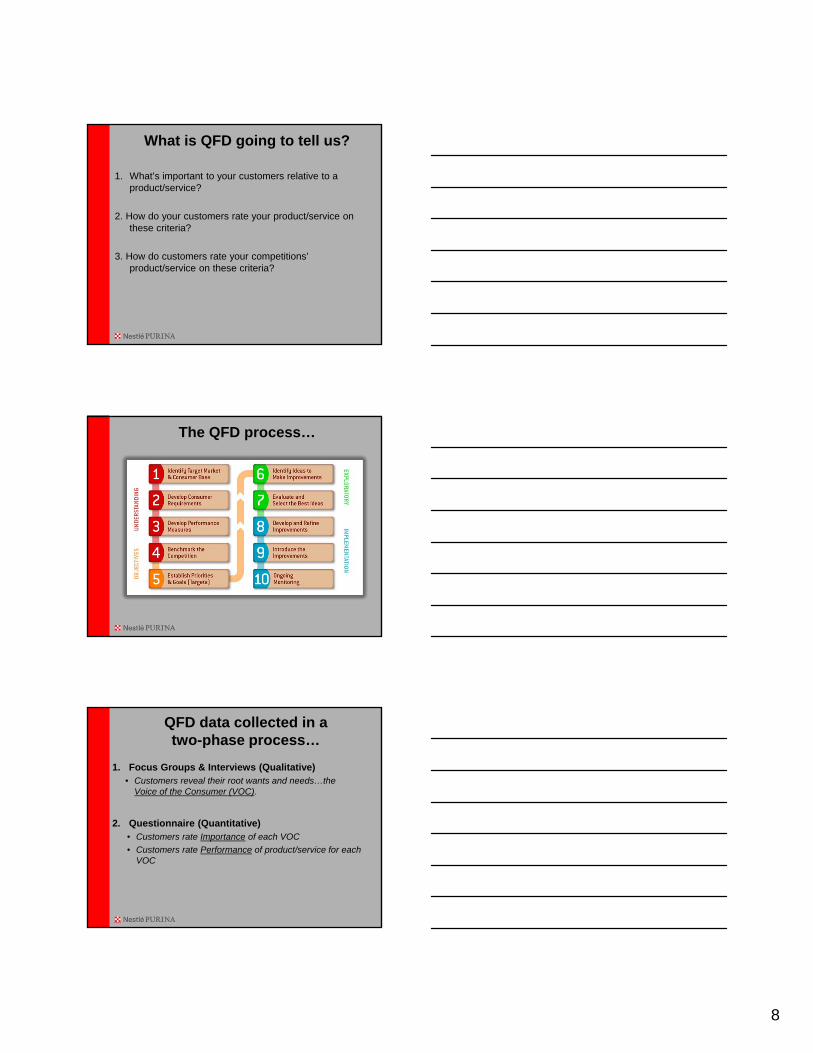
The QFD process…
1. Focus Groups & Interviews (Qualitative)• Customers reveal their root wants and needs…the
Voice of the Consumer (VOC).
QFD data collected in a two-phase process…
2. Questionnaire (Quantitative)• Customers rate Importance of each VOC
• Customers rate Performance of product/service for each VOC
9
Putting it all together…
Performance
Basic
Basic
Performance
Performance
Excitement
2
6
38
29
46
59
1
2
3
4
5
6
Easy for me to find the products quickly
Product is in stock
Products are competitively priced
Wide variety of products available
Retailer provides product suggestions / advice
Retail personnel look & act professional
Importance R
ank
Grocery
Mass
Club
Dollar
Supercenter
Consum
er Needs
Tim
e-Series An
alysis
Voice of the Customer (VOC) Matrix…
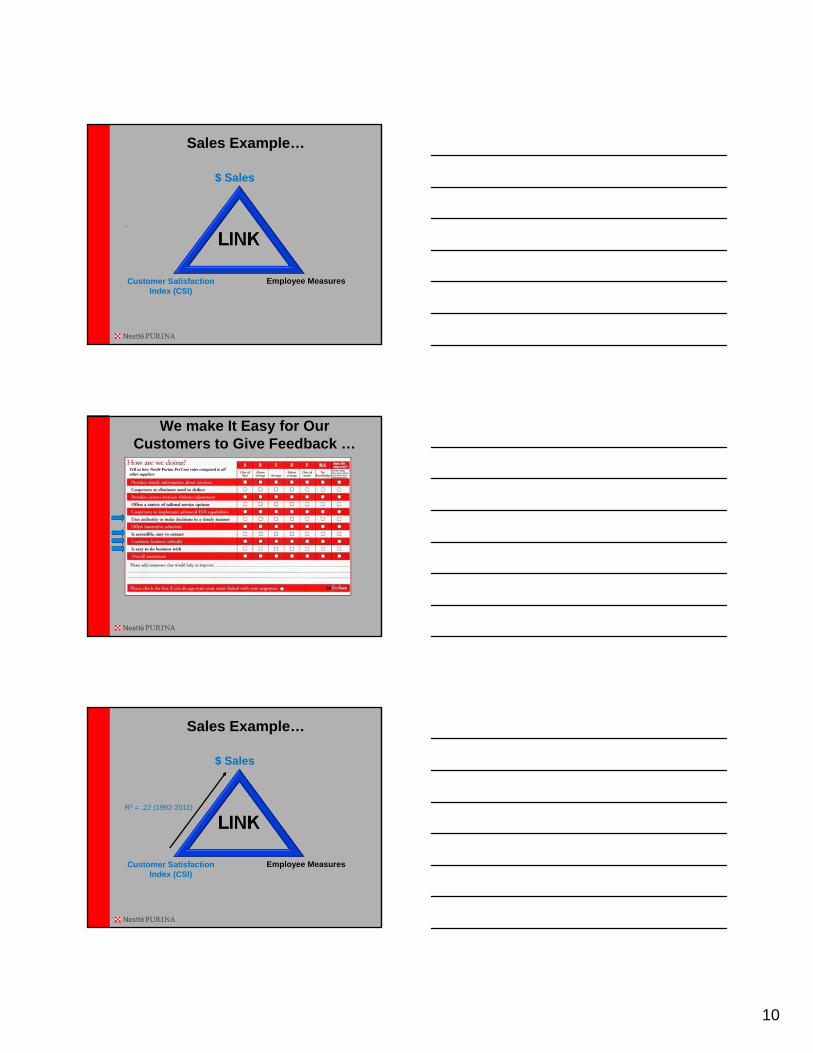
Customer Example…
LINK
Category Growth
Retail QFD Employee Measures
R2 = .38 (2000-2011)
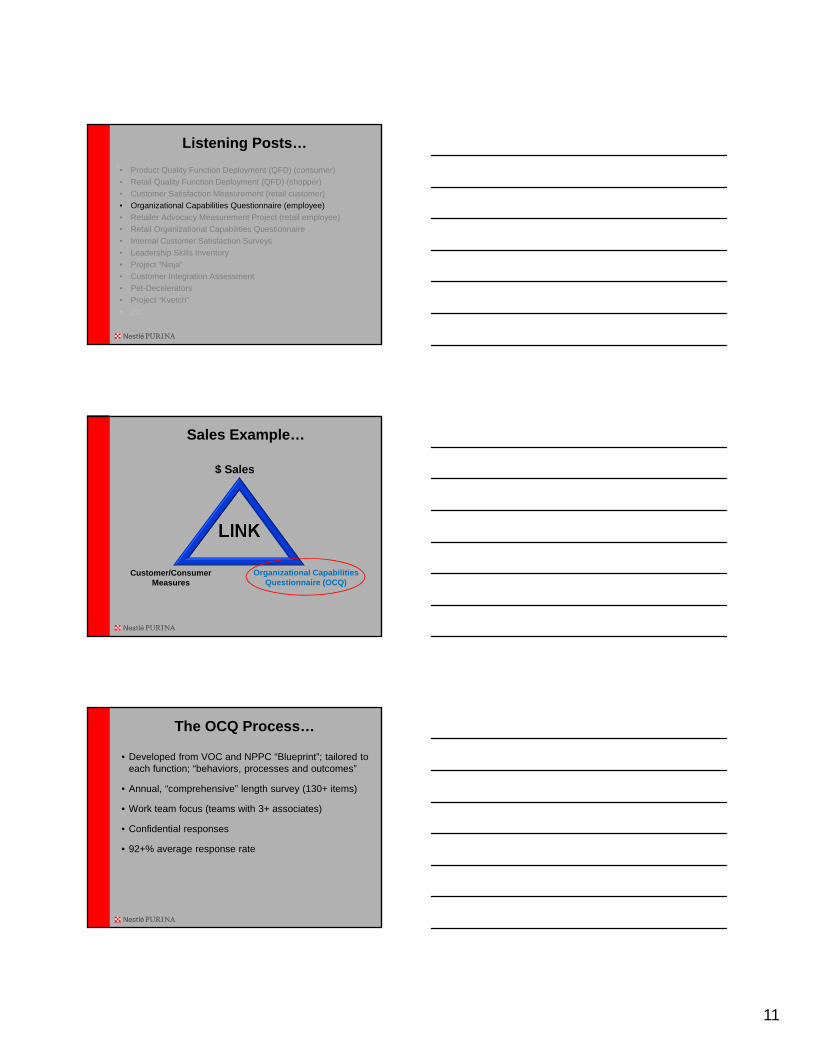
Listening Posts…
• Product Quality Function Deployment (QFD) (consumer)
• Retail Quality Function Deployment (QFD) (shopper)
• Customer Satisfaction Measurement (retail customer)
• Organizational Capabilities Questionnaire (associates)
• Retailer Advocacy Measurement Project (retail associates)
• Retail Organizational Capabilities Questionnaire
• Internal Customer Satisfaction Surveys
• Leadership Skills Inventory
• Project “Ninja”
• Customer Integration Assessment
• Pet-Decelerators
• Project “Kvetch”
• Etc.
10
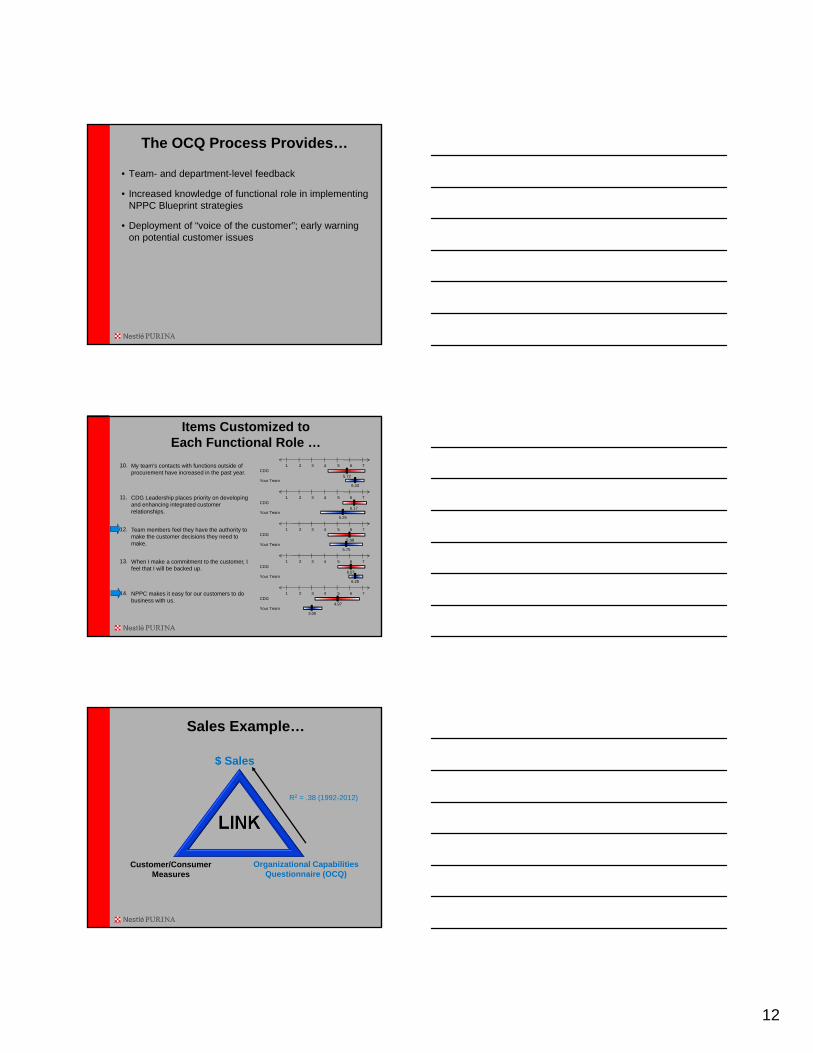
Sales Example…
LINK
$ Sales
Customer Satisfaction Index (CSI)
Employee Measures
..
We make It Easy for Our Customers to Give Feedback …
Tell us how Nestlé Purina Pet Care rates compared to all other suppliers
Sales Example…
LINK
$ Sales
Customer Satisfaction Index (CSI)
Employee Measures
R2 = .22 (1992-2011)
11
Listening Posts…
• Product Quality Function Deployment (QFD) (consumer)
• Retail Quality Function Deployment (QFD) (shopper)
• Customer Satisfaction Measurement (retail customer)
• Organizational Capabilities Questionnaire (employee)
• Retailer Advocacy Measurement Project (retail employee)
• Retail Organizational Capabilities Questionnaire
• Internal Customer Satisfaction Surveys
• Leadership Skills Inventory
• Project “Ninja”
• Customer Integration Assessment
• Pet-Decelerators
• Project “Kvetch”
• Etc.
Sales Example…
LINK
$ Sales
Customer/ConsumerMeasures
Organizational Capabilities Questionnaire (OCQ)
The OCQ Process…
• Developed from VOC and NPPC “Blueprint”; tailored to each function; “behaviors, processes and outcomes”
• Annual, “comprehensive” length survey (130+ items)
• Work team focus (teams with 3+ associates)
• Confidential responses
• 92+% average response rate
12
The OCQ Process Provides…
• Team- and department-level feedback
• Increased knowledge of functional role in implementing NPPC Blueprint strategies
• Deployment of “voice of the customer”; early warning on potential customer issues
Items Customized to Each Functional Role …
1 2 3 4 5 6 7
3.00
14. NPPC makes it easy for our customers to do business with us.
4.97Your Team
CDG
1 2 3 4 5 6 7
6.25
13. When I make a commitment to the customer, I feel that I will be backed up.
6.07Your Team
CDG
1 2 3 4 5 6 7
5.75
12. Team members feel they have the authority to make the customer decisions they need to make.
5.98Your Team
CDG
1 2 3 4 5 6 7
5.25
11. CDG Leadership places priority on developing and enhancing integrated customer relationships.
6.17Your Team
CDG
1 2 3 4 5 6 7
6.33
10. My team’s contacts with functions outside of procurement have increased in the past year.
5.72Your Team
CDG
Sales Example…
LINK
$ Sales
Customer/Consumer Measures
Organizational Capabilities Questionnaire (OCQ)
R2 = .38 (1992-2012)
13
Approach Deployed Throughout NPPC
Safety, Quality, Productivity
CSI
MFG
OCQ
MKTG
OCQProduct Quality
MKT Share
ORM
Fill rates, On Time
OCQCSI
Other Examples
Safety, Quality, Productivity
CSI
MFG
OCQ
MKTG
OCQProduct Quality
MKT Share
ORM
Fill rates, On Time
OCQCSI
Sample Manufacturing Items…• Safety
“We take the time to review all accidents and near misses.”• Quality
“Employees are trained in finding potential problems before they are observed by team leaders or the QA lab.”
• Customer Service“We deliver complete orders/high % fill rate.”
• Target Savings“Employees have an understanding of cost structures and how they can be impacted.”
• Team Effectiveness“My team has a clear understanding of how each other’s roles and responsibilities work together.”
• People Leadership“My supervisor/team leader maintains good working relationships by respecting and cooperating with other departments.”
14
Sample Findings…
• Total production positively correlated with:– Leadership effectiveness subscale
– Perceived respect and trust among team members
– Perceived cooperation of supervisor with other groups
– Perception of supervisor dealing with poor performance in a timely manner
• Recordable injury rate is negatively correlated with:– Perception that associates take the time to review all accidents and
near misses
Sample Findings…
• Final quality is positively correlated with:– Quality subscale
– Customer Service subscale
– Perceptions that they provide high quality unit loads at delivery
• Consumer Complaints Index is negatively correlated with:– Customer Service subscale
• Plant controllable on-time arrival is positively correlated with:
– Perception that they provide orders on time or at the time requested
– Perception that they deliver accurate orders
– Perception that there are effective processes in place for continuously improving shipment accuracy
Marketing…
Safety, Quality, Productivity
CSI
MFG
OCQ
MKTG
OCQProduct Quality
MKT Share
ORM
Fill rates, On Time
OCQCSI
15
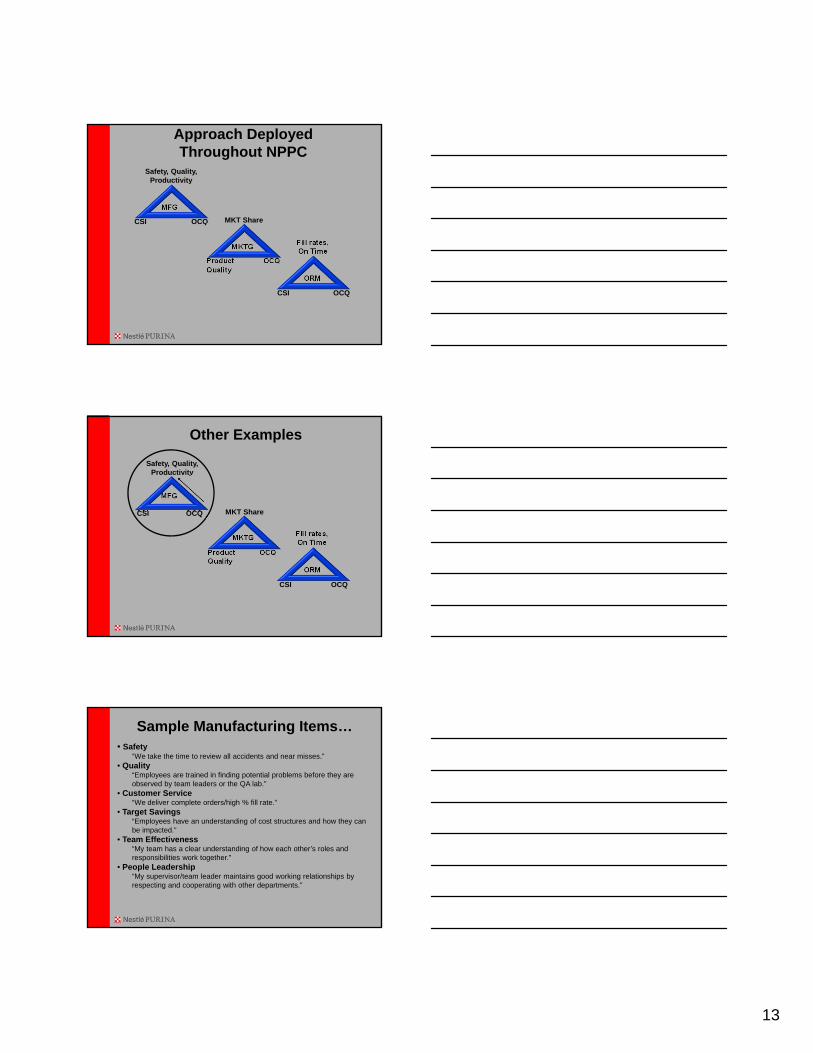
Perceived Quality Matters…
0
10
20
30
40
50
60
70
80
6 7 8 9 10
Rating
SO
R
R2 = .72 (1999-2011)
Brands
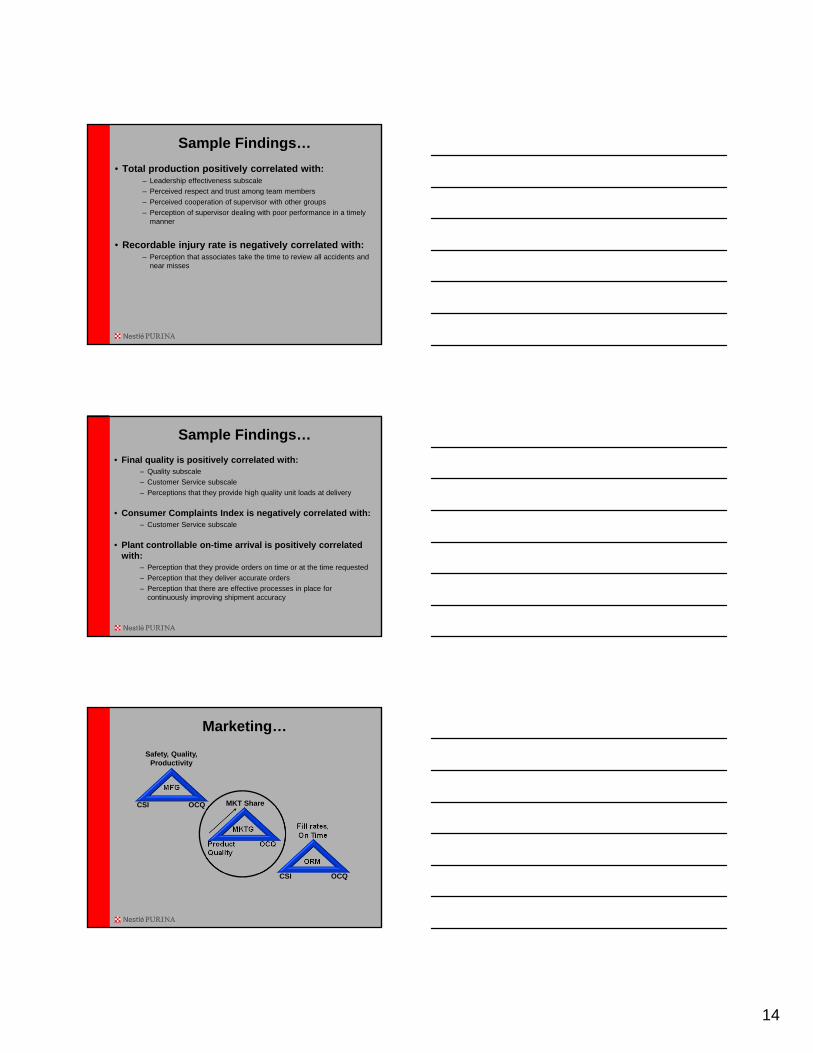
Once Linkage is Established…
CSI
$ Sales
OCQ
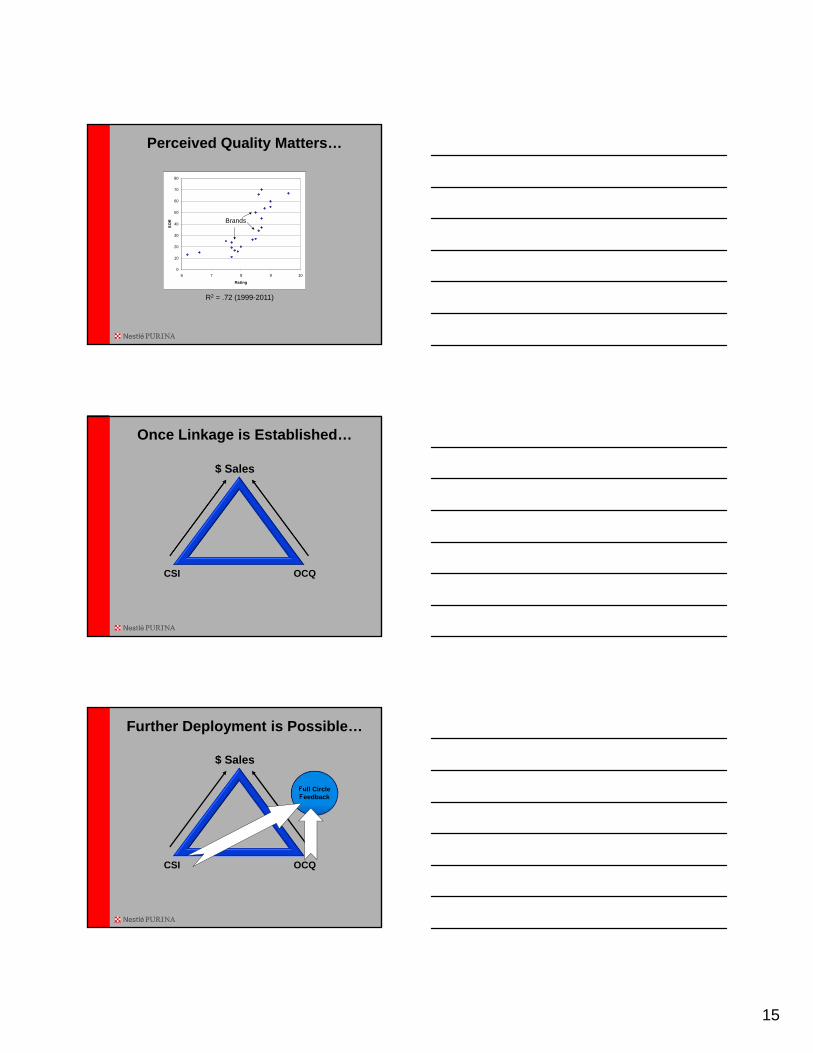
Full Circle Feedback
Further Deployment is Possible…
$ Sales
CSI OCQ
16
Full Circle Feedback “Uploads”…
Importance of the “Voice of the Customer”…
Refine strategy (if necessary)
Review current offerings and service processes; identify potential opportunities
Develop and deploy customer-centric measurement/improvement systems
- customer satisfaction
- employee survey development
- full circle feedback development
Voice of the Customer
(VOC)