net worth and the middle class june 21 - lis cross ... · net worth and the middle class: ......
TRANSCRIPT
FIRST DRAFT DO NOT QUOTE
Net worth and the Middle Class: Patterns of Wealth and Debt
Eva Sierminska, CEPS/INSTEAD, Luxembourg and DIW Berlin
Tim Smeeding, University of Wisconsin, Madison and Institute for Research on
Poverty
Serge Allegrezza, STAEC Luxembourg
Abstract:
In this paper, we take the opportunity to examine wealth portfolios for the middle
class and for various corresponding socio-economic groups. We identify the rich, at
the top of the income distribution, the middle class (middle 60 percent) and the poor
(bottom 20 percent). Instead of focusing on the whole population or only on the
elderly, we examine several household types including, two parents with children and
single parents.
We consider comparable net worth, financial assets, home ownership and net home
value, and debts. In addition, we will discuss the plausible effects of the financial
crisis on selected wealth components and discuss its impact on household
indebtedness. We use data for Italy, Luxembourg, Sweden, the US and the UK from
the recently created Luxembourg Wealth Study (LWS) - a harmonized cross-national
database on household assets and liabilities.

2
I. Introduction
The literature on the middle class indicates that income alone does not define the
middle class. People of this class are more likely to be defined by their values,
expectations or aspirations even though income may constrain to some extent the
manner in which these can be realized. In this paper, we take the opportunity to
examine the joint distribution of income and wealth by focusing our attention on
wealth portfolios of the middle class as defined by income. Since differences in
wealth accumulation exist not only due to institutional differences, but also due to
household structure and household formation we attempt to focus in on differences
due to family situations by examining two types of households: lone-parents and
couples with children.
In considering wealth portfolios we focus on net worth, financial assets, home
ownership and net home value, and debts.. We use data for Italy, Luxembourg,
Sweden, the US and the UK from the recently created Luxembourg Wealth Study
(LWS).
We find that although financial assets do not play a very large role in wealth
portfolios in most countries compared to owned homes, lone-parents are about 20
percentage points less likely to own their home than the rest of the population in all
countries except Luxembourg, and they are just as likely or more likely to be in debt
as the whole population. Couples with children on the other hand, are just as likely to
own financial assets and are more likely to own their home compared to the whole
population and therefore be in debt for that home.
In terms of wealth holdings we find that lone-parents hold on average half of what we
find for couples with children. The value of one’s home is the biggest asset, its value
varies across countries, and its affordability varies consistently with home values.
The indebtedness across countries is in the range of 2-3 times that of annual income
in countries with high indebtedness and is larger in couple families than for lone-
parents.

3
II. Brief Literature Review
We focus our scan of the literature in two areas: the newer cross national literature
on wealth holdings including housing wealth especially, and the research on wealth
holdings of different household types. In both cases, we concentrate almost solely on
cross-national research. We also introduce the affects of asset and debts on single
parents as they have not yet been studied in the cross-national literature on wealth
Wealth in Cross-National Perspective
New studies of comparative wealth holdings—many in the form of singular
components such as owner occupied housing and pensions are just beginning to
emerge over the past 5-7 years (Chiuri and Japelli, 2010; Apgar and Di, 2005;
Banks, Blundell and Smith, 2003; Kapteyn and Panis 2003). Many of these have
been limited because of unavailability of comparable data, or have been limited to
two or three countries where each author harmonizes their own data for purposes of
making a particular comparison and therefore errors in data and measurement are
likely to be higher than with harmonized wealth survey data.
Housing Wealth
Housing wealth is by far the most studied of these components (Chiuri and Japelli
2010; Apgar and Di 2005; Doling, et al. 2004; Claus and Scobie 2001; Banks et al.
2005). While housing is the most widely held real asset in many countries, its effects
on other consumption or on additional wealth accumulations are less generalizable
(Apgar and Di 2005). In the United States, reverse annuity mortgages and home
equity loans are beginning to be used by ‘home rich but cash poor’ elders to access
their savings. Even then, this access is not terribly widespread, occurring to less than
10 percent of United States elders in the early 2000’s (Fisher, et al. 2006; Copeland,
2006; see also Mitchell and Pigot, 2004 on Japan; and Hurst and Stafford 2004, on
the United States). At the same time, Apgar and Di (2005) report that low income
(bottom 20 percent of elders ranked by income) United States units which own their
own homes outright, may still end up spending 25 percent or more on housing due to
property taxes, utilities, and upkeep, and they also are likely to have very low next
worth in these units (Gornick, et al, 2010). Thus, ownership is not without direct costs
even when the mortgage has been paid off and not all elders have large amounts of
home equity.
4
Indeed one could examine housing vs. income poverty and their joint distribution in
cross-national context. The effects of housing on other consumption vary (Carroll
2004; Case, et al. 2005) with MPC’s of 2-8 percent. Similar amounts are found by
Catte, et al. 2004 for a wider range of OECD nations. The effects of housing wealth
on consumption are smaller than those of financial wealth in some studies (Barrel
and Davis 2004), but the results vary with the methods used (see Sierminska and
Takhtamanova 2007, for an overview). Others have made forays on the extent of
financial wealth holdings and their effect on consumption, claiming that the
propensity to hold stocks in the United States is more widespread than in other rich
nations (Dvornak and Kohler 2003) and therefore has a larger effect on spending.
Evidence of home owning and maintenance of housing wealth has been studied by
many analysts in specific countries (e.g., Venti and Wise 2004; and Fisher, et al.
2006, for the United States; Crossley and Ostrovsky 2003, for Canada; Ermisch and
Jenkins 1999, in the United Kingdom; Tatsiramos 2004 for six European nations; and
finally Chiuri and Japelli 2010, more generally using the LIS data). They find that
housing is held long into retirement with the exception of two nations (Finland and
Canada) where the transition from owning to renting takes place later in life. In most
other nations, rules of housing finance, borrowing, and other national idiosyncrasies
have large effects on renting vs. owning across the life cycle (e.g., see Chen 2006;
Chiuri and Japelli 2003; Ortalo–Magne and Rady 2005; Martins and Villanueva
2006).
Wealth and household structure: Single Parents vs Couples
No one has so far produced a complete study of wealth and its distribution amongst
single, divorced and unmarried parents compared to married parents across nations.
And none have targeted the middle class (see US Department of Commerce, 2010)
Middle class families of all types, including single-parent families; aspire to
homeownership, a car, college education for their children, good health insurance
and retirement security. Public policy can help with many of these needs, through
avenues such as guaranteed health insurance and college education subsidies. Of
course some countries, more or less all countries studied here but the United States,
provide guaranteed health insurance and affordable university opportunities for
qualified students. But the majority of these aspirations remain the responsibility of
the family, which must build its own financial security from savings while avoiding
5
creating unsecured debt. And two parent families are much more likely to meet these
standards than are single parent families.
Gender and family wealth gaps for single vs other parents have been studied in the
United States (Sedo and Kossoudji, 2004; Schmidt and Sevak 2006; Conley and
Ryvicker 2005) and in Germany (Frick and Grabka, 2010). Recent studies of the
effect of wealth on marriage and cohabitation in the United States suggest that
wealth also has powerful effects on coupling and assertive mating , thus further
strengthening the wealth position of more advantaged couples (Schneider, 2009).
But cross-national studies on family wealth per se are limited. Recent papers by
Lusardi and coauthors assess household financial risk in the United States (Lusardi,
Schneider and Tufano, 2009, 2010) and across six countries including US, France,
Germany, UK, Canada and Italy, but do not focus on single parents. For the cross
national work, they employ a survey of 7240 households in all six nations conducted
in summer 2009 regarding their risk exposures, risk-bearing capacity, and coping
mechanisms. These studies also do not capture the entire wealth distribution
Bover (2010) studies the effects of wealth inequality and household structure in
Spain and the US and finds that household structure is an important determinant of
the overall wealth distribution. In other recent work, Sierminska and colleagues have
examined gender gaps in wealth in Germany only (Sierminska, Frick, Grabka, 2010),
including unmarried parents and cross-national differences in family structure and
wealth using independent (dummy) variables for age, education and family forms
(Sierminska and Takhtamanova 2007).
Other LWS-based papers have considered the joint distributions of income and
wealth across 5 rich countries, but with no differentiation across family types (Jantii,
et al, 2009). This paper will be the first study to examine both income and wealth
holdings and their joint distributions for various family types using the LWS.
Poverty and Income in Cross-National Perspective among older women and
others
Asset ownership amongst older women and asset and income poverty more
generally has been studied recently using LWS (Gornick et al. 2009; Brandolini et al.
2010.) In most cross-national research on older person’s well-being, income is the
main indicator. A number of researchers have used the Luxembourg Income Study
6
(LIS) data to analyze broader range income disparities amongst elders. Many of
these papers examine the income portfolio of elders (men, women and couples), and
find a balanced package of private or occupational pensions, retirement savings,
earnings and public transfers only at higher income levels. At median and below
median income ranges, social retirement pensions or income tested public transfers
dominate the income sources of elderly units in every nation. But in all of these
studies wealth is rarely mentioned, though Smeeding (2003) capitalizes interest rent
and dividend flows to estimate financial wealth, and he differentiates between
homeowners and renters in some comparisons. Brandolini et al (2010) do a much
broader study for all LWS nations, but without any emphasis on household structure.
And there has been very little study of debt in across national context using LWS or
any other comparable data.
In summary, there is a large gap to be filled in wealth studies by papers using the
LWS data, especially as they address family types and middle class families with
children. This paper is therefore just the tip of a large iceberg of research, which will
contribute to better understanding the joint effects of income and wealth on well
being of vulnerable groups.
III. Data, Variables, Methods, and Measurement Issues.
Data
The empirical work for these analyses is based on data associated with the
Luxembourg Income Study (LIS). LIS is a cross-national archive of harmonized
cross-sectional micro-datasets from across the industrialized countries. For over
twenty years, LIS has collected and harmonized datasets containing income data at
the household- and person-level; these datasets also include extensive demographic
and labor market data.1The data used in this paper are from the Luxembourg Wealth
Study (LWS). The LWS database contains harmonized wealth micro-datasets from
ten rich countries. These wealth datasets also include comparable income data. We
use both components in this paper.
We include six countries: Germany, Italy, Luxembourg2, Sweden, the United
Kingdom and the United States. Our criteria for choosing these countries were the
1 See www.lisproject.org, for a detailed description of the Luxembourg Income Study (LIS), including both the original LIS datasets and the new LWS datasets. See also the first methodological paper from LWS, Sierminska, et. al. (2006a) 2 At the time of writing, the data for Luxembourg have not yet been included in the LWS. As a result, we

7
availability of information on housing and financial wealth. In addition, we chose
countries representing varying economic environments in order to highlight
differences in wealth allocation patterns in the first decade of the XXI century.
The original datasets the LWS project harmonized and which we use here include;
for the United States, the Survey of Consumer Finances (SCF) 2007; for Germany,
the Socio-Economic Panel (SOEP) 2001; for Italy, the Survey of Household Income
and Wealth (SHIW) 2004; for Luxembourg, PSELL-3/EUSILC 2007; for Sweden, the
Wealth Survey 2002; and for the United Kingdom, the British Household Panel Study
(BHPS) 2000.
Income and Wealth—The Aggregate Indicators and Their Components
Our main income variable used in the analyses—is household disposable personal
income (DPI). DPI is defined as the sum of total revenues from earnings, capital
income, private transfers, public transfers (social insurance and public social
assistance)—net of taxes and social security contributions. The income definitions
and basic results regarding income inequality and poverty in the LWS are very close
to those found in LIS, except of course for the fact that LWS also has much more
asset information (Niskanen, 2006)
In the LWS data, these income sources are defined as follows. First, earnings
include wages and salaries, as well as income from self-employment activities.
Second, capital income includes interests and dividends, rental income, income from
savings plans (including annuities from life insurance and private individual
retirement accounts), royalties and other property income.3 Third, private transfers
include occupational and other pensions (e.g., pensions of unknown type or foreign
pensions), alimony, regular transfers from other households/charity/private
institutions, and other incomes not elsewhere classifiable.4 Fourth, public transfers
include social insurance (including some universal benefits such as social retirement
pensions, unemployment insurance, disability benefits and family allowances), as
use raw survey data collected in 2008 for the PSELL-3/EUSILC Luxembourg wealth module. The results will be updated once imputed data become available (late 2010). 3 Capital income does not include capital gains/losses, which are both excluded from the concept of DPI. See Niskanen (2006) on the exact definitions of disposable income in LIS and LWS. 4 Private transfers do not include irregular incomes such as lottery winnings or any other lump-sums, which are excluded from the concept of DPI.
8
well as public social assistance, which includes income tested and means-tested
cash and near-cash public income transfers.5
The counterpart of DPI, with respect to wealth, is the concept of net worth, which
consists of financial assets and non-financial assets—net of total debt. Financial
assets include deposit accounts, stocks, bonds, and mutual funds. Non-financial
assets are broken into two parts: (owned) principal residence and other investment
real estate. Finally, total debt refers to all outstanding loans, both home-secured and
non-home secured. We do not include pension wealth, which has not been realized
in the form of a pension flow or converted to accessible financial assets. We also use
business assets although they are not available for all countries (see methodological
note at the end of the paper and at http://www.lisproject.org/lws.htm).
Analyzing the Economic Well-Being: the Unit of Analysis
In analyzing economic well-being we ignore differentials in holdings amongst
individuals within households (e.g., between spouses) because many sources of
income and wealth cannot be disaggregated within households. The unit of analysis
is the household, or all the individuals within such households. Since assets are
recorded on a household level, we implicitly assume full sharing of all resources
amongst members of the household. We analyze the whole population and also
focus on two types of households: single parents and parent households (See
Appendix Table and methodological note for more details.).
Analyzing the Economic Well-Being: Methods for Equivalizing Income and
Wealth, and Other Data Adjustments
After providing an overview of portfolios across countries, we focus our analysis on
the middle class. We define the middle class as households located in the middle 60
percent of the income distribution. We use DPI and divide the income distribution into
3 parts. The bottom 20% are labeled as “bottom”; the middle 60 percent as “middle”,
and the top 20 percent are labeled as “top.”
5 Our income measure does not include health care benefits in-kind, even we know that they are large (Garfinkel, Rainwater and Smeeding 2006), nor does it contain in-kind housing benefits in the form of imputed rent. It does include the cash value of having allowances, food stamps, and heating allowances.
9
As is standard in research on income, we “equivalize” the income data—meaning,
we adjust each household's income to account for household size. Incomes are
equivalized as follows: adjusted income equals unadjusted income divided by the
square root of household size. Although there is a large literature on income
equivalency scales, there is much less consensus about how to equivalize wealth.
The only paper we know of on this topic is Sierminska and Smeeding (2005) and it
suggests little difference between the wealth distribution whether eqivalized or not.
In our analyses, we do not equivalize the wealth data. Incomes are bottom-coded at
1 percent of the mean equivalized DPI and top-coded at 10 times the median
amount. The wealth variables are not bottom-coded or top-coded and as a result
wealth variables (net worth in particular) can contain negative and zero values.
Because the top and bottom ends of these wealth distributions may differ across
countries, depending on the quality of the wealth survey and the sampling practices
among the richest portions of the population we also rely on medians in our analysis.
All observations with missing or zero disposable income or missing net worth are
dropped from the sample. Furthermore, when we report actual currency amounts, all
amounts are expressed as United States dollars, adjusted by purchasing power
parities (PPPs), using the 2007 OECD individual consumption by households PPPs.
Amounts referring to years prior to 2007 are deflated using each country's CPI.
IV. Results
We begin by presenting a set of basic results followed by discussion in section V.
Descriptive statistics for the whole population are followed by deeper analyses of
wealth across the income distribution. We examine the portfolio composition, wealth
packages and financial asset holdings and housing values. Next, we examine
housing affordability and indebtedness for lone-parents and households with
children. Readers should keep in mind that wealth values e.g., for homes vs.
financial wealth, may be sensitive to the year and date at which data are recorded.
Asset Participation and Wealth Holding: the Big Picture
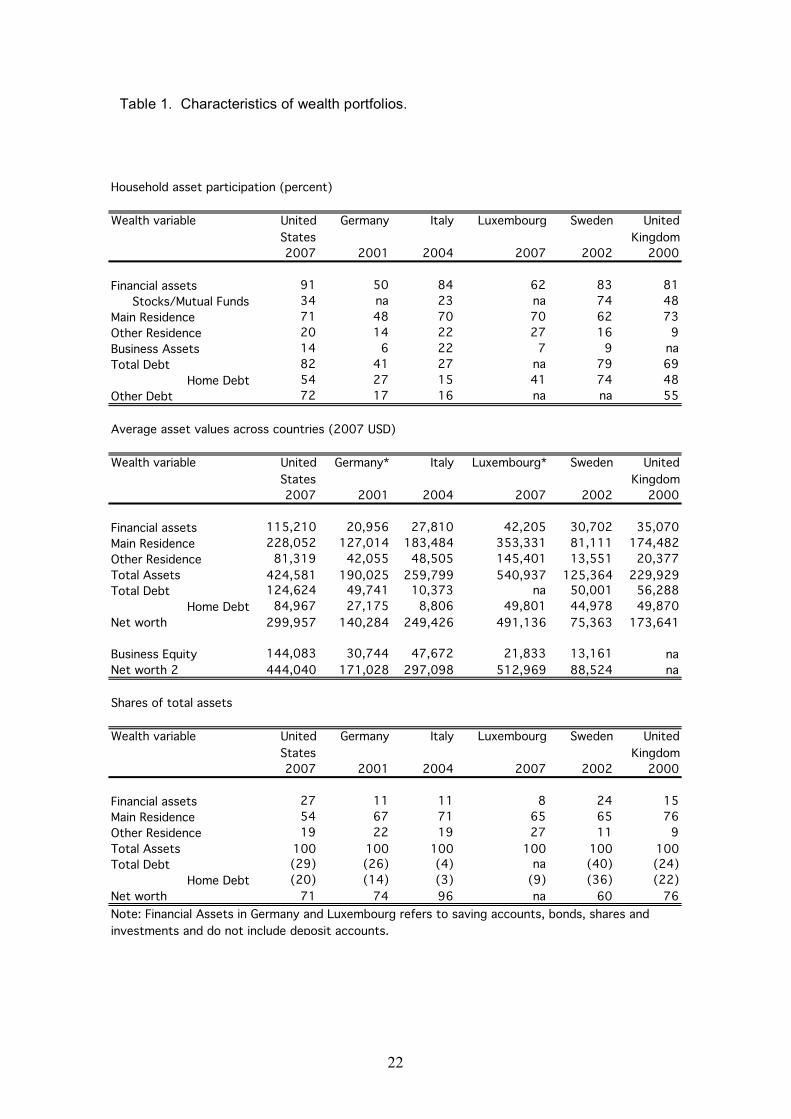
Patterns of asset holding and portfolio composition across these countries differ less
in terms of prevalence of assets than in level or composition of those assets (Table
1).6 Excluding Germany and Luxembourg (due to its bottom code for financial
assets), about 80-90 percent of households are likely to hold some form of financial
6 Simply stated, ownership is one way to consider assets, another is valuation.
10
assets. Stock and mutual fund ownership is far less prevalent, except for Sweden
(74%) and then the United Kingdom (48%) and the United States (34%). In Germany
and Luxembourg savings and other type of investments are held by at least half of
the population. Except Germany (48%), home ownership is quite uniform across
countries with about 2/3 of the population owning their main residence. Owning a
business is most prevalent in Italy (22%) and then the United States (14%) with a 6-9
percent ownership in Germany, Luxembourg and Sweden.
Although financial asset holdings are widespread, they account for at most a quarter
of total assets only in Sweden and in the United States, where financial wealth is 24
and 27 percent, respectively of the total wealth portfolio (Table 1, Panel C). In the
other countries financial holdings are only 8 to 15 percent of total wealth
Non-financial assets and particularly the main residence is the most important part of
assets in all countries and particularly in the United Kingdom (76% of total assets)
and Italy (71% of total assets). These are also about 65 percent in Germany,
Luxembourg and Sweden and less than 55 percent only in the United States. In
Luxembourg, about a quarter of the population owns other real estate, a pattern also
prevalent in the United States and Italy. Only in the United Kingdom do less than 10
percent of households own other real estate.
Debt is widespread in Sweden (79 percent), the United States (82 percent) and the
UK (69 percent), we suspect for tax reasons, but also depends on the availability of
home loans. In Luxembourg at most 41% of households have home secured debt
(home mortgages) and in Germany and Italy an even smaller share of households
(27 and 15 percent, respectively). This suggests that most homeowners in Italy are
outright owners.
Wealth levels differ across countries. Cross-nationally in our sample, the United
States has the largest levels of investments in financial assets, while Luxembourg is
the top country in non-financial assets, mainly due to high real estate prices. Given
that this is the main portfolio item in all nations this also yields the highest net-worth
levels based on our definition. Luxembourg is followed by the United States and Italy.
The home debt levels (for owners who still owe mortgages) hover around $50,000 in
Luxembourg, Sweden and the United Kingdom. This constitutes a low 9 percent of
total assets in Luxembourg to a high 36 percent in Sweden.

11
Asset Participation and Wealth Holding: across the Income Distribution
Next, we focus on the joint distribution of income and wealth by examining the
probability of owning assets across the income distribution. We distinguish between
those at the bottom (bottom 20 percent of the distribution), in the middle (middle 60
percent) and at the top (top 20 percent) of the income distribution for all persons . We
focus our analysis on the middle class in a cross-national perspective, but then in
comparison to both ends of the distribution
The probability of having financial assets among the middle class remains high (over
0.8) in the United States, Italy, Sweden, and in the United Kingdom, while in
Germany and Luxembourg it is about 50-60 percent. The probability of owning ones
homes among the middle class remains close to the average with a little over 2/3
homeowners (except Germany). Indebtedness is also high in the United States,
Sweden and the United Kingdom and lower in Germany (44 percent) and Italy (28
percent). Home secured debt is most prevalent in Sweden, where 77 percent of
households report holding household secured debt, and then it is the US (59 percent)
and about half in Luxembourg and the UK. The lowest probability of having home-
secured debt is in Germany and Italy (29 and 14 percent respectively, owing mainly
to outright home ownership in the latter).
We do observe large differences in asset participation between the bottom and
middle of the distribution particularly for homeownership with differences of 20 to 30
percentage points. There are also differences for debt participation, but not as high
as for home ownership, indicating that poorer renters sometimes fall in debt to
finance their spending. Generally, at the top of the distribution more households own
financial assets, homes, investment real estate, their own businesses, but also more
of these have debt to finance these purchases-also making them vulnerable in case
of unexpected life events.
Asset Participation and Wealth Holding: Lone Parents and Couples with
Children
As pointed out in Bover (2010) differences in wealth accumulation across countries
not only exist due to institutional differences, but due to household structure and
household formation. In order to be able to net out differences due to family
12
demographics and examine comparable households we focus on two types of
households with children: lone-parents and couples with children.7
In terms of differences in family demographics across countries we find (see
Appendix table) that in Germany and Luxembourg around half of lone-parent
households are in the bottom of the distribution and half in the middle of the
distribution hence they are relatively poorer than the rest of the population and those
in other countries, consistent with other studies of the middle class (US Department
of Commerce, 2010). There are very few lone parents in the top of the distribution.
Couple families on the other hand, are more evenly distributed except in Sweden
where they are more likely to be in the middle of the distribution.
Lone-parents are slightly less likely to own financial assets compared to the rest of
the population in Germany, Sweden, the United Kingdom and the United States; and
about 20 percentage points less likely to own their home in all countries except
Luxembourg (almost no difference). They are just as likely to be in debt as the whole
population in Germany, the United Kingdom and the United States and more likely in
Italy and Sweden (less likely in Luxembourg). There are very big differences in
ownership between lone-parents in the middle and bottom of the distribution.
Differences in homeownership, for example are in the range of 20 (in Sweden) to 40
(in the US) percentage points. Differences in financial asset ownership are small in
Luxembourg (6 percentage points) and 17 to 25 percentage points in Sweden, the
UK and Germany and very high in the United States (34 percentage points) and Italy
(41 percentage points). Differences are more striking for home debt (due to
differences in homeownership rates) than in other types of debt.
Couples with children are just as likely to own financial assets and are more likely to
own their home than the whole population particularly in Germany and Sweden. They
are also more likely to be in debt in Germany (17 percentage points), Italy (9
percentage points), Sweden (15 percentage points), the UK (18 percentage points)
and the US (7 percentage points). In Luxembourg they are more likely to have a
mortgage by 4 percentage points compared to the whole population.
Wealth Packages across the Income Distribution
7 We do not create a separate category for “other” type of households with children, but focus exclusively on households that include parents and children only.
13
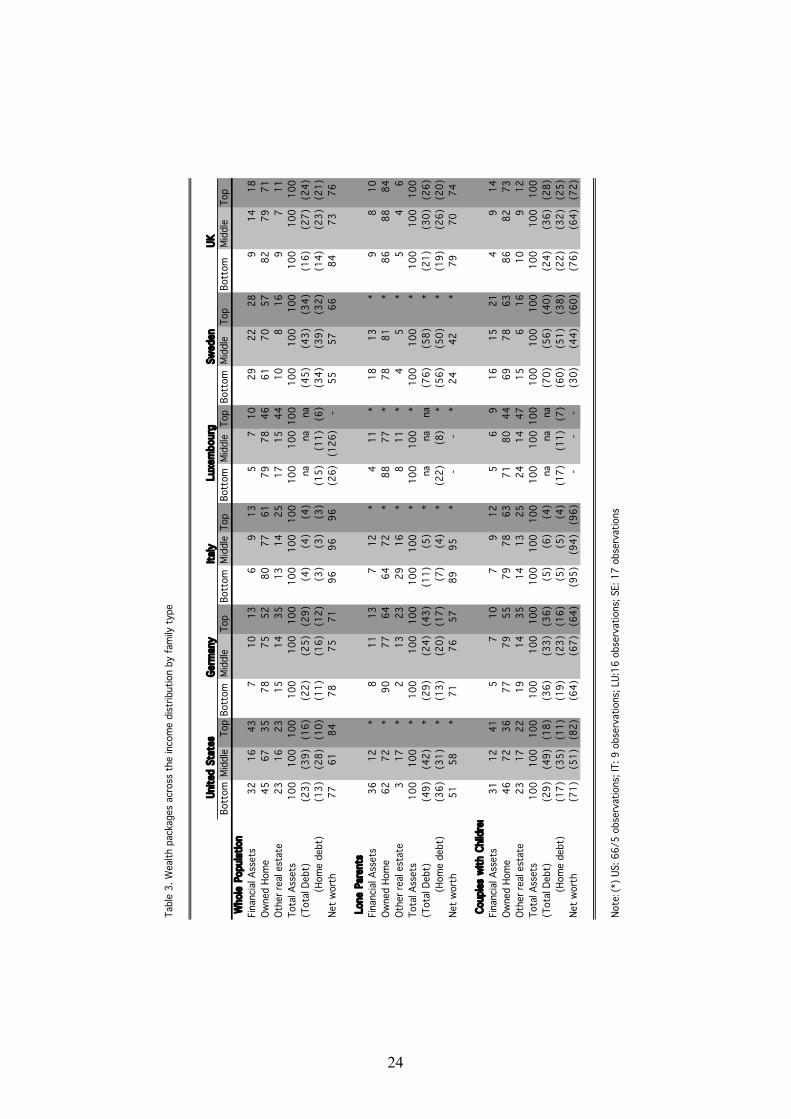
We compare wealth packages in Table 3, which express financial assets, non-
financial assets and debt as a share of total assets. In the middle of the income
distribution, the owned home takes up about 75% of the wealth portfolio of lone-
parents and couples with children and a slightly larger share in the portfolios of lone
parents in Sweden and the United Kingdom. The main home takes up a similar share
of the wealth portfolio for those at the bottom of the distribution and the home
ownership rate is much lower. In the United States for both, lone parents and couples
the share is lower for those at the bottom of the distribution; in Italy for lone-parents;
in Germany and Luxembourg it is higher for lone-parents. Debt has the highest value
(as a share of total assets) in Sweden (58 percent), the United States (42 percent),
the UK (30 percent), Germany (24 percent) and Italy (5 percent) among lone-parents.
The same ranking and similar shares are observed among couples with children.
Hence, regardless of the household structure debt is most prevalent in Sweden and
the United States, while it is least important in Italy. Luxembourg does not contain full
information on the indebtedness of the population and home debt represents a rather
low share of total assets compared to the other countries.
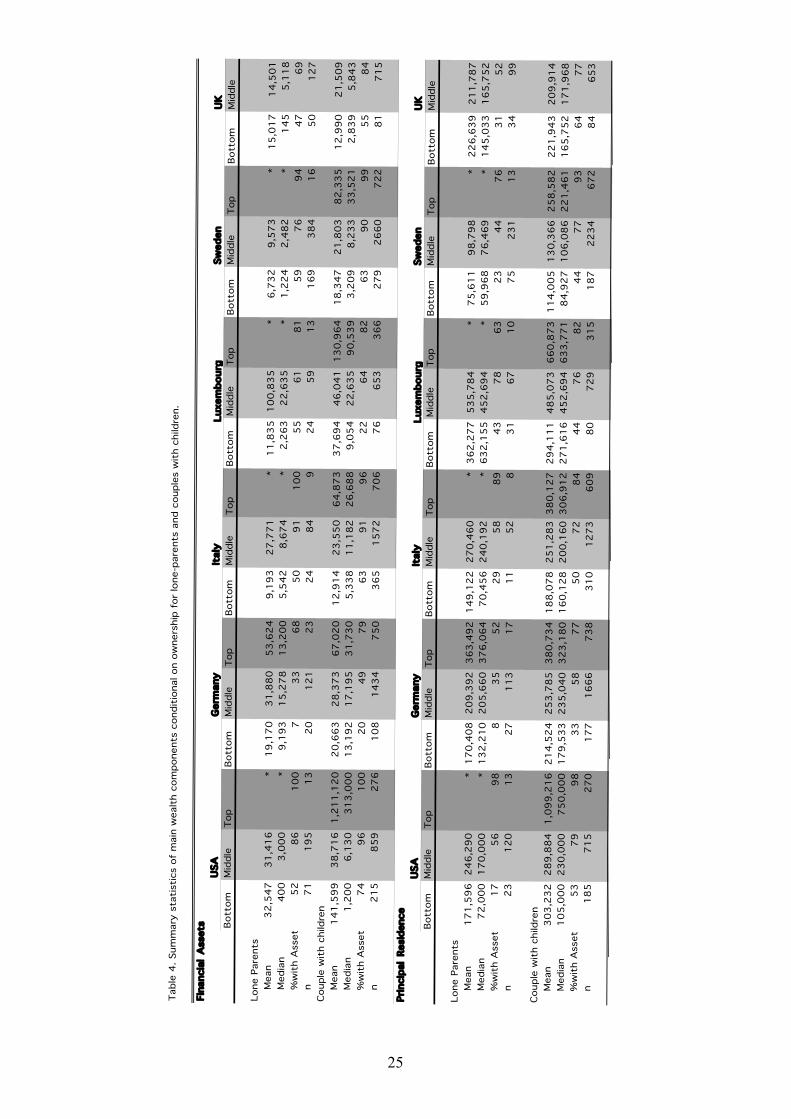
Financial Assets
Next, we examine in more detail the main components of the wealth portfolio. The
patterns of financial wealth holdings are examined in the first panel of Table 4, with
mean and median values given for those with positive wealth holdings for lone
parents and couples with children. Lone-parents in Italy, Germany and US who own
financial assets hold on average $30,000. In Sweden and the UK it is about $10,000
and in Luxembourg lone-parents in the middle of the distribution hold over $100,000.8
The values are more compressed at the median for Italy, Sweden, the UK and the
US (between $2,500-$8,500); and Luxembourg remains an outlier at $22,500. The
values are bottom coded for Germany (at $2,500) and not that representative. Values
for couples with children are also modest compared to Luxembourg. These parent
households in Italy, Sweden, the UK and the United States hold between $6,000-
$12,000 financial wealth at the median, twice as much in Luxembourg. At the mean
these values are compressed around $20,000-$25,000 (the US is an exception, but it
oversamples the very wealthy, which may be driving the results at the mean as can
be seen from the “top” column), except for Luxembourg ($45,000).
8 The result for Luxembourg may be due to inheritances or asset gifts received from parents or grandparents, which will be investigated further. We should also reiterate that in this first version of the paper we are using raw-unimputed data for this country.

14
Home Ownership and Value
There is not much variation across average home values for lone-parents in
Germany, the UK, the United States, and Italy ($209,000 - $270, 000) compared to
the two outliers: Sweden (with a mean of $98,000) and Luxembourg (with a mean
home value of $535,000). Based on the median there is a shuffling of home values
with the lowest in the UK ($165,000), the US ($170,000), Germany ($206,000) and
the highest in Italy ($240,000). The two outliers remain: Sweden ($76,500) and
Luxembourg ($450,000). For couples with children the home values are higher by
about $50,000 in Germany, Sweden and the United States, similar in the UK, and
lower or the same in Italy and Luxembourg. In all countries homeownership rates
among parents with children are higher than those for lone-parents, except for in
Luxembourg where they are the similar.
Home affordability
Owning ones home is one of the key aspirations of the middle class. We treat home
affordability as an important characteristic of the housing market and examine it
based on the relationship of gross housing values and income. We proxy for
affordability, by examining home value-income ratios. We divide the income
distribution into bottom, middle and top and within these calculate mean and median
home values and incomes for homeowners. The ratios of these values are presented
in Table 5. First, as expected, we find that the housing wealth/income ratios diminish
for all countries as we move up the income distribution regardless of the household
type, except for Sweden. Second, the rankings across countries in terms of the
highest home value to income ratios are quite consistent across the income
distribution with Luxembourg, Italy and Germany exhibiting the highest ratios (being
the least affordable), followed by the UK, the US and Sweden for the whole
population and lone-parents, and followed by the US, the UK and Sweden for
couples with children. The highest ratios are in countries with the highest home
values and relatively low incomes, the lowest where there are lower incomes and low
home values. The wealth-income ratios are quite similar in all countries for the top
portion of the income distribution although the same rankings prevail. Conventional
wisdom suggests that homes are more affordable for couples with children than for
lone-parents. Our results indicate that this is not necessarily the case for all
countries. The home value-income ratios are higher for lone-parents than for couples
15
in Italy, Luxembourg and the United Kingdom and lower in Germany and Sweden.
The results in the United States vary depending on the statistic used with average
home-income ratios being higher for lone-parents and median for couples. At the
bottom of the distribution they are higher for couples regardless of the measure used.
Aside from home values we also compare outstanding home debt as compared to
annual income (Table 6). Generally, we find that indebtedness of those at the bottom
of the distribution is larger than of those at the top. Comparing across countries, the
largest indebtedness is in the US, the UK and Sweden (in the range of 2-3 times
annual incomes) and the smallest in Italy with Germany and Luxembourg being in
the middle (1-2 annual incomes). In all countries except in Sweden the indebtedness
ratio is larger for couples with children than for lone-parents. This suggest that once
again, two parent families find housing loans more plentiful and much more
affordable.
Effects of the Crisis
The great recession of 2008-2010 has played havoc with jobs and income of the
middle class and also in many countries with asset values. The income stabilizers in
Europe (unemployment insurance mainly) have helped keep most middle class
families from ruin. While financial assets have regained about 75 percent of the value
lost since the recession as of March 2010, home values remain depressed,
especially in the United States where about 16 percent of owners are “under water”
meaning they owe more in mortgage debt on this house than the value of the house
(Smeeding and Thompson, 2010). Such families tend to be younger and have
purchased homes near the peak of the 2000’s housing boom. Similar circumstances
are liable to be found in the UK. But housing prices in Europe—Germany, Italy,
Luxembourg and Sweden, have fallen little according to the OECD (2009). Moreover,
the stricter lending requirements have produced far fewer families who are under
water on their main asset, the family home.
V. Conclusion
We find that the home is the most important asset in wealth packages,
especially for the middle class, and making up about 75 percent of total assets
across the nations studied here. Financial assets do not play a very important role in
the wealth portfolio in most nations and especially for the bottom income class.

16
We find that lone-parents are slightly less likely to own financial assets compared to
the rest of the population and about 20 percentage points less likely to own their
home in all countries except Luxembourg. They are just as likely to be in debt as the
whole population in Germany, the United Kingdom and the United States and more
likely in Italy and Sweden (less likely in Luxembourg).Couples with children on the
other hand, are just as likely to own financial assets and are more likely to own their
home than the whole population particularly in Germany and Sweden. They are also
more likely to be in debt, but most of the value of that debt is related to owning a
home
In terms of wealth holdings we find that lone-parents hold on average
$30,000 in financial assets and less than $10,000 at the median. Luxembourg is a
big exception with on average $100,000 and $22,500 at the median for financial
assets possibly coming from asset gifts or inheritance. Couples with children have on
average $20,000-$25,000 and $6,000-$12,000 at the median. Luxembourg again
here is an exception with much larger values. The value of ones home is the biggest
asset and its value varies across countries and its affordability varies consistently
with home values. The indebtedness across countries is in the range of 2-3 times
that of annual income in countries with high indebtedness and is larger in couple
families than for lone-parents.
17
References
Apgar, William C, and Zhu Xiao Di. 2005. “Housing Wealth and Retirement Savings:
Enhancing Financial Wealth for Older Americans.” W05-8. Joint Center for
Housing Studies, Harvard University.
Banks, James, Richard Blundell, Zoe Oldfield, and James P. Smith. 2005. “House
Price Volatility and Housing Ownership Over the Life Cycle.” Discussion
Paper 04-09. University College London February 2005.
Banks, James, Richard Blundell, and James P. Smith. 2003. “Understanding
Differences in Household Financial Wealth between the United States and
Great Britain.” Journal of Human Resources 38 (2): 241-279.
Barrell, Ray, and E Philip Davis. 2004. “Consumption, Financial and Real Wealth in
the G-5.” Discussion Paper number 232. National Institute of Economic and
Social Research. May, 2004.
Bover, Olympia.2010.”Wealth Inequality and Household Structure: US vs.Spain”.
RIW, 56(5), June:259-290
Brandolini, A., S. Magri, and T. M. Smeeding. 2010. “Asset-Based Measurement of
Poverty.” Journal of Policy Analysis and Management Winter, 29(2): 267-284.
Carroll, Christopher. 2004. “Housing Wealth and Consumption Expenditure.”
Presented at the Academic Consultants' Meeting of the Board of Governors
of the Federal Reserve System.
Case, Karl E, John M. Quigley, and Robert J Shiller. 2001. “Comparing Wealth
Effects: The Stock Market versus the Housing Market.” 8606. National
Bureau of Economic Research.
Catte, Pietro, Nathalie Girouard, Robert Price, and Christopher Andre. 2004.
“Housing Markets, Wealth and the Business Cycle.” 394. OECD Working
Paper. December.
Chen, Kaiji. 2006. “The Welfare Implications of Social Security for
Homeowners.”Univerisity of Oslo. March.
Chiuri, Maria Concetta, and Tullio Jappelli. 2003. “Financial Market Imperfections
and Howm Ownership: A Comparative Study.” European Economic Review
47: 857-875.
Churi, Maria Concetta, and Tullio Jappelli. 2010. “Do the Elderly Reduce Housing
Equity? An International Comparison.” Journal of Population Economics, 23
(2): 643-663.
18
Claus, Iris, and Grant Schobie. 2001. “Household Net Wealth: An International
Comparison.” Working Paper 2001/19. The Treasury of New Zealand,
Wellington.
Conley, Dalton and Miriam Ryvicker. 2004. “The Price of Female Headship: Gender,
Inheritance, and Wealth Accumulation in the United States.” Journal of
Income Distribution, Fall 2004/Winter 2005, Vol. 13, Issue ¾: p41-56.
Copeland, Craig. 2006. “Debt of the Elderly and Near Elderly, 1992 - 2004.”
Employee Benefit Research Institute 27 (9) (September)
Crossley, Thomas, and Yuri Ostrovsky. 2003. “A Synthetic Cohort Analysis of
Canadian Housing Careers.” Social and Economic Dimensions of an Aging
Population Research Paper, 107. McMaster University.
Doling, John, Marja Elsinga, Peter Boelhouwer, and Janet Ford. 2004. “Playing
Snakes and Ladders: The Gains and Losses for Homeowners.” Presented at
ENHR Conference, Cambridge, England.
Dvornak, Nikola, and Marion Kohler. 2003. “Housing, Wealth, Stock Market Wealth
and Consumption: A Panel Analysis for Australia.” Economic Research
Department Discussion Paper 2003-07.
Ermisch, John, and Stephen Jenkins. 1999. “Retirement and Housing Adjustments in
Later Life: Evidence for the British Households Panel Study Survey.” Labour
Economics 6: 311-333.
Fisher, Jonathan, David Johnson, Joseph Marchand, Timothy M. Smeeding, and
Barbara Boyle Torrey. 2006. “No Place Like Home: Older Adults, Housing,
and Life-Cycle.” Journal of Gerontology: Social Sciences
Frick, Joachim R. and Markus M. Grabka. 2010. “Alterssicherungsvermo¨gen da¨mpft
Ungleichheit - abergroße Vermo¨genskonzentration bleibt bestehen.” DIW-
Wochenbericht 77: 2–12
Garfinkel, Irwin, Lee Rainwater, and Timothy M. Smeeding. 2006. “A Reexamination
of Welfare State and Inequality in Rich Nations: How In-Kind Transfers and
Indirect Taxes Change the Story.” Journal of Policy Analysis and
Management 25 (4)
Gornick, Janet C., Eva Sierminska, and Timothy M. Smeeding. 2009. “The Income
and Wealth Packages of Older Women in Cross-National Perspective.”
Journal of Gerontology: Social Sciences 64B(3): 402-414.
Hurst, Eric, and Frank Stafford. 2004. “Home is Where the Equity Is: Mortgage
Refinancing and Household Consumption.” The Journal of Money, Credit and
Banking 36: 985-1014.
19
Jantti, Markus, Eva Sierminska, and Timothy M. Smeeding. 2009. “How is Household
Income and Wealth Distributed? Evidence from the Luxembourg Wealth
Study.” Chapter 11 in Growing Unequal, OECD: Paris, France. Pp. 253-271.
Kapteyn, Arie, and Constantijn Panis. 2003. “The Size and Composition of Wealth
Holdings in the United States, Italy, and the Netherlands.” NBER Working
Paper Series, 10182. Cambridge, MA. December.
Lusardi,Annamaria, Daniel Schneider and Peter Tufano.2009. “Household Risk: A
Cross-Country Study of Household Financial Risk. December, AEA
presentation
Lusardi, Annamaria,Daniel Schneider and Peter Tufano. 2010. Households at Risk:
US Households’ Capacity to Cope with Risk March 22, Dartmouth College
working paper
Martins, Nuno, and Ernesto Villanueva. 2006. “Does Limited Access to Mortgage
Debt Explain Why Young Adults Live with Their Parents?”Journal of the
European Economic Association (forthcoming)
Mitchell, Olivia S., and John Piggott. 2004. “Unlocking Housing Equity in Japan.”
NBER, W10340. Cambridge, MA: NBER. March.
Niskanen, Emilia. 2006. “The Luxembourg Wealth Study: Technical Report on
LWS Income Variables.” LIS.Luxembourg. April. OECD.2009. Economic Outlook, Issue 2, annex table 59. Paris, OECD
Ortalo-Magne, Francois, and Sven Rady. 2005. “Housing Market Dynamics: On the
Contribution of Income Shocks and Credit Constraints.”University of
Wisconsin.
Schmidt, L. and Sevak, P. (2006) Gender, marriage, and asset accumulation in the
United States, Feminist Economics, 12, 139–66.
Schneider, Daniel. 2009 “Wealth and the Marital Divide.” Working Paper, Population
Studies Center, Princeton University
Sedo, S.A. and Kossoudji, S.A. (2004) Rooms of one’s own: gender, race and
homeownership wealth accumulation in the United States, IZA Discussion
Paper No. 1397, Bonn, Germany.
Sierminska, Eva, Joachim Frick and Markus Grabka, 2010. “Examining the gender
wealth gap.” Oxford Economic Papers. doi: 10.1093/oep/gpq007
Sierminska, Eva and Yelena Takhtamanova.2007” Wealth Effects out of Financial
and Housing Wealth: Cross-Country and Age Group Comparisons “LWS
Working paper #4: http://www.lisproject.org/publications/lwswps/4.pdfworking
paper
20
Sierminska, Eva, A Brandolini, and Timothy M. Smeeding. 2006. “The Luxembourg
Wealth Study - A Cross-Country Database for Household Wealth Research.”
Journal of Economic Inequality 4 (3): 323-332.
Sierminska, Eva, and Timothy M. Smeeding. 2005. “Measurement Issues:
Equivalence Scales, Accounting Framework and Reference Unit.”
Luxembourg Income Study.Luxembourg.
Smeeding, Timothy M., and Jeff E. Thompson. 2010. “Inequality in the Distribution of Income from Labor and Income from Capital over the Recession.” Presented at the Tobin Conference on Inequality Wenham, MA. May 1, and the IZA/OECD Workshop: Economic Crisis, Rising Unemployment and Policy Responses: What Does It Mean for the Income Distribution?, February, Paris
Smeeding, Timothy M. 2006. “Poor People in a Rich Nation: The United States in
Comparative Perspective.” Journal of Economic Perspectives 20 (1): 69-90.
Smeeding, Timothy M. 2003. “Income Maintenance in Old Age: Current Status and
Future Prospects for Rich Countries.” Genus LIX (1) (April-June): 51-83.
Tatsiramos, Konstantinos. 2004. “Residential Mobility and the Housing Adjustment of
The Elderly: Evidence from the ECHP for 6 European Countries.” European
University Institute.Florence.
Venti, Steven F., and David A. Wise. 2004. “Aging and Housing Equity: Another
Look.” in Perspectives in the Economics of Aging, University of Chicago
Press. 2004.
U. S. Department Of Commerce .2010. “The Middle Class in America ” by the
Economics and Statistics Administration .January . available at :
http://www.commerce.gov/news/fact-sheets/2010/01/25/middle-class-
america-taskforce-report-pdf
Methodological notes
Sample: All observations with missing or zero DPI or missing NW1 were dropped
from the sample.

21
Household types:
1. “single-parent “ households are composed of 1-adult and at least 1-child and
no one else.
2. “couples with children” households are composed of 2-adults and at least 1-
child
Definition of disposable income: disposable income is the LIS-DPI variable of the
LWS datasets (i.e. cash and noncash income next or direct taxes, without imputed
rents, one-time lump sums and capital gains and losses). In all cases incomes are
adjusted by E=0.5 where ADI=unadjusted income (I) divided by household size (S)
to the power E .Incomes were bottom coded at 1% of the mean equivalized DPI and
top coded at 10 times the median unequivalized DPI.
Definition of net worth income: net worth is the NW1 variable of the LWS datasets
(see www.lisproject.org/lws.html ). It includes financial assets (deposit accounts,
stocks, bonds and mutual funds) and non-financial assets (principal residence and
investment real estate). Financial assets exclude life insurance and unrealized
pension assets and non-financial assets exclude business assets, business debt,
vehicles, durables and/or collectibles. We also use net worth 2 (NW2) in one table,
which is net worth (NW1) augmented with business equity. Wealth variables are NOT
bottom coded and top coded.
Real dollar values: for income and wealth are expressed in PPP terms using the
2007 OECD individual consumption PPPs (amounts referring to years prior to 2007
were inflated using OECD CPI indices within each country)
22
Table 1. Characteristics of wealth portfolios.
Household asset participation (percent)
Wealth variable United
States
Germany Italy Luxembourg Sweden United
Kingdom
2007 2001 2004 2007 2002 2000
Financial assets 91 50 84 62 83 81
Stocks/Mutual Funds 34 na 23 na 74 48
Main Residence 71 48 70 70 62 73
Other Residence 20 14 22 27 16 9
Business Assets 14 6 22 7 9 na
Total Debt 82 41 27 na 79 69
Home Debt 54 27 15 41 74 48
Other Debt 72 17 16 na na 55
Average asset values across countries (2007 USD)
Wealth variable United
States
Germany* Italy Luxembourg* Sweden United
Kingdom
2007 2001 2004 2007 2002 2000
Financial assets 115,210 20,956 27,810 42,205 30,702 35,070
Main Residence 228,052 127,014 183,484 353,331 81,111 174,482
Other Residence 81,319 42,055 48,505 145,401 13,551 20,377
Total Assets 424,581 190,025 259,799 540,937 125,364 229,929
Total Debt 124,624 49,741 10,373 na 50,001 56,288
Home Debt 84,967 27,175 8,806 49,801 44,978 49,870
Net worth 299,957 140,284 249,426 491,136 75,363 173,641
Business Equity 144,083 30,744 47,672 21,833 13,161 na
Net worth 2 444,040 171,028 297,098 512,969 88,524 na
Shares of total assets
Wealth variable United
States
Germany Italy Luxembourg Sweden United
Kingdom
2007 2001 2004 2007 2002 2000
Financial assets 27 11 11 8 24 15
Main Residence 54 67 71 65 65 76
Other Residence 19 22 19 27 11 9
Total Assets 100 100 100 100 100 100
Total Debt (29) (26) (4) na (40) (24)
Home Debt (20) (14) (3) (9) (36) (22)
Net worth 71 74 96 na 60 76
Note: Financial Assets in Germany and Luxembourg refers to saving accounts, bonds, shares and
investments and do not include deposit accounts.

23
Tabl
e 2
. Por
tfol
io c
ompo
siti
on a
cros
s th
e in
com
e di
strib
utio
n by
fam
ily t
ype
Bott
omM
iddl
eTo
pBo
ttom
Mid
dle
Top
Bott
omM
iddl
eTo
pBo
ttom
Mid
dle
Top
Bott
omM
iddl
eTo
pBo
ttom
Mid
dle
Top
All
Fin.
Ass
ets
70
95
10
02
35
37
85
98
99
52
96
47
96
38
59
75
98
29
5
Risk
y A
sset
s1
43
67
5na
nana
42
04
7na
nana
48
75
93
23
44
74
Hom
e4
47
69
42
84
97
05
57
08
24
07
48
13
26
48
55
67
09
2
Oth
er R
esid
ence
10
19
53
51
33
71
52
03
71
12
35
16
14
34
67
15
Busi
ness
Ass
ets
11
12
37
24
19
16
18
40
45
14
69
12
nana
na
Tota
l Deb
t6
28
78
42
14
46
11
92
83
3na
na
na
58
81
93
53
69
82
Hom
e D
ebt
25
59
72
11
29
43
91
42
32
34
54
34
47
79
02
44
86
7
Oth
er D
ebt
53
77
52
11
18
20
12
18
15
nana
na
nana
na
39
56
62
Lone
Par
ents
Fina
ncia
l Ass
ets
52
86
*7
33
68
50
91
*5
56
1*
59
76
*4
76
99
2
Risk
y1
02
4*
nana
na6
18
*na
nana
53
69
*8
32
64
Ow
ned
Hom
e1
75
6*
83
55
22
95
8*
43
78
*2
34
4*
31
52
93
Oth
er r
eal e
stat
e3
13
*1
93
02
12
0*
13
14
*3
8*
24
10
Busi
ness
Ass
ets
57
*2
12
02
17
*2
7*
43
*na
nana
Tota
l Deb
t5
68
9*
21
42
61
26
37
*na
nana
80
90
*6
47
28
4
Hom
e de
bt1
44
7*
52
23
61
41
4*
24
39
*6
98
5*
17
40
56
Oth
er D
ebt
53
84
*1
72
03
42
02
6*
nana
nana
nana
58
63
66
Cou
ples
wit
h ch
ildre
n
Fina
ncia
l Ass
ets
74
96
10
02
04
97
96
39
19
62
26
48
26
39
09
95
58
49
6
Risk
y1
63
98
6na
nana
32
24
6na
nana
52
84
97
26
44
76
Ow
ned
Hom
e5
37
99
83
35
87
75
07
28
44
47
68
24
47
79
36
47
79
6
Oth
er r
eal e
stat
e1
22
05
97
14
42
14
21
39
15
23
50
10
13
41
12
81
5
Busi
ness
Ass
ets
19
15
44
35
25
21
26
44
46
16
11
10
10
na
nana
Tota
l Deb
t7
39
49
13
66
17
42
63
73
7na
nana
86
96
98
76
87
91
Hom
e de
bt3
97
18
52
14
45
71
22
02
92
94
94
88
09
49
64
26
77
7
Oth
er D
ebt
61
84
53
17
23
22
16
22
15
nana
nana
nana
51
70
72
Not
e:(*
) U
S: 6
6/5
obs
erva
tion
s; IT
: 9 o
bser
vati
ons;
LU
:16
obs
erva
tion
s; S
E: 1
7 o
bser
vati
ons
Swed
enU
nite
d Kin
gdom
Uni
ted
Stat
esG
erm
any
Ital
yLu
xem
bour
g
24
Tab
le 3
. W
eal
th p
acka
ges
acro
ss t
he inco
me d
istr
ibuti
on b
y f
amily
type
Germ
any
Italy
Sw
eden
UK
Bott
om
Mid
dle
Top
Bott
om
Mid
dle
Top
Bott
om
Mid
dle
Top
Bott
om
Mid
dle
Top
Bott
om
Mid
dle
Top
Bott
om
Mid
dle
Top
Whole
Popula
tion
Finan
cial
Ass
ets
32
16
43
71
01
36
91
35
71
02
92
22
89
14
18
Ow
ned H
om
e4
56
73
57
87
55
28
07
76
17
97
84
66
17
05
78
27
97
1
Oth
er
real
est
ate
23
16
23
15
14
35
13
14
25
17
15
44
10
81
69
71
1
Tota
l A
ssets
10
01
00
10
01
00
10
01
00
10
01
00
10
01
00
10
01
00
10
01
00
10
01
00
10
01
00
(Tota
l D
ebt)
(23
)
(39
)
(16
)
(22
)
(25
)
(29
)
(4)
(4)
(4)
na
na
na
(45
)
(43
)
(34
)
(16
)
(27
)
(2
4)
(Hom
e d
ebt)
(13
)
(28
)
(10
)
(11
)
(16
)
(12
)
(3)
(3)
(3)
(15
)
(11
)
(6)
(3
4)
(39
)
(32
)
(14
)
(23
)
(2
1)
Net
wort
h7
7
61
84
7
8
75
71
9
6
96
96
(2
6)
(12
6)
-
55
57
66
84
7
3
7
6
Lone P
are
nts
Finan
cial
Ass
ets
36
12
*8
11
13
71
2*
41
1*
18
13
*9
81
0
Ow
ned H
om
e6
27
2*
90
77
64
64
72
*8
87
7*
78
81
*8
68
88
4
Oth
er
real
est
ate
31
7*
21
32
32
91
6*
81
1*
45
*5
46
Tota
l A
ssets
10
01
00
*1
00
10
01
00
10
01
00
*1
00
10
0*
10
01
00
*1
00
10
01
00
(Tota
l D
ebt)
(49
)
(42
)
*(2
9)
(24
)
(43
)
(11
)
(5)
*na
na
na
(76
)
(58
)
*(2
1)
(30
)
(2
6)
(Hom
e d
ebt)
(36
)
(31
)
*(1
3)
(20
)
(17
)
(7)
(4)
*(2
2)
(8)
*
(56
)
(50
)
*(1
9)
(26
)
(2
0)
Net
wort
h5
1
58
*7
1
76
57
8
9
95
*-
-
*
24
42
*7
9
7
0
7
4
Couple
s w
ith C
hild
ren
Finan
cial
Ass
ets
31
12
41
57
10
79
12
56
91
61
52
14
91
4
Ow
ned H
om
e4
67
23
67
77
95
57
97
86
37
18
04
46
97
86
38
68
27
3
Oth
er
real
est
ate
23
17
22
19
14
35
14
13
25
24
14
47
15
61
61
09
12
Tota
l A
ssets
10
01
00
10
01
00
10
01
00
10
01
00
10
01
00
10
01
00
10
01
00
10
01
00
10
01
00
(Tota
l D
ebt)
(29
)
(49
)
(18
)
(36
)
(33
)
(36
)
(5)
(6)
(4)
na
na
na
(70
)
(56
)
(40
)
(24
)
(36
)
(2
8)
(Hom
e d
ebt)
(17
)
(35
)
(11
)
(19
)
(23
)
(16
)
(5)
(5)
(4)
(17
)
(11
)
(7)
(6
0)
(51
)
(38
)
(22
)
(32
)
(2
5)
Net
wort
h(7
1)
(51
)
(82
)
(64
)
(67
)
(64
)
(95
)
(94
)
(96
)
-
-
-
(30
)
(44
)
(60
)
(76
)
(64
)
(7
2)
Note
:(*)
US: 6
6/5
obse
rvat
ions;
IT: 9
obse
rvat
ions;
LU
:16
obse
rvat
ions;
SE: 1
7 o
bse
rvat
ions
Luxe
mbourg
Unit
ed S
tate
s
25
Table
4. Sum
mary
sta
tisti
cs o
f m
ain
wealt
h c
om
ponents
condit
ional on o
wners
hip
for
lone-p
are
nts
and c
ouple
s w
ith c
hildre
n.
Fin
ancia
l A
ssets
USA
Germ
any
Italy
Sw
eden
UK
Bott
om
Mid
dle
Top
Bott
om
Mid
dle
Top
Bott
om
Mid
dle
Top
Bott
om
Mid
dle
Top
Bott
om
Mid
dle
Top
Bott
om
Mid
dle
Lone P
are
nts
Mean
32
,54
73
1,4
16
*1
9,1
70
31
,88
05
3,6
24
9,1
93
27
,77
1*
11
,83
51
00
,83
5*
6,7
32
9,5
73
*1
5,0
17
14
,50
1M
edia
n4
00
3,0
00
*9
,19
31
5,2
78
13
,20
05
,54
28
,67
4*
2,2
63
22
,63
5*
1,2
24
2,4
82
*1
45
5,1
18
%w
ith A
sset
52
86
10
07
33
68
50
91
10
05
56
18
15
97
69
44
76
9n
71
19
51
32
01
21
23
24
84
92
45
91
31
69
38
41
65
01
27
Couple
wit
h c
hildre
n
Mean
14
1,5
99
38
,71
61
,21
1,1
20
20
,66
32
8,3
73
67
,02
01
2,9
14
23
,55
06
4,8
73
37
,69
44
6,0
41
13
0,9
64
18
,34
72
1,8
03
82
,33
51
2,9
90
21
,50
9M
edia
n1
,20
06
,13
03
13
,00
01
3,1
92
17
,19
53
1,7
30
5,3
38
11
,18
22
6,6
88
9,0
54
22
,63
59
0,5
39
3,2
09
8,2
33
33
,52
12
,83
95
,84
3%
wit
h A
sset
74
96
10
02
04
97
96
39
19
62
26
48
26
39
09
95
58
4n
21
58
59
27
61
08
14
34
75
03
65
15
72
70
67
66
53
36
62
79
26
60
72
28
17
15
Princip
al
Resid
ence
USA
Germ
any
Italy
Sw
eden
UK
Bott
om
Mid
dle
Top
Bott
om
Mid
dle
Top
Bott
om
Mid
dle
Top
Bott
om
Mid
dle
Top
Bott
om
Mid
dle
Top
Bott
om
Mid
dle
Lone P
are
nts
Mean
17
1,5
96
24
6,2
90
*1
70
,40
82
09
,39
23
63
,49
21
49
,12
22
70
,46
0*
36
2,2
77
53
5,7
84
*7
5,6
11
98
,79
8*
22
6,6
39
21
1,7
87
Media
n7
2,0
00
17
0,0
00
*1
32
,21
02
05
,66
03
76
,06
47
0,4
56
24
0,1
92
*6
32
,15
54
52
,69
4*
59
,96
87
6,4
69
*1
45
,03
31
65
,75
2%
wit
h A
sset
17
56
98
83
55
22
95
88
94
37
86
32
34
47
63
15
2n
23
12
01
32
71
13
17
11
52
83
16
71
07
52
31
13
34
99
Couple
wit
h c
hildre
n
Mean
30
3,2
32
28
9,8
84
1,0
99
,21
62
14
,52
42
53
,78
53
80
,73
41
88
,07
82
51
,28
33
80
,12
72
94
,11
14
85
,07
36
60
,87
31
14
,00
51
30
,36
62
58
,58
22
21
,94
32
09
,91
4M
edia
n1
05
,00
02
30
,00
07
50
,00
01
79
,53
32
35
,04
03
23
,18
01
60
,12
82
00
,16
03
06
,91
22
71
,61
64
52
,69
46
33
,77
18
4,9
27
10
6,0
86
22
1,4
61
16
5,7
52
17
1,9
68
%w
ith A
sset
53
79
98
33
58
77
50
72
84
44
76
82
44
77
93
64
77
n1
85
71
52
70
17
71
66
67
38
31
01
27
36
09
80
72
93
15
18
72
23
46
72
84
65
3
Luxem
bourg
Luxem
bourg

26
Table 5. Home value and income ratios by for all homeowners and by household type.
Income US Germany Italy Sweden UK
quantiles Bottom Middle Top Bottom Middle Top Bottom Middle Top Bottom Middle Top Bottom Middle Top Bottom Middle Top
All
Mean 32.00 7.93 5.50 20.81 10.71 7.08 20.31 12.84 8.49 22.68 15.75 10.07 7.08 4.72 4.60 21.39 8.44 6.21
Median 14.71 6.68 4.25 16.84 9.70 6.99 15.52 11.30 8.37 17.22 15.33 10.44 4.76 3.76 4.10 14.26 6.76 5.97
Lone Parents
Mean 19.12 9.38 * 17.99 9.61 8.28 30.96 14.46 * 26.25 18.04 * 6.99 5.17 * 28.01 8.92 5.98
Median 8.52 7.27 * 13.17 9.93 8.79 18.29 12.62 * 25.13 17.00 * 4.88 4.21 * 14.77 7.54 4.69
Couples with children
Mean 43.84 8.69 7.77 22.74 10.95 7.89 24.67 13.30 9.17 19.41 15.96 10.36 11.91 5.69 6.23 32.83 8.60 7.14
Median 13.28 7.48 6.04 17.28 10.46 7.71 19.46 10.48 9.14 16.43 15.56 11.23 8.09 4.67 5.91 23.60 6.89 6.28
NOTE: Home value/income
Luxembourg
Table 6. Home debt value and income ratios by for all homeowners and by household type.
Income United States Germany Italy Sweden UK
quantiles Bottom Middle Top Bottom Middle Top Bottom Middle Top Bottom Middle Top Bottom Middle Top Bottom Middle Top
All
Mean 10.35 3.48 1.80 3.05 2.40 1.74 0.75 0.54 0.46 4.39 2.16 1.41 3.57 2.57 2.63 4.07 2.51 1.98
Median 1.76 2.91 1.37 0.00 1.07 1.12 0.00 0.00 0.00 1.43 1.07 0.32 0.16 1.98 2.00 0.00 2.14 1.78
Lone Parents
Mean 14.29 3.96 * 2.59 2.48 2.18 * 0.88 * 6.47 1.92 * 3.27 2.82 * 5.80 2.64 1.50
Median 5.93 3.39 * 0.30 1.31 2.75 * 0.00 * 4.08 0.85 * 1.95 2.33 * 4.85 2.27 1.48
Couples with children
Mean 16.14 4.41 2.52 5.63 3.27 2.40 1.28 0.75 0.52 4.52 2.26 1.60 8.84 0.24 3.74 7.51 3.37 2.45
Median 4.72 3.86 1.82 2.95 2.65 2.12 0.00 0.00 0.00 1.71 1.31 0.80 4.67 0.27 3.30 4.85 3.13 1.97
NOTE: Home debt value/income
Italy: LP: bottom 11 observations, top 8 observations; Sweden: LP: top 13 observations; LU: LP top 10 obs.
Luxembourg

27
Appe
ndix
Tab
le. S
ampl
e de
scrip
tives
.
Shar
e of
fam
ilies
by
inco
me
type
.
Italy
Bott
omM
iddl
eTo
pBo
ttom
Mid
dle
Top
Bott
omM
iddl
eTo
pBo
ttom
Mid
dle
Top
Bott
omM
iddl
eTo
pBo
ttom
Mid
dle
Tota
lTo
tal
Tota
lTo
tal
Tota
l
Lone
Par
ents
149
18
124
15
32
12
155
37
85
05
158
Cou
ples
with
chi
ldre
n2734
3132
2138
4035
3736
4538
4861
7160
1428
2024
2037
Shar
e of
fam
ilies
acr
oss
the
inco
me
dist
ribut
ion.
Italy
Bott
omM
iddl
eTo
pBo
ttom
Mid
dle
Top
Bott
omM
iddl
eTo
pBo
ttom
Mid
dle
Top
Bott
omM
iddl
eTo
pBo
ttom
Mid
dle
Tota
lTo
tal
Tota
lTo
tal
Tota
l
Lone
Par
ents
3562
410
046
495
100
3163
610
049
447
100
3662
210
033
56
Cou
ples
with
chi
ldre
n1763
2010
012
6622
100
2057
2410
017
6023
100
1271
1710
010
64
Sam
ple
size
by
inco
me
grou
p an
d ho
useh
old
type
.
Italy
Bott
omM
iddl
eTo
pBo
ttom
Mid
dle
Top
Bott
omM
iddl
eTo
pBo
ttom
Mid
dle
Top
Bott
omM
iddl
eTo
pBo
ttom
Mid
dle
Tota
lTo
tal
Tota
l
All
4409
1322
644
0522
040
1246
037
240
1181
061
510
1598
4792
1597
7987
713
1923
617
3253
3591
1077
235
9017
953
697
2325
Lone
Par
ents
639
1130
6618
3514
7015
5016
031
8044
919
144
108
9616
220
293
514
1782
410
417
7
Cou
ples
with
chi
ldre
n12
0144
6913
8070
5026
1514
265
4665
2154
559
817
2672
530
4933
911
6444
119
4450
529
9973
242
3613
985
9
Note
: US
and
Germ
any
have
5 im
plic
ates
.
Unite
d Ki
ngdo
m
Unite
d St
ates
Unite
d Ki
ngdo
mLu
xem
bour
gGe
rman
ySw
eden
Unite
d St
ates
Germ
any
Luxe
mbo
urg
Swed
en
Unite
d St
ates
Luxe
mbo
urg
Swed
enUn
ited
King
dom
Germ
any