netiq appmanager for oracle rdbms on unix or linux servers
TRANSCRIPT
NetIQ® AppManager® for Oracle RDBMS on UNIX or Linux Servers
Management GuideMay 2009

Legal Notice
NetIQ AppManager is covered by United States Patent No(s): 05829001, 05986653, 05999178, 06078324, 06397359, 06408335.
THIS DOCUMENT AND THE SOFTWARE DESCRIBED IN THIS DOCUMENT ARE FURNISHED UNDER AND ARE SUBJECT TO THE TERMS OF A LICENSE AGREEMENT OR A NON-DISCLOSURE AGREEMENT. EXCEPT AS EXPRESSLY SET FORTH IN SUCH LICENSE AGREEMENT OR NON-DISCLOSURE AGREEMENT, NETIQ CORPORATION PROVIDES THIS DOCUMENT AND THE SOFTWARE DESCRIBED IN THIS DOCUMENT "AS IS" WITHOUT WARRANTY OF ANY KIND, EITHER EXPRESS OR IMPLIED, INCLUDING, BUT NOT LIMITED TO, THE IMPLIED WARRANTIES OF MERCHANTABILITY OR FITNESS FOR A PARTICULAR PURPOSE. SOME STATES DO NOT ALLOW DISCLAIMERS OF EXPRESS OR IMPLIED WARRANTIES IN CERTAIN TRANSACTIONS; THEREFORE, THIS STATEMENT MAY NOT APPLY TO YOU.
This document and the software described in this document may not be lent, sold, or given away without the prior written permission of NetIQ Corporation, except as otherwise permitted by law. Except as expressly set forth in such license agreement or non-disclosure agreement, no part of this document or the software described in this document may be reproduced, stored in a retrieval system, or transmitted in any form or by any means, electronic, mechanical, or otherwise, without the prior written consent of NetIQ Corporation. Some companies, names, and data in this document are used for illustration purposes and may not represent real companies, individuals, or data.
This document could include technical inaccuracies or typographical errors. Changes are periodically made to the information herein. These changes may be incorporated in new editions of this document. NetIQ Corporation may make improvements in or changes to the software described in this document at any time.
© 2009 NetIQ Corporation. All Rights Reserved.
U.S. Government Restricted Rights: If the software and documentation are being acquired by or on behalf of the U.S. Government or by a U.S. Government prime contractor or subcontractor (at any tier), in accordance with 48 C.F.R. 227.7202-4 (for Department of Defense (DOD) acquisitions) and 48 C.F.R. 2.101 and 12.212 (for non-DOD acquisitions), the government’s rights in the software and documentation, including its rights to use, modify, reproduce, release, perform, display or disclose the software or documentation, will be subject in all respects to the commercial license rights and restrictions provided in the license agreement.
Check Point, FireWall-1, VPN-1, Provider-1, and SiteManager-1 are trademarks or registered trademarks of Check Point Software Technologies Ltd.
ActiveAgent, ActiveAnalytics, ActiveAudit, ActiveReporting, ADcheck, Aegis, AppAnalyzer, AppManager, the cube logo design, Change Administrator, Change Guardian, Compliance Suite, Directory and Resource Administrator, Directory Security Administrator, Domain Migration Administrator, Exchange Administrator, File Security Administrator, Group Policy Administrator, Group Policy Guardian, Group Policy Suite, IntelliPolicy, Knowing is Everything, Knowledge Scripts, Mission Critical Software for E-Business, MP3check, NetConnect, NetIQ, the NetIQ logo, the NetIQ Partner Network design, Patch Manager, PSAudit, PSDetect, PSPasswordManager, PSSecure, Risk and Compliance Center, Secure Configuration Manager, Security Administration Suite, Security Analyzer, Security Manager, Server Consolidator, VigilEnt, Vivinet, Vulnerability Manager, Work Smarter, and XMP are trademarks or registered trademarks of NetIQ Corporation or its subsidiaries in the United States and other jurisdictions. All other company and product names mentioned are used only for identification purposes and may be trademarks or registered trademarks of their respective companies.

Contents
About This GuideIntended Audience . . . . . . . . . . . . . . . . . . . . . . . . . . . . . . vConventions . . . . . . . . . . . . . . . . . . . . . . . . . . . . . . . . . . . viUsing Online Help . . . . . . . . . . . . . . . . . . . . . . . . . . . . . . viOther Information in the Library . . . . . . . . . . . . . . . . . . . . viiAbout NetIQ Corporation . . . . . . . . . . . . . . . . . . . . . . . . viii
Chapter 1 Introduction to AppManager for Oracle UNIX/LinuxHow AppManager Can Help. . . . . . . . . . . . . . . . . . . . . . . 1Monitoring in a Clustered Environment . . . . . . . . . . . . . . 2Monitoring Options . . . . . . . . . . . . . . . . . . . . . . . . . . . . . . 3
Chapter 2 Installing AppManager for Oracle UNIX/LinuxSystem Requirements . . . . . . . . . . . . . . . . . . . . . . . . . . . 7Installing and Configuring the Module . . . . . . . . . . . . . . . 9Discovering Oracle Resources. . . . . . . . . . . . . . . . . . . . . 9Discovering Components on Clustered UNIX Computers . . 10
Chapter 3 OracleUNIX Knowledge ScriptsActiveTransactions . . . . . . . . . . . . . . . . . . . . . . . . . . . . . 17AlertLog . . . . . . . . . . . . . . . . . . . . . . . . . . . . . . . . . . . . . 20BGProc. . . . . . . . . . . . . . . . . . . . . . . . . . . . . . . . . . . . . . 23Block. . . . . . . . . . . . . . . . . . . . . . . . . . . . . . . . . . . . . . . . 26
i

BlockingSessions . . . . . . . . . . . . . . . . . . . . . . . . . . . . . . 29BufferBusyWaits . . . . . . . . . . . . . . . . . . . . . . . . . . . . . . . 31Cache . . . . . . . . . . . . . . . . . . . . . . . . . . . . . . . . . . . . . . . 34CallRate . . . . . . . . . . . . . . . . . . . . . . . . . . . . . . . . . . . . . 38CallsPerTransaction . . . . . . . . . . . . . . . . . . . . . . . . . . . . 40ClusterInstanceDown . . . . . . . . . . . . . . . . . . . . . . . . . . . 42ConsistentChangeRatio . . . . . . . . . . . . . . . . . . . . . . . . . 44ContinuedRowRatio . . . . . . . . . . . . . . . . . . . . . . . . . . . . 46DatabaseConnect . . . . . . . . . . . . . . . . . . . . . . . . . . . . . . 48DatabaseDown . . . . . . . . . . . . . . . . . . . . . . . . . . . . . . . . 50DataFileSpace. . . . . . . . . . . . . . . . . . . . . . . . . . . . . . . . . 52DataRatios . . . . . . . . . . . . . . . . . . . . . . . . . . . . . . . . . . . 54DiskSpaceAvail . . . . . . . . . . . . . . . . . . . . . . . . . . . . . . . . 58FreeListWaits . . . . . . . . . . . . . . . . . . . . . . . . . . . . . . . . . 61HealthCheck . . . . . . . . . . . . . . . . . . . . . . . . . . . . . . . . . . 64Listener . . . . . . . . . . . . . . . . . . . . . . . . . . . . . . . . . . . . . . 68Memory . . . . . . . . . . . . . . . . . . . . . . . . . . . . . . . . . . . . . . 74MostExecutedSQLStatements . . . . . . . . . . . . . . . . . . . . 84OpenCursors. . . . . . . . . . . . . . . . . . . . . . . . . . . . . . . . . . 86Performance . . . . . . . . . . . . . . . . . . . . . . . . . . . . . . . . . . 89RedoLog . . . . . . . . . . . . . . . . . . . . . . . . . . . . . . . . . . . . . 95RedoLogContention . . . . . . . . . . . . . . . . . . . . . . . . . . . 100RedoLogsNotArchived . . . . . . . . . . . . . . . . . . . . . . . . . 102RedoLogSpaceWaitRatio . . . . . . . . . . . . . . . . . . . . . . . 105RollbackSegmentContention. . . . . . . . . . . . . . . . . . . . . 107RowSourceRatio . . . . . . . . . . . . . . . . . . . . . . . . . . . . . . 109
ii AppManager for Oracle RDBMS on UNIX or Linux Servers

RunSql . . . . . . . . . . . . . . . . . . . . . . . . . . . . . . . . . . . . . 111ScheduledJobs. . . . . . . . . . . . . . . . . . . . . . . . . . . . . . . 115SegmentExtentAvail . . . . . . . . . . . . . . . . . . . . . . . . . . . 117SetMonitoringOptions. . . . . . . . . . . . . . . . . . . . . . . . . . 121SortOverflowRatio . . . . . . . . . . . . . . . . . . . . . . . . . . . . 124SysStat . . . . . . . . . . . . . . . . . . . . . . . . . . . . . . . . . . . . . 126TablespaceAvail . . . . . . . . . . . . . . . . . . . . . . . . . . . . . . 129TopCpuUsers . . . . . . . . . . . . . . . . . . . . . . . . . . . . . . . . 138TopIOUsers . . . . . . . . . . . . . . . . . . . . . . . . . . . . . . . . . 140TopLockUsers . . . . . . . . . . . . . . . . . . . . . . . . . . . . . . . 142TopMemoryUsers. . . . . . . . . . . . . . . . . . . . . . . . . . . . . 144TopResourceConsumingSQL . . . . . . . . . . . . . . . . . . . 146Transaction. . . . . . . . . . . . . . . . . . . . . . . . . . . . . . . . . . 149TransactionRate . . . . . . . . . . . . . . . . . . . . . . . . . . . . . . 154UpdateInstances . . . . . . . . . . . . . . . . . . . . . . . . . . . . . 156User . . . . . . . . . . . . . . . . . . . . . . . . . . . . . . . . . . . . . . . 159UserCallsPerParse. . . . . . . . . . . . . . . . . . . . . . . . . . . . 163UserRollbackRatio . . . . . . . . . . . . . . . . . . . . . . . . . . . . 165UserSessions . . . . . . . . . . . . . . . . . . . . . . . . . . . . . . . . 167Discovery_OracleUNIX . . . . . . . . . . . . . . . . . . . . . . . . 169
Contents iii

iv AppManager for Oracle RDBMS on UNIX or Linux Servers

About This Guide
The NetIQ AppManager product (AppManager) is a comprehensive solution for managing, diagnosing, and analyzing performance, availability, and server health for a broad spectrum of operating environments, applications, and server hardware.
AppManager provides system administrators with a central, easy-to-use console to view critical server and application resources across the enterprise. With AppManager, your IT team can monitor computer and application resources, check for potential problems, initiate responsive actions, automate routine tasks, and gather performance data for real-time and historical reporting and analysis.
Intended AudienceThis Management Guide provides information for individuals monitoring Oracle on UNIX.
This guide assumes you have a working knowledge of, or access to, other documentation for performing basic UNIX environment and AppManager activities. For example, you should be familiar with AppManager components and terminology, starting AppManager jobs, and your server maintenance requirements.
v

ConventionsThis guide uses consistent conventions to help you identify items throughout the documentation. The following table summarizes these conventions.
Using Online HelpAppManager provides task-based, reference, and context-sensitive online Help.
To access task-based Help or search for Help topics, click Help Topics on the Help menu. To view context-sensitive Help within dialog boxes, click Help or press F1.
You can get help on individual Knowledge Scripts in one of the following ways:
• On the Values tab of the Knowledge Script Properties dialog box, click Help or press F1.
• In the Knowledge Script pane of the Operator Console, highlight a Knowledge Script and press F1.
Convention Use
Bold • Window and menu items• Technical terms, when introduced
Italics • Book and installation kit titles• Variable names and values• Emphasized words
Fixed Font • File and folder names• Commands and code examples• Text you must type• Text (output) displayed in the command-line interface
vi AppManager for Oracle RDBMS on UNIX or Linux Servers

Other Information in the LibraryThe library provides the following information resources:
• Installation Guide: Provides complete information about AppManager pre-installation requirements and step-by-step installation procedures for all AppManager components.
• NetIQ UNIX Installation and Configuration Guide: Provides information about installing and configuring the UNIX Agent and UNIX AppManager modules.
• Control Center User Guide: Provides complete information about managing groups of computers, including running jobs, responding to events, creating reports, and working with the Control Center Console. A separate guide is available for the AppManager Operator Console.
• Administrator Guide: Provides information about maintaining an AppManager management site, managing security, using scripts to handle AppManager tasks, and leveraging advanced configuration options.
• Upgrade and Migration Guide: Provides complete information on how to upgrade from a previous version of AppManager.
• Management Guides: Provide information about installing and monitoring specific applications with AppManager.
The AppManager library is available in Adobe Acrobat (PDF) format and is located in the \Documentation folder of the AppManager installation kit.
About This Guide vii

NetIQ Online Support and Extended Support Web sites provide other resources:
• Downloads, including hotfixes, service packs, and product upgrades.
• Documentation, including white papers and the most current information about version support for the systems and applications monitored by AppManager.
Note You can access NetIQ Support without a password or registration. To access the Extended Support site, you must be a registered AppManager customer.
In addition to this guide, you may want to consult your Oracle documentation and your operating system documentation for reference and conceptual information. This background information can help you get the most out of AppManager for Oracle (UNIX).
About NetIQ CorporationNetIQ Corporation, an Attachmate business, is a leading provider of comprehensive systems and security management solutions that help enterprises maximize IT service delivery and efficiency. With more than 12,000 customers worldwide, NetIQ solutions yield measurable business value and results that dynamic organizations demand. Best-of-breed solutions from NetIQ Corporation help IT organizations deliver critical business services, mitigate operational risk, and document policy compliance. The company’s portfolio of award-winning management solutions includes IT Process Automation, Systems Management, Security Management, Configuration Control and Enterprise Administration. For more information, please visit www.netiq.com.
viii AppManager for Oracle RDBMS on UNIX or Linux Servers

Contacting NetIQ Corporation
Please contact us with your questions and comments. We look forward to hearing from you.
Sales Email: [email protected]
Telephone: 1-713-418-5555 (United States) +353 (0) 91-782-677 (Europe, Middle East, and Africa)For other locations, see our Support Contact Information Web site at www.netiq.com/support
Support Web Site: www.netiq.com/support
About This Guide ix

x AppManager for Oracle RDBMS on UNIX or Linux Servers

Chapter 1
Introduction to AppManager for Oracle UNIX/Linux
The Oracle Relational Database Management System (RDBMS) is a powerful database that also offers administration and performance monitoring features to increase its manageability and reliability. Designed for high availability, Oracle RDBMS stores and provides access to electronic data in the form of Online Transaction Processing (OLTP) databases and data warehouses.
How AppManager Can HelpAppManager for Oracle UNIX/Linux provides several Knowledge Scripts designed to give you a comprehensive view of how Oracle RDBMS performs on your UNIX and Linux servers.
The capabilities of the Knowledge Scripts in the OracleUNIX category include the following:
• Monitoring the Oracle RDBMS alert log for specific entries related to database operations and error conditions.
• Monitoring the total number of physical read/write operations per second and the total memory usage for Oracle RDBMS background processes.
• Monitoring I/O activity at the block-level.
• Monitoring the hit ratios for the buffer cache, library cache, and the data dictionary.
• Monitoring the number of database calls from all applications and processes accessing a database instance.
• Monitoring the ratio of continued rows fetched to all rows fetched.
1

• Monitoring the availability of databases.
• Monitoring the amount of disk space available for the archive log file, the background process log file, and user log files for a database.
• Monitoring rollback segment contention for a database.
• Monitoring the percentage of rows retrieved using full table scans.
• Monitoring the most-executed SQL queries on a database.
• Monitoring the SQL queries consuming the most resources on a database.
• Monitoring the number of redo logs that have not been archived.
• Monitoring the waits on free lists and buffers.
• Monitoring the sort overflow ratio.
• Monitoring the percentage of attempted application transactions that are rolled back.
For aspects of Oracle RDBMS that you choose to monitor, you can set thresholds as the boundaries of optimal performance. You can also instruct AppManager for Oracle UNIX/Linux to raise events when the thresholds are crossed.
In addition to monitoring, you can use the OracleUNIX Knowledge Scripts to collect performance data for use in reports. AppManager for Oracle UNIX/Linux lets you generate reports that range in scope from minute-by-minute values to monthly values over a period of years. You can also generate reports that range in purpose from evaluating a narrow window of performance data to illustrating trends to aid in capacity planning.
Monitoring in a Clustered EnvironmentAppManager for Oracle UNIX/Linux supports monitoring Oracle in both Real Application Clusters (RAC) and non-RAC clustered environments. Each environment uses a different method for determining whether a node is active or inactive.
2 AppManager for Oracle RDBMS on UNIX or Linux Servers

The ClusterInstanceDown Knowledge Script lets you know when an instance is inactive. Use this Knowledge Script to raise an event when such a condition occurs on a node in the cluster. This Knowledge Script is primarily useful on nodes of the cluster that should be active.
To enable support for your specific environment, use the SetMonitoringOptions Knowledge Script. AppManager for Oracle UNIX/Linux uses this information to prevent the generation of spurious alerts by jobs running on inactive nodes of a cluster.
Monitoring in an RAC Clustered Environment
An Oracle RAC consists of a single database shared across multiple Oracle instances. Each instance runs on a separate node. The Oracle RAC software option keeps track of both active and inactive instances.
To enable monitoring in a RAC environment, use the SetMonitoringOptions Knowledge Script to provide the following information:
• Service name for the RAC cluster
• Directory containing the tnsnames.ora file (only if this file is in the non-default location). The default location is $ORACLE_HOME/network/admin.
Monitoring OptionsThe following sections describe the procedure to configure monitoring options with AppManager for Oracle UNIX/Linux for maintenance and other purposes.
Avoiding Events for Databases that are Down for Maintenance
AppManager for Oracle UNIX/Linux allows you to set up an environment in which jobs will not be run on Oracle databases that
Chapter 1 • Introduction to AppManager for Oracle UNIX/Linux 3

are known to be down for maintenance or other purposes. The SetMonitoringOptions Knowledge Script lets you specify a “blackout” directory on the UNIX host where the AppManager for Oracle UNIX/Linux component is installed. This directory contains filenames with the names of Oracle databases on which no jobs should be run. These filenames must begin with the name of the database. After the name of the database, these filenames may contain additional characters, possibly to serve as a description. The first of these additional characters, if any, must be a character that is not valid in an Oracle database name (A-Z, 0-9, _, $, and # are all valid characters in an Oracle database name).
For example, you can use the SetMonitoringOptions Knowledge Script to set the folder /usr/oracle/blackout as the blackout directory. When the databases oradb817 and oradb920 are down over the next few hours, it creates the following empty files:
/usr/oracle/blackout/oradb817.maintenance
/usr/oracle/blackout/oradb920.upgrade.
Although OracleUNIX jobs continue running on any other Oracle databases on this host whose names do not appear as part of the beginning of a filename in this folder, no jobs are run on oradb817 and oradb920. Once the maintenance period is over, you can remove these files from the blackout directory, and monitoring resumes.
In addition, you can set a parameter in the DatabaseDown Knowledge Script so that when it runs and finds the selected database is down, it can automatically create a file in the blackout directory identifying the database to exclude from monitoring. In these cases, you must manually remove the files denoting databases down for maintenance in order for jobs to proceed correctly on these databases.
Other Monitoring Options
You may not want to monitor tablespaces that have temporary contents or whose datafiles are autoextensible. In these cases, the SetMonitoringOptions Knowledge Script also includes options to
4 AppManager for Oracle RDBMS on UNIX or Linux Servers

enable or disable monitoring for these types of tablespaces. You can enable or disable monitoring while jobs associated with the TablespaceAvail Knowledge Script are currently running.
Chapter 1 • Introduction to AppManager for Oracle UNIX/Linux 5

6 AppManager for Oracle RDBMS on UNIX or Linux Servers

Chapter 2
Installing AppManager for Oracle UNIX/Linux
This chapter describes requirements for installing AppManager for Oracle UNIX/Linux. The module is installed when you install the UNIX agent.
For information about installing the UNIX agent, see the NetIQ UNIX Agent Installation and Configuration Guide.
System RequirementsThe following table lists the system requirements for AppManager for Oracle UNIX/Linux. For more specific information about supported products, see the NetIQ Support Web site.
The Oracle RDBMS account used by the OracleUNIX Knowledge Scripts should have sufficient privileges to monitor each Oracle database. The installer provides the appropriate SELECT privileges for non-SYSDBA accounts. For more information about the views
Item Requirement
AppManager repository, management server, and Operator Console or Control Center Console
Version 6.0.2, 7.0, or 7.0.1
AppManager UNIX Agent Version 7.1
Operating System • HP-UX • IBM AIX • Redhat Enterprise Linux Advanced Server • Sun Solaris • SUSE Linux Enterprise Server
7

required to run each Knowledge Script, see Chapter 3, “OracleUNIX Knowledge Scripts.”
The following operating systems have specific requirements:
• Hewlett-Packard HP-UX
If you are using any 9.2 Oracle home, the client libraries should be upgraded to 9.2.0.2 or later.
• IBM AIX
With AIX, you require the following xlC compiler runtime packages:
• xlC.aix43, version 5.0.2.0 or later
• xlC.rte, version 5.0.2.0 or later
A pre-installation check determines the version of the XlC compiler runtime packages. Upgrade the compiler packages to version 5.0.2.0 if the installer fails.
• Sun Solaris
The AppManager for Oracle UNIX/Linux package requires the following Solaris patch:
Patch 108827-35 for Solaris 2.8 (5.5.8)
The installation program checks for the presence of these patches but does not abort if these patches are not installed. The installation program issues a warning for any missing patch and logs a record of missing patches in the install_oracle.log file located in the /tmp folder.
The requirements for AppManager for Oracle UNIX/Linux are different from the operating-system versions and platforms that the UNIX agent supports. The AppManager Supported Products Web site contains up-to-date information about supported environments for the agent and application modules, which are listed separately: www.netiq.com/support/am/supportedproducts/default.asp?sp=CrossPlatSys_AMAgent
8 AppManager for Oracle RDBMS on UNIX or Linux Servers

Installing and Configuring the ModuleInstall AppManager for Oracle UNIX/Linux using NetIQ UNIX Agent Manager. You must install the UNIX Agent, configure the Agent for AppManager, then configure the Oracle UNIX/Linux managed object.
For information about how to install and configure the module, see the NetIQ UNIX Agent Installation and Configuration Guide.
Discovering Oracle ResourcesOnce you have completed the installation, you must discover Oracle UNIX/Linux resource objects.
To run Discovery manually from the Operator Console:
1 Start the Operator Console.
2 In the Security Manager window of the Extensions tab, specify the Oracle user, password and the Oracle database instance name you want to connect to.
3 In the Knowledge Script pane, click the Discovery tab.
4 Drag the Discovery_OracleUNIX Knowledge Script to the target UNIX/Linux computer in the TreeView pane.
5 Click the Values tab, and set the event severity levels for successful and failed Discovery events.
6 Click OK to start the job.
After you run the Discovery Knowledge Script, you should see the new Oracle_UNIX view and Knowledge Script category in the Operator Console or Control Center.
Chapter 2 • Installing AppManager for Oracle UNIX/Linux 9

Discovering Components on Clustered UNIX Computers
For both Oracle RAC and non-RAC clustered environments, the database you monitor should be active on a node at the time you configuration the Oracle module and when you run discovery on that node. The following instructions assume that you have already installed the UNIX agent on the host and the module on each node in the cluster.
To discover components on Oracle RAC clusters:
1 Ensure each node is active.
2 Run the netiq_oracle_configuration script and the Discovery_OracleUNIX Knowledge Script on each node.
3 Run the SetMonitoringOptions Knowledge Script on each node.
To discover components on non-RAC clusters:
1 Run the netiq_oracle_configuration script and the Discovery_OracleUNIX Knowledge Script to discover all available Oracle RDBMS resources on the active node.
2 Fail over the active node to the passive node.
3 Repeat step 1 for the currently active node.
4 Run the SetMonitoringOptions Knowledge Script on the nodes in the cluster.
10 AppManager for Oracle RDBMS on UNIX or Linux Servers

Chapter 3
OracleUNIX Knowledge Scripts
The OracleUNIX category provides the following Knowledge Scripts for monitoring Oracle RDBMS.Note Each Knowledge Script is configured to run at a specific interval. While you can change that interval to suit your needs, we recommend that you not use intervals of less than five minutes. Running at shorter intervals may have a negative impact on system performance.
From the Knowledge Script view of the Control Center Console, you can access more information about any Knowledge Script by selecting it and pressing F1. Alternatively, in the Operator Console, click any Knowledge Script in the Knowledge Script pane and press F1.
Knowledge Script What It Does
ActiveTransactions Monitors the number of active transactions that are ongoing as a percentage of the maximum number of transactions that can be executed concurrently (set as an initialization parameter).
AlertLog Scans the Oracle Database alert log for entries that match a search string that you specify.
BGProc Monitors the total memory usage and the total number of physical read/write (I/O) operations per second for Oracle Database background processes.
Block Monitors block-level database activity (visits per transaction and changes per transaction).
BlockingSessions Monitors the user sessions that are blocking other sessions and processes from accessing the Oracle Database.
11

BufferBusyWaits Monitors the number of buffer busy waits and the number of logical reads, and computes a ratio between the two numbers (expressed as a percentage).
Cache Monitors the frequency with which requested data and resources are retrieved from the cache.
CallRate Monitors the demand placed on a database instance from all sources.
CallsPerTransaction Monitors the demand placed on a database instance by each transaction.
ClusterInstanceDown Monitors Oracle instances in a cluster and notifies you when an instance fails or becomes inactive.
ConsistentChangeRatio Monitors the extent to which applications exercise the read consistency mechanism to ensure database consistency.
ContinuedRowRatio Monitors rows that span more than one database block.
DatabaseConnect Checks the connectivity to Oracle databases.
DatabaseDown Monitors the status of the background processes of a database.
DataFileSpace Monitors the size of the datafile of an Oracle Database.
DataRatios Monitors the Consistent Change Ratio, Continued Row Ratio, Row Source Ratio, and Sort Overflow Ratio.
DiskSpaceAvail Monitors the amount of disk space available for the archive log file, the background process log file, and user log files of a database.
FreeListWaits Monitors the number of freelist waits and the total number of data requests, and computes a ratio of the two numbers.
HealthCheck Monitors Oracle instances in a cluster, the connectivity to Oracle databases, and the status of the background process of Oracle database.
Listener Monitors Oracle listeners running on the host.
Knowledge Script What It Does
12 AppManager for Oracle RDBMS on UNIX or Linux Servers

Memory Monitors the Oracle background processes, buffer busy waits, cache, and freelist waits.
MostExecutedSQLStatements Determines which SQL statements are being executed on a given Oracle Database most frequently.
OpenCursors Monitors the percentage of cursors opened per session, as well as the total number of cursors open in the system.
Performance Monitors the open cursors, CPU time for current user sessions, physical reads and writes (I/O) for current user sessions, the current number of user-held locks on an Oracle Database, and memory usage (User Global Area and Program Global Area) for current user sessions.
RedoLog Monitors the number of times that a process tries to write an entry in the redo log buffer, the number of redo logs not archived, if archiving is turned on for a given Oracle Database, and the redo log space wait ratio.
RedoLogContention Monitors the number of times that a process tries to write an entry in the redo log buffer.
RedoLogsNotArchived Monitors the number of redo logs which are not being archived, if archiving is turned on for a given Oracle Database.
RedoLogSpaceWaitRatio Monitors the redo log space wait ratio.
RollbackSegmentContention Monitors rollback segment contention for a database.
RowSourceRatio Monitors the row source ratio.
RunSql Runs a SQL statement.
ScheduledJobs Monitors the scheduled job status in the New Oracle Scheduler.
SegmentExtentAvail Monitors the percentage of extents (extensions of free space) available to each segment in a tablespace.
SetMonitoringOptions Sets the various monitoring options available for OracleUNIX jobs, especially in clustered environments.
Knowledge Script What It Does
Chapter 3 • OracleUNIX Knowledge Scripts 13

SortOverflowRatio Monitors the sort overflow ratio.
SysStat Monitors statistics from V_$SYSSTAT table of an Oracle Database.
TablespaceAvail Monitors the disk space used by tablespaces.
TopCpuUsers Monitors the CPU time for current user sessions
TopIOUsers Monitors physical reads and writes (I/O) for current user sessions.
TopLockUsers Monitors the current number of user-held locks on an Oracle Database.
TopMemoryUsers Monitors memory usage (User Global Area and Program Global Area) for current user sessions.
TopResourceConsumingSQL Determines which SQL queries for Oracle Database are consuming the most resources per execution on their UNIX hosts.
Transaction Monitors the number of active transactions, the demand placed on a database instance from all sources, the demand placed on a database instance by each transaction, and the transaction rate for an Oracle Database.
TransactionRate Monitors the transaction rate for an Oracle Database.
UpdateInstances Updates the list of Oracle databases/instances on each UNIX host used to update authentication information in the AppManager Service Manager and for discovery of new databases.
User Monitors the number of user calls per parse, the user rollback ratio for an Oracle Database, the total number of user sessions accessing an Oracle Database, and the user sessions that are blocking other sessions and processes from accessing the Oracle Database.
UserCallsPerParse Monitors the number of user calls per parse.
UserRollbackRatio Monitors the user rollback ratio for an Oracle Database.
Knowledge Script What It Does
14 AppManager for Oracle RDBMS on UNIX or Linux Servers

Running All Knowledge Scripts
To run Knowledge Script using SYSDBA authentication, ensure that the user account used to run the UNIX agent is a member of the Oracle Database Administrator (OSDBA) group.
UserSessions Monitors the total number of user sessions accessing an Oracle Database.
Discovery_OracleUNIX Discovers Oracle resources and configuration information on UNIX and Linux servers.
Knowledge Script What It Does
Chapter 3 • OracleUNIX Knowledge Scripts 15

To run all of the Knowledge Scripts in the OracleUNIX category, your account must grant you SELECT permissions for all of the following tables:
List of Tables
DBA_DATA_FILESDBA_FREE_SPACEDBA_JOBSDBA_SCHEDULER_JOBSDBA_SEGMENTSDBA_TABLESPACESDBA_TEMP_FILESDBA_USERSGV_$INSTANCE (for Oracle RAC monitoring only)V_$ARCHIVE_DESTV_$BGPROCESSV_$DATABASEV_$DATAFILEV_$INSTANCEV_$LIBRARYCACHEV_$LOCKV_$LOGV_$PARAMETERV_$PROCESSV_$ROWCACHEV_$SESSIONV_$SESSTATV_$SGASTATV_$SORT_SEGMENTV_$SQLAREAV_$SQLAREAV_$STATNAMEV_$SYSSTATV_$SYSTEM_EVENTV_$TRANSACTIONV_$VERSIONV_$WAITSTAT
16 AppManager for Oracle RDBMS on UNIX or Linux Servers

ActiveTransactionsUse this Knowledge Script to retrieve the number of active transactions that are ongoing, and the maximum number of transactions that can be executed concurrently (set as an initialization parameter). This script computes a ratio, expressed as a percentage, of the two numbers. When you enable data collection, the percentage is stored in the repository. You can set multiple thresholds for the maximum ratio, and the job raises an event when any of the thresholds exceeds the value you specified.
The account you use to run this script must have SELECT permissions for the following tables:
V_$PARAMETERV_$TRANSACTIONV_$VERSION
Resource Objects
Oracle Database folders. When you drop a script on an Oracle Database folder, a job executes on that database and collects the number of active transactions and the number of total transactions. The ratio of active transactions over total transactions is then computed.
Default Schedule
The default interval for this script is Every 10 minutes.
Chapter 3 • OracleUNIX Knowledge Scripts 17

Setting Parameter Values
Set the following parameters as needed:
Description How to Set It
Oracle Username Enter the username that this script needs to access the target databases. If you run this script on more than one database, configure each database with the same username.Note To use SYSDBA authentication, leave this parameter blank.The default value is blank.
Collect data for the ratio of active transactions to maximum concurrent transactions?
Set to y to collect data for charts and reports. If data collection is enabled, returns the ratio of active transactions to maximum concurrent transactions as a percentage (%). By default, data is not collected.
Raise event if ratio exceeds threshold?
Select the Yes check box to raise an event if the threshold exceeds the value you specified.By default, the job raises events.
Threshold – ratio of active transactions to max concurrent transactions
Specify a threshold for the maximum ratio of active transactions to maximum concurrent transactions, expressed as a percentage. The default for this threshold is 95%.
Severity Set the event severity level, from 1 to 40, to indicate the importance of the event for successfully setting the monitoring options. The default severity level is 5 (red event indicator).
Raise event if ratio exceeds threshold?
Select the Yes check box to raise an event if the threshold exceeds the value you specified.By default, the job does not raise events.
Threshold – ratio of active transactions to max concurrent transactions
Specify a threshold for the maximum ratio of active transactions to maximum concurrent transactions, expressed as a percentage. The default for this threshold is 80%.
Severity Set the event severity level, from 1 to 40, to indicate the importance of the event for successfully setting the monitoring options. The default severity level is 15 (yellow event indicator).
18 AppManager for Oracle RDBMS on UNIX or Linux Servers

Raise event if ratio exceeds threshold?
Select the Yes check box to raise an event if the threshold exceeds the value you specified.By default, the job does not raise events.
Threshold -- ratio of active transactions to max concurrent transactions
Specify a threshold for the maximum ratio of active transactions to maximum concurrent transactions, expressed as a percentage. The default for this threshold is 60%.
Severity Set the event severity level, from 1 to 40, to indicate the importance of the event for successfully setting the monitoring options. The default severity level is 25 (blue event indicator).
Raise event if ratio exceeds threshold?
Select the Yes check box to raise an event if the threshold exceeds the value you specified.By default, the job does not raise events.
Threshold -- ratio of active transactions to max concurrent transactions
Specify a threshold for the maximum ratio of active transactions to maximum concurrent transactions, expressed as a percentage. The default value is 40%.
Severity Set the event severity level, from 1 to 40, to indicate the importance of the event for successfully setting the monitoring options. The default severity level is 35 (magenta event indicator).
Description How to Set It
Chapter 3 • OracleUNIX Knowledge Scripts 19

AlertLogUse this Knowledge Script to scan the Oracle alert log for entries that match a specified search string. You can set a maximum threshold for the number of occurrences of the string found during any single scan of the alert log. If during any single scan of the alert log the number of matching entries exceeds the threshold, the job raises an event.
Each database maintains an alert log where it records database operations (such as creating or dropping a database) and error conditions (such as deadlocks). This script provides a general-purpose tool for scanning a database’s alert log for specific entries.
The first interval of this script does not scan existing entries, and does not collect data. Instead, it sets a pointer to the end of the alert log so that only new entries are read. Each subsequent iteration of the script scans the alert log for entries created since the previous scan. Information in the Event Properties dialog box states the number of occurrences of the search string that were found. The lines containing matches found in the log are also included in the event details.
The account you use to run this script must have SELECT permissions for the following tables:
V_$PARAMETERV_$VERSION
Notes When the Oracle alert log reaches its maximum size, Oracle renames the file for archiving purposes and creates a new alert log with the original filename. If this script attempts to open the alert log between the time the old file is renamed and the new file is created, the job raises an event because the script cannot find the file. The next iteration of the script (when the alert log is available) should function as expected.
This script attempts to open the alert log associated with the relevant Oracle instance. Oracle instance alert logs use the naming convention alert_<instance name>.
20 AppManager for Oracle RDBMS on UNIX or Linux Servers

Resource Objects
Oracle Database folders. When you drop a script on an Oracle Database folder, a job executes on that database and monitors only that database.
Default Schedule
The default interval for this script is Every 10 minutes.
Setting Parameter Values
Set the following parameters as needed:
Description How to Set It
Oracle Username Enter the username that this script needs to access the target databases. If you run this script on more than one database, configure each database with the same username.Note To use SYSDBA authentication, leave this parameter blank.The default value is blank.
Collect data for number of matching log entries?
Set to y to collect data for charts and reports. When you enable data collection, the Knowledge Script returns the number of entries that matched the search string. By default, data is not collected.
String(s) to find in log (separate multiple strings with semicolons)
Enter all or part of the strings you want to find in the log. For this script, a string is any series of characters (including spaces, if doing an exact match search). You can specify multiple strings by separating each string with a semicolon (;). For example, if you specify ORA-600;ORA-1578
the script searches for either of two strings:ORA-600 or ORA-1578.The default values represent the most common Oracle error codes:• ORA-600 (internal error)• ORA-1578 (block corruption)• ORA-60 (deadlock error)
Chapter 3 • OracleUNIX Knowledge Scripts 21

Optional file with string(s) to find in log (one search string per line)
Specify the full path to a file that contains strings to search for in the alert log (one search string per line).If a path is specified, the strings specified in the previous parameter (String(s) to find in log) are ignored. By default, no path is specified.
Search Options
Execute a case-sensitive search?
Set to y to find only case-sensitive matches of the search string. By default, the search is not case-sensitive.
Find only entries that exactly match?
Set to y to find only entries that match the exact search string character-for-character and whole word-for whole word. For example, a search for “ORA-60” will not return a match for “ORA-600”.By default, only exact matches are found.
Raise event if threshold exceeded?
Select the Yes check box to raise an event when the number of log entries found that match the search criteria exceeds the threshold you set. By default, events are enabled.
Threshold -- Maximum number of entries found
Enter a threshold for the maximum number of log entries that can be found to match the search criteria during any single scan of the alert log. If the number of entries matches or exceeds the threshold, the job raises an event. The default value is 0 entries.
Severity Set the event severity level, from 1 to 40, to indicate the importance of the event. The default value is 5 (red event indicator).
Description How to Set It
22 AppManager for Oracle RDBMS on UNIX or Linux Servers

BGProcUse this Knowledge Script to monitor the total number of physical read/write (I/O) operations per second and/or the total memory usage for Oracle Database background processes. If the total number of read/write operations per second or the total memory usage exceeds the threshold, the job raises an event.
Oracle background processes include CKPT, DBW0, LGWR, PMON, RECO, SMON, SNP0, and others. You can monitor all or individual background processes.
The account you use to run this script must have SELECT permissions for the following tables:
V_$BGPROCESSV_$PROCESSV_$SESSIONV_$SESSTATV_$STATNAMEV_$VERSION
Resource Objects
Oracle Database folders. When you drop a script on an Oracle Database folder, a job executes on that database and monitors only that database.
Default Schedule
The default interval for this script is Every 30 minutes.
Chapter 3 • OracleUNIX Knowledge Scripts 23

Setting Parameter Values
Set the following parameters as needed:
Description How to Set It
Oracle Username Enter the username that this script needs to access the target Oracle Databases. If you run this script on more than one database, configure each database with the same username. Note To use SYSDBA authentication, leave this parameter blank.The default value is blank.
Collect data for memory usage and I/O of Oracle processes?
Set to y to collect data for charts and reports. If data collection is enabled, returns the number of read/write operations per second, and/or the total memory usage for all monitored background processes. By default, data is not collected.
Oracle background processes to monitor
Enter the names of the background processes you want to monitor. Separate the names with commas; do not use spaces. To monitor all Oracle Database background processes, enter an asterisk (*).Possible valid background process names include:• CKPT
• DBW0
• LGWR
• PMON
• RECO
• SMON
• SNP0
• SNP1
The default value is (*) (all background processes).
Monitor read/write operations?
Select the Yes check box to monitor the number of physical read/write operations per second by background processes. By default, monitoring is performed.
Raise event if threshold is exceeded?
Select the Yes check box to raise an event when the number of physical read/write operations per second exceeds the threshold you set. By default, events are not enabled.
Threshold -- Maximum number of read/write operations
Enter a threshold for the maximum number of physical read/write operations per second. The default value is 5 read/write operations per second.
24 AppManager for Oracle RDBMS on UNIX or Linux Servers

Severity Set the event severity level, from 1 to 40, to indicate the importance of the event. The default value is 15 (yellow event indicator).
Monitor memory usage?
Select the Yes check box to monitor the total memory usage by background processes. By default, monitoring is performed.
Raise event if threshold is exceeded?
Select the Yes check box to raise an event when the memory utilization of the monitored processes exceeds the threshold you set. By default, events are not enabled.
Threshold -- Maximum memory usage
Enter a threshold (in MB) for the maximum amount of memory used by all background processes you are monitoring. The default value is 15 MB.
Severity Set the event severity level, from 1 to 40, to indicate the importance of the event. The default value is 15 (yellow event indicator).
Description How to Set It
Chapter 3 • OracleUNIX Knowledge Scripts 25

BlockUse this Knowledge Script to monitor block-level database activity. Oracle Database data blocks are the smallest unit of storage for a database. Monitoring I/O activity at the block level can be a key indicator of database performance.
Use this script to monitor any combination of the following statistics:
• The number of block changes per transaction. This block change rate measures the number of SQL Data Manipulation Language (DML) commands that each transaction performs (for example, to create and drop indexes). As the number of block changes increases, the efficiency of the database transaction and database performance decreases.
• The number of times the Oracle Database buffer manager locates a database per second. This block get rate indicates the rate at which an application references the database. An increase in the block get rate suggests an increase in overall server load. A decrease in the block get rate without a decrease in load may indicate that you need to do some database tuning because there has been a slowdown in the number of database blocks requested and located per second.
• The number of times database blocks are requested per committed transaction. This block visit rate measures the database work load per completed transaction (including both successful and aborted database transactions).
The account you use to run this script must have SELECT permissions for the following tables:
V_$SYSSTATV_$VERSION
26 AppManager for Oracle RDBMS on UNIX or Linux Servers
Resource Objects
Oracle Database folders. When you drop a script on an Oracle Database folder, a job executes on that database and monitors only that database.
Default Schedule
The default interval for this script is Every 10 minutes.
Setting Parameter Values
Set the following parameters as needed:
Description How to Set It
Oracle Username Enter the username that this script needs to access the target databases. If you run this script on more than one database, configure each database with the same username.Note To use SYSDBA authentication, leave this parameter blank. The default value is blank.
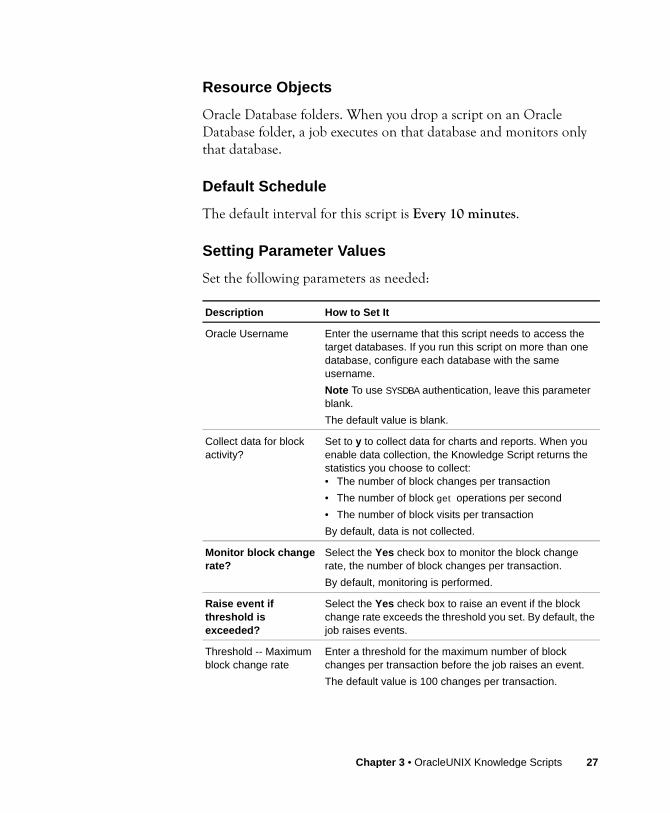
Collect data for block activity?
Set to y to collect data for charts and reports. When you enable data collection, the Knowledge Script returns the statistics you choose to collect:• The number of block changes per transaction• The number of block get operations per second• The number of block visits per transactionBy default, data is not collected.
Monitor block change rate?
Select the Yes check box to monitor the block change rate, the number of block changes per transaction. By default, monitoring is performed.
Raise event if threshold is exceeded?
Select the Yes check box to raise an event if the block change rate exceeds the threshold you set. By default, the job raises events.
Threshold -- Maximum block change rate
Enter a threshold for the maximum number of block changes per transaction before the job raises an event. The default value is 100 changes per transaction.
Chapter 3 • OracleUNIX Knowledge Scripts 27

Severity Set the event severity level, from 1 to 40, to indicate the importance of the event. The default value is 5 (red event indicator).
Monitor block get rate?
Select the Yes check box to monitor the block get rate, the number of times the Oracle Database buffer manager locates a database block per second. By default, monitoring is performed.
Raise event if threshold is exceeded?
Select the Yes check box to raise an event if the block get rate exceeds the threshold you set. By default, the job raises events.
Threshold -- Maximum block get rate
Enter a threshold for the maximum number of block get operations per second before the job raises an event. The default value is 100 get operations per second.
Severity Set the event severity level, from 1 to 40, to indicate the importance of the event. The default value is 5 (red event indicator).
Monitor block visit rate?
Select the Yes check box to monitor the block visit rate, the number of times database blocks are requested per committed transaction. By default, monitoring is performed.
Raise event if threshold is exceeded?
Select the Yes check box to raise an event if the block visit rate exceeds the threshold you set. By default, the job raises events.
Threshold -- Maximum block visit rate
Enter a threshold for the block visit rate, the maximum number of block get operations per committed transaction. The default value is 100 operations per committed transaction.
Severity Set the event severity level, from 1 to 40, to indicate the importance of the event. The default value is 5 (red event indicator).
Description How to Set It
28 AppManager for Oracle RDBMS on UNIX or Linux Servers

BlockingSessionsUse this Knowledge Script to monitor the user sessions that are blocking other sessions and processes from accessing the Oracle Database. You can set a maximum threshold for the number of sessions that are allowed to block other sessions and processes. If the number of blocking sessions exceeds the threshold, the job raises an event.
The account you use to run this script must have SELECT permissions for the following tables:
V_$LOCKV_$VERSION
Resource Objects
Oracle Database folders. When you drop a script on an Oracle Database folder, a job executes on that database and monitors only that database.
Default Schedule
The default interval for this script is Every 10 minutes.
Chapter 3 • OracleUNIX Knowledge Scripts 29

Setting Parameter Values
Set the following parameters as needed:
Description How to Set It
Oracle Username Enter the username that this script needs to access the target databases. If you run this script on more than one database, configure each database with the same username.Note To use SYSDBA authentication, leave this parameter blank.The default value is blank.
Collect data for number of blocking sessions?
Set to y to collect data for charts and reports. When you enable data collection, the Knowledge Script returns the number of blocking sessions per interval. By default, data is not collected.
Raise event if threshold is exceeded?
Select the Yes check box to raise an event if the number of blocking sessions exceeds the threshold you set. By default, the job raises events.
Threshold -- Maximum number of blocking sessions
Enter a threshold for the maximum number of user sessions allowed to block other user sessions and processes during the monitoring interval. The default value is 10 sessions.
Severity Set the event severity level, from 1 to 40, to indicate the importance of the event. The default value is 5 (red event indicator).
30 AppManager for Oracle RDBMS on UNIX or Linux Servers

BufferBusyWaitsUse this Knowledge Script to retrieve the number of buffer busy waits and the number of logical reads, and compute a ratio between the two numbers (expressed as a percentage). When you enable data collection, the repository stores the ratio. You can set multiple thresholds for the maximum ratio, and the job raises an event when any of the thresholds exceeds the value you specified. A higher ratio indicates an increased contention for buffers in the SGA memory of Oracle Database.
The account you use to run this script must have SELECT permissions for the following tables:
V_$SYSTEM_EVENTV_$SYSSTATV_$VERSION
Resource Objects
Oracle Database folders. When you drop a script on an Oracle Database folder, a job executes on that database and collects the number of buffer busy waits and the number of logical reads. The ratio of buffer waits over logical reads is then computed.
Default Schedule
The default interval for this script is Every 10 minutes.
Chapter 3 • OracleUNIX Knowledge Scripts 31

Setting Parameter Values
Set the following parameters as needed:
Description How to Set It
Oracle Username Enter the username that this script needs to access the target databases. If you run this script on more than one database, configure each database with the same username.Note To use SYSDBA authentication, leave this parameter blank.The default value is blank.
Collect data for ratio of buffer busy waits to logical reads?
Set to y to collect data for charts and reports. If data collection is enabled, returns the ratio of buffer busy waits to logical reads as a percentage (%). By default, data is not collected.
Raise event if threshold is exceeded?
Select the Yes check box to raise an event if the threshold exceeds the value you specified.By default, events are enabled.
Threshold -- Maximum ratio of buffer busy waits to logical reads
Specify a threshold for the maximum ratio of buffer busy waits to logical reads. The default for this threshold is.95.
Severity Set the event severity level, from 1 to 40, to indicate the importance of the event for successfully setting the monitoring options. The default severity level is 5 (red event indicator).
Raise event if threshold is exceeded?
Select the Yes check box to raise an event if the ratio exceeds the threshold specified below.By default, the job does not raise events.
Threshold –- Maximum ratio of buffer busy waits to logical reads
Specify a threshold for the maximum ratio of buffer busy waits to logical reads. The default value is .80.
Severity Set the event severity level, from 1 to 40, to indicate the importance of the event for successfully setting the monitoring options. The default severity level is 15 (yellow event indicator).
32 AppManager for Oracle RDBMS on UNIX or Linux Servers
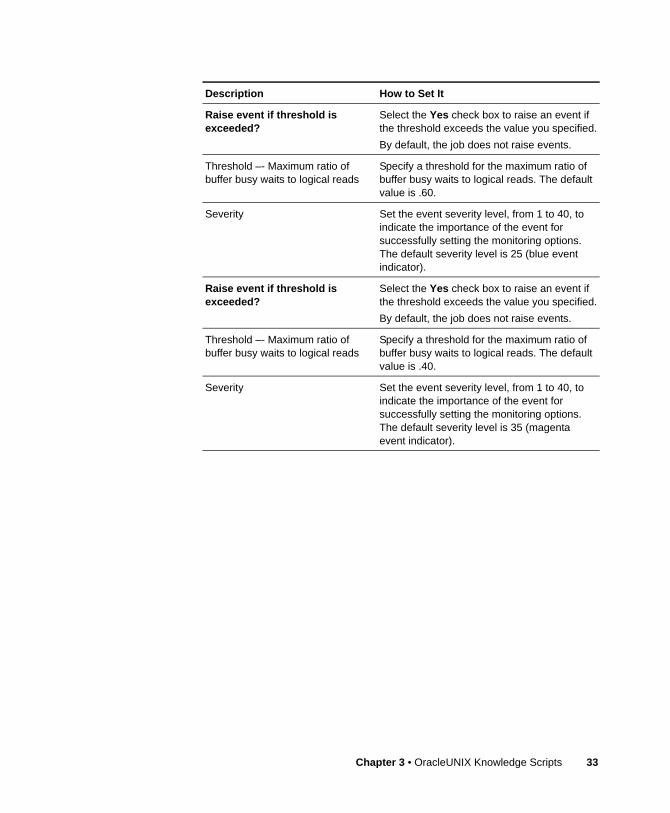
Raise event if threshold is exceeded?
Select the Yes check box to raise an event if the threshold exceeds the value you specified.By default, the job does not raise events.
Threshold –- Maximum ratio of buffer busy waits to logical reads
Specify a threshold for the maximum ratio of buffer busy waits to logical reads. The default value is .60.
Severity Set the event severity level, from 1 to 40, to indicate the importance of the event for successfully setting the monitoring options. The default severity level is 25 (blue event indicator).
Raise event if threshold is exceeded?
Select the Yes check box to raise an event if the threshold exceeds the value you specified.By default, the job does not raise events.
Threshold –- Maximum ratio of buffer busy waits to logical reads
Specify a threshold for the maximum ratio of buffer busy waits to logical reads. The default value is .40.
Severity Set the event severity level, from 1 to 40, to indicate the importance of the event for successfully setting the monitoring options. The default severity level is 35 (magenta event indicator).
Description How to Set It
Chapter 3 • OracleUNIX Knowledge Scripts 33
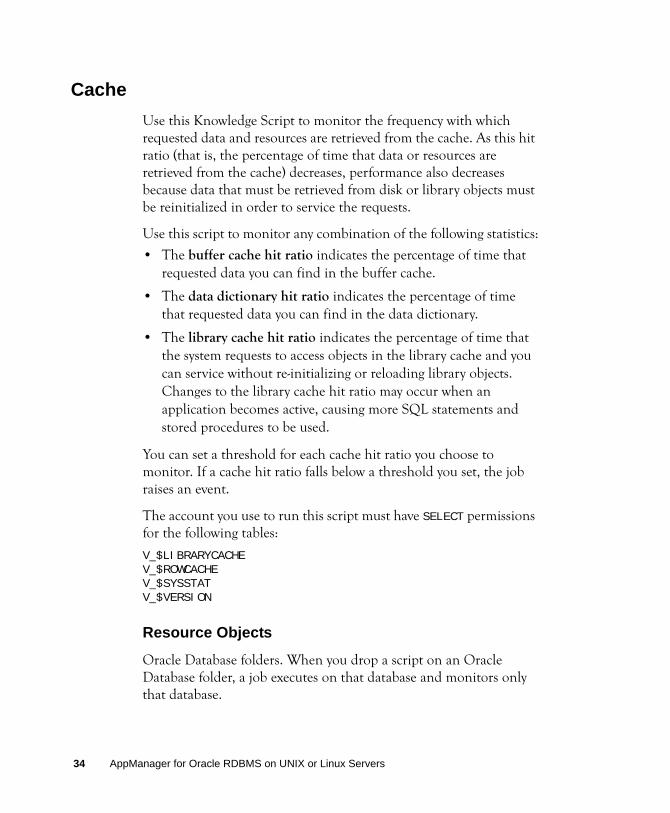
CacheUse this Knowledge Script to monitor the frequency with which requested data and resources are retrieved from the cache. As this hit ratio (that is, the percentage of time that data or resources are retrieved from the cache) decreases, performance also decreases because data that must be retrieved from disk or library objects must be reinitialized in order to service the requests.
Use this script to monitor any combination of the following statistics:
• The buffer cache hit ratio indicates the percentage of time that requested data you can find in the buffer cache.
• The data dictionary hit ratio indicates the percentage of time that requested data you can find in the data dictionary.
• The library cache hit ratio indicates the percentage of time that the system requests to access objects in the library cache and you can service without re-initializing or reloading library objects. Changes to the library cache hit ratio may occur when an application becomes active, causing more SQL statements and stored procedures to be used.
You can set a threshold for each cache hit ratio you choose to monitor. If a cache hit ratio falls below a threshold you set, the job raises an event.
The account you use to run this script must have SELECT permissions for the following tables:
V_$LIBRARYCACHEV_$ROWCACHEV_$SYSSTATV_$VERSION
Resource Objects
Oracle Database folders. When you drop a script on an Oracle Database folder, a job executes on that database and monitors only that database.
34 AppManager for Oracle RDBMS on UNIX or Linux Servers

Default Schedule
The default interval for this script is Every 10 minutes.
Setting Parameter Values
Set the following parameters as needed:
Description How to Set It
Oracle Username Enter the username that this script needs to access the target databases. If you run this script on more than one database, configure each database with the same username.Note To use SYSDBA authentication, leave this parameter blank.The default value is blank.
Collect data for monitored metrics?
Set to y to collect data for charts and reports. When you enable data collection, the Knowledge Script returns the statistics you choose to collect:• The buffer cache hit ratio• The data dictionary hit ratio• The library cache hit ratioBy default, data is not collected.
Monitor buffer cache hit ratio?
Select the Yes check box to monitor the percentage of time that requested data you can find in the buffer cache. By default, monitoring is performed.
Raise event if threshold is not met?
Select the Yes check box to raise an event if the buffer cache hit ratio exceeds the threshold you set. By default, the job raises an event.
Threshold -- Minimum buffer cache hit ratio
Enter a minimum threshold for the buffer cache hit ratio. If the actual hit ratio falls below than this threshold, the job raises an event. Ideally, you should set this percentage relatively high because the more frequently Oracle Database uses the buffer, the better your database performance. When the actual hit ratio falls below the threshold you set, the event alerts you that database performance has degraded.The default value is 70%.
Chapter 3 • OracleUNIX Knowledge Scripts 35

Severity Set the event severity level, from 1 to 40, to indicate the importance of the event. The default value is 10 (red event indicator).
Monitor data dictionary hit ratio?
Select the Yes check box to monitor the percentage of time that requested data you can find in the data dictionary. By default, monitoring is performed.
Raise event if threshold is not met?
Select the Yes check box to raise an event if the data dictionary hit ratio falls below the threshold you set. By default, the job raises an event. .
Threshold -- Minimum data dictionary hit ratio
Enter a minimum threshold for the data dictionary hit ratio. If the actual hit ratio falls below this threshold, the job raises an event. Ideally you should set this percentage high because the more frequently Oracle uses the data dictionary to service requests, the better your database performance. When the actual hit ratio falls below the threshold you set, the event alerts you that database performance has deteriorated.The default value is 90%.
Severity Set the event severity level, from 1 to 40, to indicate the importance of the event. The default value is 10 (red event indicator).
Monitor library cache hit ratio?
Select the Yes check box to monitor the percentage of time that system pin requests to access objects in the library cache you can service without re-initializing or reloading library objects. By default, monitoring is performed.
Raise event if threshold is not met?
Select the Yes check box to raise an event if the library cache hit ratio falls below the threshold you set. By default, the job raises events.
Description How to Set It
36 AppManager for Oracle RDBMS on UNIX or Linux Servers

Threshold -- Minimum library cache hit ratio
Enter a minimum threshold for the library cache hit ratio. If the actual hit ratio falls below this threshold, the job raises an event. Ideally, you should set this percentage extremely high because re-initializing or reloading library objects imposes a significant performance hit. When the actual hit ratio falls below the threshold you set, the event alerts you that database performance has degraded.The default value is 95%.
Severity Set the event severity level, from 1 to 40, to indicate the importance of the event. The default value is 10 (red event indicator).
Description How to Set It
Chapter 3 • OracleUNIX Knowledge Scripts 37

CallRateUse this Knowledge Script to monitor the demand placed on a database instance from all sources. This demand is determined by tracking the number of database calls per second from all applications and processes accessing the database instance. The database calls that are tracked include Parse, Execute, and Fetch statements. These calls are sometimes described as user calls. When the call rate (and thus the workload demand on the server) exceeds the threshold you set, the job raises an event.
The account you use to run this script must have SELECT permissions for the following tables:
V_$SYSSTATV_$VERSION
Resource Objects
Oracle Database folders. When you drop a script on an Oracle Database folder, a job executes on that database and monitors only that database.
Default Schedule
The default interval for this script is Every 10 minutes.
38 AppManager for Oracle RDBMS on UNIX or Linux Servers

Setting Parameter Values
Set the following parameters as needed:
Description How to Set It
Oracle Username Enter the username that this script needs to access the target databases. If you run this script on more than one database, configure each database with the same username.Note To use SYSDBA authentication, leave this parameter blank.The default value is blank.
Collect data for call rate?
Set to y to collect data for charts and reports. When you enable data collection, the Knowledge Script returns the total user calls per second for all work sources. By default, data is not collected.
Raise event if threshold is exceeded?
Select the Yes check box to raise an event if the maximum number of calls per second exceeds the threshold. By default, the job raises events.
Threshold -- Maximum call rate
Enter a threshold for the maximum number of calls per second allowed before the job raises an event. The default value is 100 calls per second.
Severity Set the event severity level, from 1 to 40, to indicate the importance of the event. The default value is 5 (red event indicator).
Chapter 3 • OracleUNIX Knowledge Scripts 39

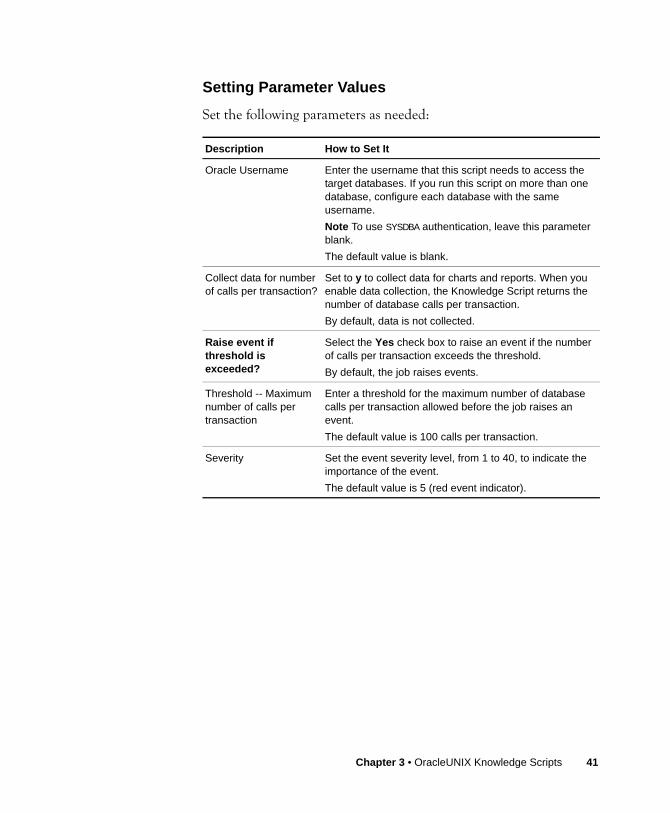
CallsPerTransactionUse this Knowledge Script to monitor the demand placed on a database instance by each transaction. This demand is determined by tracking the number of database calls (for example, to parse, execute, and fetch data) per committed transaction. When the number of database requests per transaction exceeds the threshold, the job raises an event.
The account you use to run this script must have SELECT permissions for the following tables:
V_$SYSSTATV_$VERSION
Resource Objects
Oracle Database folders. When you drop a script on an Oracle Database folder, a job executes on that database and monitors only that database.
Default Schedule
The default interval for this script is Every 10 minutes.
40 AppManager for Oracle RDBMS on UNIX or Linux Servers
Setting Parameter Values
Set the following parameters as needed:
Description How to Set It
Oracle Username Enter the username that this script needs to access the target databases. If you run this script on more than one database, configure each database with the same username.Note To use SYSDBA authentication, leave this parameter blank.The default value is blank.
Collect data for number of calls per transaction?
Set to y to collect data for charts and reports. When you enable data collection, the Knowledge Script returns the number of database calls per transaction. By default, data is not collected.
Raise event if threshold is exceeded?
Select the Yes check box to raise an event if the number of calls per transaction exceeds the threshold.By default, the job raises events.
Threshold -- Maximum number of calls per transaction
Enter a threshold for the maximum number of database calls per transaction allowed before the job raises an event. The default value is 100 calls per transaction.
Severity Set the event severity level, from 1 to 40, to indicate the importance of the event. The default value is 5 (red event indicator).
Chapter 3 • OracleUNIX Knowledge Scripts 41

ClusterInstanceDownUse this Knowledge Script to be notified when an Oracle instance in a cluster fails or becomes inactive.
Run this Knowledge Script for Oracle RAC monitoring only. This Knowledge Script uses the srvctl command functionality to fetch the statuses of all the cluster instances.
The account you use to run this script must have SELECT permissions for the following tables:
V_$VERSION
GV_$INSTANCE (for Oracle RAC monitoring only)
Resource Objects
Oracle Database folders. When you drop a script on an Oracle Database folder, a job executes on that database and determines if the instance running on that host is active or inactive.
Default Schedule
The default schedule for this script is Every 10 minutes.
Setting Parameter Values
Set the following parameters as needed:
Description How to Set It
Oracle Username For RAC cluster monitoring, enter the username that this script needs to access the target databases. If you run this script on more than one database, configure each database with the same username.Note This parameter must not be blank if you are deploying RAC cluster monitoring. If you are deploying non-RAC cluster monitoring, this parameter is ignored.The default value is blank.
42 AppManager for Oracle RDBMS on UNIX or Linux Servers

Collect data for instance status? Set to y to collect data for charts and reports. If you enable data collection, the script returns the status of each instance:• 100--instance is running• 0--instance is downBy default, data is not collected.
RAC Instance Exclude Filter Select the Yes check box to to exclude RAC instances.
RAC Instance to be excluded for status check [comma separated]
Enter the names of the RAC instances you want to exclude.
Raise event if instance is down or if unable to check status?
Select the Yes check box to raise an event when the instance is down. By default, events are enabled.
Severity Set the event severity level, from 1 to 40, to indicate the importance of the event detecting that an instance is down. The default severity level is 10 (red event indicator).
Chapter 3 • OracleUNIX Knowledge Scripts 43
ConsistentChangeRatioUse this Knowledge Script to monitor the extent to which applications exercise the read consistency mechanism to ensure database consistency.
The consistent change ratio is based on the number of database changes and database reads. “Consistent changes” refers to the number of times a consistent Get had to retrieve an old version of a database block because of updates that occurred after the cursor had been opened. When the ratio of consistent changes to consistent Gets exceeds the threshold, the job raises an event. The ratio is recalculated each time the script runs, based on the data collected during that monitoring interval.
The account you use to run this script must have SELECT permissions for the following tables:
V_$SYSSTATV_$VERSION
Resource Objects
Oracle Database folders. When you drop a script on an Oracle Database folder, a job executes on that database and monitors only that database.
Default Schedule
The default interval for this script is Every 1 hour.
44 AppManager for Oracle RDBMS on UNIX or Linux Servers

Setting Parameter Values
Set the following parameters as needed:
Description How to Set It
Oracle Username Enter the username that this script needs to access the target databases. If you run this script on more than one database, configure each database with the same username.Note To use SYSDBA authentication, leave this parameter blank.The default value is blank.
Collect data for consistent change ratio?
Set to y to collect data for charts and reports. When you enable data collection, the script returns the ratio of consistent changes to consistent gets.By default, data is not collected.
Raise event if threshold is exceeded?
Select the Yes check box to raise an event if the consistent change ratio exceeds the threshold you set. By default, the job raises events.
Threshold -- Maximum consistent change ratio
Enter a threshold for the maximum ratio of consistent block changes to consistent block gets during the monitoring interval.The default ratio is 0.01 consistent changes/consistent gets.
Severity Set the event severity level, from 1 to 40, to indicate the importance of the event. The default value is 5 (red event indicator).
Chapter 3 • OracleUNIX Knowledge Scripts 45

ContinuedRowRatioUse this Knowledge Script to monitor rows that span more than one database block. This script monitors the ratio of continued rows fetched to all rows fetched.
In most cases, this ratio should be close to zero. If the continued row ratio increases over time (indicating that more and more rows span multiple database blocks), it may mean that the PCTFREE storage parameter is set too low for one or more tables. If the continued row ratio exceeds the threshold, the job raises an event. The ratio is recalculated each time the script runs, based on the data collected during that interval.
The account you use to run this script must have SELECT permissions for the following tables:
V_$SYSSTATV_$VERSION
Resource Objects
Oracle Database folders. When you drop a script on an Oracle Database folder, a job executes on that database and monitors only that database.
Default Schedule
The default interval for this script is Every 30 minutes.
46 AppManager for Oracle RDBMS on UNIX or Linux Servers

Setting Parameter Values
Set the following parameters as needed:
Description How to Set It
Oracle Username Enter the username that this script needs to access the target databases. If you run this script on more than one database, configure each database with the same username.Note To use SYSDBA authentication, leave this parameter blank.The default value is blank.
Collect data for continued row ratio?
Set to y to collect data for charts and reports. When you enable data collection, the script returns the continued row ratio.By default, data is not collected.
Raise event if threshold is exceeded?
Select the Yes check box to raise an event if the continued row ratio exceeds the threshold. By default, the job raises events.
Threshold -- Maximum continued row ratio (0.0 to 1.0)
Enter a threshold for the maximum ratio of continued rows fetched to all rows fetched. Enter values from 0.0 to 1.0, inclusive.The default ratio is 0.01.
Severity Set the event severity level, from 1 to 40, to indicate the importance of the event. The default value is 5 (red event indicator).
Chapter 3 • OracleUNIX Knowledge Scripts 47

DatabaseConnectUse this Knowledge Script to monitor the connectivity and login capability of Oracle databases on UNIX and Linux systems. This script attempts to connect to the database you select. If the connection attempt is successful, this script reports the status of the database and of its login capability. If the connection attempt is unsuccessful, an event is raised.
The account you use to run this script must have SELECT permissions for the following tables:
V_$INSTANCEV_$VERSION
Resource Objects
Oracle Database folders. When you drop a script on an Oracle Database folder, a job executes on that database and monitors only that database.
Default Schedule
The default interval for this script is Every 10 minutes.
48 AppManager for Oracle RDBMS on UNIX or Linux Servers

Setting Parameter Values
Set the following parameters as needed:
Description How to Set It
Oracle Username Enter the username that this script needs to access the target databases. If you run this script on more than one database, configure each database with the same username.Note To use SYSDBA authentication, leave this parameter blank.The default value is blank.
Collect data for connection and login status?
Set to y to collect data for charts and reports. If you enable data collection, the script returns the status of the database and of its login capability.By default, data is not collected.
Raise event if unable to connect?
Select the Yes check box to raise an event if an attempt to connect to the Oracle database is unsuccessful.By default, events are enabled.
Severity Set the event severity level, from 1 to 40, to indicate the importance of the event. The default value is 5 (red event indicator).
Raise event with database and login status?
Select the Yes check box to raise an event providing information on the database and login status. By default, the job does not raise events.
Severity Set the event severity level, from 1 to 40, to indicate the importance of the event. The default value is 35 (magenta event indicator).
Chapter 3 • OracleUNIX Knowledge Scripts 49

DatabaseDownUse this Knowledge Script to monitor the status of a database. This script checks whether the Oracle background processes are running and whether a local connection can be made.
Each Oracle instance has a default set of background processes that must be running. An event is raised if any of the processes that you specified for monitoring in the Background processes to monitor parameter are down, or if a connection cannot be made to the database instance.
The account you use to run this script must have SELECT permissions for the following table:
V_$VERSION
Resource Objects
Oracle Database folders. When you drop a script on an Oracle Database folder, a job executes on that database and monitors only that database.
Default Schedule
The default interval for this script is Every 10 minutes.
50 AppManager for Oracle RDBMS on UNIX or Linux Servers

Setting Parameter Values
Set the following parameters as needed:
Description How to Set It
Oracle Username Enter the username that this script needs to access the target databases. If you run this script on more than one database, configure each database with the same username.Note To use SYSDBA authentication, leave this parameter blank.The default value is blank.
Collect data for process and connection status?
Set to y to collect data for charts and reports. When you enable data collection, the script returns the following values: • 100--all specified processes are running and a
connection attempt was successful• 80--one or more processes was down but a connection
attempt was successful• 0--no processes were running and/or a connection
attempt failedThis provides a way to report on the percentage of system uptime in any given period.By default, data is not collected.
Background processes to monitor (comma-separated, no spaces)
Enter the names of Oracle background processes you want to monitor, separated by commas and no spaces.The default value is: LGWR,PMON,SMON,RECO,DBWO,DBWR.
Create blackout file for a database if it appears to be down?
Select the Yes check box if the script should create a file in the blackout directory so that no further jobs are run on this database. The SetMonitoringOptions script must be run to set the blackout directory before this file can be created. By default, the file is not created.
Raise event if a process is down or unable to connect?
Select the Yes check box to raise an event if an Oracle database or background process is detected down.By default, events are enabled.
Severity Set the event severity level, from 1 to 40, to indicate the importance of the event. The default value is 15 (yellow event indicator).
Chapter 3 • OracleUNIX Knowledge Scripts 51

DataFileSpaceUse this Knowledge Script to monitor the size of an Oracle datafile. When the size of the datafile (in MB) exceeds the threshold, the job raises an event.
The account you use to run this script must have SELECT permissions for the following tables:
V_$VERSIONV_$DATAFILE
Resource Objects
Individual Oracle Database UNIX Datafiles. When dropped on a single datafile, the script monitors only that datafile.
Default Schedule
The default interval for this script is Every 10 minutes.
Setting Parameter Values
Set the following parameters as needed:
Description How to Set It
Oracle Username Enter the username that this script needs to access the target databases. If you run this script on more than one database, configure each database with the same username.Note To use SYSDBA authentication, leave this parameter blank.The default value is blank.
Collect data for datafile size?
Set to y to collect data for charts and reports. When you enable data collection, the Knowledge Script returns the current size of the datafile (in MB). By default, data is not collected.
Raise event if threshold is exceeded?
Select the Yes check box to raise an event if a datafile exceeds the size threshold you set. By default, the job raises events.
52 AppManager for Oracle RDBMS on UNIX or Linux Servers

Threshold -- Maximum datafile size
Enter a threshold for the maximum size a datafile can reach (in MB) before AppManager raises an event. The default value is 20 MB.
Severity Set the event severity level, from 1 to 40, to indicate the importance of the event. The default value is 10 (red event indicator).
Description How to Set It
Chapter 3 • OracleUNIX Knowledge Scripts 53

DataRatiosUse this Knowledge Script to monitor the following data ratios:
• Consistent Change Ratio: the extent to which applications exercise the read consistency mechanism to ensure database consistency.
The consistent change ratio is based on the number of database changes and database reads. “Consistent changes” refers to the number of times a consistent Get had to retrieve an old version of a database block because of updates occurring after the cursor had been opened. When the ratio of consistent changes to consistent Gets exceeds the threshold, the job raises an event. The ratio is recalculated each time the script runs, based on the data collected during that monitoring interval.
• Continued Row Ratio: the rows that span more than one database block and the ratio of continued rows fetched to all rows fetched.
In most cases, this ratio should be close to zero. If the continued row ratio increases over time (indicating that more and more rows span multiple database blocks), it may mean that the PCTFREE storage parameter is set too low for one or more tables. If the continued row ratio exceeds the threshold, the job raises an event. The ratio is recalculated each time the script runs, based on the data collected during that interval.
• Row Source Ratio: the row source ratio for an Oracle Database database. This ratio measures the percentage of rows retrieved using full table scans. Because a full table scan is less efficient than retrieval by row ID, this ratio gives you an indication of potential database performance problems. If you see an increase in this ratio, you may want to review other statistics to find the source of the problem. When this ratio exceeds the threshold, the job raises an event.
• Sort Overflow Ratio: the sort overflow ratio. This ratio compares the number of sorts that are using temporary segments to the
54 AppManager for Oracle RDBMS on UNIX or Linux Servers

total number of sorts. If the sort overflow ratio exceeds the threshold you set, the job raises an event.
An increase in the sort overflow ratio indicates that more sort operations are allocating work space on disk. If an excessive number of sorts are allocating work space on disk, you may want to increase the sort area size.
The account you use to run this script must have SELECT permissions for the following tables:
V_$SYSSTATV_$VERSION
Resource Objects
Oracle Database folders. When you drop a script on an Oracle Database folder, a job executes on that database and monitors only that database.
Default Schedule
The default interval for this script is Every 1Hour.
Setting Parameter Values
Set the following parameters as needed:
Description How to Set It
Oracle Username Enter the username that this script needs to access the target databases. If you run this script on more than one database, configure each database with the same username.Note To use SYSDBA authentication, leave this parameter blank.The default value is blank.
Ratios
Consistent Change Ratio
Select the Yes check box to monitor Consistent Change Ratio.
Chapter 3 • OracleUNIX Knowledge Scripts 55

Continued Row Ratio Select the Yes check box to monitor Continued Row Ratio.
Row Source Ratio Select the Yes check box to monitor Row Source Ratio.
Sort Overflow Ratio Select the Yes check box to monitor Sort Overflow Ratio.
Event Notification
Raise event if threshold is exceeded for Consistent Change Ratio?
Select the Yes check box to raise an event if the consistent change ratio exceeds the threshold you set. By default, the job raises events.
Raise event if threshold is exceeded for Continued Row Ratio?
Select the Yes check box to raise an event if the continued row ratio exceeds the threshold you set. By default, the job raises events.
Raise event if threshold is exceeded for Row Source Ratio?
Select the Yes check box to raise an event if the percentage of rows retrieved using a full table scan exceeds the threshold you set. By default, the job raises events.
Raise event if threshold is exceeded for Sort Overflow Ratio?
Select the Yes check box to raise an event if the sort overflow ratio exceeds the threshold you set. By default, the job raises events.
Severity Set the event severity level, from 1 to 40, to indicate the importance of the event. The default value is 10 (red event indicator).
Data Collection
Collect data for Consistent Change Ratio?
Select the Yes check box to collect data for charts and reports. When you enable data collection, the script returns the ratio of consistent changes to consistent gets.By default, data is not collected.
Collect data for Continued Row Ratio?
Select the Yes check box to collect data for charts and reports. When you enable data collection, the script returns the continued row ratio.By default, data is not collected.
Collect data for Row Source Ratio?
Select the Yes check box to collect data for graphs and reports. When you enable data collection, the script returns the percentage of rows retrieved using a full tables scan.By default, data is not collected.
Description How to Set It
56 AppManager for Oracle RDBMS on UNIX or Linux Servers

Collect data for Sort Overflow Ratio?
Select the Yes check box to collect data for charts and reports. When you enable data collection, the script returns the ratio of the number of sorts using temporary segments versus the number that of sorts that are not using temporary segments. For example, a ratio of .75 indicates that 3 out of 4 sorts are using temporary segments.By default, data is not collected.
Monitoring
Threshold -- Maximum consistent change ratio
Enter a threshold for the maximum ratio of consistent block changes to consistent block gets during the monitoring interval.The default ratio is 0.01 consistent changes/consistent gets.
Threshold -- Maximum continued row ratio [0.0 to 1.0]
Enter a threshold for the maximum ratio of continued rows fetched to all rows fetched. Enter values from 0.0 to 1.0, inclusive.The default ratio is 0.01..
Threshold -- Maximum row source ratio
Enter a maximum threshold for the row source ratio.The default ratio is .25.
Threshold -- Maximum sort overflow ratio?
Enter a threshold for the maximum sort overflow ratio allowed before the job raises an event. The default ratio is .75.
Description How to Set It
Chapter 3 • OracleUNIX Knowledge Scripts 57
DiskSpaceAvailUse this Knowledge Script to monitor the amount of disk space available for the archive log file, the background process log file, and user log files for a database. You can monitor the space available for all three, or for any combination of the three. For example, you could turn off monitoring for the archive log and background process log files and monitor just the disk space available for the user logs.
You can set a minimum threshold for each type of log file. If the amount of available disk space falls below any threshold, the job raises an event.
This Knowledge Script supports Automatic Storage Management (ASM).
The account you use to run this script must have SELECT permissions for the following tables:
V_$ARCHIVE_DESTV_$PARAMETERV_$VERSION
Resource Objects
Oracle Database folders. When you drop a script on an Oracle Database folder, a job executes on that database and monitors only that database.
Default Schedule
The default interval for this script is Every hour.
58 AppManager for Oracle RDBMS on UNIX or Linux Servers

Setting Parameter Values
Set the following parameters as needed:
Description How to Set It
Oracle Username Enter the username that this script needs to access the target databases. If you run this script on more than one database, configure each database with the same username.Note To use SYSDBA authentication, leave this parameter blank.The default value is blank.
Collect data for available disk space?
Set to y to collect data for charts and reports. When you enable data collection, the Knowledge Script returns the amount of free disk space for each type of log file that you are monitoring. By default, data is not collected.
Monitor space available for the archive log?
Select the Yes check box to monitor the amount of disk space available for thearchive log file of the database. By default, monitoring is performed.
Raise event if threshold is not met?
Select the Yes check box to raise an event if space available for the archive log falls below the minimum threshold. By default, the job raises events.
Threshold -- Minimum archive log space
Enter a threshold for the minimum available disk space for the archive log file. If the available space falls below this threshold, the job raises an event. The default value is 100 MB.
Severity Set the event severity level, from 1 to 40, to indicate the importance of the event. The default value is 10 (red event indicator).
Monitor space available for background process log?
Select the Yes check box to monitor the amount of space available for the background process log file of the database. By default, monitoring is performed.
Raise event if threshold is not met?
Select the Yes check box to raise an event if space available for the background process log file falls below the threshold. By default, the job raises events.
Chapter 3 • OracleUNIX Knowledge Scripts 59

Threshold -- Minimum background process log space
Enter a threshold for the minimum available disk space for the background process log file. If the amount of available space falls below this threshold, the job raises an event. The default value is 100 MB.
Severity Set the event severity level, from 1 to 40, to indicate the importance of the event. The default value is 10 (red event indicator).
Monitor space available for user logs?
Select the Yes check box to monitor the amount of space available for the user log files of the database. By default, monitoring is performed.
Raise event if threshold is not met?
Select the Yes check box to raise an event if space available for the user log file falls below the threshold. By default, the job raises events.
Threshold -- Minimum user log space
Enter a threshold for the minimum available disk space for user log files. If the amount of available space falls below this threshold, the job raises an event. The default value is 100 MB.
Severity Set the event severity level, from 1 to 40, to indicate the importance of the event. The default value is 10 (red event indicator).
Description How to Set It
60 AppManager for Oracle RDBMS on UNIX or Linux Servers

FreeListWaitsUse this Knowledge Script to retrieve the number of freelist waits and the total number of data requests, and to compute a ratio of the two numbers. You can set multiple thresholds for the ratio of freelist waits to data requests, and the job raises events when any one of the thresholds exceeds the value you specified.
The account you use to run this script must have SELECT permissions for the following tables:
V_$SYSSTATV_$VERSIONV_$WAITSTAT
Resource Objects
Oracle Database folders. When you drop a script on an Oracle Database folder, a job executes on that database and collects the number of freelist waits and the number of total data requests. The ratio of freelist waits to total data requests is then computed.
Default Schedule
The default interval for this script is Every 10 minutes.
Chapter 3 • OracleUNIX Knowledge Scripts 61

Setting Parameter Values
Set the following parameters as needed:
Description How to Set It
Oracle Username Enter the username that this script needs to access the target databases. If you run this script on more than one database, configure each database with the same username.Note To use SYSDBA authentication, leave this parameter blank.The default value is blank.
Collect data for ratio of freelist waits to total data requests?
Set to y to collect data for charts and reports. If data collection is enabled, returns the ratio of freelist waits to total data requests. By default, data is not collected.
Raise event if threshold is exceeded?
Select the Yes check box to raise an event if the threshold exceeds the value you specified.By default, events are enabled.
Threshold –- Maximum ratio of freelist waits to data requests
Specify a threshold for the maximum ratio of freelist waits to total data requests. The default for this threshold is .95.
Severity Set the event severity level, from 1 to 40, to indicate the importance of the event for successfully setting the monitoring options. The default severity level is 5 (red event indicator).
Raise event if threshold is exceeded?
Select the Yes check box to raise an event if the threshold exceeds the value you specified.By default, the job does not raise events.
Threshold –- Maximum ratio of freelist waits to data requests
Specify a threshold for the maximum ratio of freelist waits to total data requests. The default for this threshold is .80.
Severity Set the event severity level, from 1 to 40, to indicate the importance of the event for successfully setting the monitoring options. The default severity level is 15 (yellow event indicator).
62 AppManager for Oracle RDBMS on UNIX or Linux Servers
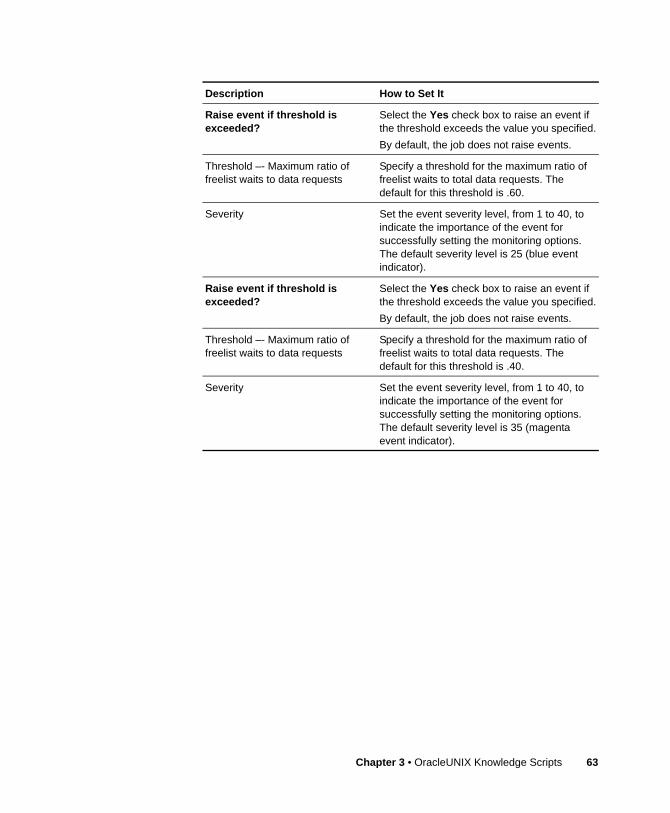
Raise event if threshold is exceeded?
Select the Yes check box to raise an event if the threshold exceeds the value you specified.By default, the job does not raise events.
Threshold –- Maximum ratio of freelist waits to data requests
Specify a threshold for the maximum ratio of freelist waits to total data requests. The default for this threshold is .60.
Severity Set the event severity level, from 1 to 40, to indicate the importance of the event for successfully setting the monitoring options. The default severity level is 25 (blue event indicator).
Raise event if threshold is exceeded?
Select the Yes check box to raise an event if the threshold exceeds the value you specified.By default, the job does not raise events.
Threshold –- Maximum ratio of freelist waits to data requests
Specify a threshold for the maximum ratio of freelist waits to total data requests. The default for this threshold is .40.
Severity Set the event severity level, from 1 to 40, to indicate the importance of the event for successfully setting the monitoring options. The default severity level is 35 (magenta event indicator).
Description How to Set It
Chapter 3 • OracleUNIX Knowledge Scripts 63

HealthCheckUse this Knowledge Script to monitor the following parameters:
• Cluster Instance Down: notify when an Oracle instance in a cluster fails or becomes inactive.
Run this Knowledge Script for Oracle RAC monitoring only. This Knowledge Script uses the srvctl command functionality to fetch the statuses of all the cluster instances.
• Database Connect: the connectivity and login capability of Oracle databases on UNIX and Linux systems. This script attempts to connect to the database you select. If the connection attempt is successful, this script reports the status of the database and of its login capability. If the connection attempt is unsuccessful, an event is raised.
• Database Down: the status of a database. This script checks whether the Oracle background processes are running and whether a local connection can be made.
Each Oracle instance has a default set of background processes that must be running. An event is raised if any of the processes that you specified for monitoring in the Background processes to monitor parameter are down, or if a connection cannot be made to the database instance.
The account you use to run this script must have SELECT permissions for the following tables:
V_$INSTANCE
V_$VERSIONGV_$INSTANCE (for Oracle RAC monitoring only)
Resource Objects
Oracle Database folders. When you drop a script on an Oracle Database folder, a job executes on that database and monitors only that database.
64 AppManager for Oracle RDBMS on UNIX or Linux Servers

Default Schedule
The default interval for this script is Every 10 minutes.
Setting Parameter Values
Set the following parameters as needed:
Description How to Set It
Oracle Username Enter the username that this script needs to access the target databases. If you run this script on more than one database, configure each database with the same username.Note To use SYSDBA authentication, leave this parameter blank.The default value is blank.
Health Check
Cluster Instance Down Select the Yes check box to monitor Cluster Instance Down.
Database Connect Select the Yes check box to monitor Database Connect.
Database Down Select the Yes check box to monitor Database Down.
Data Collection
Collect data for instance status? Set to y to collect data for charts and reports. If you enable data collection, the script returns the status of each instance:• 100--instance is running• 0--instance is downBy default, data is not collected.
Collect data for connection and login status?
Set to y to collect data for charts and reports. If you enable data collection, the script returns the status of the database and of its login capability.By default, data is not collected.
Chapter 3 • OracleUNIX Knowledge Scripts 65

Collect data for process and connection status?
Set to y to collect data for charts and reports. When you enable data collection, the script returns the following values: • 100--all specified processes are running
and a connection attempt was successful• 80--one or more processes was down but a
connection attempt was successful• 0--no processes were running and/or a
connection attempt failedThis parameter provides a way to report on the percentage of system uptime in any given period.By default, data is not collected.
Event Notification
Raise event if instance is down or if unable to check status?
Select the Yes check box to raise an event when the instance is down. By default, events are enabled.
Severity Set the event severity level, from 1 to 40, to indicate the importance of the event detecting that an instance is down. The default severity level is 10 (red event indicator).
Raise event if unable to connect? Select the Yes check box to raise an event if an attempt to connect to the Oracle database is unsuccessful.By default, events are enabled.
Severity Set the event severity level, from 1 to 40, to indicate the importance of the event. The default value is 5 (red event indicator).
Raise event with database and login status?
Select the Yes check box to raise an event providing information on the database and login status. By default, the job does not raise events.
Severity Set the event severity level, from 1 to 40, to indicate the importance of the event. The default value is 35 (magenta event indicator).
Description How to Set It
66 AppManager for Oracle RDBMS on UNIX or Linux Servers
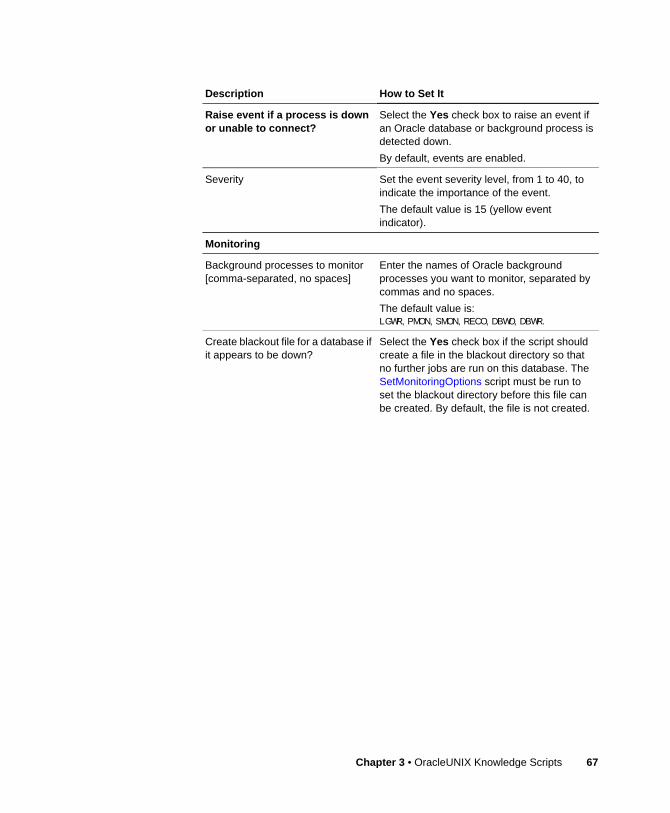
Raise event if a process is down or unable to connect?
Select the Yes check box to raise an event if an Oracle database or background process is detected down.By default, events are enabled.
Severity Set the event severity level, from 1 to 40, to indicate the importance of the event. The default value is 15 (yellow event indicator).
Monitoring
Background processes to monitor [comma-separated, no spaces]
Enter the names of Oracle background processes you want to monitor, separated by commas and no spaces.The default value is: LGWR,PMON,SMON,RECO,DBWO,DBWR.
Create blackout file for a database if it appears to be down?
Select the Yes check box if the script should create a file in the blackout directory so that no further jobs are run on this database. The SetMonitoringOptions script must be run to set the blackout directory before this file can be created. By default, the file is not created.
Description How to Set It
Chapter 3 • OracleUNIX Knowledge Scripts 67

ListenerUse this Knowledge Script to monitor Oracle listeners running on the host. This script can attempt to connect to each Oracle database using the service name. If the local connection attempt fails, or the service name connection attempt fails, or if an error occurs while running the job, an event is generated.
If you enable the Restart listeners that are not running? parameter, you have three options to specify the listeners that should be restarted. If the databases where you plan to drop the script share a single listener, you can specify the Oracle Home where the listener resides and, optionally, the name of the listener in the script itself. If the name is not specified, the job will start the default listener in that Oracle Home.
Note If you choose to have this script restart an Oracle listener that is not running, the UNIX account running the NetIQ UNIX agent must have write permissions on the $ORACLE_HOME/network/log folder if listener logging is enabled.
If the databases where you plan to drop the script use multiple listeners, you should specify this information in either a file that is created to identify the listeners that each $ORACLE_SID uses or in the default oratab file. If a file is created for this purpose, the path should be specified in the script, and it should have the following format:
$ORACLE_SID:LISTENER HOME:[LISTENER NAME]
where $ORACLE_SID is the name of the database instance, LISTENER HOME is the $ORACLE_HOME of the listener that should be restarted for this instance when no listener that can be used to connect to that instance is running, and LISTENER NAME is the name of this listener. It is not required to specify the name of the listener, as the default listener in the Oracle Home of the listener specified can be started, but if any text is presented in this column, it will be interpreted as a listener name.
68 AppManager for Oracle RDBMS on UNIX or Linux Servers

Example: A Linux host has two $ORACLE_HOME directories, one of version 8.1.7 and one of version 9.2.0. This environment requires that each database use a listener of its own version. Thus, the following file is created for restarting the listeners:
Orasid817:/oracle/product/8.1.7Orasid920:/oracle/product/9.2.0:lsnr_new
In this case, the default listener in $ORACLE_HOME/oracle/product/8.1.7 will be restarted when a listener is not running that knows about the Orasid817 database. For the Orasid920 database, the lsnr_new listener will be started from the version 9.2.0 Oracle Home.
If the path to a file containing listener information is not specified yet you have selected for listeners to be restarted, the script will use the default oratab file on the host to locate listener information. When this is the case, an entry in the $ORACLE_SID column labeled LSNR must exist, and the $ORACLE_HOME value for this identifier will be used to restart the default listener.
Example: /etc/oratab file## ORACLE_SID:$ORACLE_HOME:<N:Y>
#Orasid817:/oracle/product/8.1.7:Y
LSNR:/oracle/product/9.2.0:N
In this example, the format of the oratab is maintained, and the third column does not specify a listener name. This is because when the oratab file is read for listener information, there will be no use of listener names. The default listener in the Oracle Home specified for the LSNR entry will always be restarted.
Note This is an easy but restrictive way to specify the listener information. You should only use this option if you are running a single listener per host, yet are dropping a single job on multiple hosts where you can specify this type of information uniformly.
Chapter 3 • OracleUNIX Knowledge Scripts 69

The account you use to run this script must have SELECT permissions for the following table:
V_$VERSION
Resource Objects
Oracle Database folders. When you drop a script on an Oracle Database folder, a job executes on that database and monitors only that database.
Default Schedule
The default interval for this script is Every 10 minutes.
Setting Parameter Values
Set the following parameters as needed:
Description How to Set It
Oracle Username Enter the username that this script needs to access the target databases. If you run this script on more than one database, configure each database with the same username.Note To use SYSDBA authentication, leave this parameter blank.The default value is blank.
Collect data for success or failure of listener monitoring?
Set to y to collect data for charts and reports. If data collection is enabled, returns the current status of the listener process and the length of time it has been running.By default, data is not collected.
Monitor Oracle background processes?
Select the Yes check box to monitor Oracle background processes.By default, monitoring is enabled.
Background processes to monitor (comma-separated, no spaces)
Enter the names of Oracle background processes you want to monitor, separated by commas and no spaces.The default value is PMON,LGWR,SMON,RECO.
70 AppManager for Oracle RDBMS on UNIX or Linux Servers

Attempt a connection using service name?
Select the Yes check box to attempt a connection using a service name (tnsnames alias). By default, the connection is not attempted.
Location of tnsnames.ora
Specify the directory that can be used to set the $TNS_ADMIN environment variable so that the tnsnames.ora file can be found during the connection attempt using the service name. This value can be a specific folder, or it can be relative to the $ORACLE_HOME for the respective database. If $ORACLE_HOME is specified as part of the path, the script substitutes the appropriate folder path for this variable at the time the job is executed. The default location is: $ORACLE_HOME/network/admin.
Service Name Specify the service name you want to use for the connection attempt. By default, this name is usually the $ORACLE_SID value for the database. If $ORACLE_SID is specified as part of the name, the script substitutes the appropriate value for the respective database at the time the job is executed. In addition, domain names may be appended to $ORACLE_SID or the value specified (for example, $ORACLE_SID.netiq.eng). The default for this parameter is $ORACLE_SID.
Number of databases per host to attempt a service connection
Select the number of databases per host for which a service connection should be attempted. Options include 1, 2, 3, 4, 5, 6, 7, 8, 9, 10, 15, 20, 50, or ALL. The default value is ALL.
Restart listeners that are not running?
Select the Yes check box to restart listeners or specified background process(es) that are not running. By default, listeners are not restarted.
Number of attempts to restart a given listener
If you enabled the Restart listeners that are not running? parameter, enter the number of times the job should attempt to restart a listener that is not running before the job raises a failure event (see the Raise event if unable to restart a listener? parameter below). The default value is 1.
Options for specifying listener(s) to restart
Enter values below for the following parameters if you enabled the Restart listeners that are not running? parameter. These parameters let you select listeners to restart if they are detected as not running.
Oracle Home of listener to restart
Enter the Oracle Home where the listener to be restarted resides. The default value is blank.
Description How to Set It
Chapter 3 • OracleUNIX Knowledge Scripts 71

Name of listener to restart
Enter the name of the listener to restart. If you do not enter a name here, the job attempts to restart the default listener. The default value is blank.
Path to file with information on listener(s) to restart (leave blank to use oratab file)
Enter a full path and filename for a file containing the names and Oracle Homes of listeners that should be restarted if they are detected down. Use this parameter to restart multiple listeners.If you do not enter a path and filename here, the job uses the default oratab file for the Oracle Home listed above for the Oracle Home of listener parameter.
Raise event if listener or background process(es) not running?
Select the Yes check box to raise an event when the listener or specified background processes are not running. By default, events are enabled.
Severity Set the event severity level, from 1 to 40, to indicate the importance of the event. The default value is 5 (red event indicator).
Raise event with status of any restart attempt?
Select the Yes check box to raise an event giving the status of any attempts to restart listeners that are not running.By default, events are enabled.
Severity Set the event severity level, from 1 to 40, to indicate the importance of the event. The default value is 30 (magenta event indicator).
Raise event if connection attempts fail?
Select the Yes check box to raise an event if the connection attempts fail. By default, events are enabled.
Severity Set the event severity level, from 1 to 40, to indicate the importance of the event. The default value is 10 (red event indicator).
Raise event with status if listener running and connection(s) successful?
Select the Yes check box to raise an event with uptime information when listener is running and the connection is successful.By default, the job does not raise events.
Severity Set the event severity level, from 1 to 40, to indicate the importance of the event. The default value is 40 (magenta event indicator).
Description How to Set It
72 AppManager for Oracle RDBMS on UNIX or Linux Servers

Chapter 3 • OracleUNIX Knowledge Scripts 73

MemoryUse this Knowledge Script to monitor the following parameters:
• Freelist Waits: retrieve the number of freelist waits and the total number of data requests, and to compute a ratio of the two numbers. You can set multiple thresholds for the ratio of freelist waits to data requests, and the job raises events when any one of the thresholds exceeds the value you specified.
• Buffer Busy Waits: retrieve the number of buffer busy waits and the number of logical reads, and compute a ratio between the two numbers (expressed as a percentage). When you enable data collection, the repository stores the ratio. You can set multiple thresholds for the maximum ratio, and the job raises an event when any of the thresholds exceeds the value you specified. A higher ratio indicates an increased contention for buffers in the SGA memory of Oracle database.
• Cache: the frequency with which requested data and resources are retrieved from the cache. As this hit ratio (that is, the percentage of time that data or resources are retrieved from the cache) decreases, performance also decreases because data that must be retrieved from disk or library objects must be reinitialized in order to service the requests.
Use this script to monitor any combination of the following statistics:
• The buffer cache hit ratio indicates the percentage of time that requested data you can find in the buffer cache.
• The data dictionary hit ratio indicates the percentage of time that requested data you can find in the data dictionary.
• The library cache hit ratio indicates the percentage of time that system requests to access objects in the library cache you can service without re-initializing or reloading library objects. Changes to the library cache hit ratio may occur when an
74 AppManager for Oracle RDBMS on UNIX or Linux Servers

application becomes active, causing more SQL statements and stored procedures to be used.
You can set a threshold for each cache hit ratio you choose to monitor. If a cache hit ratio falls below a threshold you set, the job raises an event.
• BGProc: the total number of physical read/write (I/O) operations per second and/or the total memory usage for Oracle Database background processes. If the total number of read/write operations per second or the total memory usage exceeds the threshold, the job raises an event.
Oracle background processes include CKPT, DBW0, LGWR, PMON, RECO, SMON, SNP0, and others. You can monitor all or individual background processes.
The account you use to run this script must have SELECT permissions for the following tables:
V_$SYSSTATV_$VERSIONV_$WAITSTAT
V_$LIBRARYCACHEV_$ROWCACHEV_$SYSTEM_EVENT
V_$BGPROCESSV_$PROCESSV_$SESSIONV_$SESSTATV_$STATNAME
Resource Objects
Oracle Database folders. When you drop a script on an Oracle Database folder, a job executes on that database and monitors only that database.
Default Schedule
The default interval for this script is Every 10 minutes.
Chapter 3 • OracleUNIX Knowledge Scripts 75

Setting Parameter Values
Set the following parameters as needed:
Description How to Set It
Oracle Username Enter the username that this script needs to access the target databases. If you run this script on more than one database, configure each database with the same username.Note To use SYSDBA authentication, leave this parameter blank.The default value is blank.
Memory
Freelist Waits Select the Yes check box to monitor the Freelist Waits.
Buffer busy Waits Select the Yes check box to monitor the Buffer Busy Waits.
Cache
Monitor buffer cache hit ratio? Select the Yes check box to monitor the percentage of time that requested data you can find in the buffer cache. By default, monitoring is performed.
Monitor data dictionary hit ratio? Select the Yes check box to monitor the percentage of time that requested data you can find in the data dictionary. By default, monitoring is performed.
Monitor library cache hit ratio? Select the Yes check box to monitor the percentage of time that system pin requests to access objects in the library cache you can service without re-initializing or reloading library objects. By default, monitoring is performed.
BGProc
76 AppManager for Oracle RDBMS on UNIX or Linux Servers

Oracle background porcesses to monitor
Enter the names of the background processes you want to monitor. Separate the names with commas; do not use spaces. To monitor all Oracle Database background processes, enter an asterisk (*).Possible valid background process names include:• CKPT
• DBW0
• LGWR
• PMON
• RECO
• SMON
• SNP0
• SNP1
The default value is (*) (all background processes).
Monitor read/write operations? Select the Yes check box to monitor the number of physical read/write operations per second by background processes. By default, monitoring is performed.
Monitor memory usage? Select the Yes check box to monitor the total memory usage by background processes. By default, monitoring is performed.
Event Notification
Raise event if threshold is exceeded for ratio of freelist waits to total data requests?
Raise event if threshold is exceeded?
Select the Yes check box to raise an event if the threshold exceeds the value you specified.By default, events are enabled.
Threshold -- Maximum ratio of freelist waits to data requests
Specify a threshold for the maximum ratio of freelist waits to total data requests. The default for this threshold is .95.
Severity Set the event severity level, from 1 to 40, to indicate the importance of the event for successfully setting the monitoring options. The default severity level is 5 (red event indicator).
Description How to Set It
Chapter 3 • OracleUNIX Knowledge Scripts 77

Raise event if ratio exceeds threshold?
Select the Yes check box to raise an event if the threshold exceeds the value you specified.By default, the job does not raise events.
Threshold -- Maximum ratio of freelist waits to data requests
Specify a threshold for the maximum ratio of freelist waits to total data requests. The default for this threshold is .80.
Severity Set the event severity level, from 1 to 40, to indicate the importance of the event for successfully setting the monitoring options. The default severity level is 15 (yellow event indicator).
Raise event if ratio exceeds threshold?
Select the Yes check box to raise an event if the threshold exceeds the value you specified.By default, the job does not raise events.
Threshold -- Maximum ratio of freelist waits to data requests
Specify a threshold for the maximum ratio of freelist waits to total data requests. The default for this threshold is .60.
Severity Set the event severity level, from 1 to 40, to indicate the importance of the event for successfully setting the monitoring options. The default severity level is 25 (blue event indicator).
Raise event if ratio exceeds threshold?
Select the Yes check box to raise an event if the threshold exceeds the value you specified.By default, the job does not raise events.
Threshold -- Maximum ratio of freelist waits to data requests
Specify a threshold for the maximum ratio of freelist waits to total data requests. The default for this threshold is .40.
Severity Set the event severity level, from 1 to 40, to indicate the importance of the event for successfully setting the monitoring options. The default severity level is 35 (magenta event indicator).
Raise event if threshold is exceeded for ratio of buffer busy waits to logical reads?
Description How to Set It
78 AppManager for Oracle RDBMS on UNIX or Linux Servers

Raise event if threshold is exceeded?
Select the Yes check box to raise an event if the threshold exceeds the specified limit.By default, events are enabled.
Threshold -- Maximum ratio of buffer busy waits to logical reads
Specify a threshold for the maximum ratio of buffer busy waits to logical reads. The default for this threshold is.95.
Severity Set the event severity level, from 1 to 40, to indicate the importance of the event for successfully setting the monitoring options. The default severity level is 5 (red event indicator).
Raise event if threshold is exceeded?
Select the Yes check box to raise an event if the ratio exceeds the threshold specified below.By default, the job does not raise events.
Threshold -- Maximum ratio of buffer busy waits to logical reads
Specify a threshold for the maximum ratio of buffer busy waits to logical reads. The default value is.80.
Severity Set the event severity level, from 1 to 40, to indicate the importance of the event for successfully setting the monitoring options. The default severity level is 15 (yellow event indicator).
Raise event if threshold is exceeded?
Select the Yes check box to raise an event if the threshold exceeds the value you specified.By default, the job does not raise events.
Threshold -- Maximum ratio of buffer busy waits to logical reads
Specify a threshold for the maximum ratio of buffer busy waits to logical reads. The default value is.60.
Severity Set the event severity level, from 1 to 40, to indicate the importance of the event for successfully setting the monitoring options. The default severity level is 25 (blue event indicator).
Raise event if threshold is exceeded?
Select the Yes check box to raise an event if the threshold exceeds the value you specified.By default, the job does not raise events.
Description How to Set It
Chapter 3 • OracleUNIX Knowledge Scripts 79

Threshold -- Maximum ratio of buffer busy waits to logical reads
Specify a threshold for the maximum ratio of buffer busy waits to logical reads. The default value is .40.
Severity Set the event severity level, from 1 to 40, to indicate the importance of the event for successfully setting the monitoring options. The default severity level is 35 (magenta event indicator).
Raise event for cache?
Raise event if threshold is not met?
Select the Yes check box to raise an event if the buffer cache hit ratio exceeds the threshold you set. By default, the job raises an event.
Threshold -- Minimum buffer cache ratio
Enter a minimum threshold for the buffer cache hit ratio. If the actual hit ratio falls below than this threshold, the job raises an event. Ideally, you should set this percentage relatively high because the more frequently Oracle Database uses the buffer, the better your database performance. When the actual hit ratio falls below the threshold you set, the event alerts you that database performance has degraded.The default value is 70%.
Severity Set the event severity level, from 1 to 40, to indicate the importance of the event. The default value is 10 (red event indicator).
Raise event if threshold is not met?
Select the Yes check box to raise an event if the data dictionary hit ratio falls below the threshold you set. By default, the job raises an event. .
Description How to Set It
80 AppManager for Oracle RDBMS on UNIX or Linux Servers

Threshold -- Minimum data dictionary hit ratio
Enter a minimum threshold for the data dictionary hit ratio. If the actual hit ratio falls below this threshold, the job raises an event. Ideally you should set this percentage high because the more frequently Oracle uses the data dictionary to service requests, the better your database performance. When the actual hit ratio falls below the threshold you set, the event alerts you that database performance has deteriorated.The default value is 90%.
Severity Set the event severity level, from 1 to 40, to indicate the importance of the event. The default value is 10 (red event indicator).
Raise event if threshold is not met?
Select the Yes check box to raise an event if the library cache hit ratio falls below the threshold you set. By default, the job raises events.
Threshold -- Minimum library cache hit ratio
Enter a minimum threshold for the library cache hit ratio. If the actual hit ratio falls below this threshold, the job raises an event. Ideally,you should set this percentage extremely high because re-initializing or reloading library objects imposes a significant performance hit. When the actual hit ratio falls below the threshold you set, the event alerts you that database performance has degraded.The default value is 95%.
Severity Set the event severity level, from 1 to 40, to indicate the importance of the event. The default value is 10 (red event indicator).
Raise event for Oracle Background processes?
Raise event if threshold is exceeded?
Select the Yes check box to raise an event when the number of physical read/write operations per second exceeds the threshold you set. By default, events are not enabled.
Description How to Set It
Chapter 3 • OracleUNIX Knowledge Scripts 81

Threshold -- Maximum read/write operations rate
Enter a threshold for the maximum number of physical read/write operations per second. The default value is 5 read/write operations per second.
Severity Set the event severity level, from 1 to 40, to indicate the importance of the event. The default value is 15 (yellow event indicator).
Raise event if threshold is exceeded?
Select the Yes check box to raise an event when the memory utilization of the monitored processes exceeds the threshold you set. By default, events are not enabled.
Threshold -- Maximum memory usage
Enter a threshold (in MB) for the maximum amount of memory used by all background processes you are monitoring. The default value is 15 MB.
Severity Set the event severity level, from 1 to 40, to indicate the importance of the event. The default value is 15 (yellow event indicator).
Data Collection
Collect data for ratio of freelist waits to total data requests?
Select the Yes check box to collect data for charts and reports. If data collection is enabled, returns the ratio of freelist waits to total data requests. By default, data is not collected.
Collect data for ratio of buffer busy waits to logical reads?
Select the Yes check box to collect data for charts and reports. If data collection is enabled, returns the ratio of buffer busy waits to logical reads as a percentage (%). By default, data is not collected.
Description How to Set It
82 AppManager for Oracle RDBMS on UNIX or Linux Servers

Collect data for Cache? Select the Yes check box to collect data for charts and reports. When you enable data collection, the Knowledge Script returns the statistics you choose to collect:• The buffer cache hit ratio• The data dictionary hit ratio• The library cache hit ratioBy default, data is not collected.
Collect data for memory usage and I/O of Oracle processes?
Select the Yes check box to collect data for charts and reports. If data collection is enabled, returns the number of read/write operations per second, and/or the total memory usage for all monitored background processes. By default, data is not collected.
Description How to Set It
Chapter 3 • OracleUNIX Knowledge Scripts 83

MostExecutedSQLStatementsUse this Knowledge Script to determine which SQL queries or statements are being executed on a given Oracle database most frequently. This script identifies the N most frequently executed queries and returns the results in an event. You set a value for N using the Number of SQL statements to retrieve parameter.
When you enable data collection, the most frequently executed SQL statements are stored in the repository.
The account you use to run this script must have SELECT permissions for the following tables:
V_$SQLAREAV_$VERSION
Resource Objects
Oracle Database folders. When you drop a script on an Oracle Database folder, a job executes on that database and collects the N most executed SQL statements or queries.
Default Schedule
The default interval for this script is Every 10 minutes.
84 AppManager for Oracle RDBMS on UNIX or Linux Servers

Setting Parameter Values
Set the following parameters as needed:
Description How to Set It
Oracle Username Enter the username that this script needs to access the target databases. If you run this script on more than one database, configure each database with the same username.Note To use SYSDBA authentication, leave this parameter blank.The default value is blank.
Collect data for most executed SQL statements?
Set to y to collect data for charts and reports. If data collection is enabled, returns the top N most frequently executed SQL statements. Set a value for N using the Number of SQL statements to retrieve parameter (see below). By default, data is not collected.
Number of SQL statements to retrieve
The number of most frequently executed SQL queries to be retrieved by the job. The default value is 10. The maximum is 30.
Raise event if error occurs during retrieval?
Select the Yes check box to raise an event if an error occurs during the retrieval of SQL statements. By default, events are enabled.
Severity Set the event severity level, from 1 to 40, to indicate the importance of the event for successfully setting the monitoring options. The default severity level is 10 (red event indicator).
Raise event with results from query?
Select the Yes check box to raise an event with details of the query results. By default, the job does not raise events.
Severity Set the event severity level, from 1 to 40, to indicate the importance of the event for successfully setting the monitoring options. The default severity level is 40 magenta event indicator).
Chapter 3 • OracleUNIX Knowledge Scripts 85

OpenCursorsUse this Knowledge Script to monitor the percentage of cursors opened per session, as well as the total number of cursors open in the system. In the Oracle environment, a cursor is a type of handle (or pointer) used to identify a query in the system. Cursors can be opened by users or by the system itself. A high number of open cursors can be caused by a programming error, and may cause database performance problems. In the init.ora file, you can specify the maximum number of cursors that may be opened by a session.
In this script, you can specify a maximum threshold for the percentage of open cursors allowed per session--a percentage of the number specified for the open_cursor parameter in the init.ora file. For example, if the init.ora file specifies that 60 cursors may be open in a session, and you set a maximum threshold of 75%, the script raises an event when 75% of the 60 allowed cursors (or 45 cursors) are open in any session.
You can also specify a maximum threshold for the total number of open cursors allowed in the system. The job raises an event if either threshold exceeds the value you specified.
The account you use to run this script must have SELECT permissions for the following tables:
V_$PARAMETERV_$VERSION
Resource Objects
Oracle Database folders. When you drop a script on an Oracle Database folder, a job executes on that database and monitors only that database.
Default Schedule
The default interval for this script is Every 10 minutes.
86 AppManager for Oracle RDBMS on UNIX or Linux Servers

Setting Parameter Values
Set the following parameters as needed:
Description How to Set It
Oracle Username Enter the username that this script needs to access the target databases. If you run this script on more than one database, configure each database with the same username.Note To use SYSDBA authentication, leave this parameter blank.The default value is blank.
Collect data for number of open cursors?
Set to y to collect data for charts and reports. When you enable data collection, the Knowledge Script returns the total number of open cursors in the system. By default, data is not collected.
Raise event if threshold is exceeded?
Select the Yes check box to raise an event if the number of cursors open in the system exceeds the threshold you set. By default, the job raises events.
Threshold -- Maximum number of open cursors in system
Specify a maximum threshold for the number of cursors that may be open in the system. The default value is 1000 open cursors.
Severity Set the event severity level, from 1 to 40, to indicate the importance of the event. The default value is 10 (red event indicator).
Raise event if threshold is exceeded?
Select the Yes check box to raise an event if the percentage of cursors opened per session exceeds the threshold you set. By default, the job raises events.
Threshold -- Maximum percentage of cursors opened per session
Specify a maximum threshold for the percentage of open cursors per session. Note that this percentage is based on the number of open cursors allowed per session specified in the init.ora file. The default value is 80%.
Severity Set the event severity level, from 1 to 40, to indicate the importance of the event. The default value is 10 (red event indicator).
Chapter 3 • OracleUNIX Knowledge Scripts 87

88 AppManager for Oracle RDBMS on UNIX or Linux Servers

PerformanceUse this Knowledge Script to monitor the following parameters:
• Top CPU Users: the CPU time for current user sessions. If the CPU utilization exceeds the threshold, the job raises an event.
You can specify the number of user sessions with the highest CPU utilization to display in the Event Properties dialog box. The Event Properties dialog box includes the CPU usage for each of the top N sessions, username, session ID, and program name. Enter 0 to display all user sessions.
This script requires that the Oracle timed_statistics parameter be turned on (set to TRUE) for the database you are monitoring.
• Top IO Users: physical reads and writes (I/O) for current user sessions. If the number of physical reads/writes per second (the physical read/write operations rate) exceeds the threshold you set, the job raises an event.
You can specify the number of user sessions with the highest physical read/write operations rate to display in the Event Properties dialog box. Information in the Event Properties dialog box includes the physical reads/writes per second for each of the top N sessions, username, session ID, and program name.
This script requires that the Oracle timed_statistics parameter is turned on for the database you are monitoring.
• Top Lock Users: the current number of user-held locks on an Oracle database. If the number of locks exceeds the threshold, the job raises an event.
You can specify the number of user sessions holding the most locks to display in the Event Properties dialog box, or enter 0 to display all sessions. Information in the Event Properties dialog box includes the number of locks held by each session, username, session ID, and program name.
Chapter 3 • OracleUNIX Knowledge Scripts 89

• Top Memory Users: memory utilization (User Global Area and Program Global Area) for current user sessions. If the memory utilization exceeds the threshold, the job raises an event.
You can specify the number of user sessions with the highest memory usage to display in the Event Properties dialog box. Information in the Event Properties dialog box includes the memory in bytes for each session, username, session ID, and program name. Enter 0 for the Number of top user sessions to display parameter if you want to include memory utilization statistics for all user sessions in the event details.
• Open Cursors: the percentage of cursors opened per session, as well as the total number of cursors open in the system. In the Oracle environment, a cursor is a type of handle (or pointer) used to identify a query in the system. Cursors can be opened by users or by the system itself. A high number of open cursors can be caused by a programming error, and may cause database performance problems. In the init.ora file, you can specify the maximum number of cursors that may be opened by a session.
In this script, you can specify a maximum threshold for the percentage of open cursors allowed per session--a percentage of the number specified for the open_cursor parameter in the init.ora file. For example, if the init.ora file specifies that 60 cursors may be open in a session, and you set a maximum threshold of 75%, the script raises an event when 75% of the 60 allowed cursors (or 45 cursors) are open in any session.
You can also specify a maximum threshold for the total number of open cursors allowed in the system. The job raises an event if either threshold exceeds the value you specified.
The account you use to run this script must have SELECT permissions for the following tables:
DBA_USERSV_$SESSIONV_$SESSTAT
90 AppManager for Oracle RDBMS on UNIX or Linux Servers
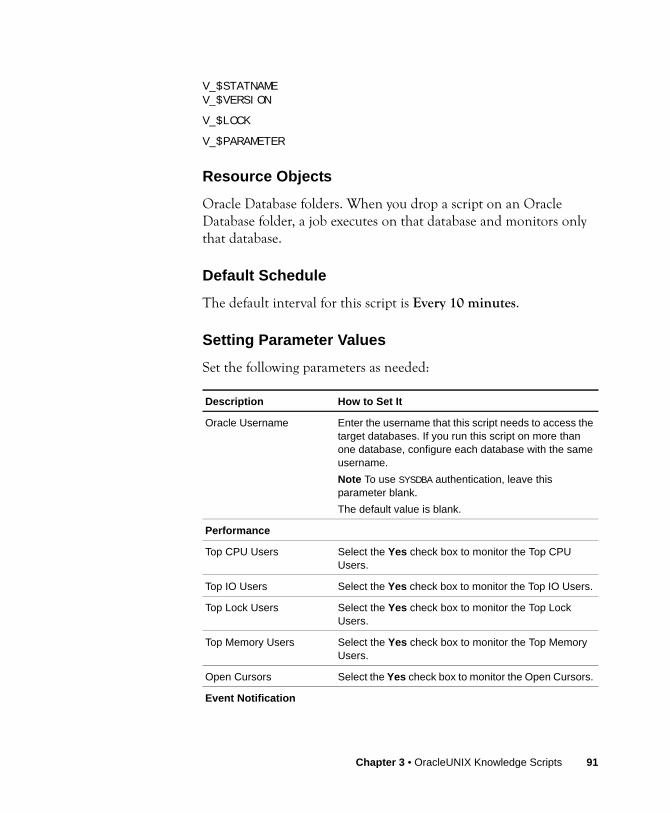
V_$STATNAMEV_$VERSION
V_$LOCK
V_$PARAMETER
Resource Objects
Oracle Database folders. When you drop a script on an Oracle Database folder, a job executes on that database and monitors only that database.
Default Schedule
The default interval for this script is Every 10 minutes.
Setting Parameter Values
Set the following parameters as needed:
Description How to Set It
Oracle Username Enter the username that this script needs to access the target databases. If you run this script on more than one database, configure each database with the same username.Note To use SYSDBA authentication, leave this parameter blank.The default value is blank.
Performance
Top CPU Users Select the Yes check box to monitor the Top CPU Users.
Top IO Users Select the Yes check box to monitor the Top IO Users.
Top Lock Users Select the Yes check box to monitor the Top Lock Users.
Top Memory Users Select the Yes check box to monitor the Top Memory Users.
Open Cursors Select the Yes check box to monitor the Open Cursors.
Event Notification
Chapter 3 • OracleUNIX Knowledge Scripts 91

Raise event if threshold exceeded for Top CPU Users?
Select the Yes check box to raise an event if the CPU usage of any user session exceeds the threshold you set. By default, the job raises events.
Raise event if threshold exceeded for Top IO Users?
Select the Yes check box to raise an event if the physical read/write operations of any single user session exceed the threshold you set. By default, the job raises events.
Raise event if threshold exceeded for Top Lock Users?
Select the Yes check box to raise an event if the number of user-held locks on the server exceeds the threshold you set.By default, the job raises events.
Raise event if threshold exceeded for Top Memory Users?
Select the Yes check box to raise an event if the total memory usage of any user session exceeds the threshold you set. By default, the job raises events.
Raise event if threshold is exceeded for Total Number of Open Cursors in the System?
Select the Yes check box to raise an event if the number of cursors open in the system exceeds the threshold you set. By default, the job raises events.
Severity Set the event severity level, from 1 to 40, to indicate the importance of the event. The default value is 10 (red event indicator).
Raise event if threshold is exceeded for Percentage of Cursors Opened per Session?
Select the Yes check box to raise an event if the percentage of cursors opened per session exceeds the threshold you set. By default, the job raises events.
Severity Set the event severity level, from 1 to 40, to indicate the importance of the event. The default value is 10 (red event indicator).
Severity Set the event severity level, from 1 to 40, to indicate the importance of the event. The default value is 5 (red event indicator).
Data Collection
Description How to Set It
92 AppManager for Oracle RDBMS on UNIX or Linux Servers

Collect data for Top CPU Users?
Select the Yes check box to collect data for charts and reports. When you enable data collection, the Knowledge Script returns the total CPU time for the top N users. By default, data is not collected.
Collect data for Top IO Users?
Select the Yes check box to collect data for charts and reports. When you enable data collection, the Knowledge Script returns the total number of physical reads/writes per second for the top N users. By default, data is not collected.
Collect data for Top Lock Users?
Select the Yes check box to collect data for charts and reports. When you enable data collection, the Knowledge Script returns the current number of user-held locks by the user sessions with the highest number of locks. By default, data is not collected.
Collect data for Top Memory Users?
Select the Yes check box to collect data for charts and reports. When you enable data collection, the Knowledge Script returns the total memory usage (in MB) for the top N user sessions. By default, data is not collected.
Collect data for Open Cursor?
Select the Yes check box to collect data for charts and reports. When you enable data collection, the Knowledge Script returns the total number of open cursors in the system. By default, data is not collected.
Monitoring
Number of user sessions of display [Not Applicable to Open Cursor Counters]
Specify the number of user sessions you want displayed in the Event Properties dialog box. Enter 0 if you want information for all user sessions. The default value is 15 user sessions.
Threshold -- Maximum amount of CPU time for a user session
Enter a threshold for the maximum number of CPU cycles per 1/100th of a second that a single user session can use before the job raises an event. The default value is 50 CPU cycles per 1/100th of a second.
Description How to Set It
Chapter 3 • OracleUNIX Knowledge Scripts 93

Threshold -- Maximum read/write operations for a user session
Enter a threshold for the maximum number of physical reads/writes per second allowed before the job raises an event. The default value is 300 read/write operations.
Threshold -- Maximum number of locks held by a user session
Enter a threshold for the maximum number of user-held locks on an Oracle Database. The default value is 35 locks.
Threshold -- Maximum amount of memory for a user session
Enter a threshold for the maximum total memory usage (in MB) for any user session. The default value is 10 MB.
Threshold -- Maximum percentage of cursors opened per session
Specify a maximum threshold for the percentage of open cursors per session. Note that this percentage is based on the number of open cursors allowed per session specified in the init.ora file. The default value is 80%.
Threshold -- Maximum number of open cursors in system
Specify a maximum threshold for the number of cursors that may be open in the system. The default value is 1000 open cursors.
Description How to Set It
94 AppManager for Oracle RDBMS on UNIX or Linux Servers

RedoLogUse this Knowledge Script to monitor the following parameters:
• Redo Log Contention: the number of times that a process tries to write an entry in the redo log buffer. The job raises an event and than stores data if the number of tries is different for subsequent iterations of the script.
The number of retries should be low. A high number of retries can adversely affect system performance, as processes must wait for buffers. If a process has to make numerous attempts to write an entry in the redo log buffer, you may need to allocate more space to the redo log buffer.
You can set a threshold value for the maximum number of times a process can try to write an entry in the redo log buffer. If the number of retries exceeds the threshold, an event is raised.
• Redo Log Space Wait Ratio: the redo log space wait ratio. The redo log space wait ratio measures memory allocation. The ratio reflects the number of times the background process was requested to allocate space within the redo file per number of redo log entries. If this ratio increases, you may want to increase the size of the redo log buffer.
When the redo log space wait ratio exceeds the threshold you set, the job raises an event.
• Redo Logs Not Archived: retrieve the number of redo logs that are not being archived, if archiving is turned on for a given Oracle database. The number of redo logs not archived is returned and compared against the thresholds you specify. The Knowledge Script retrieves the archive status for an Oracle database from the AppManager repository, which is updated during discovery. To enable archiving, you must rediscover the Oracle UNIX resources if the redo log archive is enabled after you discover resources.
When you enable data collection, the number of redo logs not archived is stored in the repository. You can set multiple
Chapter 3 • OracleUNIX Knowledge Scripts 95

thresholds for the number of redo logs not archived, with varying severities, and the job raises an event when any of these thresholds exceeds the value you specified.
The account you use to run this script must have SELECT permissions for the following tables:
V_$SGASTATV_$SYSSTATV_$VERSION
V_$LOG
Resource Objects
Oracle Database folders. When you drop a script on an Oracle Database folder, a job executes on that database and monitors only that database.
Default Schedule
The default interval for this script is Every 10 minutes.
Setting Parameter Values
Set the following parameters as needed:
Description How to Set It
Oracle Username Enter the username that this script needs to access the target databases. If you run this script on more than one database, configure each database with the same username.Note To use SYSDBA authentication, leave this parameter blank.The default value is blank.
Redo Log
Redo Log Contention Select the Yes check box to monitor Redo Log Contention.
Redo Log Space wait Ratio
Select the Yes check box to monitor Redo Log Space Wait Ratio.
96 AppManager for Oracle RDBMS on UNIX or Linux Servers

Redo Log Not Archived
Select the Yes check box to monitor Redo Log Not Archived.
Event Notification
Raise event if threshold is exceeded for Redo Log Contention?
Select the Yes check box to raise an event if the number of times that a process tries to rewrite an entry to the redo log buffer exceeds the threshold you set. By default, the job raises events.
Threshold -- Maximum redo log buffer allocation retries
Enter a threshold for the maximum number of times that a process may try to rewrite an entry to the redo log buffer before the job raises an event. The default value is 50 retries.
Severity Set the event severity level, from 1 to 40, to indicate the importance of the event. The default value is 5 (red event indicator).
Raise event if threshold is exceeded for Redo Log Space Wait Ratio?
Select the Yes check box to raise an event if the redo log space wait ratio exceeds the threshold you set. By default, the job raises events.
Threshold -- Maximum redo log space wait ratio
Enter a maximum threshold for the redo log space wait ratio. The default ratio is 0.0002.
Severity Set the event severity level, from 1 to 40, to indicate the importance of the event. The default value is 10 (red event indicator).
Raise event if threshold is exceeded for Redo Logs not archived?
Select the Yes check box to raise an event if the threshold exceeds the value you specified.By default, events are enabled.
Threshold -- Maximum number of redo logs not archived
Specify a threshold for the maximum number of redo logs that have not been archived. The default value is 6 redo logs.
Severity Set the event severity level, from 1 to 40, to indicate the importance of the event. The default severity level is 5 (red event indicator).
Description How to Set It
Chapter 3 • OracleUNIX Knowledge Scripts 97

Raise event if threshold is exceeded for Redo Logs not archived?
Select the Yes check box to raise an event if the threshold exceeds the value you specified.By default, the job does not raise events.
Threshold -- Maximum number of redo logs not archived
Specify a threshold for the maximum number of redo logs that have not been archived. The default for this threshold is 4 redo logs.
Severity Set the event severity level, from 1 to 40, to indicate the importance of the event. The default severity level is 15 (yellow event indicator).
Raise event if threshold is exceeded for Redo Logs not archived?
Select the Yes check box to raise an event if the threshold exceeds the value you specified.By default, the job does not raise events.
Threshold -- Maximum number of redo logs not archived
Specify a threshold for the maximum number of redo logs that have not been archived. The default for this threshold is 2 redo logs.
Severity Set the event severity level, from 1 to 40, to indicate the importance of the event. The default severity level is 25 (blue event indicator).
Raise event if threshold is exceeded for Redo Logs not archived?
Select the Yes check box to raise an event if the threshold exceeds the value you specified.By default, the job does not raise events.
Threshold -- Maximum number of redo logs not archived
Specify a threshold for the maximum number of redo logs that have not been archived. The default for this threshold is 1 redo log.
Severity Set the event severity level, from 1 to 40, to indicate the importance of the event. The default severity level is 35 (magenta event indicator).
Data Collection
Collect data for Redo Log Contention?
Select the Yes check box to collect data for charts and reports. When you enable data collection, the Knowledge Script returns the number of times that processes attempted to write entries to the redo log buffer. By default, data is not collected.
Description How to Set It
98 AppManager for Oracle RDBMS on UNIX or Linux Servers

Collect data for Redo Log Space Wait Ratio?
Select the Yes check box to collect data for charts and reports. When you enable data collection, the Knowledge Script returns the redo log space wait ratio. By default, data is not collected.
Collect data for Redo Log not archived?
Select the Yes check box to collect data for charts and reports. When you enable data collection, the Knowledge Script returns the number of redo logs not archived. By default, data is not collected.
Description How to Set It
Chapter 3 • OracleUNIX Knowledge Scripts 99

RedoLogContentionUse this Knowledge Script to monitor the number of times that a process tries to write an entry in the redo log buffer for a scheduled interval of time. The job raises an event and than stores data if the number of tries is different for subsequent iterations of the script.
The number of retries should be low. A high number of retries can adversely affect system performance, as processes must wait for buffers. If a process has to make numerous attempts to write an entry in the redo log buffer, you may need to allocate more space to the redo log buffer.
You can set a threshold value for the maximum number of times a process can try to write an entry in the redo log buffer. If the number of retries exceeds the threshold, the job raises an event.
The account you use to run this script must have SELECT permissions for the following tables:
V_$SGASTATV_$SYSSTATV_$VERSION
Resource Objects
Oracle Database folders. When you drop a script on an Oracle Database folder, a job executes on that database and monitors only that database.
Default Schedule
The default interval for this script is Every 10 minutes.
100 AppManager for Oracle RDBMS on UNIX or Linux Servers

Setting Parameter Values
Set the following parameters as needed:
Description How to Set It
Oracle Username Enter the username that this script needs to access the target databases. If you run this script on more than one database, configure each database with the same username.Note To use SYSDBA authentication, leave this parameter blank.The default value is blank.
Collect data for redo log write attempts?
Set to y to collect data for charts and reports. When you enable data collection, the Knowledge Script returns the number of times that processes attempted to write entries to the redo log buffer. By default, data is not collected.
Raise event if threshold is exceeded?
Select the Yes check box to raise an event if the number of times that a process tries to rewrite an entry to the redo log buffer exceeds the threshold you set. By default, the job raises events.
Threshold -- Maximum number of redo log buffer allocation retries
Enter a threshold for the maximum number of times that a process may try to rewrite an entry to the redo log buffer before the job raises an event. The default value is 50 retries.
Severity Set the event severity level, from 1 to 40, to indicate the importance of the event. The default value is 5 (red event indicator).
Chapter 3 • OracleUNIX Knowledge Scripts 101

RedoLogsNotArchivedUse this Knowledge Script to retrieve the number of redo logs that are not being archived, if archiving is turned on for a given Oracle database. The number of redo logs not archived is returned and compared against the thresholds you specify. The Knowledge Script retrieves the archive status for an Oracle database from the AppManager repository, which is updated during discovery. To enable archiving, you must rediscover the Oracle UNIX resources if the redo log archive is enabled after you discover resources.
When you enable data collection, the number of redo logs not archived is stored in the repository. You can set multiple thresholds for the number of redo logs not archived, with varying severities, and the job raises an event when any of these thresholds exceed the values you specified.
The account you use to run this script must have SELECT permissions for the following tables:
V_$LOGV_$VERSION
Resource Objects
Oracle Database folders. When you drop a script on an Oracle Database folder, a job executes on that database and checks for ARCHIVING log mode before proceeding to monitor that database. The job then collects the number of redo logs that have not been archived. This data is collected and stored in the repository if you have enabled data collection.
Default Schedule
The default interval for this script is Every 10 minutes.
102 AppManager for Oracle RDBMS on UNIX or Linux Servers
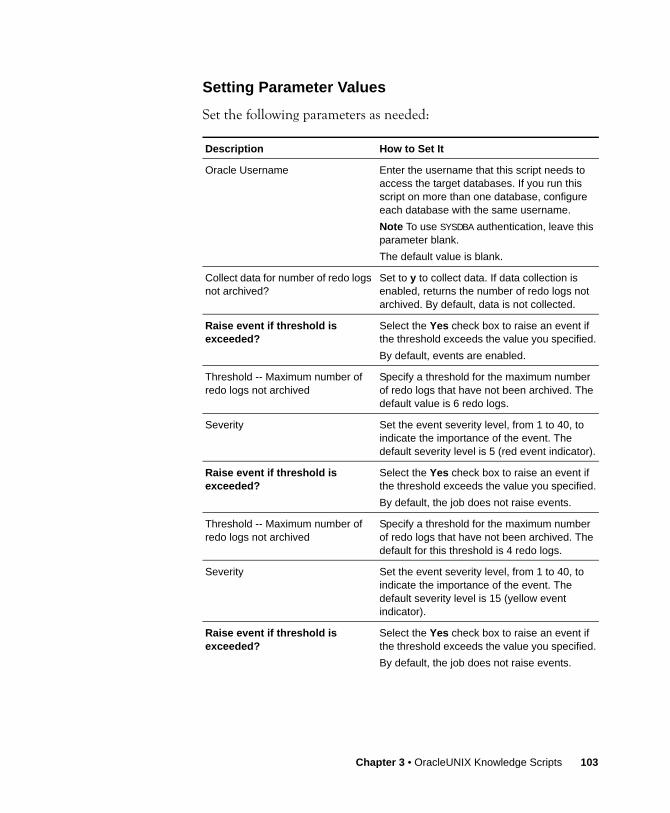
Setting Parameter Values
Set the following parameters as needed:
Description How to Set It
Oracle Username Enter the username that this script needs to access the target databases. If you run this script on more than one database, configure each database with the same username.Note To use SYSDBA authentication, leave this parameter blank.The default value is blank.
Collect data for number of redo logs not archived?
Set to y to collect data. If data collection is enabled, returns the number of redo logs not archived. By default, data is not collected.
Raise event if threshold is exceeded?
Select the Yes check box to raise an event if the threshold exceeds the value you specified.By default, events are enabled.
Threshold -- Maximum number of redo logs not archived
Specify a threshold for the maximum number of redo logs that have not been archived. The default value is 6 redo logs.
Severity Set the event severity level, from 1 to 40, to indicate the importance of the event. The default severity level is 5 (red event indicator).
Raise event if threshold is exceeded?
Select the Yes check box to raise an event if the threshold exceeds the value you specified.By default, the job does not raise events.
Threshold -- Maximum number of redo logs not archived
Specify a threshold for the maximum number of redo logs that have not been archived. The default for this threshold is 4 redo logs.
Severity Set the event severity level, from 1 to 40, to indicate the importance of the event. The default severity level is 15 (yellow event indicator).
Raise event if threshold is exceeded?
Select the Yes check box to raise an event if the threshold exceeds the value you specified.By default, the job does not raise events.
Chapter 3 • OracleUNIX Knowledge Scripts 103

Threshold -- Maximum number of redo logs not archived
Specify a threshold for the maximum number of redo logs that have not been archived. The default for this threshold is 2 redo logs.
Severity Set the event severity level, from 1 to 40, to indicate the importance of the event. The default severity level is 25 (blue event indicator).
Raise event if threshold is exceeded?
Select the Yes check box to raise an event if the threshold exceeds the value you specified.By default, the job does not raise events.
Threshold -- Maximum number of redo logs not archived
Specify a threshold for the maximum number of redo logs that have not been archived. The default for this threshold is 1 redo log.
Severity Set the event severity level, from 1 to 40, to indicate the importance of the event. The default severity level is 35 (magenta event indicator).
Description How to Set It
104 AppManager for Oracle RDBMS on UNIX or Linux Servers

RedoLogSpaceWaitRatioUse this Knowledge Script to monitor the redo log space wait ratio. The redo log space wait ratio measures memory allocation. The ratio reflects the number of times the background process was requested to allocate space within the redo file per number of redo log entries. If this ratio increases, you may want to increase the size of the redo log buffer.
When the redo log space wait ratio exceeds the threshold you set, the job raises an event.
The account you use to run this script must have SELECT permissions for the following tables:
V_$SYSSTATV_$VERSION
Resource Objects
Oracle Database folders. When you drop a script on an Oracle Database folder, a job executes on that database and monitors only that database.
Default Schedule
The default interval for this script is Every 10 minutes.
Chapter 3 • OracleUNIX Knowledge Scripts 105

Setting Parameter Values
Set the following parameters as needed:
Description How to Set It
Oracle Username Enter the username that this script needs to access the target databases. If you run this script on more than one database, configure each database with the same username.Note To use SYSDBA authentication, leave this parameter blank.The default value is blank.
Collect data for redo log space wait ratio?
Set to y to collect data for charts and reports. When you enable data collection, the Knowledge Script returns the redo log space wait ratio. By default, data is not collected.
Raise event if threshold is exceeded?
Select the Yes check box to raise an event if the redo log space wait ratio exceeds the threshold you set. By default, the job raises events.
Threshold -- Maximum redo log space wait ratio
Enter a maximum threshold for the redo log space wait ratio. The default ratio is 0.0002.
Severity Set the event severity level, from 1 to 40, to indicate the importance of the event. The default value is 10 (red event indicator).
106 AppManager for Oracle RDBMS on UNIX or Linux Servers

RollbackSegmentContentionUse this Knowledge Script to monitor rollback segment contention for a database. In the Oracle environment, the rollback segment is a temporary location where changes are stored until the user makes the changes permanent. This script compares the number of requests waiting to access data from the rollback segment to the total number of requests for data during the monitoring interval.
You can specify the maximum percentage of requests allowed to wait for data from the rollback segment. If the percentage of waiting requests exceeds the threshold you set, the job raises an event. Such an event probably indicates that too many processes are waiting to access the rollback segment, in which case, you may need to create additional rollback segments.
The account you use to run this script must have SELECT permissions for the following tables:
V_$SYSSTATV_$VERSIONV_$WAITSTAT
Resource Objects
Oracle Database folders. When you drop a script on an Oracle Database folder, a job executes on that database and monitors only that database.
Default Schedule
The default interval for this script is Every 10 minutes.
Chapter 3 • OracleUNIX Knowledge Scripts 107

Setting Parameter Values
Set the following parameters as needed:
Description How to Set It
Oracle Username Enter the username that this script needs to access the target databases. If you run this script on more than one database, configure each database with the same username.Note To use SYSDBA authentication, leave this parameter blank.The default value is blank.
Collect data for rollback segment contention?
Set to y to collect data for charts and reports. When you enable data collection, the Knowledge Script returns the percentage of requests waiting to access the rollback segment. By default, data is not collected.
Raise event if threshold is exceeded?
Select the Yes check box to raise an event if the percentage of total requests that are waiting to access the rollback segment exceeds the threshold you set. By default, the job raises events.
Threshold -- Maximum percentage of requests waiting for access
Enter the maximum percentage of total requests that can be waiting to access data from the rollback segment before the job raises an event.The default value is 1%.
Severity Set the event severity level, from 1 to 40, to indicate the importance of the event. The default value is 10 (red event indicator).
108 AppManager for Oracle RDBMS on UNIX or Linux Servers

RowSourceRatioUse this Knowledge Script to monitor the row source ratio for an Oracle Database. This ratio measures the percentage of rows retrieved using full table scans. Because a full table scan is less efficient than retrieval by row ID, this ratio gives you an indication of potential database performance problems. If you see an increase in this ratio, you may want to review other statistics to find the source of the problem. When this ratio exceeds the threshold, the job raises an event.
The account you use to run this script must have SELECT permissions for the following tables:
V_$SYSSTATV_$VERSION
Resource Objects
Oracle Database folders. When you drop a script on an Oracle Database folder, a job executes on that database and monitors only that database.
Default Schedule
The default interval for this script is Every hour.
Chapter 3 • OracleUNIX Knowledge Scripts 109

Setting Parameter Values
Set the following parameters as needed:
Description How to Set It
Oracle Username Enter the username that this script needs to access the target databases. If you run this script on more than one database, configure each database with the same username.Note To use SYSDBA authentication, leave this parameter blank.The default value is blank.
Collect data for row source ratio?
Set to y to collect data for use in graphs and reports. When you enable data collection, the script returns the percentage of rows retrieved using a full table scan. By default, data is not collected.
Raise event if threshold is exceeded?
Select the Yes check box to raise an event if the percentage of rows retrieved using a full table scan exceeds the threshold you set. By default, the job raises events.
Threshold -- Maximum row source ratio
Enter a maximum threshold for the row source ratio.The default ratio is .25.
Severity Set the event severity level, from 1 to 40, to indicate the importance of the event. The default value is 5 (red event indicator).
110 AppManager for Oracle RDBMS on UNIX or Linux Servers

RunSqlUse this Knowledge Script to run a SQL statement. The statement can be entered directly in the script or loaded from a file. You specify the column to monitor, by number or name, and whether to monitor the value found in the column or the value’s rate of change (changes per second). You can also specify a string that the script can search for in the retrieved rows.
This script is designed to execute simple SQL statements, for example, a statement that returns the size of a table or the number of columns in a table. There is a limit of 10000 characters for the entire statement when it is contained in a file, and a limit of 1000 characters when the statement is entered via the SQL statement parameter. Regardless of the source of the SQL statement, there is a limit of 100 columns retrieved by a SELECT statement, and a limit of 8 KB for the size of each row retrieved.
This script supports SQL statements using the number, character, date, and raw data types. However, only a column returning numeric data can be selected to monitor.
The account you use to run this script must have SELECT permissions for V_$VERSION and any table the script is run against.
Resource Objects
Oracle Database folders. When you drop a script on an Oracle Database folder, a job executes on that database and monitors only that database.
Default Schedule
The default interval for this script is Every 10 minutes.
Chapter 3 • OracleUNIX Knowledge Scripts 111
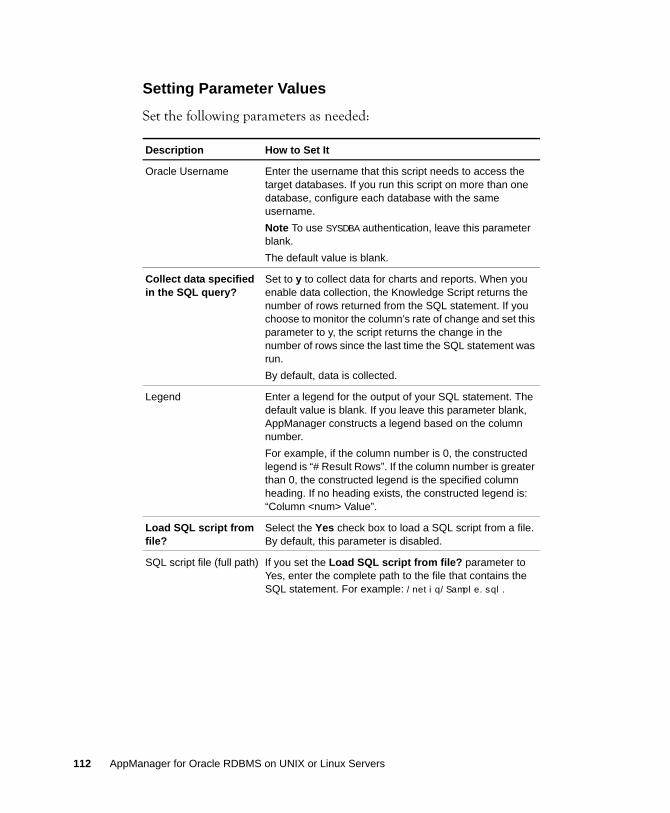
Setting Parameter Values
Set the following parameters as needed:
Description How to Set It
Oracle Username Enter the username that this script needs to access the target databases. If you run this script on more than one database, configure each database with the same username.Note To use SYSDBA authentication, leave this parameter blank.The default value is blank.
Collect data specified in the SQL query?
Set to y to collect data for charts and reports. When you enable data collection, the Knowledge Script returns the number of rows returned from the SQL statement. If you choose to monitor the column’s rate of change and set this parameter to y, the script returns the change in the number of rows since the last time the SQL statement was run.By default, data is collected.
Legend Enter a legend for the output of your SQL statement. The default value is blank. If you leave this parameter blank, AppManager constructs a legend based on the column number. For example, if the column number is 0, the constructed legend is “# Result Rows”. If the column number is greater than 0, the constructed legend is the specified column heading. If no heading exists, the constructed legend is: “Column <num> Value”.
Load SQL script from file?
Select the Yes check box to load a SQL script from a file. By default, this parameter is disabled.
SQL script file (full path) If you set the Load SQL script from file? parameter to Yes, enter the complete path to the file that contains the SQL statement. For example: /netiq/Sample.sql.
112 AppManager for Oracle RDBMS on UNIX or Linux Servers

SQL statement If you set the Load SQL script from file? parameter to no, enter the SQL statement to be executed. The default statement selects all processes from the V_$PROCESS table: SELECT * FROM V_$PROCESSTip Unless you are entering very simple queries, you may find typing a SQL statement into this field is error-prone. To avoid errors, use the Load SQL script from file? parameter. Or, if you have an AppManager Developer’s license, you can check this script out of the repository, use the Knowledge Script Editor to paste the desired SQL statement into the SQL statement parameter, then check in the modified script.
Select column by number, or name?
Set to Number or Name:• Number--to select the column by number • Name--to select the column by name.
Column number to retrieve
If you set the Select column by number or name? parameter to Number, enter the column number to use as the primary output value. The column you specify must contain numeric data. Entering 0 returns the number of rows returned from the SQL statement. Any other positive value returns the value for the specified column’s first row of data. If the specified column is not a numeric field, the job raises an event.The default value is 1.
Column name to retrieve
If you set the Select column by number or name? parameter to Name, enter the column name to use as the primary output value. The column you specify must contain numeric data. The value for the specified column’s first row of data is returned. If the specified column is not a numeric field, the job raises an event..The default value is blank.
Number of rows to display
Enter the number of rows you want displayed in the Event Properties dialog box. The default value is 5 rows.Note: You can enter 0 to indicate no limit (keep all output rows). Currently, however, the message in the Event Properties dialog box is limited to 32K characters.
Monitor the column’s value or rate of change?
Set to Value to monitor the column’s value. Set to Change to monitor the column’s rate of change (per second).The default value is Value.
Description How to Set It
Chapter 3 • OracleUNIX Knowledge Scripts 113

Raise event when threshold is exceeded or not met?
Select the Yes check box to raise an event when a threshold is crossed. By default, the job does not raise events.
Condition: <, =, or > Indicate the condition (less than, equal to, or greater than) you want to check for. This parameter is used in conjunction with the Threshold -- Value or rate of change parameter to control when the job raises events. The default value is > , indicating that the job raises an event if the value retrieved exceeds (is greater than) the value specified in the threshold.
Threshold -- Value or rate of change
Enter a threshold for the value or rate you are monitoring. Depending on how you set the Monitor the column’s value or rate of change? parameter, this may indicate a threshold for the statistic’s value or for the number of times the value changes per second. The value you set here is used in conjunction with the Condition: <, =, or > parameter to control when the job raises events. The default value is 1,000.
Severity Set the event severity level, from 1 to 40, to indicate the importance of the event. The default value is 5 (red event indicator).
Raise event for string found in row results?
Select the Yes check box to raise an event if the string you specify below you can find in the row results. By default, the job does not raise events.
String(s) to find in results (separate multiple strings with semicolons)
Enter a string (text) to search for in row results. If you enter multiple strings, separate them with semicolons (;) and no spaces.The default value is blank.
Severity Set the event severity level, from 1 to 40, to indicate the importance of the event. The default value is 15 (yellow event indicator).
Description How to Set It
114 AppManager for Oracle RDBMS on UNIX or Linux Servers

ScheduledJobsUse this Knowledge Script to monitor the scheduled job status in the New Oracle Scheduler. When the scheduled job fails, the job raises an event.
The account you use to run this script must have SELECT permissions for the following tables:
dba_jobs
dba_scheduler_jobs
(use the New Oracle Scheduler with Oracle RDBMS 10g Release 1 and later.)
Resource Objects
Oracle Database folders. When you drop a script on an Oracle Database folder, a job executes on that database and monitors only that database.
Default Schedule
The default interval for this script is Every 10 minutes.
Setting Parameter Values
Set the following parameters as needed:
Description How to Set It
Oracle Username Enter the username that this script needs to access the target databases. If you run this script on more than one database, configure each database with the same username.Note To use SYSDBA authentication, leave this parameter blank.The default value is blank.
Collect data for Oracle Scheduled Jobs?
Set to y to collect data for Oracle scheduled jobs. When there are no failed jobs, the data value is 0.By default, data is not collected.
Chapter 3 • OracleUNIX Knowledge Scripts 115

Include Jobs Scheduled with New Oracle Scheduler?
Select the Yes check box to include jobs scheduled with the New Oracle Scheduler.Note: You can use the New Oracle Scheduler with Oracle RDBMS 10g Release 1 and later. By default, this parameter is disabled.
Raise event if Jobs Failed?
Select the Yes check box to raise an event when the scheduled jobs fail. By default, events are enabled.
Severity Set the event severity level, from 1 to 40, to indicate the importance of the event. The default value is 5 (red event indicator).
Description How to Set It
116 AppManager for Oracle RDBMS on UNIX or Linux Servers

SegmentExtentAvailUse this Knowledge Script to monitor either the percentage or number of extents (extensions of free space) available to each segment in a tablespace. Use the Minimum percentage of extents available per segment or Minimum number of extents available per segment parameter to define how many available extents a monitored segment should have.
You can then set multiple threshold values for the minimum number or percentage of extents that should be available for each segment. For example, you may want each segment to have at least 1,400 or 70% of extents available. You can set thresholds for the maximum number of segments that can fall below this value before the job raises an event.
In the above example, if you specify that 70% of extents should be available for each segment, and that 4 segments should be the maximum number allowed to have less than 70% of their extents available, then if 4 segments are found to have less than 70% of their extents available, the job raises an event.
Note The job raises an event only when both conditions are met. In the example described above, this script would not raise an event until 4 segments were found that had less than 70% of their extents available.
The account you use to run this script must have SELECT permissions for the following tables:
DBA_SEGMENTSV_$VERSION
Resource Objects
Oracle Database folders. When you drop a script on an Oracle Database folder, a job executes on that database and monitors only that database.
Chapter 3 • OracleUNIX Knowledge Scripts 117

Default Schedule
The default interval for this script is Every hour.
Setting Parameter Values
Set the following parameters as needed:
Description How to Set It
Oracle Username Enter the username that this script needs to access the target databases. If you run this script on more than one database, configure each database with the same username.Note To use SYSDBA authentication, leave this parameter blank.The default value is blank.
Collect data for number of segments with too few available extents?
Set to y to collect data for charts and reports. When you enable data collection, the Knowledge Script returns the number of segments with less than the specified percentage or number of extents available. By default, data is not collected.
Units for available extents per segment
Set to Percentage to monitor the percentage of available extents per segment. Set to Number to monitor the number of available extents per segment. The default value is Percentage.
Minimum percentage of extents available per segment
Enter the minimum percentage of extents that should be available for each segment in a tablespace. This parameter is used when you have selected “Percentage” for the Units for available extents per segment parameter (see above).The default value is 80%.
Minimum number of extents available per segment
Enter the minimum number of extents that should be available for each segment in a tablespace.This parameter is used when you have selected “Number” for the Units for available extents per segment parameter (see above).The default value is 10 extents.
118 AppManager for Oracle RDBMS on UNIX or Linux Servers

Raise event if threshold is exceeded?
Select the Yes check box to raise an event when the number of extents that fail to meet the minimum value you set for available extents within a tablespace exceeds the maximum threshold (see below). By default, events are enabled.
Threshold -- Maximum number of segments with too few extents available
Enter a threshold for the maximum number of segments whose number or percentage of available extents failed to meet the minimum requirement specified above. If the number of segments not meeting this requirement exceeds this threshold, the job raises an event. The default value is 0 segments.
Severity Set the event severity level, from 1 to 40, to indicate the importance of the event. The default severity level is 35 (magenta event indicator).
Raise event if threshold is exceeded?
Select the Yes check box to raise an event when the number of extents that fail to meet the minimum value you set for available extents within a tablespace exceeds the maximum threshold (see below). By default, the job does not raise events.
Threshold -- Maximum number of segments with too few extents available
Enter a threshold for the maximum number of segments whose number or percentage of available extents failed to meet the minimum requirement specified above. If the number of segments not meeting this requirement exceeds this threshold, the job raises an event. The default value is 5 segments.
Severity Set the event severity level, from 1 to 40, to indicate the importance of the event. The default severity level is 25 (blue event indicator).
Raise event if threshold is exceeded?
Select the Yes check box to raise an event when the number of extents that fail to meet the minimum value you set for available extents within a tablespace exceeds the maximum threshold (see below). By default, the job does not raise events.
Threshold -- Maximum number of segments with too few extents available
Enter a threshold for the maximum number of segments whose number or percentage of available extents failed to meet the minimum requirement specified above. If the number of segments not meeting this requirement exceeds this threshold, the job raises an event. The default value is 10 segments.
Description How to Set It
Chapter 3 • OracleUNIX Knowledge Scripts 119

Severity Set the event severity level, from 1 to 40, to indicate the importance of the event. The default severity level is 15 (yellow event indicator).
Raise event if threshold is exceeded?
Select the Yes check box to raise an event when the number of extents that fail to meet the minimum value you set for available extents within a tablespace exceeds the maximum threshold (see below). By default, the job does not raise events.
Threshold -- Number of segments with too few extents available
Enter a threshold for the maximum number of segments whose number or percentage of available extents failed to meet the minimum requirement specified above. If the number of segments not meeting this requirement exceeds this threshold, the job raises an event. The default value is 50 segments.
Severity Set the event severity level, from 1 to 40, to indicate the importance of the event. The default severity level is 5 (red event indicator).
Description How to Set It
120 AppManager for Oracle RDBMS on UNIX or Linux Servers
SetMonitoringOptionsUse this Knowledge Script to set the various monitoring options available with AppManager for Oracle UNIX/Linux. You can set the location where files reside whose filenames contain the names of databases to be “blacked out” (not monitored) while they are down due to scheduled activities such as maintenance. Enter a full path to a directory containing filenames whose names indicate which databases to exclude from OracleUNIX jobs.
To reset this script, you can enable one or more parameters but leave their values blank and then run the job. For example, if you enable the Set option for blackout monitoring? parameter but leave the next parameter, Full path to directory with database names to exclude, blank, the next time you run the job, you overwrite the previous value with a blank value. This is the recommended way to reset the blackout monitoring option or any of the clustering options.
This script also lets you specify whether to monitor tablespaces with temporary contents, and/or those with autoextensible datafiles.
Note Use this script to specify monitoring options for running jobs in a clustered environment. AppManager for Oracle UNIX/Linux supports monitoring both RAC and non-RAC clustered environments. For details, see “Monitoring in a Clustered Environment” on page 2.
Resource Objects
Oracle Database folders. When you drop a script on an Oracle Database folder, a job executes on that database and monitors only that database.
Default Schedule
The default interval for this script is Run once.
Chapter 3 • OracleUNIX Knowledge Scripts 121

Setting Parameter Values
Set the following parameters as needed:
Description How to Set It
Set option for blackout monitoring?
Select the Yes check box if you should set blackout location upon executing this job iteration. By default, this parameter is disabled.
Full path to directory with database names to exclude
Specify the directory where files reside whose filenames include database names for databases that should not be monitored (databases to “black out”). The default value is blank (no databases blacked out).
Set option for monitoring temporary tablespaces?
Select the Yes check box if you should set the option for monitoring tablespaces with temporary contents upon executing this job iteration. By default, this option is not set.
Monitor temporary tablespaces? Select the Yes check box to monitor those tablespaces with temporary contents. Clear the box to skip monitoring such tablespaces. By default, monitoring is performed.
Set option for monitoring autoextensible tablespaces?
Select the Yes check box if you should set the option for monitoring tablespaces with autoextensible datafiles upon executing this job iteration. By default, this option is not set.
Monitor tablespaces with autoextensible datafiles?
Select the Yes check box to monitor those tablespaces with datafiles that autoextend. Clear the box to skip monitoring such tablespaces.By default, monitoring is performed.
Set option for monitoring Oracle RAC?
Select the Yes check box if you should set the option for monitoring computers running Oracle RAC upon executing this job iteration. By default, this option is not set.
Service name for the RAC cluster Enter the service name identifying the Oracle RAC environment upon which the job will run. This allows the Oracle UNIX/Linux managed object to connect to Oracle on the host and determine which nodes are active. The parameter is blank by default.
122 AppManager for Oracle RDBMS on UNIX or Linux Servers

Directory containing tnsnames.ora file (if not in default location)
Enter the path to the folder containing the tnsnames.ora file. This is normally what the $TNS_ADMIN environment variable is set to for Oracle to resolve service names. The default location is normally: $ORACLE_HOME/network admin. This parameter is blank by default.Note The default location is used if a directory is not specified here.
Set option for monitoring non-RAC cluster?
Select the Yes check box if you should set the option for monitoring computers running as part of a cluster where Oracle RAC is not installed upon executing this job. By default, this option is not set.
Path to a required available resource
Enter the path to a resource (file, directory, device, etc.) that must be available to the computer running the Oracle UNIX/Linux managed object in order for jobs to execute successfully. This can be a resource that a node in a cluster requires in order for that node to have access to Oracle. This parameter is blank by default.
Raise event if unable to set monitoring options?
Select the Yes check box to raise an event when the monitoring options could not be set. By default, events are enabled.
Severity Set the event severity level, from 1 to 40, to indicate the importance of the event for successfully setting the monitoring options. The default severity level is 15 (yellow event indicator).
Raise event to display options currently set?
Select the Yes check box to raise an event providing a summary of the current settings for monitoring options. By default, the job does not raise events.
Severity Set the event severity level, from 1 to 40, to indicate the importance of the event for successfully setting the monitoring options. The default severity level is 40 (magenta event indicator).
Description How to Set It
Chapter 3 • OracleUNIX Knowledge Scripts 123
SortOverflowRatioUse this Knowledge Script to monitor the sort overflow ratio. This ratio compares the number of sorts that are using temporary segments to the total number of sorts. If the sort overflow ratio exceeds the threshold you set, the job raises an event.
An increase in the sort overflow ratio indicates that more sort operations are allocating work space on disk. If an excessive number of sorts are allocating work space on disk, you may want to increase the sort area size.
The account you use to run this script must have SELECT permissions for the following tables:
V_$SYSSTATV_$VERSION
Resource Objects
Oracle Database folders. When you drop a script on an Oracle Database folder, a job executes on that database and monitors only that database.
Default Schedule
The default interval for this script is Every 10 minutes.
124 AppManager for Oracle RDBMS on UNIX or Linux Servers

Setting Parameter Values
Set the following parameters as needed:
Description How to Set It
Oracle Username Enter the username that this script needs to access the target databases. If you run this script on more than one database, configure each database with the same username.Note To use SYSDBA authentication, leave this parameter blank.The default value is blank.
Collect data for sort overflow ratio?
Set to y to collect data for charts and reports. When you enable data collection, the script returns the ratio of the number of sorts using temporary segments versus the number that do not. For example, a ratio of .75 indicates that 3 out of 4 sorts are using temporary segments.By default, data is not collected.
Raise event if threshold is exceeded?
Select the Yes check box to raise an event if the sort overflow ratio exceeds the threshold you set. By default, the job raises events.
Threshold -- Maximum sort overflow ratio
Enter a threshold for the maximum sort overflow ratio allowed before the job raises an event. The default ratio is .75.
Severity Set the event severity level, from 1 to 40, to indicate the importance of the event. The default value is 10 (red event indicator).
Chapter 3 • OracleUNIX Knowledge Scripts 125

SysStatUse this Knowledge Script to monitor statistics from a database’s V_$SYSSTAT table. This table stores all the key statistics for a database. You specify the statistic to monitor, and the value and condition (greater than, less than, or equal to) to check. If the value or change rate (changes per second) of a monitored statistic crosses a threshold, the job raises an event.
The account you use to run this script must have SELECT permissions for the following tables:
V_$SYSSTATV_$VERSION
Resource Objects
Oracle Database folders. When you drop a script on an Oracle Database folder, a job executes on that database and monitors only that database.
Default Schedule
The default interval for this script is Every 10 minutes.
126 AppManager for Oracle RDBMS on UNIX or Linux Servers

Setting Parameter Values
Set the following parameters as needed:
Description How to Set It
Oracle Username Enter the username that this script needs to access the target databases. If you run this script on more than one database, configure each database with the same username.Note To use SYSDBA authentication, leave this parameter blank.The default value is blank.
Collect data for a V_$SYSSTAT statistic?
Set to y to collect data for charts and reports. When you enable data collection, the Knowledge Script returns the current value of the specified statistic at each interval. By default, data is not collected.
V_$SYSSTAT statistic to monitor
Enter the name of the statistic you want to monitor--for example, USER CALLS. For information about the fields in the V_$SYSSTAT table, see your Oracle Database documentation (for example, in the Oracle8 Reference, see “Appendix C: Statistics Descriptions”). The default statistic is EXECUTE COUNT.
Monitor change rate, or value of statistic?
When you select Change rate, the script monitors the number of times the value of the monitored statistic changes per second. When you select Value, the script monitors the value of the statistic. The default value is Change rate.
Raise event if threshold is exceeded?
Select the Yes check box to raise an event if the threshold you set is crossed. By default, the job raises events.
Condition: <, =, or > Indicate the condition (less than, equal to, or greater than) you want to check. This parameter is used in conjunction with the Threshold -- Change rate or value parameter to control when the job raises an event. The default value is > (greater than).
Chapter 3 • OracleUNIX Knowledge Scripts 127
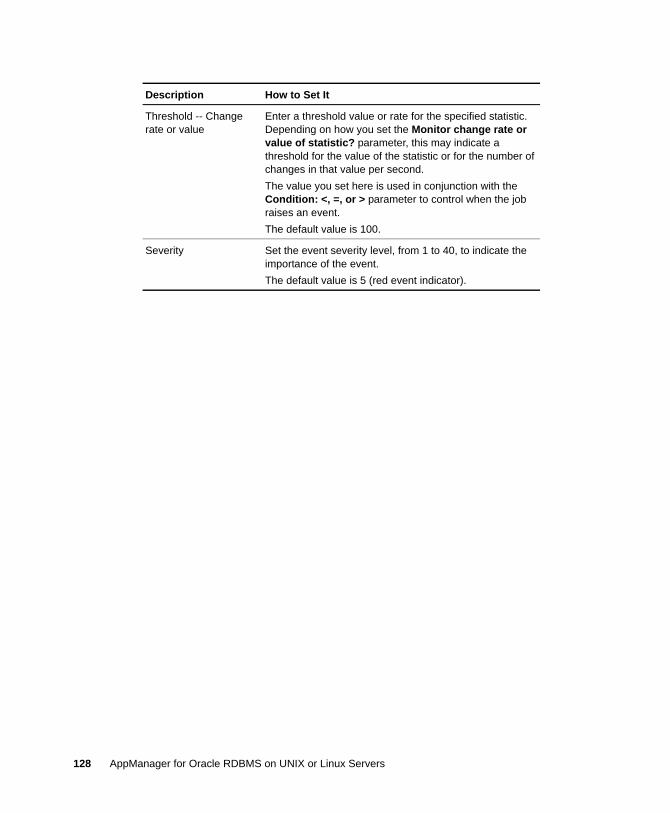
Threshold -- Change rate or value
Enter a threshold value or rate for the specified statistic. Depending on how you set the Monitor change rate or value of statistic? parameter, this may indicate a threshold for the value of the statistic or for the number of changes in that value per second. The value you set here is used in conjunction with the Condition: <, =, or > parameter to control when the job raises an event. The default value is 100.
Severity Set the event severity level, from 1 to 40, to indicate the importance of the event. The default value is 5 (red event indicator).
Description How to Set It
128 AppManager for Oracle RDBMS on UNIX or Linux Servers

TablespaceAvailUse this Knowledge Script to monitor the disk space used by Oracle tablespaces.
This script can monitor the following:
• The amount of free disk space available for a tablespace (as a percentage, absolute amount, or both)
• The amount of disk space used by a tablespace (as a percentage, absolute amount, or both)
• The size of a tablespace
This script monitors only the disk space allocated to an Oracle database, not the total disk space on the computer where Oracle is running.
By default, this script is set to monitor the percentage of free disk space available to a tablespace and the percentage of disk space used by a tablespace. You can choose any combination of monitoring options and set multiple thresholds for each one.
The account you use to run this script must have SELECT permissions for the following tables:
DBA_DATA_FILESDBA_FREE_SPACEDBA_TABLESPACESDBA_TEMP_FILESV_$SORT_SEGMENTV_$VERSION
Resource Objects
Individual Oracle Database UNIX Tablespace icons. When run on an individual tablespace, the Knowledge Script job monitors only that tablespace.
Default Schedule
The default interval for this script is Every hour.
Chapter 3 • OracleUNIX Knowledge Scripts 129

Setting Parameter Values
Set the following parameters as needed:
Description How to Set It
Oracle Username Enter the username that this script needs to access the target databases. If you run this script on more than one database, configure each database with the same username.Note To use SYSDBA authentication, leave this parameter blank.The default value is blank.
Collect data for amount of disk space used and free, and total tablespace size?
Set to y to collect data for charts and reports. When you enable data collection, and if monitoring of each metric is enabled, the Knowledge Script returns the following statistics for each tablespace on which the script is running:• percentage of disk space free within the tablespace• percentage of disk space used within the tablespace• amount of disk space free within the tablespace• amount of disk space used within the tablespace• total size of tablespaceBy default, data is not collected.
130 AppManager for Oracle RDBMS on UNIX or Linux Servers

Absolute path of the file containing comma separated information related to tablespaces to be excluded
Enter the absolute path of the file containing information related to tablespaces that you want to exclude from raising events. Specifiy the required values in the following token entries:• 1 - name of the tablespace. • 2 - the threshold value for percentage of free space
within the tablespace from which you can raise events.• 3 - the threshold value for percentage of used space
within the tablespace from which you can raise events.• 4 - the threshold value for amount of free space within
the tablespace from which you can raise events.• 5 - the threshold value for amount of used space within
the tablespace from which you can raise events.• 6 - the threshold value for total size of the tablespace
from which you can raise events.For example: system, 95, 10, 100,,3000Note: If you do not want to specify a threshold value for a particular token, leave it empty as noted in the preceding example.
Monitor percentage of free space within tablespace?
Select the Yes check box to monitor free space as a percentage. Expand this parameter to see threshold and severity parameters. By default, monitoring is enabled.
Raise event if threshold is not met?
Select the Yes check box to raise an event when the percentage of free disk space within a tablespace fails to meet the minimum threshold (see below). By default, events are enabled.
Threshold -- Minimum percentage of free space
Enter a threshold for the minimum percentage of free disk space within the tablespace that must be found to prevent an event from being raised. The default value is 5%.
Severity Set the event severity level, from 1 to 40, to indicate the importance of the event. The default severity level is 5 (red event indicator).
Raise event if threshold is not met?
Select the Yes check box to raise an event when the percentage of free disk space within a tablespace fails to meet the minimum threshold (see below). By default, the job does not raise events.
Description How to Set It
Chapter 3 • OracleUNIX Knowledge Scripts 131

Threshold -- Minimum percentage of free space
Enter a threshold for the minimum percentage of free disk space within the tablespace that must be found to prevent an event from being raised. The default value is 20%.
Severity Set the event severity level, from 1 to 40, to indicate the importance of the event. The default severity level is 15 (yellow event indicator).
Raise event if threshold is not met?
Select the Yes check box to raise an event when the percentage of free disk space within a tablespace fails to meet the minimum threshold (see below). By default, the job does not raise events.
Threshold -- Minimum percentage of free space
Enter a threshold for the minimum percentage of free disk space within the tablespace that must be found to prevent an event from being raised. The default value is 40%.
Severity Set the event severity level, from 1 to 40, to indicate the importance of the event. The default severity level is 25 (blue event indicator).
Raise event if threshold is not met?
Select the Yes check box to raise an event when the percentage of free disk space within a tablespace fails to meet the minimum threshold (see below). By default, the job does not raise events.
Threshold -- Minimum percentage of free space
Enter a threshold for the minimum percentage of free disk space within the tablespace that must be found to prevent an event from being raised. The default value is 60%.
Severity Set the event severity level, from 1 to 40, to indicate the importance of the event. The default severity level is 35 (magenta event indicator).
Monitor percentage of space used within tablespace?
Select the Yes check box to monitor used disk space as a percentage. Expand this parameter to see threshold and severity parameters. By default, monitoring is not performed.
Raise event if threshold is exceeded?
Select the Yes check box to raise an event when the percentage of used disk space within a tablespace exceeds the maximum threshold (see below). By default, the job does not raise events.
Description How to Set It
132 AppManager for Oracle RDBMS on UNIX or Linux Servers

Threshold -- Maximum percentage of space used
Enter a threshold for the maximum percentage of disk space that the tablespace can use. If the percentage of used disk space exceeds this threshold, the job raises an event. The default value is 95%.
Severity Set the event severity level, from 1 to 40, to indicate the importance of the event. The default severity level is 5 (red event indicator).
Raise event if threshold is exceeded?
Select the Yes check box to raise an event when the percentage of used disk space within a tablespace exceeds the maximum threshold (see below). By default, the job does not raise events.
Threshold -- Maximum percentage of space used
Enter a threshold for the maximum percentage of disk space that the tablespace can use. If the percentage of used disk space exceeds this threshold, the job raises an event. The default value is 80%.
Severity Set the event severity level, from 1 to 40, to indicate the importance of the event. The default severity level is 15 (yellow event indicator).
Raise event if threshold is exceeded?
Select the Yes check box to raise an event when the percentage of used disk space within a tablespace exceeds the maximum threshold (see below). By default, the job does not raise events.
Threshold -- Maximum percentage of space used
Enter a threshold for the maximum percentage of disk space that the tablespace can use. If the percentage of used disk space exceeds this threshold, the job raises an event. The default value is 60%.
Severity Set the event severity level, from 1 to 40, to indicate the importance of the event. The default severity level is 25 (blue event indicator).
Raise event if threshold is exceeded?
Select the Yes check box to raise an event when the percentage of used disk space within a tablespace exceeds the maximum threshold (see below). By default, the job does not raise events.
Description How to Set It
Chapter 3 • OracleUNIX Knowledge Scripts 133

Threshold -- Maximum percentage of space used
Enter a threshold for the maximum percentage of disk space that the tablespace can use. If the percentage of used disk space exceeds this threshold, the job raises an event. The default value is 40%.
Severity Set the event severity level, from 1 to 40, to indicate the importance of the event. The default severity level is 35 (magenta event indicator).
Monitor amount of free space within tablespace?
Select the Yes check box to monitor free space as an amount, in MB. Expand this parameter to see threshold and severity parameters. By default, monitoring is not performed.
Raise event if threshold is not met?
Select the Yes check box to raise an event when the percentage of free disk space within a tablespace fails to meet the minimum threshold (see below). By default, the job does not raise events.
Threshold -- Minimum amount of free space
Enter a threshold for the minimum amount of free disk space within the tablespace that must be found to prevent an event from being raised. The default value is 50 MB.
Severity Set the event severity level, from 1 to 40, to indicate the importance of the event. The default severity level is 5 (red event indicator).
Raise event if threshold is not met?
Select the Yes check box to raise an event when the percentage of free disk space within a tablespace fails to meet the minimum threshold (see below). By default, the job does not raise events.
Threshold -- Minimum amount of free space
Enter a threshold for the minimum amount of free disk space within the tablespace that must be found to prevent an event from being raised. The default value is 100 MB.
Severity Set the event severity level, from 1 to 40, to indicate the importance of the event. The default severity level is 15 (yellow event indicator).
Raise event if threshold is not met?
Select the Yes check box to raise an event when the percentage of free disk space within a tablespace fails to meet the minimum threshold (see below). By default, the job does not raise events.
Description How to Set It
134 AppManager for Oracle RDBMS on UNIX or Linux Servers
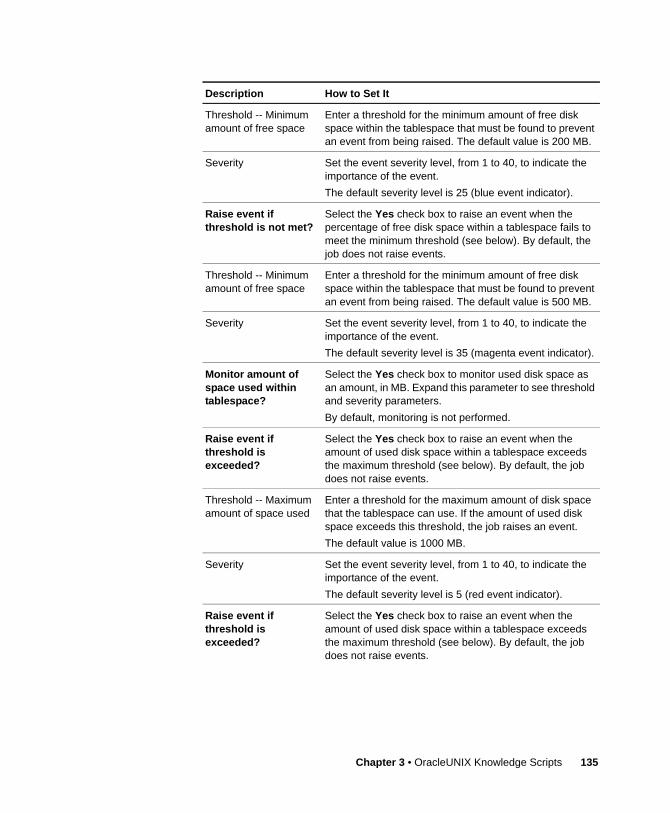
Threshold -- Minimum amount of free space
Enter a threshold for the minimum amount of free disk space within the tablespace that must be found to prevent an event from being raised. The default value is 200 MB.
Severity Set the event severity level, from 1 to 40, to indicate the importance of the event. The default severity level is 25 (blue event indicator).
Raise event if threshold is not met?
Select the Yes check box to raise an event when the percentage of free disk space within a tablespace fails to meet the minimum threshold (see below). By default, the job does not raise events.
Threshold -- Minimum amount of free space
Enter a threshold for the minimum amount of free disk space within the tablespace that must be found to prevent an event from being raised. The default value is 500 MB.
Severity Set the event severity level, from 1 to 40, to indicate the importance of the event. The default severity level is 35 (magenta event indicator).
Monitor amount of space used within tablespace?
Select the Yes check box to monitor used disk space as an amount, in MB. Expand this parameter to see threshold and severity parameters. By default, monitoring is not performed.
Raise event if threshold is exceeded?
Select the Yes check box to raise an event when the amount of used disk space within a tablespace exceeds the maximum threshold (see below). By default, the job does not raise events.
Threshold -- Maximum amount of space used
Enter a threshold for the maximum amount of disk space that the tablespace can use. If the amount of used disk space exceeds this threshold, the job raises an event. The default value is 1000 MB.
Severity Set the event severity level, from 1 to 40, to indicate the importance of the event. The default severity level is 5 (red event indicator).
Raise event if threshold is exceeded?
Select the Yes check box to raise an event when the amount of used disk space within a tablespace exceeds the maximum threshold (see below). By default, the job does not raise events.
Description How to Set It
Chapter 3 • OracleUNIX Knowledge Scripts 135

Threshold -- Maximum amount of space used
Enter a threshold for the maximum amount of disk space that the tablespace can use. If the amount of used disk space exceeds this threshold, the job raises an event. The default value is 400 MB.
Severity Set the event severity level, from 1 to 40, to indicate the importance of the event. The default severity level is 15 (yellow event indicator).
Raise event if threshold is exceeded?
Select the Yes check box to raise an event when the amount of used disk space within a tablespace exceeds the maximum threshold (see below). By default, the job does not raise events.
Threshold -- Maximum amount of space used
Enter a threshold for the maximum amount of disk space that the tablespace can use. If the amount of used disk space exceeds this threshold, the job raises an event. The default value is 200 MB.
Severity Set the event severity level, from 1 to 40, to indicate the importance of the event. The default severity level is 25 (blue event indicator).
Raise event if threshold is exceeded?
Select the Yes check box to raise an event when the amount of used disk space within a tablespace exceeds the maximum threshold (see below). By default, the job does not raise events.
Threshold -- Maximum amount of space used
Enter a threshold for the maximum amount of disk space that the tablespace can use. If the amount of used disk space exceeds this threshold, the job raises an event. The default value is 100 MB.
Severity Set the event severity level, from 1 to 40, to indicate the importance of the event. The default severity level is 35 (magenta event indicator).
Monitor total size of tablespace?
Select the Yes check box to monitor the total size, in MB, of the tablespace. Expand this parameter to see threshold and severity parameters. By default, monitoring is not performed.
Raise event if threshold is exceeded?
Select the Yes check box to raise an event when the total size of the tablespace exceeds the maximum threshold (see below). By default, the job does not raise events.
Description How to Set It
136 AppManager for Oracle RDBMS on UNIX or Linux Servers

Threshold -- Maximum total size of tablespace
Enter a threshold for the maximum size (in MB) that the tablespace can reach. If the size of the tablespace exceeds this threshold, the job raises an event. The default value is 2000 MB.
Severity Set the event severity level, from 1 to 40, to indicate the importance of the event. The default severity level is 5 (red event indicator).
Raise event if threshold is exceeded?
Select the Yes check box to raise an event when the total size of the tablespace exceeds the maximum threshold (see below). By default, the job does not raise events.
Threshold -- Maximum total size of tablespace
Enter a threshold for the maximum size (in MB) that the tablespace can reach. If the size of the tablespace exceeds this threshold, the job raises an event. The default value is 800 MB.
Severity Set the event severity level, from 1 to 40, to indicate the importance of the event. The default severity level is 15 (yellow event indicator).
Raise event if threshold is exceeded?
Select the Yes check box to raise an event when the total size of the tablespace exceeds the maximum threshold (see below). By default, the job does not raise events.
Threshold -- Maximum total size of tablespace
Enter a threshold for the maximum size (in MB) that the tablespace can reach. If the size of the tablespace exceeds this threshold, the job raises an event. The default value is 400 MB.
Severity Set the event severity level, from 1 to 40, to indicate the importance of the event. The default severity level is 25 (blue event indicator).
Raise event if threshold is exceeded?
Select the Yes check box to raise an event when the total size of the tablespace exceeds the maximum threshold (see below). By default, the job does not raise events.
Threshold -- Maximum total size of tablespace
Enter a threshold for the maximum size (in MB) that the tablespace can reach. If the size of the tablespace exceeds this threshold, the job raises an event. The default value is 200 MB.
Severity Set the event severity level, from 1 to 40, to indicate the importance of the event. The default severity level is 35 (magenta event indicator).
Description How to Set It
Chapter 3 • OracleUNIX Knowledge Scripts 137

TopCpuUsersUse this Knowledge Script to monitor the CPU time for current user sessions. If the CPU utilization exceeds the threshold, the job raises an event.
You can specify the number of user sessions with the highest CPU utilization to display in the Event Properties dialog box. The Event Properties dialog box includes the CPU usage for each of the top N sessions, username, session ID, and program name. Enter 0 to display all user sessions.
This script requires that the Oracle timed_statistics parameter be turned on (set to TRUE) for the database you are monitoring.
The account you use to run this script must have SELECT permissions for the following tables:
DBA_USERSV_$SESSIONV_$SESSTATV_$STATNAMEV_$VERSION
Resource Objects
Oracle Database folders. When you drop a script on an Oracle Database folder, a job executes on that database and monitors only that database.
Default Schedule
The default interval for this script is Every 30 minutes.
138 AppManager for Oracle RDBMS on UNIX or Linux Servers

Setting Parameter Values
Set the following parameters as needed:
Description How to Set It
Oracle Username Enter the username that this script needs to access the target databases. If you run this script on more than one database, configure each database with the same username.Note To use SYSDBA authentication, leave this parameter blank.The default value is blank.
Collect data for CPU usage of top N user sessions?
Set to y to collect data for charts and reports. When you enable data collection, the Knowledge Script returns the total CPU time for the top N users. By default, data is not collected.
Number of user sessions to display
Specify the number of user sessions you want displayed in the Event Properties dialog box. Enter 0 if you want information for all user sessions. The default value is 15 user sessions.
Raise event if threshold is exceeded?
Select the Yes check box to raise an event if the CPU usage of any user session exceeds the threshold you set. By default, the job raises events.
Threshold -- Maximum amount of CPU time for a user session
Enter a threshold for the maximum number of CPU cycles per 1/100th of a second that a single user session can use before the job raises an event. The default value is 50 CPU cycles per 1/100th of a second.
Severity Set the event severity level, from 1 to 40, to indicate the importance of the event. The default value is 5 (red event indicator).
Chapter 3 • OracleUNIX Knowledge Scripts 139
TopIOUsersUse this Knowledge Script to monitor physical reads and writes (I/O) for current user sessions. If the number of physical reads/writes per second (the physical read/write operations rate) exceeds the threshold you set, the job raises an event.
You can specify the number of user sessions with the highest physical read/write operations rate to display in the Event Properties dialog box. Information in the Event Properties dialog box includes the physical reads/writes per second for each of the top N sessions, username, session ID, and program name.
This script requires that the Oracle timed_statistics parameter is turned on for the database you are monitoring.
The account you use to run this script must have SELECT permissions for the following tables:
DBA_USERSV_$SESSIONV_$SESSTATV_$STATNAMEV_$VERSION
Resource Objects
Oracle Database folders. When you drop a script on an Oracle Database folder, a job executes on that database and monitors only that database.
Default Schedule
The default interval for this script is Every 30 minutes.
140 AppManager for Oracle RDBMS on UNIX or Linux Servers

Setting Parameter Values
Set the following parameters as needed:
Description How to Set It
Oracle Username Enter the username that this script needs to access the target databases. If you run this script on more than one database, configure each database with the same username.Note To use SYSDBA authentication, leave this parameter blank.The default value is blank.
Collect data for I/O activity of top N user sessions?
Set to y to collect data for charts and reports. When you enable data collection, the Knowledge Script returns the total number of physical reads/writes per second for the top N users. By default, data is not collected.
Raise event if threshold is exceeded?
Select the Yes check box to raise an event if the physical read/write operations of any single user session exceed the threshold you set. By default, the job raises events.
Threshold -- Maximum physical read/write operations for a user session
Enter a threshold for the maximum number of physical reads/writes per second allowed before the job raises an event. The default value is 300 read/write operations.
Number of user sessions to display
Specify the number of top user sessions you want displayed in the Event Properties dialog box. Enter 0 if you want to see information for all user sessions. The default value is 10 user sessions.
Severity Set the event severity level, from 1 to 40, to indicate the importance of the event. The default value is 5 (red event indicator).
Chapter 3 • OracleUNIX Knowledge Scripts 141

TopLockUsersUse this Knowledge Script to monitor the current number of user-held locks on an Oracle database. If the number of locks exceeds the threshold, the job raises an event.
You can specify the number of user sessions holding the most locks to display in the Event Properties dialog box, or enter 0 to display all sessions. Information in the Event Properties dialog box includes the number of locks held by each session, username, session ID, and program name.
The account you use to run this script must have SELECT permissions for the following tables:
DBA_USERSV_$LOCKV_$SESSIONV_$VERSION
Resource Objects
Oracle Database folders. When you drop a script on an Oracle Database folder, a job executes on that database and monitors only that database.
Default Schedule
The default interval for this script is Every 30 minutes.
142 AppManager for Oracle RDBMS on UNIX or Linux Servers

Setting Parameter Values
Set the following parameters as needed:
Description How to Set It
Oracle Username Enter the username that this script needs to access the target databases. If you run this script on more than one database, configure each database with the same username.Note To use SYSDBA authentication, leave this parameter blank. The default value is blank.
Collect data for locks held by top N user sessions?
Set to y to collect data for charts and reports. When you enable data collection, the Knowledge Script returns the current number of user-held locks by the user sessions with the highest number of locks. By default, data is not collected.
Raise event if threshold is exceeded?
Select the Yes check box to raise an event if the number of user-held locks on the server exceeds the threshold you set.By default, the job raises events.
Threshold -- Maximum number of locks held by a user session
Enter a threshold for the maximum number of user-held locks on an Oracle Database. The default value is 35 locks.
Number of user sessions to display
Specify the number of user sessions with the most locks that you want displayed in the Event Properties dialog box. Enter 0 if you want all user sessions displayed. The default value is 10.
Severity Set the event severity level, from 1 to 40, to indicate the importance of the event. The default value is 5 (red event indicator).
Chapter 3 • OracleUNIX Knowledge Scripts 143

TopMemoryUsersUse this Knowledge Script to monitor memory utilization (User Global Area and Program Global Area) for current user sessions. If the memory utilization exceeds the threshold, the job raises an event.
You can specify the number of user sessions with the highest memory usage to display in the Event Properties dialog box. Information in the Event Properties dialog box includes the memory in bytes for each session, username, session ID, and program name. Enter 0 for the Number of top user sessions to display parameter if you want to include memory utilization statistics for all user sessions in the event details.
The account you use to run this script must have SELECT permissions for the following tables:
DBA_USERSV_$SESSIONV_$SESSTATV_$STATNAMEV_$VERSION
Resource Objects
Oracle Database folders. When you drop a script on an Oracle Database folder, a job executes on that database and monitors only that database.
Default Schedule
The default interval for this script is Every 30 minutes.
144 AppManager for Oracle RDBMS on UNIX or Linux Servers

Setting Parameter Values
Set the following parameters as needed:
Description How to Set It
Oracle Username Enter the username that this script needs to access the target databases. If you run this script on more than one database, configure each database with the same username.Note To use SYSDBA authentication, leave this parameter blank.The default value is blank.
Collect data for memory used by top N user sessions?
Set to y to collect data for charts and reports. When you enable data collection, the Knowledge Script returns the total memory usage (in MB) for the top N user sessions. You determine how many sessions are included in this total by setting the Number of top user sessions to display parameter.By default, data is not collected.
Raise event if threshold is exceeded?
Select the Yes check box to raise an event if the total memory usage of any user session exceeds the threshold you set. By default, the job raises events.
Threshold -- Maximum amount of memory for a user session
Enter a threshold for the maximum total memory usage (in MB) for any user session. The default value is 10 MB.
Number of user sessions to display
Specify the number of user sessions with the highest memory utilization that you want displayed in the event detail message. Enter 0 if you want to see information for all user sessions. The default value is 15 user sessions.
Severity Set the event severity level, from 1 to 40, to indicate the importance of the event. The default value is 10 (red event indicator).
Chapter 3 • OracleUNIX Knowledge Scripts 145

TopResourceConsumingSQLUse this Knowledge Script to determine which SQL queries for Oracle database are consuming the most resources on their UNIX hosts. This script identifies the top N queries consuming the most memory, disk I/O, and CPU time. The job raises an event with results of the job, and/or if the job results in a failure to retrieve data.
The account you use to run this script must have SELECT permissions for the following tables:
DBA_USERSV_$SQLAREAV_$VERSION
Resource Objects
Oracle Database folders. When you drop a script on an Oracle Database folder, a job executes on that database and collects the N SQL queries using the most CPU time, disk I/O, and memory.
Default Schedule
The default schedule for this script is Every hour.
146 AppManager for Oracle RDBMS on UNIX or Linux Servers

Setting Parameter Values
Set the following parameters as needed:
Description How to Set It
Oracle Username Enter the username that this script needs to access the target databases. If you run this script on more than one database, configure each database with the same username.Note To use SYSDBA authentication, leave this parameter blank.The default value is blank.
Collect data for top resource-consuming SQL statements?
Set to y to collect data for charts and reports. If data collection is enabled, returns the top N SQL statements consuming the most resources. The parameters below let you choose which resources to monitor. Set a value for N using the Number of SQL statements to retrieve parameter. By default, data is not collected.
Monitor SQL statements consuming the most disk I/O?
Select the Yes check box to monitor SQL statements consuming the most disk I/O. By default, disk I/O is monitored.
Monitor SQL statements consuming the most memory?
Select the Yes check box to monitor SQL statements consuming the most memory. By default, memory usage is monitored.
Monitor SQL statements consuming the most CPU time?
Select the Yes check box to monitor SQL statements consuming the most CPU time. By default, CPU utilization is monitored.Note You cannot use this metric on Oracle databases prior to version 9.0.
Number of SQL statements to retrieve
The number of most executed SQL queries to be retrieved by the job. The default value is 10. The maximum is 30.
Raise event if error occurs during retrieval?
Select the Yes check box to raise an event when an error occurs during job execution. By default, events are enabled.
Chapter 3 • OracleUNIX Knowledge Scripts 147

Severity Set the event severity level, from 1 to 40, to indicate the importance of the event for successfully setting the monitoring options. The default severity level is 10 (red event indicator.
Raise event with results from query?
Select the Yes check box to raise an event with the results of the query. By default, the job does not raise events.
Severity Set the event severity level, from 1 to 40, to indicate the importance of the event for successfully setting the monitoring options. The default severity level is 40 (magenta event indicator).
Description How to Set It
148 AppManager for Oracle RDBMS on UNIX or Linux Servers

TransactionUse this Knowledge Script to monitor the following parameters:
• Active Transactions: retrieve the number of active transactions that are ongoing, and the maximum number of transactions that can be executed concurrently (set as an initialization parameter). This script computes a ratio, expressed as a percentage, of the two numbers. When you enable data collection, the percentage is stored in the repository. You can set multiple thresholds for the maximum ratio, and the job raises an event when any of the thresholds exceeds the value you specified.
• Call Rate: the demand placed on a database instance from all sources. This demand is determined by tracking the number of database calls per second from all applications and processes accessing the database instance. The database calls that are tracked include Parse, Execute, and Fetch statements. These calls are sometimes described as user calls. When the call rate (and thus the workload demand on the server) exceeds the threshold you set, the job raises an event.
• Calls Per Transaction: the demand placed on a database instance by each transaction. This demand is determined by tracking the number of database calls (for example, to parse, execute, and fetch data) per committed transaction. When the number of database requests per transaction exceeds the threshold, the job raises an event.
• Transaction Rate: the transaction rate for an Oracle database. This script tracks the number of transactions per second to provide a basic measurement of application workload. In addition, this script raises an event if the number of transactions per second exceeds the threshold you set.
Changes to your applications or to application usage patterns can affect the transaction rate, but in general, an increase in the transaction rate suggests an increase in overall server load. If you see a decrease in the transaction rate with the same number of
Chapter 3 • OracleUNIX Knowledge Scripts 149

connected users, it may indicate that you need to do some database tuning or investigate the reasons for the changes.
The account you use to run this script must have SELECT permissions for the following tables:
V_$SYSSTATV_$VERSION
V_$PARAMETERV_$TRANSACTION
Resource Objects
Oracle Database folders. When you drop a script on an Oracle Database folder, a job executes on that database and monitors only that database.
Default Schedule
The default interval for this script is Every 10 minutes.
Setting Parameter Values
Set the following parameters as needed:
Description How to Set It
Oracle Username Enter the username that this script needs to access the target databases. If you run this script on more than one database, configure each database with the same username.Note To use SYSDBA authentication, leave this parameter blank.The default value is blank.
Monitoring
Monitor ratio of active transactions?
Set to y to monitor the ratio of active transactions.
Monitor call rate? Set to y to monitor the ratio of call rate.
Monitor calls made per transaction?
Set to y to monitor the calls made per transaction.
150 AppManager for Oracle RDBMS on UNIX or Linux Servers

Monitor transaction rate?
Set to y to monitor the transaction rate.
Event Notification
Event option for the ratio of active transactions to maximum concurrent transactions
Raise event if ratio exceeds threshold?
Select the Yes check box to raise an event if the threshold exceeds the value you specified.By default, the job raises events.
Threshold - ratio of active transactions to max concurrent transactions
Specify a threshold for the maximum ratio of active transactions to maximum concurrent transactions, expressed as a percentage. The default for this threshold is 95%.
Severity Set the event severity level, from 1 to 40, to indicate the importance of the event for successfully setting the monitoring options. The default severity level is 5 (red event indicator).
Raise event if ratio exceeds threshold?
Select the Yes check box to raise an event if the threshold exceeds the value you specified.By default, the job does not raise events.
Threshold - ratio of active transactions to max concurrent transactions
Specify a threshold for the maximum ratio of active transactions to maximum concurrent transactions, expressed as a percentage. The default for this threshold is 80%.
Severity Set the event severity level, from 1 to 40, to indicate the importance of the event for successfully setting the monitoring options. The default severity level is 15 (yellow event indicator).
Raise event if ratio exceeds threshold?
Select the Yes check box to raise an event if the threshold exceeds the value you specified.By default, the job does not raise events.
Threshold - ratio of active transactions to max concurrent transactions
Specify a threshold for the maximum ratio of active transactions to maximum concurrent transactions, expressed as a percentage. The default for this threshold is 60%.
Description How to Set It
Chapter 3 • OracleUNIX Knowledge Scripts 151
Severity Set the event severity level, from 1 to 40, to indicate the importance of the event for successfully setting the monitoring options. The default severity level is 25 (blue event indicator).
Raise event if ratio exceeds threshold?
Select the Yes check box to raise an event if the threshold exceeds the value you specified.By default, the job does not raise events.
Threshold - ratio of active transactions to max concurrent transactions
Specify a threshold for the maximum ratio of active transactions to maximum concurrent transactions, expressed as a percentage. The default value is 40%.
Severity Set the event severity level, from 1 to 40, to indicate the importance of the event for successfully setting the monitoring options. The default severity level is 35 (magenta event indicator).
Event option for call rate
Raise event if threshold is exceeded?
Select the Yes check box to raise an event if the maximum number of calls per second exceeds the threshold. By default, the job raises events.
Threshold -- Maximum call rate
Enter a threshold for the maximum number of calls per second allowed before the job raises an event. The default value is 100 calls per second.
Severity Set the event severity level, from 1 to 40, to indicate the importance of the event. The default value is 5 (red event indicator).
Event option for calls made per transaction
Raise event if threshold is exceeded?
Select the Yes check box to raise an event if the number of calls per transaction exceeds the threshold.By default, the job raises events.
Threshold -- Maximum number of calls per transaction
Enter a threshold for the maximum number of database calls per transaction allowed before the job raises an event. The default value is 100 calls per transaction.
Description How to Set It
152 AppManager for Oracle RDBMS on UNIX or Linux Servers

Severity Set the event severity level, from 1 to 40, to indicate the importance of the event. The default value is 5 (red event indicator).
Event option for transaction rate
Raise event if threshold is exceeded?
Select the Yes check box to raise an event if the transaction rate exceeds the threshold you set. By default, the job raises events.
Threshold -- Maximum transaction rate
Enter a threshold for the maximum number of transactions per second allowed before an event is raised. The default value is 1 transaction per second.
Severity Set the event severity level, from 1 to 40, to indicate the importance of the event. The default value is 10 (red event indicator).
Collect Data
Collect data for the ratio of active transactions to maximum concurrent transactions?
Set to y to collect data for charts and reports. If you enable data collection, the Knowledge Script returns the ratio of active transactions to maximum concurrent transactions as a percentage (%). By default, data is not collected.
Collect data for call rate?
Set to y to collect data for charts and reports. If you enable data collection, the Knowledge Script returns the total user calls per second for all work sources. By default, data is not collected.
Collect data for calls made per transaction?
Set to y to collect data for charts and reports. When you enable data collection, the Knowledge Script returns the current transaction rate (transactions/second). By default, data is not collected.
Collect data for transaction rate?
Set to y to collect data for charts and reports. When you enable data collection, the Knowledge Script returns the current transaction rate (transactions/second). By default, data is not collected.
Description How to Set It
Chapter 3 • OracleUNIX Knowledge Scripts 153

TransactionRateUse this Knowledge Script to monitor the transaction rate for an Oracle database. This script tracks the number of transactions per second to provide a basic measurement of application workload. In addition, this script raises an event if the number of transactions per second exceeds the threshold you set.
Changes to your applications or to application usage patterns can affect the transaction rate, but in general, an increase in the transaction rate suggests an increase in overall server load. If you see a decrease in the transaction rate with the same number of connected users, it may indicate that you need to do some database tuning or investigate the reasons for the changes.
The account you use to run this script must have SELECT permissions for the following tables:
V_$SYSSTATV_$VERSION
Resource Objects
Oracle Database folders. When you drop a script on an Oracle Database folder, a job executes on that database and monitors only that database.
Default Schedule
The default interval for this script is Every 30 minutes.
154 AppManager for Oracle RDBMS on UNIX or Linux Servers

Setting Parameter Values
Set the following parameters as needed:
Description How to Set It
Oracle Username Enter the username that this script needs to access the target databases. If you run this script on more than one database, configure each database with the same username.Note To use SYSDBA authentication, leave this parameter blank.The default value is blank.
Collect data for transaction rate?
Set to y to collect data for charts and reports. When you enable data collection, the Knowledge Script returns the current transaction rate (transactions/second). By default, data is not collected.
Raise event if threshold is exceeded?
Select the Yes check box to raise an event if the transaction rate exceeds the threshold you set. By default, the job raises events.
Threshold -- Maximum transaction rate
Enter a threshold for the maximum number of transactions per second allowed before an event is raised. The default value is 1 transaction per second.
Severity Set the event severity level, from 1 to 40, to indicate the importance of the event. The default value is 10 (red event indicator).
Chapter 3 • OracleUNIX Knowledge Scripts 155

UpdateInstancesUse this Knowledge Script to update the list of Oracle databases/instances on each UNIX host.
Note This script cannot be run to update environments in all cases. If you do not use a listener.ora file to maintain listener information, or if you install a new Oracle version on the host, we recommend that you log in to the host and run the ckoracle utility. This utility will prompt you to enter required information for newly added or deleted Oracle databases/instances.
Resource Objects
Oracle Database folders. When you drop a script on an Oracle Database folder, a job executes on that database and monitors only that database.
Notes You must run the Discovery_OracleUNIX script after running the UpdateInstances script to pick up any changes in the environment.
If databases have been deleted, you must delete the Oracle UNIX objects from the TreeView. This cannot be done by the module or AppManager itself.
Default Schedule
The default interval for this script is Run Once.
156 AppManager for Oracle RDBMS on UNIX or Linux Servers

Setting Parameter Values
Set the following parameters as needed:
Description How to Set It
Required Parameter(s)
Oracle Home to use as the client (usually that of the newest Oracle version)
Specify the Oracle Home directory that should be used as the client. If multiple versions of Oracle RBDMS are installed on the host, this is usually the Oracle Home directory of the newest version of Oracle. The default value is blank.
Optional Parameter(s)
Location of sqlnet.ora, listener.ora, tnsnames.ora (TNS_ADMIN)
Specify the directory where the Oracle Net/Net 8 files reside (such as the tnsnames.ora, listener.ora, and sqlnet.ora). It is only necessary to set this parameter when the files are not in the default location for each Oracle Home ($ORACLE_HOME/network/admin). The default value is blank.
Oracle Username Enter the username that OracleUNIX jobs will use for authentication with Oracle RDBMS during execution. This username will be passed to the NetIQ Security Manager.Note To use SYSDBA authentication, leave this parameter blank.The default value is blank.
Password for the Oracle Username Specify the password for the Oracle Username specified in the previous parameter. This password will be encrypted and passed to the AppManager Security Manager along with the Oracle username. The default value is blank.
Are all databases using the same listener?
Select the Yes check box if one listener is being used on the UNIX host, then specify the details of that listener below. By default, this parameter is disabled.
Chapter 3 • OracleUNIX Knowledge Scripts 157

Name of listener Specify the name of the listener that is being used on the UNIX host. This parameter is only used when you set the Are all databases using the same listener? to Yes. The default value is LISTENER.
Port used by listener Enter the port number of that the listener is listening on for the UNIX host. This parameter is only used when you set the Are all databases using the same listener? to Yes. The default value is 1521.
Raise event if error occurs updating instances?
Select the Yes check box to raise an event when an error is detected while attempting to update the list of Oracle instances. By default, events are enabled.
Severity Set the event severity level, from 1 to 40, to indicate the importance of the event for successfully setting the monitoring options. The default severity level is 10 (red event indicator).
Raise event with current instance info if successfully updated?
Select the Yes check box to raise an event with the information collected on Oracle instances on the host during the update. By default, the job does not raise events.
Severity Set the event severity level, from 1 to 40, to indicate the importance of the event for successfully setting the monitoring options. The default severity level is 40 (magenta event indicator).
Description How to Set It
158 AppManager for Oracle RDBMS on UNIX or Linux Servers

UserUse this Knowledge Script to monitor the following parameters:
• User Calls Per Parse: the ratio of parse count (hard) to the number of user calls as a percentage. The number of user calls that result in a parse indicates how well an application is managing its context area. Changes in this ratio may indicate changes to the application itself, or to changing usage patterns (For example, because users are moving from one module to another, more or less frequently).
Generally, if the ratio of parsed calls to total user calls is low, it indicates that the SQL statements are executing efficiently without frequent reparsing. Otherwise, it may indicate that the private SQL area is too small.
This script raises an event when the percentage of user calls that are parsed exceeds the threshold you set.
• User Sessions: the total number of user sessions accessing an Oracle database. If the total number of user sessions crosses the threshold, the job raises an event.
You can specify the number of user sessions to display in the Event Properties dialog box. The Event Properties dialog box displays the total number of user sessions exceeding the threshold. Information in the graph includes the number of sessions for each user and the username.
• User Rollback Ratio: the user rollback ratio for an Oracle Database. The user rollback ratio indicates the percentage of attempted application transactions that fail. The ratio compares the number of transactions rolled back to the total number of transactions attempted.
Because rolling back a transaction uses significant system resources, an increase in this ratio suggests resources have been wasted in attempting to execute failed transactions. If you see a continued increase in this ratio, it may indicate serious application
Chapter 3 • OracleUNIX Knowledge Scripts 159

or database performance problems. This script raises an event when the rollback ratio exceeds the threshold.
• Blocking Sessions: the user sessions that are blocking other sessions and processes from accessing the Oracle database. You can set a maximum threshold for the number of sessions that are allowed to block other sessions and processes. If the number of blocking sessions exceeds the threshold, the job raises an event.
The account you use to run this script must have SELECT permissions for the following tables:
V_$SYSSTATV_$LOCKV_$VERSION
DBA_USERSV_$SESSION
Resource Objects
Oracle Database folders. When you drop a script on an Oracle Database folder, a job executes on that database and monitors only that database.
Default Schedule
The default interval for this script is Every 10 minutes.
160 AppManager for Oracle RDBMS on UNIX or Linux Servers

Setting Parameter Values
Set the following parameters as needed:
Description How to Set It
Oracle Username Enter the username that this script needs to access the target databases. If you run this script on more than one database, configure each database with the same username.Note To use SYSDBA authentication, leave this parameter blank.The default value is blank.
User
User Calls Per Parse Select the Yes check box to monitor User Calls Per Parse.
User Sessions Select the Yes check box to monitor User Sessions.
User Rollback Ratio Select the Yes check box to monitor User Callback Ratio.
Blocking Sessions Select the Yes check box to monitor Blocking Sessions.
Event Notification
Raise event if threshold is exceeded for User Calls Per Parse?
Select the Yes check box to raise an event if the ratio of parses per user call exceeds the threshold you set. By default, the job raises events.
Raise event if threshold is exceeded for User Sessions?
Select the Yes check box to raise an event if the number of user sessions exceeds the threshold. By default, the job raises events.
Raise event if threshold is exceeded for User Rollback Ratio?
Select the Yes check box to raise an event if the number of user transaction rollbacks exceeds the threshold. By default, the job raises events.
Raise event if threshold is exceeded for Blocking Sessions?
Select the Yes check box to raise an event if the number of blocking sessions exceeds the threshold you set. By default, the job raises events.
Severity Set the event severity level, from 1 to 40, to indicate the importance of the event. The default value is 5 (red event indicator).
Data Collection
Chapter 3 • OracleUNIX Knowledge Scripts 161

Collect data for User Calls Per Parse?
Select the Yes check box to collect data for charts and reports. When you enable data collection, the Knowledge Script returns the current percentage of user calls that are parsed. By default, data is not collected.
Collect data forUser Sessions?
Set to y to collect data for charts and reports. When you enable data collection, the Knowledge Script returns the total number of user sessions. By default, data is not collected.
Collect data for User Rollback Ratio?
Set to y to collect data for charts and reports. When you enable data collection, the Knowledge Script returns the current user rollback ratio. By default, data is not collected.
Collect data for Blocking Sessions?
Set to y to collect data for charts and reports. When you enable data collection, the Knowledge Script returns the number of blocking sessions per interval. By default, data is not collected.
Monitoring
Threshold -- Maximum Parses Per User Call
Enter a threshold for the maximum ratio of parsed calls to total user calls allowed before an event is raised. The default value is 0.2.
Threshold -- Maximum total user sessions
Enter a threshold for maximum number of user sessions. The default value is 75 user sessions.
Number of user sessions to display
Specify the number of user sessions you want displayed in the Event Properties dialog box. Enter 0 if you want all user sessions displayed. The default value is 10 user sessions.
Threshold -- Maximum user rollback ratio
Enter a threshold for the maximum percentage of transaction rollbacks allowed before the job raises an event. The default value is 75%.
Threshold -- Maximum number of blocking sessions
Enter a threshold for the maximum number of user sessions allowed to block other user sessions and processes during the monitoring interval. The default value is 10 sessions.
Description How to Set It
162 AppManager for Oracle RDBMS on UNIX or Linux Servers

UserCallsPerParseUse this Knowledge Script to monitor the ratio of parse count (hard) to the number of user calls as a percentage. The number of user calls that result in a parse indicates how well an application is managing its context area. Changes in this ratio may indicate changes to the application itself, or to changing usage patterns (For example, because users are moving from one module to another, more or less frequently).
Generally, if the ratio of parsed calls to total user calls is low, it indicates that the SQL statements are executing efficiently without frequent reparsing. Otherwise, it may indicate that the private SQL area is too small.
This script raises an event when the percentage of user calls that are parsed exceeds the threshold you set.
The account you use to run this script must have SELECT permissions for the following tables:
V_$SYSSTATV_$VERSION
Resource Objects
Oracle Database folders. When you drop a script on an Oracle Database folder, a job executes on that database and monitors only that database.
Default Schedule
The default interval for this script is Every 10 minutes.
Chapter 3 • OracleUNIX Knowledge Scripts 163

Setting Parameter Values
Set the following parameters as needed:
Description How to Set It
Oracle Username Enter the username that this script needs to access the target databases. If you run this script on more than one database, configure each database with the same username.Note To use SYSDBA authentication, leave this parameter blank.The default value is blank.
Collect data for parses per user call?
Set to y to collect data for charts and reports. When you enable data collection, the Knowledge Script returns the current percentage of user calls that are parsed. By default, data is not collected.
Raise event if threshold is exceeded?
Select the Yes check box to raise an event if the ratio of parses per user call exceeds the threshold you set. By default, the job raises events.
Threshold -- Maximum ratio of parses per user call
Enter a threshold for the maximum ratio of parsed calls to total user calls allowed before an event is raised. The default value is 0.2.
Severity Set the event severity level, from 1 to 40, to indicate the importance of the event. The default value is 5 (red event indicator).
164 AppManager for Oracle RDBMS on UNIX or Linux Servers

UserRollbackRatioUse this Knowledge Script to monitor the user rollback ratio for an Oracle Database. The user rollback ratio indicates the percentage of attempted application transactions that fail. The ratio compares the number of transactions rolled back to the total number of transactions attempted.
Because rolling back a transaction uses significant system resources, an increase in this ratio suggests resources have been wasted in attempting to execute failed transactions. If you see a continued increase in this ratio, it may indicate serious application or database performance problems. This script raises an event when the rollback ratio exceeds the threshold.
The account you use to run this script must have SELECT permissions for the following tables:
V_$SYSSTATV_$VERSION
Resource Objects
Oracle Database folders. When you drop a script on an Oracle Database folder, a job executes on that database and monitors only that database.
Default Schedule
The default interval for this script is Every hour.
Chapter 3 • OracleUNIX Knowledge Scripts 165

Setting Parameter Values
Set the following parameters as needed:
Description How to Set It
Oracle Username Enter the username that this script needs to access the target databases. If you run this script on more than one database, configure each database with the same username.Note To use SYSDBA authentication, leave this parameter blank.The default value is blank.
Collect data for user rollback ratio?
Set to y to collect data for charts and reports. When you enable data collection, the Knowledge Script returns the current user rollback ratio. By default, data is not collected.
Raise event if threshold is exceeded?
Select the Yes check box to raise an event if the number of user transaction rollbacks exceeds the threshold. By default, the job raises events.
Threshold -- Maximum user rollback ratio
Enter a threshold for the maximum percentage of transaction rollbacks allowed before the job raises an event. The default value is 75%.
Severity Set the event severity level, from 1 to 40, to indicate the importance of the event. The default value is 5 (red event indicator).
166 AppManager for Oracle RDBMS on UNIX or Linux Servers

UserSessionsUse this Knowledge Script to monitor the total number of user sessions accessing an Oracle database. If the total number of user sessions crosses the threshold, the job raises an event.
You can specify the number of user sessions to display in the Event Properties dialog box. The Event Properties dialog box displays the total number of user sessions exceeding the threshold. Information in the graph includes the number of sessions for each user and the username.
The account you use to run this script must have SELECT permissions for the following tables:
DBA_USERSV_$SESSION
Resource Objects
Oracle Server icon, or Oracle icon. When dropped on the Oracle Server icon, a single script job monitors every database on that server. When dropped on an Oracle icon, the script monitors only that database.
Default Schedule
The default interval for this script is Every 30 minutes.
Chapter 3 • OracleUNIX Knowledge Scripts 167

Setting Parameter Values
Set the following parameters as needed:
Description How to Set It
Oracle Username Enter the username that this script needs to access the target databases. If you run this script on more than one database, configure each database with the same username.Note To use SYSDBA authentication, leave this parameter blank.The default value is blank.
Collect data for number of user sessions?
Set to y to collect data for charts and reports. When you enable data collection, the Knowledge Script returns the total number of user sessions. By default, data is not collected.
Raise event if threshold is exceeded?
Select the Yes check box to raise an event if the number of user sessions exceeds the threshold. By default, the job raises events.
Threshold -- Maximum total user sessions
Enter a threshold for maximum number of user sessions. The default value is 75 user sessions.
Number of user sessions to display
Specify the number of user sessions you want displayed in the Event Properties dialog box. Enter 0 if you want all user sessions displayed. The default value is 10 user sessions.
Severity Set the event severity level, from 1 to 40, to indicate the importance of the event. The default value is 5 (red event indicator).
168 AppManager for Oracle RDBMS on UNIX or Linux Servers

Discovery_OracleUNIXUse this Knowledge Script to discover Oracle system resources on UNIX and Linux servers.
To successfully discover Oracle configuration and resource information, the account with which you run this script must have SELECT permissions for the following tables:DBA_DATA_FILESDBA_SEGMENTSDBA_TABLESPACESDBA_USERSV_$DATABASEV_$INSTANCEV_$VERSION
Resource Objects
UNIX machine folder
Default Schedule
The default interval for this script is Run Once.
Setting Parameter Values
Set the following parameters as needed:
Description How to Set It
Oracle Username Enter the Oracle Database username used to access the target databases. If you run this script on more than one computer, configure each database with the same username.Note To use SYSDBA authentication, leave the Oracle Username parameter blank.The default value is blank.
Discover instances not automatically started upon system boot?
Select the Yes check box to discover Oracle instances not started by the dbstart utility upon system boot. This information is obtained from the oratab file. By default, these instances are discovered.
Chapter 3 • OracleUNIX Knowledge Scripts 169

Raise event when discovery fails?
Select the Yes check box to raise an event when discovery fails. By default, events are enabled.
Severity Set the event severity level, from 1 to 40, to indicate the importance of the event. The default value is 5.
Raise event when discovery partially succeeds?
Select the Yes check box to raise an event when discovery is partially successful. By default, events are enabled.
Severity Set the event severity level, from 1 to 40, to indicate the importance of the event. The default value is 30.
Raise event when discovery succeeds?
Select the Yes check box to raise an event when discovery succeeds. By default, the job does not raise events.
Severity Set the event severity level, from 1 to 40, to indicate the importance of the event. The default value is 40.
Description How to Set It
170 AppManager for Oracle RDBMS on UNIX or Linux Servers