netiq sentinel 7.0.1 user guide
TRANSCRIPT

User Guide
Sentinel 7.0.1
April 2012

Legal Notices
NetIQ Corporation (“NetIQ”) makes no representations or warranties with respect to the contents or use of this documentation, and specifically disclaims any express or implied warranties of merchantability or fitness for any particular purpose. Further, NetIQ reserves the right to revise this publication and to make changes to its content, at any time, without obligation to notify any person or entity of such revisions or changes.
NetIQ makes no representations or warranties with respect to any software, and specifically disclaims any express or implied warranties of merchantability or fitness for any particular purpose. Further, NetIQ reserves the right to make changes to any and all parts of the software, at any time, without any obligation to notify any person or entity of such changes.
Any products or technical information provided under this Agreement may be subject to U.S. export controls and the trade laws of other countries. You agree to comply with all export control regulations and to obtain any required licenses or classification to export, re‐export, or import deliverables. You agree not to export or re‐export to entities on the current U.S. export exclusion lists or to any embargoed or terrorist countries as specified in the U.S. export laws. You agree to not use deliverables for prohibited nuclear, missile, or chemical biological weaponry end uses. NetIQ assumes no responsibility for your failure to obtain any necessary export approvals.
Copyright © 2012 Novell, Inc. All rights reserved. No part of this publication may be reproduced, photocopied, stored on a retrieval system, or transmitted without the express written consent of the publisher.
All third‐party trademarks are the property of their respective owners.
For more information, please contact NetIQ at:
1233 West Loop South, Houston, Texas 77027U.S.A.www.netiq.com

Contents
About This Guide 9
1 Introduction to the Sentinel Interface 11
1.1 Sentinel Web Interface. . . . . . . . . . . . . . . . . . . . . . . . . . . . . . . . . . . . . . . . . . . . . . . . . . . . . . . . . . . . 111.2 Sentinel Control Center . . . . . . . . . . . . . . . . . . . . . . . . . . . . . . . . . . . . . . . . . . . . . . . . . . . . . . . . . . . 111.3 Solution Designer. . . . . . . . . . . . . . . . . . . . . . . . . . . . . . . . . . . . . . . . . . . . . . . . . . . . . . . . . . . . . . . . 11
2 Searching Events 13
2.1 Running an Event Search . . . . . . . . . . . . . . . . . . . . . . . . . . . . . . . . . . . . . . . . . . . . . . . . . . . . . . . . . 132.2 Viewing Search Results . . . . . . . . . . . . . . . . . . . . . . . . . . . . . . . . . . . . . . . . . . . . . . . . . . . . . . . . . . . 15
2.2.1 Summary View. . . . . . . . . . . . . . . . . . . . . . . . . . . . . . . . . . . . . . . . . . . . . . . . . . . . . . . . . . . 172.2.2 Detailed View. . . . . . . . . . . . . . . . . . . . . . . . . . . . . . . . . . . . . . . . . . . . . . . . . . . . . . . . . . . . 17
2.3 Refining Search Results. . . . . . . . . . . . . . . . . . . . . . . . . . . . . . . . . . . . . . . . . . . . . . . . . . . . . . . . . . . 182.4 Saving a Search Query . . . . . . . . . . . . . . . . . . . . . . . . . . . . . . . . . . . . . . . . . . . . . . . . . . . . . . . . . . . 20
2.4.1 Saving a Search Query as a Filter . . . . . . . . . . . . . . . . . . . . . . . . . . . . . . . . . . . . . . . . . . . . 202.4.2 Saving a Search Query as a Report Template . . . . . . . . . . . . . . . . . . . . . . . . . . . . . . . . . . 212.4.3 Saving a Search Query as a Routing Rule . . . . . . . . . . . . . . . . . . . . . . . . . . . . . . . . . . . . . 232.4.4 Saving a Search Query as a Retention Policy. . . . . . . . . . . . . . . . . . . . . . . . . . . . . . . . . . . 232.4.5 Creating a Dashboard . . . . . . . . . . . . . . . . . . . . . . . . . . . . . . . . . . . . . . . . . . . . . . . . . . . . . 24
2.5 Performing Event Operations. . . . . . . . . . . . . . . . . . . . . . . . . . . . . . . . . . . . . . . . . . . . . . . . . . . . . . . 242.5.1 Executing Actions . . . . . . . . . . . . . . . . . . . . . . . . . . . . . . . . . . . . . . . . . . . . . . . . . . . . . . . . 252.5.2 Exporting the Search Results to a File . . . . . . . . . . . . . . . . . . . . . . . . . . . . . . . . . . . . . . . . 252.5.3 Adding Events to an Incident . . . . . . . . . . . . . . . . . . . . . . . . . . . . . . . . . . . . . . . . . . . . . . . . 262.5.4 Creating an Incident. . . . . . . . . . . . . . . . . . . . . . . . . . . . . . . . . . . . . . . . . . . . . . . . . . . . . . . 262.5.5 Adding Events to a Correlation Rule . . . . . . . . . . . . . . . . . . . . . . . . . . . . . . . . . . . . . . . . . . 272.5.6 Creating a Correlation Rule by Using Events . . . . . . . . . . . . . . . . . . . . . . . . . . . . . . . . . . . 272.5.7 Viewing Identity Details of Events . . . . . . . . . . . . . . . . . . . . . . . . . . . . . . . . . . . . . . . . . . . . 272.5.8 Viewing Advisor Report . . . . . . . . . . . . . . . . . . . . . . . . . . . . . . . . . . . . . . . . . . . . . . . . . . . . 272.5.9 Viewing Asset Data . . . . . . . . . . . . . . . . . . . . . . . . . . . . . . . . . . . . . . . . . . . . . . . . . . . . . . . 282.5.10 Viewing Vulnerabilities. . . . . . . . . . . . . . . . . . . . . . . . . . . . . . . . . . . . . . . . . . . . . . . . . . . . . 28
3 Configuring Filters 29
3.1 Overview . . . . . . . . . . . . . . . . . . . . . . . . . . . . . . . . . . . . . . . . . . . . . . . . . . . . . . . . . . . . . . . . . . . . . . 293.2 Introducing the Filters Interface . . . . . . . . . . . . . . . . . . . . . . . . . . . . . . . . . . . . . . . . . . . . . . . . . . . . . 29
3.2.1 Filters Panel. . . . . . . . . . . . . . . . . . . . . . . . . . . . . . . . . . . . . . . . . . . . . . . . . . . . . . . . . . . . . 303.2.2 Filter Builder. . . . . . . . . . . . . . . . . . . . . . . . . . . . . . . . . . . . . . . . . . . . . . . . . . . . . . . . . . . . . 30
3.3 Creating a Filter . . . . . . . . . . . . . . . . . . . . . . . . . . . . . . . . . . . . . . . . . . . . . . . . . . . . . . . . . . . . . . . . . 323.3.1 Creating a Filter by Using the Filter Builder . . . . . . . . . . . . . . . . . . . . . . . . . . . . . . . . . . . . . 323.3.2 Creating a Filter by Using a Search Query . . . . . . . . . . . . . . . . . . . . . . . . . . . . . . . . . . . . . 33
3.4 Sample Filters . . . . . . . . . . . . . . . . . . . . . . . . . . . . . . . . . . . . . . . . . . . . . . . . . . . . . . . . . . . . . . . . . . 343.4.1 View Events of Severity 3 to 5 from a System in China. . . . . . . . . . . . . . . . . . . . . . . . . . . . 343.4.2 Determine if User “Bob Smith” Tried to Log In after His Account was Disabled . . . . . . . . . 343.4.3 View Events from Two Subnets and Share the Filter with Network Administrators. . . . . . . 353.4.4 Find all Events that Include the Words “database” and “service,” and exclude “test” . . . . . 35
3.5 Viewing Events by Using Filters . . . . . . . . . . . . . . . . . . . . . . . . . . . . . . . . . . . . . . . . . . . . . . . . . . . . . 363.6 Managing Filters. . . . . . . . . . . . . . . . . . . . . . . . . . . . . . . . . . . . . . . . . . . . . . . . . . . . . . . . . . . . . . . . . 36
3.6.1 Editing a Filter . . . . . . . . . . . . . . . . . . . . . . . . . . . . . . . . . . . . . . . . . . . . . . . . . . . . . . . . . . . 363.6.2 Deleting a Filter . . . . . . . . . . . . . . . . . . . . . . . . . . . . . . . . . . . . . . . . . . . . . . . . . . . . . . . . . . 37
Contents 3
4 Con
4 Correlating Event Data 39
4.1 Overview . . . . . . . . . . . . . . . . . . . . . . . . . . . . . . . . . . . . . . . . . . . . . . . . . . . . . . . . . . . . . . . . . . . . . . 394.1.1 How Correlation Works . . . . . . . . . . . . . . . . . . . . . . . . . . . . . . . . . . . . . . . . . . . . . . . . . . . . 404.1.2 Correlation Rules . . . . . . . . . . . . . . . . . . . . . . . . . . . . . . . . . . . . . . . . . . . . . . . . . . . . . . . . . 404.1.3 Correlation Engine . . . . . . . . . . . . . . . . . . . . . . . . . . . . . . . . . . . . . . . . . . . . . . . . . . . . . . . . 43
4.2 Accessing the Correlation User Interface. . . . . . . . . . . . . . . . . . . . . . . . . . . . . . . . . . . . . . . . . . . . . . 444.3 Understanding the Correlation Interface . . . . . . . . . . . . . . . . . . . . . . . . . . . . . . . . . . . . . . . . . . . . . . 44
4.3.1 Correlation Panel . . . . . . . . . . . . . . . . . . . . . . . . . . . . . . . . . . . . . . . . . . . . . . . . . . . . . . . . . 444.3.2 Correlation Rule Builder. . . . . . . . . . . . . . . . . . . . . . . . . . . . . . . . . . . . . . . . . . . . . . . . . . . . 45
4.4 Creating Correlation Rules. . . . . . . . . . . . . . . . . . . . . . . . . . . . . . . . . . . . . . . . . . . . . . . . . . . . . . . . . 494.4.1 Creating a Simple Rule . . . . . . . . . . . . . . . . . . . . . . . . . . . . . . . . . . . . . . . . . . . . . . . . . . . . 504.4.2 Creating a Sequence Rule. . . . . . . . . . . . . . . . . . . . . . . . . . . . . . . . . . . . . . . . . . . . . . . . . . 514.4.3 Creating a Composite Rule . . . . . . . . . . . . . . . . . . . . . . . . . . . . . . . . . . . . . . . . . . . . . . . . . 524.4.4 Creating a Free-Form Rule . . . . . . . . . . . . . . . . . . . . . . . . . . . . . . . . . . . . . . . . . . . . . . . . . 534.4.5 Creating Correlation Rules From Search Results . . . . . . . . . . . . . . . . . . . . . . . . . . . . . . . . 53
4.5 Associating Actions to a Rule. . . . . . . . . . . . . . . . . . . . . . . . . . . . . . . . . . . . . . . . . . . . . . . . . . . . . . . 544.6 Testing a Correlation Rule . . . . . . . . . . . . . . . . . . . . . . . . . . . . . . . . . . . . . . . . . . . . . . . . . . . . . . . . . 554.7 Sample Correlation Rules . . . . . . . . . . . . . . . . . . . . . . . . . . . . . . . . . . . . . . . . . . . . . . . . . . . . . . . . . 55
4.7.1 Detecting Critical Events from an Intrusion Detection System . . . . . . . . . . . . . . . . . . . . . . 554.7.2 Detecting a Spreading Attack . . . . . . . . . . . . . . . . . . . . . . . . . . . . . . . . . . . . . . . . . . . . . . . 564.7.3 Detecting an Attack that Came from Outside the Firewall . . . . . . . . . . . . . . . . . . . . . . . . . . 57
4.8 Deploying Rules in the Correlation Engine . . . . . . . . . . . . . . . . . . . . . . . . . . . . . . . . . . . . . . . . . . . . 574.9 Viewing Correlation Events . . . . . . . . . . . . . . . . . . . . . . . . . . . . . . . . . . . . . . . . . . . . . . . . . . . . . . . . 574.10 Managing Correlation Rules. . . . . . . . . . . . . . . . . . . . . . . . . . . . . . . . . . . . . . . . . . . . . . . . . . . . . . . . 58
4.10.1 Viewing the Rule Dashboard . . . . . . . . . . . . . . . . . . . . . . . . . . . . . . . . . . . . . . . . . . . . . . . . 584.10.2 Editing a Rule . . . . . . . . . . . . . . . . . . . . . . . . . . . . . . . . . . . . . . . . . . . . . . . . . . . . . . . . . . . 594.10.3 Deleting a Rule . . . . . . . . . . . . . . . . . . . . . . . . . . . . . . . . . . . . . . . . . . . . . . . . . . . . . . . . . . 59
4.11 Managing the Correlation Engine. . . . . . . . . . . . . . . . . . . . . . . . . . . . . . . . . . . . . . . . . . . . . . . . . . . . 594.11.1 Using the Correlation Engine Dashboard . . . . . . . . . . . . . . . . . . . . . . . . . . . . . . . . . . . . . . 604.11.2 Stopping or Starting a Correlation Engine . . . . . . . . . . . . . . . . . . . . . . . . . . . . . . . . . . . . . . 624.11.3 Renaming a Correlation Engine. . . . . . . . . . . . . . . . . . . . . . . . . . . . . . . . . . . . . . . . . . . . . . 62
5 Analyzing Trends in Data 63
5.1 Overview . . . . . . . . . . . . . . . . . . . . . . . . . . . . . . . . . . . . . . . . . . . . . . . . . . . . . . . . . . . . . . . . . . . . . . 635.1.1 Terminology . . . . . . . . . . . . . . . . . . . . . . . . . . . . . . . . . . . . . . . . . . . . . . . . . . . . . . . . . . . . . 635.1.2 How Security Intelligence Works . . . . . . . . . . . . . . . . . . . . . . . . . . . . . . . . . . . . . . . . . . . . . 655.1.3 Permissions for Security Intelligence. . . . . . . . . . . . . . . . . . . . . . . . . . . . . . . . . . . . . . . . . . 66
5.2 Creating a Dashboard . . . . . . . . . . . . . . . . . . . . . . . . . . . . . . . . . . . . . . . . . . . . . . . . . . . . . . . . . . . . 665.2.1 Creating a Dashboard by Using a Filter. . . . . . . . . . . . . . . . . . . . . . . . . . . . . . . . . . . . . . . . 67
5.3 Understanding the Dashboard Interface . . . . . . . . . . . . . . . . . . . . . . . . . . . . . . . . . . . . . . . . . . . . . . 675.4 Creating Baselines . . . . . . . . . . . . . . . . . . . . . . . . . . . . . . . . . . . . . . . . . . . . . . . . . . . . . . . . . . . . . . . 685.5 Configuring Anomaly Detection . . . . . . . . . . . . . . . . . . . . . . . . . . . . . . . . . . . . . . . . . . . . . . . . . . . . . 69
5.5.1 Creating an Anomaly Definition . . . . . . . . . . . . . . . . . . . . . . . . . . . . . . . . . . . . . . . . . . . . . . 695.5.2 Deploying an Anomaly Definition. . . . . . . . . . . . . . . . . . . . . . . . . . . . . . . . . . . . . . . . . . . . . 705.5.3 Undeploying an Anomaly Definition. . . . . . . . . . . . . . . . . . . . . . . . . . . . . . . . . . . . . . . . . . . 705.5.4 Managing Anomalies . . . . . . . . . . . . . . . . . . . . . . . . . . . . . . . . . . . . . . . . . . . . . . . . . . . . . . 71
5.6 Managing Dashboards . . . . . . . . . . . . . . . . . . . . . . . . . . . . . . . . . . . . . . . . . . . . . . . . . . . . . . . . . . . . 715.6.1 Viewing a Dashboard. . . . . . . . . . . . . . . . . . . . . . . . . . . . . . . . . . . . . . . . . . . . . . . . . . . . . . 715.6.2 Renaming a Dashboard. . . . . . . . . . . . . . . . . . . . . . . . . . . . . . . . . . . . . . . . . . . . . . . . . . . . 725.6.3 Deleting a Dashboard . . . . . . . . . . . . . . . . . . . . . . . . . . . . . . . . . . . . . . . . . . . . . . . . . . . . . 72
5.7 Troubleshooting . . . . . . . . . . . . . . . . . . . . . . . . . . . . . . . . . . . . . . . . . . . . . . . . . . . . . . . . . . . . . . . . . 725.7.1 The Create Button Is Not Displayed . . . . . . . . . . . . . . . . . . . . . . . . . . . . . . . . . . . . . . . . . . 725.7.2 The Main Graph and the Time Slider Are Not Synchronized. . . . . . . . . . . . . . . . . . . . . . . . 725.7.3 Both Names for a Renamed Anomaly Are Displayed in the Filter . . . . . . . . . . . . . . . . . . . . 725.7.4 Dashboard Date Range Not Updated to in Real Time. . . . . . . . . . . . . . . . . . . . . . . . . . . . . 73
tents

6 Configuring Dynamic Lists 75
6.1 Creating a Dynamic List . . . . . . . . . . . . . . . . . . . . . . . . . . . . . . . . . . . . . . . . . . . . . . . . . . . . . . . . . . . 756.1.1 Using the Sentinel Control Center to Create a Dynamic List . . . . . . . . . . . . . . . . . . . . . . . . 756.1.2 Using the Correlation Rule Builder to Create a Dynamic List . . . . . . . . . . . . . . . . . . . . . . . 76
6.2 Managing Dynamic Lists . . . . . . . . . . . . . . . . . . . . . . . . . . . . . . . . . . . . . . . . . . . . . . . . . . . . . . . . . . 776.2.1 Editing a Dynamic List . . . . . . . . . . . . . . . . . . . . . . . . . . . . . . . . . . . . . . . . . . . . . . . . . . . . . 776.2.2 Deleting a Dynamic List . . . . . . . . . . . . . . . . . . . . . . . . . . . . . . . . . . . . . . . . . . . . . . . . . . . . 786.2.3 Removing Dynamic List Elements . . . . . . . . . . . . . . . . . . . . . . . . . . . . . . . . . . . . . . . . . . . . 78
7 Integrating Identity Information with Sentinel Events 79
7.1 Overview . . . . . . . . . . . . . . . . . . . . . . . . . . . . . . . . . . . . . . . . . . . . . . . . . . . . . . . . . . . . . . . . . . . . . . 797.2 Integration with Identity Management Systems . . . . . . . . . . . . . . . . . . . . . . . . . . . . . . . . . . . . . . . . . 807.3 Identity Browser . . . . . . . . . . . . . . . . . . . . . . . . . . . . . . . . . . . . . . . . . . . . . . . . . . . . . . . . . . . . . . . . . 82
7.3.1 Accessing the Identity Browser . . . . . . . . . . . . . . . . . . . . . . . . . . . . . . . . . . . . . . . . . . . . . . 827.3.2 Performing a Search . . . . . . . . . . . . . . . . . . . . . . . . . . . . . . . . . . . . . . . . . . . . . . . . . . . . . . 837.3.3 Searching. . . . . . . . . . . . . . . . . . . . . . . . . . . . . . . . . . . . . . . . . . . . . . . . . . . . . . . . . . . . . . . 837.3.4 Viewing Profile Details . . . . . . . . . . . . . . . . . . . . . . . . . . . . . . . . . . . . . . . . . . . . . . . . . . . . . 847.3.5 Viewing Activity . . . . . . . . . . . . . . . . . . . . . . . . . . . . . . . . . . . . . . . . . . . . . . . . . . . . . . . . . . 85
8 Manually Performing Actions on Events 87
8.1 Accessing Event Actions . . . . . . . . . . . . . . . . . . . . . . . . . . . . . . . . . . . . . . . . . . . . . . . . . . . . . . . . . . 878.2 Prerequisites for Assigning Actions to Events . . . . . . . . . . . . . . . . . . . . . . . . . . . . . . . . . . . . . . . . . . 878.3 Assigning Actions to Events. . . . . . . . . . . . . . . . . . . . . . . . . . . . . . . . . . . . . . . . . . . . . . . . . . . . . . . . 878.4 Configuring Event Actions . . . . . . . . . . . . . . . . . . . . . . . . . . . . . . . . . . . . . . . . . . . . . . . . . . . . . . . . . 88
8.4.1 Creating a New Event Action. . . . . . . . . . . . . . . . . . . . . . . . . . . . . . . . . . . . . . . . . . . . . . . . 888.4.2 Cloning an Event Action . . . . . . . . . . . . . . . . . . . . . . . . . . . . . . . . . . . . . . . . . . . . . . . . . . . 898.4.3 Moving an Event Action . . . . . . . . . . . . . . . . . . . . . . . . . . . . . . . . . . . . . . . . . . . . . . . . . . . . 898.4.4 Deleting an Event Action . . . . . . . . . . . . . . . . . . . . . . . . . . . . . . . . . . . . . . . . . . . . . . . . . . . 89
9 Configuring Tags 91
9.1 Overview . . . . . . . . . . . . . . . . . . . . . . . . . . . . . . . . . . . . . . . . . . . . . . . . . . . . . . . . . . . . . . . . . . . . . . 919.2 The Tags Interface . . . . . . . . . . . . . . . . . . . . . . . . . . . . . . . . . . . . . . . . . . . . . . . . . . . . . . . . . . . . . . . 929.3 Creating a Tag . . . . . . . . . . . . . . . . . . . . . . . . . . . . . . . . . . . . . . . . . . . . . . . . . . . . . . . . . . . . . . . . . . 929.4 Managing Tags . . . . . . . . . . . . . . . . . . . . . . . . . . . . . . . . . . . . . . . . . . . . . . . . . . . . . . . . . . . . . . . . . 93
9.4.1 Sorting Tags . . . . . . . . . . . . . . . . . . . . . . . . . . . . . . . . . . . . . . . . . . . . . . . . . . . . . . . . . . . . 939.4.2 Adding and Removing Tags from Favorites . . . . . . . . . . . . . . . . . . . . . . . . . . . . . . . . . . . . 939.4.3 Viewing and Modifying Tags . . . . . . . . . . . . . . . . . . . . . . . . . . . . . . . . . . . . . . . . . . . . . . . . 94
9.5 Performing Text Searches for Tags . . . . . . . . . . . . . . . . . . . . . . . . . . . . . . . . . . . . . . . . . . . . . . . . . . 949.6 Deleting Tags . . . . . . . . . . . . . . . . . . . . . . . . . . . . . . . . . . . . . . . . . . . . . . . . . . . . . . . . . . . . . . . . . . . 949.7 Associating Tags with Objects . . . . . . . . . . . . . . . . . . . . . . . . . . . . . . . . . . . . . . . . . . . . . . . . . . . . . . 94
9.7.1 Associating Tags with Event Routing Rules . . . . . . . . . . . . . . . . . . . . . . . . . . . . . . . . . . . . 959.7.2 Associating Tags with Event Sources . . . . . . . . . . . . . . . . . . . . . . . . . . . . . . . . . . . . . . . . . 959.7.3 Associating Tags with Collector Managers . . . . . . . . . . . . . . . . . . . . . . . . . . . . . . . . . . . . . 959.7.4 Associating Tags with Event Sources Servers . . . . . . . . . . . . . . . . . . . . . . . . . . . . . . . . . . 959.7.5 Associating Tags with Collector Plug-Ins. . . . . . . . . . . . . . . . . . . . . . . . . . . . . . . . . . . . . . . 959.7.6 Associating Tags with Report Results and Report Definitions. . . . . . . . . . . . . . . . . . . . . . . 96
9.8 Viewing Tagged Events . . . . . . . . . . . . . . . . . . . . . . . . . . . . . . . . . . . . . . . . . . . . . . . . . . . . . . . . . . . 96
10 Viewing Events 97
10.1 Overview . . . . . . . . . . . . . . . . . . . . . . . . . . . . . . . . . . . . . . . . . . . . . . . . . . . . . . . . . . . . . . . . . . . . . . 9710.2 Accessing the Active Views Tab . . . . . . . . . . . . . . . . . . . . . . . . . . . . . . . . . . . . . . . . . . . . . . . . . . . . 9810.3 Reconfiguring Total Display Time . . . . . . . . . . . . . . . . . . . . . . . . . . . . . . . . . . . . . . . . . . . . . . . . . . . 99
Contents 5

6 Con
10.4 Viewing Real-Time Events . . . . . . . . . . . . . . . . . . . . . . . . . . . . . . . . . . . . . . . . . . . . . . . . . . . . . . . . . 9910.5 Managing Events . . . . . . . . . . . . . . . . . . . . . . . . . . . . . . . . . . . . . . . . . . . . . . . . . . . . . . . . . . . . . . . 100
10.5.1 Showing and Hiding Event Details. . . . . . . . . . . . . . . . . . . . . . . . . . . . . . . . . . . . . . . . . . . 10110.5.2 Sending Mail Messages about Events and Incidents . . . . . . . . . . . . . . . . . . . . . . . . . . . . 10110.5.3 Creating Incidents . . . . . . . . . . . . . . . . . . . . . . . . . . . . . . . . . . . . . . . . . . . . . . . . . . . . . . . 10110.5.4 Adding Events to an Incident . . . . . . . . . . . . . . . . . . . . . . . . . . . . . . . . . . . . . . . . . . . . . . . 10210.5.5 Viewing Events That Trigger Correlated Events . . . . . . . . . . . . . . . . . . . . . . . . . . . . . . . . 10210.5.6 Executing Actions on Events . . . . . . . . . . . . . . . . . . . . . . . . . . . . . . . . . . . . . . . . . . . . . . . 10210.5.7 Investigating an Event or Events . . . . . . . . . . . . . . . . . . . . . . . . . . . . . . . . . . . . . . . . . . . . 10310.5.8 Accessing the Active Browser . . . . . . . . . . . . . . . . . . . . . . . . . . . . . . . . . . . . . . . . . . . . . . 10510.5.9 Viewing Advisor Data. . . . . . . . . . . . . . . . . . . . . . . . . . . . . . . . . . . . . . . . . . . . . . . . . . . . . 10610.5.10 Viewing Asset Data . . . . . . . . . . . . . . . . . . . . . . . . . . . . . . . . . . . . . . . . . . . . . . . . . . . . . . 10610.5.11 Viewing Vulnerabilities. . . . . . . . . . . . . . . . . . . . . . . . . . . . . . . . . . . . . . . . . . . . . . . . . . . . 10710.5.12 Viewing User Information. . . . . . . . . . . . . . . . . . . . . . . . . . . . . . . . . . . . . . . . . . . . . . . . . . 10910.5.13 Viewing the Targets . . . . . . . . . . . . . . . . . . . . . . . . . . . . . . . . . . . . . . . . . . . . . . . . . . . . . . 109
10.6 Managing Columns . . . . . . . . . . . . . . . . . . . . . . . . . . . . . . . . . . . . . . . . . . . . . . . . . . . . . . . . . . . . . 10910.7 Taking a Snapshot of a Navigator Window . . . . . . . . . . . . . . . . . . . . . . . . . . . . . . . . . . . . . . . . . . . 110
11 Reporting 111
11.1 Running Reports . . . . . . . . . . . . . . . . . . . . . . . . . . . . . . . . . . . . . . . . . . . . . . . . . . . . . . . . . . . . . . . 11111.2 Viewing the Reports . . . . . . . . . . . . . . . . . . . . . . . . . . . . . . . . . . . . . . . . . . . . . . . . . . . . . . . . . . . . . 114
11.2.1 Viewing the Report Results in PDF . . . . . . . . . . . . . . . . . . . . . . . . . . . . . . . . . . . . . . . . . . 11411.2.2 Drilling Down into Report Results . . . . . . . . . . . . . . . . . . . . . . . . . . . . . . . . . . . . . . . . . . . 11511.2.3 Viewing Report Parameters. . . . . . . . . . . . . . . . . . . . . . . . . . . . . . . . . . . . . . . . . . . . . . . . 115
11.3 Scheduling a Report. . . . . . . . . . . . . . . . . . . . . . . . . . . . . . . . . . . . . . . . . . . . . . . . . . . . . . . . . . . . . 11511.4 Adding Report Definitions . . . . . . . . . . . . . . . . . . . . . . . . . . . . . . . . . . . . . . . . . . . . . . . . . . . . . . . . 116
11.4.1 Extracting Reports from Collector Packs . . . . . . . . . . . . . . . . . . . . . . . . . . . . . . . . . . . . . . 11611.4.2 Adding or Uploading a Report . . . . . . . . . . . . . . . . . . . . . . . . . . . . . . . . . . . . . . . . . . . . . . 117
11.5 Renaming a Report Result . . . . . . . . . . . . . . . . . . . . . . . . . . . . . . . . . . . . . . . . . . . . . . . . . . . . . . . . 11711.6 Marking Report Results as Read or Unread . . . . . . . . . . . . . . . . . . . . . . . . . . . . . . . . . . . . . . . . . . 11811.7 Managing Favorite Reports . . . . . . . . . . . . . . . . . . . . . . . . . . . . . . . . . . . . . . . . . . . . . . . . . . . . . . . 118
11.7.1 Adding Reports as Favorites . . . . . . . . . . . . . . . . . . . . . . . . . . . . . . . . . . . . . . . . . . . . . . . 11811.7.2 Removing Favorite Reports . . . . . . . . . . . . . . . . . . . . . . . . . . . . . . . . . . . . . . . . . . . . . . . . 118
11.8 Exporting Report Definitions and Report Results. . . . . . . . . . . . . . . . . . . . . . . . . . . . . . . . . . . . . . . 11811.8.1 Exporting a Single Report Definition . . . . . . . . . . . . . . . . . . . . . . . . . . . . . . . . . . . . . . . . . 11911.8.2 Exporting Multiple Report Definitions. . . . . . . . . . . . . . . . . . . . . . . . . . . . . . . . . . . . . . . . . 11911.8.3 Exporting All Report Definitions . . . . . . . . . . . . . . . . . . . . . . . . . . . . . . . . . . . . . . . . . . . . . 11911.8.4 Exporting a Report Result . . . . . . . . . . . . . . . . . . . . . . . . . . . . . . . . . . . . . . . . . . . . . . . . . 119
11.9 Deleting Reports . . . . . . . . . . . . . . . . . . . . . . . . . . . . . . . . . . . . . . . . . . . . . . . . . . . . . . . . . . . . . . . 12011.9.1 Deleting a Report Definition. . . . . . . . . . . . . . . . . . . . . . . . . . . . . . . . . . . . . . . . . . . . . . . . 12011.9.2 Deleting Multiple Report Definitions. . . . . . . . . . . . . . . . . . . . . . . . . . . . . . . . . . . . . . . . . . 12011.9.3 Deleting a Report Result . . . . . . . . . . . . . . . . . . . . . . . . . . . . . . . . . . . . . . . . . . . . . . . . . . 12011.9.4 Deleting Multiple Report Results . . . . . . . . . . . . . . . . . . . . . . . . . . . . . . . . . . . . . . . . . . . . 121
12 Configuring Incidents 123
12.1 Accessing Incidents . . . . . . . . . . . . . . . . . . . . . . . . . . . . . . . . . . . . . . . . . . . . . . . . . . . . . . . . . . . . . 12312.2 Creating Incidents . . . . . . . . . . . . . . . . . . . . . . . . . . . . . . . . . . . . . . . . . . . . . . . . . . . . . . . . . . . . . . 12312.3 Managing Incidents . . . . . . . . . . . . . . . . . . . . . . . . . . . . . . . . . . . . . . . . . . . . . . . . . . . . . . . . . . . . . 124
12.3.1 Viewing an Incident . . . . . . . . . . . . . . . . . . . . . . . . . . . . . . . . . . . . . . . . . . . . . . . . . . . . . . 12412.3.2 Attaching Workflows to Incidents. . . . . . . . . . . . . . . . . . . . . . . . . . . . . . . . . . . . . . . . . . . . 12512.3.3 Adding Attachments to Incidents . . . . . . . . . . . . . . . . . . . . . . . . . . . . . . . . . . . . . . . . . . . . 12512.3.4 Adding Notes to Incidents . . . . . . . . . . . . . . . . . . . . . . . . . . . . . . . . . . . . . . . . . . . . . . . . . 12512.3.5 Executing Incident Actions . . . . . . . . . . . . . . . . . . . . . . . . . . . . . . . . . . . . . . . . . . . . . . . . 12512.3.6 E-mailing an Incident . . . . . . . . . . . . . . . . . . . . . . . . . . . . . . . . . . . . . . . . . . . . . . . . . . . . 126
12.4 Adding an Incident View. . . . . . . . . . . . . . . . . . . . . . . . . . . . . . . . . . . . . . . . . . . . . . . . . . . . . . . . . . 126
tents

13 Configuring iTRAC Workflows 127
13.1 Overview . . . . . . . . . . . . . . . . . . . . . . . . . . . . . . . . . . . . . . . . . . . . . . . . . . . . . . . . . . . . . . . . . . . . . 12713.2 Accessing the iTRAC Administration Tools . . . . . . . . . . . . . . . . . . . . . . . . . . . . . . . . . . . . . . . . . . . 12813.3 Using the Template Manager. . . . . . . . . . . . . . . . . . . . . . . . . . . . . . . . . . . . . . . . . . . . . . . . . . . . . . 129
13.3.1 Default Templates . . . . . . . . . . . . . . . . . . . . . . . . . . . . . . . . . . . . . . . . . . . . . . . . . . . . . . . 12913.4 Template Builder Interface . . . . . . . . . . . . . . . . . . . . . . . . . . . . . . . . . . . . . . . . . . . . . . . . . . . . . . . . 13013.5 Creating a Template. . . . . . . . . . . . . . . . . . . . . . . . . . . . . . . . . . . . . . . . . . . . . . . . . . . . . . . . . . . . . 13213.6 Managing Templates . . . . . . . . . . . . . . . . . . . . . . . . . . . . . . . . . . . . . . . . . . . . . . . . . . . . . . . . . . . . 132
13.6.1 Viewing or Editing a Template . . . . . . . . . . . . . . . . . . . . . . . . . . . . . . . . . . . . . . . . . . . . . . 13213.6.2 Copying a Template. . . . . . . . . . . . . . . . . . . . . . . . . . . . . . . . . . . . . . . . . . . . . . . . . . . . . . 13313.6.3 Deleting a Template. . . . . . . . . . . . . . . . . . . . . . . . . . . . . . . . . . . . . . . . . . . . . . . . . . . . . . 133
13.7 Steps . . . . . . . . . . . . . . . . . . . . . . . . . . . . . . . . . . . . . . . . . . . . . . . . . . . . . . . . . . . . . . . . . . . . . . . . 13313.7.1 Start Step. . . . . . . . . . . . . . . . . . . . . . . . . . . . . . . . . . . . . . . . . . . . . . . . . . . . . . . . . . . . . . 13313.7.2 Manual Steps. . . . . . . . . . . . . . . . . . . . . . . . . . . . . . . . . . . . . . . . . . . . . . . . . . . . . . . . . . . 13413.7.3 Decision Steps. . . . . . . . . . . . . . . . . . . . . . . . . . . . . . . . . . . . . . . . . . . . . . . . . . . . . . . . . . 13513.7.4 Mail Steps . . . . . . . . . . . . . . . . . . . . . . . . . . . . . . . . . . . . . . . . . . . . . . . . . . . . . . . . . . . . . 13513.7.5 Command Steps . . . . . . . . . . . . . . . . . . . . . . . . . . . . . . . . . . . . . . . . . . . . . . . . . . . . . . . . 13513.7.6 Activity Steps . . . . . . . . . . . . . . . . . . . . . . . . . . . . . . . . . . . . . . . . . . . . . . . . . . . . . . . . . . . 13613.7.7 End Step . . . . . . . . . . . . . . . . . . . . . . . . . . . . . . . . . . . . . . . . . . . . . . . . . . . . . . . . . . . . . . 137
13.8 Adding Steps to a Workflow . . . . . . . . . . . . . . . . . . . . . . . . . . . . . . . . . . . . . . . . . . . . . . . . . . . . . . . 13713.8.1 Adding a Step from the Step Palette . . . . . . . . . . . . . . . . . . . . . . . . . . . . . . . . . . . . . . . . . 13713.8.2 Adding a Step in the Process Builder . . . . . . . . . . . . . . . . . . . . . . . . . . . . . . . . . . . . . . . . 13713.8.3 Adding an Activity Step . . . . . . . . . . . . . . . . . . . . . . . . . . . . . . . . . . . . . . . . . . . . . . . . . . . 13813.8.4 Adding an End Step. . . . . . . . . . . . . . . . . . . . . . . . . . . . . . . . . . . . . . . . . . . . . . . . . . . . . . 138
13.9 Managing Steps . . . . . . . . . . . . . . . . . . . . . . . . . . . . . . . . . . . . . . . . . . . . . . . . . . . . . . . . . . . . . . . . 13813.9.1 Copying a Step . . . . . . . . . . . . . . . . . . . . . . . . . . . . . . . . . . . . . . . . . . . . . . . . . . . . . . . . . 13813.9.2 Modifying a Step . . . . . . . . . . . . . . . . . . . . . . . . . . . . . . . . . . . . . . . . . . . . . . . . . . . . . . . . 13913.9.3 Editing a Manual Step . . . . . . . . . . . . . . . . . . . . . . . . . . . . . . . . . . . . . . . . . . . . . . . . . . . . 13913.9.4 Editing a Decision Step . . . . . . . . . . . . . . . . . . . . . . . . . . . . . . . . . . . . . . . . . . . . . . . . . . . 13913.9.5 Editing a Mail Step. . . . . . . . . . . . . . . . . . . . . . . . . . . . . . . . . . . . . . . . . . . . . . . . . . . . . . . 14013.9.6 Editing a Command Step. . . . . . . . . . . . . . . . . . . . . . . . . . . . . . . . . . . . . . . . . . . . . . . . . . 14013.9.7 Deleting a Step . . . . . . . . . . . . . . . . . . . . . . . . . . . . . . . . . . . . . . . . . . . . . . . . . . . . . . . . . 140
13.10 Transitions . . . . . . . . . . . . . . . . . . . . . . . . . . . . . . . . . . . . . . . . . . . . . . . . . . . . . . . . . . . . . . . . . . . . 14113.10.1 Unconditional Transitions . . . . . . . . . . . . . . . . . . . . . . . . . . . . . . . . . . . . . . . . . . . . . . . . . 14213.10.2 Conditional Transitions . . . . . . . . . . . . . . . . . . . . . . . . . . . . . . . . . . . . . . . . . . . . . . . . . . . 14213.10.3 Creating an Expression . . . . . . . . . . . . . . . . . . . . . . . . . . . . . . . . . . . . . . . . . . . . . . . . . . . 14313.10.4 Else Transitions . . . . . . . . . . . . . . . . . . . . . . . . . . . . . . . . . . . . . . . . . . . . . . . . . . . . . . . . . 14413.10.5 Timeout Transitions . . . . . . . . . . . . . . . . . . . . . . . . . . . . . . . . . . . . . . . . . . . . . . . . . . . . . . 14513.10.6 Alert Transitions. . . . . . . . . . . . . . . . . . . . . . . . . . . . . . . . . . . . . . . . . . . . . . . . . . . . . . . . . 14513.10.7 Error Transition . . . . . . . . . . . . . . . . . . . . . . . . . . . . . . . . . . . . . . . . . . . . . . . . . . . . . . . . . 14613.10.8 Managing Transitions . . . . . . . . . . . . . . . . . . . . . . . . . . . . . . . . . . . . . . . . . . . . . . . . . . . . 147
13.11 Activities . . . . . . . . . . . . . . . . . . . . . . . . . . . . . . . . . . . . . . . . . . . . . . . . . . . . . . . . . . . . . . . . . . . . . . 14813.11.1 Incident Command Activity . . . . . . . . . . . . . . . . . . . . . . . . . . . . . . . . . . . . . . . . . . . . . . . . 14813.11.2 Incident Internal Activity . . . . . . . . . . . . . . . . . . . . . . . . . . . . . . . . . . . . . . . . . . . . . . . . . . . 14813.11.3 Incident Composite Activity . . . . . . . . . . . . . . . . . . . . . . . . . . . . . . . . . . . . . . . . . . . . . . . . 149
13.12 Creating iTRAC Activities. . . . . . . . . . . . . . . . . . . . . . . . . . . . . . . . . . . . . . . . . . . . . . . . . . . . . . . . . 14913.13 Managing Activities . . . . . . . . . . . . . . . . . . . . . . . . . . . . . . . . . . . . . . . . . . . . . . . . . . . . . . . . . . . . . 150
13.13.1 Editing an Activity . . . . . . . . . . . . . . . . . . . . . . . . . . . . . . . . . . . . . . . . . . . . . . . . . . . . . . . 15013.13.2 Exporting an Activity . . . . . . . . . . . . . . . . . . . . . . . . . . . . . . . . . . . . . . . . . . . . . . . . . . . . . 15013.13.3 Importing an Activity . . . . . . . . . . . . . . . . . . . . . . . . . . . . . . . . . . . . . . . . . . . . . . . . . . . . . 150
13.14 Managing iTRAC Roles . . . . . . . . . . . . . . . . . . . . . . . . . . . . . . . . . . . . . . . . . . . . . . . . . . . . . . . . . . 15113.14.1 Adding a Role . . . . . . . . . . . . . . . . . . . . . . . . . . . . . . . . . . . . . . . . . . . . . . . . . . . . . . . . . . 15113.14.2 Deleting a Role . . . . . . . . . . . . . . . . . . . . . . . . . . . . . . . . . . . . . . . . . . . . . . . . . . . . . . . . . 15113.14.3 Viewing the Role Details . . . . . . . . . . . . . . . . . . . . . . . . . . . . . . . . . . . . . . . . . . . . . . . . . . 151
13.15 Process Management . . . . . . . . . . . . . . . . . . . . . . . . . . . . . . . . . . . . . . . . . . . . . . . . . . . . . . . . . . . 15213.15.1 Instantiating a Process . . . . . . . . . . . . . . . . . . . . . . . . . . . . . . . . . . . . . . . . . . . . . . . . . . . 15213.15.2 Automatic Step Execution . . . . . . . . . . . . . . . . . . . . . . . . . . . . . . . . . . . . . . . . . . . . . . . . . 152
Contents 7
8 Con
13.15.3 Manual Step Execution . . . . . . . . . . . . . . . . . . . . . . . . . . . . . . . . . . . . . . . . . . . . . . . . . . . 15313.15.4 Display Status . . . . . . . . . . . . . . . . . . . . . . . . . . . . . . . . . . . . . . . . . . . . . . . . . . . . . . . . . . 15313.15.5 Displaying the Status of a Process . . . . . . . . . . . . . . . . . . . . . . . . . . . . . . . . . . . . . . . . . . 15313.15.6 Changing Views in Process Manager . . . . . . . . . . . . . . . . . . . . . . . . . . . . . . . . . . . . . . . . 15413.15.7 Starting or Terminating a Process . . . . . . . . . . . . . . . . . . . . . . . . . . . . . . . . . . . . . . . . . . . 154
14 Managing Work Items 157
14.1 Overview . . . . . . . . . . . . . . . . . . . . . . . . . . . . . . . . . . . . . . . . . . . . . . . . . . . . . . . . . . . . . . . . . . . . . 15714.2 Understanding the Work Item Summary Interface . . . . . . . . . . . . . . . . . . . . . . . . . . . . . . . . . . . . . . 15714.3 Viewing a Work Item . . . . . . . . . . . . . . . . . . . . . . . . . . . . . . . . . . . . . . . . . . . . . . . . . . . . . . . . . . . . 15814.4 Processing a Work Item . . . . . . . . . . . . . . . . . . . . . . . . . . . . . . . . . . . . . . . . . . . . . . . . . . . . . . . . . . 15914.5 Managing Work Items Of Other Users . . . . . . . . . . . . . . . . . . . . . . . . . . . . . . . . . . . . . . . . . . . . . . . 159
A Search Query Syntax 161
A.1 Basic Search Query . . . . . . . . . . . . . . . . . . . . . . . . . . . . . . . . . . . . . . . . . . . . . . . . . . . . . . . . . . . . . 161A.1.1 Case Insensitivity. . . . . . . . . . . . . . . . . . . . . . . . . . . . . . . . . . . . . . . . . . . . . . . . . . . . . . . . 162A.1.2 Special Characters . . . . . . . . . . . . . . . . . . . . . . . . . . . . . . . . . . . . . . . . . . . . . . . . . . . . . . 162A.1.3 Operators. . . . . . . . . . . . . . . . . . . . . . . . . . . . . . . . . . . . . . . . . . . . . . . . . . . . . . . . . . . . . . 162A.1.4 The Default Search Field . . . . . . . . . . . . . . . . . . . . . . . . . . . . . . . . . . . . . . . . . . . . . . . . . . 163A.1.5 Tokenized Fields . . . . . . . . . . . . . . . . . . . . . . . . . . . . . . . . . . . . . . . . . . . . . . . . . . . . . . . . 164A.1.6 Non-Tokenized Fields . . . . . . . . . . . . . . . . . . . . . . . . . . . . . . . . . . . . . . . . . . . . . . . . . . . . 166
A.2 Wildcards in Search Queries . . . . . . . . . . . . . . . . . . . . . . . . . . . . . . . . . . . . . . . . . . . . . . . . . . . . . . 166A.2.1 Wildcards in Tokenized Fields . . . . . . . . . . . . . . . . . . . . . . . . . . . . . . . . . . . . . . . . . . . . . . 167A.2.2 Quoted Wildcards . . . . . . . . . . . . . . . . . . . . . . . . . . . . . . . . . . . . . . . . . . . . . . . . . . . . . . . 167A.2.3 Leading Wildcards . . . . . . . . . . . . . . . . . . . . . . . . . . . . . . . . . . . . . . . . . . . . . . . . . . . . . . . 167
A.3 The notnull Query. . . . . . . . . . . . . . . . . . . . . . . . . . . . . . . . . . . . . . . . . . . . . . . . . . . . . . . . . . . . . . . 168A.4 Tags in Search Queries . . . . . . . . . . . . . . . . . . . . . . . . . . . . . . . . . . . . . . . . . . . . . . . . . . . . . . . . . . 168A.5 Range Queries . . . . . . . . . . . . . . . . . . . . . . . . . . . . . . . . . . . . . . . . . . . . . . . . . . . . . . . . . . . . . . . . . 169A.6 IP Addresses Query . . . . . . . . . . . . . . . . . . . . . . . . . . . . . . . . . . . . . . . . . . . . . . . . . . . . . . . . . . . . . 169
A.6.1 CIDR Notation . . . . . . . . . . . . . . . . . . . . . . . . . . . . . . . . . . . . . . . . . . . . . . . . . . . . . . . . . . 169A.6.2 Wildcards in IP Addresses. . . . . . . . . . . . . . . . . . . . . . . . . . . . . . . . . . . . . . . . . . . . . . . . . 170
B Correlation Rule Expression Syntax 171
B.1 Event Fields . . . . . . . . . . . . . . . . . . . . . . . . . . . . . . . . . . . . . . . . . . . . . . . . . . . . . . . . . . . . . . . . . . . 171B.2 Event Operations . . . . . . . . . . . . . . . . . . . . . . . . . . . . . . . . . . . . . . . . . . . . . . . . . . . . . . . . . . . . . . 172
B.2.1 Filter Operation . . . . . . . . . . . . . . . . . . . . . . . . . . . . . . . . . . . . . . . . . . . . . . . . . . . . . . . . . 172B.2.2 Trigger Operation. . . . . . . . . . . . . . . . . . . . . . . . . . . . . . . . . . . . . . . . . . . . . . . . . . . . . . . . 175B.2.3 Window Operation . . . . . . . . . . . . . . . . . . . . . . . . . . . . . . . . . . . . . . . . . . . . . . . . . . . . . . . 176B.2.4 Gate Operation . . . . . . . . . . . . . . . . . . . . . . . . . . . . . . . . . . . . . . . . . . . . . . . . . . . . . . . . . 178B.2.5 Sequence Operation . . . . . . . . . . . . . . . . . . . . . . . . . . . . . . . . . . . . . . . . . . . . . . . . . . . . . 178
B.3 Operators . . . . . . . . . . . . . . . . . . . . . . . . . . . . . . . . . . . . . . . . . . . . . . . . . . . . . . . . . . . . . . . . . . . . . 179B.3.1 Flow Operator . . . . . . . . . . . . . . . . . . . . . . . . . . . . . . . . . . . . . . . . . . . . . . . . . . . . . . . . . . 179B.3.2 Union Operator . . . . . . . . . . . . . . . . . . . . . . . . . . . . . . . . . . . . . . . . . . . . . . . . . . . . . . . . . 179B.3.3 Intersection Operator . . . . . . . . . . . . . . . . . . . . . . . . . . . . . . . . . . . . . . . . . . . . . . . . . . . . . 180
B.4 Order of Operators . . . . . . . . . . . . . . . . . . . . . . . . . . . . . . . . . . . . . . . . . . . . . . . . . . . . . . . . . . . . . . 180
tents

About This Guide
This guide explains how to use Sentinel to standardize, prioritize, and analyze the data that Sentinel gathers so you can make threat, risk and policy related decisions.
Audience
This guide is intended for information security professionals.
Feedback
We want to hear your comments and suggestions about this manual and the other documentation included with this product. Please use the User Comments feature at the bottom of each page of the online documentation.
Documentation Updates
For the most recent version of the NetIQ Sentinel 7.0.1 User Guide, visit the Sentinel documentation Web site (http://www.novell.com/documentation/sentinel70).
Additional Documentation
Sentinel technical documentation is broken down into several different volumes. They are:
Sentinel Quick Start Guide (http://www.novell.com/documentation/sentinel70/s701_quickstart/data/s701_quickstart.html)
Sentinel Installation Guide (http://www.novell.com/documentation/sentinel70/s701_install/data/bookinfo.html)
Sentinel Administration Guide (http://www.novell.com/documentation/sentinel70/s701_admin/data/bookinfo.html)
Sentinel Overview Guide (http://www.novell.com/documentation/sentinel70/s701_overview/data/bookinfo.html)
Sentinel Link Overview Guide (http://www.novell.com/documentation/sentinel70/sentinel_link_overview/data/bookinfo.html)
Sentinel Internal Audit Events (http://www.novell.com/documentation/sentinel70/s701_auditevents/data/bookinfo.html)
Sentinel SDK (http://www.novell.com/developer/develop_to_sentinel.html)
The Sentinel SDK site provides information about building your own plug‐ins.
Contacting Novell and NetIQ
Sentinel is now a NetIQ product, but Novell still handles many support functions.
Novell Web site (http://www.novell.com)
About This Guide 9
NetIQ Web site (http://www.netiq.com)
Technical Support (http://support.novell.com/contact/getsupport.html?sourceidint=suplnav4_phonesup)
Self Support (http://support.novell.com/support_options.html?sourceidint=suplnav_supportprog)
Patch download site (http://download.novell.com/index.jsp)
Sentinel Community Support Forums (http://forums.novell.com/netiq/netiq‐product‐discussion‐forums/sentinel/)
Sentinel TIDs (http://support.novell.com/products/sentinel)
Sentinel Plug‐in Web site (http://support.novell.com/products/sentinel/secure/sentinel61.html)
Notification Email List: Sign up through the Sentinel Plug‐in Web site
Contacting Sales Support
For questions about products, pricing, and capabilities, please contact your local partner. If you cannot contact your partner, please contact our Sales Support team.
Worldwide: NetIQ Office Locations (http://www.netiq.com/about_netiq/officelocations.asp)
United States and Canada: 888‐323‐6768
Email: [email protected]
Web site: www.netiq.com
10 NetIQ Sentinel 7.0.1 User Guide

1 1Introduction to the Sentinel Interface
Sentinel is a Security Information and Event Management (SIEM) solution that receives information from many sources throughout an enterprise, standardizes it, prioritizes it, and presents it to you to make threat, risk, and policy decisions.
There are different tools to help you take advantage of all of the features Sentinel has to offer: You must have necessary permissions to access these tools.
Section 1.1, “Sentinel Web Interface,” on page 11
Section 1.2, “Sentinel Control Center,” on page 11
Section 1.3, “Solution Designer,” on page 11
1.1 Sentinel Web InterfaceThe Sentinel Web interface is the main user interface for viewing and interacting with Sentinel data.
For more information about the user interface and its options, see “Sentinel Web Interface” in the NetIQ Sentinel 7.0.1 Administration Guide.
1.2 Sentinel Control CenterSentinel presents the collected data in the Sentinel Web interface as well as the Sentinel Control Center (SCC). For more information on the Sentinel Control Center, see “Sentinel Control Center” in the NetIQ Sentinel 7.0.1 Administration Guide.
1.3 Solution DesignerYou can use the Solution Designer to package and export different contents, such as a Correlation rule with associated actions and dynamic lists. For more information on Solution Designer, see “Solution Designer” in the NetIQ Sentinel 7.0.1 Administration Guide.
Introduction to the Sentinel Interface 11

12 NetIQ Sentinel 7.0.1 User Guide

2 2Searching Events
Sentinel provides an option to perform a search on events.You can search the local data in the flat files format in the /data directory or the stored data in compressed format at the configured networked storage location.With the necessary configuration, you can also search system events generated by Sentinel, and view the raw data for each event. By default, events are returned in a reverse chronological order. This sort order relates to how the events are stored in the file system partitions.
You can also search Sentinel servers that are distributed across different geographic locations. For more information, see “Searching and Reporting Events in a Distributed Environment”in the NetIQ Sentinel 7.0.1 Administration Guide.
Section 2.1, “Running an Event Search,” on page 13
Section 2.2, “Viewing Search Results,” on page 15
Section 2.3, “Refining Search Results,” on page 18
Section 2.4, “Saving a Search Query,” on page 20
Section 2.5, “Performing Event Operations,” on page 24
2.1 Running an Event SearchBy default, the search results include all events generated by the Sentinel system operations. These events are tagged with the Sentinel tag. If no query is specified and you click Search for the first time after the Sentinel installation, the default search returns all events with severity 3 to 5. Otherwise, the Search feature reuses the last specified search query.
To search for a value in a specific field, use the ID of the event name, a colon, and the value. For example, to search for an authentication attempt to Sentinel by user2, use the following text in the search field:
evt:LoginUser AND sun:user2
An advanced search can narrow the search for a value to a specific event field. The advanced search criteria are based on the event IDs for each event field and the search logic for the index. Advanced searches can include the product name, severity, source IP, and the event type. For example:
pn:NMAS AND sev:5
This searches for events with the product name NMAS and severity five.
sip:10.0.0.01 AND evt:“Set Password”
This searches for the initiator IP address 10.0.0.1 and a “Set Password” event.
Multiple advanced search criteria can be combined by using various operators. The advanced search criteria syntax is modeled on the search criteria for the Apache Lucene open source package. For more information on building search criteria, see Appendix A, “Search Query Syntax,” on page 161.
Searching Events 13

To perform a search:
1 Log in to the Sentinel Web interface:
https://<IP_Address/DNS_Sentinel_server:8443>
IP_Address/DNS_Sentinel_server is the IP address or the DNS name of the Sentinel server and 8443 is the default port for the Sentinel server.
2 Click New Search.
3 You can perform a search by using any of the following:
Search criteria: Specify the search criteria in the Search field.
For information on creating search criteria, see Appendix A, “Search Query Syntax,” on page 161.
Search history: Select a search criterion from the search history. As you specify the search criteria in the Search field, the closely matched search expressions appear in the recently used search expression list. The search history displays a maximum of 15 search expressions.
Tags: You can search events that have a particular tag by using the Tag icon. Click , select the tags, then click OK.
Filters: You can reuse existing filters to perform a new search by using the Filter icon. Click
, select the filter, then click Search.
4 (Optional) Select a time period for the search.
The default is Last 1 hour.
Custom allows you to select a start date and time and an end date and time for the query. The start date should be earlier than the end date, and the time is based on the machine’s local time.
Whenever searches all available data, without any time constraints.
5 (Optional) If you have administrator privileges, you can select other Sentinel servers for the search.
If you have distributed search configured, you can perform a search on other Sentinel servers. For more information, see “Searching and Reporting Events in a Distributed Environment” in the NetIQ Sentinel 7.0.1 Administration Guide.
6 Click Search.
A spinning icon indicates that the search process is being performed.
The search results are displayed. For information on the search results, see Section 2.2, “Viewing Search Results,” on page 15.
7 (Optional) Modify the search criteria by selecting the desired event fields in the search results.
To add an AND condition to the existing criteria, left‐click the event field.
To add a NOT condition, Alt+left‐click the event field.
8 Click Search.
9 (Conditional) To save the search query, see Section 2.4, “Saving a Search Query,” on page 20.
14 NetIQ Sentinel 7.0.1 User Guide
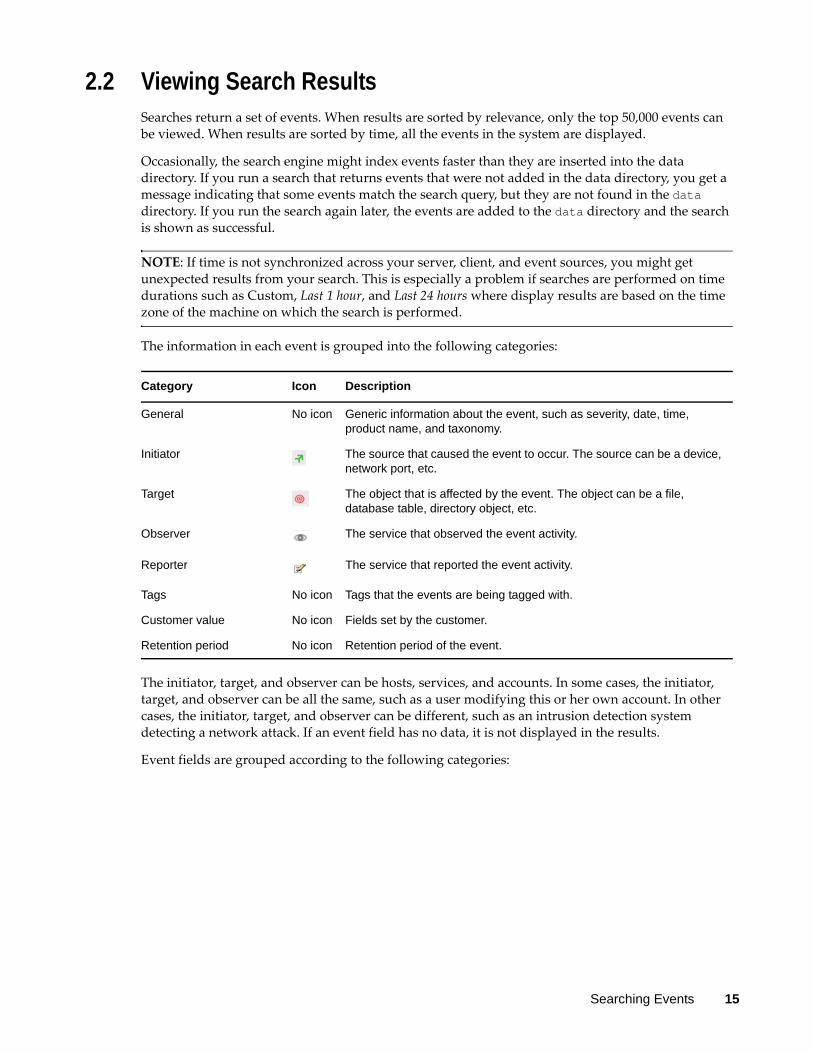
2.2 Viewing Search ResultsSearches return a set of events. When results are sorted by relevance, only the top 50,000 events can be viewed. When results are sorted by time, all the events in the system are displayed.
Occasionally, the search engine might index events faster than they are inserted into the data directory. If you run a search that returns events that were not added in the data directory, you get a message indicating that some events match the search query, but they are not found in the data directory. If you run the search again later, the events are added to the data directory and the search is shown as successful.
NOTE: If time is not synchronized across your server, client, and event sources, you might get unexpected results from your search. This is especially a problem if searches are performed on time durations such as Custom, Last 1 hour, and Last 24 hours where display results are based on the time zone of the machine on which the search is performed.
The information in each event is grouped into the following categories:
The initiator, target, and observer can be hosts, services, and accounts. In some cases, the initiator, target, and observer can be all the same, such as a user modifying this or her own account. In other cases, the initiator, target, and observer can be different, such as an intrusion detection system detecting a network attack. If an event field has no data, it is not displayed in the results.
Event fields are grouped according to the following categories:
Category Icon Description
General No icon Generic information about the event, such as severity, date, time, product name, and taxonomy.
Initiator The source that caused the event to occur. The source can be a device, network port, etc.
Target The object that is affected by the event. The object can be a file, database table, directory object, etc.
Observer The service that observed the event activity.
Reporter The service that reported the event activity.
Tags No icon Tags that the events are being tagged with.
Customer value No icon Fields set by the customer.
Retention period No icon Retention period of the event.
Searching Events 15
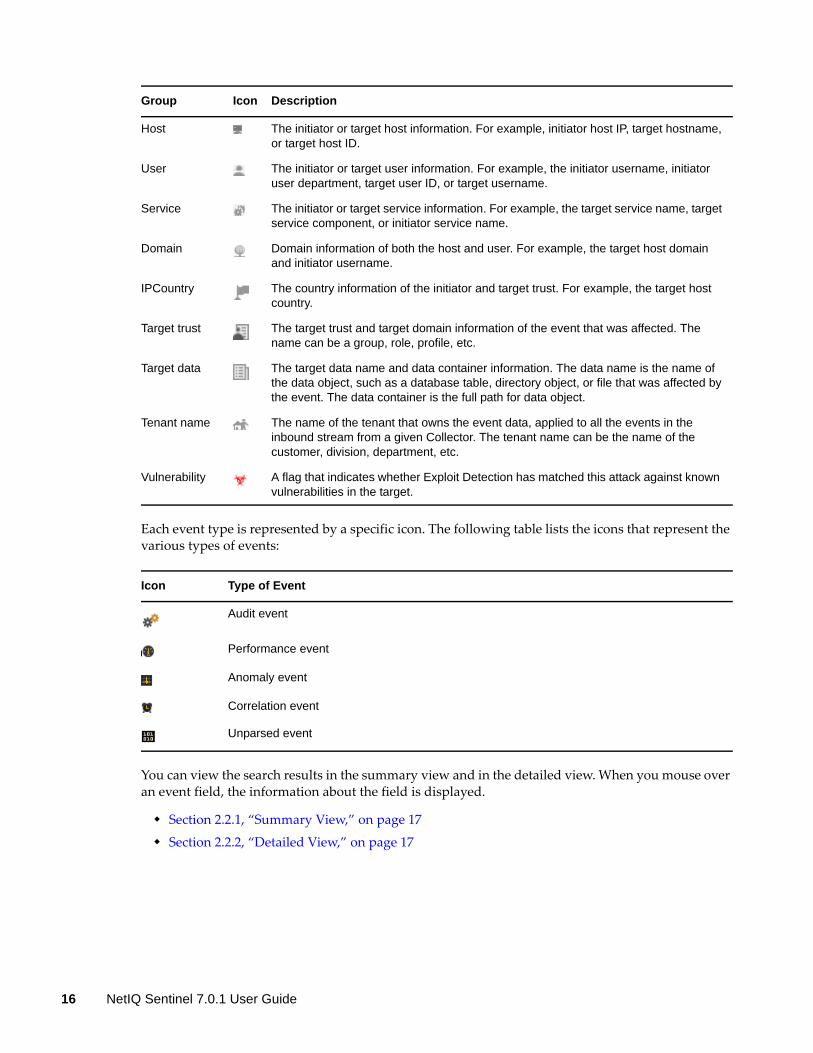
Each event type is represented by a specific icon. The following table lists the icons that represent the various types of events:
You can view the search results in the summary view and in the detailed view. When you mouse over an event field, the information about the field is displayed.
Section 2.2.1, “Summary View,” on page 17
Section 2.2.2, “Detailed View,” on page 17
Group Icon Description
Host The initiator or target host information. For example, initiator host IP, target hostname, or target host ID.
User The initiator or target user information. For example, the initiator username, initiator user department, target user ID, or target username.
Service The initiator or target service information. For example, the target service name, target service component, or initiator service name.
Domain Domain information of both the host and user. For example, the target host domain and initiator username.
IPCountry The country information of the initiator and target trust. For example, the target host country.
Target trust The target trust and target domain information of the event that was affected. The name can be a group, role, profile, etc.
Target data The target data name and data container information. The data name is the name of the data object, such as a database table, directory object, or file that was affected by the event. The data container is the full path for data object.
Tenant name The name of the tenant that owns the event data, applied to all the events in the inbound stream from a given Collector. The tenant name can be the name of the customer, division, department, etc.
Vulnerability A flag that indicates whether Exploit Detection has matched this attack against known vulnerabilities in the target.
Icon Type of Event
Audit event
Performance event
Anomaly event
Correlation event
Unparsed event
16 NetIQ Sentinel 7.0.1 User Guide
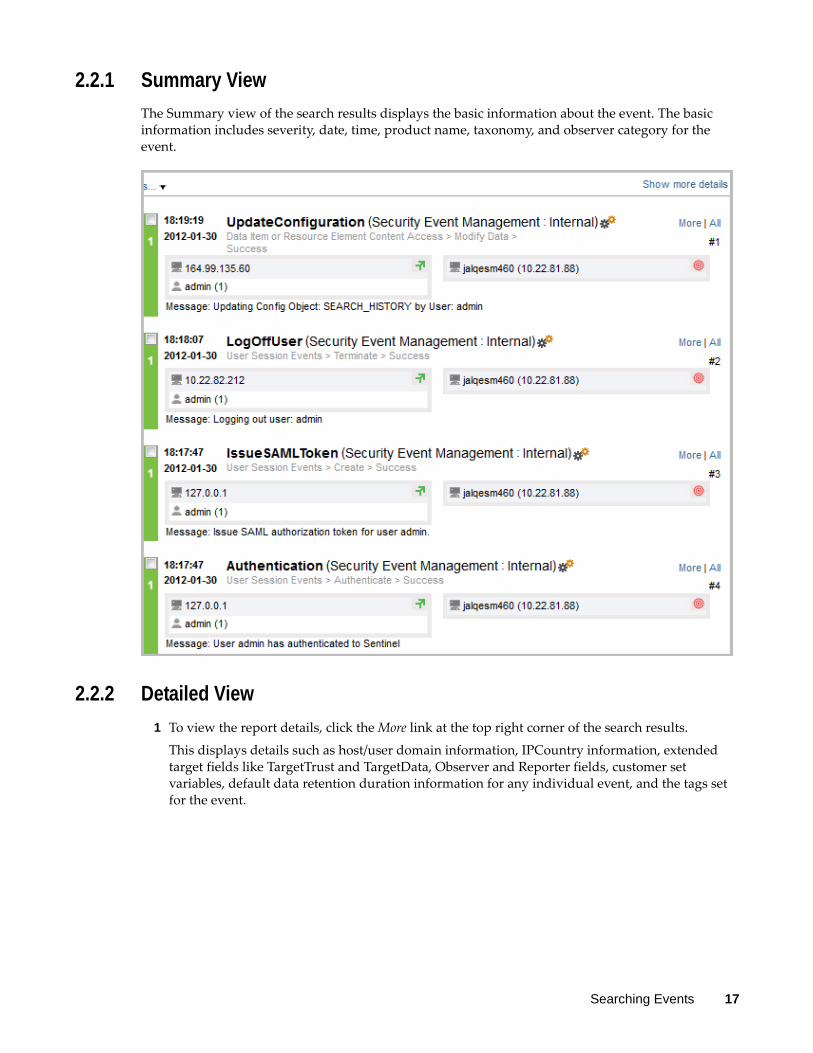
2.2.1 Summary View
The Summary view of the search results displays the basic information about the event. The basic information includes severity, date, time, product name, taxonomy, and observer category for the event.
2.2.2 Detailed View
1 To view the report details, click the More link at the top right corner of the search results.
This displays details such as host/user domain information, IPCountry information, extended target fields like TargetTrust and TargetData, Observer and Reporter fields, customer set variables, default data retention duration information for any individual event, and the tags set for the event.
Searching Events 17

2 To view all the details of an event, click the All link.
3 To view details about all events, click the Show more details link at the top of the search results page.
You can expand or collapse the details for all events on a page by using the Show more details or Show less details link.
4 (Optional) Click the get raw data link to open a new Raw Data tab with event source hierarchy and event source fields populated, based on the information received from the event.
The get raw data link is available only for users in the administrator role.
If the search result is a system or an internal event, the get raw data link does not appear.
To verify and download the raw data files, see “Verifying and Downloading Raw Data Files” in the NetIQ Sentinel 7.0.1 Administration Guide.
2.3 Refining Search ResultsThe search refinement panel can be used to narrow the search results by selecting one or more values for an event field. You can refine the results for one or more event fields.
The set of event fields that is displayed in the search refinement panel is configurable on a per‐user basis.
18 NetIQ Sentinel 7.0.1 User Guide
For performance considerations, the maximum sample size used to calculate the event field value statistics is 50,000 events. The actual sample size is displayed in the field count label as Field counts based on the first <sample-size> events where <sample-size> is replaced by the actual sampling size.
To refine search results:
1 Log in to the Sentinel Web interface.
https://<IP_Address/DNS_Sentinel_server:8443>
IP_Address/DNS_Sentinel_server is the IP address or the DNS name of the Sentinel server and 8443 is the default port for the Sentinel server.
2 Click New Search.
3 Specify the search criteria, then click Search.
For more information on how to run an event search, see “Running an Event Search” on page 13.
4 Click fields in the REFINE section.The Select Event Fields window is displayed.
5 To refine the search, select the event fields from the available fields, then click Save.
The selected event fields are displayed in the REFINE panel.
A count at the right side of each event field displays the number of unique values that exist for that event field in the data directory. The calculation is based on the first 50,000 events found.
The event field selection is on a per‐user basis. Each user can have a different set of selected event fields.
6 Click each event field to view the unique values for that event field.
For example, if the search results contain events that had severities 1, 2, 5, and 4, the event field is displayed as Severity (4).
The top 10 unique values are initially displayed in the order of most frequent to least frequent.
The value next to the check box represents the unique value for that event field and the value at the far right represents the number of times the value appears in the search result.
If there are multiple unique values occurring the same number of times in a search, the values are sorted by the most recent occurrence of the value.
For example, if events of severity 1 and 4 occurred 34 times in the search results, and an event of severity 4 was logged most recently, the unique value 4 appears at the top of the list.
To display the unique values in the order of least frequent to most frequent, click reverse.
When there are more than 10 unique values, you can view and filter either the top 10 or the bottom 10 unique values. You cannot refine your search on both the conditions at the same time.
In the following scenarios, the number of events returned from a refined search is greater than the number of values listed for an event field:
If the refinement performs a new search with additional terms intersected with the initial search string, such as by using an AND operator, the new search is run against all events in the system, including the result set from the initial search. If new events that came into the system match the refined search, they are shown in the resulting set and the event count is greater than the field value count.
Searching Events 19

If there are more than 50,000 events, the event field statistics are calculated only on the first 50,000 events.
There could be an event field value that occurs 50 times in the first 50,000 events, but it could occur 1,000 times in all other stored events. In this scenario, the displayed value count is 50, but when the search is refined with this value it returns 1,000 events.
7 Click OK.
Selected event field values are listed under the event field in the REFINE panel.
The right panel displays the refined search results, which contain only the selected values.
8 Repeat Step 4 through Step 7 to further refine the search.
9 (Optional) Click clear to clear the selected unique event field values from the REFINE panel and to return to the original search results.
10 (Optional) Click add to search to add the refined search values to the current search tab and to recalculate the search statistics.
If you have already added the event field value to the current search tab, clicking clear does not return to the previous search results.
2.4 Saving a Search QueryYou can save a search query, then repeat it as desired. To save a search query, you must first perform a search. When you are satisfied with the search results, you save the search query.
NOTE: You must have the necessary permission to access the specific options. For example, only users in the Report Administrator role can save the search query as a report template.
Section 2.4.1, “Saving a Search Query as a Filter,” on page 20
Section 2.4.2, “Saving a Search Query as a Report Template,” on page 21
Section 2.4.3, “Saving a Search Query as a Routing Rule,” on page 23
Section 2.4.4, “Saving a Search Query as a Retention Policy,” on page 23
Section 2.4.5, “Creating a Dashboard,” on page 24
2.4.1 Saving a Search Query as a Filter
1 Perform a search, and refine the search results as desired.
For more information, see Section 2.1, “Running an Event Search,” on page 13 and Section 2.3, “Refining Search Results,” on page 18.
2 When you are satisfied with the search results, click , then click Save as new filter.
3 Specify a unique name for the filter and an optional description.
4 In the drop‐down list, select one of the following options to specify the access for this filter:
Private filter: Allows you to make this filter private. Other users cannot view or access this filter.
Share with everyone: Allows you to share this filter with all users.
Share with other users in my role: Allows you to share this filter with users who have the same role as yours.
20 NetIQ Sentinel 7.0.1 User Guide
Share with roles: Allows you to share this filter with users in specific roles. If you select this option, a blank field is displayed where you can specify the roles. As you type the role name, a list of roles is displayed.
Select one or more roles.
NOTE: This option is available only for users in the administrator role.
5 Click Save.
The saved filter is listed in the Filters panel. For more information on filters, see Chapter 3, “Configuring Filters,” on page 29.
2.4.2 Saving a Search Query as a Report Template
You can save the search query as a search report or as a Jasper report.
NOTE: You must have the Manage Reports permission to save the search query as a report template.
“Saving the Search Query as a Search Report” on page 21
“Saving the Query as a Jasper Report” on page 22
Saving the Search Query as a Search Report
1 Perform a search, and refine the search results as desired.
For more information, see Section 2.1, “Running an Event Search,” on page 13 and Section 2.3, “Refining Search Results,” on page 18.
2 When you are satisfied with the search results, click , then click Save as report.
3 Specify the following information:
Report Name: Specify a unique name for the report template.
Report Type: Select Event List to save the report in the search report format.
4 Specify the following information in the Default Report Result Parameters section:
Name: Specify a unique name for the report.
Email To: To e‐mail the report template to others, specify the e‐mail address. To send the report template to more than one person, specify multiple e‐mail addresses separated by a comma.
Targets: Displays the number of servers that will be searched for events. This option is useful if distributed search is enabled. To select the targets you want to search, click selected targets, then select the targets.
Event Limits: Specify the number of results to be stored in the report template. By default, 1000 results are stored in a report template.
5 (Optional) To generate report results immediately after you save the report results, select Run this report now using current search query.
6 Click Save to save the report definition.
You can see the saved report definition in the Report Viewer pane in the Sentinel Web interface. To view the reports, see “Viewing the Reports” on page 114.
Searching Events 21

Saving the Query as a Jasper Report
1 Perform a search, and refine the search results as desired.
For more information, see Section 2.1, “Running an Event Search,” on page 13 and Section 2.3, “Refining Search Results,” on page 18.
2 When you are satisfied with the search results, click , then click Save as report.
3 Specify the following information:
Report Name: Specify a unique name for the report template.
Report Type: Select Visualization to save the report in the search report format.
4 Specify any of the following information in the Default Result Parameters field:
Name: Specify a unique name for the report.
Targets: Displays the number of sources that can be searched for events. This option is useful if distributed search is enabled. To select the targets that you want to search, click the selected targets link, then select the targets. This option is available only for users in the administrator role.
Language: Select the language in which the report labels and descriptions should be displayed.
The default value is the language you used when you logged in. If that language is supported by the report. If the report does not support the language, the report’s default language is used.
The data in the report is displayed in the language originally used by the event source.
Date Range: If the report includes time period parameters, select the date range. All time periods are based on the local time of the browser.
Current Day: Select this option to list events from midnight of the current day until 11:59:59 p.m of the current day. If the current time is 8:00:00 a.m, the report shows 8 hours of data.
Previous Day: Select this option to list events from midnight of previous day until 11:59:00 p.m of the previous day.
Week To Date: Select this option to list events from midnight Sunday of the current week until the end of the selected day.
Previous Week: Select this option to list the last seven days of events.
Month to Date: Select this option to list events from midnight the first day of the current month until the end of the selected day.
Previous Month: Select this option to list events of a month, from midnight of the first day of the previous month until 11:59:00 p.m of the last day of the previous month.
Custom Date Range: Select this option to list events for a specific period. If you select this option, you must also specify a start date and an end date.
Email Report To: To e‐mail the report template to someone, specify the e‐mail address. To send the report template to more than one person, specify multiple e‐mail addresses separated by a comma.
Event Limit: Specify the number of event results to be stored in the report template. By default, 1000 results are stored in a report template.
Minimum Severity: Specify the minimum severity value of the events to be displayed. The default value is 0.
22 NetIQ Sentinel 7.0.1 User Guide

Maximum Severity: Specify the maximum severity value of the events to be displayed. The default value is 5.
Preview: Click Preview to view the report before saving.
5 To save the report result along with the report template, click Run this report now using the current search query.
6 Click Save to save the report definition.
You can see the saved report definition in the Report Viewer pane in the Sentinel Web interface. To view the reports, see Section 11.2, “Viewing the Reports,” on page 114.
2.4.3 Saving a Search Query as a Routing Rule
You must be in the administrator role to save the search query as a routing rule.
1 Perform a search, and refine the search results as desired.
For more information, see Section 2.1, “Running an Event Search,” on page 13 and Section 2.3, “Refining Search Results,” on page 18.
2 When you are satisfied with the search results, click , then click Save as routing rule.
3 Specify a name for the rule.
4 (Conditional) To associate one or more tags to the events, click Select a tag, select the desired tags, then click Set.
5 Select where you want to route the events to:
All: Events are routed to all Sentinel services, including Correlation and Security Intelligence.
Event store only: Events are sent directly to the event store, and are not displayed in Active Views and the search results page.
None (drop): Events are dropped or ignored, and are not sent to any Sentinel service.
6 Select one or more actions to be performed on each event that meets the search criteria. Click the plus and minus icons to add and remove actions.
7 Click Save.
2.4.4 Saving a Search Query as a Retention Policy
You must be in the administrator role to save the search query as a retention policy.
1 Perform a search, and refine the search results as desired.
For more information, see Section 2.1, “Running an Event Search,” on page 13 and Section 2.3, “Refining Search Results,” on page 18.
2 When you are satisfied with the search results, click , then click Save as retention policy.
3 Specify a name for the retention policy.
4 In the Keep at least field, specify the minimum number of days to retain the events in the system. The value must be a valid positive integer.
5 (Optional) In the Keep at most field, specify the maximum number of days for which the events should be retained in the system.
Searching Events 23
The value must be a valid positive integer and must be greater than or equal to the Keep at least value. If no value is specified, the system retains the events in the system until the space is available in local storage.
6 Click Save.
The newly created policy is displayed in the data retention table. For more information on retention policies, see “Configuring Data Retention Policies” in the NetIQ Sentinel 7.0.1 Administration Guide.
2.4.5 Creating a Dashboard
You must have the Manage and View Security Intelligence Dashboards permission to create a dashboard.
1 Perform a search, and refine the search results as desired.
For more information, see Section 2.1, “Running an Event Search,” on page 13 and Section 2.3, “Refining Search Results,” on page 18.
2 When you are satisfied with the search results, click , then click Create dashboard from filter.
3 Specify the following information to create the dashboard:
Name: Specify a unique name for the dashboard.
Classifier: Select the classifier that determines the categories displayed in the dashboard. Click the Info link for information on each category.
Data Retention Period: Select how long the data for the dashboard is retained.
4 Click Create dashboard to create the dashboard.
The dashboard is displayed in a new browser tab. A new dashboard is empty because it has not had time to collect any data. For more information on dashboards, see Chapter 5, “Analyzing Trends in Data,” on page 63.
2.5 Performing Event OperationsYou can use the events in the search results to perform various tasks as you view the search results.
Section 2.5.1, “Executing Actions,” on page 25
Section 2.5.2, “Exporting the Search Results to a File,” on page 25
Section 2.5.3, “Adding Events to an Incident,” on page 26
Section 2.5.4, “Creating an Incident,” on page 26
Section 2.5.5, “Adding Events to a Correlation Rule,” on page 27
Section 2.5.6, “Creating a Correlation Rule by Using Events,” on page 27
Section 2.5.7, “Viewing Identity Details of Events,” on page 27
Section 2.5.8, “Viewing Advisor Report,” on page 27
Section 2.5.9, “Viewing Asset Data,” on page 28
Section 2.5.10, “Viewing Vulnerabilities,” on page 28
24 NetIQ Sentinel 7.0.1 User Guide

2.5.1 Executing Actions
Only users in the following roles can execute actions on events:
Administrator
Incident Administrator
Security Policy Administrator
User
To execute actions on events:
1 Perform a search, and refine the search results as desired.
For more information, see Section 2.1, “Running an Event Search,” on page 13 and Section 2.3, “Refining Search Results,” on page 18.
2 In the search results, select the events on which you want to execute actions.
3 Click Event operations > Show action panel.
4 In the Event Actions panel > Actions field, select the desired actions, then click Execute.
The results of the actions are displayed in the Results field. For more information on executing actions, see Chapter 8, “Manually Performing Actions on Events,” on page 87.
2.5.2 Exporting the Search Results to a File
1 Perform a search, and refine the search results as desired.
For more information, see Section 2.1, “Running an Event Search,” on page 13 and Section 2.3, “Refining Search Results,” on page 18.
2 In the search results, select the events you want to export to a file.
3 Click Event operations > Export to file.
4 Specify the following information:
File Name: Specify a name for the file to which you want to export the search results.
Event Limit: Specify the maximum number of events to be saved. The event limit must be less than the number of events you selected and the maximum event limit is 200000.
All the search results are written into a .csv file. These files are then compressed into a .zip file for downloading.
5 (Optional) You can remove the event fields that you do not want to export to the file. Click Choose Fields, then clear the selections for the fields that you do not want to export to the file.
By default, the null fields are excluded and not exported to file.
6 Click Export to export the search result to a file.
A download file dialog box is displayed with an option to open or save the .zip file.
7 Select the desired option, then click OK.
Searching Events 25

2.5.3 Adding Events to an Incident
You must have the View or Create Incidents and Add Events to Incidents permission to add events to incidents.
For more information on Incidents, see Chapter 12, “Configuring Incidents,” on page 123.
1 Perform a search, and refine the search results as desired.
For more information, see Section 2.1, “Running an Event Search,” on page 13 and Section 2.3, “Refining Search Results,” on page 18.
2 In the search results, select the events you want to add to an incident.
3 Click Event Operations > Add to incident.
NOTE: Ensure that incidents are available. If there are no incidents available, then you need to create one. For more information on creating incidents seeSection 2.5.4, “Creating an Incident,” on page 26.
4 Click Search to view all the available incidents.
5 (Optional) To view incidents based on categories, select a category from the GroupBy drop‐down list.
6 Select the incident to which you want to add events.
7 Click OK.
2.5.4 Creating an Incident
You can create an incident from a group of events representing something of interest. For example, group together similar events or group together a set of different events that indicate a pattern of interest such as an attack.
You must have the View or Create Incidents and Add Events to Incidents permission to create incidents.
For more information on Incidents, see Chapter 12, “Configuring Incidents,” on page 123.
To create an incident from events:
1 Perform a search, and refine the search results as desired.
For more information, see Section 2.1, “Running an Event Search,” on page 13 and Section 2.3, “Refining Search Results,” on page 18.
2 In the search results, select the events you want to add to an incident.
3 Click Event operations > Create incident.
4 Use the following information to create the incident:
Title: Specify a title for the incident.
Description: Specify a description of the incident.
Severity: Select the severity of the incident from the drop‐down list.
Priority: Select the priority of the incident from the drop‐down list.
Category: Select the category of the incident from the drop‐down list.
Responsible: Select the user that is responsible to investigate and close the incident.
26 NetIQ Sentinel 7.0.1 User Guide
iTRAC: Select an iTrac workflow to use to manage the incident.
5 Click OK to create the incident.
2.5.5 Adding Events to a Correlation Rule
You must have the Manage Correlation Engine and Rules permission to create a Correlation rule. For more information on creating a Correlation rule by using events, see Section 4.4.5, “Creating Correlation Rules From Search Results,” on page 53.
2.5.6 Creating a Correlation Rule by Using Events
You must have the Manage Correlation Engine and Rules permission to create a Correlation rule. For more information on creating a Correlation rule by using events, see Section 4.4.5, “Creating Correlation Rules From Search Results,” on page 53.
2.5.7 Viewing Identity Details of Events
If Sentinel is integrated with Identity Management systems, you can view the user identity details of events. You must have the View People Browser permission to view the Identity details.
1 Perform a search, and refine the search results as desired.
For more information, see Section 2.1, “Running an Event Search,” on page 13 and Section 2.3, “Refining Search Results,” on page 18.
2 In the search results, select the events for which you want to view the identity details.
3 Click Event operations > Show identity details.
4 Select whether you want to view the identity of the Initiator user, the Target user, or both.
For more information on identity details, see Chapter 7, “Integrating Identity Information with Sentinel Events,” on page 79.
2.5.8 Viewing Advisor Report
The following are the prerequisites to view the Advisor data:
The Advisor feed must be up‐to‐date, processed, and loaded into the Sentinel database.
The selected event must be from a product supported by Advisor and it must have the Vulnerability field value set to 1.
To view the Advisor data:
1 Perform a search, and refine the search results as desired.
For more information, see Section 2.1, “Running an Event Search,” on page 13 and Section 2.3, “Refining Search Results,” on page 18.
2 In the search results, select the events for which you want to view the Advisor data.
3 Click Event operations > View Advisor report.
The Advisor report is displayed in a new tab.
For more information on Advisor, see “Configuring Advisor” in the NetIQ Sentinel 7.0.1 Administration Guide.
Searching Events 27

2.5.9 Viewing Asset Data
You must have the View Asset Data permission to view the asset data of the selected events. You can view the asset information related to a machine or device from which you are receiving events. To view the asset data, you must run the asset management Collector and ensure that the asset data is being added to the Sentinel database.
1 Perform a search, and refine the search results as desired.
For more information, see Section 2.1, “Running an Event Search,” on page 13 and Section 2.3, “Refining Search Results,” on page 18.
2 In the search results, select the events for which you want to view the asset data.
3 Click Event operations > View assets.
The asset data is displayed in a new tab.
For more information on asset data, see Section 10.5.10, “Viewing Asset Data,” on page 106.
2.5.10 Viewing Vulnerabilities
You must have the View asset vulnerability data permission to view the Vulnerability data. You can view the vulnerabilities of the selected destination systems. To view the Vulnerability data, you must run the Vulnerability Collector and ensure that the Vulnerability scan information is being added to the Sentinel database.
Vulnerabilities can be seen for the current time or for the event time.
View Vulnerabilities at current time: This report queries the database for vulnerabilities that are active (effective) at the current date and time, and displays the relevant information.
View Vulnerabilities at time of event: This report queries the database for vulnerabilities that were active (effective) at the date and time of the selected event, and displays the relevant events.
To view the Vulnerability report:
1 Perform a search, and refine the search results as desired.
For more information, see Section 2.1, “Running an Event Search,” on page 13 and Section 2.3, “Refining Search Results,” on page 18.
2 In the search results, select the events for which you want to view the Vulnerability data.
3 (Conditional) To view vulnerabilities at the current time, click Event operations > View Vulnerabilities at current time.
4 (Conditional) To view vulnerabilities at the time of the event, click Event operations > View Vulnerabilities at time of event.
For more information on the vulnerability data, see Section 10.5.11, “Viewing Vulnerabilities,” on page 107.
28 NetIQ Sentinel 7.0.1 User Guide

3 3Configuring Filters
Section 3.1, “Overview,” on page 29
Section 3.2, “Introducing the Filters Interface,” on page 29
Section 3.3, “Creating a Filter,” on page 32
Section 3.4, “Sample Filters,” on page 34
Section 3.5, “Viewing Events by Using Filters,” on page 36
Section 3.6, “Managing Filters,” on page 36
3.1 OverviewThe Filters feature in Sentinel allows you to customize the event search and prevent data overload. This feature provides a Filter Builder that helps you build search queries ranging from simple to complex. You can save a search query as a filter and reuse it as required, so you can perform a search by selecting the filter rather than specifying the query manually every time.
You can reuse filters while using or configuring Sentinel features, such as:
Configuring Data Synchronization. For more information, see “Configuring Data Synchronization” in the NetIQ Sentinel 7.0.1 Administration Guide.
Configuring a Data Retention policy. For more information, see “Configuring Data Retention Policies” in the NetIQ Sentinel 7.0.1 Administration Guide.
Configuring the data visibility settings for a role. For more information, see “Creating a Role” in the NetIQ Sentinel 7.0.1 Administration Guide.
Creating dashboards. For more information, see Section 5.2, “Creating a Dashboard,” on page 66
Configuring event routing rules. For more information, see “Configuring Event Routing Rules” in the NetIQ Sentinel 7.0.1 Administration Guide.
Viewing real‐time events in Active Views. For more information, see Chapter 10, “Viewing Events,” on page 97.
Sentinel provides a list of filters by default. You can also create your own filters.
3.2 Introducing the Filters Interface Section 3.2.1, “Filters Panel,” on page 30
Section 3.2.2, “Filter Builder,” on page 30
Configuring Filters 29

3.2.1 Filters Panel
To access the Filters panel, click Filters in the navigation panel on the left of the Sentinel Web interface. The Filters panel lists the default filters, filters you create, and the filters that other users have shared with you.
The Filters panel includes the following:
Find Filters: Allows you to search the specified filter. Specify the filter name, description of the filter, or keywords to search for a filter.
Create: Launches the filter builder that allows you to specify the filter criteria.
My Filters: Lists the default filters and the filters you created.
Shared Filters: Lists the filters that other users have shared with you.
To view events based on filters, select the desired filter. The associated events are displayed in the search results panel.
3.2.2 Filter Builder
The Filter Builder provides a list of parameters required to build search queries ranging from simple to complex. You can either select the parameters, or you can manually specify the search query.
For information on building search queries, see Appendix A, “Search Query Syntax,” on page 161.
Figure 3-1 Filter Builder
30 NetIQ Sentinel 7.0.1 User Guide

The Filter Builder dialog box includes the following elements:
Table 3-1 Filter Builder Elements
Element Description
Query The behavior of this field depends on the filter creation method you select:
If you select Structured, this field displays the query formed by the parameters you select. You cannot modify or specify the filter query.
If you select Free-form, this field is enabled. You can manually specify the filter query.
Structured Allows you to select the various parameters to build the filter query.
Free-form Allows you to manually specify the filter criteria rather than selecting from the available parameters.
The search query is based on the standard Lucene syntax with some Sentinel extensions. For information on creating a filter query (search query), see Appendix A, “Search Query Syntax,” on page 161.
If this option is selected, the following elements are not displayed:
Event fields
Query fields
Field details
Exclude system events Select this option to exclude Sentinel internal events such as audit events and performance events from the search results.
Event fields Displays a categorized list of possible event fields that can be added to the filter query. Each category can be expanded to display the set of fields in that category. If you know the name of the field you want, specify the name in the Search field. The event category list will adjust to present only matching fields.
For more information on event fields, click Tips located at the top right of the Sentinel Web interface.
Query fields Lists a set of overlay queries that can be used on top of per-field searches. The following fields are displayed by default:
All data: Performs a search across all event fields.
For more information, see Section A.1.4, “The Default Search Field,” on page 163 in Appendix A, “Search Query Syntax,” on page 161.
Tags: Events can be tagged in various ways to help identify relationships between events. Queries that include a “Tags” search will look at the event tags (rv145) for matches.
Taxonomy: Events are also classified using a number of taxonomic categories for the action, outcome, and so forth. Queries that include a “Taxonomy” search will search for specific classes of events.
For more information on taxonomy, see Sentinel Taxonomy.
Configuring Filters 31

3.3 Creating a FilterFilter expressions are simple math expressions and simple evaluations. Filters work on selection sets by matching events against the specified criteria. If the match is TRUE, the event is displayed in Active Views or search results, or passed to other functions. If the match is FALSE, the event is blocked.
For example, consider a search query that is written as follows:
(sip:"10.0.0.1")
Events whose source IP address is 10.0.0.1 are included in the filter.
You must use the event field ID to represent an event name. Click the Tips link on the top right of the Sentinel Web interface for a list of event field names and their IDs.
For more information building search queries, see Appendix A, “Search Query Syntax,” on page 161.
While creating a filter, you can specify whether you want to share a filter with other users. You must have the Share Search Filters permission to share filters with everyone or with users in the same role as yours. If you are a user in the administrator role, you can share filters with users in a different role.
You can create filters either by using the Filter Builder or by using the Save icon in the Search panel.
Section 3.3.1, “Creating a Filter by Using the Filter Builder,” on page 32
Section 3.3.2, “Creating a Filter by Using a Search Query,” on page 33
3.3.1 Creating a Filter by Using the Filter Builder
1 Log in to the Sentinel Web interface.
https://<IP_Address/DNS_Sentinel_server:8443>
Field details The fields in this section vary depending on the event or query fields you select. For example:
For tokenized fields, you can specify the words that you want to include or exclude in the filter criteria. For information on the tokenized and non-tokenized fields, click Tips located at the top right of the Sentinel Web interface.
For non-tokenized fields, you can specify a value or a range of values.
For taxonomy fields, specific taxonomy options are displayed.
For date attributes, a date-time calendar is displayed as you type the date. You can select a date.
For fields that contain internal Sentinel UUIDs, such as the CollectorID field, the corresponding Sentinel object names are displayed and can be selected.
Condition: AND OR Allows you to specify the AND or OR condition between the query fields. These options are available when you add additional event fields to the query fields.
Cancel Allows you to cancel the filter creation process.
Search Runs a search to test the filter before saving it.
Element Description
32 NetIQ Sentinel 7.0.1 User Guide

IP_Address/DNS_Sentinel_server is the IP address or DNS name of the Sentinel server and 8443 is the default port for the Sentinel server.
2 In the navigation panel, click Filters > Create.
3 Select one of the following methods to create a search query:
To build the search query by selecting parameters, make sure that Structured is selected, select the parameters, then continue with Step 4.
For information on these parameters, see Table 3‐1, “Filter Builder Elements,” on page 31.
To manually specify the search query rather than selecting the listed parameters, select Free‐form. In the Query field, specify the search query, then continue with Step 4.
For information on creating a search query, see Appendix A, “Search Query Syntax,” on page 161.
4 (Conditional) If you do not want to include Sentinel internal events in the search, select Exclude system events.
5 Click Search to search events according to the specified filter criteria.
By default, the search is performed on events that were generated within the last 1 hour.
6 Review the search results to verify that the filter is retrieving the expected events.
7 (Optional) You can modify the search query by selecting one or more event field values from the search results, or you can click Edit search filter, then make necessary changes.
8 When you are satisfied with the search results, click , then click Save as new filter.
9 Specify a name for the filter and an optional description.
10 In the drop‐down list, select one of the following options to specify the access for this filter:
Private filter: Allows you to make this filter private. Other users cannot view or access this filter.
Share with everyone: Allows you to share this filter with all users. You must have the Share Search Filters permission.
Share with other users in my role: Allows you to share this filter with users who have the same role as yours. You must have the Share Search Filters permission.
Share with roles: Allows you to share this filter with users of specific roles. When you select this option, a blank field is displayed where you can specify the roles. As you type the role name, a list of roles is displayed.
Select one or more roles. This option to share with roles is available only for users in the administrator role.
11 Click Save.
3.3.2 Creating a Filter by Using a Search Query
You can save a search query as a filter and use this filter to perform searches when required rather than specifying the search query again. For more information on creating a filter by using a search query, see Section 2.4.1, “Saving a Search Query as a Filter,” on page 20.
Configuring Filters 33

3.4 Sample FiltersThis section lists a few examples on how you can create filters.
Section 3.4.1, “View Events of Severity 3 to 5 from a System in China,” on page 34
Section 3.4.2, “Determine if User “Bob Smith” Tried to Log In after His Account was Disabled,” on page 34
Section 3.4.3, “View Events from Two Subnets and Share the Filter with Network Administrators,” on page 35
Section 3.4.4, “Find all Events that Include the Words “database” and “service,” and exclude “test”,” on page 35
3.4.1 View Events of Severity 3 to 5 from a System in China
In the Filter Builder > Event fields, select SourceHostCountry.
For more information on the Filter Builder, see Section 3.2.2, “Filter Builder,” on page 30.
The name should match any string that contains the name “China.” For example, “ChinaBeijing.” Specify china* in the Value field.
The severity of the events must be 3 to 5:
In Event fields, select Severity.
In the Values that range from field, specify 3 TO 5.
NOTE: If you are familiar with the search query syntax, you can directly specify the query in the Query field as follows:
(rv29:china*) AND (sev:[3 TO 5])
For more information on the search query syntax, see Appendix A, “Search Query Syntax,” on page 161.
Click Search to view events that match the specified criteria.
3.4.2 Determine if User “Bob Smith” Tried to Log In after His Account was Disabled
In the Filter Builder > Event fields, select the following:
InitiatorUserName
TargetUserName
EffectiveUserName
For more information, see Section 3.2.2, “Filter Builder,” on page 30.
Select the OR condition.
Specify “Bob Smith” in the Value field.
To determine if the user has logged in, or tried to log in, select Taxonomy in Query fields.
34 NetIQ Sentinel 7.0.1 User Guide
NOTE: You can also select the appropriate event fields if you are familiar with the values to be specified for the event fields. Taxonomy is a classification of events where events of similar type are grouped together. It helps you search events based on the taxonomy classification rather than you specifying the specific event names and their values.
In the Field details, select the following:
From the Class drop‐down list, select User Session Events.
From the Identifier drop‐down list, select Create.
For Outcome, select Success, then select Failure.
NOTE: If you are familiar with the search query syntax, you can directly specify the query in the Query field as follows:
(xdasclass:2 AND xdasid:0 AND (xdasoutcome:0 OR xdasoutcome:1)) AND (iufname:"Bob Smith")
For more information on taxonomy, see Sentinel Taxonomy.
Click Search to view the events that match the specified criteria.
3.4.3 View Events from Two Subnets and Share the Filter with Network Administrators
Select subnets:
In Filter Builder > Event fields, select SourceIP.
In Field details > Value, specify the subnet, for example, 172.17.0.0/16.
Repeat the above two steps to specify another subnet.
The events must be from either of the subnets. Therefore, select OR as the condition.
Click Search to view events that match the specified criteria.
The filter must be shared with network administrators:
In the search results panel, click , then click Save as new filter.
Specify an intuitive name and an optional description.
From the drop‐down list, select Share with roles, then select Network Administrator.
Click Save.
3.4.4 Find all Events that Include the Words “database” and “service,” and exclude “test”
In the Filter Builder > Query fields, select All data.
You want to find events that include words “database” and “service,” and exclude “test.” Therefore, in Field details, specify the following:
In the All of these words field, specify database service.
In the Exclude these words field, specify test.
Configuring Filters 35

NOTE: If you are familiar with the search query syntax, you can directly specify the query in the Query field as follows:
_data:(database AND service) NOT _data:test
The _data field allows you to search for words that might appear in any event field. For more information, see “The Default Search Field” in Appendix A, “Search Query Syntax,” on page 161.
Click Search to view the events that match the specified criteria.
3.5 Viewing Events by Using FiltersYou can use filters to view events either by selecting the desired filter in the Filters panel or by using
the Filter icon in the search results panel. For more information, see Chapter 2, “Searching Events,” on page 13.
3.6 Managing FiltersYou can edit and delete only the filters that you created. The default filters and the filters that other users have shared with you cannot be edited or deleted.
Section 3.6.1, “Editing a Filter,” on page 36
Section 3.6.2, “Deleting a Filter,” on page 37
3.6.1 Editing a Filter
1 In the Sentinel Web interface, select Filters, then select the filter that you want to edit.
The filter criteria are displayed in the search results panel.
2 (Conditional) To edit the filter name, description, or the filter type, click Edit.
The Edit Filter dialog box is displayed.
3 Make the necessary changes, then click OK.
4 (Conditional) To edit the filter criteria, click Edit search filter.
For more information on the criteria you can select, see Section 3.2.2, “Filter Builder,” on page 30.
36 NetIQ Sentinel 7.0.1 User Guide
5 Make the necessary changes, then click Search.
6 Click , then select Save <filter_name> filter.
3.6.2 Deleting a Filter
1 In the Sentinel Web interface, select Filters > My filters, then select the filter that you want to delete.
2 Click .
3 Click Delete to confirm deletion.
Configuring Filters 37

38 NetIQ Sentinel 7.0.1 User Guide
4 4Correlating Event Data
A single event viewed in the system might not necessarily draw your attention. But when you correlate a set of similar or comparable events in a given period, you might identify a potential problem. Sentinel helps you correlate events by using the rules you create and deploy in the Correlation Engine, so you can take appropriate action to mitigate any problems.
Section 4.1, “Overview,” on page 39
Section 4.2, “Accessing the Correlation User Interface,” on page 44
Section 4.3, “Understanding the Correlation Interface,” on page 44
Section 4.4, “Creating Correlation Rules,” on page 49
Section 4.5, “Associating Actions to a Rule,” on page 54
Section 4.6, “Testing a Correlation Rule,” on page 55
Section 4.7, “Sample Correlation Rules,” on page 55
Section 4.8, “Deploying Rules in the Correlation Engine,” on page 57
Section 4.9, “Viewing Correlation Events,” on page 57
Section 4.10, “Managing Correlation Rules,” on page 58
Section 4.11, “Managing the Correlation Engine,” on page 59
4.1 OverviewCorrelation adds intelligence to security event management by automating analysis of the incoming event stream to find patterns of interest. Correlation allows you to define rules that identify critical threats and complex attack patterns so that you can prioritize events and initiate effective incident management and response.
Section 4.1.1, “How Correlation Works,” on page 40
Section 4.1.2, “Correlation Rules,” on page 40
Section 4.1.3, “Correlation Engine,” on page 43
Correlating Event Data 39

4.1.1 How Correlation Works
The following illustration shows how Correlation works:
Figure 4-1 Correlation Workflow
1. A user creates a Correlation rule.
2. The user associates one or more actions to the Correlation rule.
3. The user deploys the rule in the Correlation Engine.
4. The Correlation Engine processes events from the real‐time event stream to determine whether they should trigger any of the active rules to fire the associated actions.
5. If events match the rule criteria, correlation events are generated and associated actions are executed.
Sentinel’s correlation is near real‐time and depends on the time stamp of the individual events. When an event arrives at the Correlation Engine, the engine reorders the events in a buffer based on the event time stamp (dt) field so that the events are evaluated in time order. This is done partly to evaluate sequence rules in which the rule only fires if events occur in a specific order.
The buffer is 30 seconds long, so if the event time stamp (dt) is more than 30 seconds older than the Collector Manager time stamp, the event is not evaluated. To minimize false time differences, you must use an NTP (Network Time Protocol) server to synchronize the time settings on the relevant machines. For more information, see “Configuring Time” in the NetIQ Sentinel 7.0.1 Installation and Configuration Guide.
4.1.2 Correlation Rules
Correlation rules define a pattern of events that should trigger a rule. You can create rules that range from simple to extremely complex. For example:
High severity event from a finance server
High severity event from any server brought online in the past 10 days
321
Message Bus
Deploy in Correlation Engine
Actions are executed
Rulesfire
Correlation events are generated
Sample actions...
Monitoring events
Send e-mail
Log to file
Trace Initiator IP
4
5
Create rule Associate action
40 NetIQ Sentinel 7.0.1 User Guide
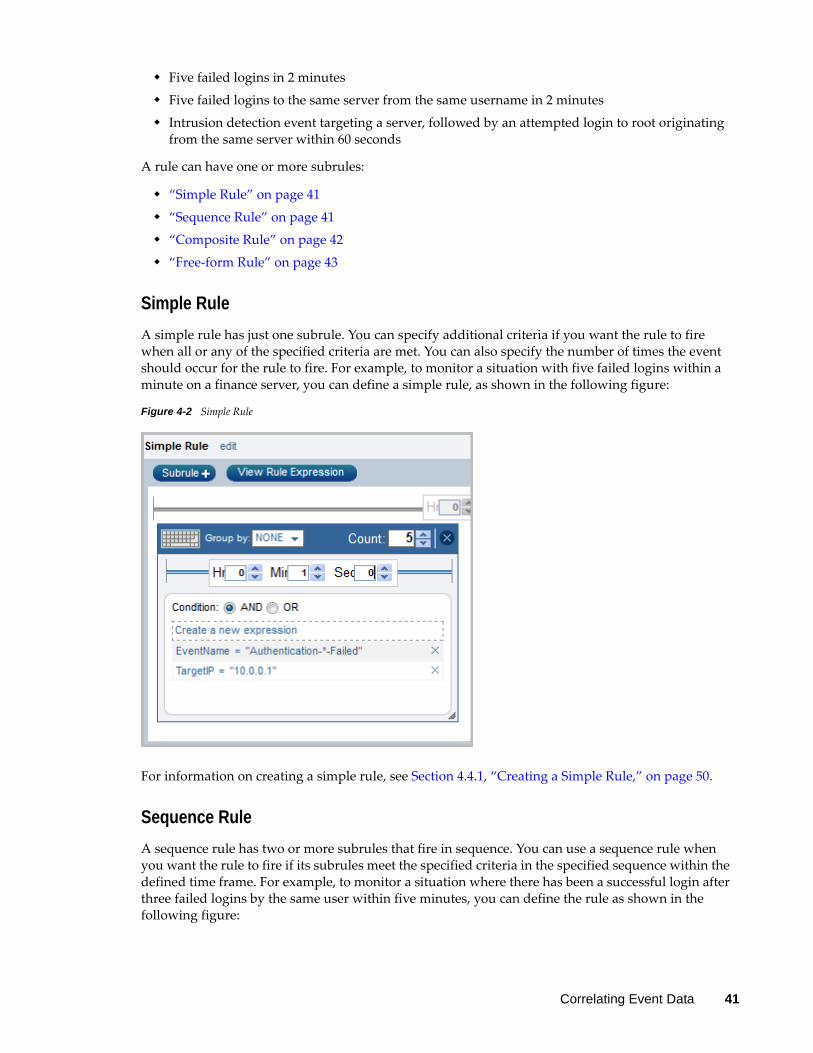
Five failed logins in 2 minutes
Five failed logins to the same server from the same username in 2 minutes
Intrusion detection event targeting a server, followed by an attempted login to root originating from the same server within 60 seconds
A rule can have one or more subrules:
“Simple Rule” on page 41
“Sequence Rule” on page 41
“Composite Rule” on page 42
“Free‐form Rule” on page 43
Simple Rule
A simple rule has just one subrule. You can specify additional criteria if you want the rule to fire when all or any of the specified criteria are met. You can also specify the number of times the event should occur for the rule to fire. For example, to monitor a situation with five failed logins within a minute on a finance server, you can define a simple rule, as shown in the following figure:
Figure 4-2 Simple Rule
For information on creating a simple rule, see Section 4.4.1, “Creating a Simple Rule,” on page 50.
Sequence Rule
A sequence rule has two or more subrules that fire in sequence. You can use a sequence rule when you want the rule to fire if its subrules meet the specified criteria in the specified sequence within the defined time frame. For example, to monitor a situation where there has been a successful login after three failed logins by the same user within five minutes, you can define the rule as shown in the following figure:
Correlating Event Data 41
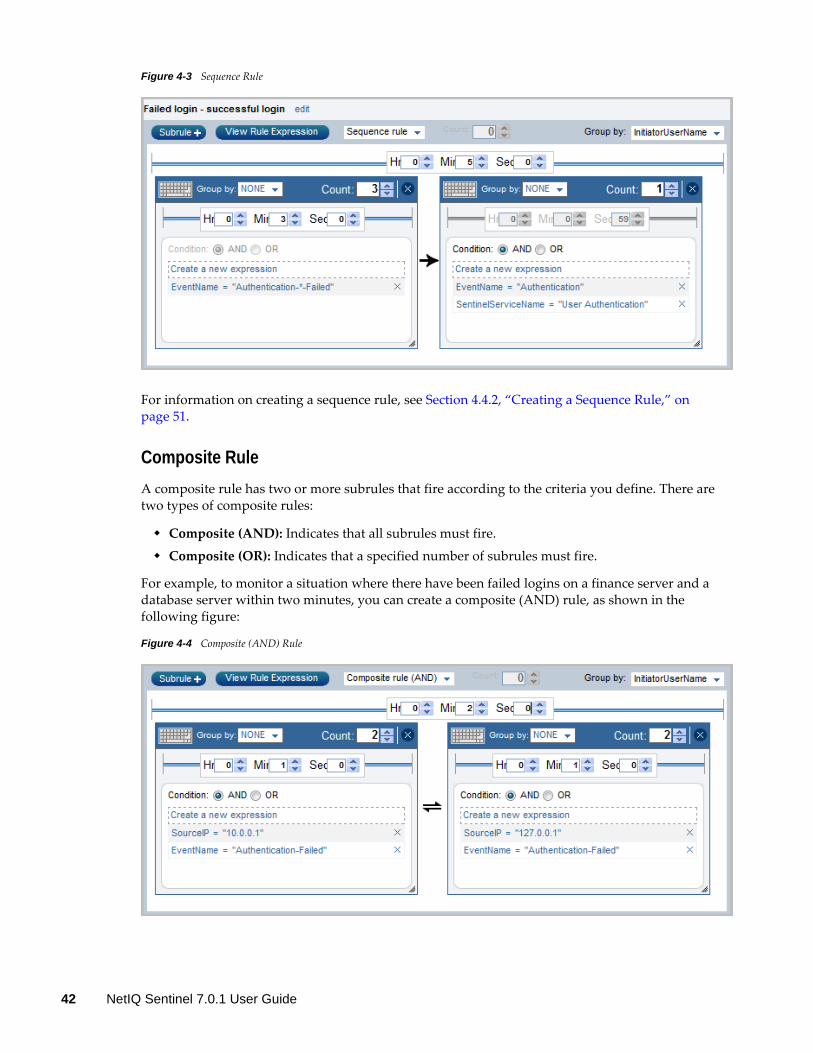
Figure 4-3 Sequence Rule
For information on creating a sequence rule, see Section 4.4.2, “Creating a Sequence Rule,” on page 51.
Composite Rule
A composite rule has two or more subrules that fire according to the criteria you define. There are two types of composite rules:
Composite (AND): Indicates that all subrules must fire.
Composite (OR): Indicates that a specified number of subrules must fire.
For example, to monitor a situation where there have been failed logins on a finance server and a database server within two minutes, you can create a composite (AND) rule, as shown in the following figure:
Figure 4-4 Composite (AND) Rule
42 NetIQ Sentinel 7.0.1 User Guide
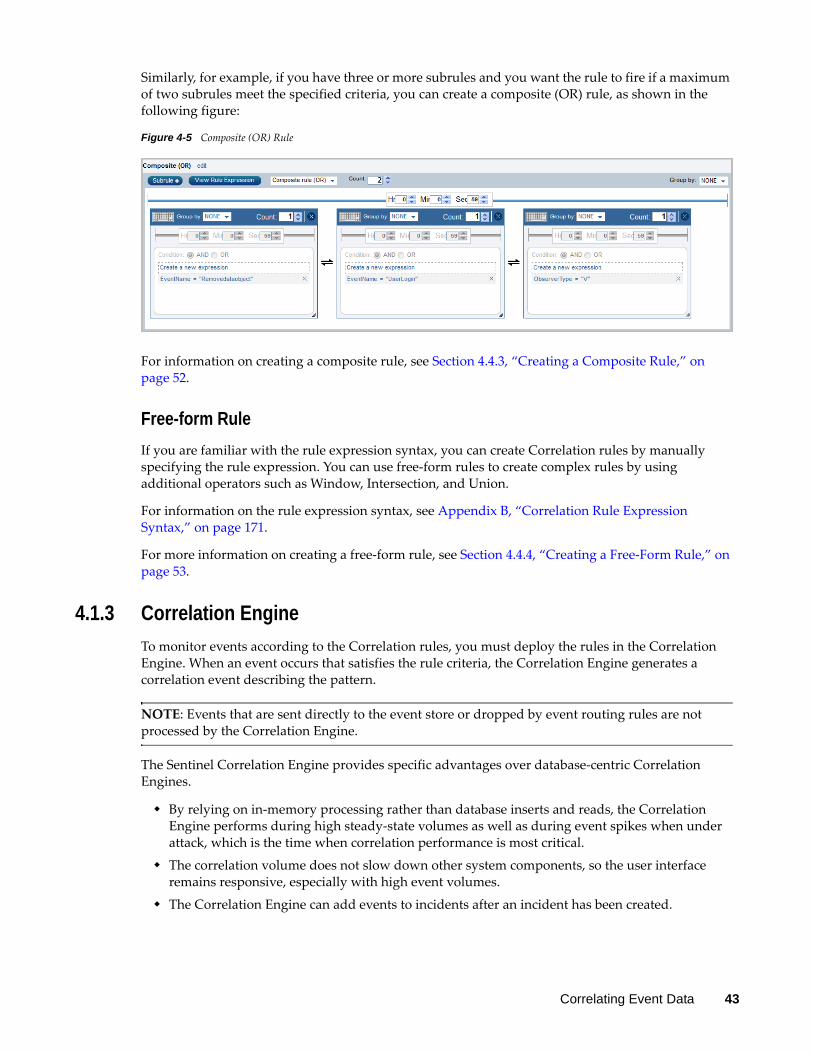
Similarly, for example, if you have three or more subrules and you want the rule to fire if a maximum of two subrules meet the specified criteria, you can create a composite (OR) rule, as shown in the following figure:
Figure 4-5 Composite (OR) Rule
For information on creating a composite rule, see Section 4.4.3, “Creating a Composite Rule,” on page 52.
Free-form Rule
If you are familiar with the rule expression syntax, you can create Correlation rules by manually specifying the rule expression. You can use free‐form rules to create complex rules by using additional operators such as Window, Intersection, and Union.
For information on the rule expression syntax, see Appendix B, “Correlation Rule Expression Syntax,” on page 171.
For more information on creating a free‐form rule, see Section 4.4.4, “Creating a Free‐Form Rule,” on page 53.
4.1.3 Correlation Engine
To monitor events according to the Correlation rules, you must deploy the rules in the Correlation Engine. When an event occurs that satisfies the rule criteria, the Correlation Engine generates a correlation event describing the pattern.
NOTE: Events that are sent directly to the event store or dropped by event routing rules are not processed by the Correlation Engine.
The Sentinel Correlation Engine provides specific advantages over database‐centric Correlation Engines.
By relying on in‐memory processing rather than database inserts and reads, the Correlation Engine performs during high steady‐state volumes as well as during event spikes when under attack, which is the time when correlation performance is most critical.
The correlation volume does not slow down other system components, so the user interface remains responsive, especially with high event volumes.
The Correlation Engine can add events to incidents after an incident has been created.
Correlating Event Data 43
You can deploy multiple Correlation Engines, each on its own server, without the need to replicate configurations or add databases. The Correlation Engine is built with a pluggable framework that allows the addition of new Correlation Engines. Independent scaling of components provides cost‐effective scalability and performance.
NOTE: You cannot install more than one Correlation Engine on a single system. You can install additional Correlation Engines on remote systems, and then connect them to the Sentinel server.
For more information on installing the Correlation Engine, see “Installing Additional Correlation Engines” in the NetIQ Sentinel 7.0.1 Installation and Configuration Guide.
4.2 Accessing the Correlation User Interface
NOTE: You must have the Manage Correlation Engine and Rules permission to access the Correlation interface.
1 Log in to the Sentinel Web interface as a user with the Manage Correlation Engine and Rules permission.
https://<IP_Address/DNS_Sentinel_server:8443>
IP_Address/DNS_Sentinel_server is the IP address or DNS name of the Sentinel server and 8443 is the default port for the Sentinel server.
2 In the navigation panel, click Correlation.
The Correlation panel is displayed. For more information, see Section 4.3.1, “Correlation Panel,” on page 44.
You can also access the Correlation user interface from the search results panel. For information on creating Correlation rules from the search results panel, see Section 4.4.5, “Creating Correlation Rules From Search Results,” on page 53.
4.3 Understanding the Correlation InterfaceThe Correlation interface includes the following:
Section 4.3.1, “Correlation Panel,” on page 44
Section 4.3.2, “Correlation Rule Builder,” on page 45
4.3.1 Correlation Panel
The Correlation panel lists the rules and the Correlation Engines installed on your system.
The Correlation panel includes the following options:
“Search Field” on page 45
“Create Link” on page 45
“More Link” on page 45
“Rules” on page 45
“Engines” on page 45
44 NetIQ Sentinel 7.0.1 User Guide

Search Field
The Search field allows you to search for the specified rule in your system.
Create Link
The Create link launches the Correlation Rule Builder that helps you to create correlation rules.
More Link
The More link allows you to select multiple rules to delete them.
Rules
The Rules section lists all the available rules in the system. The icon next to the rule indicates the status of the rule:
Enabled : The rule is deployed in the Correlation Engine and is enabled to process events.
Disabled : The rule is deployed in the Correlation Engine, but the rule is disabled and is not processing events.
No icon: The rule is not deployed in the Correlation Engine.
To view the details of any rule, click the rule. When you select or click any rule, the following icons are displayed:
Search : Searches for the events that meet the rule criteria. The events are displayed in the search results panel.
Edit : Allows you to edit the rule.
Delete : Allows you to delete the rule.
Engines
The Engines section lists the Correlation Engines installed in the system. The icon next to the Correlation Engine indicates the status of the Correlation Engine.
Start : The Correlation Engine is started and is processing the deployed correlation rules.
Stop : The Correlation Engine is stopped. When the Correlation Engine is stopped, all in‐memory data is preserved and no new correlation events are generated.
Offline : The remote Correlation Engine is off.
Click any engine to view the details, such as the rules deployed in this engine and information about the engine. For more information, see Section 4.11.1, “Using the Correlation Engine Dashboard,” on page 60.
4.3.2 Correlation Rule Builder
The Correlation Rule Builder helps you to create correlation rules and includes the following:
“Command Buttons” on page 46
“Rule Builder Elements” on page 46
Correlating Event Data 45
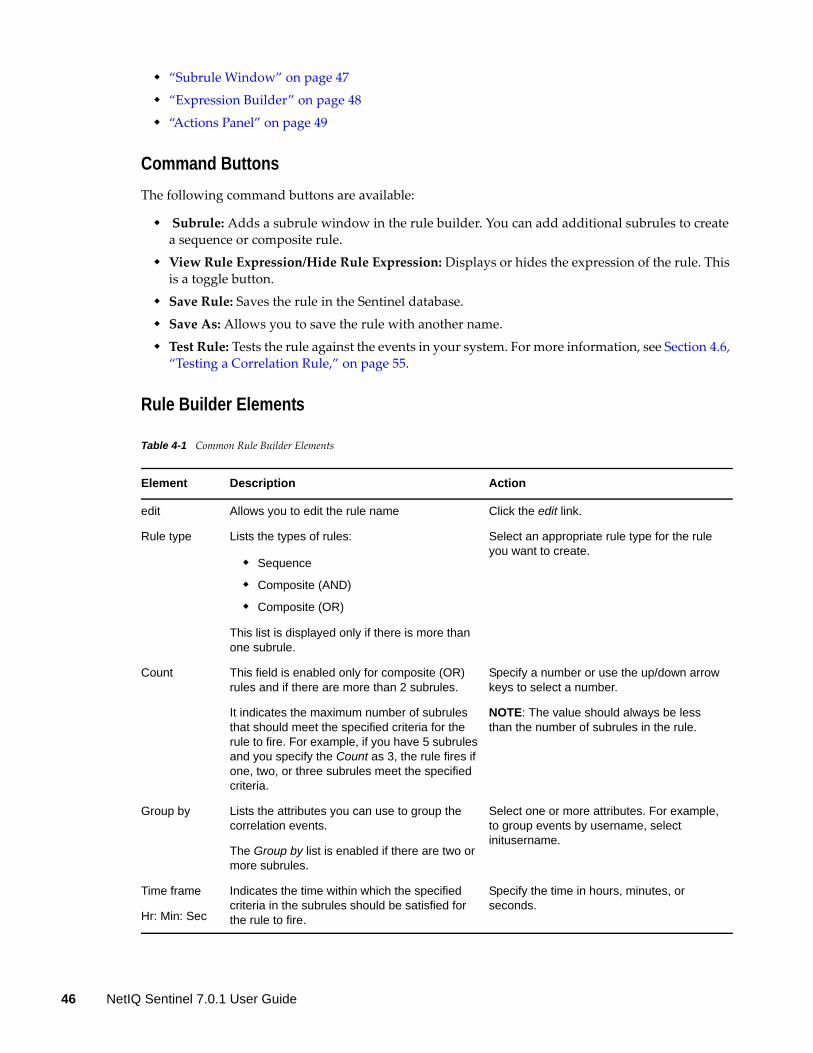
“Subrule Window” on page 47
“Expression Builder” on page 48
“Actions Panel” on page 49
Command Buttons
The following command buttons are available:
Subrule: Adds a subrule window in the rule builder. You can add additional subrules to create a sequence or composite rule.
View Rule Expression/Hide Rule Expression: Displays or hides the expression of the rule. This is a toggle button.
Save Rule: Saves the rule in the Sentinel database.
Save As: Allows you to save the rule with another name.
Test Rule: Tests the rule against the events in your system. For more information, see Section 4.6, “Testing a Correlation Rule,” on page 55.
Rule Builder Elements
Table 4-1 Common Rule Builder Elements
Element Description Action
edit Allows you to edit the rule name Click the edit link.
Rule type Lists the types of rules:
Sequence
Composite (AND)
Composite (OR)
This list is displayed only if there is more than one subrule.
Select an appropriate rule type for the rule you want to create.
Count This field is enabled only for composite (OR) rules and if there are more than 2 subrules.
It indicates the maximum number of subrules that should meet the specified criteria for the rule to fire. For example, if you have 5 subrules and you specify the Count as 3, the rule fires if one, two, or three subrules meet the specified criteria.
Specify a number or use the up/down arrow keys to select a number.
NOTE: The value should always be less than the number of subrules in the rule.
Group by Lists the attributes you can use to group the correlation events.
The Group by list is enabled if there are two or more subrules.
Select one or more attributes. For example, to group events by username, select initusername.
Time frame
Hr: Min: Sec
Indicates the time within which the specified criteria in the subrules should be satisfied for the rule to fire.
Specify the time in hours, minutes, or seconds.
46 NetIQ Sentinel 7.0.1 User Guide
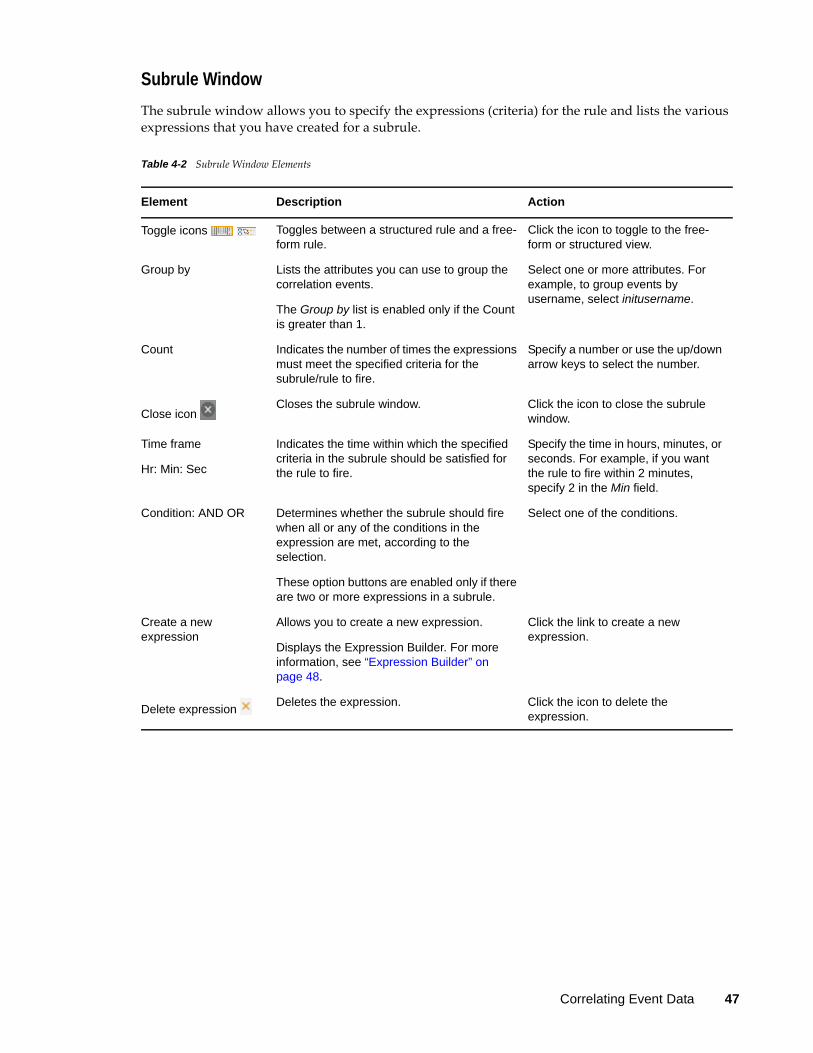
Subrule Window
The subrule window allows you to specify the expressions (criteria) for the rule and lists the various expressions that you have created for a subrule.
Table 4-2 Subrule Window Elements
Element Description Action
Toggle icons Toggles between a structured rule and a free-form rule.
Click the icon to toggle to the free-form or structured view.
Group by Lists the attributes you can use to group the correlation events.
The Group by list is enabled only if the Count is greater than 1.
Select one or more attributes. For example, to group events by username, select initusername.
Count Indicates the number of times the expressions must meet the specified criteria for the subrule/rule to fire.
Specify a number or use the up/down arrow keys to select the number.
Close icon Closes the subrule window. Click the icon to close the subrule
window.
Time frame
Hr: Min: Sec
Indicates the time within which the specified criteria in the subrule should be satisfied for the rule to fire.
Specify the time in hours, minutes, or seconds. For example, if you want the rule to fire within 2 minutes, specify 2 in the Min field.
Condition: AND OR Determines whether the subrule should fire when all or any of the conditions in the expression are met, according to the selection.
These option buttons are enabled only if there are two or more expressions in a subrule.
Select one of the conditions.
Create a new expression
Allows you to create a new expression.
Displays the Expression Builder. For more information, see “Expression Builder” on page 48.
Click the link to create a new expression.
Delete expression Deletes the expression. Click the icon to delete the
expression.
Correlating Event Data 47

Expression Builder
The Expression Builder allows you to select various parameters required to create an expression for the rule. The various parameters include Attributes, Operator, and Value. These parameters are interdependent, and changing one of them affects the validity of others.
Figure 4-6 Expression Builder
Attribute: Displays a categorized list of possible event fields that can be used to create a Correlation rule. Each category can be expanded to display the set of fields in that category. If you know the name of the field you want, specify the name in the Search field. The event category list adjusts to present only matching fields.
For information on the various event fields, click Tips located at the top right corner.
Operator: Lists the various operators. The list varies depending on the selected attribute type. For example:
For all attributes, the =, <, >, !=, <=, >=, inlist, isnull, not inlist, and not isnull operators are available.
For string attributes, the match regex operator is available.
For IP attributes, the match subnet operator is available.
For tag attributes, the contains operator is available.
For more information on using the operators, see “Filter Operation” in Appendix B, “Correlation Rule Expression Syntax,” on page 171.
48 NetIQ Sentinel 7.0.1 User Guide
Value: This field varies, depending on the attribute and operator. For example:
For the isnull and not isnull operators, no value can be chosen.
For the inlist and not inlist operators, the available dynamic lists are displayed. You can also create a new dynamic list if necessary. For more information on dynamic lists, see Section 6.1, “Creating a Dynamic List,” on page 75.
For the Severity attribute, the severity list is displayed.
For date attributes, a date‐time calendar is displayed.
For xdas taxonomy attributes, the taxonomy builder is displayed.
For numeric attributes, only numbers are accepted.
For the Sensor type attribute, the list of sensor types is displayed.
For the Tags (rv145) attribute, the list of available tags is displayed.
For Collector fields, a list of Collectors is displayed.
You can also select one or more event attributes as the value by using the Show Attributes option.
Actions Panel
The Actions panel lists the actions associated with the rule, allows you to associate actions to the rule, and allows you to define when the action should execute.
The Actions panel includes the following icons:
Action execution criteria : Allows you to specify when the rule should initiate the action. When you click this icon, the Action Execution Criteria dialog box is displayed:
You can select one of the following options:
Perform actions every time the rule fires: The action executes each time the rule criteria are met.
Perform actions at most every: The action executes at most every specified time interval. By default, this option is selected and the time interval is set to 1 hour. This is to ensure that the rule does not fire continually and overutilize resources.
Add action : Allows you to associate actions to the rule. When you click this icon, a list of actions is displayed. Select one or more actions that you want to associate to the rule.
For more information on associating actions to a rule, see Section 4.5, “Associating Actions to a Rule,” on page 54.
4.4 Creating Correlation RulesThe procedure to create various types of Correlation rules is the same for all rule types, except for a few steps that are specific to each rule type.
NOTE: Events are evaluated by rules in the specified order until a match is made, so you should order subrules accordingly. More narrowly defined subrules and more important subrules should be placed at the beginning of the list.
Section 4.4.1, “Creating a Simple Rule,” on page 50
Section 4.4.2, “Creating a Sequence Rule,” on page 51
Correlating Event Data 49

Section 4.4.3, “Creating a Composite Rule,” on page 52
Section 4.4.4, “Creating a Free‐Form Rule,” on page 53
Section 4.4.5, “Creating Correlation Rules From Search Results,” on page 53
4.4.1 Creating a Simple Rule
A simple rule has just one subrule. You can specify additional criteria if you want the rule to fire when all or any of the specified criteria are met. You can also specify the number of times the event should occur for the rule to fire.
1 Launch the Correlation Rule Builder.
For more information, see Section 4.2, “Accessing the Correlation User Interface,” on page 44.
2 Click Create.
3 In the Subrule window, click Create a new expression.
The Expression Builder is displayed. For more information, see “Expression Builder” on page 48.
4 Select the criteria for the rule, then click OK.
The specified criteria are displayed in the subrule window.
5 (Conditional) Specify additional expressions as necessary:
5a Repeat Step 3 and Step 4.
5b Select either of the following conditions:
AND: Use this condition if you want the subrule to fire when the conditions in all of the expressions are met.
OR: Use this condition if you want the subrule to fire when the condition in either of the expressions is met.
5c In the Count field, specify the number of times the expressions must meet the specified for the rule to fire. If the Count is greater than 1, the Hr, Min, and Sec fields are enabled.
5d Specify the time frame within which the subrule should fire.
5e (Conditional) Group the events according to specific event field by selecting the event field from the Group by drop‐down list. You can select one or more event fields.
6 (Optional) To associate one or more actions to the rule, click in the Actions panel.
For more information on associating actions, see Section 4.5, “Associating Actions to a Rule,” on page 54.
7 (Optional) To test whether the rule is works as expected, click Test Rule.
For more information on testing the rule, see Section 4.6, “Testing a Correlation Rule,” on page 55.
8 Click Save As.
9 Specify a name for the rule and an optional description, then click OK.
10 Deploy the rule in the Correlation Engine so that events can be processed according to the rule.
For more information, see Section 4.8, “Deploying Rules in the Correlation Engine,” on page 57.
50 NetIQ Sentinel 7.0.1 User Guide

4.4.2 Creating a Sequence Rule
A sequence rule has two or more subrules that fire in sequence. You can use a sequence rule when you want the rule to fire if its subrules meet the specified criteria in the specified sequence within the defined time frame.
1 Launch the Correlation Rule Builder.
For more information, see Section 4.2, “Accessing the Correlation User Interface,” on page 44.
2 Click Create.
3 In the Subrule window, click Create a new expression.
The Expression Builder is displayed. For more information, see “Expression Builder” on page 48.
4 Select the criteria for the rule, then click OK.
The specified criteria are displayed in the subrule window.
5 (Conditional) Specify additional expressions as necessary:
5a Select either of the following conditions:
AND: Use this condition if you want the subrule to fire when the conditions in all of the expressions are met.
OR: Use this condition if you want the subrule to fire when the condition in either of the expressions is met.
5b In the Count field, specify the number of times the expressions must meet the specified criteria for the rule to fire. If the Count is greater than 1, the Hr, Min, and Sec fields are enabled.
5c Specify the time frame within which the subrule should fire.
5d (Conditional) Group the events according to specific event fields by selecting the event field from the Group by drop‐down list. You can select one or more event fields.
6 To add additional subrules, click Subrule, then repeat Step 3 through Step 5 to specify the subrule criteria.
7 In the Rule Type drop‐down list, select Sequence rule.
8 Specify the time frame within which the rule should fire.
9 (Optional) To associate one or more actions to the rule, click in the Actions panel.
For more information on associating actions, see Section 4.5, “Associating Actions to a Rule,” on page 54.
10 (Optional) To test whether the rule is works as expected, click Test Rule.
For more information on testing the rule, see Section 4.6, “Testing a Correlation Rule,” on page 55.
11 Click Save As.
12 Specify a name for the rule and an optional description, then click Save.
13 Deploy the rule in the Correlation Engine so that events can be processed according to the rule.
For more information, see Section 4.8, “Deploying Rules in the Correlation Engine,” on page 57.
Correlating Event Data 51
4.4.3 Creating a Composite Rule
A composite rule has two or more subrules that fire according to the criteria you define.
1 Launch the Correlation Rule Builder.
For more information, see Section 4.2, “Accessing the Correlation User Interface,” on page 44.
2 Click Create.
3 In the Subrule window, click Create a new expression.
The Expression Builder is displayed. For more information, see “Expression Builder” on page 48.
4 Select the criteria for the rule, then click OK.
The specified criteria are displayed in the subrule window.
5 (Conditional) Specify additional expressions as necessary:
5a Select either of the following conditions:
AND: Use this condition if you want the subrule to fire when the conditions in all of the expressions are met.
OR: Use this condition if you want the subrule to fire when the condition in either of the expressions is met.
5b In the Count field, specify the number of times the expressions must meet the specified criteria for the rule to fire. If the Count is greater than 1, the Hr, Min, and Sec fields are enabled.
5c Specify the time frame within which the subrule should fire.
5d (Conditional) Group the events according to specific event fields by selecting the event field from the Group by drop‐down list. You can select one or more event fields.
6 Complete Step 1 through Step 5 in Section 4.4.1, “Creating a Simple Rule,” on page 50.
7 To add additional subrules, click Subrule, then repeat Step 3 through Step 5 to specify the subrule criteria.
8 In the Rule Type drop‐down list, select Composite rule.
9 Select one of the following:
Composite Rule (AND): The rule fires if all the subrules meet the specified criteria within the defined time frame.
Composite Rule (OR): The rule fires if any of the subrules meets the specified criteria within the defined time frame.
10 (Conditional) If you selected Composite Rule (OR), use the Count field to specify the number of subrules that should meet the specified criteria.
The value in the Count field must be less than the number of subrules. For example, if there are 5 subrules and you specify the count as 3, the rule fires if one, two, or three subrules meet the specified criteria.
11 Specify the time frame within which the rule should fire.
12 (Optional) To associate one or more actions to the rule, in the Actions panel, click .
For more information on associating actions, see Section 4.5, “Associating Actions to a Rule,” on page 54.
13 (Optional) To test whether the rule is works as expected, click Test Rule.
52 NetIQ Sentinel 7.0.1 User Guide
For more information on testing the rule, see Section 4.6, “Testing a Correlation Rule,” on page 55.
14 Click Save As.
15 Specify an intuitive name for the rule and an optional description, then click Save.
16 Deploy the rule in the Correlation Engine so that events can be processed according to the rule.
For more information, see Section 4.8, “Deploying Rules in the Correlation Engine,” on page 57.
4.4.4 Creating a Free-Form Rule
If you are familiar with the rule expression syntax, you can create correlation rules by manually specifying the rule expression. You can use free‐form rules to create complex rules by using additional operators such as Window, Intersection, and Union.
1 Launch the Correlation Rule Builder.
For more information, see Section 4.2, “Accessing the Correlation User Interface,” on page 44.
2 Click Create.
3 In the subrule window, click to switch to the free‐form view.
4 Specify the criteria for the rule.
As you type the rule expression, the Free‐form editor validates the rule expression syntax and indicates errors if the syntax is wrong.
For more information on the rule expression syntax, see Appendix B, “Correlation Rule Expression Syntax,” on page 171.
5 (Optional) Click to view the rule in a structured format.
Free‐form expressions that include the Window operator or a combination of AND and OR operators are not supported in the structured view.
6 (Optional) To associate one or more actions to the rule, in the Actions panel, click .
For more information on associating actions, see Section 4.5, “Associating Actions to a Rule,” on page 54.
7 (Optional) To test whether the rule is works as expected, click Test Rule.
For more information on testing the rule, see Section 4.6, “Testing a Correlation Rule,” on page 55.
8 Click Save As.
9 Specify an intuitive name for the rule and an optional description, then click Save.
10 Deploy the rule in the Correlation Engine so that events can be processed according to the rule.
For more information, see Section 4.8, “Deploying Rules in the Correlation Engine,” on page 57.
4.4.5 Creating Correlation Rules From Search Results
1 In the search results panel, select the events from which you want to create a Correlation rule.
2 In the Events Operations drop‐down list, select one of the following:
Add to correlation rule: Adds the selected events to an existing rule.
Create correlation rule: Creates a new rule with the selected events.
Correlating Event Data 53
3 (Conditional) If you selected create correlation rule, the Correlation Rule Builder is displayed. The events that you selected to build the rule are displayed below the rule builder. Skip to Step 5.
4 (Conditional) If you selected add to correlation rule, the Add events to an existing rule window is displayed that lists the rules in the system.
Select a rule, then click OK.
The Correlation Rule Builder is displayed. The events that you selected to build the rule are displayed below the rule builder.
5 From the event list, drag the attributes that you want to add to the rule to the Subrule window.
6 (Optional) To associate one or more actions to the rule, in the Actions panel, click .
For more information on associating actions, see Section 4.5, “Associating Actions to a Rule,” on page 54.
7 (Optional) To test whether the rule is works as expected, click Test Rule.
For more information on testing the rule, see Section 4.6, “Testing a Correlation Rule,” on page 55.
8 Click Save As.
9 Specify an intuitive name for the rule and an optional description, then click Save.
10 Deploy the rule in the Correlation Engine so that events can be processed according to the rule.
For more information, see Section 4.8, “Deploying Rules in the Correlation Engine,” on page 57.
4.5 Associating Actions to a RuleYou can configure one or more actions to a rule. The associated actions are executed when the rule fires.
1 Launch the Correlation interface.
For more information, see Section 4.2, “Accessing the Correlation User Interface,” on page 44.
2 In the Correlation panel, click any rule to which you want to associate actions, then click .
The Correlation Rule Builder is displayed.
3 In the Actions panel, click to associate one or more actions to the rule.
The list of actions is displayed.
4 Select the actions that you want to associate with the rule, then click OK.
5 Click to define when the action should execute.
6 Select one of the following:
Perform actions every time the rule fires: The action executes each time the rule criteria are met.
Perform actions at most every: The action executes at most every specified time interval. By default, this option is selected and the time interval is set to 1 hour. This is to ensure that rule does not fire continually and overutilize resources.
7 Click OK.
8 Click Save Rule.
54 NetIQ Sentinel 7.0.1 User Guide

NOTE: If you modified a deployed rule, you must redeploy the rule in the Correlation Engine for the changes to take effect. For information on deploying a rule, see Section 4.8, “Deploying Rules in the Correlation Engine,” on page 57.
4.6 Testing a Correlation RuleYou can determine whether the rule is working as expected by testing a rule on the events that are already in the system before deploying it to monitor real‐time events.
1 Launch the Correlation interface.
For more information, see Section 4.2, “Accessing the Correlation User Interface,” on page 44.
2 In the Correlation panel, click any rule that you want to test, then click .
3 Click Test Rule.
4 Specify the time frame during which you want to test the rule.
5 (Optional) Click to filter events that the rule should process.
6 Click Test Rule.
The test takes some time, depending on the specified criteria. After the test is complete, the test results are displayed.
The test results display the rule details:
Status: Indicates whether the test is running, stopped, or completed. The test stops when the rule has fired at least 20 times during the test process. This ensures that the rule is working as expected and saves time when there are many events.
Started at: The date/time when the rule started to fire.
Finished at: The date/time when the test stopped.
The indicators (dots) indicate when the rule fired. The white dot indicates a single correlation event. The black dot indicates multiple correlation events generated within a short period of time. Click the indicator to see the event details.
7 Click the Close icon to close the test results.
4.7 Sample Correlation RulesThis section provides a few examples on how you can create correlation rules. For more examples, see Appendix B, “Correlation Rule Expression Syntax,” on page 171.
Section 4.7.1, “Detecting Critical Events from an Intrusion Detection System,” on page 55
Section 4.7.2, “Detecting a Spreading Attack,” on page 56
Section 4.7.3, “Detecting an Attack that Came from Outside the Firewall,” on page 57
4.7.1 Detecting Critical Events from an Intrusion Detection System
This example identifies critical events from an intrusion detection system and sends an e‐mail to the Administrator.
Launch the Correlation Rule Builder. In the Correlation panel, click Create.
Correlating Event Data 55
In the Subrule window, click Create a new expression.
Specify that the events must be from an intrusion detection system (IDS):
In the Expression Builder > Event Fields, select ObserverCategory.
Ensure that the “=” operator is selected.
In the Value field, specify IDS, then click OK.
Identify critical events:
Add another expression. In the Subrule window, click Create a new expression.
In the Expression Builder > Event Fields, select Severity.
Select >= as the operator.
In the Value field, select 4, then click OK.
If events are found, send an e‐mail to the administrator:
In the Actions panel, click to associate the action with the rule.
Select Send E‐mail.
Click to update the action execution criteria.
Select Perform actions everytime the rule fires, then click OK.
Click Save Rule.
Deploy the rule in the Correlation Engine.
For more information, see Section 4.8, “Deploying Rules in the Correlation Engine,” on page 57.
Search events that match the rule criteria.
For more information, see Section 4.9, “Viewing Correlation Events,” on page 57.
4.7.2 Detecting a Spreading Attack
This example creates a Correlation rule that indicates whether the source of an attack was previously the destination of an attack (within 15 minutes.) Because this involves comparing a current event set with a past event set, it uses the window operation.
In the Subrule window, click to switch to the free‐form editor.
Specify the expression as follows:
filter(e.TaxonomyLevel1="Attack") flow window(w.dip=e.sip, filter(e.rv51="Attack"), 15m)
Click Save Rule.
Deploy the rule in the Correlation Engine.
For more information, see Section 4.8, “Deploying Rules in the Correlation Engine,” on page 57.
Search events that match the rule criteria.
For more information, see Section 4.9, “Viewing Correlation Events,” on page 57.
56 NetIQ Sentinel 7.0.1 User Guide

4.7.3 Detecting an Attack that Came from Outside the Firewall
This example creates a Correlation rule that checks whether an intrusion detection system attack event seen inside your network came through your firewall in the last 10 seconds.
In the Subrule window, click to switch to the free‐form editor.
Specify the expression as follows:
filter(e.TaxonomyLevel1="Attack") flow window(w.dip=e.sip, filter(e.rv32="FW"), 10)
Click Save Rule.
Deploy the rule in the Correlation Engine.
For more information, see Section 4.8, “Deploying Rules in the Correlation Engine,” on page 57.
Search events that match the rule criteria.
For more information, see Section 4.9, “Viewing Correlation Events,” on page 57.
4.8 Deploying Rules in the Correlation EngineYou can deploy the Correlation rules either from the rule dashboard or from the Correlation Engine dashboard.
To deploy rules from the Correlation Engine dashboard:
1 Launch the Correlation interface.
For more information, see Section 4.2, “Accessing the Correlation User Interface,” on page 44.
2 In the Correlation panel, select the rule that you want to deploy.
3 In the Deploy/Undeploy section, select the engine to which you want to deploy the rule, then click Deploy.
To deploy rules from the Correlation Rule dashboard:
1 Launch the Correlation interface.
For more information, see Section 4.2, “Accessing the Correlation User Interface,” on page 44.
2 In the Correlation panel, click the engine to which you want to deploy rules.
The Correlation Engine dashboard is displayed.
3 In the Available rules section, select the rule or rules that you want to deploy, then click Deploy.
4.9 Viewing Correlation Events1 Launch the Correlation interface.
For more information, see Section 4.2, “Accessing the Correlation User Interface,” on page 44.
2 In the Correlation panel, select any rule, then click .
The events that match the rule criteria are displayed in the search results panel. The correlation
events are displayed with the icon.
3 (Optional) Click View triggers to view the events that generated the correlation event.
Correlating Event Data 57

4.10 Managing Correlation Rules Section 4.10.1, “Viewing the Rule Dashboard,” on page 58
Section 4.10.2, “Editing a Rule,” on page 59
Section 4.10.3, “Deleting a Rule,” on page 59
4.10.1 Viewing the Rule Dashboard
The Rule dashboard displays overall information of the rule. The Rule dashboard helps you to deploy or undeploy a rule on a Correlation Engine, and also helps you manage the rule status. After a rule is deployed, you can monitor the health of the rule, activities such as the events processed, and the memory usage by the rule.
To view the Rule dashboard, select the desired rule in the Correlation panel.
After a rule is deployed, the dashboard displays the following information:
Rule health statistics: Indicates the overall performance of the rule and enables you to monitor the activities of the rule.
Activity statistics: Indicates the activities of the rule since it was deployed in the Correlation Engine:
Fire count: The number of times the rule fired. You can use this information to discover a rule that fires more than expected and that might need to be tuned, or to discover a rule that does not fire as often as you would expect. In either case, this tab guides you to the rules that are the most and least active. The search icon allows you to view the events generated since the rule was deployed or enabled.
Fire rate: The number of times the rule has been fired relative to the events processed by the rule. This statistic is similar to fire count in that it gives an indication of how active a rule is. However, instead of giving a raw count, the fire rate gives a percentage that is relative to the number of events a rule has processed.
EPS utilization: The processing time this rule consumes relative to the capacity of the engine. This statistic provides an estimate of the amount of engine capacity a given rule is currently consuming. Rules that are more complex, have time‐consuming actions, or fire frequently consume more capacity. You can use this statistic to determine whether the rule needs to be tuned or perhaps moved to another Correlation Engine for scalability reasons.
Events processed: The number of events processed by the rule since the rule was deployed.
Total processing time: Total time spent by the Correlation Engine processing the rule since it was deployed or enabled.
Memory statistics: Indicates the memory consumed by the rule:
Estimated memory utilization: Gives a snapshot of roughly how much memory a rule is consuming. Rules consume memory when they have discriminators specified for fields with multiple values (through the Group by list), and when rules hold events in memory for operations like the advanced “window” operation. Rules that consume a lot of memory are a potential liability to a healthy system and should be carefully reviewed to ensure they are properly written or possibly moved to another Correlation Engine for scalability reasons.
Events in memory: Number of events held in memory by the rule.
58 NetIQ Sentinel 7.0.1 User Guide

Cardinality: Number of strings and related structures held in memory by the rule.
Deploy/Undeploy: Lists the available Correlation Engines.You can select an engine, then click Deploy or Undeploy to add or remove the rule in the Correlation Engine.
Associated actions: Lists the actions associated with the rule.
Status: Indicates the current status of the rule. You can also use this option to enable or disable the rule.
4.10.2 Editing a Rule
1 Launch the Correlation interface.
For more information, see Section 4.2, “Accessing the Correlation User Interface,” on page 44.
2 Do either of the following:
In the Correlation panel, select the rule for which you want to modify the details, then click
.
In the Rule dashboard window, select the rule for which you want to modify the details, then click Edit rule.
The rule details are displayed in the Correlation Rule Builder.
3 Make the necessary changes, then click Save Rule.
NOTE: If you modify a deployed rule, you must redeploy the rule in the Correlation Engine for the changes to take effect. For information on deploying a rule, see Section 4.8, “Deploying Rules in the Correlation Engine,” on page 57.
4.10.3 Deleting a Rule
You can delete rules that are not deployed in the Correlation Engine. To delete a deployed rule, you must first undeploy the rule from the Correlation Engine.
1 Launch the Correlation interface.
For more information, see Section 4.2, “Accessing the Correlation User Interface,” on page 44.
2 Select the rule that you want to delete, then click .
3 Click OK to confirm deletion.
4.11 Managing the Correlation Engine Section 4.11.1, “Using the Correlation Engine Dashboard,” on page 60
Section 4.11.2, “Stopping or Starting a Correlation Engine,” on page 62
Section 4.11.3, “Renaming a Correlation Engine,” on page 62
Correlating Event Data 59

4.11.1 Using the Correlation Engine Dashboard
The Correlation Engine dashboard provides an overall picture of the health of the engine and the various rules deployed to it. The dashboard provides information on the activity of an engine and provides insights about which rules are behaving as expected and which rules might need additional tuning.
To view the Correlation Engine dashboard, select the desired Correlation Engine in the Correlation panel.
The dashboard displays a simple view of all the rules deployed to that engine and a list of rules available to deploy. You can also see some general information about the engine, such as its current state (running, stopped, or offline) and how long the engine has been in that state. There is also a summary that shows how many events the engine has processed, and an indication of current utilization of the engine (EPS utilization). In general, you can think of this number as something analogous to CPU utilization, but this metric indicates how much of the capacity of the engine is currently utilized. As the number of rules and the complexity of rules increases along with the current EPS (events per second) rate of the system, you can expect this number to grow larger.
The Deployed rules comparison tab provides a more granular view of engine activity. The various tabs represent various statistics, and you can select a given tab to sort the rules (ascending or descending) by these statistics to get a clear picture of how various rules are behaving and consuming resources.
The Correlation Engine dashboard also allows you to manage the engine and the rules in your system:
“Managing the Correlation Engine” on page 60
“Managing Deployed Rules” on page 60
“Comparing Deployed Rules” on page 61
“Viewing Engine Details” on page 61
“Viewing Available Rules” on page 62
Managing the Correlation Engine
The following options are available to manage the Correlation Engine:
Stop: Stops an active Correlation Engine. When the engine stopped, it does not monitor the events against the deployed rules.
Undeploy all: Undeploys all the deployed rules from the engine.
Rename: Allows you to rename the engine.
Managing Deployed Rules
This section lists the number of rules and the rules deployed in the engine.
The following options are displayed when you mouse over a rule:
View: Opens the Rule dashboard to provides overall information on the rule. For more information, see Section 4.10.1, “Viewing the Rule Dashboard,” on page 58.
Disable: Allows you to disable the rule. When a rule is disabled, it does not process the events.
Undeploy: Undeploys the rule from the Correlation Engine.
60 NetIQ Sentinel 7.0.1 User Guide
Comparing Deployed Rules
This section helps you compare the rules based on parameters such as fire count, EPS capacity, and memory utilization. You can sort the rules as desired by using the up‐arrow and down‐arrow icons.
Fire count: The number of times the rule has fired since it was deployed or enabled. You can use this information to discover a rule that fires more than expected and that might need to be tuned, or to discover a rule that does not fire as often as you would expect. In either case, this tab guides you to the rules that are the most and least active.
Last fired: The last time the rule fired since it was deployed. This statistic is useful for determining the rules that are currently active and inactive in the system. A rule might have fired frequently, but it has not fired recently. Or, a rule might fire infrequently, but it fired recently. This tab gives you a real‐time picture of what is active in the engine at any given time.
Fire rate: The number of times the rules have fired relative to the events processed by the engine. This statistic is similar to fire count in that it gives an indication of how active a rule is. However, instead of giving a raw count, the fire rate gives a percentage that is relative to the number of events a rule has processed. This normalizes the metric, and rules that were recently deployed can be compared with rules that were deployed at an earlier time.
EPS utilization: The events processing time the rule consumes relative to the capacity of the engine. This statistic provides an estimate of the amount of engine capacity a given correlation rule is currently consuming. Rules that are more complex, have time‐consuming actions, or fire frequently consume more capacity. You can use this statistic to identify rules that need to be tuned or perhaps moved to another correlation engine for scalability reasons.
Memory utilization: The estimated memory utilization of the rule. In addition to EPS utilization, which provides a good picture of how much time a rule consumes relative to the total available processing time of the engine, the memory utilization gives a snapshot of roughly how much memory a rule is consuming. Rules consume memory when they have discriminators specified for fields with multiple values (through the Group by list), and when rules hold events in memory for operations like the advanced “window” operation. Rules that consume a lot of memory are a potential liability to a healthy system and should be carefully reviewed to ensure they are properly written or possibly moved to another engine for scalability reasons.
Viewing Engine Details
This section lists the Correlation Engine details and so you can monitor the performance of the Correlation Engine.
Engine ID: The Correlation Engine ID.
Engine Name: The name of the Correlation Engine.
Host IP: The IP address of the host machine where the Correlation Engine is installed.
Hostname: The hostname of the machine where the Correlation Engine is installed
State: Whether the status of the Correlation Engine is running or stopped.
Events Processed: The number of events processed by the deployed rules since they were deployed.
Last changed state: The time the Correlation Engine status was last changed.
EPS utilization: The processing time the Correlation Engine consumes relative to the capacity of the engine.
Correlating Event Data 61
Viewing Available Rules
This section lists the available rules in the system that are not deployed in the Correlation Engine. It also allows you to select rules and deploy them in the Correlation Engine.
4.11.2 Stopping or Starting a Correlation Engine
The Correlation Engine is in the Start mode by default and keeps processing events for the rules deployed in the engine. You can determine when the Correlation Engine should process the events and start or stop the Correlation Engine accordingly.
1 Launch the Correlation interface.
For more information, see Section 4.2, “Accessing the Correlation User Interface,” on page 44.
2 In the Correlation > Engines section, select the Correlation Engine that you want to stop.
The Correlation Engine dashboard is displayed.
3 (Conditional) To stop the engine, click Stop.
The engine is stopped and does not process any events.
4 (Conditional) To start the engine, click Start.
4.11.3 Renaming a Correlation Engine
1 Launch the Correlation interface.
For more information, see Section 4.2, “Accessing the Correlation User Interface,” on page 44.
2 In the Correlation > Engines section, select the Correlation Engine that you want to rename.
The Correlation Engine dashboard is displayed.
3 Click Rename, which is above the Rules Deployed section.
4 Modify the name of the engine, then click anywhere outside the field.
62 NetIQ Sentinel 7.0.1 User Guide
5 5Analyzing Trends in Data
The following sections describe how the Sentinel Security Intelligence feature analyzes trends in data and how to use the Security Intelligence feature.
Section 5.1, “Overview,” on page 63
Section 5.2, “Creating a Dashboard,” on page 66
Section 5.3, “Understanding the Dashboard Interface,” on page 67
Section 5.4, “Creating Baselines,” on page 68
Section 5.5, “Configuring Anomaly Detection,” on page 69
Section 5.6, “Managing Dashboards,” on page 71
Section 5.7, “Troubleshooting,” on page 72
5.1 OverviewThe Correlation capability in Sentinel provides security analysis with the ability to look for “known knowns” occurring within the enterprise in real time. Sentinel provides another way to analyze data by looking for the “known unknowns” in the events generated within the enterprise.
This second type of analysis is called Security Intelligence in Sentinel. It allows you to perform anomaly‐based analysis so you can find deviations from the normal trends of your enterprise.
A key aspect in looking for deviations depends upon the nature of input data. Input data is typically a collection of various instances, records, or points. Each data instance itself consists of attributes that define the type of input. Examples of different types of input data within the SIEM domain are:
Spatial (location of various entities)
Graphical (relation between the various entities)
Sequences (time series)
The Security Intelligence feature in Sentinel focuses on statistical analysis of time series data to enable analysts to identify and analyze anomalies either by an automated statistical engine or by visual representation of the statistical data for manual interpretation. The following concepts collectively define the Security Intelligence feature in Sentinel:
Section 5.1.1, “Terminology,” on page 63
Section 5.1.2, “How Security Intelligence Works,” on page 65
Section 5.1.3, “Permissions for Security Intelligence,” on page 66
5.1.1 Terminology
The following terminology is used with Security Intelligence:
Analyzing Trends in Data 63
Security Intelligence: The feature that allows you to create dashboards with baselines that define what is normal in your network. An analysis of the real‐time data lets you see if there are any anomalies, and an e‐mail is sent to notify someone that anomalies are occurring.
Dashboard: Displays data matching a particular filter, categorizes data using a particular classifier, and looks for particular anomalies as specified in the dashboard’s set of anomaly rule definitions. This is not just a front‐end Web interface, but also a back‐end engine because it is always looking for anomalies, even if the Web interface is not open.
Classifier: Determines the categories displayed in the dashboard.
Filter: Determines the scope of events displayed in the dashboard.
MongoDB: A database that stores the Security Intelligence data.
Category: A class or division of events with shared characteristics as defined by the classifier.
Anomaly: Something that deviates from what is standard, normal, or expected when compared to the user’s selected baseline.
Anomaly Definition: A set of principles, configurable by a user, that describes the threshold and circumstances as defined in the anomaly rules.
Chart: The graph in the dashboard that depicts the statistical data and baseline.
Time Slider: The Web interface component that allows a user to quickly visualize and navigate the time range of data.
Breakdown: The Web interface component that displays the top ten values of a select number of event fields to show a user details on the most prevalent event values in the data they are viewing.
64 NetIQ Sentinel 7.0.1 User Guide

5.1.2 How Security Intelligence Works
The following diagram depicts how the Security Intelligence feature works.
Figure 5-1 How Security Intelligence Works
1. A user creates a dashboard in the Sentinel Web interface.
2. The dashboard consists of a filter and classifier that create a segment of data from the normalized events in the message bus.
3. The segment of data is stored in the MongoDB database for up to 28 days.
4. The user then defines a baseline of normal activity for the environment.
5. The user creates anomaly definitions to look for real‐time events that are occurring outside of the defined baseline.
6. The anomaly engine analyzes the events in the MongoDB database.
87
5
4
3
2
1
6
Message Bus
Dashboard
Classifier
Segment ofData
AnomalyDetectionEngine
AnomalyDetectionE-mailRecipient
SentinelWebInterface
FilterBaseline
Anomaly
Days
Security Intelligence Database
Analyzing Trends in Data 65

7. This information is displayed in the dashboard.
8. If an anomaly is detected, an e‐mail is sent with the information about the anomaly.
5.1.3 Permissions for Security Intelligence
The Security Intelligence option is displayed in the Web interface if the user has one of the following permissions:
Manage and View Security Intelligence Dashboards
View Security Intelligence Dashboards
A user is assigned these permissions while creating a role. For more information, see “Creating Roles”in the NetIQ Sentinel 7.0.1 Administration Guide.
Using the Security Intelligence option, you can view, create, and manage dashboards.
5.2 Creating a Dashboard1 Log in to the Sentinel Web interface as a user with the Manage and View Security Intelligence
Dashboards permission.
2 On the left side of the page, click Security Intelligence >Dashboards > Create.
The Create Dashboard page opens in a new tab.
3 Use the following information to create the dashboard:
Name: Specify a unique name for the dashboard.
Classifier: Select the classifier that determines the categories displayed in the dashboard. The options are:
Taxonomy Outcome
Device Activity
Tag Activity
Http
Exploit
Filter: Specify a filter to determine the scope of events displayed in the dashboard, or select a predefined filter. By default it displays the (sev:[0 TO 5]) filter.
To search for an event field, specify the short name of the field, a colon, and the value. For example, notnull: xdastaxname displays all events. For more information, see Chapter 3, “Configuring Filters,” on page 29.
Data retention period: Select how long the data for the dashboards is retained. The options are:
1 week
2 weeks
3 weeks
4 weeks
By default the Security Intelligence MongoDB database retains the data for 4 weeks.
4 Click Create dashboard.
The newly created empty dashboard is displayed because it has not had time to collect any data.
66 NetIQ Sentinel 7.0.1 User Guide

After few minutes, you can see the event data in the dashboard.
5.2.1 Creating a Dashboard by Using a Filter
You can use a filter search query as a dashboard filter and create a dashboard. For more information on creating a dashboard by using a filter, see Section 2.4.5, “Creating a Dashboard,” on page 24.
5.3 Understanding the Dashboard InterfaceThe dashboard displays the analysis of the data.
Chart: The graph displays the events, the anomalies, and the baseline.
Compared to: Displays the types of baselines for comparison with the flowing data. Baseline is the referenced line that is displayed in blue color, whereas the actual events that are flowing in to the system is displayed in brown. You can compare the flowing data to the following:
Moving Average: Data that is flowing in to the system is compared to the average of the data.
Previous Day: If you have one day data stored in Security Intelligence database (MongoDB), then you can compare the flowing data with the previous day data.
Previous Week: If you have one week of data stored in Security Intelligence database (MongoDB), then you can compare the flowing data with the previous week data.
Create Baseline: Allows you to create a custom baseline You must have at least a week’s worth of data before you can create a baseline. For more information on creating a custom baseline, see Section 5.4, “Creating Baselines,” on page 68.
Analyzing Trends in Data 67
Time range: Displays the time range between which we can see the data. When you create a dashboard, the Time range shows Hour. It then displays Day and Week as you have one day or one week data stored in Security Intelligence database (MongoDB). The Hour option does not appear, if the Security Intelligence database (MongoDB) have 28 days of data.
Show Events: Displays the list of events for the selected time range in the Sentinel Web interface. The total events in the Sentinel Web interface matches with the total events in the dashboard. However, the total events count in the Sentinel Web interface does not match with the total events in the dashboard in the following cases:
If the leftmost and rightmost time point on the dashboard are included. To match the events in the dashboard and Sentinel Web interface, select the time point between the leftmost and rightmost time point on the dashboard.
By default, Sentinel includes internal audit events in the dashboard search results. To exclude the internal events, create a dashboard by using the filter (sev:[0 TO 5]) -st:A -st:I -st:Y. For more information, see Section 5.2.1, “Creating a Dashboard by Using a Filter,” on page 67.
Time Slider: The time slider allows you to change the amount of information displayed in the dashboard. It allows you to zoom in or zoom out for a specific time period. As you move the time slider, the graph changes accordingly.
Time Slider Data Summaries: Below the graph, a summary of the time slider data is displayed. The data that is
Anomalies: Displays the anomalies that have occurred during the lifetime of the dashboard. To view the details of the anomaly, you can click on anomaly name. This displays the anomaly detail page.
Categories: The Categories panel on the right of the dashboard displays the categories of the current time range at the current level of the dashboard. It provides the ability to drill down and find more information about the categories of events. This section displays lines identifying changes from the baseline indicators of the categories. You can sort the category list by percent change, reference count or current count.
Clicking a specific category in the list on the right displays the data for just that category. It changes the main graph to show the events in that category list. The totals in the main section changes to reflect the current category. It also displays the following sections in the bottom of the main panel.
Category anomalies: Displays anomalies happened in the current time window for the selected category.
Category breakdown: Displays the attributes of the selected category. Only top 10 values of the selected category are displayed in the UI. You can click any value under the Top 10 Values list to view the list of events in the Sentinel Web interface.
The Categories list on the right changes to Subcategories and displays attributes of the selected category. You can sort them as per your requirement.
5.4 Creating BaselinesYou can create a baseline to use for anomaly detection. You must have at least a week’s worth of data before you can create a baseline.
1 Click the desired dashboard under the dashboard heading.
2 Click the option displayed in the Compare to field.
or
68 NetIQ Sentinel 7.0.1 User Guide

Click Show dashboard details.
3 Click Create baseline.
4 Read the confirmation message, then click Create.
5 After the baseline is created if you want to update the baseline with more amount of data then you can click Regenerate baseline.
After the baseline is created, you can use it to create an anomaly definition as described in Section 5.5, “Configuring Anomaly Detection,” on page 69.
5.5 Configuring Anomaly DetectionAfter you create a baseline, you can configure anomalies to use with the information gathered in the dashboard. This allows you to receive alerts when events occur outside of the baseline.
Section 5.5.1, “Creating an Anomaly Definition,” on page 69
Section 5.5.2, “Deploying an Anomaly Definition,” on page 70
Section 5.5.3, “Undeploying an Anomaly Definition,” on page 70
Section 5.5.4, “Managing Anomalies,” on page 71
5.5.1 Creating an Anomaly Definition
1 Log in to the Sentinel Web interface as a user with the Manage Dashboard permission.
2 Click the desired dashboard under the dashboard heading, then click Configure anomaly detection.
3 Click Create anomaly definition.
The Anomaly detection definition details screen is displayed.
4 Use the following information to create the anomaly definition:
Anomaly name: Specify a unique name for the anomaly.
Comparison type: Select and define the anomaly type. The options are:
Threshold: Provides a threshold for the events. If the events exceed the threshold, the anomaly is triggered.
Moving Average: Provides a comparison on the moving average of the events.
Ratio: Provides a comparison using the ratio of the events.
Historical: Provides a historical comparison of the events.
Baseline: Provides a comparison to an established baseline. You must have a custom baseline to use this option. For more information, see Section 5.4, “Creating Baselines,” on page 68.
As per your requirement, you can select the Comparison type and specify the anomaly definition.
Anomaly description: Specify a description for the anomaly. The description is displayed in the anomaly event.
Anomaly state: Define the state of the anomaly by selecting any one of the following:
Always active: You can use this option to keep the anomaly definition active always and trigger when the specified anomaly definition is met.
Analyzing Trends in Data 69

Only active for selected days and times: You can use this option to define the specific times for anomaly definition to trigger. When you select this option, it displays a default time grid. You can change the time grid and specify different time periods for the same anomaly definition by holding the Ctrl key.
NOTE: The timing that is displayed in the time grid is the local time.
Notification information: Select the information to define the notification information.
Severity: Select the severity of the notification. The options are 0 to 5.
After this anomaly definition fires: Specify the notification time gap to send e‐mail or events after an anomaly triggers.
Optionally send notification via e‐mail after the anomaly triggers: Fill in the following fields to send an e‐mail when the anomaly triggers.
E‐mail address: Specify the e‐mail addresses of the people who should receive notification when the anomaly occurs. Separate multiple e‐mail addresses with commas.
Subject: Specify a subject for the e‐mail.
Message: Specify a message for the e‐mail to explain the anomaly that occurred.
5 Click Save.
6 Continue with “Deploying an Anomaly Definition” on page 70.
5.5.2 Deploying an Anomaly Definition
After the anomaly definition is created, it must be deployed to be applied to the dashboard.
1 In the Sentinel Web interface, click Security Intelligence > Dashboard, then select the dashboard where you created the anomaly definition.
2 Click Configure anomaly detection.
The Anomaly detect screen is displayed.
3 Mouse over the anomaly definition you want to deploy, then click Deploy.
You receive a message that the anomaly definition was deployed.
5.5.3 Undeploying an Anomaly Definition
To undeploy the anomaly definition:
1 In the Sentinel Web interface, click Security Intelligence > Dashboard, then select the dashboard where you created the anomaly definition.
2 Click Configure anomaly detection.
3 Mouse over the anomaly definition you want to undeploy, then click Undeploy.
4 Click Undeploy again to verify that you want to perform this action.
You receive a message that the anomaly definition was undeployed.
70 NetIQ Sentinel 7.0.1 User Guide

5.5.4 Managing Anomalies
You can perform the following management tasks on the anomalies:
“Editing an Anomaly” on page 71
“Deleting an Anomaly” on page 71
Editing an Anomaly
1 In the Sentinel Web interface, click Security Intelligence > Dashboard, then select the dashboard where you created the anomaly definition.
2 Click Configure anomaly detection.
3 Mouse over the anomaly you want to edit, then click Edit.
4 Make any desired changes to the anomaly definition, then click Save.
Deleting an Anomaly
1 In the Sentinel Web interface, click Security Intelligence > Dashboard, then select the dashboard where you created the anomaly definition.
2 Click Configure anomaly detection.
3 Mouse over the anomaly you want to delete, then click Delete.
4 Click Delete again to verify that you want to perform this action.
5.6 Managing DashboardsYou cannot change the filter or classifier for an existing dashboard, because this changes all of the data. If you want to change the filter or classifier, you must create a new dashboard.
However, you can perform the following management tasks on dashboards:
Section 5.6.1, “Viewing a Dashboard,” on page 71
Section 5.6.2, “Renaming a Dashboard,” on page 72
Section 5.6.3, “Deleting a Dashboard,” on page 72
5.6.1 Viewing a Dashboard
1 In the Sentinel Web interface, click Security Intelligence > Dashboard, then select the dashboard that you want to view.
2 Click Show dashboard details to see the following information about the dashboard:
The classifiers used to create the dashboard.
The filter used to create the dashboard.
When the dashboard was created.
The amount of time data is retained for the dashboard.
Analyzing Trends in Data 71

5.6.2 Renaming a Dashboard
1 In the Sentinel Web interface, click Security Intelligence > Dashboard, then select the dashboard that you want to rename.
2 Click Show dashboard details in the toolbar.
3 Click Rename in the toolbar, then rename the dashboard.
4 Click Save to save the change.
5.6.3 Deleting a Dashboard
1 In the Sentinel Web interface, click Security Intelligence > Dashboard, then select the dashboard that you want to delete.
2 Click Show dashboard details in the toolbar.
3 Click Delete.
4 Click Delete again to verify that you want to perform this action.
5.7 Troubleshooting Section 5.7.1, “The Create Button Is Not Displayed,” on page 72
Section 5.7.2, “The Main Graph and the Time Slider Are Not Synchronized,” on page 72
Section 5.7.3, “Both Names for a Renamed Anomaly Are Displayed in the Filter,” on page 72
Section 5.7.4, “Dashboard Date Range Not Updated to in Real Time,” on page 73
5.7.1 The Create Button Is Not Displayed
If you access the Security Intelligence feature and the Create button is not displayed, the MongoDB database is not running. The solution is to restart the Sentinel system.
5.7.2 The Main Graph and the Time Slider Are Not Synchronized
The main graph and the time slider can display different data because of the potential differences in granularity.
5.7.3 Both Names for a Renamed Anomaly Are Displayed in the Filter
If an anomaly definition display name changes but the anomaly was fired in both the old name and the new name within the selected time range, the anomaly shows two filters: the old anomaly display name with its firing count and new anomaly display name with its firing count.
If you filter on the new anomaly, only the new anomaly name is shown in the list, but the Show x of y anomaly message shows x as the total count of the anomaly fired under the new name and y as the total count of the anomaly fired in both the new and old display names.
The x will never equal y if there are events fired in both names within selected date range.
72 NetIQ Sentinel 7.0.1 User Guide

For example, assume that there is an anomaly definition of DemoDef that was renamed to DemoDef‐nameChanged within the selected time range and it has fired under the old name 60 times and under the new name 180 times. In the filter drop‐down list, both anomalies are displayed, showing DemoDef (fired 60 times) and DemoDef‐nameChanged (fired 180 times) for a total of 240. If you filter on DemoDef, the filter message displays, Showing 60 of 240 anomalies. If you filter on DemoDef‐nameChanged, the filter message displays, Showing 180 of 240 anomalies.
5.7.4 Dashboard Date Range Not Updated to in Real Time
When the dashboard is bigger, the time granularity is bigger, so it page refreshes slowly. In another words, the date range for the bigger display takes longer to show a difference. Even though the auto refresh timer is the same, it might need to fire two times before you see any change in data.
Analyzing Trends in Data 73

74 NetIQ Sentinel 7.0.1 User Guide
6 6Configuring Dynamic Lists
Dynamic Lists are distributed list structures that can be used to store string elements, such as IP addresses, server names, or usernames. The lists are then used within a Correlation rule for a quick lookup to see whether an incoming event includes an element from the Dynamic List. Some examples of Dynamic Lists include:
Terminated user lists
Suspicious user watchlist
Privileged user watchlist
Authorized ports and services list
Authorized server list
NOTE: You must have the Manage Correlation Engine and Rules permission to create and manage Dynamic Lists.
6.1 Creating a Dynamic ListA Dynamic List can be built using the text values for any event ID. Elements can be added to the list manually or automatically whenever a Correlation rule fires.
Regardless of how the values were added, an element can be of the following types:
Persistent: The element is active until it is manually removed or until the maximum list size is reached.
Transient: The element is active only for a specified time after being added to the list.
Dynamic Lists can be created either in the Sentinel Control Center or in the Correlation Rule Builder:
Section 6.1.1, “Using the Sentinel Control Center to Create a Dynamic List,” on page 75
Section 6.1.2, “Using the Correlation Rule Builder to Create a Dynamic List,” on page 76
6.1.1 Using the Sentinel Control Center to Create a Dynamic List
1 Launch the Sentinel Control Center.
1a Log in to the Sentinel Web interface:
https://<IP_Address/DNS_Sentinel_server:8443>
IP_Address/DNS_Sentinel_server is the IP address or DNS name of the Sentinel server and 8443 is the default port for the Sentinel server.
1b In the tool bar, click Applications.
1c Click Launch Control Center.
Configuring Dynamic Lists 75
1d Click Yes to accept the security certificate.
1e Specify a username and password of a user that has rights to access the SCC, then click Login.
1f Click Accept or Accept Permanently to accept the security certificate and display the SCC.
2 Launch the Dynamic Lists window:
(Conditional) If the Configuration menu is not enabled, click the Configuration tab, then click
the Configuration menu > Dynamic Lists or click the icon in the toolbar.
(Conditional) If the Configuration menu is enabled, click the Configuration menu > Dynamic
Lists or click the icon in the toolbar.
3 Click Add.
4 Specify a name for the Dynamic List.
The name must start with a character. The name can contain only letters, digits, or underscores. The name cannot be changed after you create the Dynamic List. Therefore, specify a descriptive name.
5 To add elements, click Add.
6 Specify a name for the list element.
7 To keep the element active until it is manually removed or until the maximum list size is reached, select Make Persistent, then click OK.
or
To keep the element active only for a specific time, use the Transient elements life span fields to specify how long the element remains active.
The time period can range from 1 hour to 90 days.
8 Specify the maximum number of elements you want in the Dynamic List.
The maximum list size can be 100,000.
9 Click OK.
6.1.2 Using the Correlation Rule Builder to Create a Dynamic List
You can create Dynamic Lists while creating a Correlation rule. This option is provided in the Correlation Rule Builder to help you complete the rule creation process without switching to the Sentinel Control Center, and also if you want to just create an empty Dynamic List.
1 Log in to the Sentinel Web interface.
https://<IP_Address/DNS_Sentinel_server:8443>
IP_Address/DNS_Sentinel_server is the IP address or DNS name of the Sentinel server and 8443 is the default port for the Sentinel server.
2 Select Correlation from the navigation panel.
3 In the Subrule window, click Create a new expression.
4 In the Expression Builder, select an appropriate event field from Attributes.
5 In the Operator list, select inlist or not inlist.
6 In the Value section, click Create.
76 NetIQ Sentinel 7.0.1 User Guide

7 Specify the following information for the list:
List name: A descriptive name for the Dynamic List. The name must start with a character. The name can contain only letters, digits, or underscores.
Transient elements life span: The time for the element to remain active. The time can range from 1 hour to 90 days.
Maximum number of elements: The maximum number of elements the list should include.
8 Click OK.
The Dynamic List is created. However, you must launch the Sentinel Control Center to add elements to the list. You can complete the Correlation rule creation process, then add elements to the list. For more information on adding elements, see Section 6.1.1, “Using the Sentinel Control Center to Create a Dynamic List,” on page 75.
6.2 Managing Dynamic Lists Section 6.2.1, “Editing a Dynamic List,” on page 77
Section 6.2.2, “Deleting a Dynamic List,” on page 78
Section 6.2.3, “Removing Dynamic List Elements,” on page 78
6.2.1 Editing a Dynamic List
1 Launch the Sentinel Control Center. For more information, see Step 1 in Section 6.1.1, “Using the Sentinel Control Center to Create a Dynamic List,” on page 75.
2 Launch the Dynamic Lists window:
(Conditional) If the Configuration menu is not enabled, click the Configuration tab, then click
the Configuration menu > Dynamic Lists or click the icon in the toolbar.
(Conditional) If the Configuration menu is enabled, click the Configuration menu > Dynamic
Lists or click the .icon in the toolbar.
3 In the Dynamic Lists window, select the dynamic list you want to edit, then click View/Edit.
4 Make the necessary changes, then click OK.
The name cannot be changed.
NOTE: If you make changes to the transient life span on an active Dynamic List, the changes do not apply to elements already in the list. Elements that are already in the Dynamic List retain their original life span.
Configuring Dynamic Lists 77
6.2.2 Deleting a Dynamic List
You can delete only the dynamic lists that are not being used by Correlation rules or actions:
1 Launch the Sentinel Control Center. For more information, see Step 1 in Section 6.1.1, “Using the Sentinel Control Center to Create a Dynamic List,” on page 75.
2 Launch the Dynamic Lists window:
(Conditional) If the Configuration menu is not enabled, click the Configuration tab, then click
the Configuration menu > Dynamic Lists or click the icon in the toolbar.
(Conditional) If the Configuration menu is enabled, click the Configuration menu > Dynamic
Lists or click the .icon in the toolbar.
3 In the Dynamic Lists window, select the dynamic list you want to delete, then click Delete.
4 Click Yes to confirm deletion.
6.2.3 Removing Dynamic List Elements
There are several ways an element can be removed from a Dynamic List:
The element can be removed manually:
In the Dynamic List Properties window, select the element you want to delete, then click Delete.
The element can be removed by a Correlation rule action.
The element‘s life span can expire.
If the maximum number of elements for a Dynamic List is reached, elements are removed from the list to keep the list at or below the maximum list size. The transient elements are removed from oldest to newest before any persistent elements are removed.
78 NetIQ Sentinel 7.0.1 User Guide

7 7Integrating Identity Information with Sentinel Events
Section 7.1, “Overview,” on page 79
Section 7.2, “Integration with Identity Management Systems,” on page 80
Section 7.3, “Identity Browser,” on page 82
7.1 OverviewUsers in an IT environment have multiple accounts and sometimes multiple account identifiers per user. Normally, if a user has multiple account identifiers, Sentinel treats each identifier as a unique account.
This means a user could log in to Active Directory and an LDAP directory and Sentinel tracks these events, but Sentinel does not realize these events are related to the same user account.
In order to overcome this issues, Sentinel provides an integration framework to identity management systems to track the identities of for each user account and what events those identities have performed.
This integration provides functionality on several levels:
The Identity Browser provides the ability to look up the following information about a user:
Contact information
Accounts associated with that user
Most recent authentication events
Most recent access events
Most recent permissions changes
The Identity Browser lets you do a lookup from events
Reports and Correlation rules provide an integrated view of a userʹs true identity, even across multiple systems on which the user has separate accounts. For example, accounts like COMPANY\testuser; > cn=testuser,ou=engineering,o=company, and [email protected] can be mapped to the actual person who owns the accounts.
By displaying information about the people initiating a given action or people affected by an action, incident response times are improved and behavior‐based analysis is enabled.
Sentinel provides an optional integration with Novell Identity Manager. The figures and descriptions in this section are based on Identity Manager.
Sentinel synchronizes identity information with major identity management systems and stores local copies of key information about each identity. The following table summarizes the commonly used information provided:
Integrating Identity Information with Sentinel Events 79
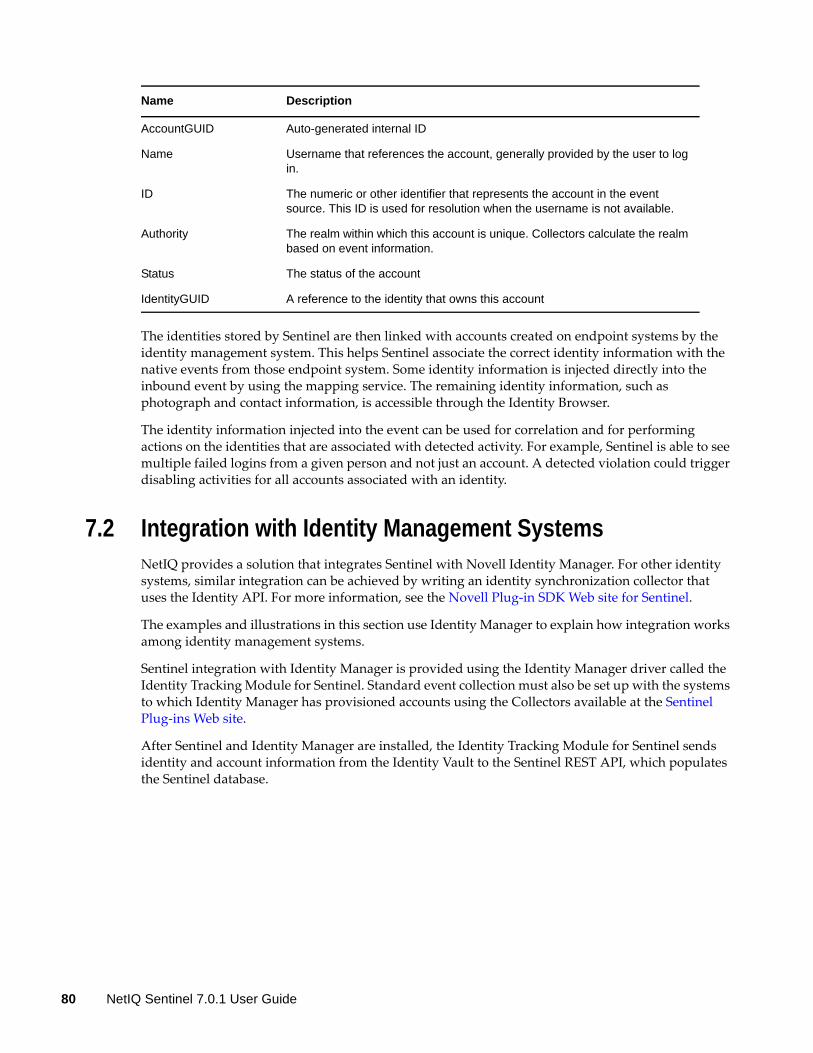
The identities stored by Sentinel are then linked with accounts created on endpoint systems by the identity management system. This helps Sentinel associate the correct identity information with the native events from those endpoint system. Some identity information is injected directly into the inbound event by using the mapping service. The remaining identity information, such as photograph and contact information, is accessible through the Identity Browser.
The identity information injected into the event can be used for correlation and for performing actions on the identities that are associated with detected activity. For example, Sentinel is able to see multiple failed logins from a given person and not just an account. A detected violation could trigger disabling activities for all accounts associated with an identity.
7.2 Integration with Identity Management SystemsNetIQ provides a solution that integrates Sentinel with Novell Identity Manager. For other identity systems, similar integration can be achieved by writing an identity synchronization collector that uses the Identity API. For more information, see the Novell Plug‐in SDK Web site for Sentinel.
The examples and illustrations in this section use Identity Manager to explain how integration works among identity management systems.
Sentinel integration with Identity Manager is provided using the Identity Manager driver called the Identity Tracking Module for Sentinel. Standard event collection must also be set up with the systems to which Identity Manager has provisioned accounts using the Collectors available at the Sentinel Plug‐ins Web site.
After Sentinel and Identity Manager are installed, the Identity Tracking Module for Sentinel sends identity and account information from the Identity Vault to the Sentinel REST API, which populates the Sentinel database.
Name Description
AccountGUID Auto-generated internal ID
Name Username that references the account, generally provided by the user to log in.
ID The numeric or other identifier that represents the account in the event source. This ID is used for resolution when the username is not available.
Authority The realm within which this account is unique. Collectors calculate the realm based on event information.
Status The status of the account
IdentityGUID A reference to the identity that owns this account
80 NetIQ Sentinel 7.0.1 User Guide

Figure 7-1 Sentinel Integration with IDM
The time required to initially populate the Sentinel database depends on the amount of data in the Identity Vault; identity information including photographs requires significantly more time to load.
The Identity Tracking Module for Sentinel also keeps the identity information synchronized as information is updated in the Identity Vault during normal Identity Manager operations.
After the identity and account information are loaded, a map named IdentityAccount is automatically generated in /var/opt/novell/sentinel/data/map_data. The map contains the following information:
Account Name
Authority
Customer Name
Identity GUID
Full Name
Department
Job Title
IdentityVault
Active Directory
Driver
Identity Tracking Module
for Sentinel
AccountsTable
IdentityTable
Active DirectoryDomain
JohnSmith
jsmith
LDAP Driver
LDAPDatabase
jsmith
REST API
ActiveDirectoryCollector
Driver/Application
DirXML-Accounts
AccountIdentifier Type
Account IdentifierSample Data
ADADADADLDAP
sAMAccountNameuserPrincipalNameDNassociationDN
[email protected]=John Smith,cn=users,dc=company,dc=com5de77f84f3ab534babbf13edd6540d77cn=jsmith,cn=users,dc=company,dc=com
Custom Events
Windows System Events
SentinelIT Environment
Identity Manager
Integrating Identity Information with Sentinel Events 81

Manager GUID
Account Status
IMPORTANT: An identity can have multiple accounts but one account cannot be assigned to multiple identities.
The identity map is automatically applied to all events from Collectors to look for an identical match between the information in the event and key fields in the map. The table below shows the fields that are populated if all of the map key fields and event data exactly match. These mappings are automatically configured and are not editable.
NOTE: To find a match, the event fields and map key fields must match exactly. This might require modifications to existing Collectors to enable them to parse or concatenate data to make these fields match the data from the Identity Vault.
After these fields are added to the event by the mapping service, they are used by Correlation rules, remediation actions, and reports in the Identity Tracking Solution Pack. In addition to using the content included in the Solution Pack, users can also perform the following actions:
Create Correlation rules based on identity in addition to account name. This allows you to look for similar events from a single user, which provides a more comprehensive view than looking at events from a single account
Create reports that show identity, including all accounts associated with a user
Use the Identity Browser to get more information about users and their activities
7.3 Identity BrowserThe Identity Browser in Sentinel allows you to search and view user profiles of the identities in the Sentinel database that have been synchronized from the identity management system. In addition to information from the identity management system, the Identity Browser also shows recent user activity that has been collected through the Sentinel Collectors.
7.3.1 Accessing the Identity Browser
1 Log in to the Sentinel Web interface.
2 Click People on the left side.
The Identity Browser is displayed.
Label Populated by which Column from IdentityAccount Map
InitUserDepartment Department
InitUserFullName Full Name
InitUserIdentity Identity GUID
TargetUserDepartment Department
TargetUserFullName Full Name
TargetUserIdentity Identity GUID
82 NetIQ Sentinel 7.0.1 User Guide
7.3.2 Performing a Search
The Identity Browser allows you to search for people to view what they have been doing. You can use the search box or click the arrow next to the search box for more options. As you start typing the information in the search field, the data is automatically displayed.
1 Access the Identity Browser.
For more information, see Section 7.3.1, “Accessing the Identity Browser,” on page 82.
2 Search for a user by typing in the search box. The search box is dynamic
or
Click the arrow next to the search box to display more search fields.
You can type letters to view all identities whose first or last name starts with the letters. For example, if you type the names Abraham, Abdullah, and so on are matched. For more information, see Section 7.3.3, “Searching,” on page 83.
3 If you used the search box, skip to Step 5. Otherwise, specify the search value for the users you are searching for.
For more information, about the search fields, see “Using the Search Fields” on page 84.
4 Click Search to perform the search, then click Close.
5 Click on the user name to view the information about the user.
6 Proceed to Section 7.3.4, “Viewing Profile Details,” on page 84 to view the details about the user.
7.3.3 Searching
You can search for users by using the search box or by using the search fields.
“Using the Search Box” on page 83
“Using the Search Fields” on page 84
Using the Search Box
The search box automatically uses the following logic to interpret the text you enter:
All letters and no spaces searches for the given name or surname.
All letters and a space between letter groups searches for the given name and surname. The surname match is a starts‐with, unless there is a trailing space.
All letters with a comma in the middle is a match of the surname and given name. The given name match is starts‐with unless there is a trailing space.
Anything with a @ in it is a starts‐with match for e‐mail address.
All digits, or letters and digits but no telephone punctuation characters is a starts‐with match for workforce ID.
Digits in addition to a leading +, and spaces, hyphens, periods, or parentheses is a starts‐with match for a telephone number.
Alphanumeric, or all numeric with no spaces, or all numbers with spaces is a starts‐with match for the workforce ID.
Integrating Identity Information with Sentinel Events 83
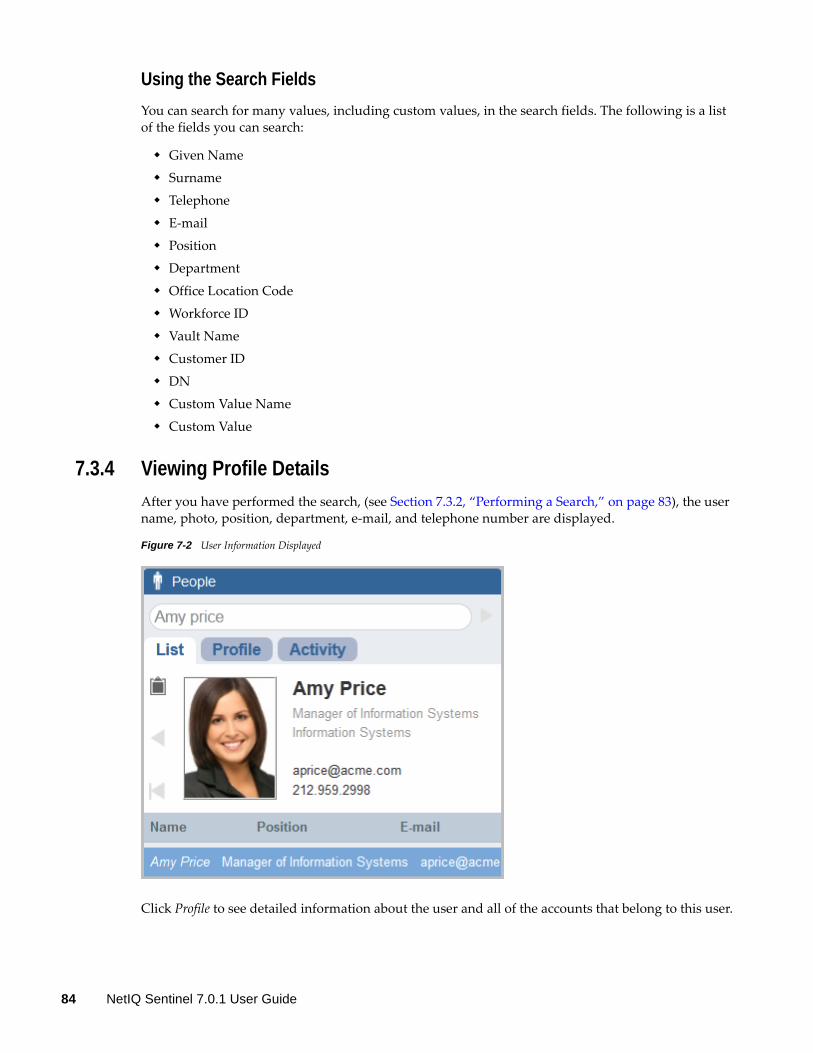
Using the Search Fields
You can search for many values, including custom values, in the search fields. The following is a list of the fields you can search:
Given Name
Surname
Telephone
E‐mail
Position
Department
Office Location Code
Workforce ID
Vault Name
Customer ID
DN
Custom Value Name
Custom Value
7.3.4 Viewing Profile Details
After you have performed the search, (see Section 7.3.2, “Performing a Search,” on page 83), the user name, photo, position, department, e‐mail, and telephone number are displayed.
Figure 7-2 User Information Displayed
Click Profile to see detailed information about the user and all of the accounts that belong to this user.
84 NetIQ Sentinel 7.0.1 User Guide

You can use the clipboard functionality to copy the data of the user’s profile and account information. Click the clipboard icon to the left of the user’s photo and their information is now in the clipboard. You can paste this information into a text editor.
7.3.5 Viewing Activity
You can view the recent activity of the user through the Identity Browser.
Authentication information
Access events
Permission changes
Select one or more of these options, then click Show Recent Activity. The activity is displayed in the search panel of the Sentinel Web interface.
Integrating Identity Information with Sentinel Events 85

86 NetIQ Sentinel 7.0.1 User Guide

8 8Manually Performing Actions on Events
Administrators can configure event routing rules to automatically perform specific actions on events, as described in “Configuring Event Routing Rules” in the NetIQ Sentinel 7.0.1 Administration Guide. However, Sentinel allows users to manually perform actions on events returned in searches.
This allows users to perform the desire actions as they are viewing events.
Section 8.1, “Accessing Event Actions,” on page 87
Section 8.2, “Prerequisites for Assigning Actions to Events,” on page 87
Section 8.3, “Assigning Actions to Events,” on page 87
Section 8.4, “Configuring Event Actions,” on page 88
8.1 Accessing Event ActionsTo access the event actions:
1 Log in to the Sentinel Web interface as a user who is a member of one of the following roles:
Administrator
Incident Administrator
Security Policy Administrator
User
2 Click Event Actions on the left.
If Event Actions is not displayed, you do not have the proper rights to access this feature.
8.2 Prerequisites for Assigning Actions to EventsIn order to manually assign actions to select events, you must perform the following tasks:
Configure the Integrators for the Actions: There are default actions available to perform.
However, the integrators for these actions must be configured before the actions can be executed. For more information, see “Configuring the Default Integrators” in the NetIQ Sentinel 7.0.1 Administration Guide.
Perform a Search: You must have the results of a search available in order to perform actions on
selected events. For more information about searching, see Chapter 2, “Searching Events,” on page 13.
8.3 Assigning Actions to Events1 Access Event Actions in the Sentinel Web interface.
Manually Performing Actions on Events 87
For more information, see Section 8.1, “Accessing Event Actions,” on page 87.
2 Perform a search.
If you have not performed a search, you cannot execute an action.
3 Select the events in the search to perform actions on.
4 In the Actions field, select the desired action from the drop‐down box.
You can add or remove items from this list. For more information, see Section 8.4, “Configuring Event Actions,” on page 88.
5 Click Execute.
6 In the Results field, view the results of the action.
8.4 Configuring Event ActionsAdministrators can control what actions can manually performed on events.
Section 8.4.1, “Creating a New Event Action,” on page 88
Section 8.4.2, “Cloning an Event Action,” on page 89
Section 8.4.3, “Moving an Event Action,” on page 89
Section 8.4.4, “Deleting an Event Action,” on page 89
8.4.1 Creating a New Event Action
If you have imported new action plug‐ins into Sentinel and you want to create an event action for the action plug‐in:
1 Access the Sentinel Control Center.
1a Log in to the Sentinel Web interface:
https://<IP_Address/DNS_Sentinel_server:8443>
IP_Address/DNS_Sentinel_server is the IP address or DNS name of the Sentinel server and 8443 is the default port for the Sentinel server.
1b In the tool bar, click Applications.
1c Click Launch Control Center.
1d Click Yes to accept the security certificate.
1e Specify a username and password of a user that has rights to access the SCC, then click Login.
1f Click Accept or Accept Permanently to accept the security certificate and display the SCC.
2 Click the Configuration tab.
3 From the menu, click Configuration > Event Actions Configuration.
4 Click Add to add a new action.
5 Use the following information to create the new event action:
Name: Specify a unique name for the event action.
Description: Specify a description for the new event action.
Action: Select the desired action from the drop‐down list.
88 NetIQ Sentinel 7.0.1 User Guide

6 Click Add Action.
7 Create a new action by following the instructions in “Adding an Action” in the NetIQ Sentinel 7.0.1 Administration Guide.
8.4.2 Cloning an Event Action
You can clone an existing event action add give it another name.
1 Access the Sentinel Control Center. For more information, see Step 1 in Section 8.4.1, “Creating a New Event Action,” on page 88.
2 Click the Configuration tab.
3 On the menu, click Configuration > Event Actions Configuration.
4 Select an event action, then click Clone.
5 Change the name to a unique name, then click OK.
8.4.3 Moving an Event Action
You can display the event actions in any order. The order in the Event Actions Configuration page is the order that is shown in the Sentinel Web interface.
To move event actions:
1 Access the Sentinel Control Center. For more information, see Step 1 in Section 8.4.1, “Creating a New Event Action,” on page 88.
2 Click the Configuration tab.
3 On the menu, click Configuration > Event Actions Configuration.
4 Select the event action you want to move, then click Up or Down until the event action is in the correct location.
8.4.4 Deleting an Event Action
1 Access the Sentinel Control Center. For more information, see Step 1 in Section 8.4.1, “Creating a New Event Action,” on page 88.
2 Click the Configuration tab.
3 From the menu, click Configuration > Event Actions Configuration.
4 Select the event action you want to delete, then click Delete.
5 Click Yes to confirm the deletion.
Manually Performing Actions on Events 89

90 NetIQ Sentinel 7.0.1 User Guide
9 9Configuring Tags
Tags are user‐defined values that can be used to logically group data collection objects such as event sources, event source servers, Collector Managers, Collector plug‐ins, event routing rules, report templates, and report results. Tags help you to filter object lists for the data collection objects and also to augment incoming data. You can search for events, report templates, and report definitions that are tagged with a particular tag.
NOTE: Only users in the Manage Tags role can create and manage tags.
Section 9.1, “Overview,” on page 91
Section 9.2, “The Tags Interface,” on page 92
Section 9.3, “Creating a Tag,” on page 92
Section 9.4, “Managing Tags,” on page 93
Section 9.5, “Performing Text Searches for Tags,” on page 94
Section 9.6, “Deleting Tags,” on page 94
Section 9.7, “Associating Tags with Objects,” on page 94
Section 9.8, “Viewing Tagged Events,” on page 96
9.1 OverviewYou can associate objects with more than one tag. You can, for example, create tags related to regulations (PCI) or compromised systems or network infrastructure such as routers, switches, and firewalls. Some organizations need to define data retention or data viewing policies based on the geographic location, so tags can be used to tag event sources based on different locations.
When ESM objects such as event sources, event servers, Collector Managers, or Collector plug‐ins are tagged, all the events from those ESM objects are tagged with that value. The tag value is placed in a reserved variable, rv145. However, events generated before tagging the ESM objects are not tagged. Sentinel does not perform retroactive tagging of data that is already stored because it is not an accepted practice to modify events that are already stored.
You must have the appropriate permission to view events that are tagged with specific tags. For example, only users in the PCI Compliance Auditor role can view events that are tagged with at least one of the regulation‐related tags such as PCI, SOX, HIPAA, NERC_CIP, FISMA, GLBA, NISPOM, JSOX, and ISO/IEC_27002:2005.
Configuring Tags 91

9.2 The Tags InterfaceThe Tags interface lists the tags available in the system and allows you to manage the tags. You can perform text‐refined searches to find the tags that you are looking for. The interface also provides options such as maintaining a list of favorite tags and searching tagged events.
As you mouse over a tag, you can see the icons available to manage the tag. The number next to each tag indicates the number of objects associated with the tag. For more information on creating new tags, see Section 9.3, “Creating a Tag,” on page 92.
The Tag icon is available in various parts of the Sentinel interface, which allows you to quickly add tags to the desired data collection objects such as event sources, event source servers, Collector
Managers, Collector plug‐ins, report templates, and report results. When you click the Tag icon, the Tags dialog box is displayed that allows you to select tags and to create new tags.
9.3 Creating a Tag1 Log in to the Sentinel Web interface as a user in the Manage Tags role.
https://<IP_Address/DNS_Sentinel_server:8443>
IP_Address/DNS_Sentinel_server is the IP address or DNS name of the Sentinel server and 8443 is the default port for the Sentinel server.
2 Select Tags in the navigation panel on the left or click the Tag icon in the appropriate data object interface to which you want to associate tags.
3 Click Create.
4 Specify a name for the tag.
Tags have the following naming conventions, and a warning message is displayed if the name you specify does not comply with the following conventions:
Tag names should not be more than 20 characters.
There should not be any white space as part of the tag name.
92 NetIQ Sentinel 7.0.1 User Guide
A tag name is not case‐sensitive. You cannot create two tags with identical names except for capitalization. For example, you cannot have the tag names IDM and idm, because both are perceived as the same name.
Articles such as a and the cannot be tag names.
5 Specify an optional description for the tag.
If the tag name is available, a message is displayed.
If a tag with the same name already exists, a message is displayed indicating the name is not unique. You must specify a different name for the tag.
6 Click Save.
9.4 Managing Tags Section 9.4.1, “Sorting Tags,” on page 93
Section 9.4.2, “Adding and Removing Tags from Favorites,” on page 93
Section 9.4.3, “Viewing and Modifying Tags,” on page 94
9.4.1 Sorting Tags
You can sort tags either based on their names or based on the number of objects associated with the tags.
1 Log in to the Sentinel Web interface as a user in the Manage Tags role.
2 Select Tags in the navigation panel, then click More.
3 (Conditional) To sort the tags in the alphabetical order, select Sort by Name.
4 (Conditional) To sort the tags based on the number of objects associated with them, select Sort by Count.
The Tags are sorted according to the selection.
9.4.2 Adding and Removing Tags from Favorites
You can add your frequently used tags to the Favorites section so that it is easier to locate them and associate them with objects. When a tag is added to the Favorites section, it is removed from the Other section.
1 Log in to the Sentinel Web interface as a user in the Manage Tags role.
2 Select Tags in the navigation panel on the left.
3 To add or remove a tag from Favorites, select the tag, then click the Favorites icon.
Configuring Tags 93
9.4.3 Viewing and Modifying Tags
You can modify only the description of a tag.The tag name cannot be modified because it might be used to tag events and other data collection objects, and it is not an accepted practice to modify events that are already stored. Therefore, to modify the name of a tag, you must create a new tag.
1 Log in to the Sentinel Web interface as a user in the Manage Tags role.
2 Select Tags in the navigation panel on the left.
3 Select the tag that you want to edit, and click the Edit icon.
4 Modify the description as necessary, then click Save.
9.5 Performing Text Searches for TagsThis option is useful when you want to look for a particular tag.
1 Log in to the Sentinel Web interface as a user in the Manage Tags role.
2 Select Tags in the navigation panel on the left.
3 To search for a particular tag, specify the name or description of the tag or a keyword. To search for multiple tags, specify the tag names separated by the space character.
The tag that matches the keyword is displayed.
9.6 Deleting Tags1 Log in to the Sentinel Web interface as a user in the Manage Tags role.
2 Select Tags in the navigation panel on the left.
3 Select the tag that you want to delete, then click the Delete icon.
The Sentinel tag is a system tag that tags all Sentinel internal events, and cannot be deleted.
4 Click Delete to confirm deletion.
9.7 Associating Tags with ObjectsYou can associate tags with event sources, event source servers, Collector Managers, Collector Plug‐ins, event routing rules, and reports and report templates. You can add more than one tag to a data collection object. However, the rv145 field, which stores the tag value, can hold a maximum of 256 characters. Therefore, the maximum number of tags that you can associate with an object depends on the length of the tag name.
Section 9.7.1, “Associating Tags with Event Routing Rules,” on page 95
Section 9.7.2, “Associating Tags with Event Sources,” on page 95
Section 9.7.3, “Associating Tags with Collector Managers,” on page 95
Section 9.7.4, “Associating Tags with Event Sources Servers,” on page 95
Section 9.7.5, “Associating Tags with Collector Plug‐Ins,” on page 95
Section 9.7.6, “Associating Tags with Report Results and Report Definitions,” on page 96
94 NetIQ Sentinel 7.0.1 User Guide

9.7.1 Associating Tags with Event Routing Rules
1 Log in to the Sentinel Web interface as a user in the administrator role.
2 Click Routing in the toolbar, then click Create.
3 Specify a name and filter criteria for the rule.
4 Click Select tag, then select the tags that you want to associate with the rule.
5 Click Save.
9.7.2 Associating Tags with Event Sources
1 Log in to the Sentinel Web interface as a user in the administrator role.
2 Select Collection > Event Sources.
3 Select the event sources that you want to associate with the tag.
4 Select the Configure icon, then select Tags.
5 Select the tags you want to associate, then click Set.
9.7.3 Associating Tags with Collector Managers
1 Log in to the Sentinel Web interface as a user in the administrator role.
2 Select Collection > Event Sources.
3 From the Collector Managers section, select one or more of the Collector Managers that you want to associate with the tag.
4 Select the Configure icon, then select Tags.
5 Select the tags you want to associate, then click Set.
9.7.4 Associating Tags with Event Sources Servers
1 Log in to the Sentinel Web interface as a user in the administrator role.
2 Select Collection > Event Sources.
3 From the Event Source Servers section, select one or more event source servers that you want to associate with the tag.
4 Select the Configure icon, then select Tags.
5 Select the tags you want to associate, then click Set.
9.7.5 Associating Tags with Collector Plug-Ins
1 Log in to the Sentinel Web interface as a user in the administrator role.
2 Select Collection > Event Sources.
3 From the Collector Plugins section, select one or more of the Collector plug‐ins that you want to associate with the tag.
4 Select the Configure icon, then select Tags.
5 Select the tags you want to associate, then click Set.
Configuring Tags 95

9.7.6 Associating Tags with Report Results and Report Definitions
NOTE: When a tag is set on a report definition, the report results under the report definition inherit the tag by default. Inherited tags for a report result appear disabled in the Tag selector dialog box.
1 Log in to the Sentinel Web interface.
2 Select Reports in the navigation panel on the left.
3 Select the report result or the report definition that you want to associate with a tag.
4 Do one of the following:
Select Tags from the more drop‐down list.
Click Edit at the bottom left pane.
5 Select one or more tags that you want to associate with selected reports.
6 Click Set.
9.8 Viewing Tagged Events1 Log in to the Sentinel Web interface.
2 Do either of the following:
From the Tags panel, select the tag for which you want to view events, then select the Search
icon.
In the Search field, click the Tag icon, select the desired tags, then click OK. Click Search.
In the Search field, specify rv145:<tagname> or @<tagname> as the search criteria, then click Search.
96 NetIQ Sentinel 7.0.1 User Guide
10 10Viewing Events
Section 10.1, “Overview,” on page 97
Section 10.2, “Accessing the Active Views Tab,” on page 98
Section 10.3, “Reconfiguring Total Display Time,” on page 99
Section 10.4, “Viewing Real‐Time Events,” on page 99
Section 10.5, “Managing Events,” on page 100
Section 10.6, “Managing Columns,” on page 109
Section 10.7, “Taking a Snapshot of a Navigator Window,” on page 110
10.1 OverviewSentinel displays events in near‐real time through the Active Views tab in the Sentinel Control Center. In the Active Views tab, you can:
View events occurring in near‐real time
Investigate events
Graph events
Invoke right‐click functions
Initiate manual incidents and remediation workflows
An event represents a normalized log record reported to Sentinel from a third‐party security, network, or application device or from an internal Sentinel source. There are several types of events:
External events (events received from a security device), such as:
An attack detected by an intrusion detection system (IDS)
A successful login reported by an operating system
A customer‐defined situation such as a user accessing a file
Internal events (an event generated by Sentinel), including:
A Correlation rule being disabled
The database filling up
You can monitor the events in a tabular form or you can use different types of charts, you can perform queries for recent events.
NOTE: You must have the Create and use Active Views permission to use the Active Views feature.
Viewing Events 97
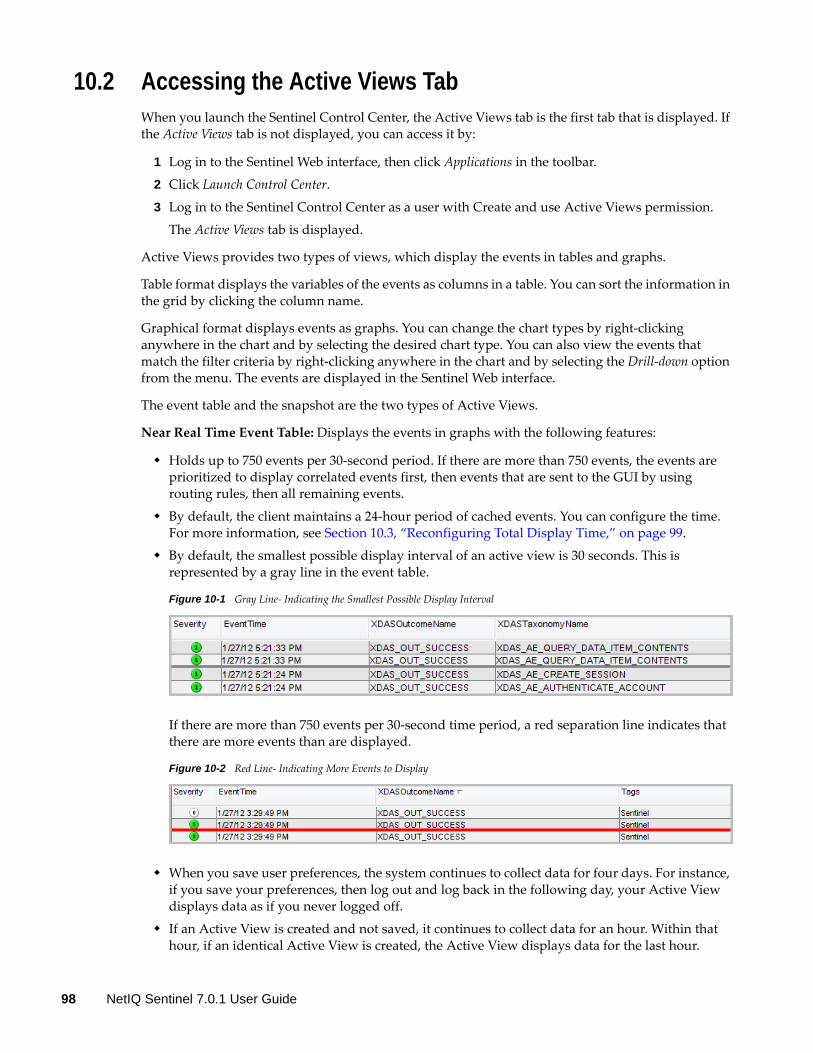
10.2 Accessing the Active Views TabWhen you launch the Sentinel Control Center, the Active Views tab is the first tab that is displayed. If the Active Views tab is not displayed, you can access it by:
1 Log in to the Sentinel Web interface, then click Applications in the toolbar.
2 Click Launch Control Center.
3 Log in to the Sentinel Control Center as a user with Create and use Active Views permission.
The Active Views tab is displayed.
Active Views provides two types of views, which display the events in tables and graphs.
Table format displays the variables of the events as columns in a table. You can sort the information in the grid by clicking the column name.
Graphical format displays events as graphs. You can change the chart types by right‐clicking anywhere in the chart and by selecting the desired chart type. You can also view the events that match the filter criteria by right‐clicking anywhere in the chart and by selecting the Drill‐down option from the menu. The events are displayed in the Sentinel Web interface.
The event table and the snapshot are the two types of Active Views.
Near Real Time Event Table: Displays the events in graphs with the following features:
Holds up to 750 events per 30‐second period. If there are more than 750 events, the events are prioritized to display correlated events first, then events that are sent to the GUI by using routing rules, then all remaining events.
By default, the client maintains a 24‐hour period of cached events. You can configure the time. For more information, see Section 10.3, “Reconfiguring Total Display Time,” on page 99.
By default, the smallest possible display interval of an active view is 30 seconds. This is represented by a gray line in the event table.
Figure 10-1 Gray Line‐ Indicating the Smallest Possible Display Interval
If there are more than 750 events per 30‐second time period, a red separation line indicates that there are more events than are displayed.
Figure 10-2 Red Line‐ Indicating More Events to Display
When you save user preferences, the system continues to collect data for four days. For instance, if you save your preferences, then log out and log back in the following day, your Active View displays data as if you never logged off.
If an Active View is created and not saved, it continues to collect data for an hour. Within that hour, if an identical Active View is created, the Active View displays data for the last hour.
98 NetIQ Sentinel 7.0.1 User Guide
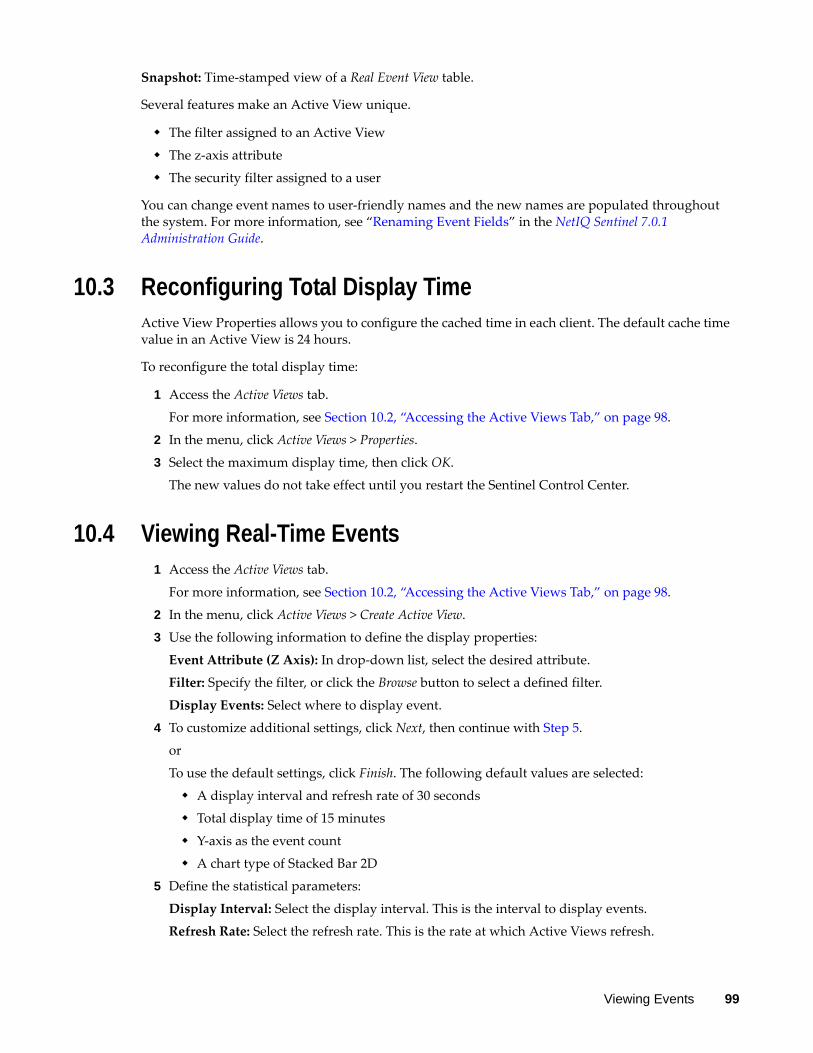
Snapshot: Time‐stamped view of a Real Event View table.
Several features make an Active View unique.
The filter assigned to an Active View
The z‐axis attribute
The security filter assigned to a user
You can change event names to user‐friendly names and the new names are populated throughout the system. For more information, see “Renaming Event Fields” in the NetIQ Sentinel 7.0.1 Administration Guide.
10.3 Reconfiguring Total Display TimeActive View Properties allows you to configure the cached time in each client. The default cache time value in an Active View is 24 hours.
To reconfigure the total display time:
1 Access the Active Views tab.
For more information, see Section 10.2, “Accessing the Active Views Tab,” on page 98.
2 In the menu, click Active Views > Properties.
3 Select the maximum display time, then click OK.
The new values do not take effect until you restart the Sentinel Control Center.
10.4 Viewing Real-Time Events1 Access the Active Views tab.
For more information, see Section 10.2, “Accessing the Active Views Tab,” on page 98.
2 In the menu, click Active Views > Create Active View.
3 Use the following information to define the display properties:
Event Attribute (Z Axis): In drop‐down list, select the desired attribute.
Filter: Specify the filter, or click the Browse button to select a defined filter.
Display Events: Select where to display event.
4 To customize additional settings, click Next, then continue with Step 5.
or
To use the default settings, click Finish. The following default values are selected:
A display interval and refresh rate of 30 seconds
Total display time of 15 minutes
Y‐axis as the event count
A chart type of Stacked Bar 2D
5 Define the statistical parameters:
Display Interval: Select the display interval. This is the interval to display events.
Refresh Rate: Select the refresh rate. This is the rate at which Active Views refresh.
Viewing Events 99

Total Display Time: Specify the amount of time to display the chart.
Y‐axis: Set the Y axis to be either the total event count or event count per second.
6 Click Next.
7 Select your chart type from the drop‐down list:
Stacked Bar 2D
Bar 3D
Line
Ribbon
8 Click Finish.
The five buttons to the left of the chart perform the following functions:
Lock Chart or Unlock Chart: Used when performing a drill‐down, zoom in, zoom out, zoom to selection, and when saving a chart as an .html file. When you click the Lock button, you have additional options:
Zoom In: Zooms in without changing any of the time settings of the chart.
Zoom Out: Zooms out without changing any of the time settings of the chart.
Zoom to Selection: Zooms in on a selection of time intervals of events.
Snapshot Active View: Saves an .html file with the chart as an image and events in a tabular format.
Increase Display Interval: Increases the display time interval for incoming events.
Decrease Display Interval: Decreases the display time interval for incoming events.
Increase Display Time: Increases the time interval along the x‐axis.
Decrease Display Time: Decreases the time interval along the x‐axis.
10.5 Managing EventsIn the table view, you can manage one or more events. Select the event or events you want to manage, then right‐click and select the option.
Section 10.5.1, “Showing and Hiding Event Details,” on page 101
Section 10.5.2, “Sending Mail Messages about Events and Incidents,” on page 101
Section 10.5.3, “Creating Incidents,” on page 101
Section 10.5.4, “Adding Events to an Incident,” on page 102
Section 10.5.5, “Viewing Events That Trigger Correlated Events,” on page 102
Section 10.5.6, “Executing Actions on Events,” on page 102
Section 10.5.7, “Investigating an Event or Events,” on page 103
Section 10.5.8, “Accessing the Active Browser,” on page 105
Section 10.5.9, “Viewing Advisor Data,” on page 106
Section 10.5.10, “Viewing Asset Data,” on page 106
Section 10.5.11, “Viewing Vulnerabilities,” on page 107
100 NetIQ Sentinel 7.0.1 User Guide
Section 10.5.12, “Viewing User Information,” on page 109
Section 10.5.13, “Viewing the Targets,” on page 109
10.5.1 Showing and Hiding Event Details
To show details in a Real Time Event Table of the Navigator or Snapshot, double‐click or right‐click an event, then click Show Details.
The details display in the left panel of the Real Time Event Table.
To close the Event Details window in a Real Time Event Table of the Navigator or Snapshot, right‐click an event, then click Show Details.
10.5.2 Sending Mail Messages about Events and Incidents
To send mail messages from within the Sentinel Control Center, you must have an SMTP integrator that is configured with connection information and with the SentinelDefaultEMailServer set to True. For more information on configuring the SMTP Integrator, see “Configuring Integrators” in the NetIQ Sentinel 7.0.1 Administration Guide.
To send an event message by e‐mail:
1 In a Real Time Event Table, right‐click an event or a group of events, then select Send Email.
The e‐mail is sent to the specified recipients.
To e‐mail an incident:
1 After you save your incident, click the Incidents tab, Incidents > Incidents View.
2 Click All Incidents in the Switch View drop‐down list located at the bottom right corner.
3 Double‐click an incident.
4 Click the Email Incident button.
5 Provide the following information:
Email Address
Email Subject
Email Message
6 Click OK.
The e‐mail messages have .html attachments that address incident details, events, assets, vulnerabilities, advisor information, attachment information, incident notes, and incident history.
10.5.3 Creating Incidents
Creating an incident is useful in grouping a set of events together to indicate a pattern of interest, such an attack.
You must have the View or create incidents and add events to incidents permission to create incidents.
Viewing Events 101

If events are not initially displayed in a newly created incident, it is probably because of a lag in the time between display in the Real Time Events window and insertion into the event store. It takes a few minutes for the original events to be inserted into the event store and displayed in the incident.
1 Access the Active Views tab.
For more information, see Section 10.2, “Accessing the Active Views Tab,” on page 98.
2 In a Real Time Event Table, select an event or a group of events and right‐click.
3 Select Create Incident.
4 Follow the steps in Section 12.2, “Creating Incidents,” on page 123.
10.5.4 Adding Events to an Incident
You must have the View or create incidents and add events to incidents permission to add events to Incidents.
1 Access the Active Views tab.
For more information, see Section 10.2, “Accessing the Active Views Tab,” on page 98.
2 In a Real Time Event Table, select an event or a group of events and right‐click.
3 Select Add To Incident.
4 Click Browse, then click Search to list the available incidents.
You can define your criteria to better search for a particular incident or incidents in the Select Incident window.
5 Select an incident, then click Add.
6 Click OK.
If events are not initially displayed in a newly created incident, it is probably because of a lag in the time between display in the Real Time Events window and insertion into the event store. It takes a few minutes for the original events to be inserted into the event store and display in the incident.
10.5.5 Viewing Events That Trigger Correlated Events
1 Access the Actives Views tab.
For more information, see Section 10.2, “Accessing the Active Views Tab,” on page 98.
2 In the Real Time Event Table, right‐click a correlated event, then select View Trigger Events.
The View Trigger Events option is enabled only for Correlated events. Section 10.5.13, “Viewing the Targets,” on page 109. The events that generated the correlation event are displayed in the Sentinel Web interface.
10.5.6 Executing Actions on Events
You can execute the following actions on events:
Log to File
Log to Syslog
Send Email
102 NetIQ Sentinel 7.0.1 User Guide
Send SNMP trap
Send via Sentinel Link
1 Access the Actives Views tab.
For more information, see Section 10.2, “Accessing the Active Views Tab,” on page 98.
2 In a Real Time Event Table, select an event or a group of events, right‐click, then select the action you want to execute.
10.5.7 Investigating an Event or Events
You can use the Active Views tab to investigate events in two ways:
You can perform an event query for the last hour on a single event for:
Other events with the same target IP address
Other events with the same source (initiator) IP address
Other targets with the same event name
NOTE: You cannot perform a query on a null (empty) field.
You can graphically display the mappings between any two fields in the selected events. This is particularly useful to view the relationship between the initiatiors (IP, port, event, sensor type, Collector) and the targets (IP, port, event, sensor type, Collector name) of the selected events, but any fields can be used
Viewing Events 103
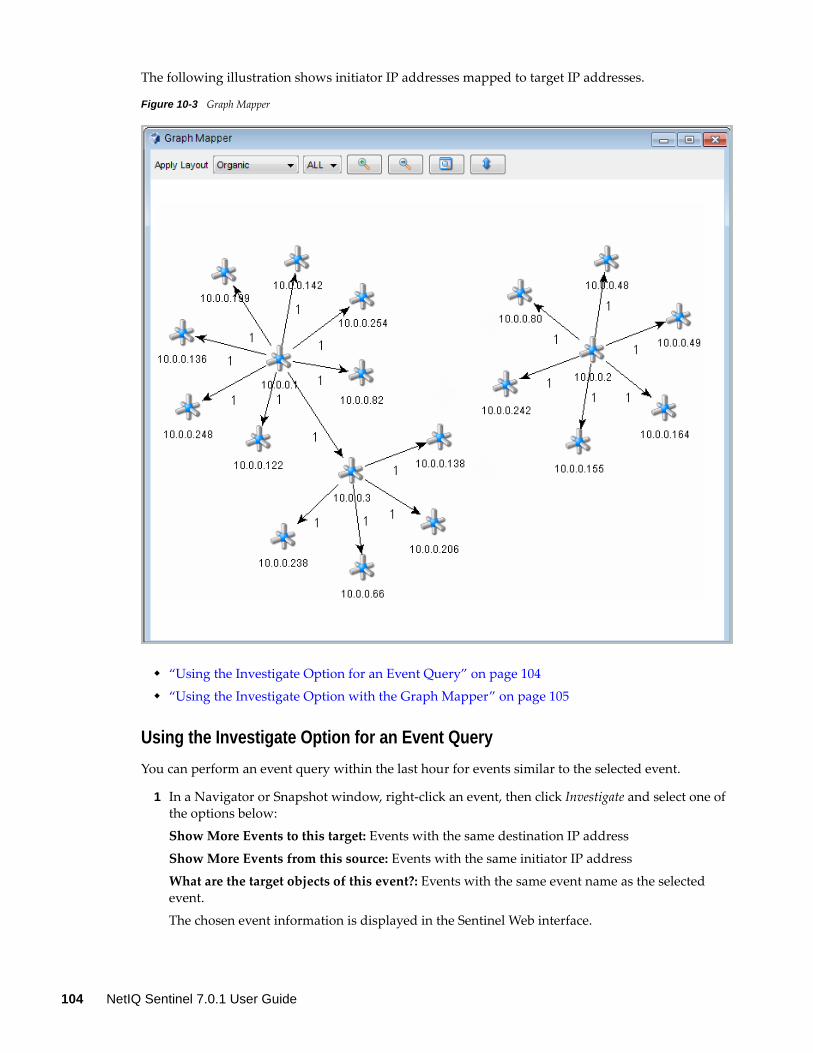
The following illustration shows initiator IP addresses mapped to target IP addresses.
Figure 10-3 Graph Mapper
“Using the Investigate Option for an Event Query” on page 104
“Using the Investigate Option with the Graph Mapper” on page 105
Using the Investigate Option for an Event Query
You can perform an event query within the last hour for events similar to the selected event.
1 In a Navigator or Snapshot window, right‐click an event, then click Investigate and select one of the options below:
Show More Events to this target: Events with the same destination IP address
Show More Events from this source: Events with the same initiator IP address
What are the target objects of this event?: Events with the same event name as the selected event.
The chosen event information is displayed in the Sentinel Web interface.
104 NetIQ Sentinel 7.0.1 User Guide

Using the Investigate Option with the Graph Mapper
To create a graph map:
1 In a Real Time Event Table, right‐click one or more events, then select Investigate > Show Graph.
2 Select the desired information in the From and To fields, then click Finish.
3 In the Graph Mapper window, select how the information is displayed:
Circular
Hierarchical
Organic
Orthogonal
10.5.8 Accessing the Active Browser
The Active Browser provides the ability to browse through a selected set of data to look for patterns and perform investigation. You can view the selected events in the Active Views in the Active Browser. You can also perform all the right‐click activities that are available in Active Views in the Active Browser.
“Viewing Events in the Active Browser” on page 105
“Searching in the Active Browser” on page 105
“Adding Attributes in the Active Browser” on page 105
Viewing Events in the Active Browser
1 Access the Active Views tab.
For more information, see Section 10.2, “Accessing the Active Views Tab,” on page 98.
2 Select the events you want to view in the Active Browser.
3 Right‐click the events, then select View in Active Browser.
The selected events display in the Active Browser window.
Searching in the Active Browser
1 Access the Active Views tab.
For more information, see Section 10.2, “Accessing the Active Views Tab,” on page 98.
2 Specify the value or text you want to search for in the Search field, then click the Search button.
You can move between the various searches by using the Forward and Backward buttons above the search field.
Adding Attributes in the Active Browser
1 Access the Active Views tab.
For more information, see Section 10.2, “Accessing the Active Views Tab,” on page 98.
2 Click the Add an attribute for categorization button.
Viewing Events 105
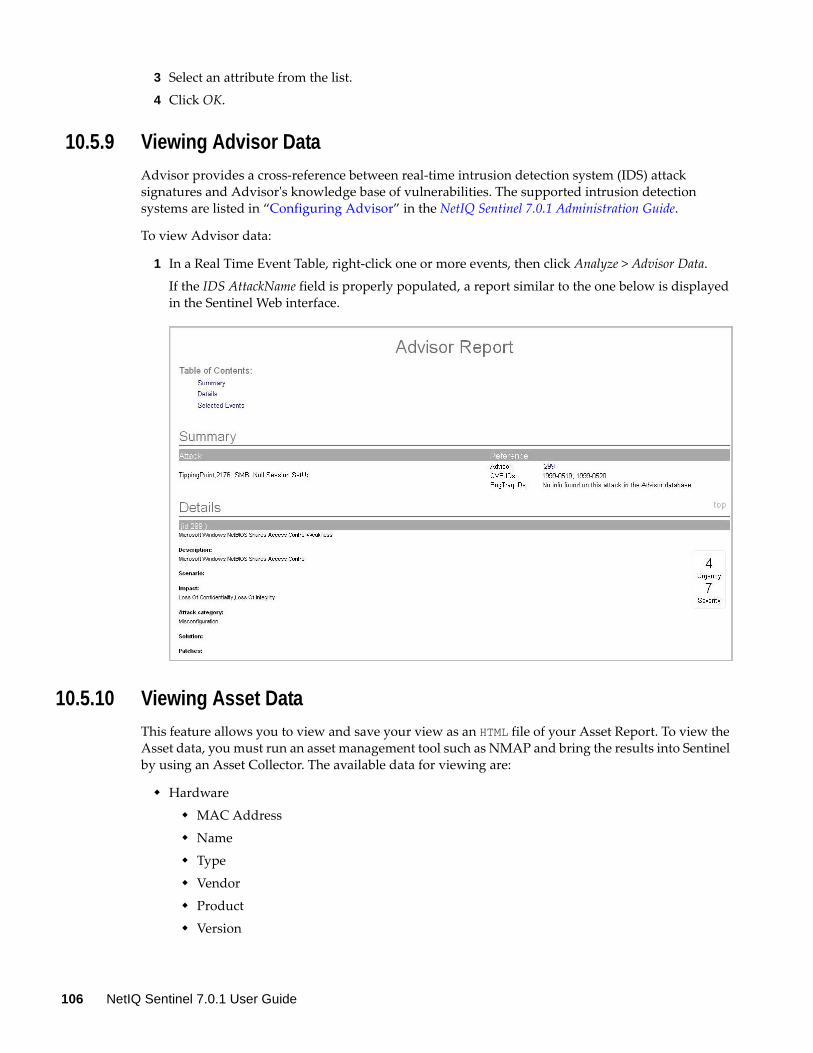
3 Select an attribute from the list.
4 Click OK.
10.5.9 Viewing Advisor Data
Advisor provides a cross‐reference between real‐time intrusion detection system (IDS) attack signatures and Advisorʹs knowledge base of vulnerabilities. The supported intrusion detection systems are listed in “Configuring Advisor” in the NetIQ Sentinel 7.0.1 Administration Guide.
To view Advisor data:
1 In a Real Time Event Table, right‐click one or more events, then click Analyze > Advisor Data.
If the IDS AttackName field is properly populated, a report similar to the one below is displayed in the Sentinel Web interface.
10.5.10 Viewing Asset Data
This feature allows you to view and save your view as an HTML file of your Asset Report. To view the Asset data, you must run an asset management tool such as NMAP and bring the results into Sentinel by using an Asset Collector. The available data for viewing are:
Hardware
MAC Address
Name
Type
Vendor
Product
Version
106 NetIQ Sentinel 7.0.1 User Guide
Value
Criticality
Network
IP Address
Hostname
Software
Name
Type
Vendor
Product
Version
Contacts
Order
Name
Role
Phone Number
Location
Location
Address
If both the Source IP and Destination IP are populated in an event, the asset data is displayed for both. If either of them is populated, the respective asset data is displayed.
To view asset data:
1 In a Real Time Event Table, right‐click one or more events, then click Analyze > Asset Data.
The Asset data is displayed in the Sentinel Web interface.
10.5.11 Viewing Vulnerabilities
Vulnerability Visualization provides a textual or graphical representation of the vulnerabilities of selected destination systems. Vulnerabilities for the selected destination IPs can be seen for the current time or for the time of the selected events.
Vulnerability Visualization requires that a vulnerability Collector is running and is adding vulnerability scan information to the Sentinel database. The Sentinel Plug‐in Web site provides Collectors for several industry‐standard vulnerability scanners, and additional vulnerability Collectors can be written by using the Collector Builder.
NOTE: Vulnerability Collectors are distinct from Event Collectors and use different commands.
There are several Vulnerability Visualization views:
HTML
Viewing Events 107
Graphical
Circular
Organic
Hierarchical
Orthogonal
The HTML view is a report view that lists relevant fields, depending on which vulnerability scanner you have:
IP
Host
Vulnerability
Port/protocol
The graphical display is a rendering of vulnerabilities that links them to an event through common ports. There are four available views:
Organic view
Hierarchical view
Circular view
Orthogonal view
The graphical display has four panels:
Graph panel
Tree panel
Control panel
Details/events panel
The graph panel display associates vulnerabilities to a port/protocol combination of a resource (IP address). For example, if a resource has five unique port/protocol combinations that are vulnerable, there are five nodes attached to that resource. The resources are grouped together under the scanner that scanned the resources and reported the vulnerabilities. If two different scanners are used, such as ISS and Nessus, there are two independent scanner nodes that have vulnerabilities associated with them.
NOTE: Event mapping takes place only between the selected events and the vulnerability data returned.
The tree panel organizes data in same hierarchy as the graph. The tree panel also allows users to hide or show nodes at any level in the hierarchy.
The control panel exposes all the functionality available in the display. This includes:
Four different algorithms to display
The ability to show all or selected nodes that have events mapped to them
Zooming in and out of selected areas of the graph
There are two tabs. When you are in the Details tab, click on a node displays node details. When you are in the Events tab, clicking an event associated with a node displays a table in a Real Time window.
108 NetIQ Sentinel 7.0.1 User Guide
To run a vulnerability visualization:
1 In a Real Time Event Table, right‐click one or more events, then click Analyze and select one of the following options:
Current Vulnerability: Queries the database for vulnerabilities that are active (effective) at the current date and time.
Event Time Vulnerability: Queries the database for vulnerabilities that were active (effective) at the date and time of the selected event.
10.5.12 Viewing User Information
NetIQ provides optional integration with Novell Identity Manager. With this integration, user identity information is added to incoming events when the account name matches one from Novell Identity Manager. When the InitUserIdentity or TargetUserIdentity column is populated in an event, a right‐click menu is enabled to open the user’s page in the Identity Browser.
When you right‐click an event and select Show Identity Details, you can choose to view the identity of the Initiator user, the Target user, or both. The Identity Browser opens and shows identifying information about the user (or users) from the identity management system, all the accounts to which the user is provisioned, and the recent activity by that user. For more information on the Identity Browser, see Chapter 7, “Integrating Identity Information with Sentinel Events,” on page 79.
10.5.13 Viewing the Targets
You can view the targets of the events in the Real Time Event Table.
1 In an existing Real Time Event Table, right‐click an event, then click Target.
2 Select one of the following options:
ping
Name server lookup
Trace Route
Whois?
The selected information is displayed.
10.6 Managing ColumnsYou can manage the columns displayed in the Active Views tab.
1 Access the Active Views tab.
For more information, see Section 10.2, “Accessing the Active Views Tab,” on page 98.
2 Click Active Views > Event Real Time > Manage Columns.
3 Use the Add and Remove buttons to move column titles between the Available columns list and the Show these columns in this order list.
4 Use the Insert button to insert an available column item into a specific location.
5 Use the up‐arrow and down‐arrow to arrange the order of the columns as you want them to display in the Real Time Event Table.
Viewing Events 109

The top to bottom order of column titles in the Manage Column dialog box determines the left to right order of the columns in the Real Time Event Table.
6 To save your changes, click OK.
7 (Optional) If you want your columns to display the next time you open the Sentinel Control Center, click File > Save Preferences.
10.7 Taking a Snapshot of a Navigator WindowYou must have user permission to take a snapshot.
A snapshot is useful to study events of interest because the Navigator refreshes automatically and the alert or alerts of interest scroll off the screen. Also, within a snapshot, you can sort by column.
1 Access the Active Views tab.
For more information, see Section 10.2, “Accessing the Active Views Tab,” on page 98.
2 In the menu, click Active Views > Event Real Time > Snapshot.
A Snapshot window opens and is added to the Snap Shots folder list under Active Views in the Navigator. The graphical display is not part of the snapshot.
To sort columns in a snapshot:
1 Click any column header once to sort by ascending value and twice to sort by descending value.
110 NetIQ Sentinel 7.0.1 User Guide

11 11Reporting
Sentinel is prepackaged with a variety of Jasper reports, some of which are general and some of which are device‐specific. For example, SUSE Linux. Some of the reports are flexible to allow users to specify the columns to be displayed in the results. These reports use a Lucene‐based query language.
When the Sentinel page is loaded for the first time, all the report definitions in the system are loaded and displayed in the Reports panel on the left of the page.
You can run, schedule, and e‐mail the reports. You can also run any report as a search and then interact with the results as you would do for any search, such as refining the search or performing an action on the results. For more information, see Chapter 2, “Searching Events,” on page 13.
You can also run reports on Sentinel servers that are distributed across different geographic locations. For more information, see “Searching and Reporting Events in a Distributed Environment” in the NetIQ Sentinel 7.0.1 Administration Guide.
All report results depend on the data viewing permissions associated with the userʹs role.
Section 11.1, “Running Reports,” on page 111
Section 11.2, “Viewing the Reports,” on page 114
Section 11.3, “Scheduling a Report,” on page 115
Section 11.4, “Adding Report Definitions,” on page 116
Section 11.5, “Renaming a Report Result,” on page 117
Section 11.6, “Marking Report Results as Read or Unread,” on page 118
Section 11.7, “Managing Favorite Reports,” on page 118
Section 11.8, “Exporting Report Definitions and Report Results,” on page 118
Section 11.9, “Deleting Reports,” on page 120
11.1 Running ReportsYou can run and schedule report definitions that are saved in the system. You can also view the report results of the report definitions.
The Reports panel displays all the report definitions in the system. Because the reports run asynchronously, you can simultaneously perform other tasks in the application.
You can run a report by using the desired parameters such as a start and an end date, and save the report results with a name of your choice. After the report runs, you can view it in the Reports panel or in PDF.
Because the reports run asynchronously, you can simultaneously perform other tasks in the application while you run reports. If the Sentinel server was restarted while a report was processing, you can either cancel or restart the report. If you restart the report, it runs with the same parameters
Reporting 111

that were used the first time. If the report was run with a relative time setting (such as Last 12 hours), the time period for rerunning the report is based on the current date and time and not the date and time when the report was initially run.
You can run reports as either search reports or as Jasper reports, depending on the details you want to see and the format you want for the report results.
Use the following procedure to run a report:
1 Log in to the Sentinel Web interface as a user with the Manage Reports permission.
2 In the Reports panel, select the report you want to run, then click Run.
3 Specify if you want to run the report now or if you want to schedule it to run at a certain time.
4 Specify a name to identify the report results.
Because the username and time are also used to identify the report results, the report name does not need to be unique.
5 (Conditional) If your Sentinel is configured for distributed search, click the Selected Targets link in the Targets section to select the source machines on which the reports can be run. For more information on distributed search, see “Searching and Reporting Events in a Distributed Environment”in the NetIQ Sentinel 7.0.1 Administration Guide.
6 (Conditional) To run a search report, specify the following parameters:
7 (Conditional) To run a Jasper report, specify the following parameters:
Jasper reports can also have additional parameters defined when you create the Jasper report. To view the description for an additional parameter via a tool tip, mouse over the parameter names in the Run Report form.
Parameter Description
Maximum Results Specify the maximum number of event search results to include in the report.
Durations If the report includes time period parameters, choose the date range. All time periods are based on the local time for the browser.
Last 1 hour: Shows events for the last hour.
Last 12 hours: Shows events for the last 12 hours.
Last 24 hours: Shows events for the last 24 hours.
Last 7 days: Shows events for the last seven days.
Last 30 days: Shows events for the last 30 days.
Last 60 days: Shows a month of events, from midnight of the first day of the previous month until 11:59 p.m. of the last day of the previous month.
Last 90 days: Shows events for the last 90 days.
Whenever: Shows all events stored in the system.
Custom Date Range: If you selected Custom Date Range, set the start date (From Date) and the end date (To Date) for the report.
112 NetIQ Sentinel 7.0.1 User Guide
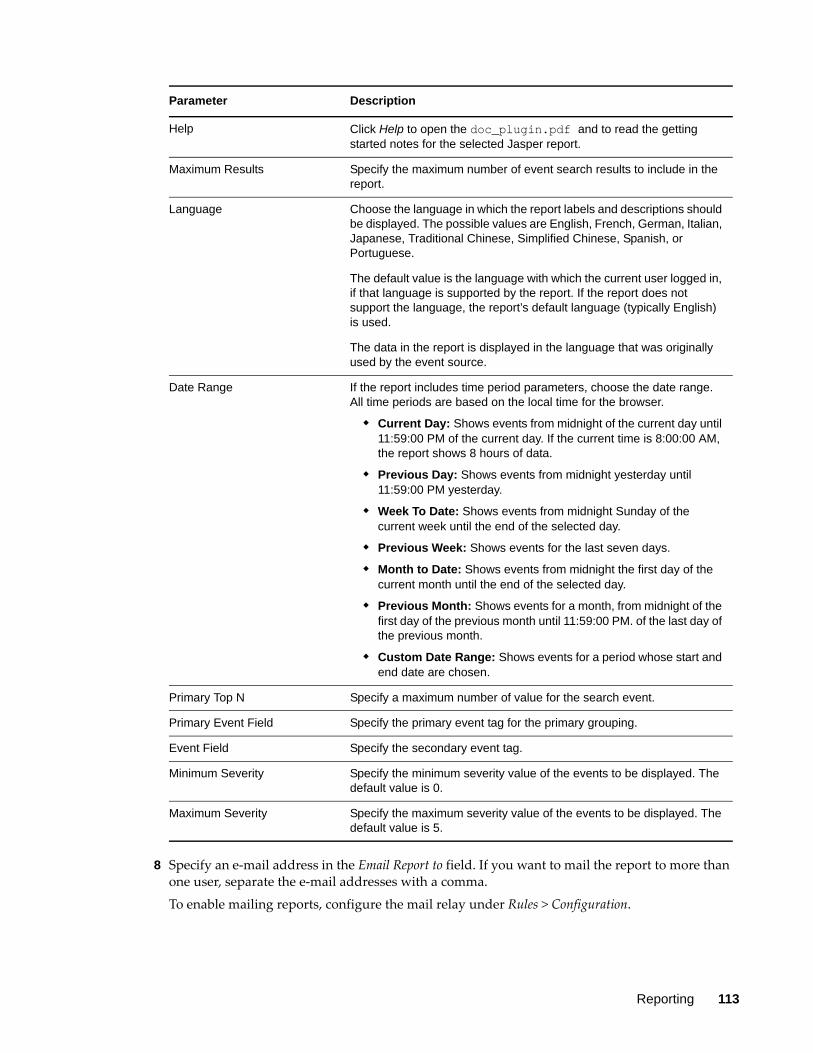
8 Specify an e‐mail address in the Email Report to field. If you want to mail the report to more than one user, separate the e‐mail addresses with a comma.
To enable mailing reports, configure the mail relay under Rules > Configuration.
Parameter Description
Help Click Help to open the doc_plugin.pdf and to read the getting started notes for the selected Jasper report.
Maximum Results Specify the maximum number of event search results to include in the report.
Language Choose the language in which the report labels and descriptions should be displayed. The possible values are English, French, German, Italian, Japanese, Traditional Chinese, Simplified Chinese, Spanish, or Portuguese.
The default value is the language with which the current user logged in, if that language is supported by the report. If the report does not support the language, the report’s default language (typically English) is used.
The data in the report is displayed in the language that was originally used by the event source.
Date Range If the report includes time period parameters, choose the date range. All time periods are based on the local time for the browser.
Current Day: Shows events from midnight of the current day until 11:59:00 PM of the current day. If the current time is 8:00:00 AM, the report shows 8 hours of data.
Previous Day: Shows events from midnight yesterday until 11:59:00 PM yesterday.
Week To Date: Shows events from midnight Sunday of the current week until the end of the selected day.
Previous Week: Shows events for the last seven days.
Month to Date: Shows events from midnight the first day of the current month until the end of the selected day.
Previous Month: Shows events for a month, from midnight of the first day of the previous month until 11:59:00 PM. of the last day of the previous month.
Custom Date Range: Shows events for a period whose start and end date are chosen.
Primary Top N Specify a maximum number of value for the search event.
Primary Event Field Specify the primary event tag for the primary grouping.
Event Field Specify the secondary event tag.
Minimum Severity Specify the minimum severity value of the events to be displayed. The default value is 0.
Maximum Severity Specify the maximum severity value of the events to be displayed. The default value is 5.
Reporting 113

9 Click Run.
A report results entry is created and mailed to the chosen recipients.
11.2 Viewing the ReportsThe reports are loaded and displayed in the Reports panel on the left of the Sentinel Web interface. Click More > Show all reports to view all reports or click More > Only show scheduled reports to view only the scheduled reports.
The report results for each users vary depending on the data security settings configured for the role of that user.
All the report results are ordered by the creation time. If there is more than one report, the show more link is displayed that displays other report results.
In the Reports panel, the Favorites and Other sections show the number of unread reports with a blue dot next to them.
A blue dot next to the report result indicates that the report result is unread. For more information, see “Marking Report Results as Read or Unread” on page 118.
Section 11.2.1, “Viewing the Report Results in PDF,” on page 114
Section 11.2.2, “Drilling Down into Report Results,” on page 115
Section 11.2.3, “Viewing Report Parameters,” on page 115
11.2.1 Viewing the Report Results in PDF
Only Jasper reports can be viewed in PDF.
1 Log in to the Sentinel Web interface.
2 In the Reports panel, select the report definition that you want to run, then click Run.
3 Click the report definition to view the report results in the Reports panel. An unread report result appears with a blue dot next to it.
4 Select a report result.
5 To view the report in PDF format, click the View Report PDF icon.
You can view only Jasper reports, not search reports, in PDF.
6 (Optional) At the bottom left corner of the page, view the report parameter values used to run the report.
When a report definition is expanded, some report definitions display a Sample Report link, if a report definition contains a sample report.
7 Click Sample Report to display a View link.
8 Click View to find out how the completed report looks with a set of sample data.
Report results are organized from the newest to the oldest.
114 NetIQ Sentinel 7.0.1 User Guide
11.2.2 Drilling Down into Report Results
The drill‐down viewing option provides the ability to launch a search with the same query and time frame that was used to generate the report. This option allows users to view details of the event used to generate the report.
The drill‐down feature is available only on reports that run against the file‐based event store, or multiple event stores for a distributed query. It is not available on Sentinel configuration reports that run against the database.
In addition, the drill‐down feature is available only on reports that specify the Lucene query in the main .jrxml file of the report. This is true for most reports that are written by NetIQ, with the exception of a few reports that rely on multiple subreports, such as the NetIQ Top Ten reports.
1 Log in to the Sentinel Web interface.
2 In the Reports panel, select the report you want to run, then click Run.
3 Click the report definition to view the report results in the Reports panel. An unread report result appears with a blue dot next to it.
4 Select a report result, then click the drill‐down icon to launch the drill‐down query.
11.2.3 Viewing Report Parameters
The Reports panel on the left side of the page displays a status pane at the bottom left corner of the page. The status pane displays the parameter information associated with the selected report. It also displays the error messages, if the report execution resulted in an error.
1 Log in to the Sentinel Web interface.
2 In the Reports panel, click a report definition to expand it.
3 Select the report to view the parameters associated with the selected report.
The report parameters are displayed in the status pane.
11.3 Scheduling a ReportSentinel allows you to schedule a report to run at regular intervals.You can run the report immediately or schedule it to run later, either once or on a recurring basis. For scheduled reports, choose a frequency and specify a time for the report to run. The report runs based on the time settings of the Sentinel server.
Now: This is the default. It runs the report immediately.
Once: Runs the report once at the specified date and time.
Daily: Runs the report once a day at the specified time.
Weekly: Runs the report once a week on the same day at the specified time.
Monthly: Runs the report on the same day of the month every month, starting at the specified date and time. For example, if the start date and time is May 26, 2010 4:00:00 p.m., the report runs on the 26th day of the month at 4:00:00 p.m. every month.
NOTE: All time settings are based on the machine’s local time.
Report schedules can be removed or modified by using the Delete and Edit links.
Reporting 115
11.4 Adding Report DefinitionsReports in Sentinel are designed as plug‐ins (.zip or .rpz files that include the report definition in addition to the metadata and resources used by the report). New or updated reports can be uploaded into Sentinel by users in the Manage Reports role.
The primary sources for new or updated reports are:
Solution Packs: Solution Packs provide a framework where sets of content can be packaged into controls, each of which is designed to enforce a specific business or technical policy. They are created in Sentinel Solution Designer and contain different types of plug‐ins, including Sentinel reports. For more information on Solution Packs, see the Sentinel Plug‐ins Web Site.
Collector Packs: Collector Packs are specialized Solution Packs. They include event source setup instructions, associated scripts, utilities, and Sentinel reports specific to the data of the associated Collector.For more information on Solution packs, see the Sentinel Plug‐ins Web Site.
JasperForge iReport: You can modify or write reports by using JasperForge iReport, which is a graphical report designer for JasperReports. iReport is an open source report development tool that is available for download from JasperForge.org (as of the time of this publication).
New or modified reports can include additional database fields that are not presented in the Sentinel interface. They must adhere to the file and format requirements of the report plug‐ins. For more information about database fields and file and format requirements for report plug‐ins, see the Sentinel SDK Web site.
Section 11.4.1, “Extracting Reports from Collector Packs,” on page 116
Section 11.4.2, “Adding or Uploading a Report,” on page 117
11.4.1 Extracting Reports from Collector Packs
Collector Packs contain the event source setup instructions, associated scripts, utilities, and the Sentinel reports specific to the data of the associated Collector.
The Collector Pack Extractor utility allows you to extract the Collector packs. You can use the instructions and scripts to configure the associated event sources. The reports that are extracted from the new Collector can be uploaded to the Sentinel.
These Collector Packs are available on the Sentinel Plug‐ins Web site.
To extract the reports from the Collector Packs:
1 Copy the Collector Packs from where you want to extract the event source setup instructions, associated scripts and utilities, and Sentinel reports to a temporary directory.
2 Download the Collector Pack Extractor from the Sentinel Plug‐ins Web site. It is available under the Utilities tab.
3 Copy the cpextractor.jar file to the directory. where you copied the Collector Packs.
4 Execute the jar file in one of the following ways, depending on your operating software:
On Windows: Double‐click the jar file (if the Java environment is properly configured).
On Linux: Run the java -jar cpextractor.jar command.
For each Collector Pack, a new directory is created with the same base name of the Collector. The newly created directory contains the following:
jasperreports: A subdirectory that contains all the extracted Sentinel reports.
116 NetIQ Sentinel 7.0.1 User Guide

instructions.txt: (Optional) A text file with the required instructions to configure the event source.
This directory can also contain additional files required for the event source configuration.
5 To proceed with event source configuration, follow the instructions provided in “Configuring Data Collection for Other Event Sources”in the NetIQ Sentinel 7.0.1 Administration Guide.
6 For any additional steps required to configure the event source, follow the steps given in the instructions.txt file.
11.4.2 Adding or Uploading a Report
1 Log in to the Sentinel Web interface.
2 In the Reports panel, click More, then select Upload.
3 Browse and select the report plug‐in .zip or .rpz file from your local machine.
NOTE: You must first add the appropriate Report Data Definition (.rdz) file to add the desired report plug‐in.
4 Click Open, then click Upload.
The new report definition is added to the Report Template list in alphabetical order and can be run immediately, if necessary.
Sentinel verifies the unique ID of the report to determine whether an older or identical version of the report already exists in the report repository. If it does, Sentinel displays the details of both the reports so that the user can decide whether to cancel the action or replace the existing report with the current report.
If the same report already exists in the report repository, decide based on the unique ID of the report whether to replace the existing report or not.
Sentinel displays details of both the reports.
11.5 Renaming a Report Result1 Log in to the Sentinel Web interface.
2 In the Reports section, click a report definition to view the report results.
3 Select a report result.
4 Do one of the following:
Click the more drop‐down list in the Report Viewer pane and select Rename.
Double‐click the report name in the status pane.
5 Specify a name in the bottom left status pane.
6 Click Rename.
The selected report result is renamed under the report definition.
Reporting 117

11.6 Marking Report Results as Read or UnreadWhen a report result is created under a report definition, the report result is in unread state. An unread report result appears with a blue dot next to the report result in the Report Viewer. When you view a report result, the blue dot is removed to indicate that the report has been read. You can also manually mark a report result as read or unread without viewing it by using the options in the More drop‐down list.
In the Report Viewer, each of the report templates or definitions shows the number of unread reports next to it.
NOTE: The reports marked as read or unread are on a per‐user basis. Each user can have a different set of read or unread reports.
11.7 Managing Favorite Reports Section 11.7.1, “Adding Reports as Favorites,” on page 118
Section 11.7.2, “Removing Favorite Reports,” on page 118
11.7.1 Adding Reports as Favorites
You can mark individual report definitions as Favorites so that they are easier to find.
1 Log in to the Sentinel Web interface.
2 In the Reports panel, select the report definition that you want to mark as favorite.
3 Click More, then select Add to Favorite.
11.7.2 Removing Favorite Reports
1 Log in to the Sentinel Web interface.
2 In the Reports panel, select the report definition that you want to remove from the Favorites.
3 Click More, then select Remove from Favorite.
11.8 Exporting Report Definitions and Report ResultsYou can export report definitions from one Sentinel instance and export it into another instance of Sentinel. The report results can be exported and saved or sent to another user
NOTE: When you export report definitions, only the report definitions are exported. None of the report results are exported.
Section 11.8.1, “Exporting a Single Report Definition,” on page 119
Section 11.8.2, “Exporting Multiple Report Definitions,” on page 119
Section 11.8.3, “Exporting All Report Definitions,” on page 119
Section 11.8.4, “Exporting a Report Result,” on page 119
118 NetIQ Sentinel 7.0.1 User Guide
11.8.1 Exporting a Single Report Definition
1 Log in to the Sentinel Web interface.
2 Select a report definition in the Report Viewer pane.
3 Click More, then select Export Definition.
The Opening <Selected Report Name>.zip dialog box is displayed with the option to save the file on your local machine.
4 Save the file to the location you prefer.
11.8.2 Exporting Multiple Report Definitions
1 Log in to the Sentinel Web interface.
2 Click More, then select the Select Multiple Definitions option.
3 Select the report definitions that you want to export.
4 Click Export.
The Opening reportexport.zip dialog box is displayed with the option to save the file.
5 Save the file to a location you prefer.
11.8.3 Exporting All Report Definitions
You can use the Export All Definitions option to export all reports as a .zip file.
1 Log in to the Sentinel Web interface.
2 Click More, then select Export All Definitions.
The Opening reportexport.zip dialog box is displayed with the option to save the file.
3 Save the file to a location you prefer.
11.8.4 Exporting a Report Result
1 Log in to the Sentinel Web interface.
2 Select a report definition in the Report Viewer pane.
A list of available report results appear.
3 Select the report result that you want to export.
The View Report PDF icon is displayed next to the report result.
4 Click the icon.
A dialog box appears with an option to export and save the file as <Report Def name>_<Report result name>.pdf .
5 Click OK to save the file.
Reporting 119
11.9 Deleting ReportsYou can delete a report definition or a report result. If a report definition is deleted, all associated report results are also deleted.
Section 11.9.1, “Deleting a Report Definition,” on page 120
Section 11.9.2, “Deleting Multiple Report Definitions,” on page 120
Section 11.9.3, “Deleting a Report Result,” on page 120
Section 11.9.4, “Deleting Multiple Report Results,” on page 121
11.9.1 Deleting a Report Definition
1 Log in to the Sentinel Web interface.
2 Select a report definition in the Report Viewer pane.
3 Click the Delete button in the Report Viewer pane.
4 Click Delete to confirm deletion.
11.9.2 Deleting Multiple Report Definitions
You can select multiple report definitions and delete all of them.
1 Log in to the Sentinel Web interface.
2 Click More, then select Select Multiple Definitions.
3 A check box is displayed next to each report result in the Report Viewer pane. Select the check boxes to select the report definitions that you want to delete.
You can also use the select all link to select all of the available report definitions. To clear all the selected reports, click Clear all.
If no report definitions are selected, the Delete and Mark Read links are disabled.
The Delete(x) in the Report Viewer pane shows the number of selected report definitions, where (x) is the number of selected report results.
4 Click Delete(x).
5 Click Delete again to confirm deletion.
11.9.3 Deleting a Report Result
1 Log in to the Sentinel Web interface.
2 Select a report result under a report definition in the Report Viewer pane.
3 Click the Delete button in the Report Viewer pane.
4 Click Delete again to confirm deletion.
120 NetIQ Sentinel 7.0.1 User Guide

11.9.4 Deleting Multiple Report Results
You can select multiple report results and delete all of them.
1 Log in to the Sentinel Web interface.
2 Click More, then select Select Multiple Results.
3 A check box is displayed next to each report result in the Report Viewer pane. Select the check boxes to select the report results.
You can also use the select all link to select all the available report results. To clear all the selected reports, click Clear all.
If no report results are selected, the Delete and Mark Read links are disabled.
The Delete(x) option in the Report Viewer pane shows the number of selected report results, where (x) is the number of selected report results.
4 Click Delete(x).
5 Click Delete again to confirm deletion.
Reporting 121

122 NetIQ Sentinel 7.0.1 User Guide

12 12Configuring Incidents
In Sentinel, a set of related events (for example, a possible attack) can be grouped together form an incident. An incident in open state alerts you to investigate, resolve, and close the incident. For example, the resolution to an attack might be to close a port, block a source IP, or rebuild a machine.
Incidents are created automatically as a result of a correlation rule being triggered, or they are created manually by a security analyst monitoring incoming data or querying past data.
Section 12.1, “Accessing Incidents,” on page 123
Section 12.2, “Creating Incidents,” on page 123
Section 12.3, “Managing Incidents,” on page 124
Section 12.4, “Adding an Incident View,” on page 126
12.1 Accessing IncidentsYou access the incidents through the Sentinel Control Center. You need to have appropriate permissions to access this tab. Only an Administrator has controls to enable or disable access to the features of incidents for a user.
1 Log in to the Sentinel Web interface as a user with permissions to access incidents.
2 Click Applications in the toolbar.
3 Click Launch Sentinel Control Center.
4 Log in to the Sentinel Control Center as a user with permissions to access incidents.
5 Click Incidents.
The Incidents are displayed.
12.2 Creating Incidents1 Access the Incidents tab in the Sentinel Control Center.
For more information, see Section 12.1, “Accessing Incidents,” on page 123.
2 In the menu, click Incidents > Create Incident.
or
Click the Create Incident button in the toolbar.
3 Use the following information to create the incident:
Title: Specify the title of the incident.
State: Select the state of the incident from the drop‐down list.
Severity: Select the severity of the incident from the drop‐down list.
Configuring Incidents 123
Priority: Select the priority of the incident from the drop‐down list.
Category: Select the category of the incident from the drop‐down list
or
Create your own category by clicking the button next to the Category field, then click Add. You must specify a name and a description of the new category.
Responsible: Select the user that is responsible to investigate and close the incident.
Description: Specify a description of the incident.
Resolution: Specify the steps required to resolve the incident.
4 Click Create.
The Incident ID is automatically generated after you click Create.
You can also create incidents from the Sentinel Web interface. For more information, see Section 2.5.4, “Creating an Incident,” on page 26.
After the incident is created, proceed to Section 12.3, “Managing Incidents,” on page 124 to manage the incident.
12.3 Managing Incidents Section 12.3.1, “Viewing an Incident,” on page 124
Section 12.3.2, “Attaching Workflows to Incidents,” on page 125
Section 12.3.3, “Adding Attachments to Incidents,” on page 125
Section 12.3.4, “Adding Notes to Incidents,” on page 125
Section 12.3.5, “Executing Incident Actions,” on page 125
Section 12.3.6, “E‐mailing an Incident,” on page 126
12.3.1 Viewing an Incident
1 Click Incidents in the Sentinel Control Center.
For more information, see Section 12.1, “Accessing Incidents,” on page 123.
2 From the menu, click Incidents > Display Incident View Manager
or
Click the Display Incident View Manager button in the toolbar.
3 Select the desired Incident in the Incidents View window.
When you view an incident, you see the tabs listed below where you can perform Incident related activities. As you investigate and remediate an Incident, additional information can be added to these tabs.
Events: Lists events attached to this Incident. For more information, see Section 2.5.4, “Creating an Incident,” on page 26.
Assets: Lists assets affected by the events of this Incident.
Vulnerability: Lists asset vulnerabilities.
Advisor: Displays Asset attack and alert information.
124 NetIQ Sentinel 7.0.1 User Guide

iTRAC: Allows you to add a workflow to Incident.
History: Lists the activities performed on the current Incident.
Attachments: Allows you to add an attachment to the Incident created in the system.
Notes: Allows you to add notes to the Incident.
12.3.2 Attaching Workflows to Incidents
1 In the Incidents View window, select the desired Incident.
2 Click the iTRAC tab.
3 Select a workflow from the iTRAC process drop‐down list.
For more information about workflows, see Chapter 13, “Configuring iTRAC Workflows,” on page 127.
4 Click Save.
You can attach only one workflow to an Incident.
12.3.3 Adding Attachments to Incidents
1 In the Incidents View window, select the desired Incident.
2 Click the Attachments tab, then click Add.
3 Click Browse, then navigate to the attachment and select it.
4 Specify the required information, or accept the default entries.
5 Click OK, then click Save.
You can right‐click the attachment to view it or save it to your local hard drive.
12.3.4 Adding Notes to Incidents
1 In the Incidents View window, select the desired Incident.
2 Click the Notes tab, then click Add.
3 Specify your notes, then click OK.
4 Click Save to update the Incident.
To edit or delete the note, select a note in the Notes tab of the Incident window, right‐click the note, then select edit or delete.
12.3.5 Executing Incident Actions
Any configured Javascript action or iTRAC activity can be executed on an Incident.
1 In the Incidents View window, select the desired Incident.
2 In the menu, click Action > Execute Incident Action.
or
Click the Execute Incident Action button.
3 Select an Action or click the Add Action button to create a new one.
Configuring Incidents 125

4 Click Execute.
If the action is a Javascript Action, a window opens to show the progress of the action.
5 To add the command output to the Incident, click the Attach to Incident button.
The action output is saved and can be viewed from the Attachments tab of the Incident.
12.3.6 E-mailing an Incident
To e‐mail an Incident using the preinstalled E‐mail Incident action, you must have an SMTP Integrator configured with valid connection information and with the property SentinelDefaultEMailServer set to “true”. For more information, see the SMTP Integrator documentation available at the Sentinel Plug‐in Web site.
1 In the Incidents View window, select the desired Incident.
2 Click the Email Incident icon.
3 Specify the required information.
4 Select which HTML attachments should be included in the mail message: the events included in the incident, assets, vulnerabilities, Advisor attacks, incident history, attachments, and notes.
5 Click OK.
12.4 Adding an Incident View1 Click the Incidents tab in the Sentinel Control Center.
For more information, see Section 12.1, “Accessing Incidents,” on page 123.
2 Click the Manage Views drop‐down, then select Add View.
3 Specify a name in the Option Name field. Click each button (listed below) to specify the options.
Fields: The variables of the events attached to Incidents are displayed as fields. By default, all the fields are arranged as columns in the Incidents View. You can add or remove columns, and arrange the order of the columns by using the up and down arrows.
Group By: Allows you to set rules to group Incidents.
Sort: Allows you to set rules to sort the Incidents.
Filter: Allows you to set filters. Only Incidents that match the filter are displayed in the Incidents View.
Leaf Attribute: Allows you to select attributes from the list, which is displayed as the first column in the Incidents View.
4 Click Save.
126 NetIQ Sentinel 7.0.1 User Guide

13 13Configuring iTRAC Workflows
Section 13.1, “Overview,” on page 127
Section 13.2, “Accessing the iTRAC Administration Tools,” on page 128
Section 13.3, “Using the Template Manager,” on page 129
Section 13.4, “Template Builder Interface,” on page 130
Section 13.5, “Creating a Template,” on page 132
Section 13.6, “Managing Templates,” on page 132
Section 13.7, “Steps,” on page 133
Section 13.8, “Adding Steps to a Workflow,” on page 137
Section 13.9, “Managing Steps,” on page 138
Section 13.10, “Transitions,” on page 141
Section 13.11, “Activities,” on page 148
Section 13.12, “Creating iTRAC Activities,” on page 149
Section 13.13, “Managing Activities,” on page 150
Section 13.14, “Managing iTRAC Roles,” on page 151
Section 13.15, “Process Management,” on page 152
13.1 OverviewiTRAC workflows are designed to provide a simple, flexible solution for automating and tracking an enterprise’s incident response processes. iTRAC leverages Sentinel’s internal incident system to track security or system problems from identification (through correlation rules or manual identification) through resolution.
Workflows can be built using manual and automated steps. Advanced features such as branching, time‐based escalation, and local variables are supported. Integration with external scripts and plug‐ins allows for flexible interaction with third‐party systems. Comprehensive reporting allows administrators to understand and fine‐tune the incident response processes.
NOTE: Access to manage iTRAC templates, activities, and processes can be enabled on a user‐by‐user basis by any user with the ability to change user permissions.
The iTRAC system uses three Sentinel objects that can be defined outside the iTRAC framework:
Incident: Incidents within Sentinel are groups of events that represent an actionable security incident, plus associated state and meta‐information.
Incidents are created manually or through Correlation rules.They can be associated with a workflow process. They can be viewed on the Incidents tab.
Configuring iTRAC Workflows 127

Activity: An activity is a predefined automatic unit of work, with defined inputs, command‐driven activity, and outputs (for example, automatically attaching asset data to the incident or sending an e‐mail).
Activities can be included in a workflow template and executed during workflow processes, or they can be executed within an incident.
Role: Sentinel users can be assigned to one or more roles. Manual steps in the workflow processes can be assigned to a role. For more information, see Section 13.14, “Managing iTRAC Roles,” on page 151.
iTRAC workflows have four major components that are unique to iTRAC:
Step: A step is an individual unit of work within a workflow; including manual steps, decision steps, command steps, mail steps, and activity‐based steps. Each step displays as an icon within a given workflow template.
Transition: A transition defines how the workflow moves from one state (activity) to another. A transition is determined by an analyst action, by the value of a variable, or by the amount of time elapsed.
Templates: A template is a design for a workflow that controls the flow of execution of a process in iTRAC. The template consists of a network of manual and automated steps that combine activities and criteria for transition between the steps.
Workflow templates define how an incident is responded to after a process based on that template is instantiated. A template can be associated with many incidents.
Processes: A process is a specific instance of a workflow template that is actively being tracked by the workflow system. It includes all the relevant information for the instance, including the current step in the workflow, the associated incident, the results of steps, attachments, and notes. Each workflow process is associated to one incident.
NOTE: On a system with 16GB of RAM and 8 core CPU, you can run a maximum of 1000 processes on a single Sentinel server instance.
13.2 Accessing the iTRAC Administration ToolsThere are multiple tools that allow you to create iTRAC workflows in Sentinel. To access these tools:
1 Access the Sentinel Control Center.
1a Log in to the Sentinel Web interface:
https://<IP_Address/DNS_Sentinel_server:8443>
IP_Address/DNS_Sentinel_server is the IP address or DNS name of the Sentinel server and 8443 is the default port for the Sentinel server.
1b In the toolbar, click Applications.
1c Click Launch Control Center.
1d Click Yes to accept the security certificate.
1e Specify a username and password of a user that has rights to access the SCC, then click Login.
1f Click Accept or Accept Permanently to accept the security certificate and display the SCC.
2 Click the iTRAC tab, then click iTRAC in the toolbar.
All of the different administrative tools are listed here.
128 NetIQ Sentinel 7.0.1 User Guide
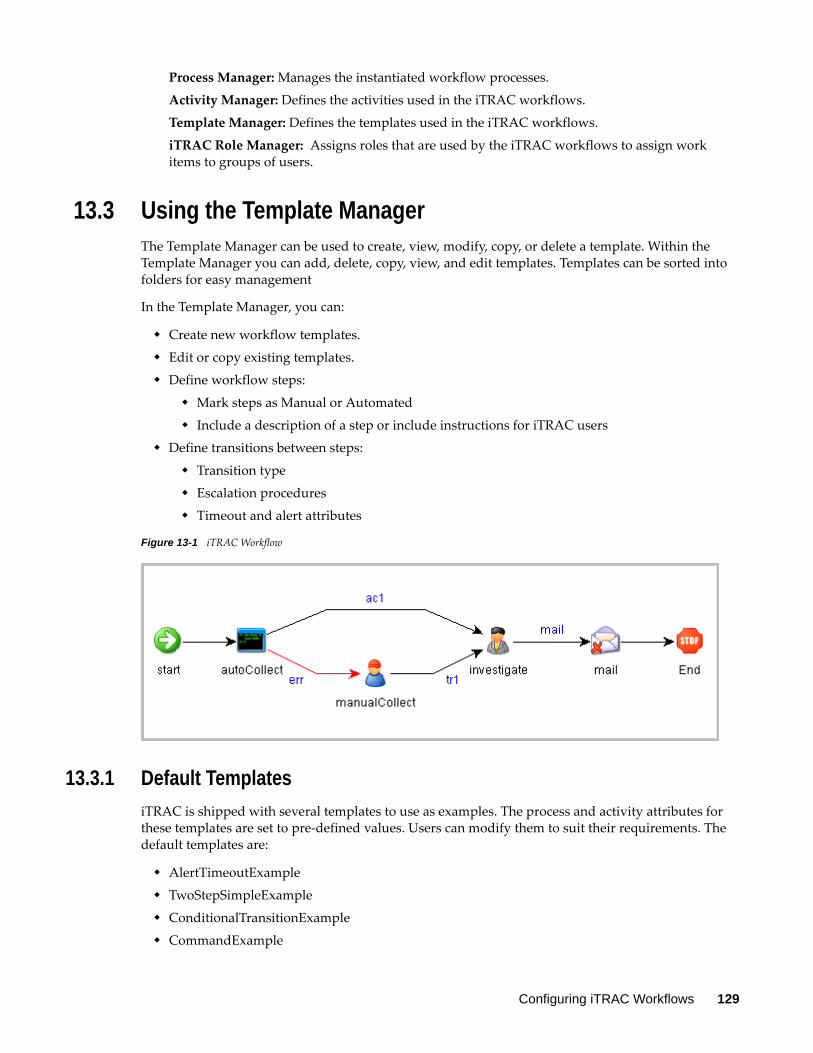
Process Manager: Manages the instantiated workflow processes.
Activity Manager: Defines the activities used in the iTRAC workflows.
Template Manager: Defines the templates used in the iTRAC workflows.
iTRAC Role Manager: Assigns roles that are used by the iTRAC workflows to assign work items to groups of users.
13.3 Using the Template ManagerThe Template Manager can be used to create, view, modify, copy, or delete a template. Within the Template Manager you can add, delete, copy, view, and edit templates. Templates can be sorted into folders for easy management
In the Template Manager, you can:
Create new workflow templates.
Edit or copy existing templates.
Define workflow steps:
Mark steps as Manual or Automated
Include a description of a step or include instructions for iTRAC users
Define transitions between steps:
Transition type
Escalation procedures
Timeout and alert attributes
Figure 13-1 iTRAC Workflow
13.3.1 Default Templates
iTRAC is shipped with several templates to use as examples. The process and activity attributes for these templates are set to pre‐defined values. Users can modify them to suit their requirements. The default templates are:
AlertTimeoutExample
TwoStepSimpleExample
ConditionalTransitionExample
CommandExample
Configuring iTRAC Workflows 129
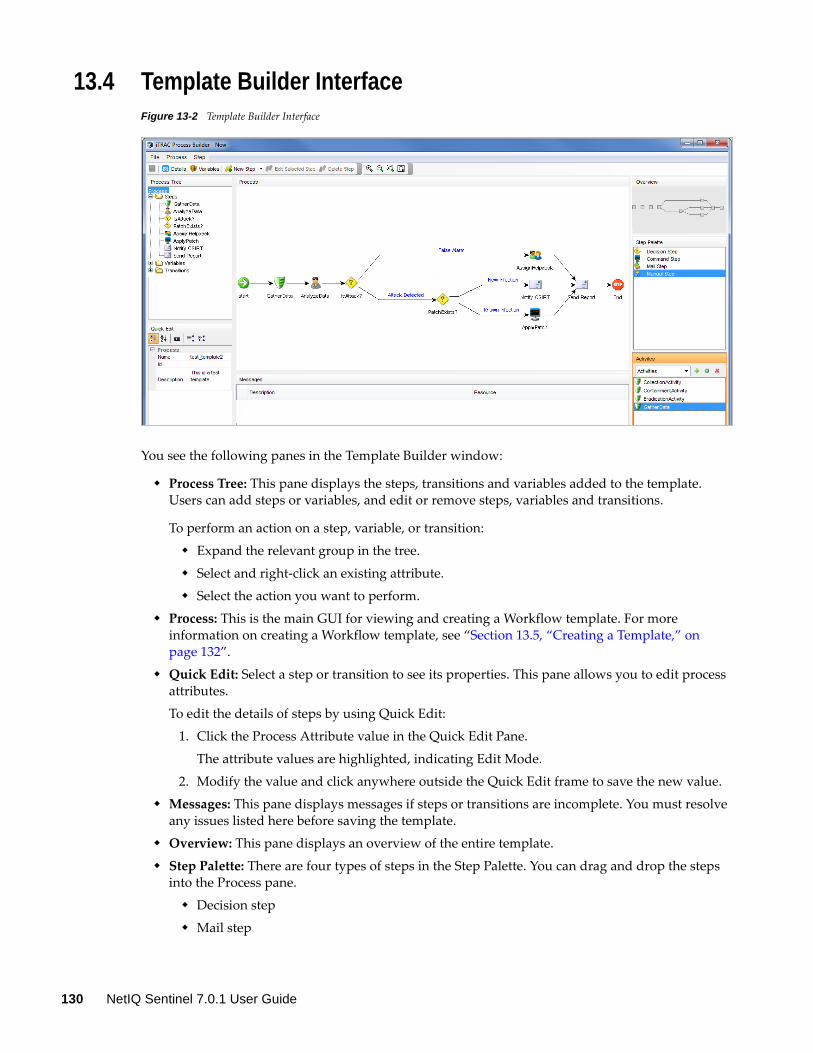
13.4 Template Builder InterfaceFigure 13-2 Template Builder Interface
You see the following panes in the Template Builder window:
Process Tree: This pane displays the steps, transitions and variables added to the template. Users can add steps or variables, and edit or remove steps, variables and transitions.
To perform an action on a step, variable, or transition:
Expand the relevant group in the tree.
Select and right‐click an existing attribute.
Select the action you want to perform.
Process: This is the main GUI for viewing and creating a Workflow template. For more information on creating a Workflow template, see “Section 13.5, “Creating a Template,” on page 132”.
Quick Edit: Select a step or transition to see its properties. This pane allows you to edit process attributes.
To edit the details of steps by using Quick Edit:
1. Click the Process Attribute value in the Quick Edit Pane.
The attribute values are highlighted, indicating Edit Mode.
2. Modify the value and click anywhere outside the Quick Edit frame to save the new value.
Messages: This pane displays messages if steps or transitions are incomplete. You must resolve any issues listed here before saving the template.
Overview: This pane displays an overview of the entire template.
Step Palette: There are four types of steps in the Step Palette. You can drag and drop the steps into the Process pane.
Decision step
Mail step
130 NetIQ Sentinel 7.0.1 User Guide

Manual step
Command step
Activities: The activities added in the Activity Manager are shown in this pane and can be added to a workflow template. The user can also add, edit and remove activities. For more information, see Section 13.13, “Managing Activities,” on page 150.
IMPORTANT: Use caution when editing or deleting an Activity that is already in use.
The following icons are used in the Template Builder to represent the steps:
Table 13-1 Template Builder Icons
Icon Description
Start Step: All workflow templates have a start step.
Decision Step: This step provides different execution paths depending on the value of a variable defined in a previous step.
Mail Step: This step sends a pre-written e-mail.
Manual Step: This step indicates that manual work must be performed, often outside the Sentinel system (For example, telephoning the owner of the affected system or analyzing the results of a scan).
Activity Step: This step is a predefined set of activities.
Command Step: This step executes a command or script on the iTRAC workflow server, which is usually installed in the same place as the Data Access Service (DAS). The output of the command can be stored in a string variable and used as input to a decision step.
End Step: This step signifies the completion of a workflow process.
Configuring iTRAC Workflows 131
13.5 Creating a Template1 Access the Sentinel Control Center. For more information, see Step 1 in Section 13.2, “Accessing
the iTRAC Administration Tools,” on page 128.
2 Click the iTRAC tab.
3 In the toolbar, click iTRAC > Template Manager.
4 Click Add to display the iTRAC Template Builder window.
5 In the Process Details window, provide a name and description (optional) of the template, then click OK.
6 Drag and drop a step from the Step Palette or an activity from the Activities pane into the Process window.
7 Add as many steps and activities as needed to create the template.
8 Right‐click the step where you need to add transition, then click Add Transition.
The transition is added after the selected step.
NOTE: Any step (except for the end step) can have one or more exit transition lines. A decision step must have at least two exit lines.
9 Right‐click each final step in the template, then click Add End Transition.
10 Look at the message pane at the bottom of the iTRAC Template Builder to find any messages with warnings or errors about incomplete steps, then fix any problems you find.
11 When the template is complete, click File > Save.
or
Click the Save button to save the template.
13.6 Managing TemplatesAfter creating a template, you can modify, copy, or delete it.
Section 13.6.1, “Viewing or Editing a Template,” on page 132
Section 13.6.2, “Copying a Template,” on page 133
Section 13.6.3, “Deleting a Template,” on page 133
13.6.1 Viewing or Editing a Template
1 Access the Sentinel Control Center. For more information, see Step 1 in Section 13.2, “Accessing the iTRAC Administration Tools,” on page 128.
2 In the toolbar, click iTRAC > Template Manager.
3 Select a template, then click View/Edit to display the Template Builder.
132 NetIQ Sentinel 7.0.1 User Guide

13.6.2 Copying a Template
One way to create a new workflow template is to copy one of the default templates and modify it.
1 Access the Sentinel Control Center. For more information, see Step 1 in Section 13.2, “Accessing the iTRAC Administration Tools,” on page 128.
2 Click the iTRAC tab.
3 In the toolbar, click iTRAC > Template Manager.
4 Select a template, then click Copy to display the Template Builder with the copied template
5 Specify a new name, then edit the template.
13.6.3 Deleting a Template
If you delete a template, any instantiated workflow processes that are based on that template finish normally.
To delete a template:
1 Access the Sentinel Control Center. For more information, see Step 1 in Section 13.2, “Accessing the iTRAC Administration Tools,” on page 128.
2 Click the iTRAC tab.
3 In the toolbar, click iTRAC > Template Manager.
4 Select a template, then click Delete.
5 Click Yes to confirm you want to delete the template.
13.7 StepsSteps are the basic components of a template. Every template must have a start step and an end step. The start step exists by default. You can also add the following types of steps to a template:
Section 13.7.1, “Start Step,” on page 133
Section 13.7.2, “Manual Steps,” on page 134
Section 13.7.3, “Decision Steps,” on page 135
Section 13.7.4, “Mail Steps,” on page 135
Section 13.7.5, “Command Steps,” on page 135
Section 13.7.6, “Activity Steps,” on page 136
Section 13.7.7, “End Step,” on page 137
13.7.1 Start Step
Every workflow template must have one start step. The transition from a start step is always unconditional.
Configuring iTRAC Workflows 133

13.7.2 Manual Steps
This type of step indicates that manual work must be performed. Every manual step in a template must be assigned to a role. The users in that role are notified through a worklist item when an instantiated workflow process reaches the manual step. When a user accepts the worklist item, it is removed from the queues of the other users in that role. For more information about worklists and stepping through a workflow process, see Section 14.2, “Understanding the Work Item Summary Interface,” on page 157.
The description of the step should indicate what work needs to be performed. The user is expected to perform that work and then acknowledge completion.
A manual step includes the following attributes:
Name of step
Role
Variables
Delete
Add
Description
Variables
The user can also be asked to set one or more variables to appropriate values. Four variable types can be assigned to manual steps: Integer, Boolean, String, and Float. The variable can be set to an explicit default value during the step definition, or the user can set the value at run‐time as part of the workflow process. The value can be optional or required.
The value of the variable can be used as part of a conditional transition to determine the path the workflow follows. It can also be used later as part of a conditional transition from a decision step to determine the workflow path.
NOTE: If the value is to be used later as part of a decision step, it should be marked Required.
For example, an integer variable can be set by the user to hold the event rate. Output transitions from the manual step can be defined so that if the event rate is greater than 500, one path is followed, and another path is followed if the event rate is less than 500.
To create a variable:
1 Access the Sentinel Control Center. For more information, see Step 1 in Section 13.2, “Accessing the iTRAC Administration Tools,” on page 128.
2 Click the iTRAC tab.
3 In the toolbar, click iTRAC > Template Manager.
4 Click the Add button in upper left corner to open a new template.
or
Select an existing template, then click View/Edit.
5 Right‐click Variables in the Process Tree, then select the type of variable to add.
6 Use the following information to define the selected variable:
Name: Specify a name for the variable.
134 NetIQ Sentinel 7.0.1 User Guide
Variable Type: Select the variable type. The options are:
INTEGER
BOOLEAN
FLOAT
STRING
Default Value: Specify a default value for the selected variable. The Boolean variable has only the options of True or False.
Description: (Optional) Specify a description for the variable.
7 Click OK to save the variable.
From a manual step, you can set conditional, unconditional, timeout, or alert transitions.
13.7.3 Decision Steps
This type of step selects different exit transitions, depending on the values of variables defined in prior steps. See Section 13.7.2, “Manual Steps,” on page 134 for the available variable types. The decision step itself is very simple; you can edit only the step name and description. The workflow path is determined by the transitions.
From a decision step, you can set conditional and else transitions. Every decision step must have an else transition and at least one conditional transition. The else transition leads to a workflow path that is followed if none of the criteria for the conditional transitions are met.
13.7.4 Mail Steps
This step sends a pre‐written e‐mail. A mail step includes the following attributes:
Name of step
To addressee
From addressee
Subject of e‐mail
Body of e‐mail
From a mail step, you can set a conditional, unconditional, timeout, alert, or error transition. An error transition should always be included so error conditions can be handled properly.
NOTE: If the first step of a workflow fails without an error transition, the iTRAC process cannot proceed.
13.7.5 Command Steps
A command step executes an operating system command or script (shell, batch, Perl and so on). The name of the command can be explicitly provided or set as a string variable, and parameters can be passed in the same manner. Output from the command can also be placed back into a string variable.
A command step includes the following attributes:
Name of step
Description
Configuring iTRAC Workflows 135

Command (Can be explicit or variable‐driven)
Arguments (Can be explicit or variable‐driven)
Output Variable
NOTE: The command (a script file that refers to the command) must be stored in the /opt/novell/sentinel/bin/actions directory on the iTRAC workflow server. Symbolic links are not supported
Variables
The command output can also be used to set a variable to the appropriate values. Command steps must use String variable types.
The value of the variable can be used as part of a conditional transition to determine the path the workflow follows. It can also be used later as part of a decision step to determine the workflow path.
For example, a command step can return a value of 0 for failure and 1 for success. This output can be assigned to a variable, and then a conditional transition or a decision step can use this value to determine which workflow path to take.
The command and its arguments can each be specified explicitly by the person designing the workflow or can be set as a string variable. If either the command or the argument is set as a String variable, there must be a previous step in the template where the variable is set to a String value.
From a command step, you can set conditional, unconditional, timeout, alert, or error transitions. An error transition should always be included so error conditions can be handled properly.
NOTE: If the first step of a workflow fails without an error transition, the iTRAC process cannot proceed.
13.7.6 Activity Steps
An activity step is a type of automated step that can be used in a workflow template. Activity steps are created in the Activity Manager and can consist of internal Sentinel operations or external scripted operations. After activity steps are created, the user can select from a library of these activities and include them into a workflow. For more information on creating each type of predefined activity, see Section 13.12, “Creating iTRAC Activities,” on page 149.
An activity step includes the following attributes:
Name
Description
Activity Assignment
From an activity step, you can set conditional, unconditional, timeout, alert, or error transitions. An error transition should always be included so error conditions can be handled properly.
NOTE: If the first step of a workflow fails without an error transition, the iTRAC process cannot proceed.
136 NetIQ Sentinel 7.0.1 User Guide

13.7.7 End Step
Every workflow template must have an end step to complete every branch of the workflow path.
13.8 Adding Steps to a WorkflowSteps can be added to a workflow by using the Step Palette or by right‐clicking in the Process Builder. When you add steps to a workflow, a yellow entry field indicates an invalid entry.
Section 13.8.1, “Adding a Step from the Step Palette,” on page 137
Section 13.8.2, “Adding a Step in the Process Builder,” on page 137
Section 13.8.3, “Adding an Activity Step,” on page 138
Section 13.8.4, “Adding an End Step,” on page 138
13.8.1 Adding a Step from the Step Palette
1 Access the Sentinel Control Center. For more information, see Step 1 in Section 13.2, “Accessing the iTRAC Administration Tools,” on page 128.
2 Click the iTRAC tab.
3 In the toolbar, click iTRAC > Template Manager.
4 Click the Add button in upper left corner to open a new template.
or
Select an existing template, then click View/Edit.
5 Drag and drop a step from the Step Palette.
6 Right‐click the step, then select Edit Step.
7 Edit the details of the step, then click Save.
13.8.2 Adding a Step in the Process Builder
1 Access the Sentinel Control Center. For more information, see Step 1 in Section 13.2, “Accessing the iTRAC Administration Tools,” on page 128.
2 Click the iTRAC tab.
3 In the toolbar, click iTRAC > Template Manager.
4 Select an existing template, then click View/Edit.
5 Right‐click an existing step in the Process Builder, then click Insert New.
6 Select the type of step you want to add:
Manual
Command Step
Mail Step
Decision Step
7 Edit the details of the step, then click Save.
Configuring iTRAC Workflows 137
13.8.3 Adding an Activity Step
1 Access the Sentinel Control Center. For more information, see Step 1 in Section 13.2, “Accessing the iTRAC Administration Tools,” on page 128.
2 Click the iTRAC tab.
3 In the toolbar, click iTRAC > Template Manager.
4 Select an existing template, then click View/Edit.
5 Drag and drop an activity from the Activity Pane to the Process Builder.
13.8.4 Adding an End Step
1 Access the Sentinel Control Center. For more information, see Step 1 in Section 13.2, “Accessing the iTRAC Administration Tools,” on page 128.
2 Click the iTRAC tab.
3 In the toolbar, click iTRAC > Template Manager.
4 Select an existing template, then click View/Edit.
5 Right‐click the last step with no transition, then select Add End Transition.
13.9 Managing StepsSteps can be copied, edited, or deleted.
Section 13.9.1, “Copying a Step,” on page 138
Section 13.9.2, “Modifying a Step,” on page 139
Section 13.9.3, “Editing a Manual Step,” on page 139
Section 13.9.4, “Editing a Decision Step,” on page 139
Section 13.9.5, “Editing a Mail Step,” on page 140
Section 13.9.6, “Editing a Command Step,” on page 140
Section 13.9.7, “Deleting a Step,” on page 140
13.9.1 Copying a Step
1 Access the Sentinel Control Center. For more information, see Step 1 in Section 13.2, “Accessing the iTRAC Administration Tools,” on page 128.
2 Click the iTRAC tab.
3 In toolbar, click iTRAC > Template Manager.
4 Select an existing template, click View/Edit.
5 Right‐click an existing step, then select Copy Step.
The step window opens in edit mode with all the attributes of the selected step.
6 Specify a name for the new step.
7 Edit step attributes as necessary, then click OK.
138 NetIQ Sentinel 7.0.1 User Guide
13.9.2 Modifying a Step
1 Access the Sentinel Control Center. For more information, see Step 1 in Section 13.2, “Accessing the iTRAC Administration Tools,” on page 128.
2 Click the iTRAC tab.
3 In the toolbar, click iTRAC > Template Manager.
4 Select an existing template, then click View/Edit.
5 Right‐click an existing step, then select Edit Step.
6 Edit the step attributes, then click OK.
13.9.3 Editing a Manual Step
1 Access the Sentinel Control Center. For more information, see Step 1 in Section 13.2, “Accessing the iTRAC Administration Tools,” on page 128.
2 Click the iTRAC tab.
3 In the toolbar, click iTRAC > Template Manager.
4 Select an existing template that contains a manual step, then click View/Edit.
5 Right‐click the manual step, then select Edit Step.
6 Change the name for the step.
7 Attach a role to this step by selecting a role from the drop‐down list.
For more information on roles, see Section 13.14, “Managing iTRAC Roles,” on page 151.
8 Click Associate to associate a variable, then select the variable from the list or create new variables to be associated.
9 Set a default value for the variable as desired.
10 Check Read‐Only, if this variable is to be forced to the default value.
11 Click the Description tab, then provide a description for this step.
12 Click Preview to preview the step you created.
13 Click OK to save the step.
13.9.4 Editing a Decision Step
1 Access the Sentinel Control Center. For more information, see Step 1 in Section 13.2, “Accessing the iTRAC Administration Tools,” on page 128.
2 Click the iTRAC tab.
3 In the toolbar, click iTRAC > Template Manager.
4 Select an existing template that contains a decision step, then click View/Edit.
5 Right‐click a decision step, then select Edit Step.
6 Change the name of the step.
7 Click the Description tab to provide a description for this step.
8 Click OK to save the step.
Configuring iTRAC Workflows 139

13.9.5 Editing a Mail Step
1 Access the Sentinel Control Center. For more information, see Step 1 in Section 13.2, “Accessing the iTRAC Administration Tools,” on page 128.
2 Click the iTRAC tab.
3 In the toolbar, click iTRAC > Template Manager.
4 Select an existing template that contains a mail step, then click View/Edit.
5 Right‐click a mail step, then select Edit Step.
6 Change the name of the step.
7 Specify the To and From e‐mail addresses, then specify a subject for the e‐mail in the General tab.
8 Click the Body tab, then compose the e‐mail message.
9 Click OK to save the step.
13.9.6 Editing a Command Step
1 Access the Sentinel Control Center. For more information, see Step 1 in Section 13.2, “Accessing the iTRAC Administration Tools,” on page 128.
2 Click the iTRAC tab.
3 In the toolbar, click iTRAC > Template Manager.
4 Select an existing template that contains a command step, then click View/Edit.
5 Right‐click a command step, then select Edit Step.
6 Change the name for this step.
7 Specify the path and name of the command or script to execute relative to the /opt/novell/sentinel/bin/actions directory.
8 (Conditional) Select Use Variables, if you want to run a command or script referenced in a variable that is populated during the workflow process.
9 Specify any command line arguments to pass to the command or script.
10 (Conditional) Select Use Variables, if you want to run a command or script referenced in a variable that is populated during the workflow process.
11 Specify a variable to hold output from the command or script.
Any standard output is placed into these variables.
12 Click the Description tab to provide a description for this step.
13 Click OK to save the step.
13.9.7 Deleting a Step
1 Access the Sentinel Control Center. For more information, see Step 1 in Section 13.2, “Accessing the iTRAC Administration Tools,” on page 128.
2 Click the iTRAC tab.
3 In the toolbar, click iTRAC > Template Manager.
4 Select an existing template, then click View/Edit.
140 NetIQ Sentinel 7.0.1 User Guide

5 Right‐click an existing step, then select Delete Step.
6 In the Alert Message window, select Yes to confirm deletion.
13.10 TransitionsTransitions are used to connect steps. There are several types of transitions:
Unconditional
Conditional
Timeout
Alert
Else
Error
A transition can have the following attributes:
Name
Description
Destination: The step where the transition links
Expression
Timeout Values
Different steps have different properties and therefore they are associated with different transition types.
Table 13-2 Steps and Valid Transitions
Step Type Valid Transitions
Decision Conditional
Else
Manual Unconditional
Timeout
Alert
Command
Activity
Unconditional
Timeout
Alert
Error
Configuring iTRAC Workflows 141

13.10.1 Unconditional Transitions
An unconditional transition must always be used from a start step. Manual, command, activity, and mail steps can also have unconditional transitions. The only parameter for an unconditional transition is the next step.
The transition is carried out when the current step is completed (unless a timeout transition is configured and the timeout period elapses).
To add an unconditional transition:
1 Access the Sentinel Control Center. For more information, see Step 1 in Section 13.2, “Accessing the iTRAC Administration Tools,” on page 128.
2 Click the iTRAC tab.
3 In the toolbar, click iTRAC > Template Manager.
4 Select an existing template, then click View/Edit.
5 Right‐click an existing step, then select Add Transition.
6 Use the following information to create the unconditional transition:
Name: Specify a name for the transition that is displayed in the Process Builder.
Type: Select Unconditional for the transition type.
Destination: Select the next step in the workflow for the unconditional transition.
Description: Specify a description for the transition.
7 Click OK to save the transition.
13.10.2 Conditional Transitions
Select an exit path based on an expression using iTRAC variables set in a manual or command step.
You can add conditional transitions only from a decision step to any other step.
When you create a conditional transition, the conditional expressions can be based on comparing a variable that is populated during the workflow process to a specific value or to another variable populated during the workflow process. Multiple conditional expressions can be combined or nested using the AND and OR operators.
To add a conditional transition:
1 Access the Sentinel Control Center. For more information, see Step 1 in Section 13.2, “Accessing the iTRAC Administration Tools,” on page 128.
2 Click the iTRAC tab.
3 Select an existing template, then click View/Edit.
4 Right‐click an existing decision step, then select Add Transition.
5 Use the following information to create the conditional transition:
Name: Specify a name for the conditional transition.
Type: Select Conditional for the transition type.
Destination: Select the next step in the workflow for the conditional transition.
Expression: Create an expression for the conditional transition. See Section 13.10.3, “Creating an Expression,” on page 143 for instructions.
142 NetIQ Sentinel 7.0.1 User Guide

Description: Specify a description for the conditional transition.
6 Click OK to save the conditional transition.
13.10.3 Creating an Expression
Each conditional transition contains an expression that defines the condition. Use the following procedure to create a transition:
1 Verify you have completed Step 2 through Step 4.
2 Click Set to create the expression.
3 Click EXP to add the first expression.
The evaluation expression is an expression that evaluates to True or False during the workflow process.
4 Use the following information to define the expression:
Relations: Select how the expression compares the conditional transition:
Variables and Variable: Compares a variable to another variable.
Variables and Values: Compares a variable to a constant value.
Attribute: Select a variable from the drop‐down list or create a new one if desired.
Condition: Select a condition from the drop‐down list.
The condition list varies depending on the type of attribute variable chosen.
Boolean: The options are:
equals
not equals
Float: The options are:
is exactly
is not
is <
is <=
is >
is >=
Integer: The options are:
is exactly
is not
is <
is <=
is >
is >=
String: The options are:
startsWith
endsWith
equals
Configuring iTRAC Workflows 143

equalsIgnorecase
matches
is empty
is not empty
Value: Either select an existing value or define a new value.
5 Click OK.
6 If a second expression is desired, select the root folder
7 Repeat Step 3 through Step 5 as needed.
8 To nest expressions or to use the OR operator, click the appropriate operator button, then drag and drop expressions onto that operator.
By default, all expressions at the root level are separated by AND operators.
9 When the expression is complete, click OK.
You can edit or delete an existing expression by using the Edit and Delete buttons in the Expression window.
10 Continue with Step 5 on page 142 to finish creating the conditional transition.
13.10.4 Else Transitions
An else transition leads to a path that is taken from a decision step when the criteria for the conditional transitions are not met. This transition only applies to decision steps, and every decision step must have an else transition. The workflow path with the else transition is only followed if none of the criteria for the conditional transitions is met.
You can add else transitions only from a decision step to any other step.
1 Access the Sentinel Control Center. For more information, see Step 1 in Section 13.2, “Accessing the iTRAC Administration Tools,” on page 128.
2 Click the iTRAC tab.
3 Select an existing template, then click View/Edit.
4 Right‐click an existing Decision step, then select Add Transition.
5 Use the following information to create the else transition:
Name: Specify a name for the else transition.
Type: Select Else for the transition type.
Destination: Select the next step in the workflow for the else transition.
Description: Specify a description for the else transition.
6 Click OK to save the else transition.
144 NetIQ Sentinel 7.0.1 User Guide
13.10.5 Timeout Transitions
A timeout transition leads to a path that is taken when a user‐specified amount of time (minutes, hours, or days) elapses after a base time, which is either step_activated_time or step_accepted_time. Step_activated_time is the time that iTRAC activates this step within the workflow process. Step_accepted_time is the time when a user accepts, or takes ownership, of the worklist item for this step. If the timeout period passes without the step being completed, control moves to the next step.
Timeout transitions can be set for a manual step or a command step. Step_accepted_time is only relevant for manual steps and should not be selected for a command step.
This transition is represented by a red line.
To add a timeout transition:
1 Access the Sentinel Control Center. For more information, see Step 1 in Section 13.2, “Accessing the iTRAC Administration Tools,” on page 128.
2 Click the iTRAC tab.
3 Select an existing template, then click View/Edit.
4 Right‐click an existing manual or command step, then select Add Transition.
5 Use the following information to create the timeout transition:
Name: Specify a name for the timeout transition.
Type: Select Timeout for the transition type.
Destination: Select the next step in the workflow for the timeout transition.
Timeout Details: Click Set to specify the timeout details:
Time: Specify the timeout value.
Unit: Select the unit of the timeout value. The options are:
Minutes
Hours
Days
Base Time: Select the base time to use with the timeout transition.
Step Accepted Time: The time that iTRAC activates this step within the workflow process
Step Activated Time: The time when a user accepts, or takes ownership, of the worklist item for this step.
Description: Specify a description for the timeout transition.
6 Click OK to save the timeout transition.
13.10.6 Alert Transitions
An alert transition leads to a path that is taken when a user‐specified amount of time (minutes, hours, or days) elapses after step_activated_time or step_accepted_time. At this point, the workflow process is usually escalated to a user who can intervene and take action.
Step_activated_time is the time that iTRAC activates this step within the workflow process. Step_accepted_time is the time when a user accepts (or takes ownership) of the worklist item for this step.
Configuring iTRAC Workflows 145

If the alert time period passes without the step being completed, the workflow process branches into two active paths. The original step remains active for user intervention. The alert path is also initiated. For example, the alert path might escalate the workflow process to the attention of a supervisor, although the main path is still open and the original owner still has the option to complete the worklist item. Another example is that if a command is taking too long to run, you might want to alert an analyst to investigate the delay or possibly run the command manually.
Alert transitions can be set for a manual step or a command step. Step_accepted_time is only relevant for manual steps and should not be selected for a command step.
This transition is represented by a yellow line.
To add an alert transition:
1 Access the Sentinel Control Center. For more information, see Step 1 in Section 13.2, “Accessing the iTRAC Administration Tools,” on page 128.
2 Click the iTRAC tab.
3 Select an existing template, then click View/Edit.
4 Right‐click an existing manual or command step, then select Add Transition.
5 Use the following information to create the alert transition:
Name: Specify a name for the alert transition.
Type: Select Alert for the transition type.
Destination: Select the next step in the workflow for the alert transition.
Alert Details: Click Set to specify the alert details:
Time: Specify the alert value.
Unit: Select the unit of the alert value. The options are:
Minutes
Hours
Days
Base Time: Select the base time to use with the alert transition.
Step Accepted Time: The time that iTRAC activates this step within the workflow process
Step Activated Time: The time when a user accepts, or takes ownership, of the worklist item for this step.
Description: Specify a description for the alert transition.
6 Click OK to save the alert transition.
13.10.7 Error Transition
An error transition leads to a path that is taken if an automated step cannot successfully finish. Error transitions can be used for command, mail, and activity steps (for example, if a command step fails to execute).
Error transitions should typically lead to some kind of notification. For example, an error transition might lead to a manual step in which the user is instructed to manually run a process that previously failed.
146 NetIQ Sentinel 7.0.1 User Guide

The error transition is taken only if the iTRAC call to the command, mail, or activity step fails. If there is an internal error with the command script or the mail server fails, this does not satisfy the conditions for an error transition.
To add an error transition:
1 Access the Sentinel Control Center. For more information, see Step 1 in Section 13.2, “Accessing the iTRAC Administration Tools,” on page 128.
2 Click the iTRAC tab.
3 Select an existing template, then click View/Edit.
4 Right‐click an existing command, mail, or activity step, then select Add Transition.
5 Use the following information to create the error transition:
Name: Specify a name for the error transition.
Type: Select Error for the transition type.
Destination: Select the next step in the workflow for the error transition.
Description: Specify a description for the error transition.
6 Click OK to save the error transition.
13.10.8 Managing Transitions
After creating a transition, you can edit or delete the transition.
“Editing a Transition” on page 147
“Deleting a Transition” on page 147
Editing a Transition
1 Access the Sentinel Control Center. For more information, see Step 1 in Section 13.2, “Accessing the iTRAC Administration Tools,” on page 128.
2 Click the iTRAC tab.
3 In the toolbar, click iTRAC > Template Manager.
4 Select an existing template, then click View/Edit.
5 Double‐click an existing transition line.
6 Edit the transition as needed.
7 Click OK to save the changes.
Deleting a Transition
1 Access the Sentinel Control Center. For more information, see Step 1 in Section 13.2, “Accessing the iTRAC Administration Tools,” on page 128.
2 Click the iTRAC tab.
3 In the toolbar, click iTRAC > Template Manager.
4 Select an existing template, then click View/Edit.
5 Right‐click an existing step, then select Remove Transition.
6 Click Yes to confirm the deletions of the transition.
Configuring iTRAC Workflows 147

13.11 ActivitiesAn activity is very similar to a command step, except that activities are reusable and cannot use input or output variables. The activities pane shows a library of user‐defined, reusable activities that can reduce the amount of configuration necessary when building templates.
Activities are exported or imported as .xml files. These files can be exported or imported from one system to another.
iTRAC activities can be used in iTRAC templates to define a workflow step, or they can be manually executed from within an incident. Sentinel provides three types of actions that can be used to build activities:
Section 13.11.1, “Incident Command Activity,” on page 148
Section 13.11.2, “Incident Internal Activity,” on page 148
Section 13.11.3, “Incident Composite Activity,” on page 149
13.11.1 Incident Command Activity
An incident command activity enables you to launch a specific command with or without arguments. The following fields from the incident associated with the workflow process can be used as input to the command:
DIP [Target IP]
DIP: Port
RT1 (IDSAttackName)
SIP [Initiator IP]
SIP: Port
Text (incident information in name value pair format)
The command (a script file that refers to the command) must be stored in the /opt/novell/sentinel/bin/actions directory on the Sentinel server.
13.11.2 Incident Internal Activity
An incident internal activity enables you to email and attach information from the Sentinel database to the incident associated with the workflow process. Each of these options has a prerequisite:
Vulnerability for the Initiator IP address (SIP) or the Target IP address (DIP): Requires that you run a vulnerability scanner and bring the results of the scan into Sentinel by using a Vulnerability (or information) Collector
Advisor attack‐related data: Requires the purchase and installation of the optional Advisor data subscription service.
Asset data: Requires that you run an asset management tool such as NMAP and bring the results into Sentinel by using an Asset Collector.
To send mail messages from within the Sentinel Control Center, you must have an SMTP integrator that is configured with connection information and with the SentinelDefaultEMailServer property set to True.
148 NetIQ Sentinel 7.0.1 User Guide
13.11.3 Incident Composite Activity
An incident composite activity enables you to combine one or more existing commands and internal activities.
13.12 Creating iTRAC Activities1 Access the Sentinel Control Center. For more information, see Step 1 in Section 13.2, “Accessing
the iTRAC Administration Tools,” on page 128.
2 Click the iTRAC tab.
3 In the toolbar, click iTRAC > Activity Manager.
4 Select an existing activity, then click View/Edit.
or
Click the Add button to create a new activity.
5 Use the following information to define the activity type:
Type: Select the activity type you want to create:
Incident Command Activity
Incident Composite Activity
Incident Internal Activity
Usage: The Usage field is populated with the type of activity you selected.
Name: Specify a name for the activity
Description: Specify a description for the activity.
6 Configure the necessary settings for the type of activity you chose:
Incident Command Activity: Use the following information to create the incident command activity:
Command: Specify the command the activity performs.
Arguments: Select the type of arguments for this command. The options are:
None
Incident Output
Custom
Incident Composite Activity: Select one or more of the activities to create a composite activity. The options are:
CollectionActivity
EraditionaActivity
ContainmentActivity
Incident Internal Activity: Configure the incident internal activity to e‐mail the output to a specific address and attach the output to the incident associated with the workflow process.
Mail and Attach: Select whether you want to e‐mail the vulnerability and Advisor data.
Mail Details: Specify the details of the e‐mail that will be sent. You must define the To, From, and Subject fields.
7 View and confirm the details you chose in the Summary page, then click Finish.
Configuring iTRAC Workflows 149

13.13 Managing ActivitiesAfter creating an activity, you can modify, import or export it.
Section 13.13.1, “Editing an Activity,” on page 150
Section 13.13.2, “Exporting an Activity,” on page 150
Section 13.13.3, “Importing an Activity,” on page 150
13.13.1 Editing an Activity
1 Access the Sentinel Control Center. For more information, see Step 1 in Section 13.2, “Accessing the iTRAC Administration Tools,” on page 128.
2 Click the iTRAC tab.
3 In the toolbar, click iTRAC > Activity Manager.
4 Select activity you want to edit, then click View/Edit.
5 Edit information in General, Attachments and Mail tabs.
6 Click OK to save the changes.
13.13.2 Exporting an Activity
1 Access the Sentinel Control Center. For more information, see Step 1 in Section 13.2, “Accessing the iTRAC Administration Tools,” on page 128.
2 Click the iTRAC tab.
3 In the toolbar, click iTRAC > Activity Manager.
4 Click Import/Export.
5 Use the following information to export the activity:
Action: Select Export Activity.
File Name: Click Explore, then browse to and select the file you want to export this information to.
File Path: This is automatically populated when you select the export file.
6 Click Next.
7 Select one or more activities to be exported.
8 Click Next, then click Finish.
13.13.3 Importing an Activity
1 Access the Sentinel Control Center. For more information, see Step 1 in Section 13.2, “Accessing the iTRAC Administration Tools,” on page 128.
2 Click the iTRAC tab.
3 In the toolbar, click iTRAC > Activity Manager.
4 Click Import/Export.
5 Use the following information to import the .xml file that contains the activity:
Action: Select Import Activity.
150 NetIQ Sentinel 7.0.1 User Guide
File Name: Click Explore, then browse to and select the file you want to import.
File Path: This is automatically populated when you select the import file.
6 Click Next.
The list of activities is displayed.
7 Click Next, then click Finish.
13.14 Managing iTRAC RolesSentinel users can be assigned to one or more roles. Manual steps in the workflow processes can be assigned to a role.
Section 13.14.1, “Adding a Role,” on page 151
Section 13.14.2, “Deleting a Role,” on page 151
Section 13.14.3, “Viewing the Role Details,” on page 151
13.14.1 Adding a Role
1 Access the Sentinel Control Center. For more information, see Step 1 in Section 13.2, “Accessing the iTRAC Administration Tools,” on page 128.
2 Click the iTRAC tab.
3 In the menu bar, click iTRAC > iTRAC Role Manager.
4 Click Add Role.
5 Specify a unique name for the role.
6 Click Add to specify which users must be members of this role.
7 Click OK.
13.14.2 Deleting a Role
1 Access the Sentinel Control Center. For more information, see Step 1 in Section 13.2, “Accessing the iTRAC Administration Tools,” on page 128.
2 Click the iTRAC tab.
3 In the menu bar, click iTRAC > iTRAC Role Manager.
4 Right‐click the role you want to delete, click Delete Role.
5 Click Yes to confirm deletion.
13.14.3 Viewing the Role Details
1 Access the Sentinel Control Center. For more information, see Step 1 in Section 13.2, “Accessing the iTRAC Administration Tools,” on page 128.
2 Click the iTRAC tab.
3 In the menu bar, click iTRAC > iTRAC Role Manager.
4 Right‐click the role for which you want to view details, click iTRAC Role Details.
Configuring iTRAC Workflows 151
13.15 Process ManagementProcess management allows you to view the incident’s progress in the workflow or terminate a workflow process.
Process execution is the time period during which the process is operational, with process instances being created and managed.
When an iTRAC process is executed or instantiated in the iTRAC server, a process instance is created, managed, and eventually terminated by the iTRAC server in accordance with the process definition. As the process progresses towards completion or termination, it executes various activities defined in the workflow template based on the criteria for the transitions between them. The iTRAC workflow server processes manual and automatic steps differently.
An iTRAC process must be created with a single associated incident; there is therefore a one‐to‐one match between iTRAC processes and incidents. Not all incidents are attached to a process. Only one incident can be associated to an iTRAC process instance.
Section 13.15.1, “Instantiating a Process,” on page 152
Section 13.15.2, “Automatic Step Execution,” on page 152
Section 13.15.3, “Manual Step Execution,” on page 153
Section 13.15.4, “Display Status,” on page 153
Section 13.15.5, “Displaying the Status of a Process,” on page 153
Section 13.15.6, “Changing Views in Process Manager,” on page 154
Section 13.15.7, “Starting or Terminating a Process,” on page 154
13.15.1 Instantiating a Process
An iTRAC process can be instantiated in the iTRAC server by associating an incident to an iTRAC process by any of the following three methods
Associating an iTRAC process to the incident at the time of incident creation
Associating an iTRAC process to incident after an incident has been created
Associating an iTRAC process to an incident through correlation
For more information on associating a process to an incident, see Chapter 12, “Configuring Incidents,” on page 123.
13.15.2 Automatic Step Execution
When the process instance executes an automatic activity step, command step, or mail step, it executes the associated activity or command defined in the template and stores the result in process variables. It then transitions to the next step in the iTRAC template.
For example, an activity might be defined to ping a server. When this activity is executed in a workflow process, the activity runs and attaches the results to the associated incident.
152 NetIQ Sentinel 7.0.1 User Guide

13.15.3 Manual Step Execution
On encountering a manual step, the iTRAC server sends out notifications in the form of work items to the assigned resource. If the step was assigned to a role, a work item is sent to all users within the role. The iTRAC server then waits for the user to complete the work item before proceeding to the next activity.
For more information, see Section 14.2, “Understanding the Work Item Summary Interface,” on page 157.
13.15.4 Display Status
The Display Status option monitors the progress of a process. As the process instance progresses from one activity, the user can track the progress visually by clicking the Refresh button. The process monitor also provides an audit trail of all the actions performed by the iTRAC server when executing the process.
Activities that are running, completed, or terminated are represented by the following icons.
Table 13-3 Display Status Icons
13.15.5 Displaying the Status of a Process
1 Access the Sentinel Control Center. For more information, see Step 1 in Section 13.2, “Accessing the iTRAC Administration Tools,” on page 128.
2 Click the iTRAC tab.
3 In the toolbar, click iTRAC > Display Process Manager.
4 Click the down‐arrow on the Switch Views button to select a view or create a new view.
5 In the Process Manager window, right‐click a process, then select Actions > Display Status.
The current step is highlighted in red.
Icon Description
Indicates that the activity is running.
Indicates that the activity is completed.
Indicates that the activity is terminated.
Configuring iTRAC Workflows 153
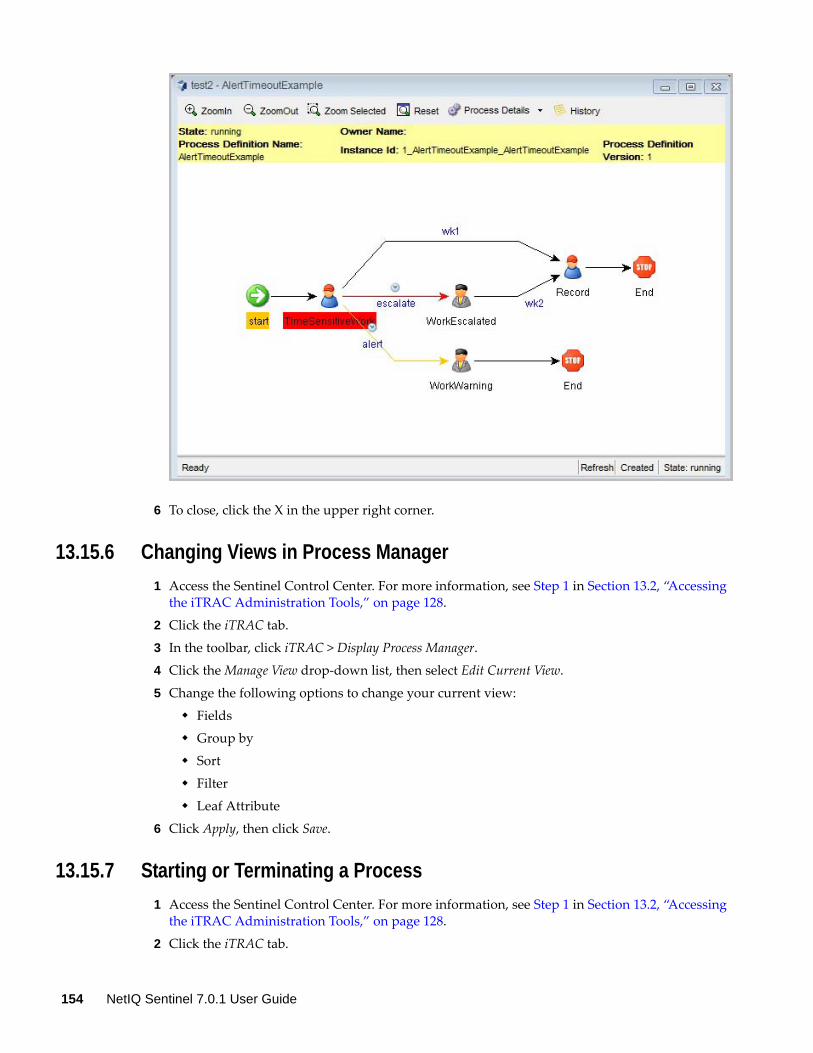
6 To close, click the X in the upper right corner.
13.15.6 Changing Views in Process Manager
1 Access the Sentinel Control Center. For more information, see Step 1 in Section 13.2, “Accessing the iTRAC Administration Tools,” on page 128.
2 Click the iTRAC tab.
3 In the toolbar, click iTRAC > Display Process Manager.
4 Click the Manage View drop‐down list, then select Edit Current View.
5 Change the following options to change your current view:
Fields
Group by
Sort
Filter
Leaf Attribute
6 Click Apply, then click Save.
13.15.7 Starting or Terminating a Process
1 Access the Sentinel Control Center. For more information, see Step 1 in Section 13.2, “Accessing the iTRAC Administration Tools,” on page 128.
2 Click the iTRAC tab.
154 NetIQ Sentinel 7.0.1 User Guide
3 In the toolbar, click iTRAC > Display Process Manager.
4 In the Process View Manager window, right‐click a process, then select Actions > Start Process or Terminate Process.
Configuring iTRAC Workflows 155

156 NetIQ Sentinel 7.0.1 User Guide

14 14Managing Work Items
Section 14.1, “Overview,” on page 157
Section 14.2, “Understanding the Work Item Summary Interface,” on page 157
Section 14.3, “Viewing a Work Item,” on page 158
Section 14.4, “Processing a Work Item,” on page 159
Section 14.5, “Managing Work Items Of Other Users,” on page 159
14.1 OverviewA work item is a workflow task assigned to a particular user or role in the iTRAC application. The individual activities to be performed to complete an iTRAC process are listed as work items in Work Item Summary in the Sentinel Control Center. For more information on iTRAC processes, see Chapter 13, “Configuring iTRAC Workflows,” on page 127. You can access the work items from any tab in the Sentinel Control Center.
NOTE: To have access to a work item, you must assign it to you or acquire the work item management permission. If you have the work item management permission, you can manage work items of other users.
14.2 Understanding the Work Item Summary InterfaceThe Work Item Summary lists the work items allocated to a user as an individual and as a member of a group. It can be used as an incident workflow to‐do list for a user who is a part of the incident response process. In the Work Item Summary, you can access the work items and perform different tasks:
View the details of a work item
Process the work item to complete the task
In the Work Item Summary, work items are grouped by current user and by other users with similar roles. The following example is for a user who is a member of the Admin, Analyst, Jr Analyst, and Admin Asst groups.
Managing Work Items 157

Figure 14-1 Work Item Summary Example 1
The following example is for a user who is a member of the Analyst group who has a process assigned to his role (group).
Figure 14-2 Work Item Summary Example 2
14.3 Viewing a Work Item1 In the Work Item Summary, click the yellow or green bar.
A work item list for the group or the current user displays and shows the name and ID of the incident, the workflow process name, and the step name and description
2 Double‐click any work item and click View Details.
The Work Item Details window appears and shows the process details, including any detailed instructions included by the iTRAC workflow developer and any variables that need to be set in the step.
3 Click Process Overview to view an overview of the entire iTRAC process.
4 Click Incident to view the details of the associated incident.
5 To take responsibility for this work item, click Acquire. Otherwise, click Cancel.
NOTE: Any changes to the incident from this page must be saved. There is a Save button on the toolbar and a Save button at the bottom of the page.
The information on the Process Details and Process Overview tabs is defined by the iTRAC workflow designer. For more information on creating workflow templates, see Chapter 13, “Configuring iTRAC Workflows,” on page 127.
158 NetIQ Sentinel 7.0.1 User Guide

14.4 Processing a Work ItemA work item can be accessed from any part of the main tabbed Sentinel Control Center interface.
You can process a work item in a group even if you have logged in as a different user. However, you cannot acquire a step if you have logged in as a different user.
The work item remains with the user of a group who has acquired it.
Consecutive steps are dependent. If two consecutive steps are assigned to the same role, the user who acquires the first step is also assigned the second step.
Non‐consecutive steps are independent. For example, if a workflow proceeds from steps that are assigned to the Tier 1 Analyst group to the Tier 2 Analyst group and then back to the Tier 1 Analyst group, the third step is available to the entire Tier 1 Analyst group. It is not assigned to the individual user who handled the first step.
To process a work item, you must accept and complete the work item:
1 In the Work Item Summary, click the yellow or green bar. A work item list for the group or the current user displays.
2 To assign an iTRAC process to you, select the process and click Acquire.
The Work Item Summary changes from yellow to green.
NOTE: When you acquire (accept) a work item, it is removed from the queues of all other users in the same role. The work item can be returned to the group by clicking Release.
3 Click View Details.
The current step within a work item is highlighted in red.
4 To take action on the step, click the Process Details tab.
Depending on the type of variable (Integer, String, Boolean and Float) in a manual step, you can click the down‐arrow and select a value. If needed, you can add comments or add an attachment.
In all other cases, the steps are automatic.
5 Click Complete to complete the process.
Completing the work item signals the completion of the task to the iTRAC server. The updateable variables from the work item are processed by the server to move to the next step, which depends on how the workflow is defined. The work item is removed from the user’s worklist and appears in the worklist of the individual or role associated with the next step in the process.
14.5 Managing Work Items Of Other UsersThe Administration function allows an administrative user to release a work item from a specific user back to everyone in a role. This is beneficial if a work item is in already in process but the assigned user cannot complete the work.
1 Log in into Sentinel as a user with iTRAC – Manage Work Items Of Other Users user rights.
2 In the Summary pane, click View work items.
3 In the Work Items window, set the following:
User: Name of the user that has acquired the process
Managing Work Items 159

Group: Name of the group that the user belongs to. In this example, the user belongs to the Analyst group.
Owner: Select <All> (all processes acquired or not), me (acquired processes), or Group (un‐acquired processes).
Process: Name of the process.
In this example, all processes are acquired by jr1, who belongs to the Analyst group.
4 To release the work item, select the work item and click Release. Release changes to Acquire (not available).
In this example, only a member of the Analyst group can acquire this work item.
160 NetIQ Sentinel 7.0.1 User Guide
A ASearch Query Syntax
Sentinel uses the Lucene query language for searching events. This section provides an overview of how to use the Lucene query language to perform searches in Sentinel. For more advanced features, see Apache Lucene ‐ Query Parser Syntax.
For information on the event fields in Sentinel, click Tips on the top right corner in the Sentinel Web interface. A table is displayed that lists the event names and their IDs.
Section A.1, “Basic Search Query,” on page 161
Section A.2, “Wildcards in Search Queries,” on page 166
Section A.3, “The notnull Query,” on page 168
Section A.4, “Tags in Search Queries,” on page 168
Section A.5, “Range Queries,” on page 169
Section A.6, “IP Addresses Query,” on page 169
A.1 Basic Search QueryA basic query is a search for a value on a field. The syntax is as follows:
msg:<value>
The field name (msg) is separated from the value by a colon.
For example, to search for a phrase that includes the word “authentication,” you can specify the search query as follows:
msg:authentication
Or, to search for events of severity 5, you can specify the search query as follows:
sev:5
If the value has spaces or other delimiters in it, you should use quotation marks. For example:
msg:"value with spaces"
Sentinel classifies event fields as either tokenized fields or non‐tokenized fields. A tokenized field is indexed and is searched differently than a non‐tokenized field.
Section A.1.1, “Case Insensitivity,” on page 162
Section A.1.2, “Special Characters,” on page 162
Section A.1.3, “Operators,” on page 162
Section A.1.4, “The Default Search Field,” on page 163
Search Query Syntax 161

Section A.1.5, “Tokenized Fields,” on page 164
Section A.1.6, “Non‐Tokenized Fields,” on page 166
A.1.1 Case Insensitivity
Indexing and searching in Sentinel is not case‐sensitive. For example, the following queries are all equivalent:
msg:AdMinmsg:adminmsg:ADMIN
A.1.2 Special Characters
If you include special characters as part of a search, the special characters must be escaped. These characters are as follows:
+ - && || ! ( ) { } [ ] ^ " ~ * ? : \
Use “ \” before the character you want to escape. For example, to search for ISO/IEC_27002:2005 in the rv145 (Tag) field, use the following query:
rv145:ISO/IEC_27002\:2005
You can also use quotation marks around the query:
rv145:"ISO/IEC_27002:2005"
If the value contains quotation marks, you must escape it by using the “\” character instead of quotation marks. For example, to search for “system “mail” service” in the initiatorservicename field, you must specify the query as follows:
sp:"system \"mail\" service"
For more information on quoting wildcard characters, see Section A.2.2, “Quoted Wildcards,” on page 167.
A.1.3 Operators
Lucene supports AND, OR, and NOT Boolean operators, which allow words to be combined. Boolean operators must be always capitalized.
“OR Operator” on page 162
“AND Operator” on page 163
“NOT Operator” on page 163
“Operator Precedence” on page 163
OR Operator
The OR operator is the default conjunction operator. If there is no Boolean operator between two clauses, the OR operator is used. The OR operator links two clauses and finds a matching event if either of the clauses is satisfied. The symbol || can be used in place of the word OR. For example, consider the following query:
162 NetIQ Sentinel 7.0.1 User Guide

sun:admin OR dun:admin
This query finds events whose initiator username or target username is “admin.” The following query produces the same result because OR is used by default:
sun:admin dun:admin
AND Operator
The AND operator links two clauses and finds a matching event only if both clauses are satisfied. The symbol && can be used in place of the word AND. For example, consider the following query:
sun:admin AND dun:tester
This query finds events whose initiator username is admin and the target username is tester.
NOT Operator
The NOT operator excludes events that match the clause after the NOT. The symbol ! can be used in place of the word NOT. For example, consider the following query:
sev:[0 TO 5] NOT st:I NOT st:A NOT st:P
This query matches all events whose severity is between 0 and 5, but excludes those whose sensor type is I (internal), A (audit), or P (performance); that is, it excludes Sentinel internal events.
The NOT operator cannot be used by itself because it is a way to exclude events from a set that has been found by other search terms. For example, consider the following query:
NOT st:I NOT st:A NOT st:P
This query might seem like it should return all events where the sensor type is not I, A, or P. However, it is an invalid query because a query cannot begin with the NOT operator.
Operator Precedence
Parentheses can be used in the usual way to change operator precedence. They can be nested to any depth, as shown in the following examples:
(sun:admin OR dun:admin) AND (sip:10.0.0.1 OR sip:10.0.0.2)
((sun:admin OR dun:admin) AND (sip:10.0.0.1 OR sip:10.0.0.2)) OR (msg:user AND evt:authentication)
A.1.4 The Default Search Field
Lucene uses a default search field, which is the field that is searched if no field is specified. In Sentinel, _data is the default search field. This field is a concatenation of all non‐empty fields in the event. It is indexed and searched as a tokenized field. The result is that you can search for words that might appear in any event field.
For example, suppose you have two non‐tokenized fields in an event, sun (initiatorusername) and dun (targetusername). The sun field has the following value:
report-administrator
The dun field has the following value:
Search Query Syntax 163

system-tester
The _data field contains the concatenation of these fields separated by a single space character:
report-administrator system-tester
Because the _data field is a tokenized field, the words “report,” “administrator,” “system,” and “tester” are indexed and searchable. The following queries would find this event:
report
_data:report
report-administrator
_data:report-administrator
report tester
In addition, the following queries also find this event:
sun:report-administrator
dun:system-tester
A.1.5 Tokenized Fields
Fields that are classified as tokenized fields are parsed into individual words for indexing. Therefore, a search occurs only on words within the field value. Characters that are considered to be word delimiters are not searchable, nor are words that are considered to be stop words. Lucene removes extremely common words to save disk space and speed up searching. These words are ignored in search filters. Currently, the following stop words are removed:
a
an
and
are
as
at
be
but
by
for
if
in
into
is
it
no
not
of
on
164 NetIQ Sentinel 7.0.1 User Guide
or
such
that
the
their
then
there
these
they
this
to
was
will
with
When it does a search, Lucene examines all of the words in a field and tries to match words in the search value. For example, suppose that you specify a search for messages containing the following value:
msg:"user-authentication failed on the server"
The words that are parsed within this value are “user,” “authentication,” “failed,” and “server.” These are the only search words that would match this value. “On” and “the” are omitted because they are stop words.
The value has the hyphen character (‐) between some words. Hyphens are treated as word delimiters, so Lucene does not search for hyphens. Consider, the following query:
msg:"user-authentication"
The results might not be exactly what you expect. The query search value matches the value, but not because it is matching the hyphen. It matches because Lucene first parses the words in the search value and identifies the words “user” and “authentication.” Lucene then matches those words against values that have the words “user” and “authentication” with no intervening words in between. This query would also match the following value, even though there is no hyphen between “user” and “authentication”:
user authentication has failed on the server
Consider the following query:
msg:"failed on server"
This query has the stop word, ʺon,ʺ which is ignored. However, the stop word does affect the relative positioning that is expected to be between words when evaluating a value to see if it matches. The “failed on server” search matches any phrase where the words “failed” and “server” are separated by exactly one word. It does not matter what the word is because the separating word is a stop word and is ignored. Thus, the above query would match all of the following:
failed on server
failed-on server
failed a server
Search Query Syntax 165

failed-a-server
Proximity indicators created by using the ~ character followed by a value, make this more complicated. The query dictates an expected distance between words. In the “failed on server” query, the expected distance between “failed” and “server” is one word. The proximity indicator specifies how much variance there can be from the expected distance. For example, consider the following query, where a proximity indicator of one (~1) is specified:
msg:"failed on server"~1
This query indicates that the distance between “failed” and “server” could be plus or minus one from the expected distance, which is one because of the stop word “on.” Thus, the distance could be 1, 1‐1 (0), or 1+1 (2). Thus, all of the following would match:
failed on server
failed on the server
failed finance server
As of Lucene version 3.1, word parsing is done according to word break rules outlined in the Unicode Text Segmentation algorithm. For more information, see Unicode Text Segmentation.
For information on tokenized fields in Sentinel, in the Sentinel Web interface click Tips on the top right corner of the Sentinel Web interface. A table is displayed that lists all the event fields and whether an event field is searchable or not.
A.1.6 Non-Tokenized Fields
Fields that are classified as non‐tokenized fields are parsed fully for indexing. Thus, a search occurs on full field values. For example, to search events whose initiatoruserfullname (iufname) field has the value “Bob White”, you must specify the query as follows:
iufname:"Bob White"
A.2 Wildcards in Search QueriesLucene supports wildcards in search values but not in regular expressions:
The asterisk (*) matches zero or more characters.
The questions mark (?) matches any one character.
For example:
adm*test: Matches admtest, ADMTEST, admintest, adMINtEst (note the lack of case sensitivity).
adm?test: Matches adm1test and AdMatest. Does not match admtest or ADMINTEST because it must have exactly one character between ʺadmʺ and ʺtest.ʺ
Section A.2.1, “Wildcards in Tokenized Fields,” on page 167
Section A.2.2, “Quoted Wildcards,” on page 167
Section A.2.3, “Leading Wildcards,” on page 167
166 NetIQ Sentinel 7.0.1 User Guide
A.2.1 Wildcards in Tokenized Fields
Wildcards are applied differently to tokenized fields and non‐tokenized fields. Wildcards for tokenized fields match only words that were parsed from the value and not the entire value. For example, if you specify the search query msg:authentication*failed to search for the message The user authentication has failed on the server, it does not return the events with this message. This is because “*” does not match anything between “authentication” and “failed.” However, it matches any words that begin with “authentication” and end with “failed.” For example, it returns results if any of the following words are used: “authenticationhasfailed,” “authenticationuserfailed,” and “authenticationserverfailed.” For tokenized fields, all matching that uses wildcard searches is done on the words within the value and not on the full value.
A.2.2 Quoted Wildcards
“Tokenized Fields” on page 167
“Non‐Tokenized Fields” on page 167
Tokenized Fields
When wildcards are quoted, they are not treated as wildcards, but as word delimiters. For example, consider the following query:
msg:"user* fail*"
The search value ʺuser* fail*ʺ is parsed into two words, “user” and “fail.” The semantic is ʺfind any event where the msg field contains “user” AND “fail” words in that order, and there are no intervening words between them.” Thus, it does not match the following value:
The user authentication has failed on the server.
This is because the wildcard is not treated as a wildcard but as a word delimiter.
Non-Tokenized Fields
When wildcards are quoted, they are treated as literal characters to search. For example, if the query is: sun:"adm*," it returns the following values:
adm*
ADM* (case-insensitive)
The query does not return the following values:
admin
ADMIN
A.2.3 Leading Wildcards
Leading wildcards are not valid in searches because Lucene does not allow the * or ? characters to be the first character of a search value. For example, the following queries are invalid:
sun:*adm* The semantic is “find any event whose initiator username value contains the letters a, d, and m in sequence.“
Search Query Syntax 167

sun:*tester The semantic is “find any event whose initiatorusername value ends with “tester.”
sun:* The semantic is “find any event whose initiator username field is non‐empty.”
Because this is an important type of query, Sentinel provides an alternative way to accomplish this. For more information, see Section A.3, “The notnull Query,” on page 168.
A.3 The notnull QueryYou might need to find events where some field is present, or non‐empty. For example, to find all events that have a value in the sun field, you can specify the query as sun:*
The query does not return the expected results because Lucene does not support wildcards to be the first character of a search value. However, Sentinel provides an alternate solution. For every event, Sentinel creates a special field called notnull. The notnull field is a list of all fields in the event that are not null (not empty). For example, if there is an event that has values in the evt, msg, sun, and xdasid fields, the notnull field contains the following value:
evt msg sun xdasid
The notnull field is a tokenized field, so the following kinds of queries are possible:
notnull:sun Finds all events whose sun field has a value.
notnull:xdas* Finds all events where any field beginning with the name ʺxdasʺ has a value.
When a notnull field is added in Lucene, creating, indexing, and storing this field adds a cost to processing each event as CPU needs to create and index the field and it also requires additional storage space. If you want to disable storing the list of non‐empty fields in the notnull field, set the following property in the /etc/opt/novell/sentinel_log_mgr/config/configuration.properties file:
indexedlog.storenotnull=false
Save the file and restart the Sentinel Log Manager server. All events received after this property was set do not have a notnullfield associated.
NOTE: If you disable the notnull field, do not use the notnull field in search filters, rule filters, or policy filters because the results might be incorrect and unpredictable.
A.4 Tags in Search QueriesThe Tag field (rv145) is a tokenized field that has special parsing rules for words. The parsing rules enable you to search on tags that include non‐alphanumeric characters. However, the only word delimiters are white space characters such as the blank and the tab. This is because tags do not include white space in their names. For example, the following queries find the event if the event is tagged with the ISO/IEC_27002:2005 tag and the NIST_800‐53 tag:
rv145:"ISO/IEC_27002:2005"
rv145:"iso/iec_27002:2005"
rv145:ISO/IEC_27002*
rv145:nist_*
168 NetIQ Sentinel 7.0.1 User Guide

The slash (/), hyphen (‐), and colon (:) characters are significant in the search value because, unlike other tokenized fields, the parsing rules for rv145 do not treat them as a word delimiter. Also, the search is not case sensitive.
The following queries would not find the event:
rv145:"ISO IEC_27002 2005"
rv145:"iso *"
A.5 Range QueriesRange queries allow you to find events where a field value is between a lower bound and an upper bound. Range queries can be inclusive or exclusive of the upper and lower bounds. Whether a particular value falls in the specified range is based on lexicographic character sorting. Inclusive ranges are denoted by square brackets []. Exclusive ranges are denoted by curly brackets {}.
For example, consider the following query:
sun:[admin TO tester]
This query finds events whose sun field has values between admin and tester, inclusive. Note that ʺTOʺ is capitalized.
However, if you change the query as follows:
sun:{admin TO tester}
The query now finds all events whose sun field is between admin and tester, not including admin and tester.
Some event fields such as sev and xdasid are numeric. In Sentinel, range queries on numeric fields are based on numeric sorting and not on lexicographic character sorting. For example, consider the following query:
xdasid:[1 TO 7]
This query returns events whose xdasid value is 1, 2, 3, 4, 5, 6, or 7. If the range evaluation was based on lexicographic sorting, it would incorrectly match 10, 101, 100001, 200, and so on.
A.6 IP Addresses QueryThere are several extensions that Sentinel has implemented for searching on IP addresses. Specifically, there are a number of convenient ways to specify IP address ranges. These are explained in the following sections:
Section A.6.1, “CIDR Notation,” on page 169
Section A.6.2, “Wildcards in IP Addresses,” on page 170
A.6.1 CIDR Notation
Sentinel supports the Classless Inter‐Domain Routing (CIDR) notation as a search value for IP address fields such as sip (initiator IP) and dip (target IP) for specifying an IP address range. The notation uses a combination of an IP address and a mask, as follows:
Search Query Syntax 169
xxx.xxx.xxx.xxx/n
In this notation, n is the number of high order bits in the value to match. For example, consider the following query:
sip:10.0.0.0/24
This query returns events whose sip field is an IPv4 address ranging from 10.0.0.0 to 10.0.0.255.
The same notation works for IPv6 addresses. For example, consider the following query:
sip:2001:DB8::/48
This query returns events whose sip field is an IPv6 address ranging from 2001:DB8:: to 2001:DB8:0:FFFF:FFFF:FFFF:FFFF:FFFF.
A.6.2 Wildcards in IP Addresses
You can use only the asterisk character (*) in the IP address search values to specify ranges of IP addresses. You cannot use the question mark (?) character.
In IPv4 addresses, an asterisk (*) can be used at any of the positions in the quad format. In IPv6 addresses, an asterisk (*) can be used between colons to specify a 16‐bit segment. For example, all of the following queries are valid on the sip field:
sip:10.*.80.16
sip:10.02.*.*
sip:10.*.80.*
sip:CAFE:*::FEED
sip:CAFE:*:FADE:*::FEED
If an asterisk (*) is used in one of the quad positions in an IPv4 address or between colons in an IPv6 address, it cannot be combined with other digits. For example, all of the following queries are invalid:
sip:10.*7.80.16
sip:10.10*.80.16
sip:CAFE:FA*::FEED
sip:CAFE:*DE::FEED
Because the question mark (?) is not allowed, the following queries are invalid:
sip:10.10?.80.16
sip:10.?.80.16
sip:CAFE:FA??::FEED
sip:CAFE:??DE::FEED
170 NetIQ Sentinel 7.0.1 User Guide

B BCorrelation Rule Expression Syntax
Correlation rules are written to match specific events or sequences of events by using field references, comparison and match operators on the field contents, and operations on sets of events.
The Correlation Engine loads the rule definition and uses the rules to evaluate, filter, and store events in memory that meet the criteria specified by the rule. Depending on the rule definition, a correlation rule might fire according to several different criteria:
The value of one field or multiple fields
The comparison of an incoming event to past events
The number of occurrences of similar events within a defined time period
One or more subrules firing
One or more subrules firing in a particular order
This section provides a basic overview of how to build Correlation rules and the various parameters required to build a rule.
Section B.1, “Event Fields,” on page 171
Section B.2, “Event Operations,” on page 172
Section B.3, “Operators,” on page 179
Section B.4, “Order of Operators,” on page 180
B.1 Event FieldsAll operations function on event fields, which can be referred to by their names or by their IDs within the rule expression. For a full list of event field names and their IDs, in the Sentinel Web interface, click Tips on the top right corner of the Sentinel Web interface.
The event field name or its ID must also be combined with a prefix to designate whether the event field is part of the current event (e) or a past event that is stored in memory. For the Window operator, the stored events are prefixed with (w).
Examples:
e.dip (Destination IP for the current event)w.dip (Destination IP for any stored event)
IMPORTANT: If you rename an event field by using the Event Configuration utility in the Sentinel Control Center, use the new name when writing rules. In all cases, rules are stored internally with the fixed IDs and the names are translated dynamically when viewed.
Correlation Rule Expression Syntax 171
B.2 Event Operations Event operations evaluate, compare, and count events. Each operation works on a set of events, receiving a set of events as input and returning a set of events as output. The current event processed by a rule often has a special meaning within the language semantics. The current event is always part of the set of events output by the operation unless the set is empty. If an input set of an operation is empty, then the operation is not evaluated.
The individual correlation operations evaluate sets of events and, if matches are produced, generates sets of corresponding events. You can chain together multiple correlation operations by using the flow operator. The most common use of a chain construct is to begin a chain with a filter to select a subset of events. The subset is then grouped by operations, such as Trigger, or by cross‐event comparisons, such as Window. For more information on the flow operator, see Section B.3.1, “Flow Operator,” on page 179.
<operation 1> [flow <operation N> ...]
<operation 1> is a fully‐specified operation.
In the above example, the output from one operation is treated as input to the next operation, much like the UNIX pipe operator. The last operation in a chainʹs output causes the whole rule to fire, generating a correlated event.
Section B.2.1, “Filter Operation,” on page 172
Section B.2.2, “Trigger Operation,” on page 175
Section B.2.3, “Window Operation,” on page 176
Section B.2.4, “Gate Operation,” on page 178
Section B.2.5, “Sequence Operation,” on page 178
B.2.1 Filter Operation
A filter consists of evaluation expressions that evaluate the current event from the real‐time event stream. It compares the event field values with user‐specified values by using a wide set of comparison and match operators. If a match is found, the output set is the matched event, and then the filter resets.
The syntax for the filter operation is:
<filter expression> ::= "filter("<evaluation expression 1> [NOT|AND|OR <evaluation expression 2>] […] [NOT|AND|OR <evaluation expression n>]")"
<evaluation expression 1..N> is an expression constructed of one event field reference (name or ID) and a comparison or match operator.
<evaluation expression> ::= “e.” <event_name | event_ID> <comparison operator | match operator> <user_specified_value>
Multiple evaluation expressions can be combined by using the standard Boolean operators (AND, OR, and NOT) and grouping parentheses.
For example, the following rule detects whether the current event has a severity of 4 and the event name contains either “FW” or “Comm.”
filter(e.sev = 4 and (e.evt match regex ("FW") or e.evt match regex ("Comm")))
172 NetIQ Sentinel 7.0.1 User Guide

The filter operation supports the following operators:
“Boolean Operators” on page 173
“Standard Arithmetic Operators” on page 173
“Match Regex Operator” on page 173
“Match Subnet Operator” on page 174
“Inlist and Not Inlist Operators” on page 174
“Isnull Operator” on page 174
Boolean Operators
Filter expressions can be combined by using the Boolean operators AND, OR, and NOT. The filter Boolean operator precedence (from the highest to the lowest precedence) is described in the following table:
Table B-1 Boolean Operators
Standard Arithmetic Operators
Standard arithmetic operators can be used to build a condition that compares the value of an event ID and a user‐specified value, which is either a numeric value or a string field. The standard arithmetic operators in Sentinel are =, <, >, !=, <=, and >=.
Examples:
filter(e.sev > 3)filter(e.BeginTime < 1179217665)filter(e.iufname != “Administrator”)
Match Regex Operator
The match regex operator is used to match an event field value by using standard regular expressions. This operator is used only for string type tags.
Examples:
Match the exact phrase (case sensitive):
filter(e.evt match regex ("LoginUser"))
Match the exact phrase (not case sensitive):
filter(e.evt match regex ("(?i)^TeSt EvenT$"))
The value includes the phrase (not case sensitive):
filter(e.evt match regex ("(?i)EsT EVen"))
Operator Meaning Operator Type Associativity
NOT logical NOT unary None
AND logical AND binary left to right
OR logical OR binary left to right
Correlation Rule Expression Syntax 173

For more information on the match regex operator, see Regular Expressions.
Match Subnet Operator
The match subnet operator is used to match event field IP addresses to a subnet in standard CIDR notation. This operator is used only for IP address fields.
Example:
filter(e.dip match subnet (10.0.0.1/22))filter(e.sip = 10.0.0.1 or e.sip=10.0.0.2) and (e.dpint=80)
For more information on CIDR notation, see CIDR.
Inlist and Not Inlist Operators
The inlist operator is used to perform a lookup on an existing Dynamic List of string values. This operator returns TRUE if the event field value is present in the list. For more information on Dynamic Lists, see Chapter 6, “Configuring Dynamic Lists,” on page 75.
For example, the following expression is used to evaluate whether the source IP address of the current event is present in a Dynamic List named MailServerList. If the source IP address is present in this list, the expression evaluates to TRUE.
filter(e.sip inlist MailServerList)
As another example, this filter expression combines the NOT operator and the inlist operator. This expression evaluates to TRUE if the source IP address is not present in the Dynamic List named MailServerList.
filter(not (e.sip inlist MailServerList))
The following expression is used to evaluate whether the event name of the current event equals “File Access” and the InitiatorUserName is not present in a Dynamic List named AuthorizedUsers. If both conditions are true for the current event, the expression evaluates to TRUE.
filter(e.evt="File Access" and not(e.sun inlist AuthorizedUsers))
Isnull Operator
The isnull operator returns TRUE if the event field value is equal to null. For example:
Filter(isnull(e.sip))
Output Sets
The output of this expression is either the empty set (if the evaluation expression evaluates to FALSE) or a set containing the current event (if the evaluation expression evaluates to TRUE).
If the filter is the last or only operation of a correlation rule, the output set of the filter is used to construct a correlated event.The input event that matched the filter is associated with the correlated event.
If the filter is not the last operation of a correlation rule (that is, if the filter is followed by a flow operator), the output set of a filter is used as the input set to other operations through the flow operator.
174 NetIQ Sentinel 7.0.1 User Guide

Additional Information
The filter operator can be used to compare event field values with other event field values within the same event. For example:
filter(e.sip=e.dip)
B.2.2 Trigger Operation
The trigger operation counts a number of events for a specified duration. The trigger command defines a threshold count of events within a time condition and applies an optional discriminator that splits events into unique buckets on which to apply the threshold count and time window conditions. Trigger itself does not apply any filtering. Every event that enters the trigger function is put in a bucket and is counted. If you want to use trigger on certain type of events, you must prefilter the events and then flow that output to trigger.
Syntax
<trigger expression> ::= "trigger("<threshold count>","<evaluation period>","discriminator ("<list of event fields>")")"
<threshold count> is an integer value specifying the number of events in a single bucket that are necessary for the rule to fire.
<evaluation period> indicates the duration for which old events are kept in the bucket and counted towards the threshold. The duration can be seconds (s), minutes (m), hours (h), and days (d.).
discriminator (<list of event fields>) specifies the set of fields to use to segregate each event into its unique bucket. All fields are logically combined to define the bucket.
For example, the following rule detects if 5 events with the same source IP address happen within 10 seconds.
trigger(5,10,discriminator(e.sip))
Note that the discriminator is used to split the input stream of events into distinct buckets where all events in a bucket have identical data for the specified fields (SourceIP in the example above.) Multiple fields can be used to create buckets where all events in a single bucket have, for example, the same SourceIP and TargetUserName. However, you cannot count across multiple buckets. For example, you cannot use the Trigger operation to detect conditions where a source system contacts N distinct target systems.
Output Sets
If the specified count is reached within the specified duration, a set of events containing all of the events maintained by the trigger is output.
When receiving a new input set of events, a trigger first discards the outdated events (events that have been maintained for more than the duration) and then inserts the current event. If the number of resulting events is greater than or equal to the specified count, the trigger outputs a set containing all of the events.
If a trigger is the last operation (or the only operation) of a correlation rule, then the output set of the trigger is used to construct a correlated event. The raw events associated with the correlated events are the trigger operation output set of events with the current event listed first.
Correlation Rule Expression Syntax 175

B.2.3 Window Operation
The Window operation compares the current event to a set of past events that are stored in a window that is defined as part of the Window operation. Window allows you to temporarily store events of interest and then use the data within those stored events to filter the incoming raw events.
For example, suppose you want to detect if someone attempts to log in to an account several times and fails, but then guesses that password and succeeds in logging in. You would collect the failed login events and store them in the window, then compare new successful login events against those stored events and match the username. If a match is found, then the user first failed to log in and then did so successfully. Any event field can be matched against any other event field for more sophisticated correlations.
How the Window Operation Works
The incoming raw stream of events is split before it arrives at the window operation:
Storage filter (w.event tag): One stream of raw events is matched against the storage filter and, if any events match, they are placed in the window. Note that the current event is not part of this stream (that is, this stream is delayed by one event.) Events in the window are referred to with the “w.” prefix, which can be interpreted as ʺthe set of events in the window.ʺ
Evaluation filter (e.event tag): The other stream of raw events is filtered and then passed, one at a time, into the Window operation. Each event (the current event) is matched against the set of events stored in the window by using the defined comparison expression. The current event passing into the Window operation is referred to with the “e.” prefix, which can be interpreted as ʺthe current event.ʺ
You can define two filters for the Window operation to constrain resource usage. You define the first filter within the Window operation itself to set the storage filter. You define the second filter as a prefix to the Window operation using a standard in‐line filter that sets the evaluation filter. These filters are optional, but recommended.
To ensure that the current event does not match itself in cases where the comparison operator is matching on the same field and a single event would match both the evaluation and storage filters, the set of events in the window does not include the current event.
NOTE: It is critical to design your storage and evaluation filters carefully to minimize resource usage by the Window operation. The window stores the event UUID and any fields necessary for comparison for all events that match the storage filter, so constraining the set of matched events is important to reduce memory use.
Syntax
The syntax is as follows:
<window expression> ::= "window(" <comparison expression> "," <storage filter> "," <storage_time_period> ")"
<comparison expression> matches a current event field against a field in the set of past events stored in the window. The standard comparison operators are supported.
<comparison expression> ::= "w." <event_ID | event_name> <comparison operator> "e." <event_ID | event_name>
176 NetIQ Sentinel 7.0.1 User Guide
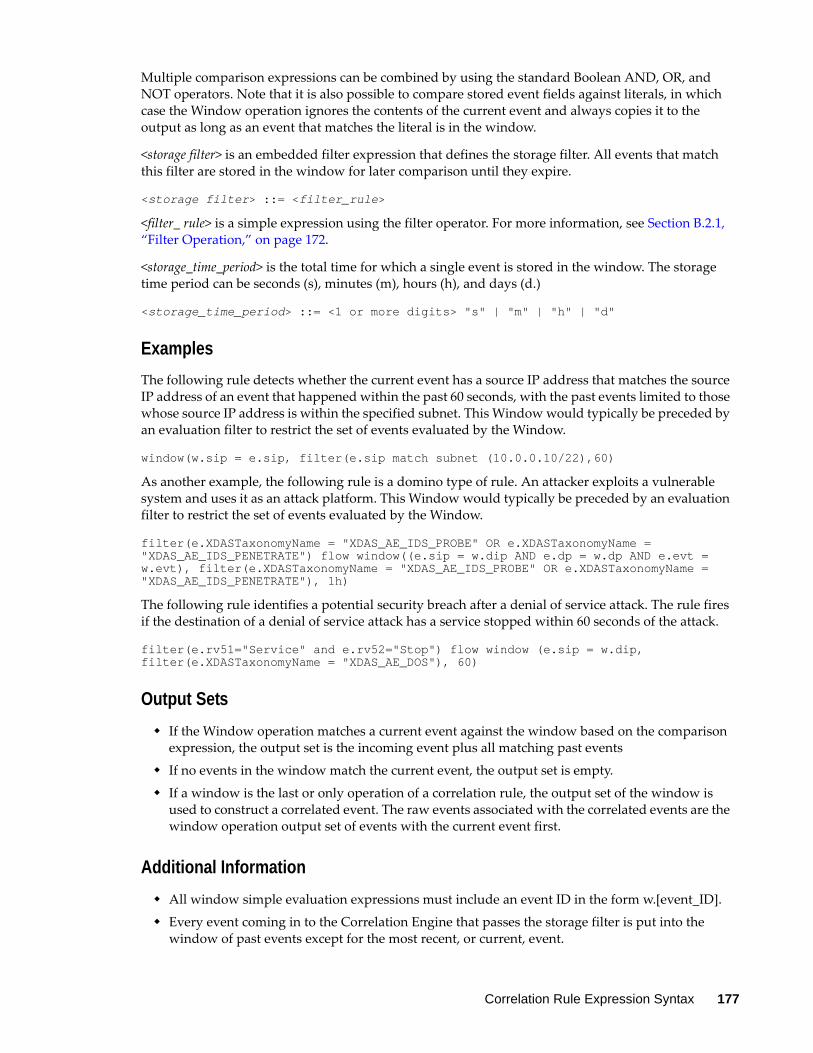
Multiple comparison expressions can be combined by using the standard Boolean AND, OR, and NOT operators. Note that it is also possible to compare stored event fields against literals, in which case the Window operation ignores the contents of the current event and always copies it to the output as long as an event that matches the literal is in the window.
<storage filter> is an embedded filter expression that defines the storage filter. All events that match this filter are stored in the window for later comparison until they expire.
<storage filter> ::= <filter_rule>
<filter_ rule> is a simple expression using the filter operator. For more information, see Section B.2.1, “Filter Operation,” on page 172.
<storage_time_period> is the total time for which a single event is stored in the window. The storage time period can be seconds (s), minutes (m), hours (h), and days (d.)
<storage_time_period> ::= <1 or more digits> "s" | "m" | "h" | "d"
Examples
The following rule detects whether the current event has a source IP address that matches the source IP address of an event that happened within the past 60 seconds, with the past events limited to those whose source IP address is within the specified subnet. This Window would typically be preceded by an evaluation filter to restrict the set of events evaluated by the Window.
window(w.sip = e.sip, filter(e.sip match subnet (10.0.0.10/22),60)
As another example, the following rule is a domino type of rule. An attacker exploits a vulnerable system and uses it as an attack platform. This Window would typically be preceded by an evaluation filter to restrict the set of events evaluated by the Window.
filter(e.XDASTaxonomyName = "XDAS_AE_IDS_PROBE" OR e.XDASTaxonomyName = "XDAS_AE_IDS_PENETRATE") flow window((e.sip = w.dip AND e.dp = w.dp AND e.evt = w.evt), filter(e.XDASTaxonomyName = "XDAS_AE_IDS_PROBE" OR e.XDASTaxonomyName = "XDAS_AE_IDS_PENETRATE"), 1h)
The following rule identifies a potential security breach after a denial of service attack. The rule fires if the destination of a denial of service attack has a service stopped within 60 seconds of the attack.
filter(e.rv51="Service" and e.rv52="Stop") flow window (e.sip = w.dip, filter(e.XDASTaxonomyName = "XDAS_AE_DOS"), 60)
Output Sets
If the Window operation matches a current event against the window based on the comparison expression, the output set is the incoming event plus all matching past events
If no events in the window match the current event, the output set is empty.
If a window is the last or only operation of a correlation rule, the output set of the window is used to construct a correlated event. The raw events associated with the correlated events are the window operation output set of events with the current event first.
Additional Information
All window simple evaluation expressions must include an event ID in the form w.[event_ID].
Every event coming in to the Correlation Engine that passes the storage filter is put into the window of past events except for the most recent, or current, event.
Correlation Rule Expression Syntax 177

If no storage filter expression is defined, all events coming into the Correlation Engine are stored by the window. With extremely high event rates or long duration storage time period, this might require a large amount of memory.
To minimize memory usage, only the relevant parts of the past events, not all event ID values, are maintained in memory.
B.2.4 Gate Operation
The Gate operation is used to combine multiple subrules together to detect conditions where several distinct activities happen within a given time period. The order in which each activity occurred is not considered.
The gate operation is made up of one or more nested subrules and can be configured to fire if some, any, or all of the subrules fire within a specified time. The subrules can be a simple rule or another composite rule. For more information on composite rules, see “Composite Rule” on page 42.
Syntax
<gate expression> ::= "gate("<subrule 1>","<subrule 2>","<subrule n>","<mode>","<evaluation period>","discriminator ("<list of event fields>")")"
<subrule 1...N> rules are the rule definitions for 1 to n subrules. Each subrule is an independent, valid, correlation rule.
<mode> can be one of the subrules that must be triggered for the Gate operation to trigger.
<evaluation period> indicates the time period over which the specified number of subrules must fire in order for the whole Gate rule to fire.
discriminator (<list of fields>) acts similar to the discriminator in the Trigger operation. The output from each subrule is placed into unique buckets based on the data in the fields specified in this discriminator. The <mode> count and <evaluation period> is then applied to each bucket separately.
For example, the following rule is a typical perimeter security IDS inside/outside rule:
filter(e.sev > 3) flow gate(filter(e.sn = "in"), filter(e.sn = "out"), all, 60s, discriminator(e.dip, e.evt))
B.2.5 Sequence Operation
Sequence rules are similar to gate rules, except that all subrules must fire in sequence for the overall Sequence operation to fire.
The subrules can be a simple rule or another composite rule.
Syntax
Syntax:
<sequence expression> ::= "sequence("<subrule 1>","<subrule 2>","<subrule n>","<evaluation period>","discriminator("<list of event fields>")")"
<subrule 1..N> are the rule definitions for 1 to n subrules. Each subrule is an independent, valid, correlation rule.
178 NetIQ Sentinel 7.0.1 User Guide

<evaluation period> is a time period expressed in seconds (s), minutes (m), or hours (h).
discriminator (<list of fields>) acts similar to the discriminator in the Trigger operation; the output from each subrule is placed into unique buckets based on the data in the fields specified in this discriminator. The <evaluation period> is then applied to each bucket separately.
For example, this rule detects three failed logins by a particular user in 10 minutes followed by a successful login by the same user.
sequence (filter(e.evt="failed logins") flow trigger(3, 600, discriminator(e.sun, e.dip)), filter(e.evt="goodlogin"), 600, discriminator(e.sun, e.dip))
B.3 OperatorsOperators are used to transition between operations or expressions. The following fundamental operators are used between operations:
Section B.3.1, “Flow Operator,” on page 179
Section B.3.2, “Union Operator,” on page 179
Section B.3.3, “Intersection Operator,” on page 180
B.3.1 Flow Operator
The output set of events of the left side operation is the input set of events for the right side operation. Flow is typically used to transition from one correlation operation to the next.
For example:
filter(e.sev = 5) flow trigger(3, 60)
The output of the filter operation is the input of the trigger operation. The trigger only counts 3 events with severity equal to 5.
B.3.2 Union Operator
The union operator is the union of the left side operation output set and the right side operation output set. The resulting output set contains events from either the left side operation output set or the right side operation output set, without duplicates.
For example:
filter(e.sev = 5) union filter(e.sip = 10.0.0.1)
is equivalent to
filter(e.sev = 5 or e.sip = 10.0.0.1)
Correlation Rule Expression Syntax 179

B.3.3 Intersection Operator
The intersection operator is the intersection of the left side operation output set and the right side operation output set. The resulting output set contains events that are common to both the left side operation output set and the right side operation output set without duplicates.
For example:
filter(e.sev = 5) intersection filter(e.sip = 10.0.0.1)
is equivalent to
filter(e.sev = 5 and e.sip = 10.0.0.1)
B.4 Order of OperatorsThe operator precedence (from the highest to the lowest) is as follows:
Table B-2 Operator Precedence
Operator Meaning Operator Type Associativity
flow The output set becomes the input set binary left to right
intersection Set intersection (remove duplicates) binary left to right
union Set union (remove duplicates) binary left to right
180 NetIQ Sentinel 7.0.1 User Guide