netl’s capability to compare transportation fuels: … library/research/energy...
TRANSCRIPT

Briefing for NETL Director, February 25, 2009; updated April 2, 2009
NETL’s Capability to Compare Transportation Fuels:
GHG Emissions and Energy Security Impacts
Kristin J. GerdesOffice of Systems, Analyses and Planning

2
• Defined baseline greenhouse gas (GHG) emissions
for petroleum-based fuels
Evaluating GHG Emissions of
Transportation Fuels
Proposed
Sec 526
0 5 10 15 20 25 30
Diesel Well-to-Tank GHG Emissions (kg CO2E/MMBtu LHV)
Domestic
Crude Oil
13.5
Imported
Crude Oil
21.4
$100 Billion Top
GHG Emitters
28.4
Diesel Well-to-Wheels GHG Emissions (kg CO2E/MMBtu LHV)
0 10 20 30 40 50 60 70 80 90 100 110
Well-to-Wheels (WTW) = 95.0 kg CO2E/MMBtu LHV diesel
Well-to-Tank (WTT) = 18.4 kg CO2E/MMBtu LHV diesel Proposed
Sec 526

3
• Defined baseline greenhouse gas (GHG) emissions
for petroleum-based fuels
• Evaluated incremental impacts by crude oil source
• Portrayed impact of a PHEV-CO2-EOR system
Evaluating GHG Emissions of
Transportation Fuels
0 5 10 15 20 25 30
Diesel Well-to-Tank GHG Emissions (kg CO2E/MMBtu LHV)
Domestic
Crude Oil
13.5
Imported
Crude Oil
21.4
Top GHG Emitters
$100 Billion in 2008*
28.4
WTT Baseline
18.4
*At a weighted average acquisition price of $92/bbl for Canada oil sands, Venezuela upgraded bitumen, and Mexico and Nigeria crude oil

4
Presentation Overview
• Baseline GHG emissions from
petroleum-based fuels
• GHG emissions for production
of diesel by crude oil source
• Combining petroleum baseline study with other
transportation analyses products
T-3
T-2T-1

5
Goal and Application of Petroleum Baseline
GHG Emissions Study
Develop life cycle GHG
emissions for petroleum-based
transportation fuelsConsistent with Energy
Independence and Security
Act of 2007To allow accurate
comparison of alternative
transportation fuel
options

6
Year 2005 Petroleum Refinery Flows*
Feedstock Acquisition
for U.S. Refineries
- Domestic Crude Oil
- Foreign Crude Oil
- Other Inputs
Conventional
Gasoline Consumed
in the U.S. in 2005
Conventional
Diesel Consumed
in the U.S. in 2005
OtherRefineryProducts
ExportedConventional
Diesel
ExportedConventional
Gasoline
Refinery Fuels
340 MMbbl/yr
Crude Oil Extraction
for Foreign Production
of Gasoline
Kersosene-Based
Jet Fuel Consumed
in the U.S. in 2005
379 MMbbl/yr*
54 MMbbl/yr*
57 MMbbl/yr
404 MMbbl/yr
65 MMbbl/yr*
69 MMbbl/yr
1,056 MMbbl/yr
545 MMbbl/yr
2,772 MMbbl/yr
ExportedJet Fuel
1,488 MMbbl/yr
19 MMbbl/yr
14 MMbbl/yr
73 MMbbl/yr
3,176 MMbbl/yr
1,113 MMbbl/yr
614 MMbbl/yr
LC Stage #1:
Raw Material
Acquisition
LC Stage #2:
Raw Material
Transport
LC Stage #3:
Liquid Fuels
Production
LC Stage #4:
Product Transport
and Refueling
LC Stage #5:
Vehicle/Aircraft
Use
Volume Gain
387 MMbbl/yr
Volume Gain
32 MMbbl/yr
Other Inputs: 365 MMbbl/yr
Domestic: 1,876 MMbbl/yr
Foreign: 3,679 MMbbl/yr
Crude Oil Extraction
for Foreign Production
of Diesel
Crude Oil Extraction
for Foreign Production
of Jet Fuel
Foreign Refineries Exporting
Gasoline to the U.S.
(59 Countries)
Foreign Refineries Exporting
Diesel to the U.S.
(26 Countries)
Foreign Refineries Exporting
Kerosene Jet Fuel to the U.S.
(26 Countries)
149
U.S.
Refineries
Crude Oil
Conventional Gasoline
Conventional Diesel
Kerosene-Based Jet Fuel
* 2005 U.S. refinery feedstock and product and imported products quantities from Energy Information Administration (EIA) Petroleum Navigator

7
Crude Oil Extraction Emissions Dependent on
Associated Gas Handling and Heavy Oil Production
• Impact of associated
gas flaring and venting
• Impact of oil sands production
• Data limitations in Venezuela
Angola
EquadorMexico
Nigeria
U.S.
Algeria
IraqKuwait
Saudi Arabia
Venezuela
0.000
0.00Flared Hydrocarbons During Crude Oil Extraction
(per kg of crude oil)
Cru
de O
il E
xtr
acti
on
CO
2 E
mis
sio
ns
(pe
r kg
of cru
de
oil)
0 5 10 15 20 25
Nigeria
Canada Oil Sands
Angola
Other Crude Imports
Weighted Average
Mexico
Canada Conventional
Algeria
Non-Crude Inputs
Ecuador
Domestic Crude Oil
Venezuela
Iraq
Kuwait
Saudi Arabia
Crude Oil Extraction GHG Emissions
(kg CO2E/MMBtu LHV diesel)

8
Assignment of GHG Emissions to Refinery
Co-Products is Key
• EIA data on 2005
fuels consumed at
refineries and API
emissions factors
provide total GHG
emissions from
refinery operations*
• Assignment of
emissions between
refinery co-products
using a process-
based approach**
1
2
3
4
5
6
6
6
6
6
6
7
8
9
Hydrogen
Plant10
1
2
3
4
5
6
6
6
6
6
6
7
8
9
Hydrogen
Plant10
*Additional sources used for GHG emissions estimates for acquisition of hydrogen and purchased fuels/energy
**EIA data provides estimated 2005 throughput of process units and Energetics 2007 study provides process-unit specific energy requirements

9
Allocation of “Refining” Emissions to Co-Products
Refinery Fuels
Combustion Emissions
Fuel Acquisition
Emissions
Ga
so
lin
e
Die
se
l
Je
t F
ue
l
Fu
el
Oil
Co
ke
"L
igh
t E
nd
s"
"H
ea
vy
En
ds
"
Fraction of Refinery
Energy Attributable to
Each Product
Ga
so
lin
e
Die
se
l
Je
t F
ue
l
Fu
el
Oil
Co
ke
"L
igh
t
En
ds
"
"H
ea
vy
En
ds
"
A
B
C
D
E
F
G
% of Volumetric Throughput
Process
Units
Energy
Usage
Hydrogen
Consumption
Ga
so
lin
e
Die
se
l
Je
t F
ue
l
Fu
el
Oil
Co
ke
"L
igh
t E
nd
s"
"H
ea
vy
En
ds
"
Fraction of H2
Consumption Attributable
to Each Product
RefineryOff-Site
H2 Plant
Steam
Electricity
Natural Gas
Coal
Refinery-
Produced Fuels
Natural Gas and
Electricity for H2
ProductionOn-Site
H2 Plant
Natural Gas Feed
Natural Gas Feed & Fuel
Electricity
Ga
so
lin
e
Die
se
l
Je
t F
uel
Fu
el
Oil
Co
ke
"L
igh
t E
nd
s"
"H
ea
vy
En
ds"
Emissions Attributable to
Each Product
Flaring Emissions and
Vented/Fugitive Methane
Feed/Fuel Acquisition
Emissions
CO2 Process Emissions
from H2 Production
HYDROGEN
EMISSIONS
POOL
REFINERY
EMISSIONS
POOL
Fuel Combustion and
CO2 Process Emissions

10
Baseline Life Cycle Greenhouse Gas Emissions for
Petroleum Transportation Fuels Sold or
Distributed in the U.S. in Year 2005
11
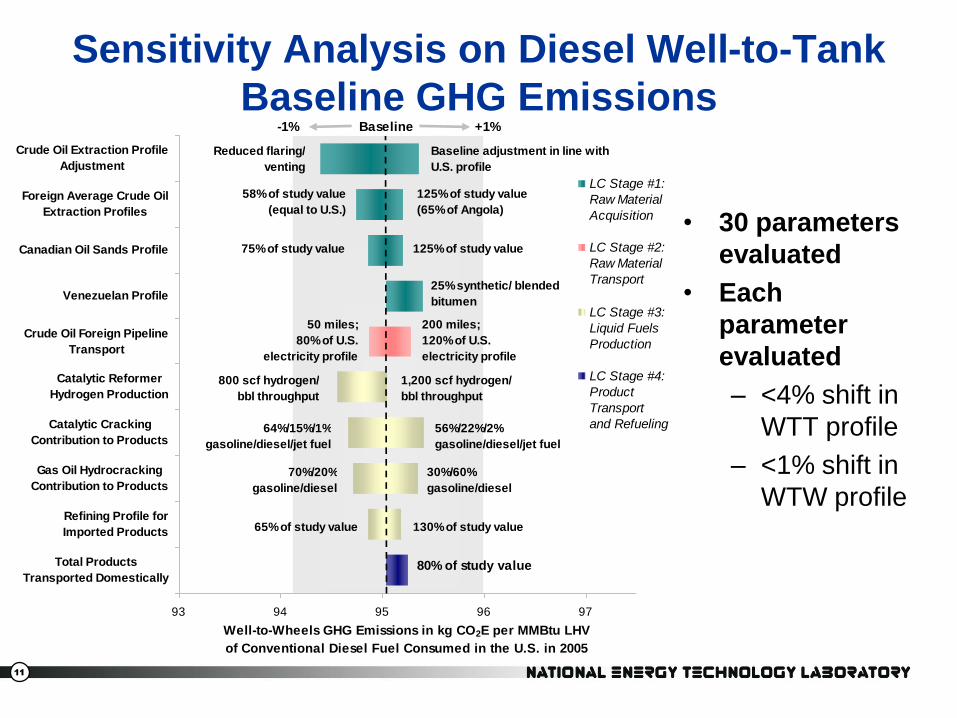
Sensitivity Analysis on Diesel Well-to-Tank
Baseline GHG Emissions
• 30 parameters
evaluated
• Each
parameter
evaluated
– <4% shift in
WTT profile
– <1% shift in
WTW profile
93 94 95 96 97
Total Products
Transported Domestically
Refining Profile for
Imported Products
Gas Oil Hydrocracking
Contribution to Products
Catalytic Cracking
Contribution to Products
Catalytic Reformer
Hydrogen Production
Crude Oil Foreign Pipeline
Transport
Venezuelan Profile
Canadian Oil Sands Profile
Foreign Average Crude Oil
Extraction Profiles
Crude Oil Extraction Profile
Adjustment
Well-to-Wheels GHG Emissions in kg CO2E per MMBtu LHV
of Conventional Diesel Fuel Consumed in the U.S. in 2005
LC Stage #1:
Raw Material
Acquisition
LC Stage #2:
Raw Material
Transport
LC Stage #3:
Liquid Fuels
Production
LC Stage #4:
Product
Transport
and Refueling
800 scf hydrogen/
bbl throughput
1,200 scf hydrogen/
bbl throughput
64%/15%/1%
gasoline/diesel/jet fuel
56%/22%/2%
gasoline/diesel/jet fuel
70%/20%
gasoline/diesel
30%/60%
gasoline/diesel
130% of study value65% of study value
58% of study value
(equal to U.S.)
125% of study value
(65% of Angola)
Baseline adjustment in line with
U.S. profile
Reduced flaring/
venting
25% synthetic/ blended
bitumen
75% of study value 125% of study value
200 miles;
120% of U.S.
electricity profile
50 miles;
80% of U.S.
electricity profile
80% of study value
Baseline-1% +1%

12
Goal and Drivers of Crude Oil Source-
Specific GHG Emissions Analysis
Understand variability of
GHG emissions by
crude oil sourceConsistent with 2005
petroleum baseline
GHG emissions analysis
To enhance comparison
of alternative
transportation fuel
options

13
GHG Emissions for Production of Diesel Fuel
Variability by Imported Feedstock Source
WTT GHG emissions
~20% of the baseline
WTW profile; remaining
80% due to combustion
of the fuel
WTT GHG emissions for diesel production from imported crude oil
sources vary from -35% to +80% of 2005 baseline
Canada (Oil Sands)
Venezuela (UpgradedBitumen)
Nigeria
Mexico
Angola
Kuwait
Iraq
Venezuela(Conventional)
Canada(Conventional)
Ecuador
Saudi Arabia
Other CrudeOil Imports
Algeria
0%
2%
4%
6%
8%
10%
12%
0 5 10 15 20 25 30 35 40
2005 C
rud
e O
il In
pu
t to
U.S
. R
efi
neri
es
WTT GHG Emissions (kg CO2E per MMBtu LHV diesel)
Domestic(34% of 2005
Crude Oil Input)
WTT Petroleum Diesel Baseline (U.S. 2005 Average from Imported
and Domestic Crude Oil)
14
Drivers of Variability in Source-Specific
GHG Emissions by Feedstock Source
• Flaring and venting of associated natural gas during
extraction
• Alternative extraction techniques and pre-processing
requirements required for oil sands and bitumen
• Ocean transport distances
• Varying processing requirements within the refinery for crude
oils of different quality
14

15
Challenges in Evaluating GHG Emissions
for Venezuelan Bitumen Acquisition
• Raw material extraction and transport GHG emissions profiles
available from baseline analysis by import source
• Evaluating Venezuela bitumen acquisition profile
– Canada oil sands v Venezuela bitumen
– 90% confidence interval developed due to limited availability of
data
0 5 10 15 20 25
Canada Oil Sands
Venezuela Upgraded
Bitumen
Extraction and Pre-Processing GHG Emissions
(kg CO2E/MMBtu LHV diesel)

16
2.7
2.7
2.7
2.4
1.9
1.7
1.7
1.5
1.1
1.1
1.0
0.9
0.7
1.4
0.0 0.5 1.0 1.5 2.0 2.5 3.0
Kuwait
Iraq
Saudi Arabia
Other Crude Oil Imports
Angola
Nigeria
Ecuador
Algeria
Weighted Average
Venezuela
NGL and Unfinished Oils
Mexico
Canada
Domestic Crude Oil
Crude Oil Transport GHG Emissions
(kg CO2E/MMBtu LHV diesel)
Raw Material Transport Impacts Variability
to a Lesser Degree
Persian Gulf crude oil
transport GHG emissions double

17
Refinery Processing Requirements
Impacted by Crude Oil Quality
• Crude oil quality impacts refining requirements
– NOT a process model to evaluate refining 100% of a given crude oil
– Heuristics developed to determine impact of API gravity and sulfur content
– Baseline analysis provides emissions associated with refining operations impacted by crude quality
0% 50% 100% 150% 200%
Mexico
U.S. Average
Algeria Base*
% of U.S. Average GHG Emissions for Diesel Refining Operations
0% 50% 100% 150% 200%
Mexico
U.S. Average
Algeria
23.8 API
30.2 API
44.8API
Base* ProcessingHeavyFractions
% of U.S. Average GHG Emissions for Diesel Refining Operations
0% 50% 100% 150% 200%
Mexico
U.S. Average
Algeria
23.8 API
30.2 API
44.8API
3.0 wt%
1.4 wt%
0.1 wt% Base* ProcessingHeavyFractions
SulfurRemoval
% of U.S. Average GHG Emissions for Diesel Refining Operations
+64%
-58%
*Base GHG emissions are those not due to processing heavy fractions or sulfur removal and thus are not significantly impacted by API gravity or sulfur content

18
Source-Specific Diesel Fuel Life Cycle GHG
Emissions by Life Cycle Stage
0 5 10 15 20 25 30 35 40
Canada Oil Sands
Venezuela Upgraded Bitumen
Nigeria
Mexico
Angola
Kuw ait
Iraq
Baseline
Venezuela Conventional
Canada Conventional
Ecuador
Saudi Arabia
Other Crude Oil Imports
NGL & Unfinished Oils
Domestic Crude Oil
Algeria
Well-to-Tank GHG Emissions (kg CO2E per MMBtu LHV diesel dispensed)
LC Stage #1:
Raw Material
Acquisition
LC Stage #2:
Raw Material
Transport
LC Stage #3:
Liquid Fuels
Production
LC Stage #4:
Product
Transport
and Refueling

19
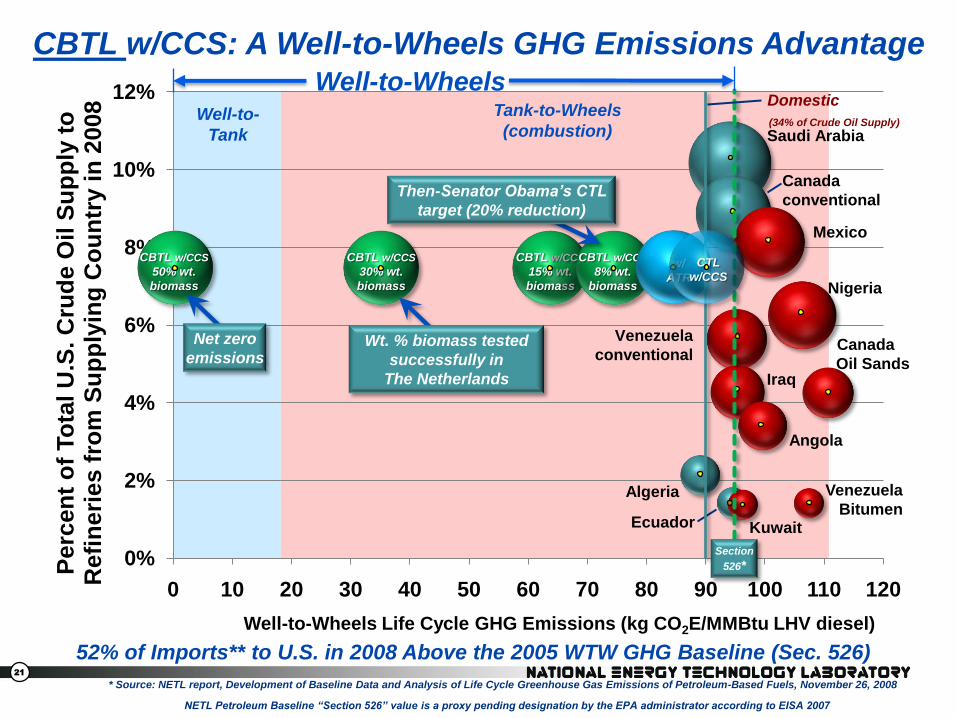
Tank-to-Wheels
(combustion)Well-to-
Tank
0%
2%
4%
6%
8%
10%
12%
0 10 20 30 40 50 60 70 80 90 100 110 120
Pe
rcen
t o
f To
tal U
.S. C
rud
e O
il S
up
ply
to
R
efi
neri
es f
rom
Su
pp
lyin
g C
ou
ntr
y i
n 2
008
Well-to-Wheels Life Cycle GHG Emissions (kg CO2E/MMBtu LHV diesel)
Venezuela
conventional
Venezuela
Bitumen
Canada
Oil Sands
Angola
Nigeria
Mexico
Saudi Arabia
Iraq
Algeria
KuwaitEcuador
Canada
conventional
Domestic (34% of Crude Oil Supply)
52% of Imports** to U.S. in 2008 Above the 2005 WTW GHG Baseline (Sec. 526)
CTL w/CCS: A Well-to-Wheels GHG Emissions AdvantageWell-to-Wheels
Criteria for EISA 2007
Section 526*
U.S. WTW average in 2005 95.0 kg CO2E/MMBtu diesel
Section
526*
* Source: NETL report, Development of Baseline Data and Analysis of Life Cycle Greenhouse Gas Emissions of Petroleum-Based Fuels, November 26, 2008
NETL Petroleum Baseline “Section 526” value is a proxy pending designation by the EPA administrator according to EISA 2007
** Includes 1.3 MMbpd of other crudes from smaller foreign suppliers at 94.0 kg CO2E/MMBtu
w/
ATR1.5MMbpd
CTL
w/CCS

20
0%
2%
4%
6%
8%
10%
12%
70 80 90 100 110 120
Pe
rcen
t o
f To
tal U
.S. C
rud
e O
il S
up
ply
to
R
efi
neri
es f
rom
Su
pp
lyin
g C
ou
ntr
y i
n 2
008
Well-to-Wheels Life Cycle GHG Emissions (kg CO2E/MMBtu LHV diesel)
Venezuela
conventional
Venezuela
Bitumen
Canada
Oil Sands
Angola
Nigeria
Mexico
Saudi Arabia
Iraq
Algeria
KuwaitEcuador
Canadaconventional
$51
$43
$37
$35
$19
$8
$26
$22
$18
$12
$7$7
$172 billion of 2008 imports would not meet Section 526 Life-cycle requirement
CTL w/CCS
& ATR
Dollar value reflects
2008 imports (billions)
Section
526*
1.5MMbpd
CTL w/CCS
5% to 12%
below
* Source: NETL report, Development of Baseline Data and Analysis of Life Cycle Greenhouse Gas Emissions of Petroleum-Based Fuels, November 26, 2008
NETL Petroleum Baseline “Section 526” value is a proxy pending designation by the EPA Administrator according to EISA 2007
Domestic (34% of Crude
Oil Supply)
A Well-to-Wheels GHG Emissions AdvantageDetails of CTL Potential Compared to Imports
21
Well-to-
Tank
Tank-to-Wheels
(combustion)
0%
2%
4%
6%
8%
10%
12%
0 10 20 30 40 50 60 70 80 90 100 110 120
Pe
rcen
t o
f To
tal U
.S. C
rud
e O
il S
up
ply
to
R
efi
neri
es f
rom
Su
pp
lyin
g C
ou
ntr
y i
n 2
008
Well-to-Wheels Life Cycle GHG Emissions (kg CO2E/MMBtu LHV diesel)
Venezuela
conventional
Venezuela
Bitumen
Canada
Oil Sands
Angola
Nigeria
Mexico
Saudi Arabia
Iraq
Algeria
KuwaitEcuador
Canada
conventional
52% of Imports** to U.S. in 2008 Above the 2005 WTW GHG Baseline (Sec. 526)
CBTL w/CCS
15% wt.
biomass
CBTL w/CCS
8% wt.
biomass
CBTL w/CCS: A Well-to-Wheels GHG Emissions Advantage
w/
ATR
Well-to-Wheels
CBTL w/CCS
30% wt.
biomass
CBTL w/CCS
50% wt.
biomass
Then-Senator Obama’s CTL
target (20% reduction)
Net zero
emissionsWt. % biomass tested
successfully in
The Netherlands
Section
526*
* Source: NETL report, Development of Baseline Data and Analysis of Life Cycle Greenhouse Gas Emissions of Petroleum-Based Fuels, November 26, 2008
NETL Petroleum Baseline “Section 526” value is a proxy pending designation by the EPA administrator according to EISA 2007
** Includes 1.3 MMbpd of other crudes from smaller foreign suppliers at 94.0 kg CO2E/MMBtu
Domestic
(34% of Crude Oil Supply)
CTL
w/CCS

22
Comparison Considerations
• Representative GHG emissions profile – 2005
U.S. Average
– Efficiency improvements
– Operational changes
– Crude oil quality shifts
• Drivers of marginal crude oil source
– Economics
– Energy security
– GHG emissions

23
Expanding Domestic Benefits with PHEV
and CO2-EOR
Crude Oil
Refining
Gasoline
PHEVs
Coal-Based Power
Generation
with CCS
CO2 Enhanced
Oil Recovery
Crude Oil
Input/Output
Other
Petroleum
Products
Stored CO2
Emitted CO2E
Vehicle
Miles
Traveled
Crude OilCO2/CO2EPetroleum ProductsElectricity
Coal
Mining
Coal
Coal/
Biomass
to Liquids
Diesel
PHEVsCoal-Based
Power
Generation
with CCS
CO2 Enhanced
Oil Recovery
Other CBTL
Products
Stored CO2
Emitted CO2E
Vehicle
Miles
Traveled
Crude OilCO2/CO2ECBTL ProductsElectricityCoal
Crude Oil
Output
Biomass
Acquisition
Biomass
Coal
Mining
PHEV fueled by petroleum-based
GASOLINE and IGCC power where
captured CO2 is used for CO2-EOR
PHEV fueled by CTL DIESEL
and IGCC power where captured CO2
is used for CO2-EOR

24
Snapshot of Tool – Petroleum Gasoline
MMmt CO2E emitted
MMmt CO2E 0.01 MMmt CO2E 0.04 MMmt CO2E Coal
5.198 Crude Oil
Petro products
5.2 MMbbl MM bbl crude oil CO2 / CO2E
crude oil Electricity
MMbbl ~0.3 refineries
crude oil (200,000 bpd each)
MMgal gasoline
144
0.1 BkWh (del'd)
275 BkWh (del'd)
2 million vehicles
12 thousand miles/vehicle/yr Billion VMT/yr
MMshort tons coal 37.1 mpg (internal combustion engine)
~1.1 power plants 0.32 AC kWh/mile (battery)
(500 MW each @80% CF) 41% miles from grid electricity
38% Base plant efficiency (no capture)
33% Overall efficiency (with capture)
Emissions 90% CO2 capture
Credit for
System Outputs 0.5 BkWh (del'd)
MMmt CO2 kg CO2E per VMT
Crude Oil
0.00 MMmt CO2E
~7.6 CO 2 EOR floods 0.26 mt CO2 stored/bbl crude oil produced
(5,000 bpd each) 40 kWh/bbl crude oil produced
Refining Products
0.61 MMmt CO2E
MM bbl crude oil
MMmt CO2 stored
Vehicle efficiency mpg
Point of combustion kg CO2E/mile
E&P, refining, transport kg CO2E/mile
Total kg CO2E/mile
0.0
0.08
2.2
Material flows in a gasoline PHEV system where captured CO2 from power is used for CO2 EOR
4.54
Calculated Values
User Inputs
24.1
384
3.40.21 0.17 0.40 0.81
Current Best Practice
0.370
0.466
Apply
19.0
First Generation
0.189
0.096
3.62 All Gasoline Vehicle
13.8
Apply
24
3.10
3.6
Gasoline PHEVs
CO2 Enhanced Oil
Recovery
Crude Oil
Refining
Coal-Based Power
Generation with CCSCoal Mining/
Transport
Gasoline
TransportMMgal
diesel
(<500 ppm S)
MMgal
other
petro
products
Crude Oil
Transport
MMmt CO2E MMmt CO2EMMmt CO2EMMmt CO2EMMmt CO2E

25
Advancement of Multiple Technologies
Drives Down GHG Emissions
-2
0
2
4
0.0 0.1 0.2 0.3 0.4 0.5
Ne
t C
rud
e O
il O
utp
ut
(ba
rre
ls p
er
tho
us
an
d m
ile
s)
GHG Emissions (kg CO2E per mile)
Petroleum Gasoline
CTL Diesel
Advanced PHEV2nd Gen CO2-EOR
1st Gen PHEVNext Gen
CO2-EOR
Non-PHEVCurrent Best
Practices CO2-EOR15% bioCCS &
ATR
CCS & ATR
CCS simple
PetroleumDiesel Conv
Vehicle
Petroleum Gasoline
Conv
Vehicle
Bubble Size =>
Quantity of CO2 Stored

26
Conclusions
• Defined baseline greenhouse gas (GHG) emissions
for petroleum-based fuels
• Showed the GHG emission and economic advantage
of domestic crude oil and CTL with CCS for
production of diesel versus crude oil imports
• Portrayed impact of a
PHEV-CO2-EOR system

27
Status
• Presentation: http://www.netl.doe.gov/energy-
analyses/pubs/Petroleum%20Fuels%20GHG%20Modeling_Feb%2025a.pdf
• Summary Document: http://www.netl.doe.gov/energy-
analyses/pubs/Life%20Cycle%20GHG%20Analysis%20of%20Diesel%20Fuel%20by%20Crude%20Oil%20Source%202.pdf
• Petroleum Baseline GHG Emissions Report
– Published to NETL website Nov 2008http://www.netl.doe.gov/energy-analyses/pubs/NETL%20LCA%20Petroleum-Based%20Fuels%20Nov%202008.pdf
– Submitted to EPA for consideration for EISA 2007
• Crude Oil Source-Specific Report
– Published to NETL website Mar 2009http://www.netl.doe.gov/energy-analyses/pubs/PetrRefGHGEmiss_ImportSourceSpecific1.pdf
• PHEV-CO2EOR-CBTL GHG Emissions Tool
– Posted on NETL website Jan 2009http://www.netl.doe.gov/energy-analyses/pubs/PHEV-CO2EOR-CCS_12-16_CBTL.xls