netscaler insight center 10 - citrix.com netscaler insight center release notes 10.5 is covered as a...
TRANSCRIPT
© 1999-2017 Citrix Systems, Inc. All rights reserved. p.1https://docs.citrix.com
Release Notes
FAQs
Understanding NetScaler Insight Center
How NetScaler insight Center is Deployed in a Network
Before You Begin
Installing NetScaler Insight Center
Installing NetScaler Insight Center on XenServer
Installing NetScaler Insight Center on VMware ESX
Installing NetScaler Insight Center on Microsoft Hyper-V
Accessing NetScaler Insight Center
Adding Devices
Enabling Data Collection
Enabling Web Insight Data Collection
Enabling HDX Insight Data Collection
Enabling WAN Insight Data Collection
Viewing the Reports
Web Insight Reports
HDX Insight Reports
WAN Insight Reports
Exporting reports
Upgrading NetScaler Insight Center
Use Cases: Web Insight
Use Cases: HDX Insight
Managing NetScaler Insight Center
NetScaler Insight Center 10.5
Jun 10 , 2015
© 1999-2017 Citrix Systems, Inc. All rights reserved. p.2https://docs.citrix.com
Managing System Settings
Configuring Authentication and Authorization Settings
Configuring the External Authentication Server
Working with SSL Files
Configuring Clock Synchronization
Change Adaptive Threshold Setting
Diagnostics
Troubleshooting Tips
NITRO API
Obtaining the NITRO Package
How NITRO Works
Java SDK
.NET SDK
Python SDK
REST Web Service
© 1999-2017 Citrix Systems, Inc. All rights reserved. p.3https://docs.citrix.com
Release Notes
May 14 , 2015
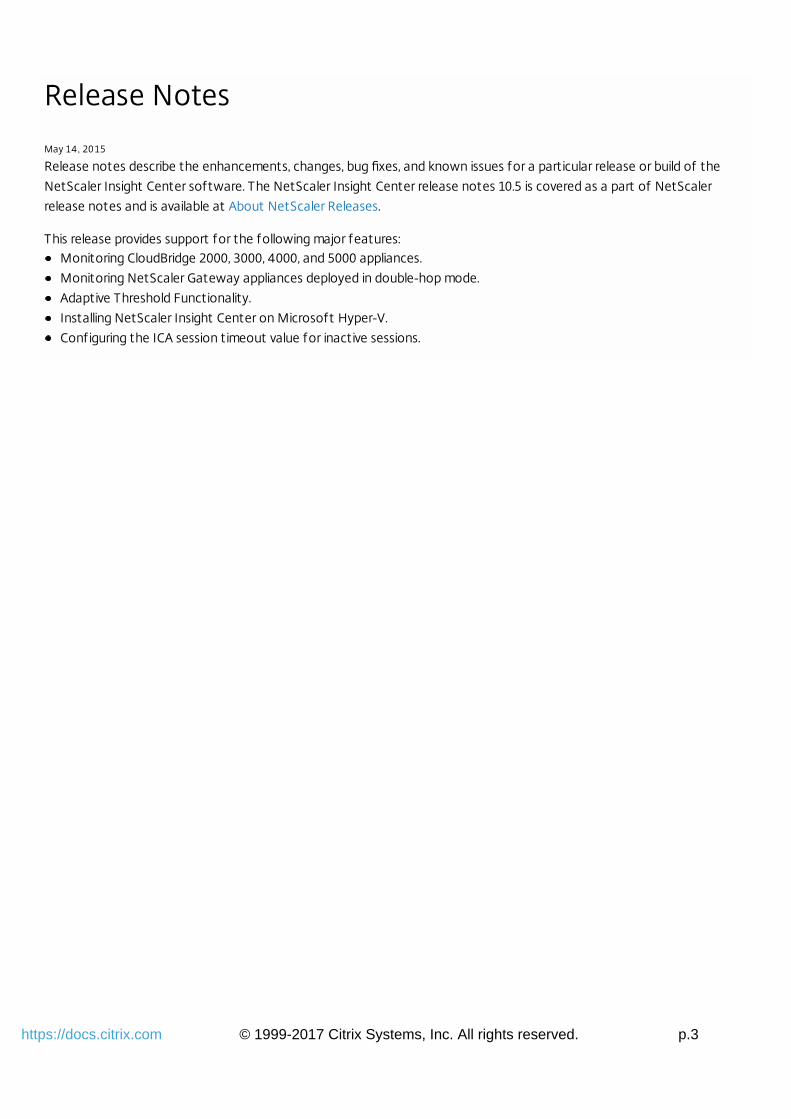
Release notes describe the enhancements, changes, bug fixes, and known issues for a particular release or build of the
NetScaler Insight Center software. The NetScaler Insight Center release notes 10.5 is covered as a part of NetScaler
release notes and is available at About NetScaler Releases.
This release provides support for the following major features:Monitoring CloudBridge 2000, 3000, 4000, and 5000 appliances.
Monitoring NetScaler Gateway appliances deployed in double-hop mode.
Adaptive Threshold Functionality.
Installing NetScaler Insight Center on Microsoft Hyper-V.
Configuring the ICA session timeout value for inactive sessions.
© 1999-2017 Citrix Systems, Inc. All rights reserved. p.4https://docs.citrix.com
FAQs
Nov 24 , 2016
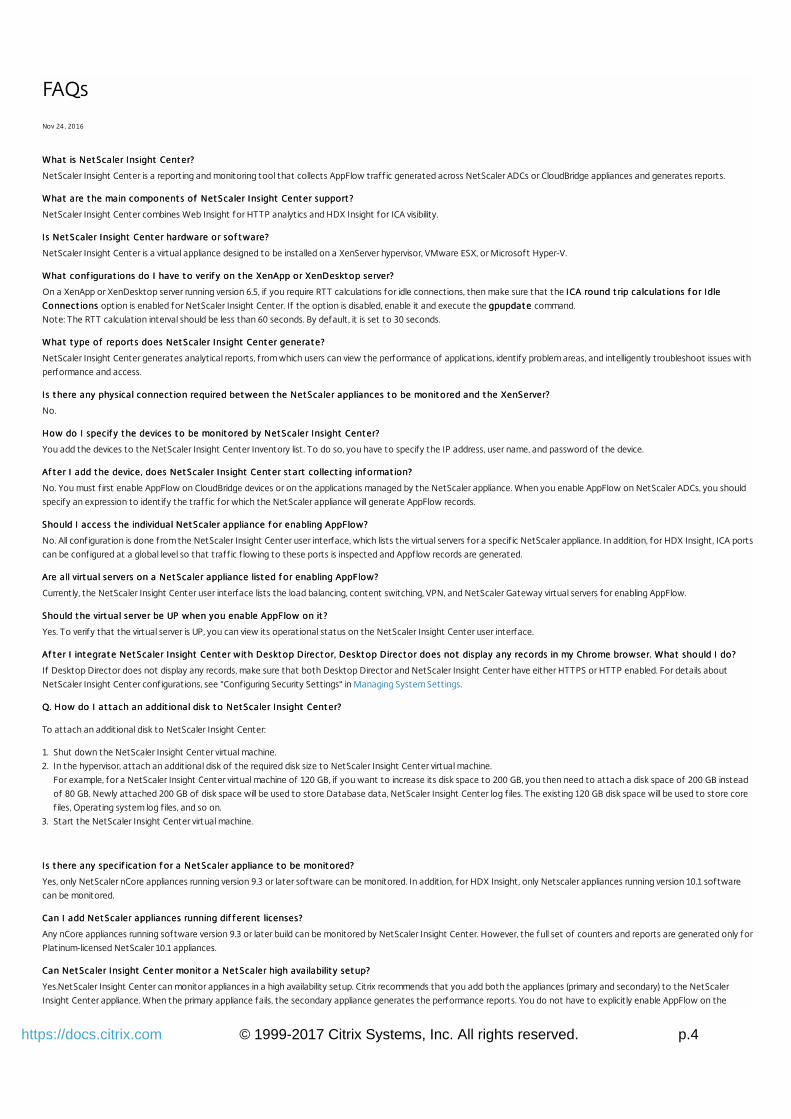
What is What is Net Scaler Insight Cent erNet Scaler Insight Cent er??
NetScaler Insight Center is a reporting and monitoring tool that collects AppFlow traff ic generated across NetScaler ADCs or CloudBridge appliances and generates reports.
What are t he main component s of What are t he main component s of Net Scaler Insight Cent erNet Scaler Insight Cent er support ? support ?
NetScaler Insight Center combines Web Insight for HTTP analytics and HDX Insight for ICA visibility.
Is Is Net Scaler Insight Cent erNet Scaler Insight Cent er hardware or sof t ware? hardware or sof t ware?
NetScaler Insight Center is a virtual appliance designed to be installed on a XenServer hypervisor, VMware ESX, or Microsoft Hyper-V.
What conf igurat ions do I have t o verif y on t he XenApp or XenDeskt op server?What conf igurat ions do I have t o verif y on t he XenApp or XenDeskt op server?
On a XenApp or XenDesktop server running version 6.5, if you require RTT calculations for idle connections, then make sure that the ICA round t rip calculat ions f or IdleICA round t rip calculat ions f or Idle
Connect ionsConnect ions option is enabled for NetScaler Insight Center. If the option is disabled, enable it and execute the gpupdat egpupdat e command.
Note: The RTT calculation interval should be less than 60 seconds. By default, it is set to 30 seconds.
What t ype of report s does What t ype of report s does Net Scaler Insight Cent erNet Scaler Insight Cent er generat e? generat e?
NetScaler Insight Center generates analytical reports, from which users can view the performance of applications, identify problem areas, and intelligently troubleshoot issues with
performance and access.
Is t here any physical connect ion required bet ween t he Net Scaler appliances t o be monit ored and t he XenServer?Is t here any physical connect ion required bet ween t he Net Scaler appliances t o be monit ored and t he XenServer?
No.
How do I specif y t he How do I specif y t he devicesdevices t o be monit ored by t o be monit ored by Net Scaler Insight Cent erNet Scaler Insight Cent er??
You add the devices to the NetScaler Insight Center Inventory list. To do so, you have to specify the IP address, user name, and password of the device.
Af t er I add t he Af t er I add t he devicedevice , does , does Net Scaler Insight Cent erNet Scaler Insight Cent er st art collect ing inf ormat ion? st art collect ing inf ormat ion?
No. You must f irst enable AppFlow on CloudBridge devices or on the applications managed by the NetScaler appliance. When you enable AppFlow on NetScaler ADCs, you should
specify an expression to identify the traff ic for which the NetScaler appliance will generate AppFlow records.
Should I access t he individual Net Scaler appliance f or enabling AppFlow?Should I access t he individual Net Scaler appliance f or enabling AppFlow?
No. All configuration is done from the NetScaler Insight Center user interface, which lists the virtual servers for a specif ic NetScaler appliance. In addition, for HDX Insight, ICA ports
can be configured at a global level so that traff ic f lowing to these ports is inspected and Appflow records are generated.
Are all virt ual servers on a Net Scaler appliance list ed f or enabling AppFlow?Are all virt ual servers on a Net Scaler appliance list ed f or enabling AppFlow?
Currently, the NetScaler Insight Center user interface lists the load balancing, content switching, VPN, and NetScaler Gateway virtual servers for enabling AppFlow.
Should t he virt ual server be UP when you enable AppFlow on it ?Should t he virt ual server be UP when you enable AppFlow on it ?
Yes. To verify that the virtual server is UP, you can view its operational status on the NetScaler Insight Center user interface.
Af t er I int egrat e Net Scaler Insight Cent er wit h Deskt op Direct or, Deskt op Direct or does not display any records in my Chrome browser. What should I do?Af t er I int egrat e Net Scaler Insight Cent er wit h Deskt op Direct or, Deskt op Direct or does not display any records in my Chrome browser. What should I do?
If Desktop Director does not display any records, make sure that both Desktop Director and NetScaler Insight Center have either HTTPS or HTTP enabled. For details about
NetScaler Insight Center configurations, see "Configuring Security Settings" in Managing System Settings.
Q. How do I at t ach an addit ional disk t o Net Scaler Insight Cent er?Q. How do I at t ach an addit ional disk t o Net Scaler Insight Cent er?
To attach an additional disk to NetScaler Insight Center:
1. Shut down the NetScaler Insight Center virtual machine.
2. In the hypervisor, attach an additional disk of the required disk size to NetScaler Insight Center virtual machine.
For example, for a NetScaler Insight Center virtual machine of 120 GB, if you want to increase its disk space to 200 GB, you then need to attach a disk space of 200 GB instead
of 80 GB. Newly attached 200 GB of disk space will be used to store Database data, NetScaler Insight Center log f iles. The existing 120 GB disk space will be used to store core
files, Operating system log f iles, and so on.
3. Start the NetScaler Insight Center virtual machine.
Is t here any Is t here any specif icat ion f or a Net Scaler appliance t o be monit ored?specif icat ion f or a Net Scaler appliance t o be monit ored?
Yes, only NetScaler nCore appliances running version 9.3 or later software can be monitored. In addition, for HDX Insight, only Netscaler appliances running version 10.1 software
can be monitored.
Can I add Can I add Net Scaler appliances running dif f erent licenses?Net Scaler appliances running dif f erent licenses?
Any nCore appliances running software version 9.3 or later build can be monitored by NetScaler Insight Center. However, the full set of counters and reports are generated only for
Platinum-licensed NetScaler 10.1 appliances.
Can Can Net Scaler Insight Net Scaler Insight Cent erCent er monit or a Net Scaler high availabilit y set up? monit or a Net Scaler high availabilit y set up?
Yes.NetScaler Insight Center can monitor appliances in a high availability setup. Citrix recommends that you add both the appliances (primary and secondary) to the NetScaler
Insight Center appliance. When the primary appliance fails, the secondary appliance generates the performance reports. You do not have to explicitly enable AppFlow on the
© 1999-2017 Citrix Systems, Inc. All rights reserved. p.5https://docs.citrix.com
secondary appliance.
Can a Net Scaler clust er be monit ored by Can a Net Scaler clust er be monit ored by Net Scaler Insight Net Scaler Insight Cent erCent er??
No. NetScaler Insight Center does not support cluster nodes.
Which version of Net Scaler Insight Cent er can I use t o monit or CloudBridge appliances?Which version of Net Scaler Insight Cent er can I use t o monit or CloudBridge appliances?
CloudBridge monitoring is supported on NetScaler Insight Center release 10.5 build 51.10 and later.
Which CloudBridge appliances can I monit or using Net Scaler Insight Cent er?Which CloudBridge appliances can I monit or using Net Scaler Insight Cent er?
Only CloudBridge datacenter appliances (CloudBridge 2000, 2000WS, 3000, 4000, and 5000) can be monitored by NetScaler Insight Center.
Which version of CloudBridge sof t ware is support ed by Net Scaler Insight Cent er?Which version of CloudBridge sof t ware is support ed by Net Scaler Insight Cent er?
The CloudBridge version supported is 7.3.0 build 194 and later.
Does Net Scaler Insight Cent er monit or bot h CloudBridge dat acent er appliances and branch of f ice appliances?Does Net Scaler Insight Cent er monit or bot h CloudBridge dat acent er appliances and branch of f ice appliances?
NetScaler insight Center only monitors the CloudBridge datacenter appliances.
However, CloudBridge datacenter appliances aggregate information from the CloudBridge branch-office appliances.
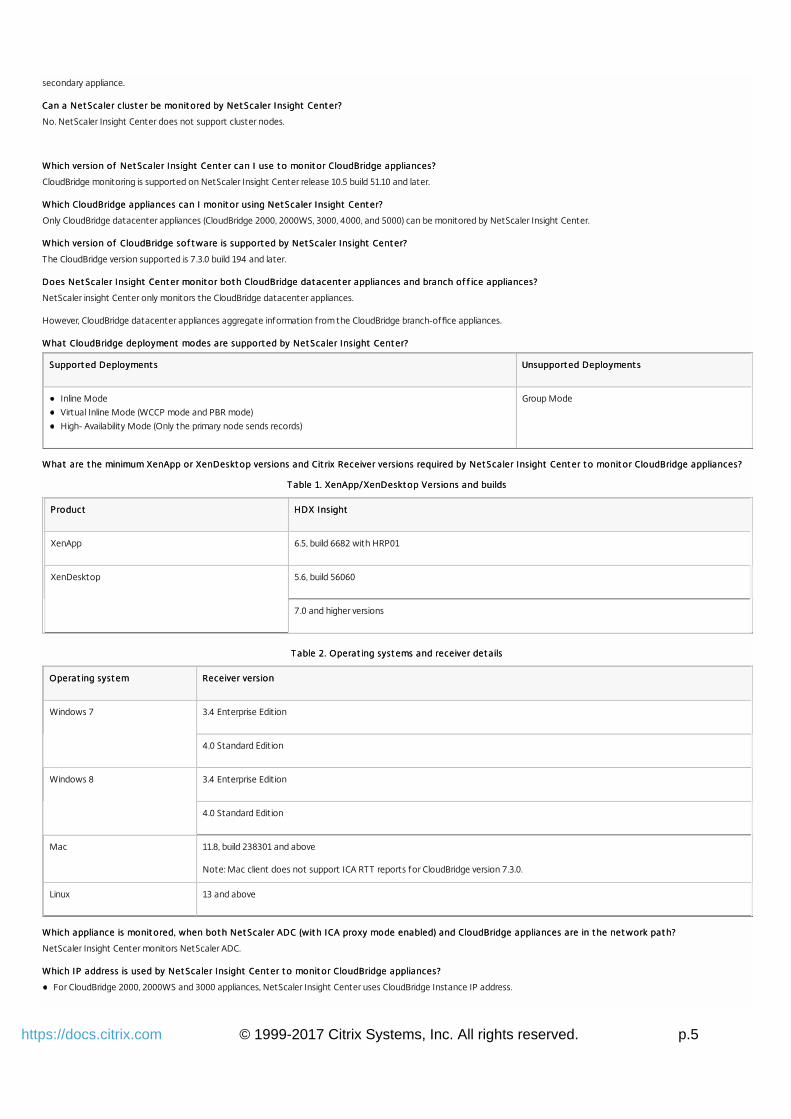
What CloudBridge deployment modes are support ed by Net Scaler Insight Cent er?What CloudBridge deployment modes are support ed by Net Scaler Insight Cent er?
Support ed Deployment sSupport ed Deployment s Unsupport ed Deployment sUnsupport ed Deployment s
Inline Mode
Virtual Inline Mode (WCCP mode and PBR mode)
High- Availability Mode (Only the primary node sends records)
Group Mode
What are t he minimum XenApp or XenDeskt op versions and Cit rix Receiver versions required by Net Scaler Insight Cent er t o monit or CloudBridge appliances?What are t he minimum XenApp or XenDeskt op versions and Cit rix Receiver versions required by Net Scaler Insight Cent er t o monit or CloudBridge appliances?
T able 1. XenApp/XenDeskt op Versions and buildsT able 1. XenApp/XenDeskt op Versions and builds
ProductProduct HDX InsightHDX Insight
XenApp 6.5, build 6682 with HRP01
XenDesktop 5.6, build 56060
7.0 and higher versions
T able 2. Operat ing syst ems and receiver det ailsT able 2. Operat ing syst ems and receiver det ails
Operat ing syst emOperat ing syst em Receiver versionReceiver version
Windows 7 3.4 Enterprise Edition
4.0 Standard Edition
Windows 8 3.4 Enterprise Edition
4.0 Standard Edition
Mac 11.8, build 238301 and above
Note: Mac client does not support ICA RTT reports for CloudBridge version 7.3.0.
Linux 13 and above
Which appliance is monit ored, when bot h Net Scaler ADC (wit h ICA proxy mode enabled) and CloudBridge appliances are in t he net work pat h?Which appliance is monit ored, when bot h Net Scaler ADC (wit h ICA proxy mode enabled) and CloudBridge appliances are in t he net work pat h?
NetScaler Insight Center monitors NetScaler ADC.
Which IP address is used by Net Scaler Insight Cent er t o monit or CloudBridge appliances?Which IP address is used by Net Scaler Insight Cent er t o monit or CloudBridge appliances?
For CloudBridge 2000, 2000WS and 3000 appliances, NetScaler Insight Center uses CloudBridge Instance IP address.
© 1999-2017 Citrix Systems, Inc. All rights reserved. p.6https://docs.citrix.com
For CloudBridge 4000 and 5000 appliances, NetScaler Insight Center uses CloudBridge Accelerator IP address.
What are t he def ault credent ials t o access CloudBridge appliances?What are t he def ault credent ials t o access CloudBridge appliances?
The default credentials are:
Username: admin
Password: admin_passwd
Can Management Service IP address (running on CloudBridge 4 000 and 5000 appliances) be used t o discover CloudBridge appliances?Can Management Service IP address (running on CloudBridge 4 000 and 5000 appliances) be used t o discover CloudBridge appliances?
No.
Can I use a CloudBridge VPX t o demonst rat e how Net Scaler Insight Cent er collect s report s f rom CloudBridge appliances?Can I use a CloudBridge VPX t o demonst rat e how Net Scaler Insight Cent er collect s report s f rom CloudBridge appliances?
NetScaler Insight Center does not support CloudBridge VPX.
However, if you want to use CloudBridge VPX for demonstration purpose, make sure that the CloudBridge VPX has primary and accelerated pairs (apA) configured.
For details, see "Configuring Inline Mode" in CloudBrisge 7.3 Product Documentation.
What are t he prerequisit es t o monit or CloudBridge appliances?What are t he prerequisit es t o monit or CloudBridge appliances?
Before you start using NetScaler Insight Center to monitor a CloudBridge appliance, make sure that you have met the following prerequisites:
The NTP server must be configured on both the CloudBridge appliance and NetScaler Insight Center. To add an NTP server to NetScaler Insight Center, see Configuring Clock
Synchronization. These NTP servers must be closely synchronized to each other.
Make sure that the CloudBridge appliances can communicate with NetScaler Insight Center by using port 4739.
When both NetScaler ADC and CloudBridge appliance is located in the same network path, you cannot configure a single NetScaler Insight Center to monitor both the
appliances. NetScaler ADC and CloudBridge appliance should use different NetScaler Insight Center virtual appliances for generating HDX Insight reports.
Make sure that the CloudBridge appliance should only use the primary interface for sending Appflow records.
Do not configure the CloudBridge appliance at the branch off ice to send Appflow records to NetScaler Insight Center.
Verify that the CloudBridge appliance, XenApp or XenDesktop, and Receiver versions are supported by NetScaler Insight Center.
To monitor the CloudBridge appliance, NetScaler Insight Center must successfully discover the CloudBridge appliance.
Enable HDX data set on the CloudBridge appliance. To verify, on the Configuration tab, navigate to Appliance Settings > AppFlow.
Make sure that the Update Interval is set to one minute on the CloudBridge appliance. Also, make sure that the IP address and port values are not deleted. To verify, on the
Configuration tab, navigate to Appliance Settings > AppFlow.
Make sure that CloudBridge ICA connections are accelerated with Disk Based Compression (DBC) policy. To verify, on the Configuration tab, navigate to Optimization Rules >
Service Classes and in the right pane, expand ICA and click Edit. The Acceleration policy must be Disk.
Does t he CloudBridge appliance generat e AppFlow report s f or non-accelerat ed ICA connect ions?Does t he CloudBridge appliance generat e AppFlow report s f or non-accelerat ed ICA connect ions?
No. NetScaler Insight Center reports are generated only when CloudBridge ICA connections are accelerated with Disk Based Compression (DBC) policy.
To verify, on the Configuration tab, navigate to Optimization Rules > Service Classes and in the right pane, expand ICA and click Edit. The Acceleration policy must be Disk ICA
connections. The ICA Service class policies that are not accelerated and configured with Flow Control policy, do not generate HDX Insight reports.
NetScaler insight Center does not generate reports if CloudBridge ICA connections are accelerated with flow control policy.
Does Net Scaler Insight Cent er support Mult i St ream ICA (MSI) f or CloudBridge appliances?Does Net Scaler Insight Cent er support Mult i St ream ICA (MSI) f or CloudBridge appliances?
Currently NetScaler Insight center does not support collecting data records for MSI connections.
Is t he CloudBridge Plug-In support ed by Net Scaler Insight Cent er report s?Is t he CloudBridge Plug-In support ed by Net Scaler Insight Cent er report s?
Yes. ICA connections from Plug-in-equipped systems must be accelerated with DBC compression policy.
To verify, on the Configuration tab of the CloudBridge appliance, navigate to Optimization Rules > Service Classes and in the right pane, expand ICA and click Edit. The Acceleration
policy must be Disk.
Are t hin client s support ed by Net Scaler Insight Cent er?Are t hin client s support ed by Net Scaler Insight Cent er?
NetScaler Insight Center supports thin clients, but the client type details in the User Agent reports display incorrect values.
Can a CloudBridge dat acent er appliance and Net Scaler ADC be added t o t he same Net Scaler Insight Cent er, present in t he same dat acent er locat ion?Can a CloudBridge dat acent er appliance and Net Scaler ADC be added t o t he same Net Scaler Insight Cent er, present in t he same dat acent er locat ion?
No. This is not supported in this release.
Can I add mult iple CloudBridge dat acent er appliances (present in t he same dat acent er locat ion) t o t he same Net Scaler Insight Cent er?Can I add mult iple CloudBridge dat acent er appliances (present in t he same dat acent er locat ion) t o t he same Net Scaler Insight Cent er?
Yes.
Is t he CloudBridge appliance support ed wit h Deskt op Direct or?Is t he CloudBridge appliance support ed wit h Deskt op Direct or?
Yes. CloudBridge appliance is supported with Desktop director. However, the WAN Jitter and DC Jitter values are not supported.
Why is t he DC Lat ency value more t han ICA RT T ?Why is t he DC Lat ency value more t han ICA RT T ?
Ideally ICA RTT should be greater than the sum of WAN Latency and DC latency.
If the application is not actively sending data, then it does not work as expected. This is because, the TCP RTT estimation works only on active connections. If a connection is not
very active or if it is idle, the DC latency value will be more than ICA RTT or WAN Latency.
What are t he limit at ions of using Deskt op Direct or Plug-in f or generat ing HDX Insight report s f or CloudBridge appliances?What are t he limit at ions of using Deskt op Direct or Plug-in f or generat ing HDX Insight report s f or CloudBridge appliances?
Desktop director does not correlate data across user sessions with NetScaler Insight Center, if CloudBridge generates a Replacement Session GUIDReplacement Session GUID (instead of using an
© 1999-2017 Citrix Systems, Inc. All rights reserved. p.7https://docs.citrix.com
Genuine GUID).
To verify, on the CloudBridge appliance, navigate to Monitoring > ICA Advanced > Conn Info.
This occurs if the customer is using an unsupported ICA Client or XenApp or XenDesktop server. For supported versions, see Supported Software.
Desktop Director does not support WAN Jitter and LAN Jitter values.
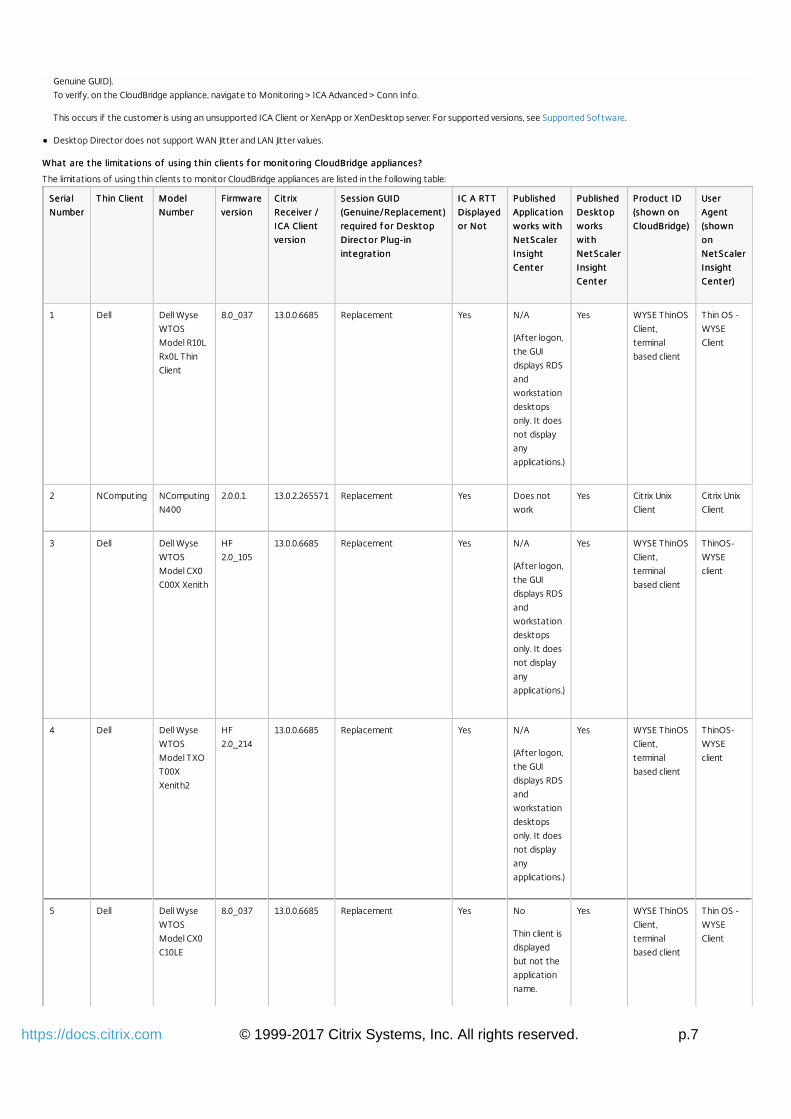
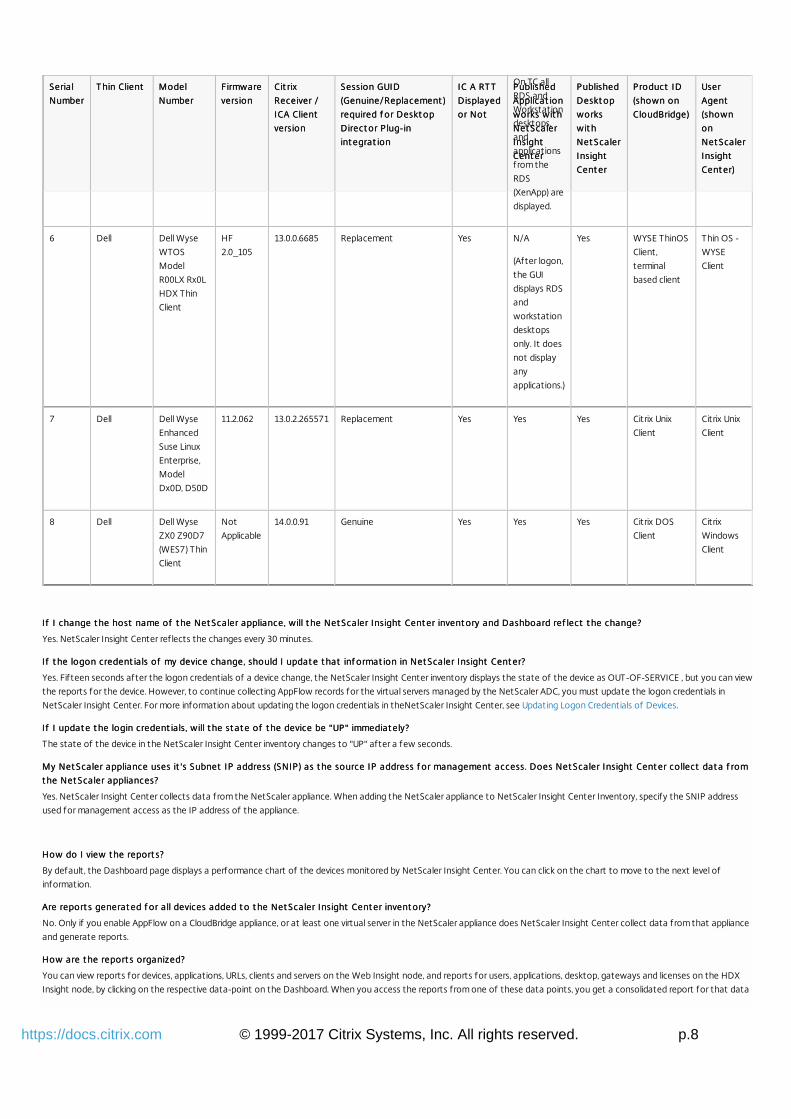
What are t he limit at ions of using t hin client s f or monit oring CloudBridge appliances?What are t he limit at ions of using t hin client s f or monit oring CloudBridge appliances?
The limitations of using thin clients to monitor CloudBridge appliances are listed in the following table:
SerialSerial
NumberNumber
T hin ClientT hin Client ModelModel
NumberNumber
FirmwareFirmware
versionversion
Cit rixCit rix
Receiver /Receiver /
ICA ClientICA Client
versionversion
Session GUIDSession GUID
(Genuine/Replacement )(Genuine/Replacement )
required f or Deskt oprequired f or Deskt op
Direct or Plug-inDirect or Plug-in
int egrat ionint egrat ion
IC A RT TIC A RT T
DisplayedDisplayed
or Notor Not
PublishedPublished
Applicat ionApplicat ion
works wit hworks wit h
Net ScalerNet Scaler
InsightInsight
Cent erCent er
PublishedPublished
Deskt opDeskt op
worksworks
wit hwit h
Net ScalerNet Scaler
InsightInsight
Cent erCent er
Product IDProduct ID
(shown on(shown on
CloudBridge)CloudBridge)
UserUser
AgentAgent
(shown(shown
onon
Net ScalerNet Scaler
InsightInsight
Cent er)Cent er)
1 Dell Dell Wyse
WTOS
Model R10L
Rx0L Thin
Client
8.0_037 13.0.0.6685 Replacement Yes N/A
(After logon,
the GUI
displays RDS
and
workstation
desktops
only. It does
not display
any
applications.)
Yes WYSE ThinOS
Client,
terminal
based client
Thin OS -
WYSE
Client
2 NComputing NComputing
N400
2.0.0.1 13.0.2.265571 Replacement Yes Does not
work
Yes Citrix Unix
Client
Citrix Unix
Client
3 Dell Dell Wyse
WTOS
Model CX0
C00X Xenith
HF
2.0_105
13.0.0.6685 Replacement Yes N/A
(After logon,
the GUI
displays RDS
and
workstation
desktops
only. It does
not display
any
applications.)
Yes WYSE ThinOS
Client,
terminal
based client
ThinOS-
WYSE
client
4 Dell Dell Wyse
WTOS
Model TXO
T00X
Xenith2
HF
2.0_214
13.0.0.6685 Replacement Yes N/A
(After logon,
the GUI
displays RDS
and
workstation
desktops
only. It does
not display
any
applications.)
Yes WYSE ThinOS
Client,
terminal
based client
ThinOS-
WYSE
client
5 Dell Dell Wyse
WTOS
Model CX0
C10LE
8.0_037 13.0.0.6685 Replacement Yes No
Thin client is
displayed
but not the
application
name.
Yes WYSE ThinOS
Client,
terminal
based client
Thin OS -
WYSE
Client
© 1999-2017 Citrix Systems, Inc. All rights reserved. p.8https://docs.citrix.com
On TC all
RDS and
Workstation
desktops,
and
applications
from the
RDS
(XenApp) are
displayed.
6 Dell Dell Wyse
WTOS
Model
R00LX Rx0L
HDX Thin
Client
HF
2.0_105
13.0.0.6685 Replacement Yes N/A
(After logon,
the GUI
displays RDS
and
workstation
desktops
only. It does
not display
any
applications.)
Yes WYSE ThinOS
Client,
terminal
based client
Thin OS -
WYSE
Client
7 Dell Dell Wyse
Enhanced
Suse Linux
Enterprise,
Model
Dx0D, D50D
11.2.062 13.0.2.265571 Replacement Yes Yes Yes Citrix Unix
Client
Citrix Unix
Client
8 Dell Dell Wyse
ZX0 Z90D7
(WES7) Thin
Client
Not
Applicable
14.0.0.91 Genuine Yes Yes Yes Citrix DOS
Client
Citrix
Windows
Client
SerialSerial
NumberNumber
T hin ClientT hin Client ModelModel
NumberNumber
FirmwareFirmware
versionversion
Cit rixCit rix
Receiver /Receiver /
ICA ClientICA Client
versionversion
Session GUIDSession GUID
(Genuine/Replacement )(Genuine/Replacement )
required f or Deskt oprequired f or Deskt op
Direct or Plug-inDirect or Plug-in
int egrat ionint egrat ion
IC A RT TIC A RT T
DisplayedDisplayed
or Notor Not
PublishedPublished
Applicat ionApplicat ion
works wit hworks wit h
Net ScalerNet Scaler
InsightInsight
Cent erCent er
PublishedPublished
Deskt opDeskt op
worksworks
wit hwit h
Net ScalerNet Scaler
InsightInsight
Cent erCent er
Product IDProduct ID
(shown on(shown on
CloudBridge)CloudBridge)
UserUser
AgentAgent
(shown(shown
onon
Net ScalerNet Scaler
InsightInsight
Cent er)Cent er)
If I change t he host name of t he Net Scaler appliance, will t he If I change t he host name of t he Net Scaler appliance, will t he Net Scaler Insight Cent erNet Scaler Insight Cent er invent ory and Dashboard ref lect t he change? invent ory and Dashboard ref lect t he change?
Yes. NetScaler Insight Center reflects the changes every 30 minutes.
I f t he logon credent ials of my If t he logon credent ials of my devicedevice change, should I updat e t hat inf ormat ion in change, should I updat e t hat inf ormat ion in Net Scaler Insight Cent erNet Scaler Insight Cent er??
Yes. Fifteen seconds after the logon credentials of a device change, the NetScaler Insight Center inventory displays the state of the device as OUT-OF-SERVICE , but you can view
the reports for the device. However, to continue collecting AppFlow records for the virtual servers managed by the NetScaler ADC, you must update the logon credentials in
NetScaler Insight Center. For more information about updating the logon credentials in theNetScaler Insight Center, see Updating Logon Credentials of Devices.
I f I updat e t he login credent ials, will t he st at e of t he If I updat e t he login credent ials, will t he st at e of t he devicedevice be "UP" immediat ely? be "UP" immediat ely?
The state of the device in the NetScaler Insight Center inventory changes to "UP" after a few seconds.
My Net Scaler appliance uses it 's Subnet IP address (SNIP) as t he source IP address f or management access. Does My Net Scaler appliance uses it 's Subnet IP address (SNIP) as t he source IP address f or management access. Does Net Scaler Insight Cent erNet Scaler Insight Cent er collect dat a f rom collect dat a f rom
t he Net Scaler appliances?t he Net Scaler appliances?
Yes. NetScaler Insight Center collects data from the NetScaler appliance. When adding the NetScaler appliance to NetScaler Insight Center Inventory, specify the SNIP address
used for management access as the IP address of the appliance.
How do I view t he report s?How do I view t he report s?
By default, the Dashboard page displays a performance chart of the devices monitored by NetScaler Insight Center. You can click on the chart to move to the next level of
information.
Are report s generat ed f or all Are report s generat ed f or all devicesdevices added t o t he added t o t he Net Scaler Insight Cent erNet Scaler Insight Cent er invent ory? invent ory?
No. Only if you enable AppFlow on a CloudBridge appliance, or at least one virtual server in the NetScaler appliance does NetScaler Insight Center collect data from that appliance
and generate reports.
How are t he report s organized?How are t he report s organized?
You can view reports for devices, applications, URLs, clients and servers on the Web Insight node, and reports for users, applications, desktop, gateways and licenses on the HDX
Insight node, by clicking on the respective data-point on the Dashboard. When you access the reports from one of these data points, you get a consolidated report for that data
© 1999-2017 Citrix Systems, Inc. All rights reserved. p.9https://docs.citrix.com
point. For example, click Applications to display the performance chart for all applications (across all NetScaler appliances) monitored by NetScaler Insight Center.
Even when t he Appf low is enabled on a Net Scaler ADC, I do not see t he report s on t he Dashboard. What are t he possible reasons?Even when t he Appf low is enabled on a Net Scaler ADC, I do not see t he report s on t he Dashboard. What are t he possible reasons?
Even if Appflow is enabled on the virtual servers, the services bound to the virtual servers might have AppFlow loggingAppFlow logging set to disabled. In that case, you might not see the reports
in the dashboard. On the NetScaler appliance, enable AppFlow loggingAppFlow logging at the service level to view the reports. For more information, see Troubleshooting Tips.
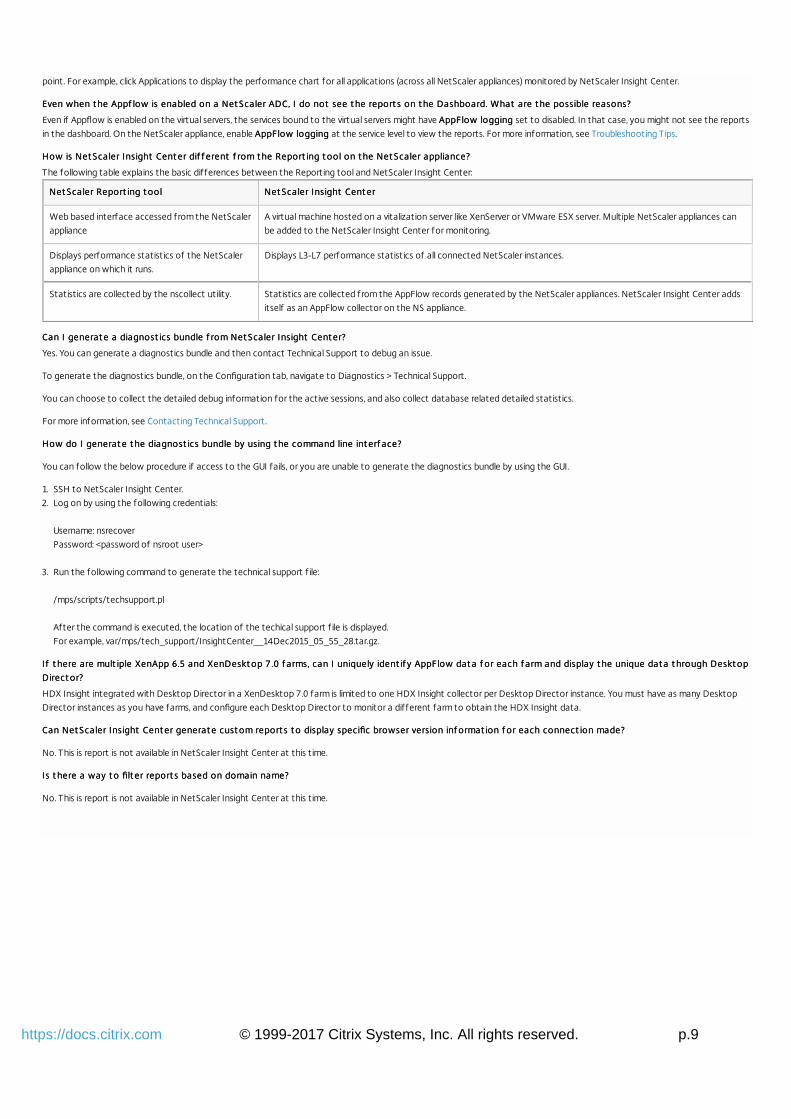
How is How is Net Scaler Insight Cent erNet Scaler Insight Cent er dif f erent f rom t he Report ing t ool on t he Net Scaler appliance? dif f erent f rom t he Report ing t ool on t he Net Scaler appliance?
The following table explains the basic differences between the Reporting tool and NetScaler Insight Center:
Net Scaler Report ing t oolNet Scaler Report ing t ool Net Scaler Insight Cent erNet Scaler Insight Cent er
Web based interface accessed from the NetScaler
appliance
A virtual machine hosted on a vitalization server like XenServer or VMware ESX server. Multiple NetScaler appliances can
be added to the NetScaler Insight Center for monitoring.
Displays performance statistics of the NetScaler
appliance on which it runs.
Displays L3-L7 performance statistics of all connected NetScaler instances.
Statistics are collected by the nscollect utility. Statistics are collected from the AppFlow records generated by the NetScaler appliances. NetScaler Insight Center adds
itself as an AppFlow collector on the NS appliance.
Can I generat e a diagnost ics bundle f rom Net Scaler Insight Cent er?Can I generat e a diagnost ics bundle f rom Net Scaler Insight Cent er?
Yes. You can generate a diagnostics bundle and then contact Technical Support to debug an issue.
To generate the diagnostics bundle, on the Configuration tab, navigate to Diagnostics > Technical Support.
You can choose to collect the detailed debug information for the active sessions, and also collect database related detailed statistics.
For more information, see Contacting Technical Support.
How do I generat e t he diagnost ics bundle by using t he command line int erf ace?How do I generat e t he diagnost ics bundle by using t he command line int erf ace?
You can follow the below procedure if access to the GUI fails, or you are unable to generate the diagnostics bundle by using the GUI.
1. SSH to NetScaler Insight Center.
2. Log on by using the following credentials:
Username: nsrecover
Password: <password of nsroot user>
3. Run the following command to generate the technical support f ile:
/mps/scripts/techsupport.pl
After the command is executed, the location of the techical support f ile is displayed.
For example, var/mps/tech_support/InsightCenter__14Dec2015_05_55_28.tar.gz.
I f t here are mult iple XenApp 6.5 and XenDeskt op 7 .0 f arms, can I uniquely ident if y AppFlow dat a f or each f arm and display t he unique dat a t hrough Deskt opIf t here are mult iple XenApp 6.5 and XenDeskt op 7 .0 f arms, can I uniquely ident if y AppFlow dat a f or each f arm and display t he unique dat a t hrough Deskt op
Direct or?Direct or?
HDX Insight integrated with Desktop Director in a XenDesktop 7.0 farm is limited to one HDX Insight collector per Desktop Director instance. You must have as many Desktop
Director instances as you have farms, and configure each Desktop Director to monitor a different farm to obtain the HDX Insight data.
Can Net Scaler Insight Cent er generat e cust om report s t o display specific browser version inf ormat ion f or each connect ion made?Can Net Scaler Insight Cent er generat e cust om report s t o display specific browser version inf ormat ion f or each connect ion made?
No. This is report is not available in NetScaler Insight Center at this time.
Is t here a way t o filt er report s based on domain name?Is t here a way t o filt er report s based on domain name?
No. This is report is not available in NetScaler Insight Center at this time.
© 1999-2017 Citrix Systems, Inc. All rights reserved. p.10https://docs.citrix.com
Understanding NetScaler Insight Center
May 14 , 2015
In mobile, cloud, and virtual desktop environments, applications are deployed in a dynamic and distributed manner. In such an
environment, monitoring the applications and diagnosing the application issues can be a challenge, which can affect the
user experience and employee productivity.
NetScaler Insight Center, a virtual appliance that runs on XenServer, VMWare ESX, or on Microsoft Hyper-V addresses the
application visibility challenge by collecting detailed information about web-application and virtual-desktop traffic, such as
flow, user-session-level information, web page performance data, and database information flowing through the NetScaler
ADCs, NetScaler Gateway appliances, or CloudBridge appliances at your site and providing actionable reports. It enables IT
administrators to troubleshoot as well as proactively monitor customer issues in matter of minutes.
To help you analyze the performance of the applications running on your appliances, NetScaler Insight Center provides
insight into all of the components that might affect application performance, and generates performance reports.
NetScaler Insight Center has two main components:Web Insight that delivers data analytics for web traff ic f lowing through NetScaler ADCs.
HDX Insight that delivers data analytics for XenApp and XenDesktop traff ic f lowing through NetScaler ADCs, NetScaler
Gateway appliances, or CloudBridge appliances. HDX Insight collects reports when NetScaler ADCs are deployed in
transparent mode, and when NetScaler Gateway appliances are deployed in single-hop mode or double-hop mode.
WAN Insight that delivers data analytics for both accelerated and unaccelerated traff ic f lowing through CloudBridge
appliances
Note: NetScaler Insight Center was earlier called NetScaler Insight. At the time of rebranding, the release number waschanged from 1.0 to 10.1 aligning with a NetScaler release.
Web Insight provides visibility into web applications and allows IT administrators to monitor all web applications being
served by NetScaler ADCs. Web Insight captures data about web traffic that flows between the clients and the servers,
generates AppFlow records by doing deep inspection of the data, and presents the records as visual reports. These reports
provide critical information such as user and server response time, enabling IT organizations to improve web application
performance.
Key features of Web Insight include application-specific reports, URL-specific reports, and cache server-specific reports that
provide visibility into cache performance. Web Insight also provides visibility into HTTP request methods, HTTP response
status, client operating system, and user agents.
Information about client-side parameters enables you to evaluate user experience. Along with other capabilities, you can
identify the top web applications accessed by clients and track their peak usage.
The administrators of web servers can use Web insight to answer any of the following questions:While accessing a particular application like SharePoint, which clients are experiencing high latency?
In the past hour, which applications have had the most hits?
For any given client, what are the applications and URLs that have been accessed?
What operating system and browser is a particular client using?
Which applications or servers are sending the most error-related responses?
© 1999-2017 Citrix Systems, Inc. All rights reserved. p.11https://docs.citrix.com
HDX Insight provides administrators of Citrix XenApp and Citrix XenDesktop environments an easy way to monitor users
and the performance of the applications hosted on NetScaler ADCs, NetScaler Gateway appliances, or CloudBridge
appliances. HDX Insight captures data about the ICA traffic that flows between the clients and the servers, generates
AppFlow records by doing deep inspection of the data, and presents the records as visual reports.
Note: HDX is built on top of the Citrix ICA protocol. ICA is a Citrix proprietary protocol used in XenApp/XenDesktop traff ic.It is composed of virtual channels. A virtual channel is a bidirectional, error-free connection used for the exchange ofgeneralized packet data between a Citrix host for online delivery (XenApp or XenDesktop) and the Citrix Receiver onlineplug-in. Connections for sound, graphics, client drive mapping, printing, and end user experience monitoring are a fewexamples of the virtual channels.With HDX Insight, administrators can troubleshoot issues while accessing a particular published application through XenApp
or XenDesktop.
For example, the administrators of Citrix XenApp and Citrix XenDesktop environments can use HDX Insight to answer thefollowing questions:
For a given XenDesktop user, what is the average client and server-side latency, and the average jitter?
Which part of the network, the f irst Demilitarized zone (DMZ) or the second DMZ is causing a bad user experience?
Which XenDesktop or XenApp users are consuming the most bandwidth over a given time period?
Which virtual channels are consuming the most bandwidth over a given time period?
What are the top applications across all XenApp users, by up-time and total number of launches over a given time
period?
What is the DC latency at the datacenter end of the CloudBridge appliance?
NetScaler Insight Center supports collecting information from NetScaler ADCs when they are deployed in Transparent
mode or LAN User Mode. In this mode, the user is local to the XenApp and XenDesktop applications. NetScaler appliance is
directly part of the traffic flow. No NetScaler Gateway is used.
NetScaler Gateway appliances can be deployed in different modes. HDX Insight supports collecting ICA reports fromNetScaler Gateway appliances when they are deployed in the any of the following modes:
Single-Hop Mode: In this mode, a NetScaler Gateway appliance is used to connect to the XenApp and XenDesktop
applications.
Double-Hop Mode: In this mode, two NetScaler Gateway appliances are deployed to connect to the XenApp and
XenDesktop applications.
NetScaler Insight Center also collects information from CloudBridge datacenter and branch appliances. For details, see
NetScaler Insight Center in a CloudBridge Setup.
Note: NetScaler Insight Center can also be integrated with Desktop Director. In that case, to enable HDX Insight datacollection, you must configure the NetScaler Insight Center virtual appliance in Desktop Director. For more information, seeConfigure HDX Insight.
A CloudBridge setup supports delivery of a large number of applications by greatly improving the efficiency of data flow
across the network. However, maintaining maximum efficiency requires monitoring your network. For example, poor
performance of critical applications can increase the latency in application delivery, and a particular branch office using
maximum bandwidth can cause delays at other branch offices.
The WAN Insight feature of NetScaler Insight Center gives CloudBridge administrators an easy way to monitor the
accelerated and unaccelarted WAN traffic that flows through CloudBridge datacenter and CloudBridge branch appliances,
and it provides end-to-end visibility that includes client-specific data, application-specific data, and branch- specific data.
© 1999-2017 Citrix Systems, Inc. All rights reserved. p.12https://docs.citrix.com
With the ability to identify and monitor all the applications, clients, and branches on the network, you can effectively deal
with the issues that degrade performance.
The WAN Insight feature provides powerful capabilities for failure analysis of your network, branches and applications. Live
and historical reports enable you to be aware of performance issues before users raise complaints.
As a CloudBridge administrator, you can use WAN Insight to answer questions such as:Which client in a branch off ice is consuming the most bandwidth?
What compression ratio is achieved at a particular branch?
What is the latency at the CloudBridge datacenter appliance?
To view WAN Insight reports, you must first add the CloudBridge appliance to NetScaler Insight Center, and then enable
AppFlow.
© 1999-2017 Citrix Systems, Inc. All rights reserved. p.13https://docs.citrix.com
How NetScaler insight Center is Deployed in aNetwork
May 15, 2015
NetScaler Insight Center monitors NetScaler ADCs when these appliances are deployed in transparent mode. It monitors
NetScaler Gateway appliances when these appliances are deployed in single-hop mode or double-hop mode. Currently, in a
CloudBridge deployment, NetScaler Insight Center does not monitor branch office traffic.
This document includes the following details:NetScaler Insight Center in a NetScaler Appliance Transparent Mode
NetScaler Insight Center in a NetScaler Gateway Single-Hop Mode
NetScaler Insight Center in a NetScaler Gateway Double-Hop Mode
NetScaler Insight Center in a NetScaler LAN User Mode
NetScaler Insight Center in a CloudBridge Setup
NetScaler Insight Center in a Multi-Hop Setup
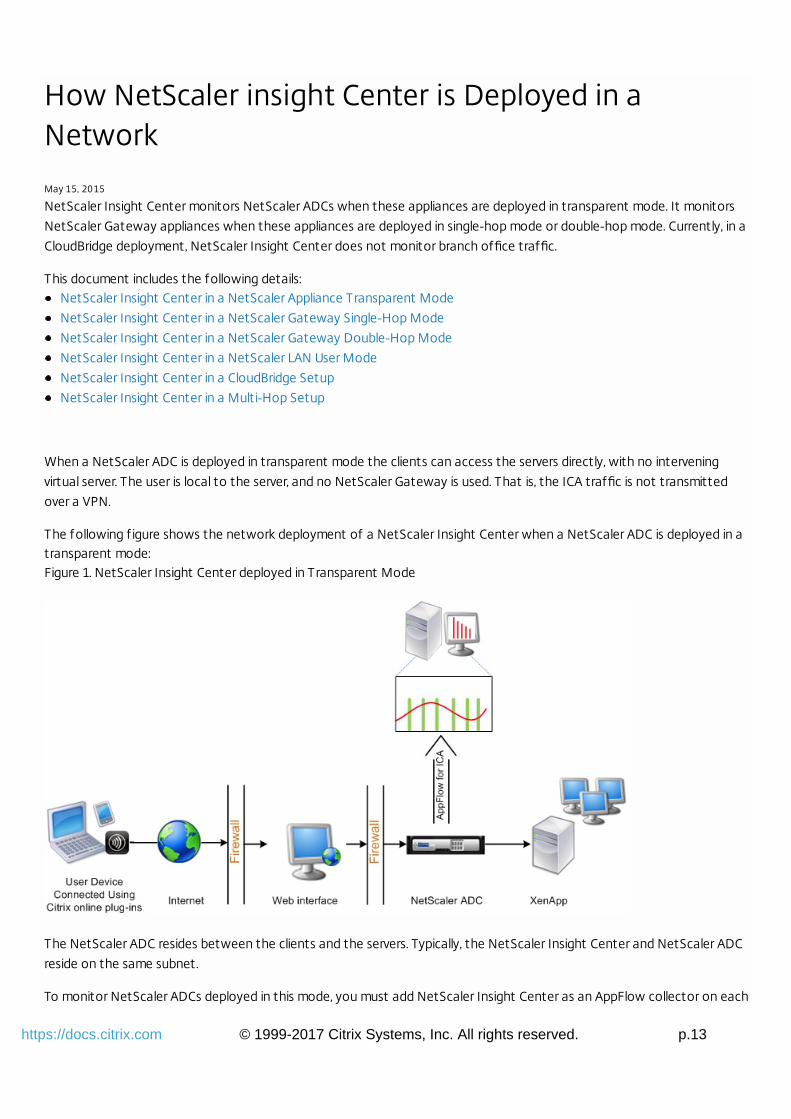
When a NetScaler ADC is deployed in transparent mode the clients can access the servers directly, with no intervening
virtual server. The user is local to the server, and no NetScaler Gateway is used. That is, the ICA traffic is not transmitted
over a VPN.
The following f igure shows the network deployment of a NetScaler Insight Center when a NetScaler ADC is deployed in atransparent mode:Figure 1. NetScaler Insight Center deployed in Transparent Mode
The NetScaler ADC resides between the clients and the servers. Typically, the NetScaler Insight Center and NetScaler ADC
reside on the same subnet.
To monitor NetScaler ADCs deployed in this mode, you must add NetScaler Insight Center as an AppFlow collector on each
© 1999-2017 Citrix Systems, Inc. All rights reserved. p.14https://docs.citrix.com
NetScaler ADC, configure an Appflow policy to collect all or specific ICA traffic that flows through the ADC, and then view
the reports on the NetScaler Insight Center dashboard. For details, see Enabling Data Collection for Monitoring NetScaler
ADCs Deployed in Transparent Mode.
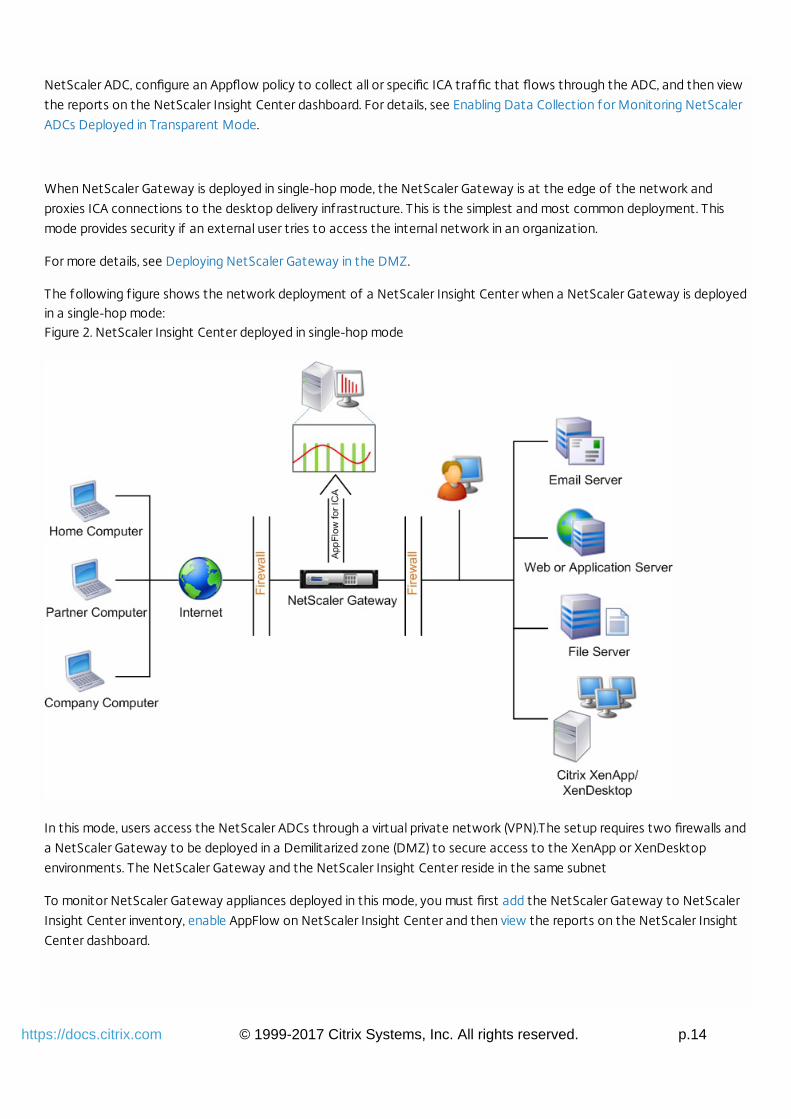
When NetScaler Gateway is deployed in single-hop mode, the NetScaler Gateway is at the edge of the network and
proxies ICA connections to the desktop delivery infrastructure. This is the simplest and most common deployment. This
mode provides security if an external user tries to access the internal network in an organization.
For more details, see Deploying NetScaler Gateway in the DMZ.
The following f igure shows the network deployment of a NetScaler Insight Center when a NetScaler Gateway is deployedin a single-hop mode:Figure 2. NetScaler Insight Center deployed in single-hop mode
In this mode, users access the NetScaler ADCs through a virtual private network (VPN).The setup requires two firewalls and
a NetScaler Gateway to be deployed in a Demilitarized zone (DMZ) to secure access to the XenApp or XenDesktop
environments. The NetScaler Gateway and the NetScaler Insight Center reside in the same subnet
To monitor NetScaler Gateway appliances deployed in this mode, you must first add the NetScaler Gateway to NetScaler
Insight Center inventory, enable AppFlow on NetScaler Insight Center and then view the reports on the NetScaler Insight
Center dashboard.
© 1999-2017 Citrix Systems, Inc. All rights reserved. p.15https://docs.citrix.com
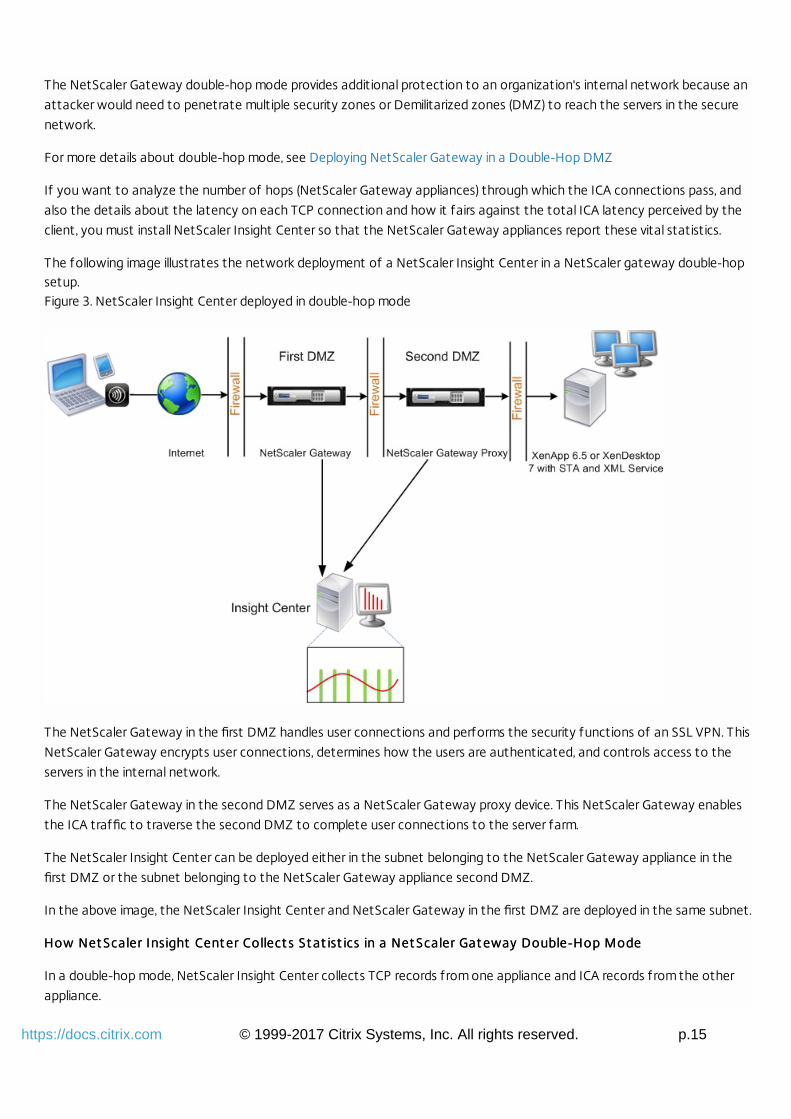
The NetScaler Gateway double-hop mode provides additional protection to an organization's internal network because an
attacker would need to penetrate multiple security zones or Demilitarized zones (DMZ) to reach the servers in the secure
network.
For more details about double-hop mode, see Deploying NetScaler Gateway in a Double-Hop DMZ
If you want to analyze the number of hops (NetScaler Gateway appliances) through which the ICA connections pass, and
also the details about the latency on each TCP connection and how it fairs against the total ICA latency perceived by the
client, you must install NetScaler Insight Center so that the NetScaler Gateway appliances report these vital statistics.
The following image illustrates the network deployment of a NetScaler Insight Center in a NetScaler gateway double-hopsetup.Figure 3. NetScaler Insight Center deployed in double-hop mode
The NetScaler Gateway in the first DMZ handles user connections and performs the security functions of an SSL VPN. This
NetScaler Gateway encrypts user connections, determines how the users are authenticated, and controls access to the
servers in the internal network.
The NetScaler Gateway in the second DMZ serves as a NetScaler Gateway proxy device. This NetScaler Gateway enables
the ICA traffic to traverse the second DMZ to complete user connections to the server farm.
The NetScaler Insight Center can be deployed either in the subnet belonging to the NetScaler Gateway appliance in the
first DMZ or the subnet belonging to the NetScaler Gateway appliance second DMZ.
In the above image, the NetScaler Insight Center and NetScaler Gateway in the first DMZ are deployed in the same subnet.
How Net Scaler Insight Cent er Collect s St at ist ics in a Net Scaler Gat eway Double-Hop ModeHow Net Scaler Insight Cent er Collect s St at ist ics in a Net Scaler Gat eway Double-Hop Mode
In a double-hop mode, NetScaler Insight Center collects TCP records from one appliance and ICA records from the other
appliance.
© 1999-2017 Citrix Systems, Inc. All rights reserved. p.16https://docs.citrix.com
After you add the NetScaler Gateway appliances to the NetScaler Insight center inventory and enable data collection,
each of the appliances export the reports by keeping track of the hop count and connection chain ID.
For NetScaler Insight Center to identify which appliance is exporting records, each appliance is specified with a hop count
and each connection is specified with a connection chain ID. Hop count represents the number of NetScaler Gateway
appliances through which the traffic flows from a client to the servers. The connection chain ID represents the end- to end
connections between the client and server.
NetScaler Insight Center uses the hop count and connection chain ID to co-relate the data from both the NetScaler
Gateway appliances and generates the reports.
To monitor NetScaler Gateway appliances deployed in this mode, you must first add the NetScaler Gateway to NetScaler
Insight Center inventory, enable AppFlow on NetScaler Insight Center and then view the reports on the NetScaler Insight
Center dashboard.
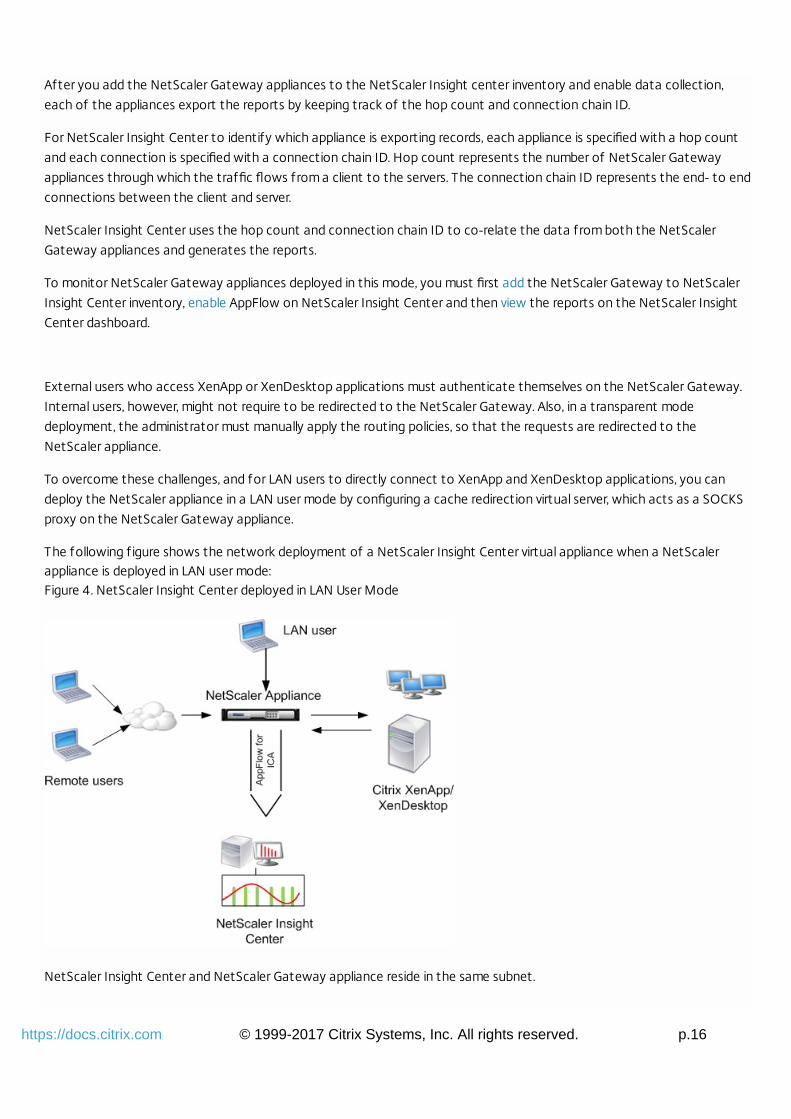
External users who access XenApp or XenDesktop applications must authenticate themselves on the NetScaler Gateway.
Internal users, however, might not require to be redirected to the NetScaler Gateway. Also, in a transparent mode
deployment, the administrator must manually apply the routing policies, so that the requests are redirected to the
NetScaler appliance.
To overcome these challenges, and for LAN users to directly connect to XenApp and XenDesktop applications, you can
deploy the NetScaler appliance in a LAN user mode by configuring a cache redirection virtual server, which acts as a SOCKS
proxy on the NetScaler Gateway appliance.
The following f igure shows the network deployment of a NetScaler Insight Center virtual appliance when a NetScalerappliance is deployed in LAN user mode:Figure 4. NetScaler Insight Center deployed in LAN User Mode
NetScaler Insight Center and NetScaler Gateway appliance reside in the same subnet.
© 1999-2017 Citrix Systems, Inc. All rights reserved. p.17https://docs.citrix.com
To monitor NetScaler appliances deployed in this mode, first add the NetScaler appliance to the NetScaler Insight inventory,
enable AppFlow and then view the reports on the dashboard.
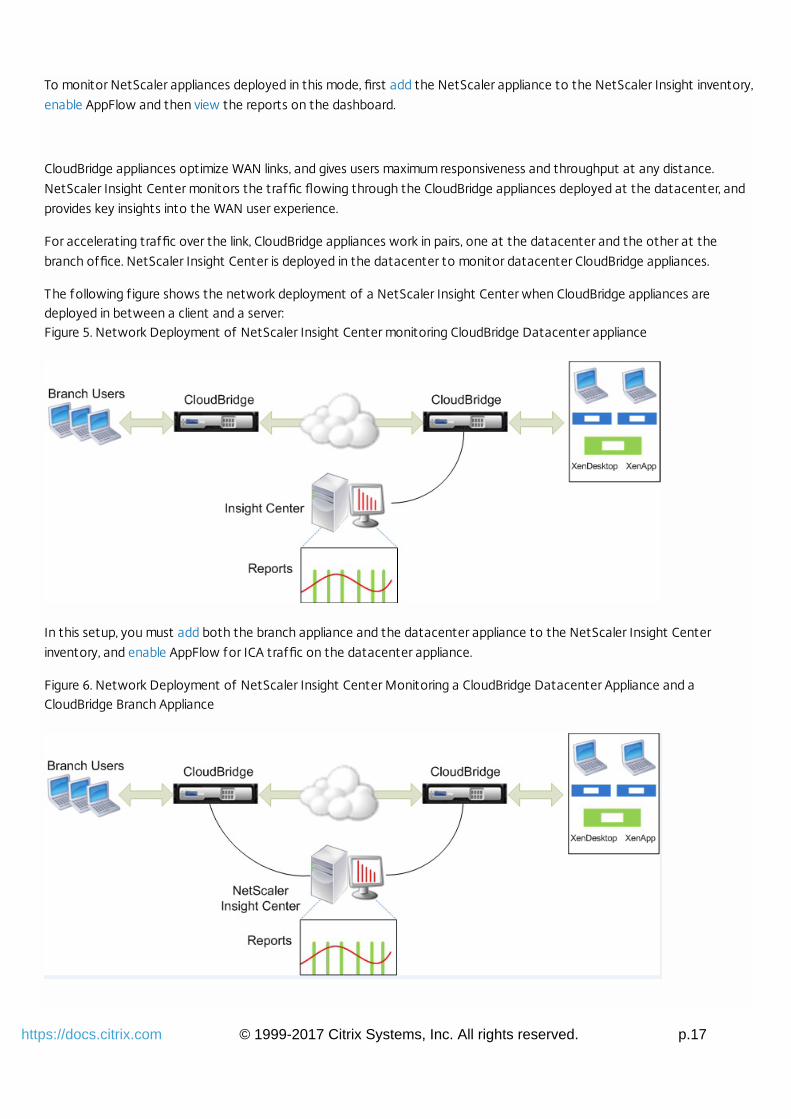
CloudBridge appliances optimize WAN links, and gives users maximum responsiveness and throughput at any distance.
NetScaler Insight Center monitors the traffic flowing through the CloudBridge appliances deployed at the datacenter, and
provides key insights into the WAN user experience.
For accelerating traffic over the link, CloudBridge appliances work in pairs, one at the datacenter and the other at the
branch office. NetScaler Insight Center is deployed in the datacenter to monitor datacenter CloudBridge appliances.
The following f igure shows the network deployment of a NetScaler Insight Center when CloudBridge appliances aredeployed in between a client and a server:Figure 5. Network Deployment of NetScaler Insight Center monitoring CloudBridge Datacenter appliance
In this setup, you must add both the branch appliance and the datacenter appliance to the NetScaler Insight Center
inventory, and enable AppFlow for ICA traffic on the datacenter appliance.
Figure 6. Network Deployment of NetScaler Insight Center Monitoring a CloudBridge Datacenter Appliance and aCloudBridge Branch Appliance
© 1999-2017 Citrix Systems, Inc. All rights reserved. p.18https://docs.citrix.com
In this setup, you must add both the branch appliance and the datacenter appliance to the NetScaler Insight Center
inventory, enable AppFlow for ICA traffic on the branch appliance, and enable AppFlow for TCP, ICA, and WAN traffic on the
datacenter appliance.
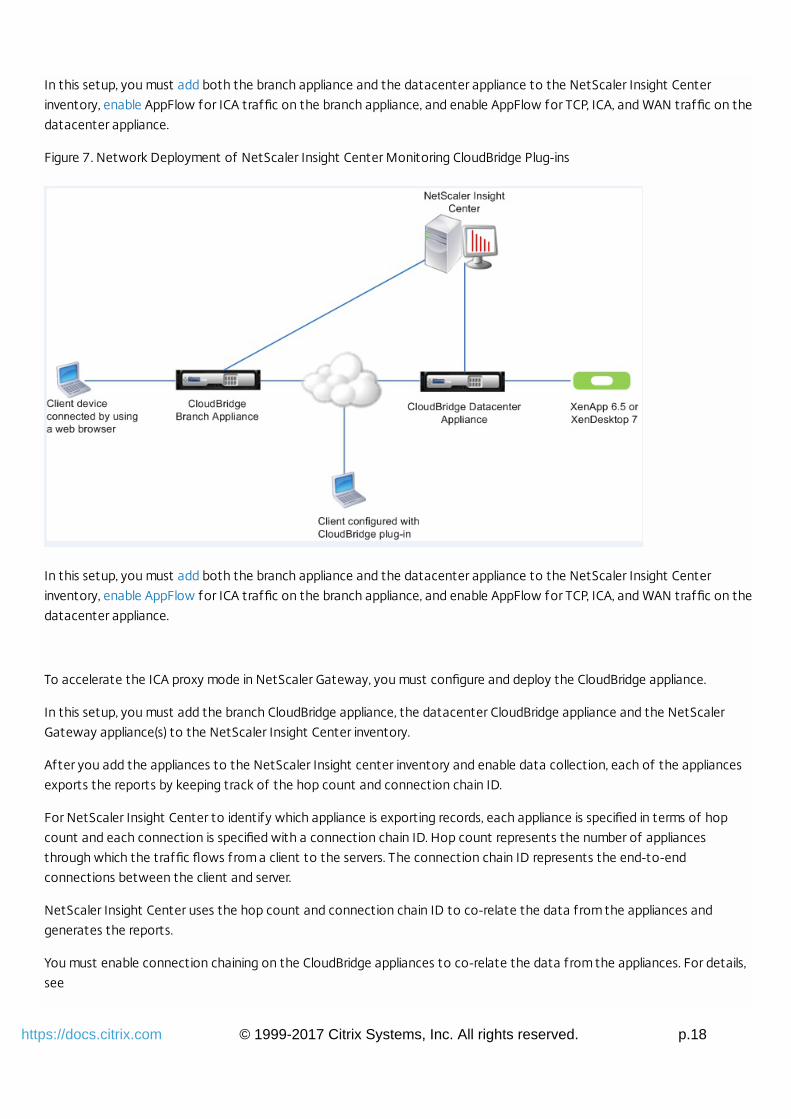
Figure 7. Network Deployment of NetScaler Insight Center Monitoring CloudBridge Plug-ins
In this setup, you must add both the branch appliance and the datacenter appliance to the NetScaler Insight Center
inventory, enable AppFlow for ICA traffic on the branch appliance, and enable AppFlow for TCP, ICA, and WAN traffic on the
datacenter appliance.
To accelerate the ICA proxy mode in NetScaler Gateway, you must configure and deploy the CloudBridge appliance.
In this setup, you must add the branch CloudBridge appliance, the datacenter CloudBridge appliance and the NetScaler
Gateway appliance(s) to the NetScaler Insight Center inventory.
After you add the appliances to the NetScaler Insight center inventory and enable data collection, each of the appliances
exports the reports by keeping track of the hop count and connection chain ID.
For NetScaler Insight Center to identify which appliance is exporting records, each appliance is specified in terms of hop
count and each connection is specified with a connection chain ID. Hop count represents the number of appliances
through which the traffic flows from a client to the servers. The connection chain ID represents the end-to-end
connections between the client and server.
NetScaler Insight Center uses the hop count and connection chain ID to co-relate the data from the appliances and
generates the reports.
You must enable connection chaining on the CloudBridge appliances to co-relate the data from the appliances. For details,
see
© 1999-2017 Citrix Systems, Inc. All rights reserved. p.19https://docs.citrix.com
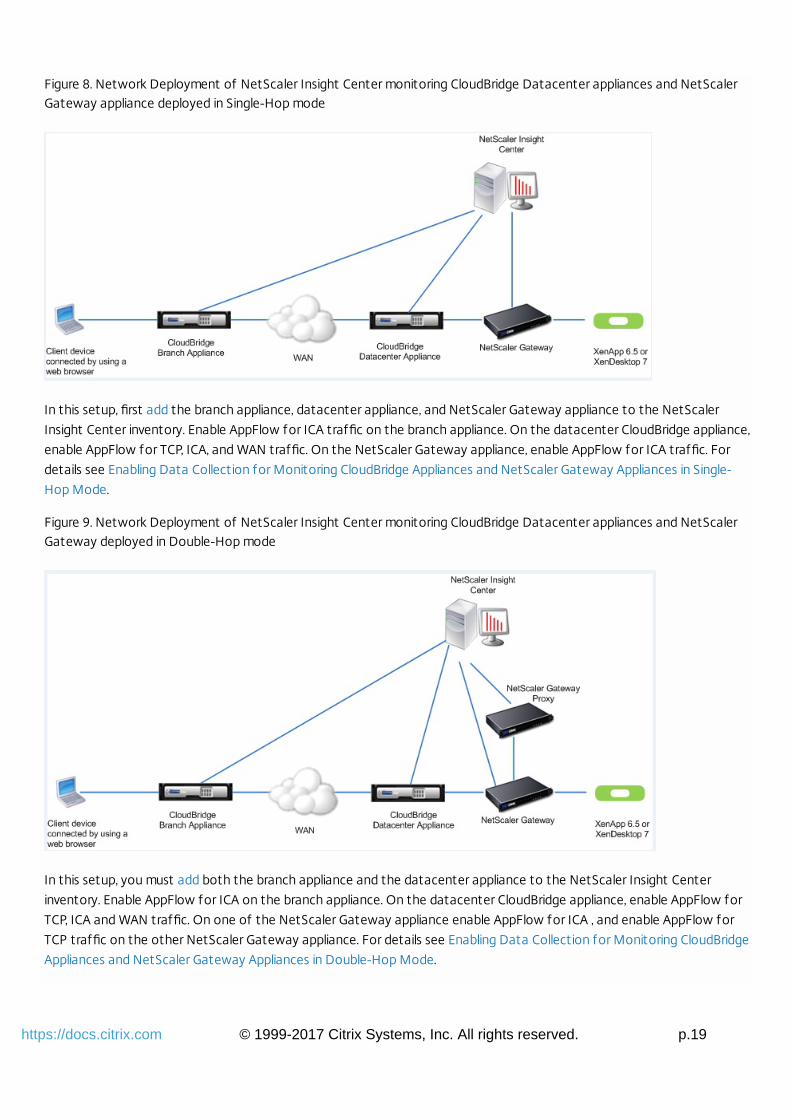
Figure 8. Network Deployment of NetScaler Insight Center monitoring CloudBridge Datacenter appliances and NetScalerGateway appliance deployed in Single-Hop mode
In this setup, first add the branch appliance, datacenter appliance, and NetScaler Gateway appliance to the NetScaler
Insight Center inventory. Enable AppFlow for ICA traffic on the branch appliance. On the datacenter CloudBridge appliance,
enable AppFlow for TCP, ICA, and WAN traffic. On the NetScaler Gateway appliance, enable AppFlow for ICA traffic. For
details see Enabling Data Collection for Monitoring CloudBridge Appliances and NetScaler Gateway Appliances in Single-
Hop Mode.
Figure 9. Network Deployment of NetScaler Insight Center monitoring CloudBridge Datacenter appliances and NetScalerGateway deployed in Double-Hop mode
In this setup, you must add both the branch appliance and the datacenter appliance to the NetScaler Insight Center
inventory. Enable AppFlow for ICA on the branch appliance. On the datacenter CloudBridge appliance, enable AppFlow for
TCP, ICA and WAN traffic. On one of the NetScaler Gateway appliance enable AppFlow for ICA , and enable AppFlow for
TCP traffic on the other NetScaler Gateway appliance. For details see Enabling Data Collection for Monitoring CloudBridge
Appliances and NetScaler Gateway Appliances in Double-Hop Mode.
© 1999-2017 Citrix Systems, Inc. All rights reserved. p.20https://docs.citrix.com
Before You Begin
Dec 08 , 2016
Before you Install NetScaler Insight Center you must understand the software requirements, browser requirements, port
information, license information, and limitations.
This topic includes the following details:Supported Software
Ports
Licensing Information
Limitations
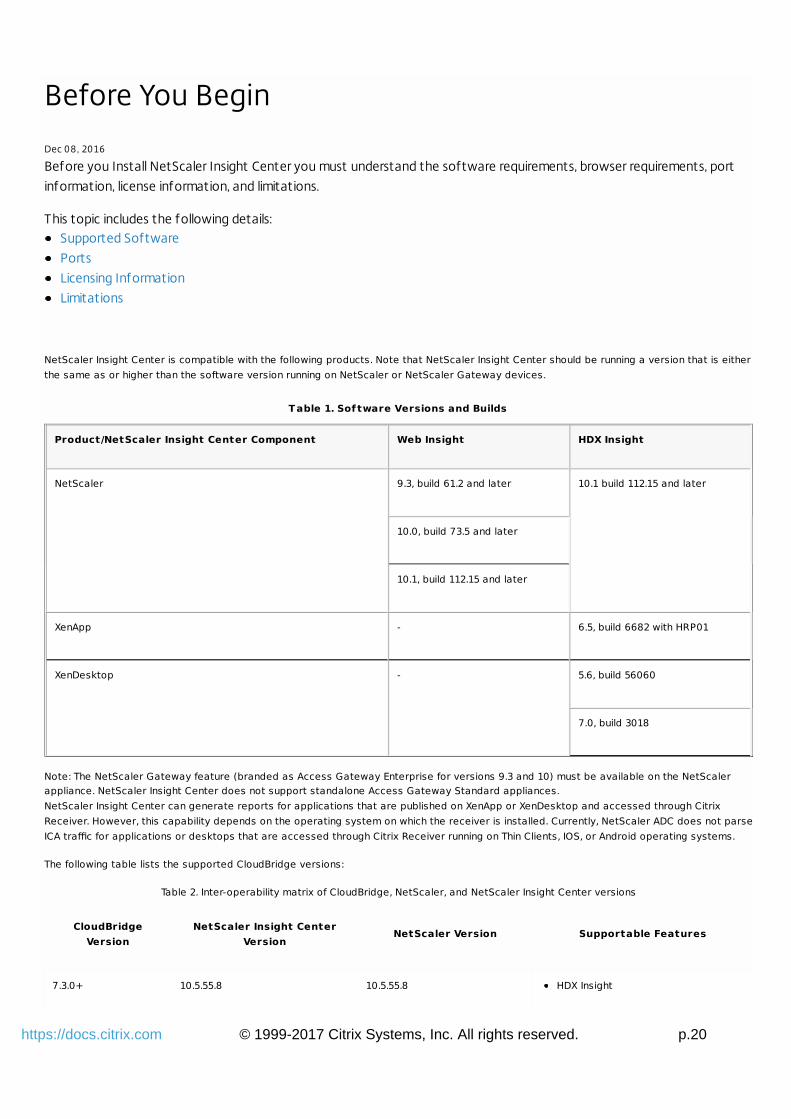
NetScaler Insight Center is compatible with the following products. Note that NetScaler Insight Center should be running a version that is eitherthe same as or higher than the software version running on NetScaler or NetScaler Gateway devices.
Table 1. Sof tware Versions and Builds
Product/NetScaler Insight Center Component Web Insight HDX Insight
NetScaler 9.3, build 61.2 and later 10.1 build 112.15 and later
10.0, build 73.5 and later
10.1, build 112.15 and later
XenApp - 6.5, build 6682 with HRP01
XenDesktop - 5.6, build 56060
7.0, build 3018
Note: The NetScaler Gateway feature (branded as Access Gateway Enterprise for versions 9.3 and 10) must be available on the NetScalerappliance. NetScaler Insight Center does not support standalone Access Gateway Standard appliances.NetScaler Insight Center can generate reports for applications that are published on XenApp or XenDesktop and accessed through CitrixReceiver. However, this capability depends on the operating system on which the receiver is installed. Currently, NetScaler ADC does not parseICA traffic for applications or desktops that are accessed through Citrix Receiver running on Thin Clients, IOS, or Android operating systems.
The following table lists the supported CloudBridge versions:
Table 2. Inter-operability matrix of CloudBridge, NetScaler, and NetScaler Insight Center versions
CloudBridgeVersion
NetScaler Insight CenterVersion
NetScaler Version Supportable Features
7.3.0+ 10.5.55.8 10.5.55.8 HDX Insight
© 1999-2017 Citrix Systems, Inc. All rights reserved. p.21https://docs.citrix.com
7.4.0 10.5.55.8007.e 10.5.55.8007.eHDX InsightWAN InsightNS/CB Multi-hop
7.4.1 10.5.56.1505.e 10.5.56.1505.eHDX InsightWAN InsightNS/CB Multi-hop
7.4.1 11.0.55.23 11.0.55.23
HDX InsightWAN InsightNS/CB Multi-hopGeo Map
7.4.3 11.0.64.34 11.0.64.34
HDX InsightWAN InsightNS/CB Multi-hopGeo Map
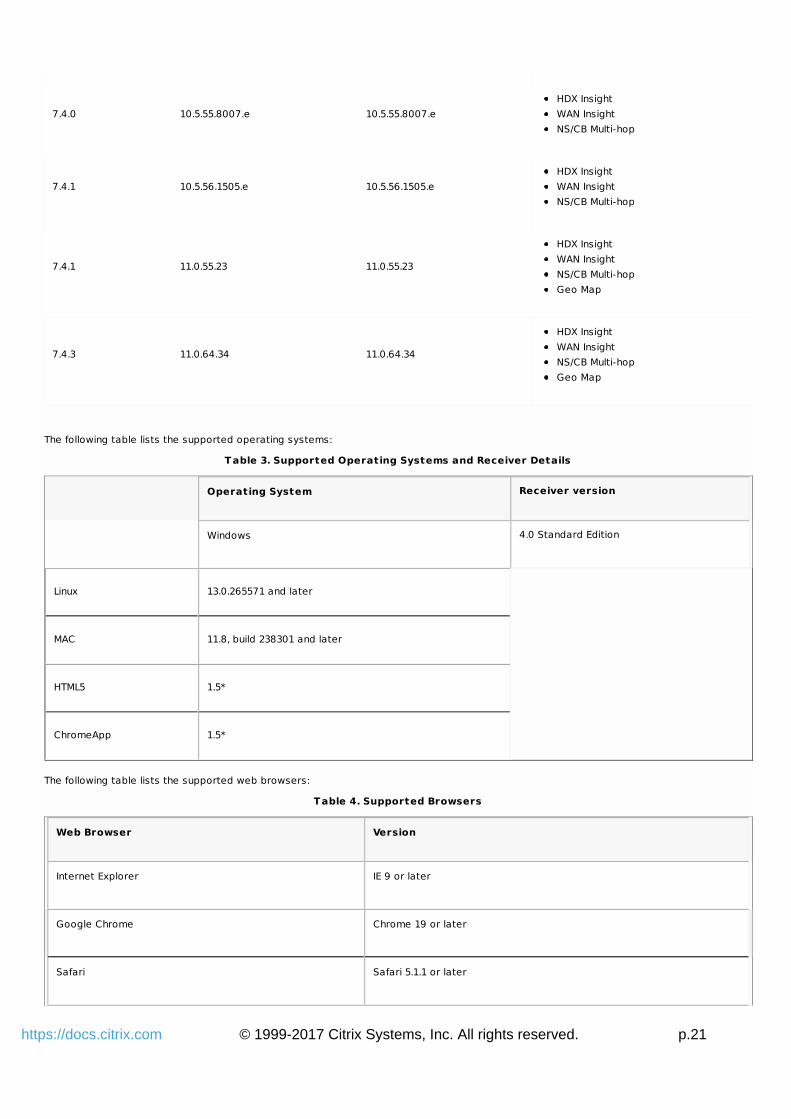
The following table lists the supported operating systems:
Table 3. Supported Operating Systems and Receiver Details
Operating System Receiver version
Windows 4.0 Standard Edition
Linux 13.0.265571 and later
MAC 11.8, build 238301 and later
HTML5 1.5*
ChromeApp 1.5*
The following table lists the supported web browsers:
Table 4. Supported Browsers
Web Browser Version
Internet Explorer IE 9 or later
Google Chrome Chrome 19 or later
Safari Safari 5.1.1 or later
© 1999-2017 Citrix Systems, Inc. All rights reserved. p.22https://docs.citrix.com
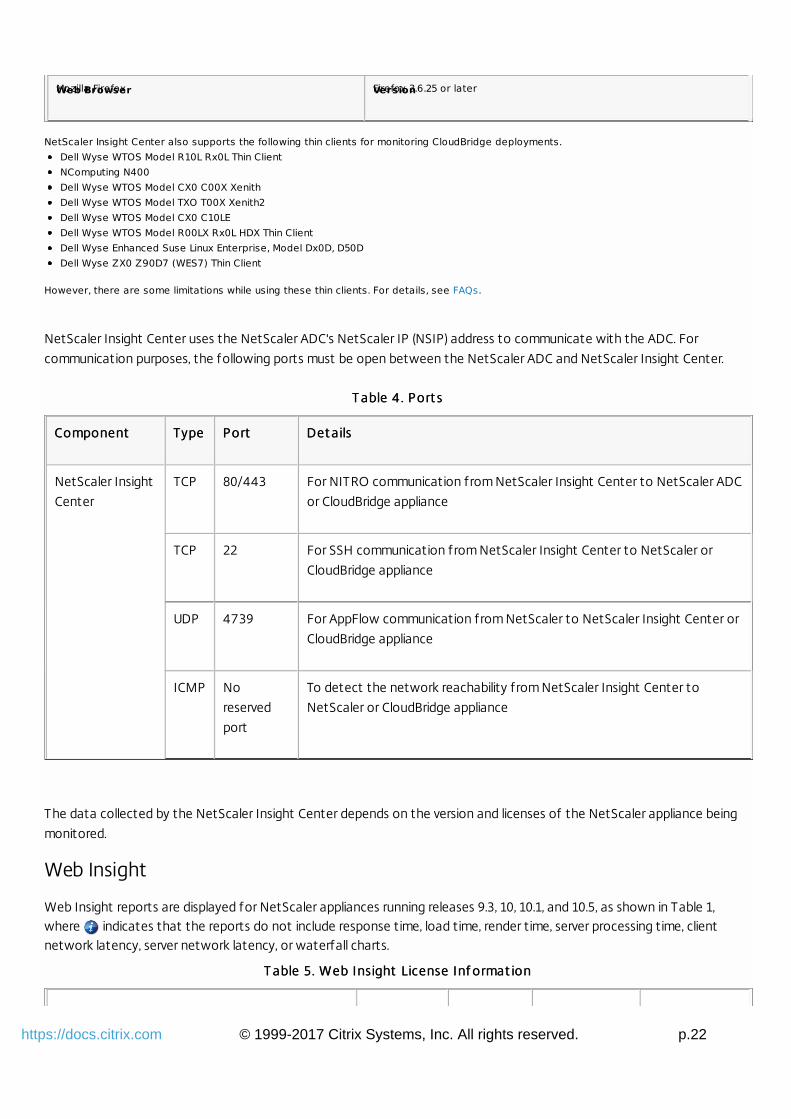
Mozilla Firefox Firefox 3.6.25 or laterWeb Browser Version
NetScaler Insight Center also supports the following thin clients for monitoring CloudBridge deployments.Dell Wyse WTOS Model R10L Rx0L Thin ClientNComputing N400Dell Wyse WTOS Model CX0 C00X XenithDell Wyse WTOS Model TXO T00X Xenith2Dell Wyse WTOS Model CX0 C10LEDell Wyse WTOS Model R00LX Rx0L HDX Thin ClientDell Wyse Enhanced Suse Linux Enterprise, Model Dx0D, D50DDell Wyse ZX0 Z90D7 (WES7) Thin Client
However, there are some limitations while using these thin clients. For details, see FAQs.
NetScaler Insight Center uses the NetScaler ADC's NetScaler IP (NSIP) address to communicate with the ADC. For
communication purposes, the following ports must be open between the NetScaler ADC and NetScaler Insight Center.
T able 4 . Port sT able 4 . Port s
ComponentComponent TypeType PortPort Det ailsDet ails
NetScaler Insight
Center
TCP 80/443 For NITRO communication from NetScaler Insight Center to NetScaler ADC
or CloudBridge appliance
TCP 22 For SSH communication from NetScaler Insight Center to NetScaler or
CloudBridge appliance
UDP 4739 For AppFlow communication from NetScaler to NetScaler Insight Center or
CloudBridge appliance
ICMP No
reserved
port
To detect the network reachability from NetScaler Insight Center to
NetScaler or CloudBridge appliance
The data collected by the NetScaler Insight Center depends on the version and licenses of the NetScaler appliance being
monitored.
Web Insight
Web Insight reports are displayed for NetScaler appliances running releases 9.3, 10, 10.1, and 10.5, as shown in Table 1,where indicates that the reports do not include response time, load time, render time, server processing time, clientnetwork latency, server network latency, or waterfall charts.
T able 5. Web Insight License Inf ormat ionT able 5. Web Insight License Inf ormat ion
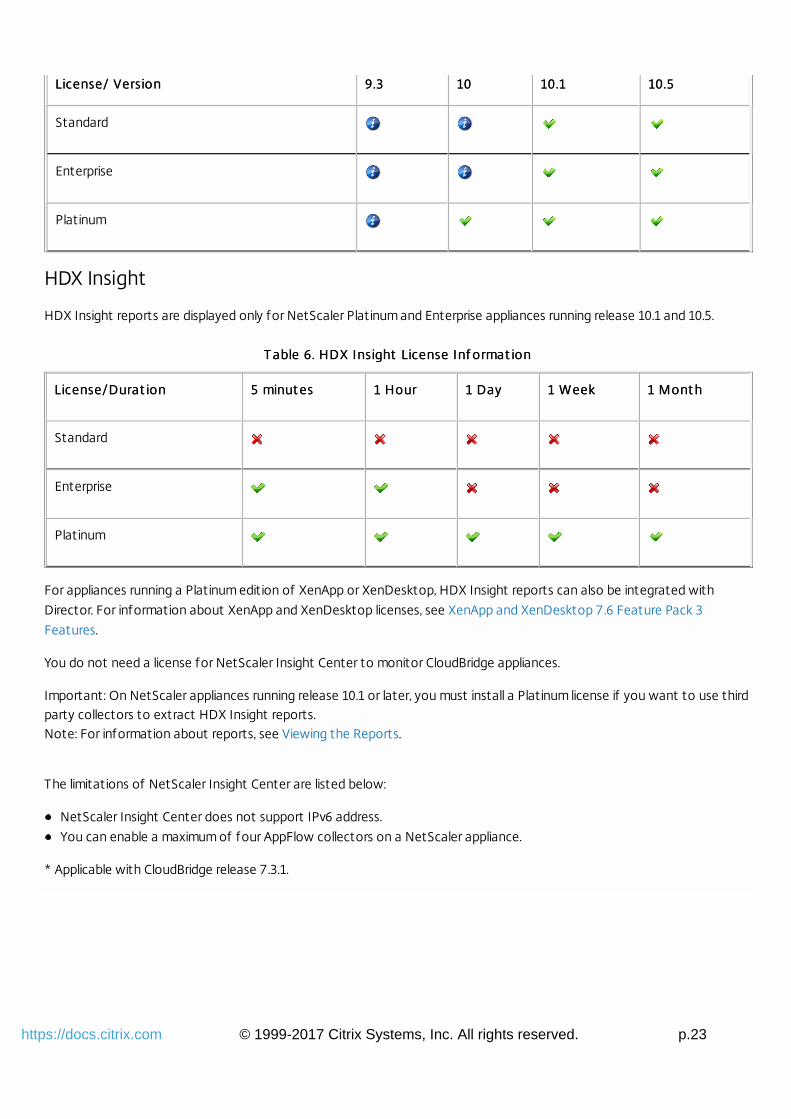
© 1999-2017 Citrix Systems, Inc. All rights reserved. p.23https://docs.citrix.com
License/ VersionLicense/ Version 9.39.3 1010 10.110.1 10.510.5
Standard
Enterprise
Platinum
HDX Insight
HDX Insight reports are displayed only for NetScaler Platinum and Enterprise appliances running release 10.1 and 10.5.
T able 6. HDX Insight License Inf ormat ionT able 6. HDX Insight License Inf ormat ion
License/Durat ionLicense/Durat ion 5 minut es5 minut es 1 Hour1 Hour 1 Day1 Day 1 Week1 Week 1 Mont h1 Mont h
Standard
Enterprise
Platinum
For appliances running a Platinum edition of XenApp or XenDesktop, HDX Insight reports can also be integrated with
Director. For information about XenApp and XenDesktop licenses, see XenApp and XenDesktop 7.6 Feature Pack 3
Features.
You do not need a license for NetScaler Insight Center to monitor CloudBridge appliances.
Important: On NetScaler appliances running release 10.1 or later, you must install a Platinum license if you want to use thirdparty collectors to extract HDX Insight reports.Note: For information about reports, see Viewing the Reports.
The limitations of NetScaler Insight Center are listed below:
NetScaler Insight Center does not support IPv6 address.
You can enable a maximum of four AppFlow collectors on a NetScaler appliance.
* Applicable with CloudBridge release 7.3.1.
© 1999-2017 Citrix Systems, Inc. All rights reserved. p.24https://docs.citrix.com
Installing NetScaler Insight Center
May 15, 2015
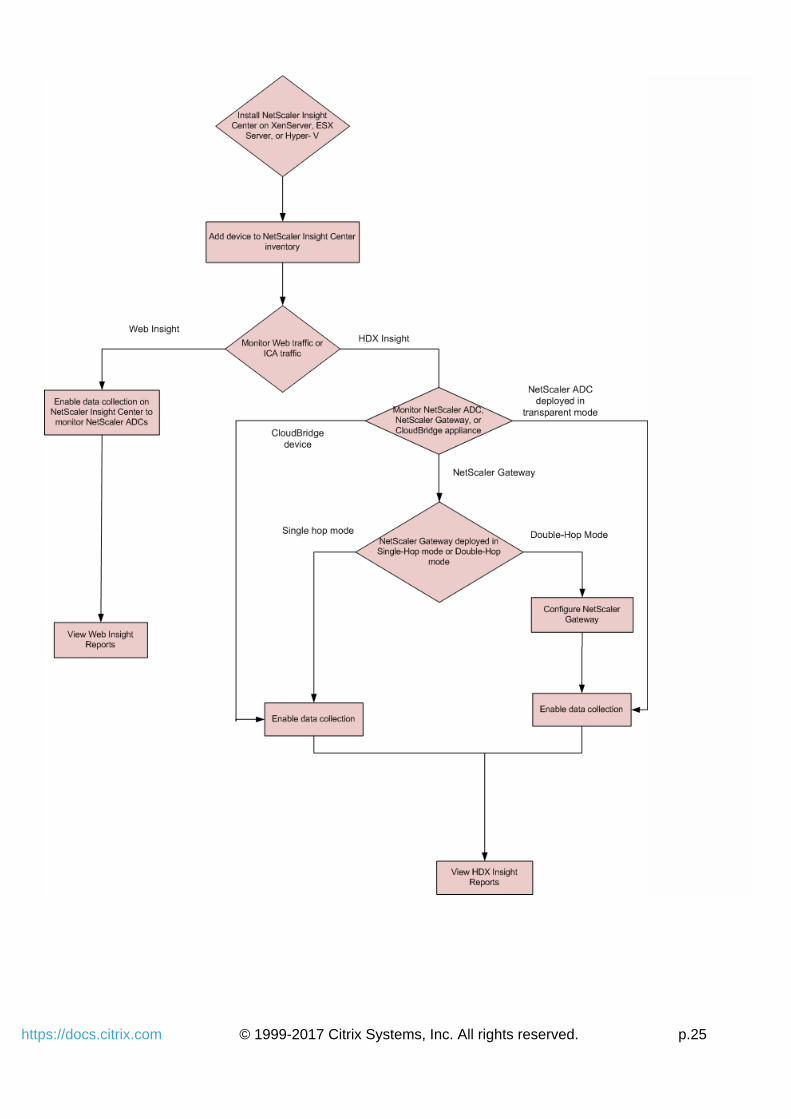
To monitor web and ICA traffic, you first install NetScaler Insight Center on one of the hypervisors and then add a device to
the NetScaler Insight Center inventory. For Web Insight, you just need to enable data collection and start viewing reports.
For HDX Insight, on NetScaler ADC and NetScaler Gateway, choose a mode first, then enable data collection to view
reports. For CloudBridge appliances, directly enable data collection to view reports.
NetScaler Insight Center is a virtual appliance that must be deployed either on a Citrix XenServer server, VMware ESX server,
or Microsoft Hyper-V.
Based on the platform you choose to install NetScaler Insight Center and your requirement to monitor web traffic or ICA
traffic, the workflow changes accordingly. The following diagram describes this workflow
After you have installed NetScaler Insight Center on one of the hypervisors, perform the following steps:Add Devices
Enable Data Collection
View Reports
The following diagram describes the workflow of NetScaler Insight Center:Figure 1. Network Deployment of NetScaler Insight Center monitoring NetScaler ADC
© 1999-2017 Citrix Systems, Inc. All rights reserved. p.25https://docs.citrix.com
© 1999-2017 Citrix Systems, Inc. All rights reserved. p.26https://docs.citrix.com
Installing NetScaler Insight Center on XenServer
May 15, 2015
To install NetScaler Insight Center virtual appliances on Citrix XenServer, you use XenCenter.
This topic includes the following details:Prerequisites for Installing NetScaler Insight Center
Installation Procedure
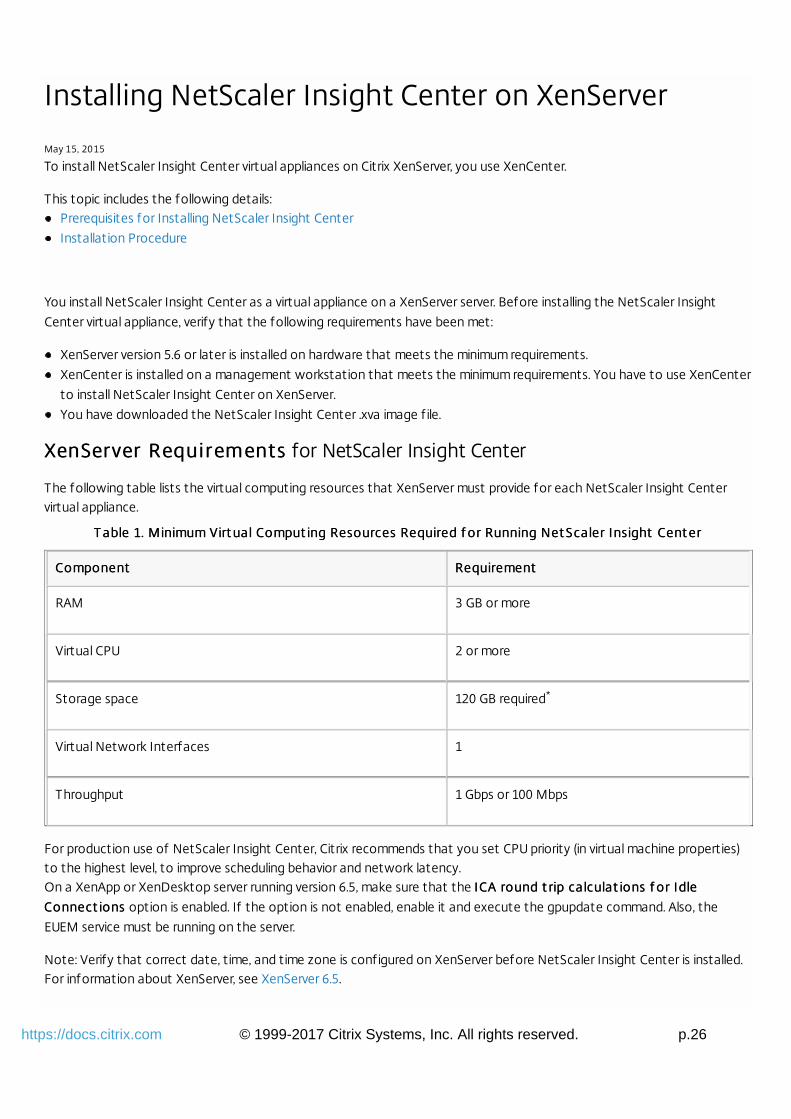
You install NetScaler Insight Center as a virtual appliance on a XenServer server. Before installing the NetScaler Insight
Center virtual appliance, verify that the following requirements have been met:
XenServer version 5.6 or later is installed on hardware that meets the minimum requirements.
XenCenter is installed on a management workstation that meets the minimum requirements. You have to use XenCenter
to install NetScaler Insight Center on XenServer.
You have downloaded the NetScaler Insight Center .xva image f ile.
XenServer RequirementsXenServer Requirements for NetScaler Insight Center
The following table lists the virtual computing resources that XenServer must provide for each NetScaler Insight Centervirtual appliance.
T able 1. T able 1. Minimum Virt ual Comput ing Resources Required f or Running Minimum Virt ual Comput ing Resources Required f or Running Net Scaler Insight Cent erNet Scaler Insight Cent er
ComponentComponent RequirementRequirement
RAM 3 GB or more
Virtual CPU 2 or more
Storage space 120 GB required
Virtual Network Interfaces 1
Throughput 1 Gbps or 100 Mbps
For production use of NetScaler Insight Center, Citrix recommends that you set CPU priority (in virtual machine properties)to the highest level, to improve scheduling behavior and network latency.On a XenApp or XenDesktop server running version 6.5, make sure that the ICA round t rip calculat ions f or IdleICA round t rip calculat ions f or Idle
Connect ionsConnect ions option is enabled. If the option is not enabled, enable it and execute the gpupdate command. Also, the
EUEM service must be running on the server.
Note: Verify that correct date, time, and time zone is configured on XenServer before NetScaler Insight Center is installed.For information about XenServer, see XenServer 6.5.
*
© 1999-2017 Citrix Systems, Inc. All rights reserved. p.27https://docs.citrix.com
XenCenter System Requirements
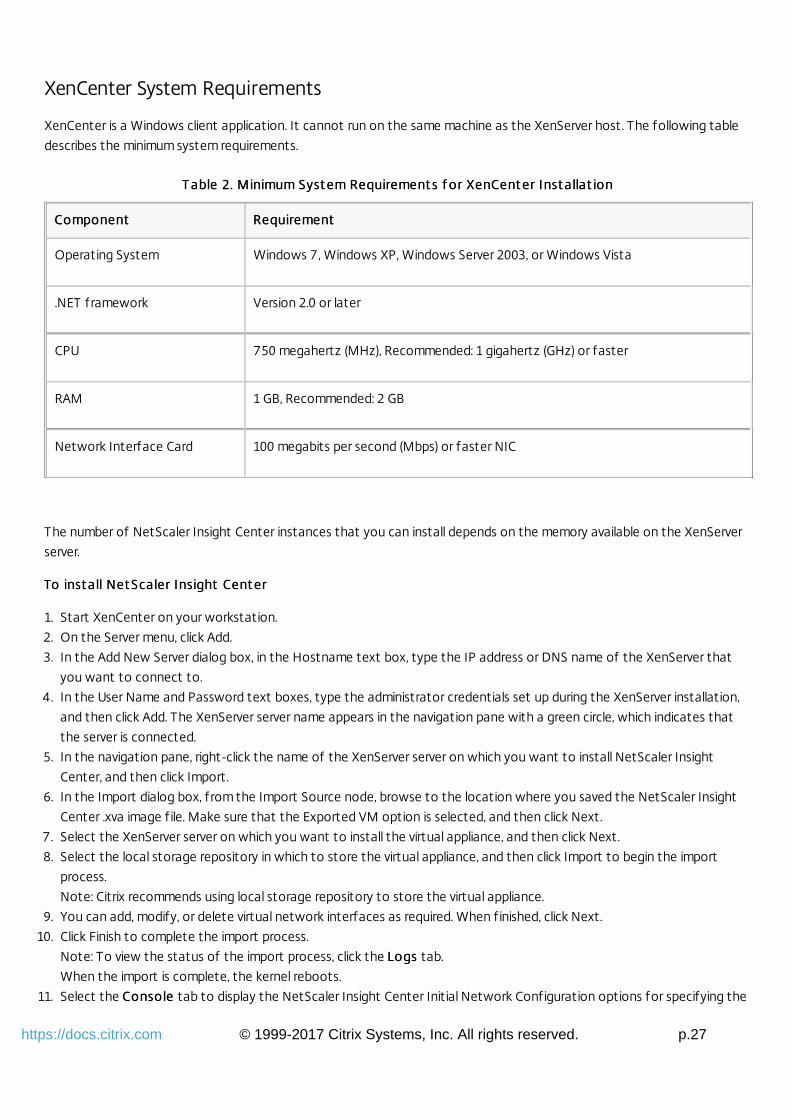
XenCenter is a Windows client application. It cannot run on the same machine as the XenServer host. The following table
describes the minimum system requirements.
T able 2. T able 2. Minimum Syst em Requirement s f or XenCent er Inst allat ionMinimum Syst em Requirement s f or XenCent er Inst allat ion
ComponentComponent RequirementRequirement
Operating System Windows 7, Windows XP, Windows Server 2003, or Windows Vista
.NET framework Version 2.0 or later
CPU 750 megahertz (MHz), Recommended: 1 gigahertz (GHz) or faster
RAM 1 GB, Recommended: 2 GB
Network Interface Card 100 megabits per second (Mbps) or faster NIC
The number of NetScaler Insight Center instances that you can install depends on the memory available on the XenServer
server.
To inst all To inst all Net Scaler Insight Cent erNet Scaler Insight Cent er
1. Start XenCenter on your workstation.
2. On the Server menu, click Add.
3. In the Add New Server dialog box, in the Hostname text box, type the IP address or DNS name of the XenServer that
you want to connect to.
4. In the User Name and Password text boxes, type the administrator credentials set up during the XenServer installation,
and then click Add. The XenServer server name appears in the navigation pane with a green circle, which indicates that
the server is connected.
5. In the navigation pane, right-click the name of the XenServer server on which you want to install NetScaler Insight
Center, and then click Import.
6. In the Import dialog box, from the Import Source node, browse to the location where you saved the NetScaler Insight
Center .xva image f ile. Make sure that the Exported VM option is selected, and then click Next.
7. Select the XenServer server on which you want to install the virtual appliance, and then click Next.
8. Select the local storage repository in which to store the virtual appliance, and then click Import to begin the import
process.
Note: Citrix recommends using local storage repository to store the virtual appliance.
9. You can add, modify, or delete virtual network interfaces as required. When f inished, click Next.
10. Click Finish to complete the import process.
Note: To view the status of the import process, click the LogsLogs tab.
When the import is complete, the kernel reboots.
11. Select the ConsoleConsole tab to display the NetScaler Insight Center Initial Network Configuration options for specifying the

© 1999-2017 Citrix Systems, Inc. All rights reserved. p.28https://docs.citrix.com
initial IPv4 address, subnet mask (Netmask), and Gateway IP address for the NetScaler Insight Center virtual server.
Note: If the wizard closes and you want to update the network details, run the networkconfig command from the
command line interface.
12. If you want to install another NetScaler Insight Center virtual appliance, repeat steps 5 through 11.
* After provisioning NetScaler Insight Center, you cannot increase the amount of storage space allocated to it, even if
more space becomes available.
© 1999-2017 Citrix Systems, Inc. All rights reserved. p.29https://docs.citrix.com
Installing NetScaler Insight Center on VMware ESX
May 15, 2015
To install NetScaler Insight Center virtual appliances on VMware ESX, use VMware vSphere client.
This topic includes the following details:Prerequisites for Installing NetScaler Insight Center
Installation Procedure
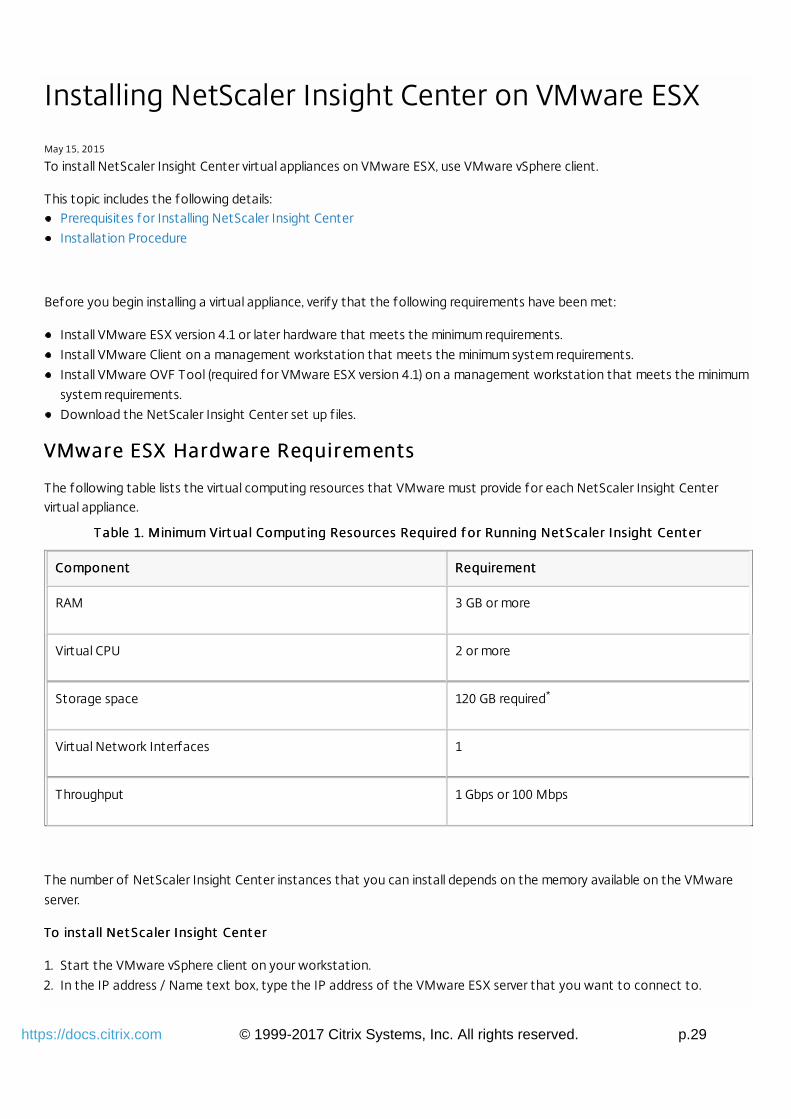
Before you begin installing a virtual appliance, verify that the following requirements have been met:
Install VMware ESX version 4.1 or later hardware that meets the minimum requirements.
Install VMware Client on a management workstation that meets the minimum system requirements.
Install VMware OVF Tool (required for VMware ESX version 4.1) on a management workstation that meets the minimum
system requirements.
Download the NetScaler Insight Center set up f iles.
VMware ESX Hardware RequirementsVMware ESX Hardware Requirements
The following table lists the virtual computing resources that VMware must provide for each NetScaler Insight Centervirtual appliance.
T able 1. T able 1. Minimum Virt ual Comput ing Resources Required f or Running Minimum Virt ual Comput ing Resources Required f or Running Net Scaler Insight Cent erNet Scaler Insight Cent er
ComponentComponent RequirementRequirement
RAM 3 GB or more
Virtual CPU 2 or more
Storage space 120 GB required
Virtual Network Interfaces 1
Throughput 1 Gbps or 100 Mbps
The number of NetScaler Insight Center instances that you can install depends on the memory available on the VMware
server.
To inst all To inst all Net Scaler Insight Cent erNet Scaler Insight Cent er
1. Start the VMware vSphere client on your workstation.
2. In the IP address / Name text box, type the IP address of the VMware ESX server that you want to connect to.
*
© 1999-2017 Citrix Systems, Inc. All rights reserved. p.30https://docs.citrix.com
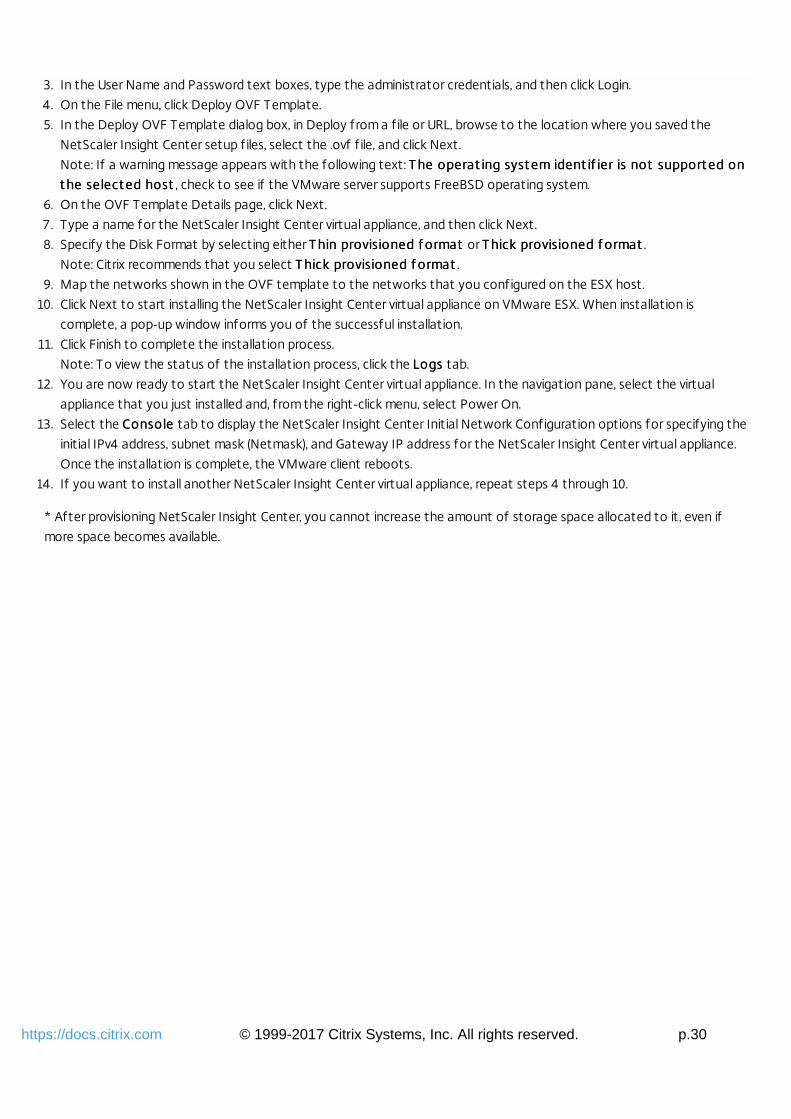
3. In the User Name and Password text boxes, type the administrator credentials, and then click Login.
4. On the File menu, click Deploy OVF Template.
5. In the Deploy OVF Template dialog box, in Deploy from a f ile or URL, browse to the location where you saved the
NetScaler Insight Center setup f iles, select the .ovf f ile, and click Next.
Note: If a warning message appears with the following text: T he operat ing syst em ident if ier is not support ed onT he operat ing syst em ident if ier is not support ed on
t he select ed hostt he select ed host , check to see if the VMware server supports FreeBSD operating system.
6. On the OVF Template Details page, click Next.
7. Type a name for the NetScaler Insight Center virtual appliance, and then click Next.
8. Specify the Disk Format by selecting either T hin provisioned f ormatT hin provisioned f ormat or T hick provisioned f ormatT hick provisioned f ormat .
Note: Citrix recommends that you select T hick provisioned f ormatT hick provisioned f ormat .
9. Map the networks shown in the OVF template to the networks that you configured on the ESX host.
10. Click Next to start installing the NetScaler Insight Center virtual appliance on VMware ESX. When installation is
complete, a pop-up window informs you of the successful installation.
11. Click Finish to complete the installation process.
Note: To view the status of the installation process, click the LogsLogs tab.
12. You are now ready to start the NetScaler Insight Center virtual appliance. In the navigation pane, select the virtual
appliance that you just installed and, from the right-click menu, select Power On.
13. Select the ConsoleConsole tab to display the NetScaler Insight Center Initial Network Configuration options for specifying the
initial IPv4 address, subnet mask (Netmask), and Gateway IP address for the NetScaler Insight Center virtual appliance.
Once the installation is complete, the VMware client reboots.
14. If you want to install another NetScaler Insight Center virtual appliance, repeat steps 4 through 10.
* After provisioning NetScaler Insight Center, you cannot increase the amount of storage space allocated to it, even if
more space becomes available.
© 1999-2017 Citrix Systems, Inc. All rights reserved. p.31https://docs.citrix.com
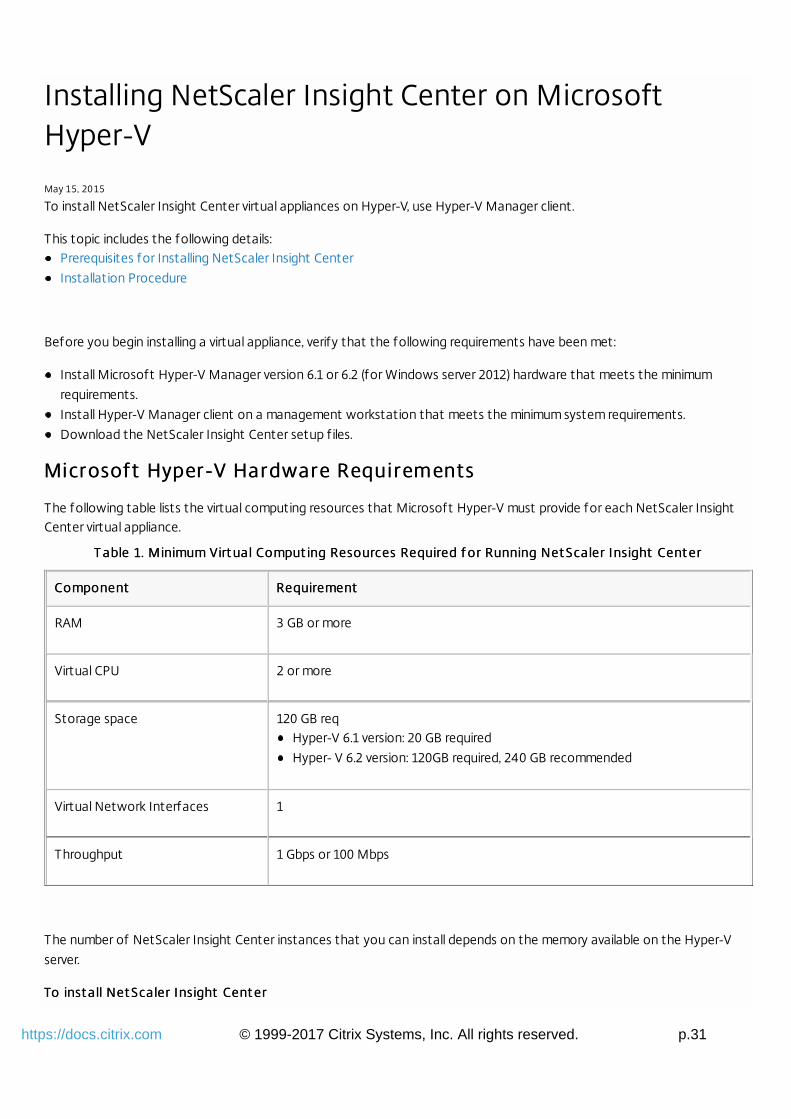
Installing NetScaler Insight Center on MicrosoftHyper-V
May 15, 2015
To install NetScaler Insight Center virtual appliances on Hyper-V, use Hyper-V Manager client.
This topic includes the following details:Prerequisites for Installing NetScaler Insight Center
Installation Procedure
Before you begin installing a virtual appliance, verify that the following requirements have been met:
Install Microsoft Hyper-V Manager version 6.1 or 6.2 (for Windows server 2012) hardware that meets the minimum
requirements.
Install Hyper-V Manager client on a management workstation that meets the minimum system requirements.
Download the NetScaler Insight Center setup f iles.
Microsoft Hyper-V Hardware RequirementsMicrosoft Hyper-V Hardware Requirements
The following table lists the virtual computing resources that Microsoft Hyper-V must provide for each NetScaler InsightCenter virtual appliance.
T able 1. T able 1. Minimum Virt ual Comput ing Resources Required f or Running Minimum Virt ual Comput ing Resources Required f or Running Net Scaler Insight Cent erNet Scaler Insight Cent er
ComponentComponent RequirementRequirement
RAM 3 GB or more
Virtual CPU 2 or more
Storage space 120 GB reqHyper-V 6.1 version: 20 GB required
Hyper- V 6.2 version: 120GB required, 240 GB recommended
Virtual Network Interfaces 1
Throughput 1 Gbps or 100 Mbps
The number of NetScaler Insight Center instances that you can install depends on the memory available on the Hyper-V
server.
To inst all To inst all Net Scaler Insight Cent erNet Scaler Insight Cent er
© 1999-2017 Citrix Systems, Inc. All rights reserved. p.32https://docs.citrix.com
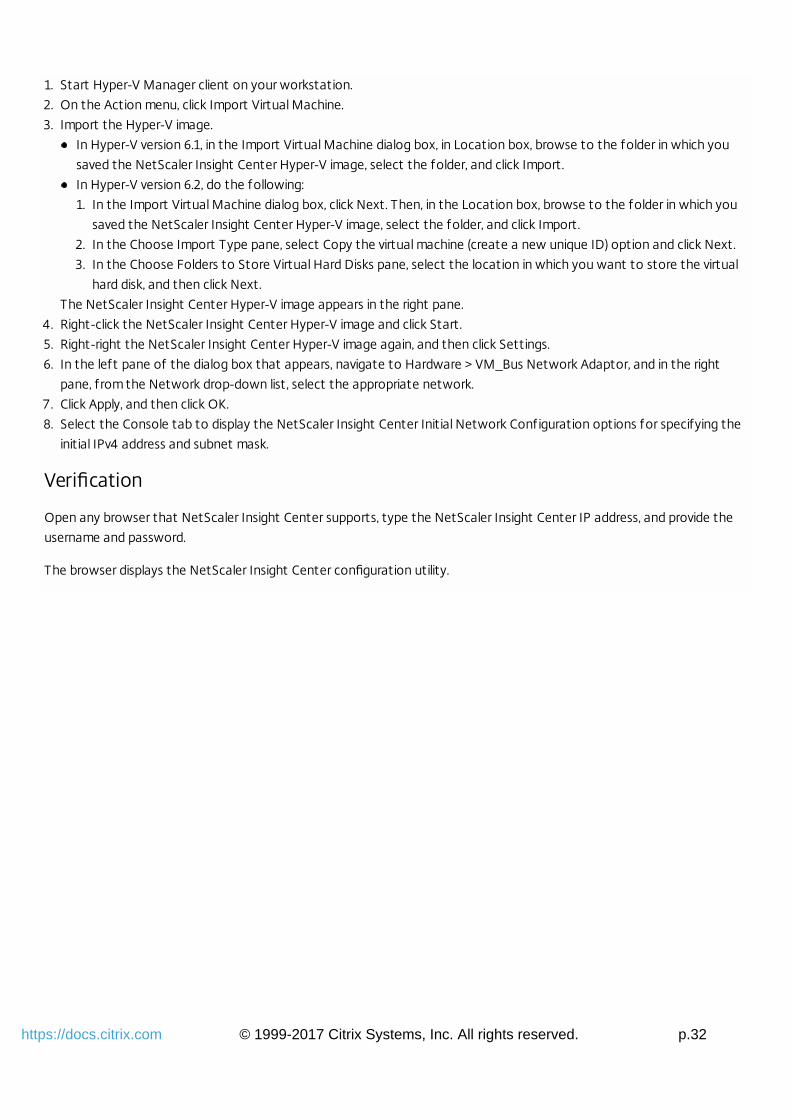
1. Start Hyper-V Manager client on your workstation.
2. On the Action menu, click Import Virtual Machine.
3. Import the Hyper-V image.
In Hyper-V version 6.1, in the Import Virtual Machine dialog box, in Location box, browse to the folder in which you
saved the NetScaler Insight Center Hyper-V image, select the folder, and click Import.
In Hyper-V version 6.2, do the following:
1. In the Import Virtual Machine dialog box, click Next. Then, in the Location box, browse to the folder in which you
saved the NetScaler Insight Center Hyper-V image, select the folder, and click Import.
2. In the Choose Import Type pane, select Copy the virtual machine (create a new unique ID) option and click Next.
3. In the Choose Folders to Store Virtual Hard Disks pane, select the location in which you want to store the virtual
hard disk, and then click Next.
The NetScaler Insight Center Hyper-V image appears in the right pane.
4. Right-click the NetScaler Insight Center Hyper-V image and click Start.
5. Right-right the NetScaler Insight Center Hyper-V image again, and then click Settings.
6. In the left pane of the dialog box that appears, navigate to Hardware > VM_Bus Network Adaptor, and in the right
pane, from the Network drop-down list, select the appropriate network.
7. Click Apply, and then click OK.
8. Select the Console tab to display the NetScaler Insight Center Initial Network Configuration options for specifying the
initial IPv4 address and subnet mask.
Verification
Open any browser that NetScaler Insight Center supports, type the NetScaler Insight Center IP address, and provide the
username and password.
The browser displays the NetScaler Insight Center configuration utility.
© 1999-2017 Citrix Systems, Inc. All rights reserved. p.33https://docs.citrix.com
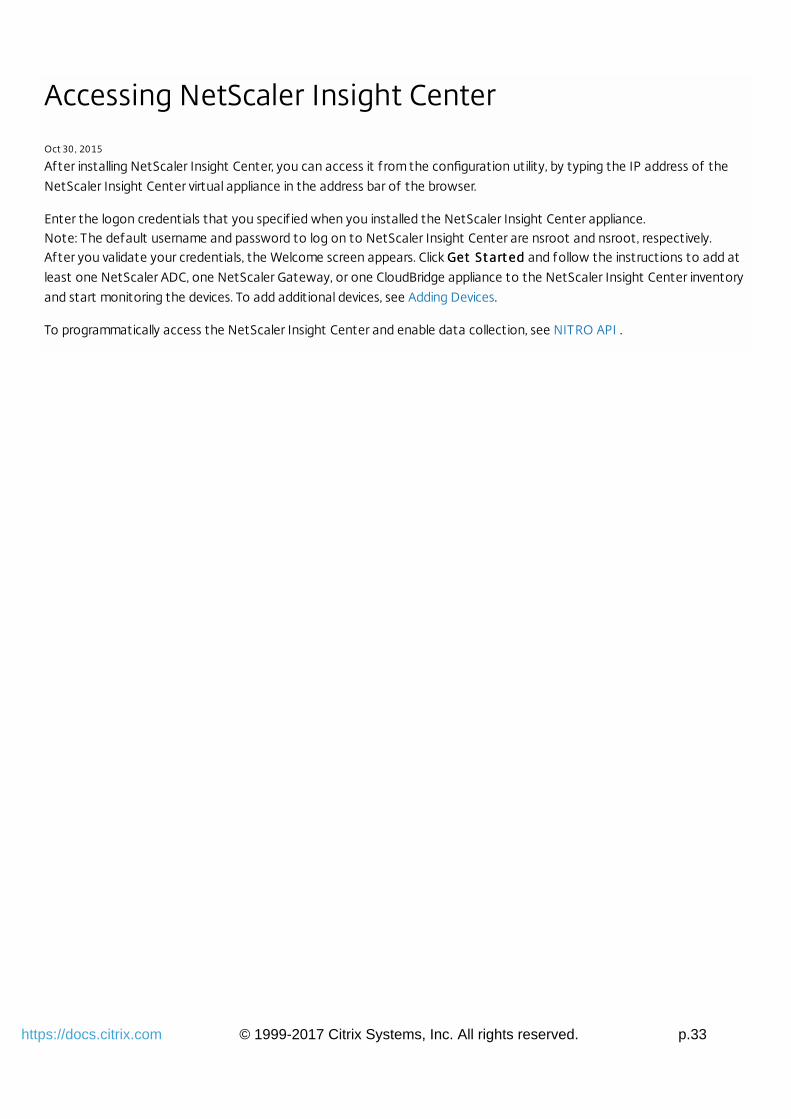
Accessing NetScaler Insight Center
Oct 30 , 2015
After installing NetScaler Insight Center, you can access it from the configuration utility, by typing the IP address of the
NetScaler Insight Center virtual appliance in the address bar of the browser.
Enter the logon credentials that you specif ied when you installed the NetScaler Insight Center appliance.Note: The default username and password to log on to NetScaler Insight Center are nsroot and nsroot, respectively.After you validate your credentials, the Welcome screen appears. Click Get St art edGet St art ed and follow the instructions to add at
least one NetScaler ADC, one NetScaler Gateway, or one CloudBridge appliance to the NetScaler Insight Center inventory
and start monitoring the devices. To add additional devices, see Adding Devices.
To programmatically access the NetScaler Insight Center and enable data collection, see NITRO API .
© 1999-2017 Citrix Systems, Inc. All rights reserved. p.34https://docs.citrix.com
Adding Devices
Sep 07, 2016
In addition to the NetScaler ADC, NetScaler Gateway, or CloudBridge appliance that you added to the inventory when you
accessed NetScaler Insight Center for the first time, you must add any additional appliances that you want to monitor.
Point s t o rememberPoint s t o remember
Only nCore NetScaler appliances running version software 9.3 or later can be added to the inventory. You cannot add
standalone Access Gateway appliances.
NetScaler Insight Center can monitor appliances in a high availability setup. Citrix recommends that you add both the
appliances (primary and secondary) to the NetScaler Insight Center appliance. When the primary appliance fails, the
secondary appliance generates the performance reports. You do not have to explicitly enable AppFlow on the secondary
appliance.
You cannot monitor a NetScaler cluster setup.
Make sure that both the NetScaler appliance and the NetScaler Insight Center appliance have either HTTP access or
HTTPS access enabled. For details about configurations, see "Configuring Security Settings" in Managing System
Settings.
Citrix recommends not adding a NetScaler appliance to the inventory if the appliance's user access level is set to read
only.
For a CloudBridge WAN Opt device type, enter the primary IP address of the CloudBridge appliance.
For a CloudBridge Enterprise device type, enter the primary IP address of the CloudBridge appliance.
To add a deviceTo add a device
1. On the Configuration tab, navigate to Inventory and click Add. All devices added to NetScaler Insight Center are shown
on the Invent oryInvent ory page.
2. Enter the source IP address from which the NetScaler or CloudBridge appliance sends AppFlow records. Also enter the
user name and password required for access to the device.
Points to Note:
If the NetScaler appliance uses a Subnet IP (SNIP) address as the source IP address for AppFlow records, specify that
the SNIP address as the NetScaler IP address.
Select the Gateway option if , in a double-hop setup, one of the appliances that you are adding is a NetScaler
Gateway. For details on double-hop mode, see NetScaler Insight Center in a NetScaler Gateway Double-Hop Mode.
3. Click Add.
Note: You can delete devices from the Inventory list by selecting the row that lists the NetScaler appliance and clicking
Delete.
When the appliance is added, information about the appliance appears in the Inventory list.
After you add the devices, you must enable data collection and then view reports on the NetScaler Insight Center
dashboard.
© 1999-2017 Citrix Systems, Inc. All rights reserved. p.35https://docs.citrix.com
Enabling Data Collection
Aug 22, 2014
You must enable data collection to start gathering information about the traffic flowing through the NetScaler ADCs or
CloudBridge appliances.
To monitor NetScaler ADCs, NetScaler Insight Center gathers metrics from load balancing, content switching, cache
redirection, and NetScaler Gateway virtual servers. To enable data collection, you must enable AppFlow on each virtual
server from which you want to collect data. When enabling AppFlow, you must specify policy expressions to identify the
traffic for which you want the NetScaler Insight Center virtual appliance to retrieve data. The NetScaler ADC then
generates AppFlow records for traffic that matches the expression.
For information on policy expressions, see Policies and Expressions.
When you enable data collection, NetScaler Insight Center starts collecting information about the applications represented
by the virtual servers and presents the collected information as performance reports on the dashboard.
To enable data collection on CloudBridge devices, you must enable AppFlow on the NetScaler Insight Center graphical user
interface for the required CloudBridge appliance. After you enable AppFlow, NetScaler Insight Center starts collecting the
information.
Point s t o rememberPoint s t o rememberMake sure that the services bound to the virtual servers also have AppFlow logging enabled.
The timestamp of the CloudBridge appliance must be in sync with the NTP server.
If you want to use NTP server time on the NetScaler Insight Center, make sure that you configure NTP before enabling
AppFlow on the CloudBridge appliances or virtual servers of the NetScaler ADCs. For information about synchronizing
the local time of an NetScaler Insight Center appliance with the NTP server, see Configuring an NTP Server.
Note:Web Insight supports HTTP, SSL and TCP virtual servers and HDX Insight supports VPN virtual servers.
If AppFlow is enabled for a virtual server on more than one NetScaler Insight Center virtual appliance, the one on which
the AppFlow was most recently enabled collects the information. For example, if AppFlow is enabled for virtual server
abcabc on a NetScaler Insight Center virtual appliance at 10.102.60.89 on 1/3/2013, and on 3/3/2013 AppFlow is enabled for
virtual server abcabc on another virtual appliance at 10.102.56.78, the virtual appliance at 10.102.60.89 stops retrieving
information from virtual server abcabc .
You cannot enable AppFlow from a NetScaler Insight Center for a NetScaler ADC or CloudBridge appliance on which
Appflow is already enabled for four AppFlow collectors. Each NetScaler insight Center functions as an AppFlow collector,
and you can put only four AppFlow collectors on one NetScaler ADC or on one CloudBridge appliance.
Citrix does not recommend adding IPv6 NetScaler appliances and virtual servers, or IPv6 CloudBridge appliances.
NetScaler Insight Center does not support IPv6.
Before enabling data collection on cache redirection servers, enable cache redirection on the NetScaler ADC.
If you enable cache redirection on any of the NetScaler ADCs listed in the inventory, the dashboard does not display
Applications node for Web insight. Instead, NetScaler Insight Center displays the reports for all the domains accessed by
the client.
© 1999-2017 Citrix Systems, Inc. All rights reserved. p.36https://docs.citrix.com
Enabling Web Insight Data Collection
Aug 21, 2014
When AppFlow is enabled for Web Insight data collection, the NetScaler Insight Center retrieves the performance reports
of web applications (load balancing and content switching virtual servers) that are bound to the NetScaler ADC.
To enable dat a collect ion on a virt ual server f or Web InsightTo enable dat a collect ion on a virt ual server f or Web Insight
1. On the Configuration tab, click Inventory.
2. From the inventory list, select the IP address of the ADC on which you want to enable data collection.
3. On the NetScaler Insight Center Inventory Setup screen, in the Application List pane, from the ViewView drop-down list,
select the type of virtual server (Load Balancing, Cache Redirection, or Content Switching).
Note: Before enabling data collection on cache redirection servers, enable cache redirection on the NetScaler ADC.
The virtual servers of the specified type populate a table that includes the following information:
IP Address— IP address of the virtual server
Name— Name of the virtual server
State— Current operational state of the virtual server. Can be UP or DOWN
Type— Service type of the virtual server
Insight— Data-collection status of the virtual server (ENABLED or DISABLED)
4. Select a virtual server for which you want to enable data collection.
Note: You can enable data collection on a virtual server only if the operational state of the virtual server is UP.
5. From the Action drop-down list, select Enable Appflow.
6. In the Enable AppFlow dialog box, from the Select Expression drop-down list, specify the traff ic to be f iltered by
selecting one of the available expressions or by manually typing the expression. You can also use multiple expressions by
using the logical operators AND (&&) or OR (||).
The following are examples of some expressions that can be used:
To collect information about HTTP requests where URL contains the word images, specify the expression
HTTP.REQ.URL.CONTAINS("images")
To collect information about HTTP virtual servers which have greater than 15000 connections, specify the expression
HTTP.REQ.LB_VSERVER.CONNECTIONS.GE(15000)
To collect information about HTTP requests where URL suff ix is not json and css, specify the expression
HTTP.REQ.URL.SUFFIX.EQ("json").NOT && HTTP.REQ.URL.SUFFIX.EQ("css").NOT
To collect information about HTTP requests where hostname contains the word abc.com and HTTP requests where
cookie contains the word JSESSIONID, specify the expression
HTTP.REQ.HOSTNAME.CONTAINS("abc.com")&&HTTP.REQ.COOKIE.CONTAINS("JSESSIONID")
To collect the information for all the traff ic that f lows through the virtual server, specify the expression true
For more information on expressions, see Policies and Expressions.
Note: After enabling data collection on a virtual server, if you want to edit the expression that you selected, select the
virtual server, and then select Edit AppFlow Expression from the Action drop-down list.
7. Select the HTML Injection check box. When this option is selected, the web insight reports will include information
about load time and render time, which is useful for comparing the performance of web applications.
Note: On NetScaler 10 appliances, the HTML Injection feature is available only for Platinum licenses. On NetScaler 10.1
appliances, it is available for all licenses.
© 1999-2017 Citrix Systems, Inc. All rights reserved. p.37https://docs.citrix.com
8. Click OK to save the configuration. If data collection is enabled, the Insight column in the Application List table for that
virtual server displays the word Enabled.
Note: If AppFlow logging is not enabled for the respective services or service groups on the NetScaler appliance, the
NetScaler Insight Center dashboard does not display the records, even if the Insight column shows Enabled.
9. To return to the inventory list, from the Action drop-down, select Return to Inventory list.
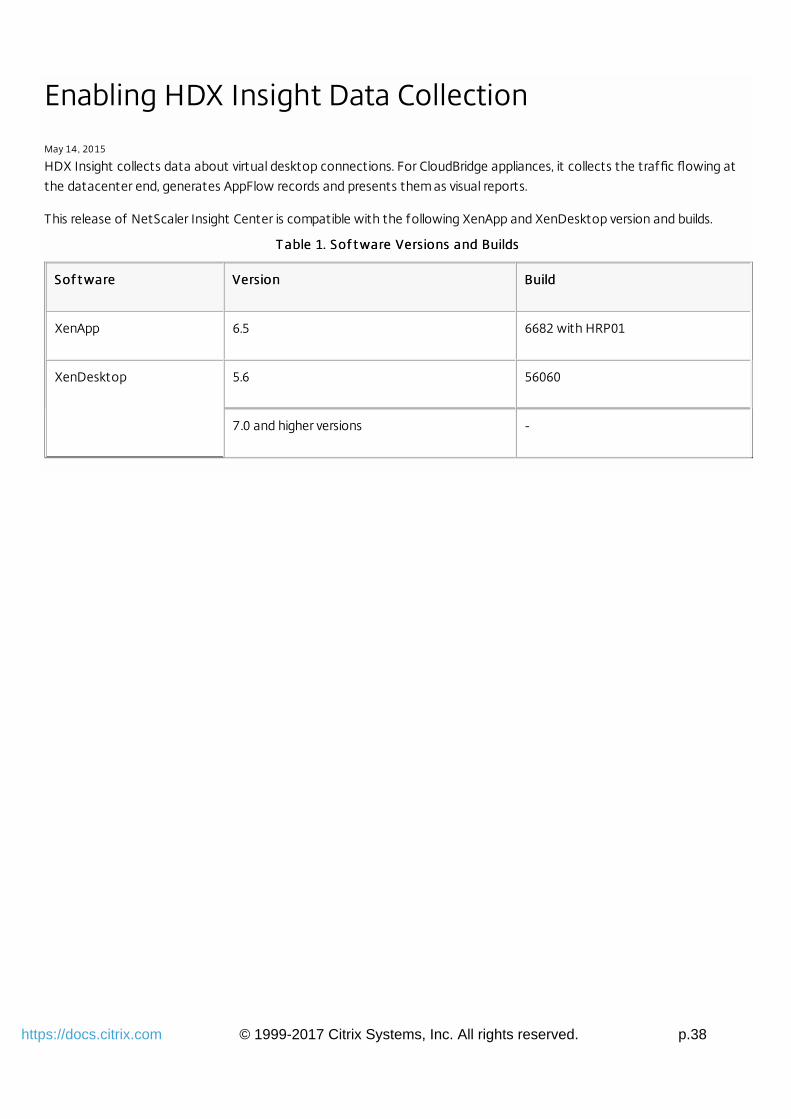
© 1999-2017 Citrix Systems, Inc. All rights reserved. p.38https://docs.citrix.com
Enabling HDX Insight Data Collection
May 14 , 2015
HDX Insight collects data about virtual desktop connections. For CloudBridge appliances, it collects the traffic flowing at
the datacenter end, generates AppFlow records and presents them as visual reports.
This release of NetScaler Insight Center is compatible with the following XenApp and XenDesktop version and builds.
T able 1. Sof t ware Versions and BuildsT able 1. Sof t ware Versions and Builds
Sof t wareSof t ware VersionVersion BuildBuild
XenApp 6.5 6682 with HRP01
XenDesktop 5.6 56060
7.0 and higher versions -
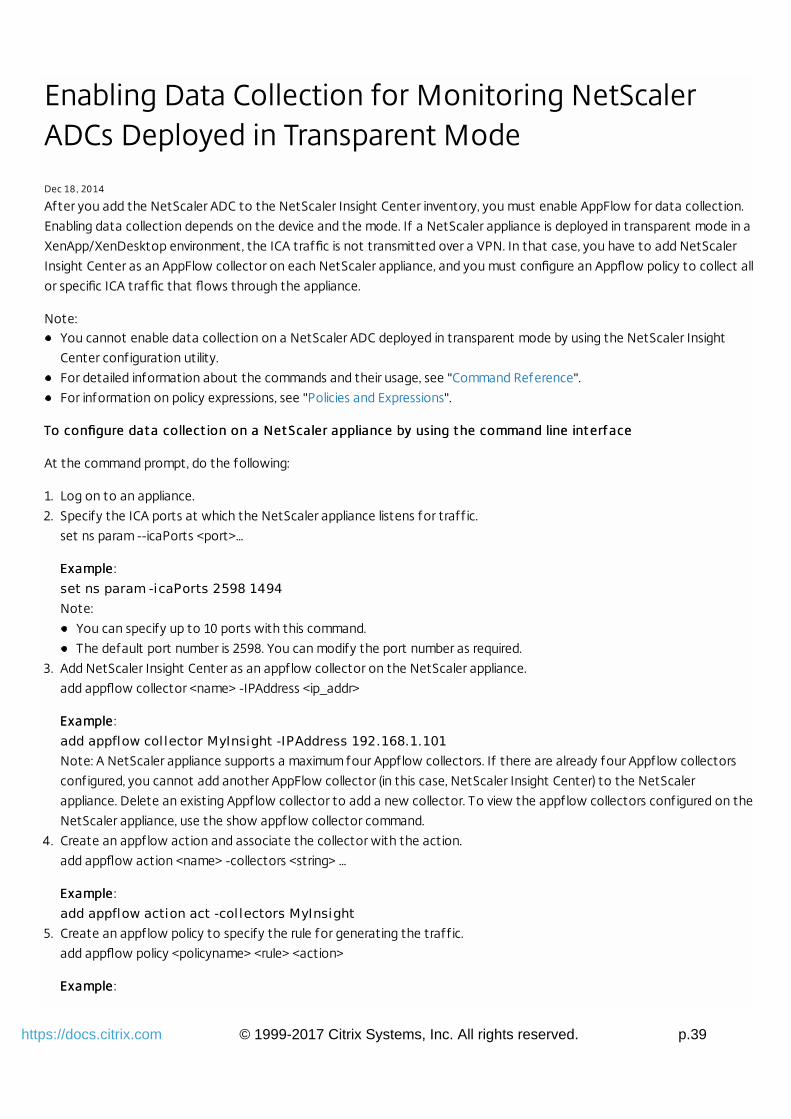
© 1999-2017 Citrix Systems, Inc. All rights reserved. p.39https://docs.citrix.com
Enabling Data Collection for Monitoring NetScalerADCs Deployed in Transparent Mode
Dec 18 , 2014
After you add the NetScaler ADC to the NetScaler Insight Center inventory, you must enable AppFlow for data collection.
Enabling data collection depends on the device and the mode. If a NetScaler appliance is deployed in transparent mode in a
XenApp/XenDesktop environment, the ICA traffic is not transmitted over a VPN. In that case, you have to add NetScaler
Insight Center as an AppFlow collector on each NetScaler appliance, and you must configure an Appflow policy to collect all
or specific ICA traffic that flows through the appliance.
Note:You cannot enable data collection on a NetScaler ADC deployed in transparent mode by using the NetScaler Insight
Center configuration utility.
For detailed information about the commands and their usage, see "Command Reference".
For information on policy expressions, see "Policies and Expressions".
To configure dat a To configure dat a collect ion on a Net Scaler appliance by using t he command line int erf acecollect ion on a Net Scaler appliance by using t he command line int erf ace
At the command prompt, do the following:
1. Log on to an appliance.
2. Specify the ICA ports at which the NetScaler appliance listens for traff ic.
set ns param --icaPorts <port>...
ExampleExample :
set ns param -icaPorts 2598 1494Note:
You can specify up to 10 ports with this command.
The default port number is 2598. You can modify the port number as required.
3. Add NetScaler Insight Center as an appflow collector on the NetScaler appliance.
add appflow collector <name> -IPAddress <ip_addr>
ExampleExample :
add appflow collector MyInsight -IPAddress 192.168.1.101Note: A NetScaler appliance supports a maximum four Appflow collectors. If there are already four Appflow collectors
configured, you cannot add another AppFlow collector (in this case, NetScaler Insight Center) to the NetScaler
appliance. Delete an existing Appflow collector to add a new collector. To view the appflow collectors configured on the
NetScaler appliance, use the show appflow collector command.
4. Create an appflow action and associate the collector with the action.
add appflow action <name> -collectors <string> ...
ExampleExample :
add appflow action act -collectors MyInsight5. Create an appflow policy to specify the rule for generating the traff ic.
add appflow policy <policyname> <rule> <action>
ExampleExample :
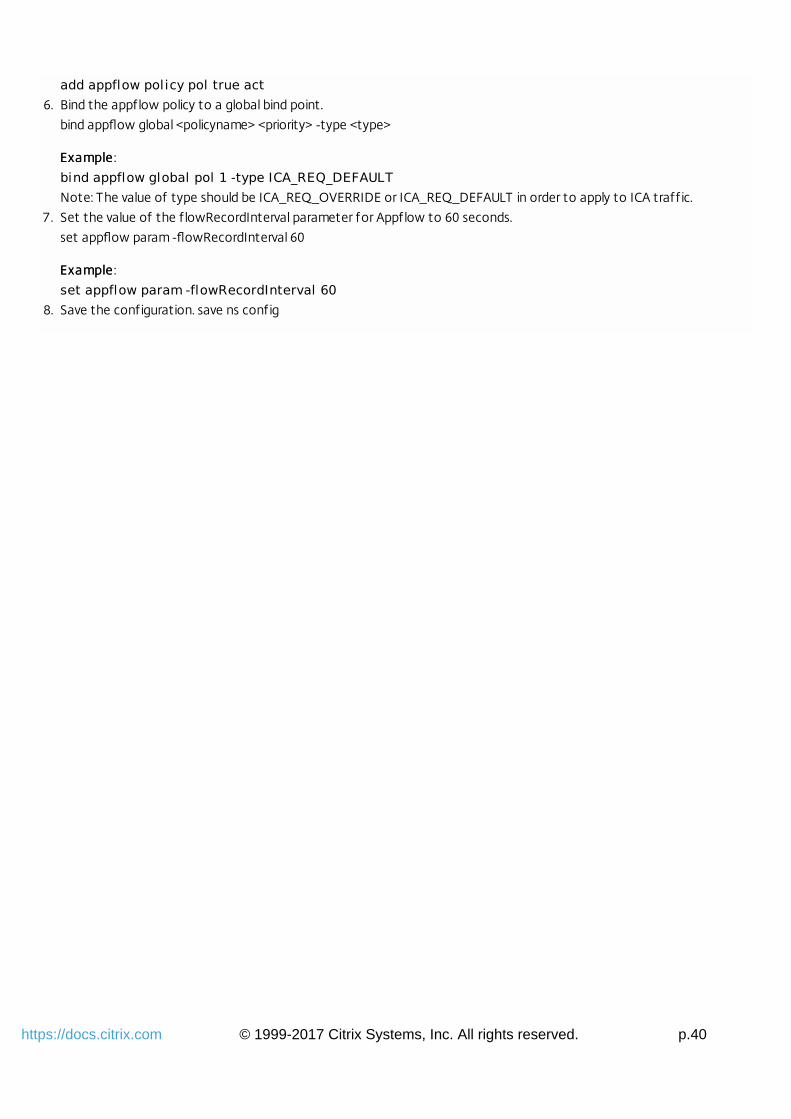
© 1999-2017 Citrix Systems, Inc. All rights reserved. p.40https://docs.citrix.com
add appflow policy pol true act6. Bind the appflow policy to a global bind point.
bind appflow global <policyname> <priority> -type <type>
ExampleExample :
bind appflow global pol 1 -type ICA_REQ_DEFAULTNote: The value of type should be ICA_REQ_OVERRIDE or ICA_REQ_DEFAULT in order to apply to ICA traff ic.
7. Set the value of the f lowRecordInterval parameter for Appflow to 60 seconds.
set appflow param -flowRecordInterval 60
ExampleExample :
set appflow param -flowRecordInterval 608. Save the configuration. save ns config
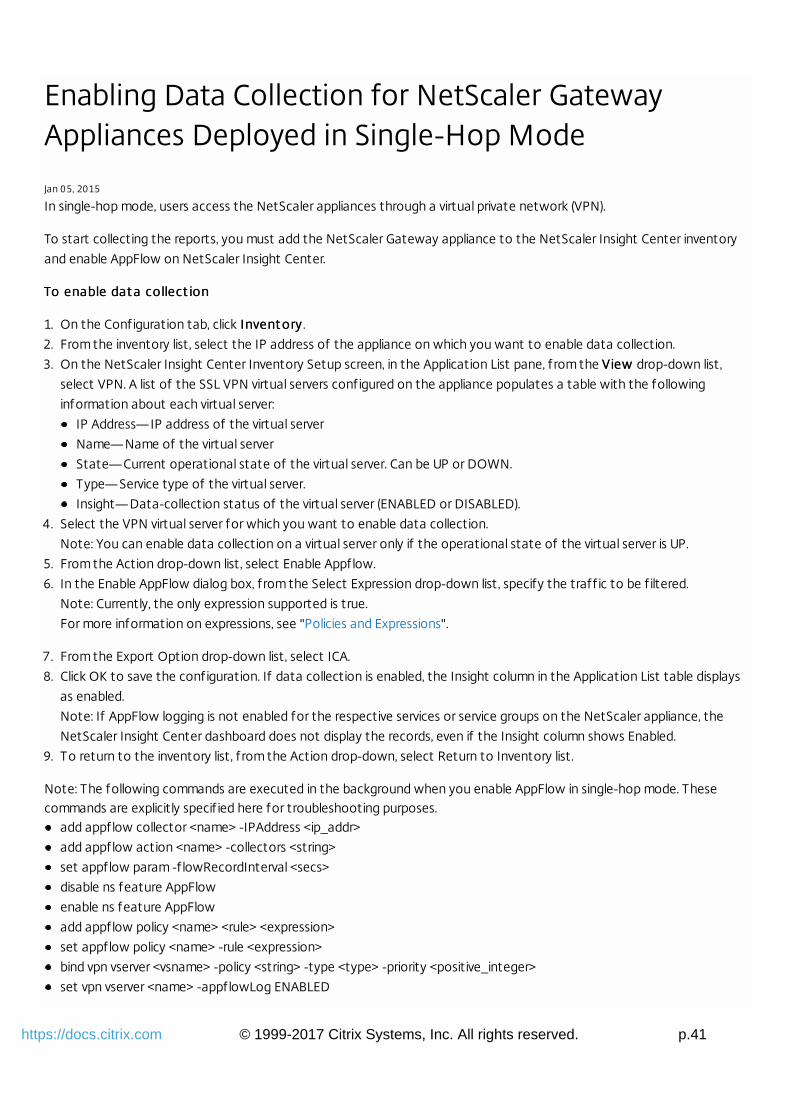
© 1999-2017 Citrix Systems, Inc. All rights reserved. p.41https://docs.citrix.com
Enabling Data Collection for NetScaler GatewayAppliances Deployed in Single-Hop Mode
Jan 05, 2015
In single-hop mode, users access the NetScaler appliances through a virtual private network (VPN).
To start collecting the reports, you must add the NetScaler Gateway appliance to the NetScaler Insight Center inventory
and enable AppFlow on NetScaler Insight Center.
To enable dat a collect ionTo enable dat a collect ion
1. On the Configuration tab, click Invent ory Invent ory .
2. From the inventory list, select the IP address of the appliance on which you want to enable data collection.
3. On the NetScaler Insight Center Inventory Setup screen, in the Application List pane, from the ViewView drop-down list,
select VPN. A list of the SSL VPN virtual servers configured on the appliance populates a table with the following
information about each virtual server:
IP Address— IP address of the virtual server
Name— Name of the virtual server
State— Current operational state of the virtual server. Can be UP or DOWN.
Type— Service type of the virtual server.
Insight— Data-collection status of the virtual server (ENABLED or DISABLED).
4. Select the VPN virtual server for which you want to enable data collection.
Note: You can enable data collection on a virtual server only if the operational state of the virtual server is UP.
5. From the Action drop-down list, select Enable Appflow.
6. In the Enable AppFlow dialog box, from the Select Expression drop-down list, specify the traff ic to be f iltered.
Note: Currently, the only expression supported is true.
For more information on expressions, see "Policies and Expressions".
7. From the Export Option drop-down list, select ICA.
8. Click OK to save the configuration. If data collection is enabled, the Insight column in the Application List table displays
as enabled.
Note: If AppFlow logging is not enabled for the respective services or service groups on the NetScaler appliance, the
NetScaler Insight Center dashboard does not display the records, even if the Insight column shows Enabled.
9. To return to the inventory list, from the Action drop-down, select Return to Inventory list.
Note: The following commands are executed in the background when you enable AppFlow in single-hop mode. Thesecommands are explicitly specif ied here for troubleshooting purposes.
add appflow collector <name> -IPAddress <ip_addr>
add appflow action <name> -collectors <string>
set appflow param -f lowRecordInterval <secs>
disable ns feature AppFlow
enable ns feature AppFlow
add appflow policy <name> <rule> <expression>
set appflow policy <name> -rule <expression>
bind vpn vserver <vsname> -policy <string> -type <type> -priority <positive_integer>
set vpn vserver <name> -appflowLog ENABLED

© 1999-2017 Citrix Systems, Inc. All rights reserved. p.42https://docs.citrix.com
save ns config
© 1999-2017 Citrix Systems, Inc. All rights reserved. p.43https://docs.citrix.com
Enabling Data Collection for NetScaler GatewayAppliances Deployed in Double-Hop Mode
May 13, 2015
To enable data collection you must perform the following operations:Enable data collection on NetScaler Insight Center to start gathering the traff ic information
Configure NetScaler Gateway appliances to export the data
If you enable NetScaler Insight Center to start collecting the ICA details from both the appliances, the details collected are
redundant. That is both the appliances report the same metrics. To overcome this situation, you must enable AppFlow for
ICA on one of the first NetScaler Gateway appliance, and then enable AppFlow for TCP on the second appliance. By doing
so, one of the appliances export ICA AppFlow records and the other appliance exports TCP AppFlow records. This also
saves the processing time on parsing the ICA traffic.
To enable dat a collect ion f or ICA t raf ficTo enable dat a collect ion f or ICA t raf fic
1. On the Configuration tab, click Invent ory Invent ory .
2. From the inventory list, select the IP address of the appliance on which you want to enable data collection.
3. On the NetScaler Insight Center Inventory Setup screen, in the Application List pane, from the ViewView drop-down list,
select VPN. A list of the SSL VPN virtual servers configured on the appliance populates a table with the following
information about each virtual server:
IP Address— IP address of the virtual server
Name— Name of the virtual server
State— Current operational state of the virtual server. Can be UP or DOWN.
Type— Service type of the virtual server.
Insight— Data-collection status of the virtual server (ENABLED or DISABLED).
4. Select the SSL VPN virtual server for which you want to enable data collection.
Note: You can enable data collection on a virtual server only if the operational state of the virtual server is UP.
5. From the Action drop-down list, select Enable Appflow.
6. In the Enable AppFlow dialog box, from the Select Expression drop-down list, specify the traff ic to be f iltered.
Note: Currently, the only expression supported is true.
For more information on expressions, see Policies and Expressions.
7. From the Export Option drop-down list, select ICA.
8. Click OK to save the configuration. If data collection is enabled, the Insight column in the Application List table displays
as enabled.
Note: If AppFlow logging is not enabled for the respective services or service groups on the NetScaler appliance, the
NetScaler Insight Center dashboard does not display the records, even if the Insight column shows Enabled.
9. To return to the inventory list, from the Action drop-down, select Return to Inventory list.
To enable data collection for TCP traffic
1. On the Configuration tab, click Invent ory Invent ory .
© 1999-2017 Citrix Systems, Inc. All rights reserved. p.44https://docs.citrix.com
2. From the inventory list, select the IP address of the appliance on which you want to enable data collection.
3. On the NetScaler Insight Center Inventory Setup screen, in the Application List pane, from the ViewView drop-down list,
select VPN. A list of the SSL VPN virtual servers configured on the appliance populates a table with the following
information about each virtual server:
IP Address— IP address of the virtual server
Name— Name of the virtual server
State— Current operational state of the virtual server. Can be UP or DOWN.
Type— Service type of the virtual server.
Insight— Data-collection status of the virtual server (ENABLED or DISABLED).
4. Select the SSL VPN virtual server for which you want to enable data collection.
Note: You can enable data collection on a virtual server only if the operational state of the virtual server is UP.
5. From the Action drop-down list, select Enable Appflow.
6. In the Enable AppFlow dialog box, from the Select Expression drop-down list, specify the traff ic to be f iltered.
Note: Currently, the only expression supported is true.
For more information on expressions, see Policies and Expressions.
7. From the Export Option drop-down list, select TCP.
8. Click OK to save the configuration. If data collection is enabled, the Insight column in the Application List table displays
as enabled.
Note: If AppFlow logging is not enabled for the respective services or service groups on the NetScaler appliance, the
NetScaler Insight Center dashboard does not display the records, even if the Insight column shows Enabled.
9. To return to the inventory list, from the Action drop-down, select Return to Inventory list.
After you install the NetScaler Gateway appliances, you must configure the following settings on the NetScaler gateway
appliances to export the reports to NetScaler Insight Center:
Configure virtual servers of the NetScaler Gateway appliances in the f irst and second DMZ to communicate with each
other.
Bind the NetScaler Gateway virtual server in the second DMZ to the NetScaler Gateway virtual server in the f irst DMZ.
Enable double hop on the NetScaler Gateway in the second DMZ.
Disable authentication on the NetScaler Gateway virtual server in the second DMZ.
Enable one of the NetScaler Gateway appliances to export ICA records
Enable the other NetScaler Gateway appliance to export TCP records:
Enable connection chaining on both the NetScaler Gateway appliances.
Configuring Net Scaler Gat eway Using t he command line int erf aceConfiguring Net Scaler Gat eway Using t he command line int erf ace
1. Configure the NetScaler Gateway virtual server in the f irst DMZ to communicate with the NetScaler Gateway virtual
server in the second DMZ.
add vpn nextHopServer <name> <nextHopIP> <nextHopPort> [-secure (ON|OFF)] [-imgGifToPng] ...
add vpn nextHopServer nh1 10.102.2.33 8443 –secure ON 2. Bind the NetScaler Gateway virtual server in the second DMZ to the NetScaler Gateway virtual server in the f irst DMZ.
Run the following command on the NetScaler Gateway in the f irst DMZ:
bind vpn vserver <name> -nextHopServer <name>
bind vpn vserver vs1 -nextHopServer nh1
© 1999-2017 Citrix Systems, Inc. All rights reserved. p.45https://docs.citrix.com
3. Enable double hop and AppFlow on the NetScaler Gateway in the second DMZ.
set vpn vserver <name> [- doubleHop ( ENABLED |DISABLED )] [- appflowLog ( ENABLED |DISABLED )]
set vpn vserver vpnhop2 –doubleHop ENABLED –appFlowLog ENABLED4. Disable authentication on the NetScaler Gateway virtual server in the second DMZ.
set vpn vserver <name> [-authentication (ON|OFF)]
set vpn vserver vs -authentication OFF5. Enable one of the NetScaler Gateway appliances to export TCP records.
bind vpn vserver <name> [-policy <string> -priority <positive_integer>] [-type <type>]
bind vpn vserver vpn1 -policy appflowpol1 -priority 101 –type OTHERTCP_REQUEST6. Enable the other NetScaler Gateway appliance to export ICA records:
bind vpn vserver <name> [-policy <string> -priority <positive_integer>] [-type <type>]
bind vpn vserver vpn2 -policy appflowpol1 -priority 101 -type ICA_REQUEST7. Enable connection chaining on both the NetScaler Gateway appliances:
set appFlow param [-connectionChaining (ENABLED|DISABLED)]
set appflow param -connectionChaining ENABLED.
Configuring NetScaler Gateway Using the configuration utility
1. Configure the NetScaler Gateway in the f irst DMZ to communicate with the NetScaler Gateway in the second DMZ
and bind the NetScaler Gateway in the second DMZ to the NetScaler Gateway in the f irst DMZ.
1. On the Configuration tab expand NetScaler Gateway and click Virtual Servers.
2. In the right pane, double- click the virtual server, and in the Advanced group, expand Published Applications.
3. Click Next Hop Server and bind a next hop server to the second NetScaler Gateway appliance.
2. Enable double hop on the NetScaler Gateway in the second DMZ.
1. On the Configuration tab expand NetScaler Gateway and click Virtual Servers.
2. In the right pane, double- click the virtual server, and in the Basic Settings group, click the edit icon.
3. Expand More , select Double Hop and click OK.
3. Disable authentication on the virtual server on the NetScaler Gateway in the second DMZ.
1. On the Configuration tab expand NetScaler Gateway and click Virtual Servers.
2. In the right pane, double- click the virtual server, and in the Basic Settings group, click the edit icon.
3. Expand More, and uncheck Enable Authentication.
4. Enable one of the NetScaler Gateway appliance to export TCP records.
1. On the Configuration tab expand NetScaler Gateway and click Virtual Servers.
2. In the right pane, double- click the virtual server, and in the Advanced group, expand Policies.
3. Click the + icon and in the from the Choose Policy drop-down list, select AppFlow and from the Choose Type drop-
down list, select Other TCP Request.
4. Click Continue.
5. Add a policy binding, and click Close.
5. Enable the other NetScaler Gateway appliance to export ICA records:
1. On the Configuration tab expand NetScaler Gateway and click Virtual Servers.
2. In the right pane, double- click the virtual server, and in the Advanced group, expand Policies.
3. Click the + icon and in the from the Choose Policy drop-down list, select AppFlow and from the Choose Type drop-
© 1999-2017 Citrix Systems, Inc. All rights reserved. p.46https://docs.citrix.com
down list, select Other TCP Request.
4. Click Continue.
5. Add a policy binding, and click Close.
6. Enable connection chaining on both the NetScaler Gateway appliances.
1. On the Configuration tab, navigate to System > Appflow.
2. In the right Pane, in the Settings group, click on Change Appflow Settings.
3. Select Connection Chaining and Click OK.
© 1999-2017 Citrix Systems, Inc. All rights reserved. p.47https://docs.citrix.com
Enabling Data Collection for Monitoring NetScalerADCs Deployed in LAN User Mode
Apr 13, 2015
Note: This feature is available in release 10.5 build 57.7 and later.
After you add the NetScaler appliance to the NetScaler Insight Center inventory, you must enable AppFlow for data
collection.
Note:You cannot enable data collection on a NetScaler ADC deployed in LAN User mode by using the NetScaler Insight Center
configuration utility.
For detailed information about the commands and their usage, see "Command Reference".
For information on policy expressions, see "Policies and Expressions".
To configure dat a collect ion on a Net Scaler appliance by using t he command line int erf aceTo configure dat a collect ion on a Net Scaler appliance by using t he command line int erf ace
At the command prompt, do the following:
1. Log on to an appliance.
2. Add a forward proxy cache redirection virtual server with the proxy IP and port, and specify the service type as HDX.
add cr vserver <name> <servicetype> [<ipaddress> <port>] [-cacheType <cachetype>] [ - cltT imeout <secs>]
ExampleExample
add cr vserver cr1 HDX 10.12.2.2 443 –cacheType FORWARD –cltTimeout 180Note: If you are accessing the LAN network by using a NetScaler Gateway appliance, add an action to be applied by a
policy that matches the VPN traff ic.
add vpn trafficAction <name> <qual> [-HDX ( ON | OFF )]
add vpn trafficPolicy <name> <rule> <action
ExampleExample
add vpn trafficAction act1 tcp -HDX ON >add vpn trafficPolicy pol1 "REQ.IP.DESTIP == 10.102.69.17" act1
3. Add NetScaler Insight Center as an appflow collector on the NetScaler appliance.
add appflow collector <name> -IPAddress <ip_addr>
ExampleExample :
add appflow collector MyInsight -IPAddress 192.168.1.101Note: A NetScaler appliance supports a maximum four Appflow collectors. If there are already four Appflow collectors
configured, you cannot add another AppFlow collector (in this case, NetScaler Insight Center) to the NetScaler
appliance. Delete an existing Appflow collector to add a new collector. To view the appflow collectors configured on the
NetScaler appliance, use the show appflow collector command.
4. Create an appflow action and associate the collector with the action.
add appflow action <name> -collectors <string> ...
ExampleExample :
© 1999-2017 Citrix Systems, Inc. All rights reserved. p.48https://docs.citrix.com
add appflow action act -collectors MyInsight5. Create an appflow policy to specify the rule for generating the traff ic.
add appflow policy <policyname> <rule> <action>
ExampleExample :
add appflow policy pol true act6. Bind the appflow policy to a global bind point.
bind appflow global <policyname> <priority> -type <type>
ExampleExample :
bind appflow global pol 1 -type ICA_REQ_DEFAULTNote: The value of type should be ICA_REQ_OVERRIDE or ICA_REQ_DEFAULT in order to apply to ICA traff ic.
7. Set the value of the f lowRecordInterval parameter for Appflow to 60 seconds.
set appflow param -flowRecordInterval 60
ExampleExample :
set appflow param -flowRecordInterval 608. Save the configuration. save ns config
9. Edit the “default.ica” f ile of the store that is used to launch applications and desktops. The f ile is located at
"C:\inetpub\wwwroot\Citrix\<Store>\App_Data”. Add the following configuration in the WFClient and Application
section.
1. ProxyType=Socks
2. ProxyHost=<crvserver IP>:<Port>
3. ICASOCKSProtocolVersion=0
4. ICASOCKSProxyHost=<crvserver>
5. ICASOCKSProxyPortNumber=<Port>
© 1999-2017 Citrix Systems, Inc. All rights reserved. p.49https://docs.citrix.com
Enabling Data Collection for CloudBridge DatacenterAppliances
May 12, 2015
After you add the CloudBridge appliance to the inventory, you must enable AppFlow on NetScaler Insight Center to start
collecting the reports.
To enable dat a collect ion To enable dat a collect ion f or CloudBridge appliancesf or CloudBridge appliances
1. On the Configuration tab, click Invent ory Invent ory .
2. From the inventory list, select the IP address of the CloudBridge appliance on which you want to enable data collection.
3. On the Configure CloudBridge screen, select AppFlow to enable data collection, and choose HDX, to collect information
for ICA traff ic.
© 1999-2017 Citrix Systems, Inc. All rights reserved. p.50https://docs.citrix.com
Enabling Data Collection for Monitoring CloudBridgeDatacenter Appliances and Branch Appliances
May 12, 2015
After you add the CloudBridge appliance to the inventory, you must enable AppFlow on NetScaler Insight Center to start
collecting the reports.
On t he branch appliancesOn t he branch appliances
1. On the Configuration tab, click Invent ory Invent ory .
2. From the inventory list, select the IP address of the CloudBridge appliance on which you want to enable data collection.
3. On the Configure CloudBridge screen, select AppFlow to enable data collection, and choose TCP for HDX to collect
information for ICA traff ic.
On t he dat acent er applianceOn t he dat acent er appliance
1. On the Configuration tab, click Invent ory Invent ory .
2. From the inventory list, select the IP address of the CloudBridge appliance on which you want to enable data collection.
3. On the Configure CloudBridge screen, select AppFlow to enable data collection, and choose TCP for WANOpt, HDX, and
TCP for HDX to collect information for ICA traff ic.
© 1999-2017 Citrix Systems, Inc. All rights reserved. p.51https://docs.citrix.com
Enabling Data Collection for Monitoring CloudBridgePlug-Ins
May 12, 2015
After you add the CloudBridge appliance to the inventory, you must enable AppFlow on NetScaler Insight Center to start
collecting the reports.
On t he branch applianceOn t he branch appliance
1. On the Configuration tab, click Invent ory Invent ory .
2. From the inventory list, select the IP address of the CloudBridge appliance on which you want to enable data collection.
3. On the Configure CloudBridge screen, select AppFlow to enable data collection, and choose TCP for HDX to collect
information for ICA traff ic.
On t he dat acent er applianceOn t he dat acent er appliance
1. On the Configuration tab, click Invent ory Invent ory .
2. From the inventory list, select the IP address of the CloudBridge appliance on which you want to enable data collection.
3. On the Configure CloudBridge screen, select AppFlow to enable data collection, and choose TCP for WANOpt, HDX, and
TCP for HDX to collect information for ICA traff ic.
© 1999-2017 Citrix Systems, Inc. All rights reserved. p.52https://docs.citrix.com
Enabling Data Collection for Monitoring CloudBridgeAppliances and NetScaler Gateway Appliances inSingle-Hop Mode
May 12, 2015
After you add the CloudBridge appliance to the inventory, you must enable AppFlow on NetScaler Insight Center to start
collecting the reports.
On t he branch applianceOn t he branch appliance
1. On the Configuration tab, click Invent ory Invent ory .
2. From the inventory list, select the IP address of the CloudBridge appliance on which you want to enable data collection.
3. On the Configure CloudBridge screen, select AppFlow to enable data collection, and choose TCP for HDX to collect
information for ICA traff ic.
On t he dat acent er applianceOn t he dat acent er appliance
1. On the Configuration tab, click Invent ory Invent ory .
2. From the inventory list, select the IP address of the CloudBridge appliance on which you want to enable data collection.
3. On the Configure CloudBridge screen, select AppFlow to enable data collection, and choose TCP for WANOpt, HDX, and
TCP for HDX to collect information for ICA traff ic.
On t he Net Scaler Gat eway applianceOn t he Net Scaler Gat eway appliance
1. On the Configuration tab, click Invent oryInvent ory .
2. From the inventory list, select the IP address of the NetScaler Gateway appliance on which you want to enable data
collection.
3. On the NetScaler Insight Center Inventory Setup screen, in the Application List pane, from the View drop-down list,
select VPN.
4. Select the VPN virtual server for which you want to enable data collection.
5. From the Action drop-down list, select Enable Appflow.
6. In the Enable AppFlow dialog box, from the Select Expression drop-down list, specify the traff ic to be f iltered.
7. From the Export Option drop-down list, select ICA.
8. Click OK to save the configuration. If data collection is enabled, the Insight column in the Application List table shows
that NetScaler Insight Center is enabled.
Note: If AppFlow logging is not enabled for the respective services or service groups on the NetScaler appliance, the
NetScaler Insight Center dashboard does not display the records, even if Enabled appears in the Insight column.
9. To return to the inventory list, from the Action drop-down, select Return to Inventory list.
Enabling Connect ion Chaining on CloudBridge AppliancesEnabling Connect ion Chaining on CloudBridge Appliances
If the network topology includes both CloudBridge and NetScaler Gateway appliances, you must enable connection
chaining on the CloudBridge appliances.
To enable connect ion chaining by using t he command line int erf aceTo enable connect ion chaining by using t he command line int erf ace
1. Enable connection chaining
© 1999-2017 Citrix Systems, Inc. All rights reserved. p.53https://docs.citrix.com
enable connection-chaining
ExampleExample :
Admin> enable connection-chaining Done admin> show connection-chaining Connection Chaining : on Done admin> disable connection-chaining Done admin> show connection-chaining Connection Chaining : off Done
To enable connect ion chaining by using t he consoleTo enable connect ion chaining by using t he console
> Tcp.ConnectionChaining Tcp.ConnectionChaining off > Tcp.ConnectionChaining on > Tcp.ConnectionChaining Tcp.ConnectionChaining on
© 1999-2017 Citrix Systems, Inc. All rights reserved. p.54https://docs.citrix.com
Enabling Data Collection for Monitoring CloudBridgeAppliances and NetScaler Gateway Appliances inDouble-Hop Mode
May 12, 2015
After you add the CloudBridge appliance to the inventory, you must enable AppFlow on NetScaler Insight Center to start
collecting the reports.
On t he branch applianceOn t he branch appliance
1. On the Configuration tab, click Invent ory Invent ory .
2. From the inventory list, select the IP address of the CloudBridge appliance on which you want to enable data collection.
3. On the Configure CloudBridge screen, select AppFlow to enable data collection, and choose TCP for HDX to collect
information for ICA traff ic.
On t he dat acent er applianceOn t he dat acent er appliance
1. On the Configuration tab, click Invent ory Invent ory .
2. From the inventory list, select the IP address of the CloudBridge appliance on which you want to enable data collection.
3. On the Configure CloudBridge screen, select AppFlow to enable data collection, and choose TCP for WANOpt, HDX, and
TCP for HDX to collect information for ICA traff ic.
On t he Net Scaler Gat eway applianceOn t he Net Scaler Gat eway appliance
If you enable NetScaler Insight Center to start collecting the ICA details from both the NetScaler Gateway appliances the
collected details are redundant. That is, both appliances report the same metrics. To correct this situation, enable AppFlow
for ICA on the first NetScaler Gateway appliance, and then enable AppFlow for TCP on the second appliance. One
appliance then exports ICA AppFlow records, and the other exports TCP AppFlow records. This arrangement also reduces
processing time for parsing the ICA traffic.
Enabling Connect ion Chaining on CloudBridge AppliancesEnabling Connect ion Chaining on CloudBridge Appliances
If the network topology includes both CloudBridge and NetScaler Gateway appliances, you must enable connection
chaining on the CloudBridge appliances.
To enable connect ion chaining by using t he command line int erf aceTo enable connect ion chaining by using t he command line int erf ace
1. Enable connection chaining
enable connection-chaining
ExampleExample :
Admin> enable connection-chaining Done admin> show connection-chaining Connection Chaining : on Done admin> disable connection-chaining
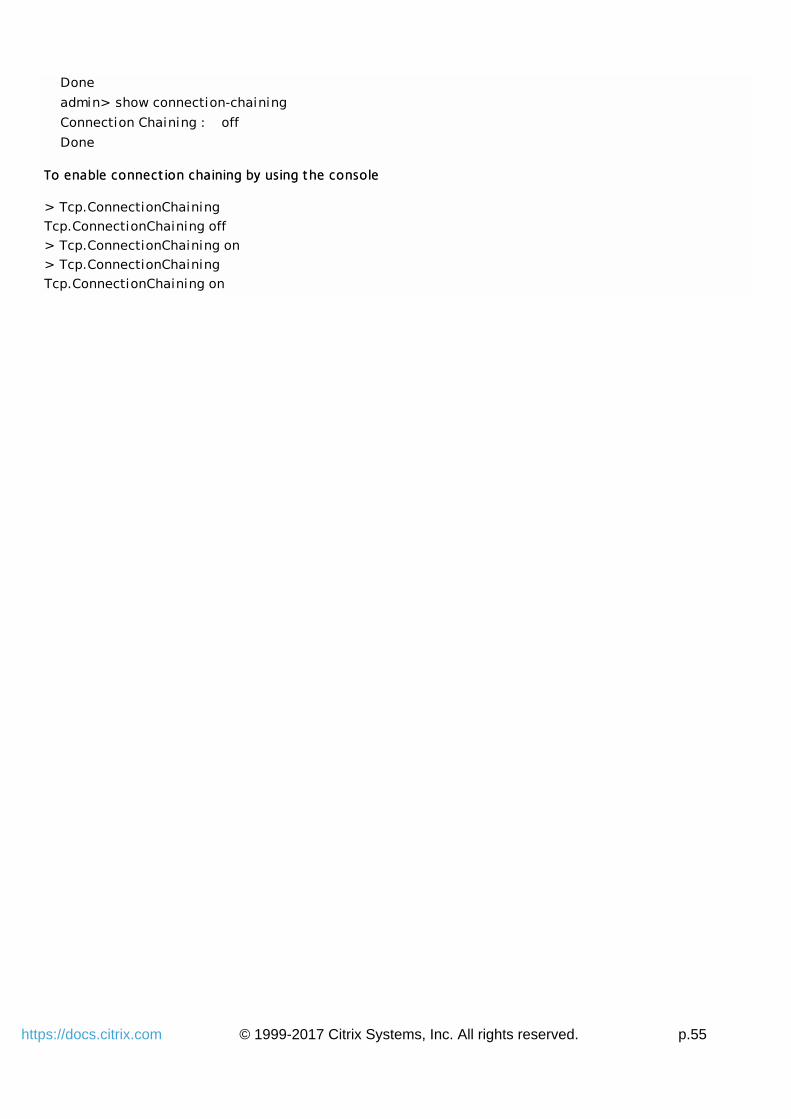
© 1999-2017 Citrix Systems, Inc. All rights reserved. p.55https://docs.citrix.com
Done admin> show connection-chaining Connection Chaining : off Done
To enable connect ion chaining by using t he consoleTo enable connect ion chaining by using t he console
> Tcp.ConnectionChaining Tcp.ConnectionChaining off > Tcp.ConnectionChaining on > Tcp.ConnectionChaining Tcp.ConnectionChaining on
© 1999-2017 Citrix Systems, Inc. All rights reserved. p.56https://docs.citrix.com
Enabling WAN Insight Data Collection
May 12, 2015
After you add the CloudBridge appliance to the NetScaler Insight Center inventory, you must enable AppFlow on NetScaler
Insight Center for WAN Insight data collection.
To enable dat a collect ion f or WAN InsightTo enable dat a collect ion f or WAN Insight
1. On the Configuration tab, click Inventory.
2. From the inventory list, select the IP address of the appliance on which you want to enable data collection.
3. On the Configure CloudBridge screen, select AppFlow to enable data collection, and choose TCP and WANOpt, to
collect information for WAN traff ic.
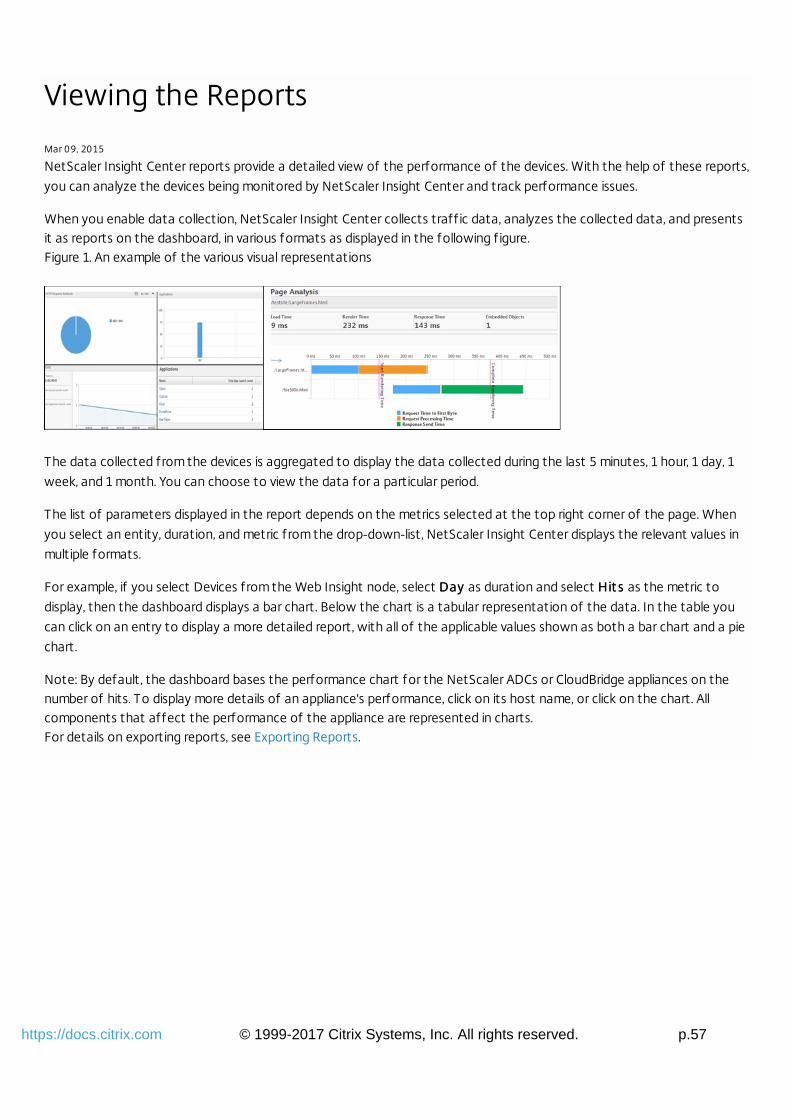
© 1999-2017 Citrix Systems, Inc. All rights reserved. p.57https://docs.citrix.com
Viewing the Reports
Mar 09, 2015
NetScaler Insight Center reports provide a detailed view of the performance of the devices. With the help of these reports,
you can analyze the devices being monitored by NetScaler Insight Center and track performance issues.
When you enable data collection, NetScaler Insight Center collects traff ic data, analyzes the collected data, and presentsit as reports on the dashboard, in various formats as displayed in the following f igure.Figure 1. An example of the various visual representations
The data collected from the devices is aggregated to display the data collected during the last 5 minutes, 1 hour, 1 day, 1
week, and 1 month. You can choose to view the data for a particular period.
The list of parameters displayed in the report depends on the metrics selected at the top right corner of the page. When
you select an entity, duration, and metric from the drop-down-list, NetScaler Insight Center displays the relevant values in
multiple formats.
For example, if you select Devices from the Web Insight node, select DayDay as duration and select Hit sHit s as the metric to
display, then the dashboard displays a bar chart. Below the chart is a tabular representation of the data. In the table you
can click on an entry to display a more detailed report, with all of the applicable values shown as both a bar chart and a pie
chart.
Note: By default, the dashboard bases the performance chart for the NetScaler ADCs or CloudBridge appliances on thenumber of hits. To display more details of an appliance's performance, click on its host name, or click on the chart. Allcomponents that affect the performance of the appliance are represented in charts.For details on exporting reports, see Exporting Reports.
© 1999-2017 Citrix Systems, Inc. All rights reserved. p.58https://docs.citrix.com
Web Insight Reports
Jun 11, 2014
For application traff ic, the reports generated by NetScaler Insight Center are available on the Web InsightWeb Insight node on theDashboard. The reports include the following categories of entities:
Devices.Devices. Displays the reports for all NetScaler appliances accessed by the clients.
Applicat ions.Applicat ions. Displays the reports for all applications used by the clients across all the NetScaler appliances.
Domains.Domains. Displays the reports for all domains accessed by the clients.
Note: This category is displayed if you enable cache redirection on any of the NetScaler ADCs listed in the inventory.
URLs.URLs. Displays the reports for all the application URLs accessed by the clients.
Client s.Client s. Displays the reports for all clients accessing the applications across all the NetScaler appliances.
Servers.Servers. Displays the reports for all the servers responding to the client requests.
Web Insight reports consolidate the following data:Applications managed by the selected NetScaler appliances
Top f ive clients details
Top f ive servers details
HTTP request methods used by the clients
HTTP Response Status
Operating Systems used by the clients
User agents (browsers) used by the clients
Cache Performance details
Note: You can click on a chart to view details of the selected component.The following table lists the Web Insight metrics available with different licenses:
T able 1. Web Insight T able 1. Web Insight Met rics wit h Applicable LicensesMet rics wit h Applicable Licenses
Met ricsMet rics Descript ionDescript ion NS 10NS 10Plat inumPlat inumedit ion,edit ion,and NSand NS10.1 all10.1 alledit ionsedit ions
NS 10NS 10(St andard and(St andard andEnt erpriseEnt erpriseedit ions, andedit ions, andNS 9.3 (AllNS 9.3 (Alledit ions)edit ions)
DevicesDevices Hits Number of requests received by NetScaler. Yes Yes
Bandwidth Total bytes processed by NetScaler appliance. Yes Yes
Applicat ionsApplicat ions Hits Number of requests received by application. Yes Yes
Bandwidth Total bytes sent to the application. Yes Yes
Response
Time
Elapsed time between the end of an enquiry and the
beginning of a response from the application.
Yes No
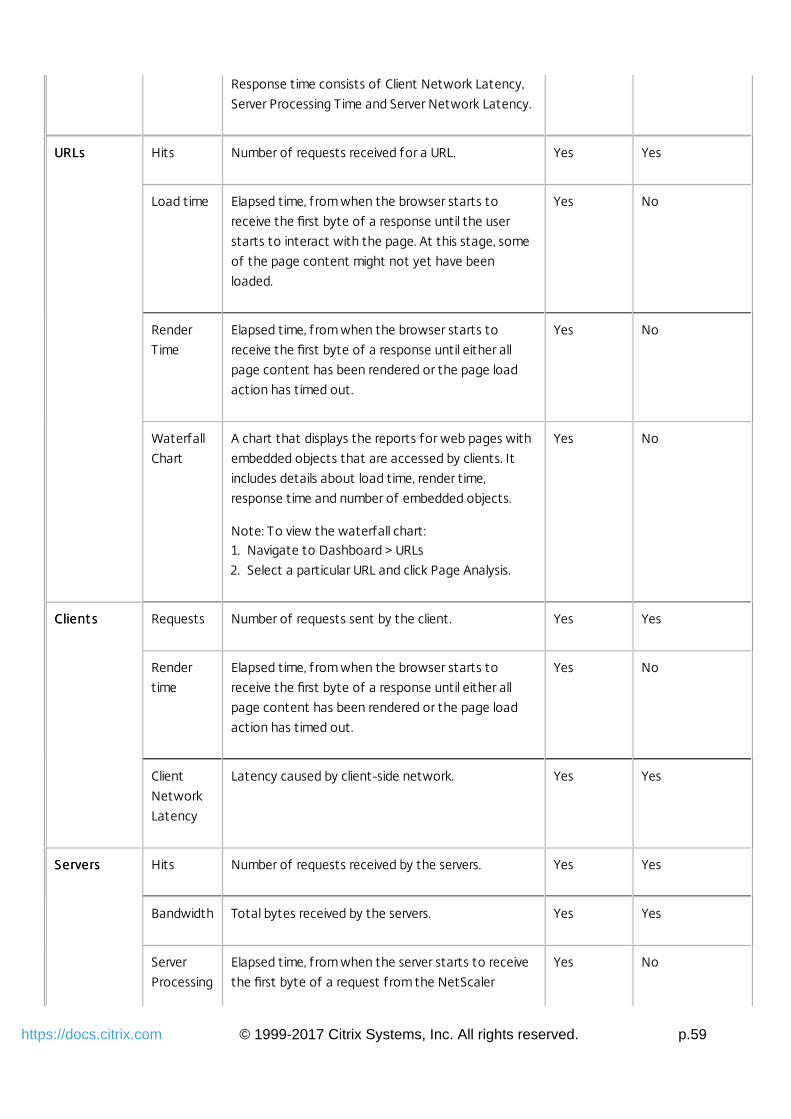
© 1999-2017 Citrix Systems, Inc. All rights reserved. p.59https://docs.citrix.com
Response time consists of Client Network Latency,
Server Processing Time and Server Network Latency.
URLsURLs Hits Number of requests received for a URL. Yes Yes
Load time Elapsed time, from when the browser starts to
receive the first byte of a response until the user
starts to interact with the page. At this stage, some
of the page content might not yet have been
loaded.
Yes No
Render
Time
Elapsed time, from when the browser starts to
receive the first byte of a response until either all
page content has been rendered or the page load
action has timed out.
Yes No
Waterfall
Chart
A chart that displays the reports for web pages with
embedded objects that are accessed by clients. It
includes details about load time, render time,
response time and number of embedded objects.
Note: To view the waterfall chart:1. Navigate to Dashboard > URLs
2. Select a particular URL and click Page Analysis.
Yes No
Client sClient s Requests Number of requests sent by the client. Yes Yes
Render
time
Elapsed time, from when the browser starts to
receive the first byte of a response until either all
page content has been rendered or the page load
action has timed out.
Yes No
Client
Network
Latency
Latency caused by client-side network. Yes Yes
ServersServers Hits Number of requests received by the servers. Yes Yes
Bandwidth Total bytes received by the servers. Yes Yes
Server
Processing
Elapsed time, from when the server starts to receive
the first byte of a request from the NetScaler
Yes No
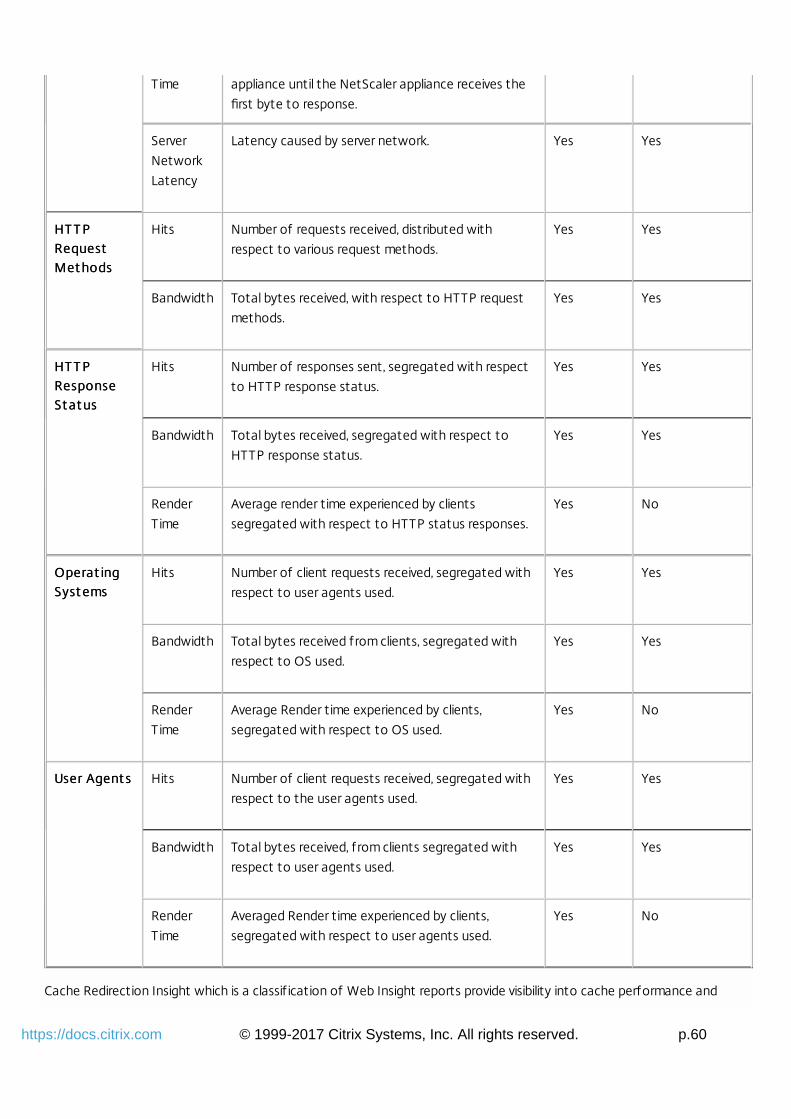
© 1999-2017 Citrix Systems, Inc. All rights reserved. p.60https://docs.citrix.com
Time appliance until the NetScaler appliance receives the
first byte to response.
Server
Network
Latency
Latency caused by server network. Yes Yes
HT T PHT T PRequestRequestMet hodsMet hods
Hits Number of requests received, distributed with
respect to various request methods.
Yes Yes
Bandwidth Total bytes received, with respect to HTTP request
methods.
Yes Yes
HT T PHT T PResponseResponseSt at usSt at us
Hits Number of responses sent, segregated with respect
to HTTP response status.
Yes Yes
Bandwidth Total bytes received, segregated with respect to
HTTP response status.
Yes Yes
Render
Time
Average render time experienced by clients
segregated with respect to HTTP status responses.
Yes No
Operat ingOperat ingSyst emsSyst ems
Hits Number of client requests received, segregated with
respect to user agents used.
Yes Yes
Bandwidth Total bytes received from clients, segregated with
respect to OS used.
Yes Yes
Render
Time
Average Render time experienced by clients,
segregated with respect to OS used.
Yes No
User Agent sUser Agent s Hits Number of client requests received, segregated with
respect to the user agents used.
Yes Yes
Bandwidth Total bytes received, from clients segregated with
respect to user agents used.
Yes Yes
Render
Time
Averaged Render time experienced by clients,
segregated with respect to user agents used.
Yes No
Cache Redirection Insight which is a classif ication of Web Insight reports provide visibility into cache performance and
© 1999-2017 Citrix Systems, Inc. All rights reserved. p.61https://docs.citrix.com
includes the following details:Cache Hits: Number of requests served by the cache server.
Cache miss: Number of requests that the cache server could not serve and was served by the origin server.
Cache bypass: Number of requests that bypassed the cache server and was served by the origin server.
Cache hits bandwidth consumed: Bandwidth consumed while serving request from the cache server.
Cache miss bandwidth consumed: Bandwidth consumed when the cache server could not serve the request and was
served by the origin server.
Cache bypass bandwidth consumed: Bandwidth consumed when the requests bypassed the cache server and was served
by the origin server.
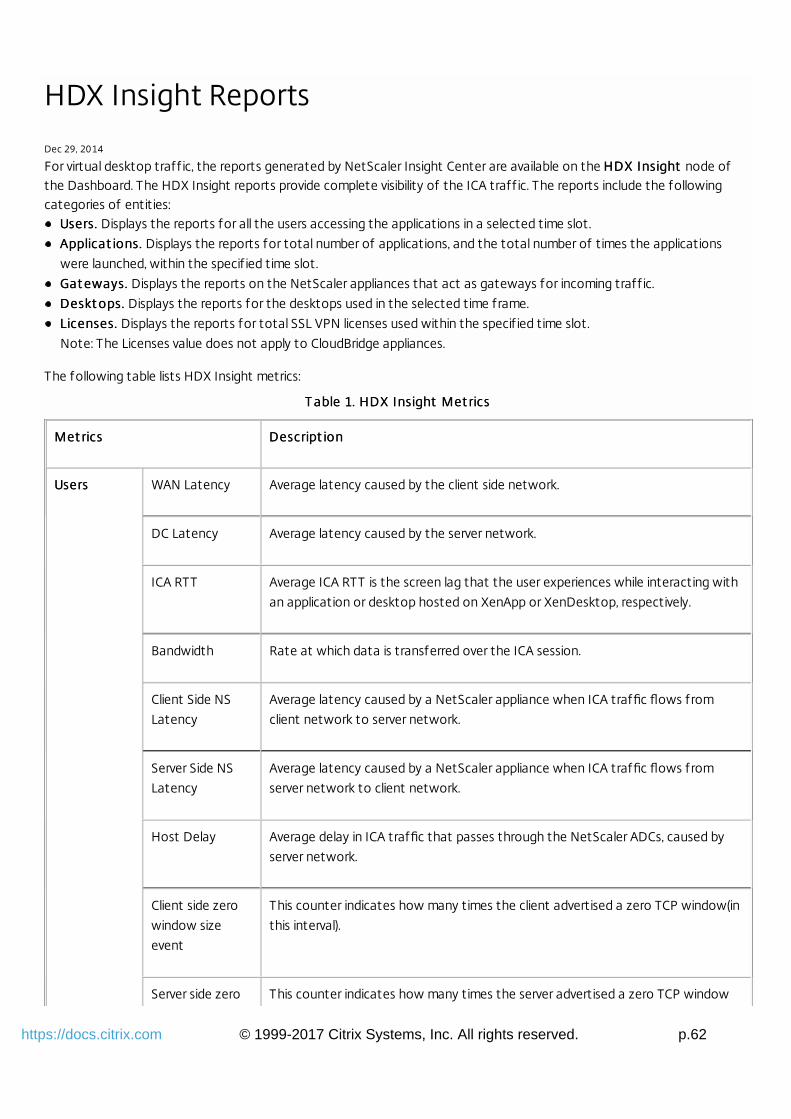
© 1999-2017 Citrix Systems, Inc. All rights reserved. p.62https://docs.citrix.com
HDX Insight Reports
Dec 29, 2014
For virtual desktop traff ic, the reports generated by NetScaler Insight Center are available on the HDX InsightHDX Insight node ofthe Dashboard. The HDX Insight reports provide complete visibility of the ICA traff ic. The reports include the followingcategories of entities:
Users.Users. Displays the reports for all the users accessing the applications in a selected time slot.
Applicat ions.Applicat ions. Displays the reports for total number of applications, and the total number of times the applications
were launched, within the specif ied time slot.
Gat eways.Gat eways. Displays the reports on the NetScaler appliances that act as gateways for incoming traff ic.
Deskt ops.Deskt ops. Displays the reports for the desktops used in the selected time frame.
Licenses.Licenses. Displays the reports for total SSL VPN licenses used within the specif ied time slot.
Note: The Licenses value does not apply to CloudBridge appliances.
The following table lists HDX Insight metrics:
T able 1. HDX Insight T able 1. HDX Insight Met ricsMet rics
Met ricsMet rics Descript ionDescript ion
UsersUsers WAN Latency Average latency caused by the client side network.
DC Latency Average latency caused by the server network.
ICA RTT Average ICA RTT is the screen lag that the user experiences while interacting with
an application or desktop hosted on XenApp or XenDesktop, respectively.
Bandwidth Rate at which data is transferred over the ICA session.
Client Side NS
Latency
Average latency caused by a NetScaler appliance when ICA traffic flows from
client network to server network.
Server Side NS
Latency
Average latency caused by a NetScaler appliance when ICA traffic flows from
server network to client network.
Host Delay Average delay in ICA traffic that passes through the NetScaler ADCs, caused by
server network.
Client side zero
window size
event
This counter indicates how many times the client advertised a zero TCP window(in
this interval).
Server side zero This counter indicates how many times the server advertised a zero TCP window
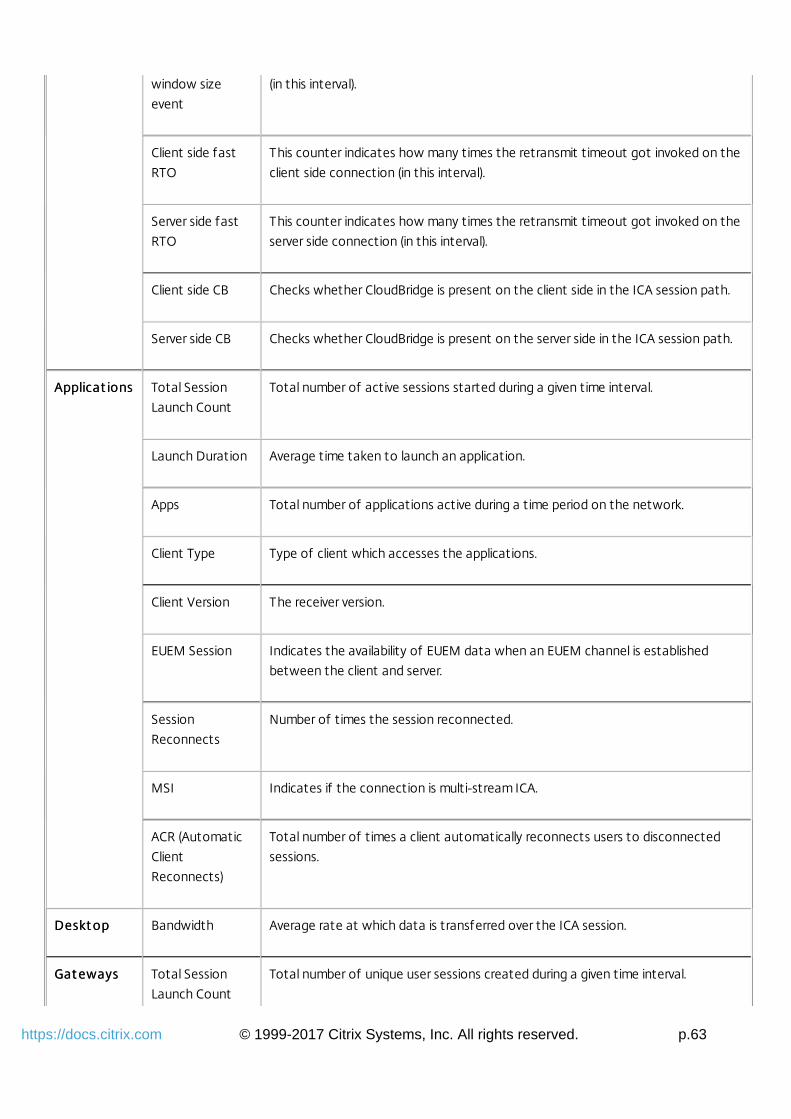
© 1999-2017 Citrix Systems, Inc. All rights reserved. p.63https://docs.citrix.com
window size
event
(in this interval).
Client side fast
RTO
This counter indicates how many times the retransmit timeout got invoked on the
client side connection (in this interval).
Server side fast
RTO
This counter indicates how many times the retransmit timeout got invoked on the
server side connection (in this interval).
Client side CB Checks whether CloudBridge is present on the client side in the ICA session path.
Server side CB Checks whether CloudBridge is present on the server side in the ICA session path.
Applicat ionsApplicat ions Total Session
Launch Count
Total number of active sessions started during a given time interval.
Launch Duration Average time taken to launch an application.
Apps Total number of applications active during a time period on the network.
Client Type Type of client which accesses the applications.
Client Version The receiver version.
EUEM Session Indicates the availability of EUEM data when an EUEM channel is established
between the client and server.
Session
Reconnects
Number of times the session reconnected.
MSI Indicates if the connection is multi-stream ICA.
ACR (Automatic
Client
Reconnects)
Total number of times a client automatically reconnects users to disconnected
sessions.
Deskt opDeskt op Bandwidth Average rate at which data is transferred over the ICA session.
Gat ewaysGat eways Total Session
Launch Count
Total number of unique user sessions created during a given time interval.
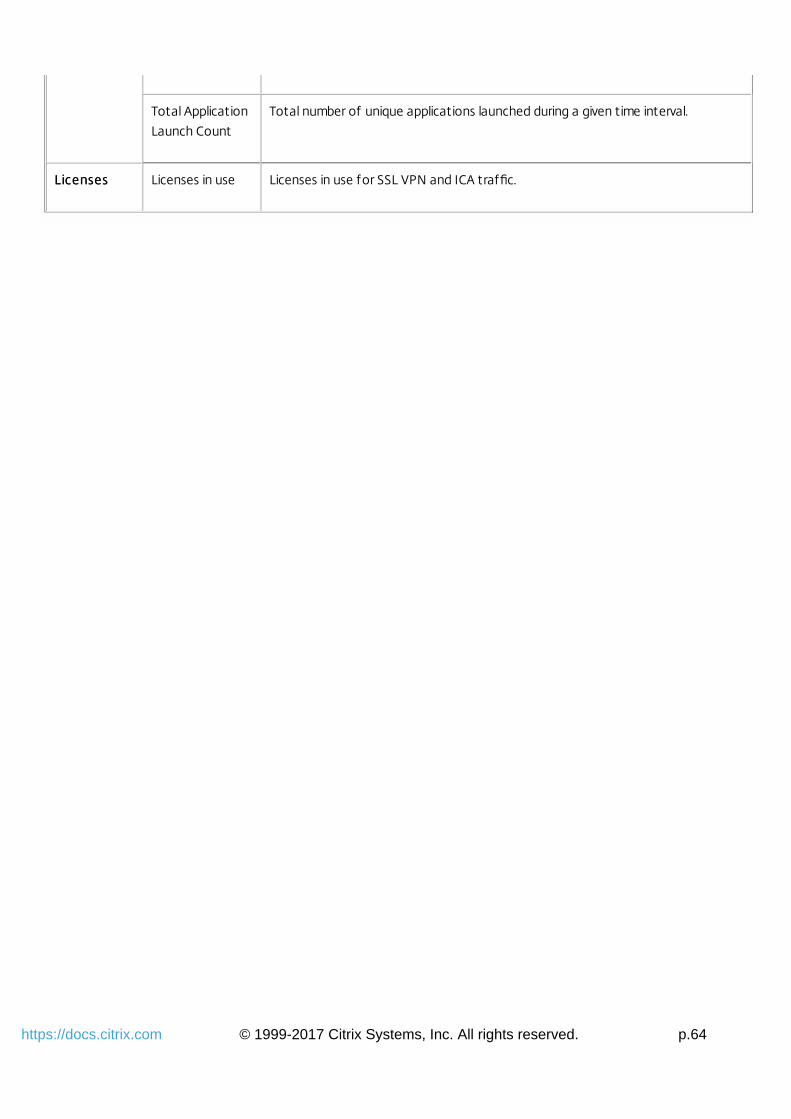
© 1999-2017 Citrix Systems, Inc. All rights reserved. p.64https://docs.citrix.com
Total Application
Launch Count
Total number of unique applications launched during a given time interval.
LicensesLicenses Licenses in use Licenses in use for SSL VPN and ICA traffic.
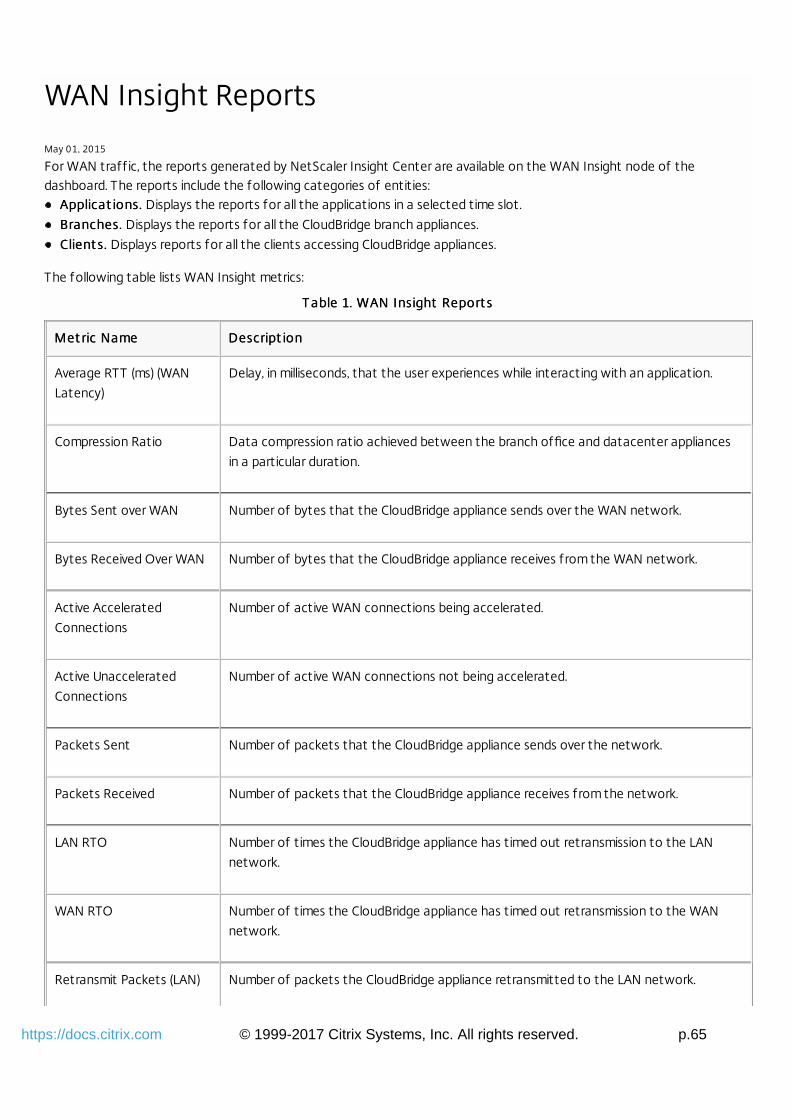
© 1999-2017 Citrix Systems, Inc. All rights reserved. p.65https://docs.citrix.com
WAN Insight Reports
May 01, 2015
For WAN traff ic, the reports generated by NetScaler Insight Center are available on the WAN Insight node of thedashboard. The reports include the following categories of entities:
Applicat ions.Applicat ions. Displays the reports for all the applications in a selected time slot.
Branches.Branches. Displays the reports for all the CloudBridge branch appliances.
Client s.Client s. Displays reports for all the clients accessing CloudBridge appliances.
The following table lists WAN Insight metrics:
T able 1. WAN Insight Report sT able 1. WAN Insight Report s
Met ric NameMet ric Name Descript ionDescript ion
Average RTT (ms) (WAN
Latency)
Delay, in milliseconds, that the user experiences while interacting with an application.
Compression Ratio Data compression ratio achieved between the branch office and datacenter appliances
in a particular duration.
Bytes Sent over WAN Number of bytes that the CloudBridge appliance sends over the WAN network.
Bytes Received Over WAN Number of bytes that the CloudBridge appliance receives from the WAN network.
Active Accelerated
Connections
Number of active WAN connections being accelerated.
Active Unaccelerated
Connections
Number of active WAN connections not being accelerated.
Packets Sent Number of packets that the CloudBridge appliance sends over the network.
Packets Received Number of packets that the CloudBridge appliance receives from the network.
LAN RTO Number of times the CloudBridge appliance has timed out retransmission to the LAN
network.
WAN RTO Number of times the CloudBridge appliance has timed out retransmission to the WAN
network.
Retransmit Packets (LAN) Number of packets the CloudBridge appliance retransmitted to the LAN network.

© 1999-2017 Citrix Systems, Inc. All rights reserved. p.66https://docs.citrix.com
Retransmit Packets (WAN) Number of packets the CloudBridge appliance retransmitted to the WAN network.Met ric NameMet ric Name Descript ionDescript ion
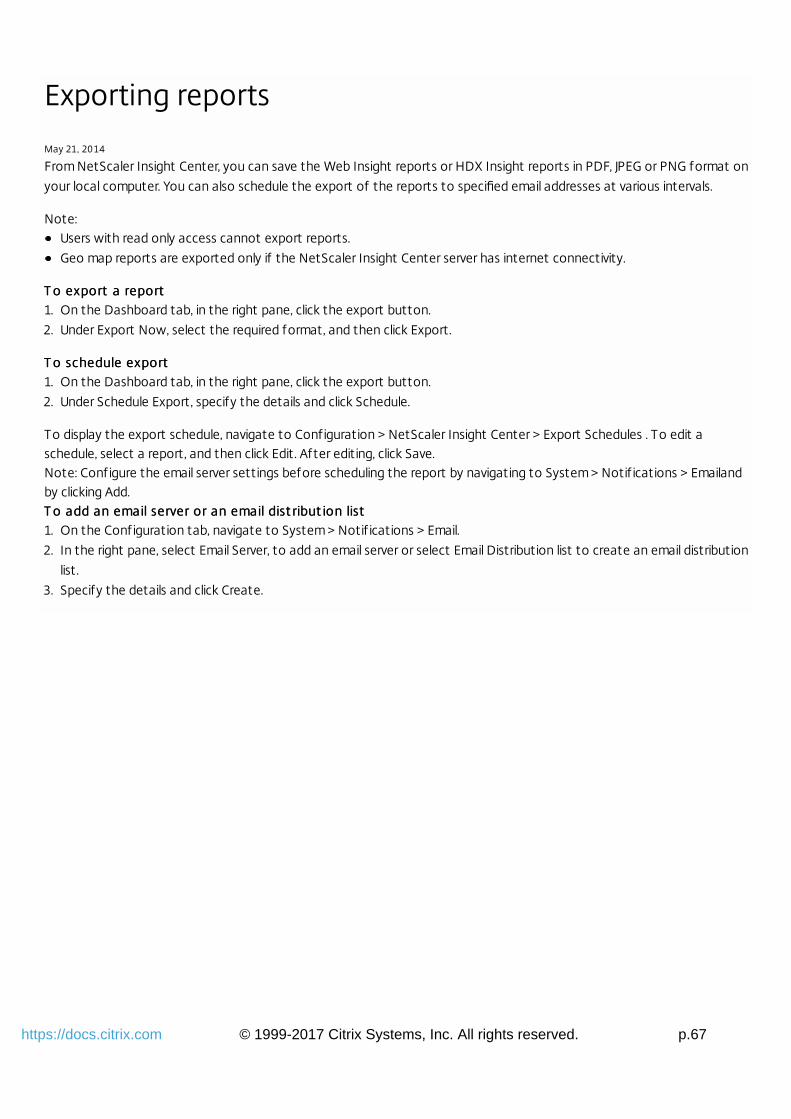
© 1999-2017 Citrix Systems, Inc. All rights reserved. p.67https://docs.citrix.com
Exporting reports
May 21, 2014
From NetScaler Insight Center, you can save the Web Insight reports or HDX Insight reports in PDF, JPEG or PNG format on
your local computer. You can also schedule the export of the reports to specified email addresses at various intervals.
Note:Users with read only access cannot export reports.
Geo map reports are exported only if the NetScaler Insight Center server has internet connectivity.
T o export a reportT o export a report1. On the Dashboard tab, in the right pane, click the export button.
2. Under Export Now, select the required format, and then click Export.
T o schedule exportT o schedule export1. On the Dashboard tab, in the right pane, click the export button.
2. Under Schedule Export, specify the details and click Schedule.
To display the export schedule, navigate to Configuration > NetScaler Insight Center > Export Schedules . To edit aschedule, select a report, and then click Edit. After editing, click Save.Note: Configure the email server settings before scheduling the report by navigating to System > Notif ications > Emailandby clicking Add.T o add an email server or an email dist ribut ion listT o add an email server or an email dist ribut ion list1. On the Configuration tab, navigate to System > Notif ications > Email.
2. In the right pane, select Email Server, to add an email server or select Email Distribution list to create an email distribution
list.
3. Specify the details and click Create.
© 1999-2017 Citrix Systems, Inc. All rights reserved. p.68https://docs.citrix.com
Upgrading NetScaler Insight Center
Dec 30 , 2014
To upgrade NetScaler Insight Center to a new build, you must f irst download the application build f ile. Upgrading to a newbuild is a simple procedure.Note: Citrix recommends not to downgrade NetScaler Insight Center.
1. Upload the latest software image to the NetScaler Insight Center application.
1. On the Configuration tab, navigate to NetScaler Insight Center > Software Images.
2. In the details pane, from the Action drop-down list, select Upload.
3. In the Upload NetScaler Insight Center Software Image dialog box, click Browse and navigate to the folder that
contains the build f ile, and then double-click the build f ile.
4. Click Upload.
Note: You can create a backup of the software image by selecting an image and then selecting the Download option
from the Action drop-down list.
2. Upgrade NetScaler Insight Center to a new version.
1. On the Configuration tab, navigate to System.
2. In the System pane, under System Administration, click Upgrade Netscaler Insight Center
3. In the Upgrade Netscaler Insight Center dialog box, in Software Images, select the f ile of the build to which you want
to upgrade.
4. Click OK.
© 1999-2017 Citrix Systems, Inc. All rights reserved. p.69https://docs.citrix.com
Use Cases: Web insight
May 15, 2015
Web Insight enables visibility into enterprise web applications and allows IT administrators to monitor all web applications
being served by the NetScaler ADC by providing integrated and real-time monitoring of applications. Web Insight provides
critical information such as user and server response time, enabling IT organizations to monitor and improve application
performance.
This topic includes the following details:Monitoring Cache Server Performance
Identifying the root cause of slow performance issues
Display the usage of web applications across different geographical locations on a map
A NetScaler deployment can optimize cache server utilization to reduce bandwidth consumption and speed up data
retrieval. The NetScaler ADC analyzes incoming requests, sends cacheable requests to cache servers, and sends non-
cacheable requests or dynamic HTTP requests to origin servers. NetScaler Insight Center analyzes the traffic flowing
through NetScaler ADC to cache servers and origin servers, and provides useful information about the cache performance,
such as:
Bandwidth saved while serving requests from the cache server instead of the origin server.
Bandwidth consumed when requests bypassed the cache server and were served from the origin server.
Number of times a URL was accessed from the cache server instead of the origin server.
To analyze the performance of the cache server, you can view the following metrics:Cache Hits: Number of requests served by the cache server.
Cache misses: Number of requests served by the origin server because they could not be served by the cache server.
Cache bypass: Number of requests served by the origin server because the cache server was bypassed.
Cache hits bandwidth consumed: Bandwidth consumed by serving requests from the cache server.
Cache miss bandwidth consumed: Bandwidth consumed by serving requests from the origin server when they could not
be served from the cache server.
Cache bypass bandwidth consumed: Bandwidth consumed by serving requests from the origin server when the cache
server was bypassed.
If cache servers are deployed in a network, and cache redirection is enabled on the NetScaler ADC, and appflow logging is
enabled for cache redirection, NetScaler Insight Center gathers details such as bandwidth saved and cache servers utilized
across a cache farm.
1. Amount of bandwidt h saved in a Net Scaler deploymentAmount of bandwidt h saved in a Net Scaler deployment
The main reason to deploy cache servers is to decrease the bandwidth consumed in retrieving data from the origin
servers. A cache redirection report on bandwidth consumed by cache hits versus cache bypasses and cache misses over a
period of time can provide a picture of bandwidth saved. The report includes the following details:
Bandwidth consumed by origin server versus cache farm
Bandwidth consumed by origin server
Bandwidth consumed by cache farm
Percentage of bandwidth saved by NetScaler ADC
2. Cache Servers ut ilized in a cache f armCache Servers ut ilized in a cache f arm
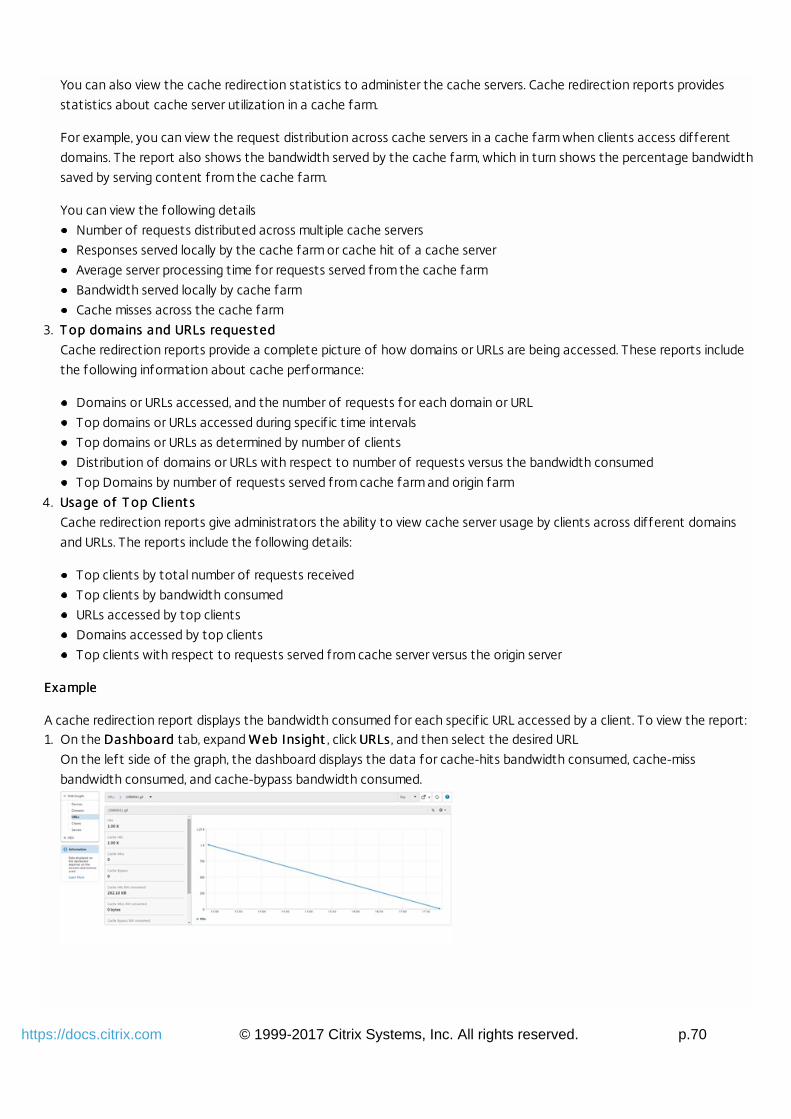
© 1999-2017 Citrix Systems, Inc. All rights reserved. p.70https://docs.citrix.com
You can also view the cache redirection statistics to administer the cache servers. Cache redirection reports provides
statistics about cache server utilization in a cache farm.
For example, you can view the request distribution across cache servers in a cache farm when clients access different
domains. The report also shows the bandwidth served by the cache farm, which in turn shows the percentage bandwidth
saved by serving content from the cache farm.
You can view the following details
Number of requests distributed across multiple cache servers
Responses served locally by the cache farm or cache hit of a cache server
Average server processing time for requests served from the cache farm
Bandwidth served locally by cache farm
Cache misses across the cache farm
3. T op domains and URLs request edT op domains and URLs request ed
Cache redirection reports provide a complete picture of how domains or URLs are being accessed. These reports include
the following information about cache performance:
Domains or URLs accessed, and the number of requests for each domain or URL
Top domains or URLs accessed during specif ic time intervals
Top domains or URLs as determined by number of clients
Distribution of domains or URLs with respect to number of requests versus the bandwidth consumed
Top Domains by number of requests served from cache farm and origin farm
4. Usage of T op Client sUsage of T op Client s
Cache redirection reports give administrators the ability to view cache server usage by clients across different domains
and URLs. The reports include the following details:
Top clients by total number of requests received
Top clients by bandwidth consumed
URLs accessed by top clients
Domains accessed by top clients
Top clients with respect to requests served from cache server versus the origin server
ExampleExample
A cache redirection report displays the bandwidth consumed for each specif ic URL accessed by a client. To view the report:1. On the DashboardDashboard tab, expand Web InsightWeb Insight , click URLsURLs, and then select the desired URL
On the left side of the graph, the dashboard displays the data for cache-hits bandwidth consumed, cache-miss
bandwidth consumed, and cache-bypass bandwidth consumed.
© 1999-2017 Citrix Systems, Inc. All rights reserved. p.71https://docs.citrix.com
Scenario 1Scenario 1
Consider a scenario where two clients are accessing the same SharePoint server, but one client is experiencing slow
performance.
The client might be experiencing slow performance while accessing the SharePoint server due to latency on the client
network or latency on the server network.
To identify the root cause of the issue, analyze the following metrics:Client Network Latency
Server processing time
Server Network Latency
T o view t he client met ricsT o view t he client met rics1. On the Dashboard tab, expand Web Insight and click Applications.
2. In the list of applications select Share Point.
3. Scroll to the Clients graph.
4. Select the Client Network latency from the drop-down list.
Note the Client Network Latency values for the clients.
5. In the Servers graph, select Server Processing Time and Servernetwork Latency and note its value.
SummarySummary
In this example, the Client Network Latency for client 1 (192.168.1.102) and client 2 (192.168.1.100) is 1 second and 103
milliseconds respectively. The server processing time and the server network is latency is low.
This implies that the client is experiencing the slow performance due to latency on the client network and not due to server
latency or server processing time.
Scenario 2Scenario 2
Consider another scenario where a client is experiencing slow performance while accessing a URL (Main.html).
The client might be experiencing slow performance while accessing the URL due to high Client Render T ime, Client Network
Latency, or high application Response Time.
To identify the root cause of the issue, analyze the following metrics:Client Render
Client Network Latency
T o view t he client met ricsT o view t he client met rics1. On the Dashboard tab, expand Web Insight and click URLs.
2. In the URLs dashboard select Render T ime from the drop down.
3. Select the /Main.html URL and scroll down to the Clients graph and check the render time for client 192.168.1.105.
4. In the Clients graph, select Client Network Latency and check the Client network latency value.
SummarySummary
In this example, the Render time is 1 second and the Client Network Latency is 105 milliseconds.
This implies that the slow performance experienced by the is due to the high render time of the client.
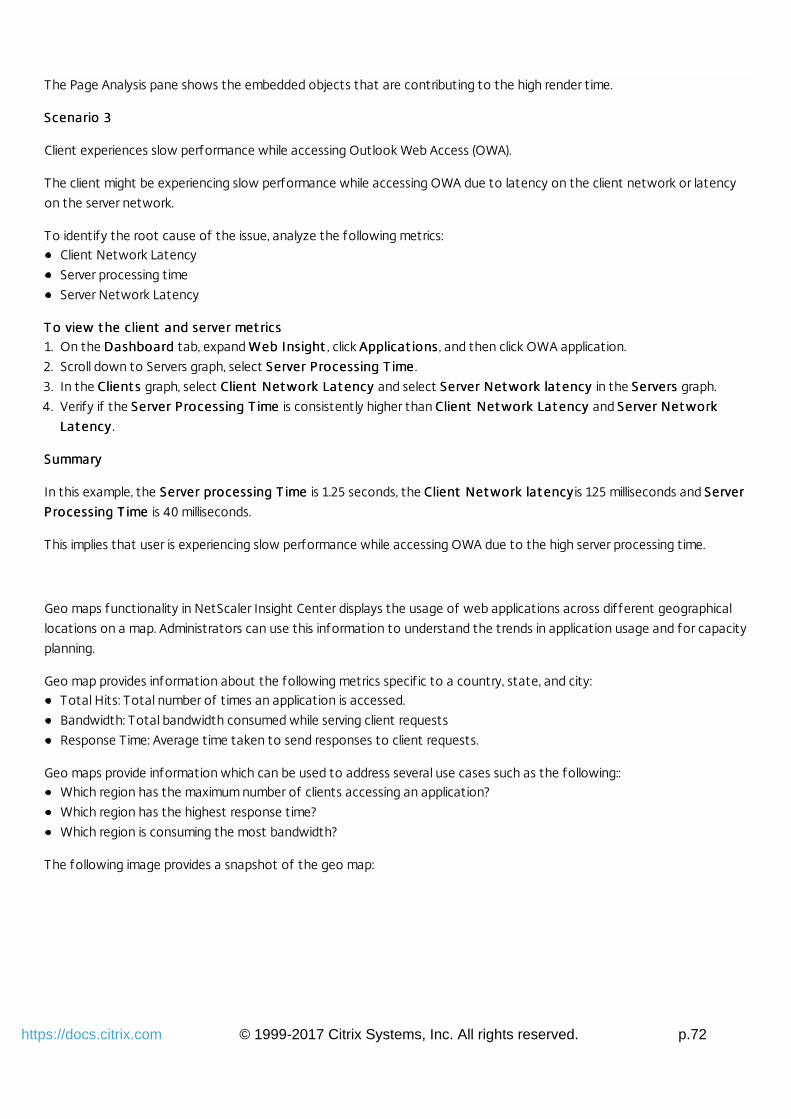
© 1999-2017 Citrix Systems, Inc. All rights reserved. p.72https://docs.citrix.com
The Page Analysis pane shows the embedded objects that are contributing to the high render time.
Scenario 3Scenario 3
Client experiences slow performance while accessing Outlook Web Access (OWA).
The client might be experiencing slow performance while accessing OWA due to latency on the client network or latency
on the server network.
To identify the root cause of the issue, analyze the following metrics:Client Network Latency
Server processing time
Server Network Latency
T o view t he client and server met ricsT o view t he client and server met rics1. On the DashboardDashboard tab, expand Web InsightWeb Insight , click Applicat ionsApplicat ions, and then click OWA application.
2. Scroll down to Servers graph, select Server Processing T imeServer Processing T ime.
3. In the Client sClient s graph, select Client Net work Lat encyClient Net work Lat ency and select Server Net work lat encyServer Net work lat ency in the ServersServers graph.
4. Verify if the Server Processing T imeServer Processing T ime is consistently higher than Client Net work Lat encyClient Net work Lat ency and Server Net workServer Net work
Lat encyLat ency .
SummarySummary
In this example, the Server processing T ime Server processing T ime is 1.25 seconds, the Client Net work lat encyClient Net work lat ency is 125 milliseconds and ServerServer
Processing T imeProcessing T ime is 40 milliseconds.
This implies that user is experiencing slow performance while accessing OWA due to the high server processing time.
Geo maps functionality in NetScaler Insight Center displays the usage of web applications across different geographical
locations on a map. Administrators can use this information to understand the trends in application usage and for capacity
planning.
Geo map provides information about the following metrics specif ic to a country, state, and city:Total Hits: Total number of times an application is accessed.
Bandwidth: Total bandwidth consumed while serving client requests
Response Time: Average time taken to send responses to client requests.
Geo maps provide information which can be used to address several use cases such as the following::Which region has the maximum number of clients accessing an application?
Which region has the highest response time?
Which region is consuming the most bandwidth?
The following image provides a snapshot of the geo map:
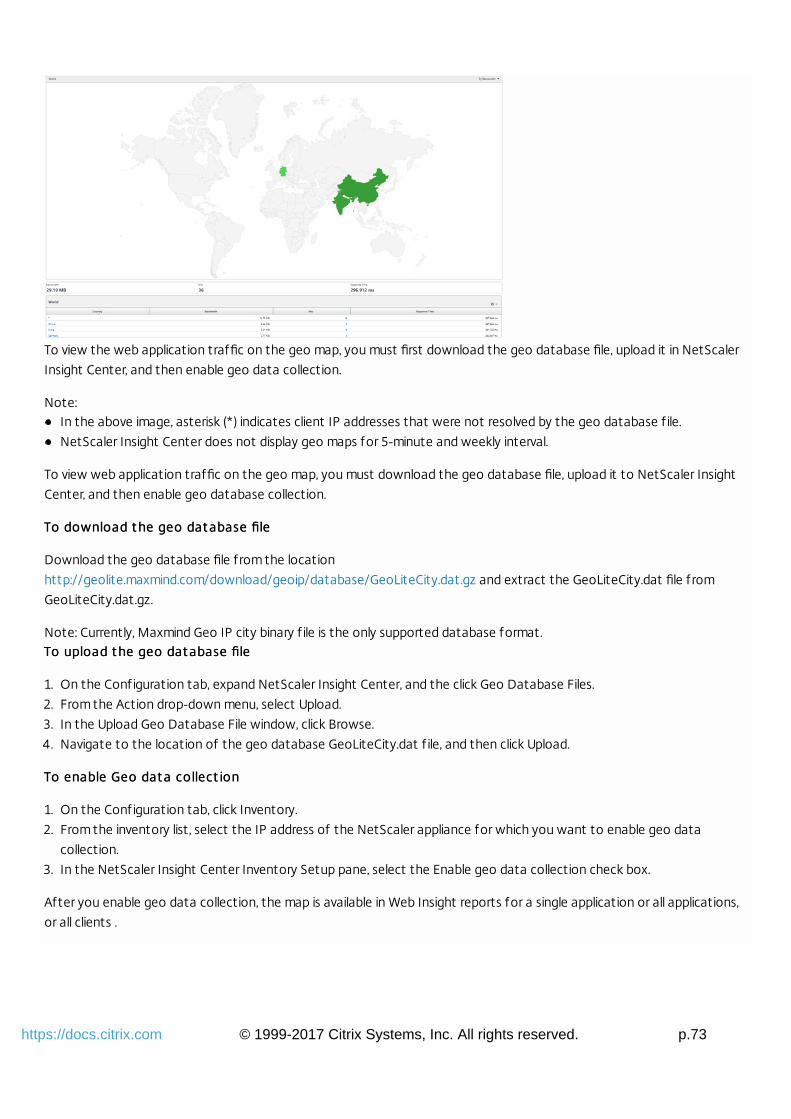
© 1999-2017 Citrix Systems, Inc. All rights reserved. p.73https://docs.citrix.com
To view the web application traffic on the geo map, you must first download the geo database file, upload it in NetScaler
Insight Center, and then enable geo data collection.
Note:In the above image, asterisk (*) indicates client IP addresses that were not resolved by the geo database f ile.
NetScaler Insight Center does not display geo maps for 5-minute and weekly interval.
To view web application traffic on the geo map, you must download the geo database file, upload it to NetScaler Insight
Center, and then enable geo database collection.
To download t he geo dat abase fileTo download t he geo dat abase file
Download the geo database file from the location
http://geolite.maxmind.com/download/geoip/database/GeoLiteCity.dat.gz and extract the GeoLiteCity.dat file from
GeoLiteCity.dat.gz.
Note: Currently, Maxmind Geo IP city binary f ile is the only supported database format.To upload t he geo dat abase fileTo upload t he geo dat abase file
1. On the Configuration tab, expand NetScaler Insight Center, and the click Geo Database Files.
2. From the Action drop-down menu, select Upload.
3. In the Upload Geo Database File window, click Browse.
4. Navigate to the location of the geo database GeoLiteCity.dat f ile, and then click Upload.
To enable Geo dat a collect ionTo enable Geo dat a collect ion
1. On the Configuration tab, click Inventory.
2. From the inventory list, select the IP address of the NetScaler appliance for which you want to enable geo data
collection.
3. In the NetScaler Insight Center Inventory Setup pane, select the Enable geo data collection check box.
After you enable geo data collection, the map is available in Web Insight reports for a single application or all applications,
or all clients .
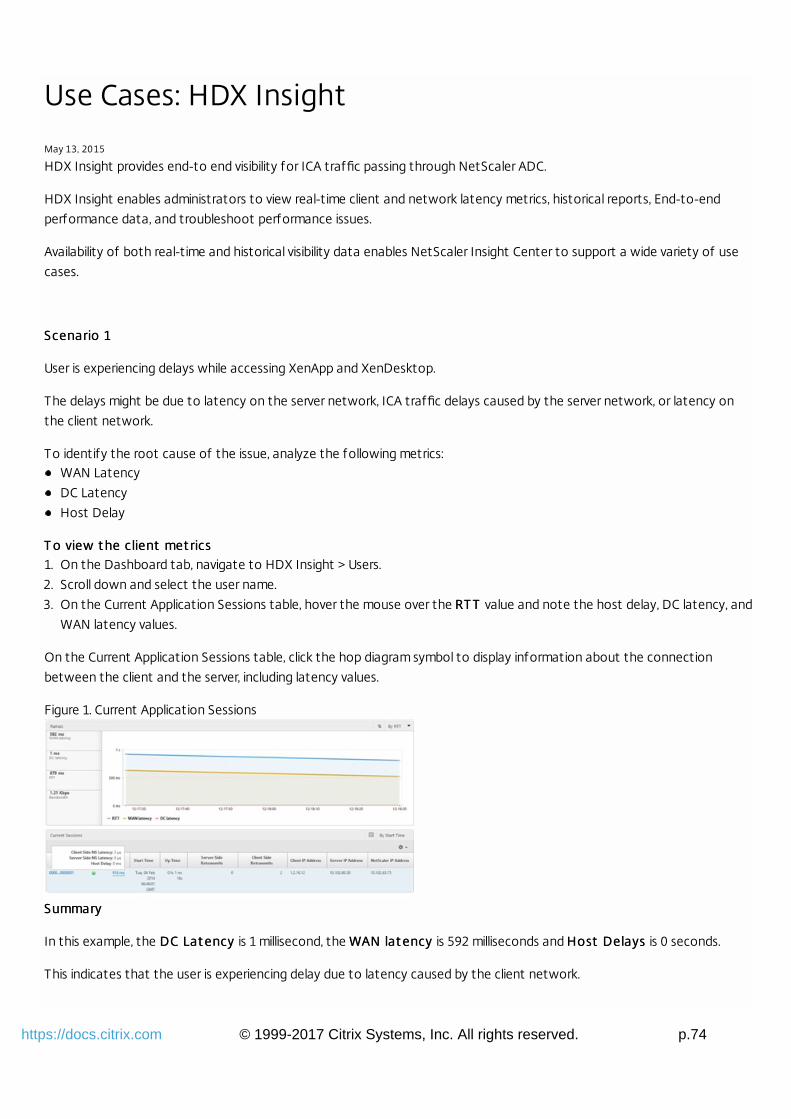
© 1999-2017 Citrix Systems, Inc. All rights reserved. p.74https://docs.citrix.com
Use Cases: HDX Insight
May 13, 2015
HDX Insight provides end-to end visibility for ICA traffic passing through NetScaler ADC.
HDX Insight enables administrators to view real-time client and network latency metrics, historical reports, End-to-end
performance data, and troubleshoot performance issues.
Availability of both real-time and historical visibility data enables NetScaler Insight Center to support a wide variety of use
cases.
Scenario 1Scenario 1
User is experiencing delays while accessing XenApp and XenDesktop.
The delays might be due to latency on the server network, ICA traffic delays caused by the server network, or latency on
the client network.
To identify the root cause of the issue, analyze the following metrics:WAN Latency
DC Latency
Host Delay
T o view t he client met ricsT o view t he client met rics1. On the Dashboard tab, navigate to HDX Insight > Users.
2. Scroll down and select the user name.
3. On the Current Application Sessions table, hover the mouse over the RT TRT T value and note the host delay, DC latency, and
WAN latency values.
On the Current Application Sessions table, click the hop diagram symbol to display information about the connection
between the client and the server, including latency values.
Figure 1. Current Application Sessions
SummarySummary
In this example, the DC Lat ency DC Lat ency is 1 millisecond, the WAN lat encyWAN lat ency is 592 milliseconds and Host DelaysHost Delays is 0 seconds.
This indicates that the user is experiencing delay due to latency caused by the client network.
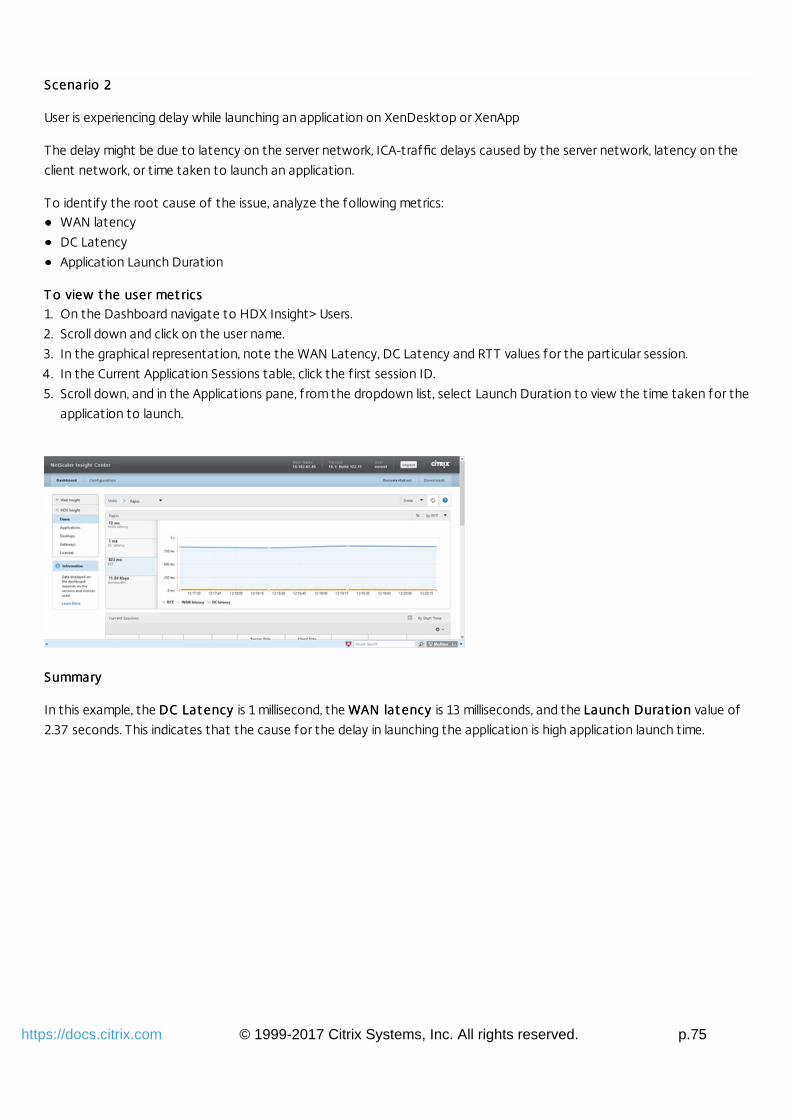
© 1999-2017 Citrix Systems, Inc. All rights reserved. p.75https://docs.citrix.com
Scenario 2Scenario 2
User is experiencing delay while launching an application on XenDesktop or XenApp
The delay might be due to latency on the server network, ICA-traffic delays caused by the server network, latency on the
client network, or time taken to launch an application.
To identify the root cause of the issue, analyze the following metrics:WAN latency
DC Latency
Application Launch Duration
T o view t he user met ricsT o view t he user met rics1. On the Dashboard navigate to HDX Insight> Users.
2. Scroll down and click on the user name.
3. In the graphical representation, note the WAN Latency, DC Latency and RTT values for the particular session.
4. In the Current Application Sessions table, click the f irst session ID.
5. Scroll down, and in the Applications pane, from the dropdown list, select Launch Duration to view the time taken for the
application to launch.
SummarySummary
In this example, the DC Lat encyDC Lat ency is 1 millisecond, the WAN lat encyWAN lat ency is 13 milliseconds, and the Launch Durat ionLaunch Durat ion value of
2.37 seconds. This indicates that the cause for the delay in launching the application is high application launch time.
© 1999-2017 Citrix Systems, Inc. All rights reserved. p.76https://docs.citrix.com
Managing NetScaler Insight Center
May 15, 2015
The configuration tab provides the interface through which you can manage the NetScaler Insight Center virtual appliance.
You can perform management activities, such as the following by using the options on the configuration tab:
The configuration tab provides the interface through which you can manage the NetScaler Insight Center virtual appliance.
You can perform management activities such as modify the network configuration, update logon credentials of devices,
configure user accounts, and manage client sessions. You can also restart NetScaler Insight Center and configure security
settings. You can further configure mail notifications to receive emails whenever an alert is raised.
This topic includes the following details:Modifying the Network Configuration
Updating Logon Credentials of Devices
Configuring User Accounts
Managing Client Sessions
Restarting the NetScaler Insight Center
Configuring Security Settings in NetScaler Insight Center
Configuring Mail Notif ications
You can change the NetScaler Insight Center IP address, network mask, and gateway address that you specif ied for theNetScaler Insight Center virtual appliance during initial configuration.
To modify the network configuration of NetScaler Insight Center
On the Configuration tab, click System. Then, in the Setup NetScaler Insight Center group, click Network Configuration and
enter the new value or values.
If the logon credentials of a device changes after it is added to the inventory, NetScaler Insight Center is not able to
connect to that appliance. In the user interface, the State column in the Inventory list displays a yellow or red circle in the
row that lists the appliance.
Note: There can be many other reasons for this state change. A change in logon credentials is just one of the possiblecauses. To resolve this issue, you must acquire information about the credential change from the administrator of thedevice and update NetScaler Insight Center.To updat e logon credent ials f or t he Net Scaler applianceTo updat e logon credent ials f or t he Net Scaler appliance
1. On the Configuration tab, click Inventory.
2. Select the device for which you want to update the credentials, and from the Action drop-down list, select Update Login
Credentials.
3. On the Update Login Credentials screen, enter the new credentials for the device.
To allow a user to access NetScaler Insight Center virtual appliance, you must create an account for the user. Users are
authenticated locally, on the virtual appliance. You can also enable external authentication for the user and specify the
© 1999-2017 Citrix Systems, Inc. All rights reserved. p.77https://docs.citrix.com
amount of time for which the a user can remain logged on.
To configure a user account
On the Configuration tab, navigate to System > User Administration > Users and, in the Users pane, add or edit a user
account.
A client session is created when a user logs on to the NetScaler Insight Center virtual appliance. You can view all current
client sessions in the Sessions pane, and you can end the session for a user.
To view client sessions, on the Configuration tab, in the navigation pane, expand System, and then click Sessions.
In the Sessions pane, you can view the following details:User NameUser Name— User account that is being used for the session.
IP AddressIP Address— IP address of the client from which the session has been created.
PortPort — Port being used for the session.
Login T imeLogin T ime— Time at which the current session was created on NetScaler Insight Center.
Last Act ivit y Last Act ivit y T imeT ime— Time at which user activity was last detected in the session.
Session Session Expires InExpires In— Time remaining before session expiry.
To end a client session, in the Sessions pane, click the session that you want to remove, and then click End Session.
Note: You cannot end a session from the client that initiated that session.
Restarting NetScaler Insight Center does not affect the devices monitored by NetScaler Insight Center. The devices
continue to function during the restart process.
To restart NetScaler Insight Center
1. On the Configuration tab, in the navigation pane, click System.
2. In the System pane, under System Administration, click Reboot NetScaler Insight Center.
3. At the confirmation prompt, Click Yes.
NetScaler Insight Center applies a password policy and, optionally, a user-lockout policy to provide security against hackers
and password-cracking software.
The password policy specifies the minimum length and complexity of a password. The user-lockout policy disables a user
account if an incorrect password is entered a specified number of times.
You can specify the time period (user lockout interval) for how long the user account remains disabled, after which the user
account is enabled automatically. A NetScaler Insight Center system administrator can enable a disabled user account
within the user lockout interval.
Note: User lockout is disabled by default.To set t he Password To set t he Password policypolicy
1. On the Configuration tab, navigate to System > User Administration.
© 1999-2017 Citrix Systems, Inc. All rights reserved. p.78https://docs.citrix.com
2. In the User Configuration group, click Password policy, and set the password policy.
To set t he user-lockout To set t he user-lockout policypolicy
1. On the Configuation tab, click System > User Administration.
2. In the User Configuration group, click User Lockout Configuration and set the user-lockout policy.
You must configure an email server to receive an email message each time an alert is raised. First configure an email server,
and then configure a mail profile. In the mail profile, use semicolons to separate the addresses of the recipients.
To configure an email serverTo configure an email server
1. On the Configuration tab, navigate to System > Notif ications > Email.
2. In the users pane, click Email Servers, and create an email server.
To configure an email dist ribut ion listTo configure an email dist ribut ion list
1. On the Configuration tab, navigate to System > Notif ications > Email.
2. In the users pane, click Email Distribution List and then, create an email distribution list.
© 1999-2017 Citrix Systems, Inc. All rights reserved. p.79https://docs.citrix.com
Managing System Settings
Dec 23, 2014
You can perform various operations such as modifying the time zone, configuring security settings and managing ICA
sessions on the NetScaler Insight Center configuration tab.
To perform these operations, on the, on the Configuration tab, in the navigation pane, click System, and in the right pane,
from the System Settings group, click the required setting.
TaskTask Descript ionDescript ion Navigat ionNavigat ion
Modifying
the Time
Zone
You can modify the time zone used by the NetScaler Insight Center virtual
appliance's clock. The default time zone is UTC.
In the System pane, in the
System Settings group,
click Change Time Zone.
Configuring
Security
Settings
For security reasons, you can specify that all communication between
NetScaler Insight Center and a NetScaler appliance must be over a secure
channel. You can also specify HTTPS-only access to NetScaler Insight
Center user interface.
Note: You can specify the session timeout value for a particular user or agroup. To define the user session timeout value or group session timeoutvalue, on the Configuration tab, navigate to System > User Administration,click Users or Groups, click Add and then specify the values.
In the System pane, in the
System Settings group,
click Change System
Settings .
Managing
ICA
Sessions
You can use the ICA session timeout feature to specify the time period for
which an ICA session can remain in the idle state before being terminated.
By default, if there is no flow of traffic, the session remains in active state
for the first 2 minutes and then moves to Idle state.
For example, if you set the ICA session timeout value to 5 minutes, a
session in which there is no traffic remains active for 2 minutes and then
enters the idle state. If there is still no traffic at the end of another 5
minutes, the session is terminated. If the session has any traffic during the
(2+5=) 7-minute period, the session moves to active state.
In the System pane, in the
System Settings group,
click Change ICA Session
Timeout and set the
timeout value.
Change
Database
Cache
Settings
The database cache functionality of NetScaler Insight Center stores
database content locally in the cache and serves the content to users
without accessing the database server. By default, this feature is enabled.
In the System pane, in the
System Settings group,
click Change Database
Cache Settings and clear
(reset) or enable the
cache.
Change
Data
Data record logs provide detailed information about appflow records that
NetScaler Insight Center collects from NetScaler ADCs. These records are
In the System pane, in the
System Settings group,
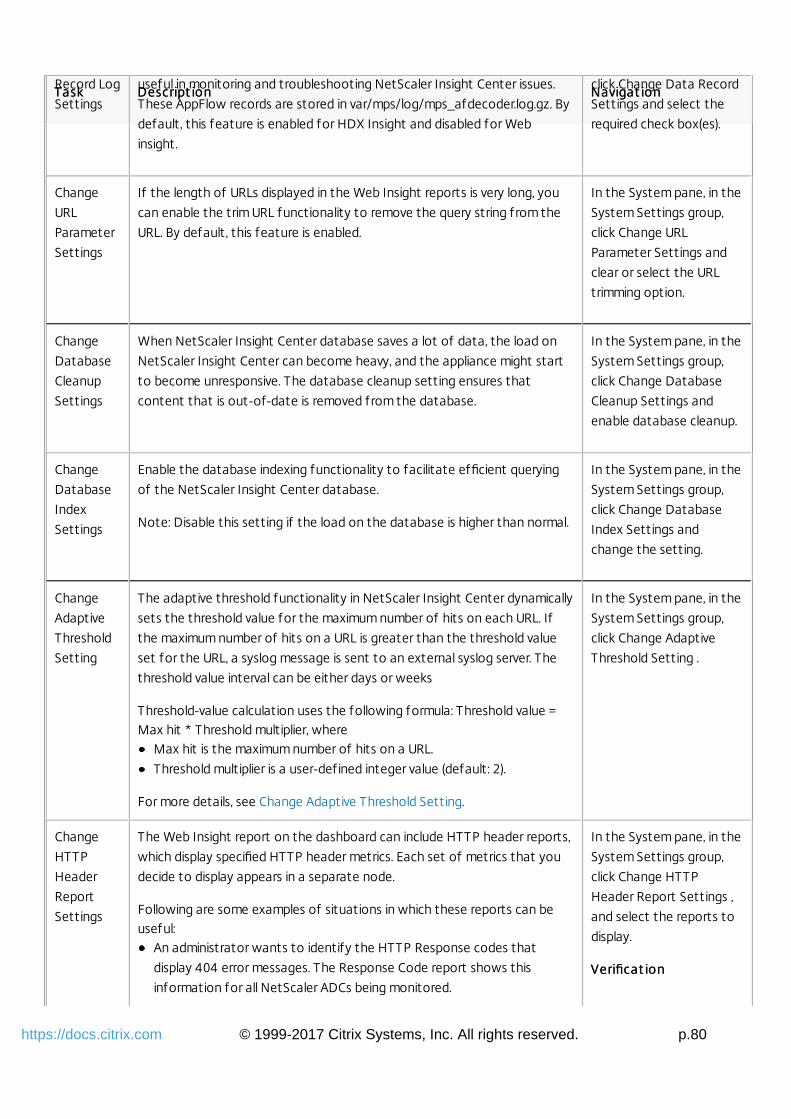
© 1999-2017 Citrix Systems, Inc. All rights reserved. p.80https://docs.citrix.com
Record Log
Settings
useful in monitoring and troubleshooting NetScaler Insight Center issues.
These AppFlow records are stored in var/mps/log/mps_afdecoder.log.gz. By
default, this feature is enabled for HDX Insight and disabled for Web
insight.
click Change Data Record
Settings and select the
required check box(es).
Change
URL
Parameter
Settings
If the length of URLs displayed in the Web Insight reports is very long, you
can enable the trim URL functionality to remove the query string from the
URL. By default, this feature is enabled.
In the System pane, in the
System Settings group,
click Change URL
Parameter Settings and
clear or select the URL
trimming option.
Change
Database
Cleanup
Settings
When NetScaler Insight Center database saves a lot of data, the load on
NetScaler Insight Center can become heavy, and the appliance might start
to become unresponsive. The database cleanup setting ensures that
content that is out-of-date is removed from the database.
In the System pane, in the
System Settings group,
click Change Database
Cleanup Settings and
enable database cleanup.
Change
Database
Index
Settings
Enable the database indexing functionality to facilitate efficient querying
of the NetScaler Insight Center database.
Note: Disable this setting if the load on the database is higher than normal.
In the System pane, in the
System Settings group,
click Change Database
Index Settings and
change the setting.
Change
Adaptive
Threshold
Setting
The adaptive threshold functionality in NetScaler Insight Center dynamically
sets the threshold value for the maximum number of hits on each URL. If
the maximum number of hits on a URL is greater than the threshold value
set for the URL, a syslog message is sent to an external syslog server. The
threshold value interval can be either days or weeks
Threshold-value calculation uses the following formula: Threshold value =Max hit * Threshold multiplier, where
Max hit is the maximum number of hits on a URL.
Threshold multiplier is a user-defined integer value (default: 2).
For more details, see Change Adaptive Threshold Setting.
In the System pane, in the
System Settings group,
click Change Adaptive
Threshold Setting .
Change
HTTP
Header
Report
Settings
The Web Insight report on the dashboard can include HTTP header reports,
which display specified HTTP header metrics. Each set of metrics that you
decide to display appears in a separate node.
Following are some examples of situations in which these reports can beuseful:
An administrator wants to identify the HTTP Response codes that
display 404 error messages. The Response Code report shows this
information for all NetScaler ADCs being monitored.
In the System pane, in the
System Settings group,
click Change HTTP
Header Report Settings ,
and select the reports to
display.
Verificat ionVerificat ion
TaskTask Descript ionDescript ion Navigat ionNavigat ion
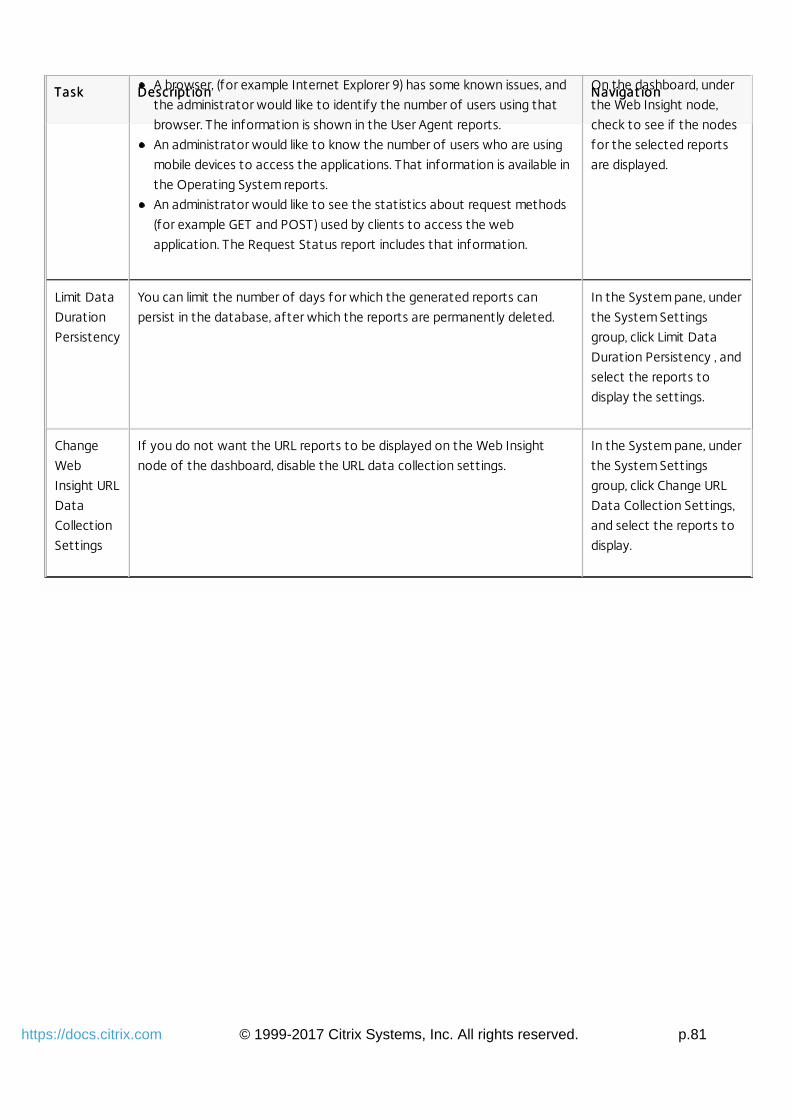
© 1999-2017 Citrix Systems, Inc. All rights reserved. p.81https://docs.citrix.com
A browser, (for example Internet Explorer 9) has some known issues, and
the administrator would like to identify the number of users using that
browser. The information is shown in the User Agent reports.
An administrator would like to know the number of users who are using
mobile devices to access the applications. That information is available in
the Operating System reports.
An administrator would like to see the statistics about request methods
(for example GET and POST) used by clients to access the web
application. The Request Status report includes that information.
On the dashboard, under
the Web Insight node,
check to see if the nodes
for the selected reports
are displayed.
Limit Data
Duration
Persistency
You can limit the number of days for which the generated reports can
persist in the database, after which the reports are permanently deleted.
In the System pane, under
the System Settings
group, click Limit Data
Duration Persistency , and
select the reports to
display the settings.
Change
Web
Insight URL
Data
Collection
Settings
If you do not want the URL reports to be displayed on the Web Insight
node of the dashboard, disable the URL data collection settings.
In the System pane, under
the System Settings
group, click Change URL
Data Collection Settings,
and select the reports to
display.
TaskTask Descript ionDescript ion Navigat ionNavigat ion
© 1999-2017 Citrix Systems, Inc. All rights reserved. p.82https://docs.citrix.com
Configuring Authentication and Authorization Settings
May 14 , 2015
Authentication with the NetScaler Insight Center appliance can be local or external. With external authentication, theNetScaler Insight Center appliance grants user access on the basis of the response from an external server. It supports thefollowing external authentication protocols:
Remote Authentication Dial In User Service (RADIUS)
Terminal Access Controller Access-Control System (TACACS)
Lightweight Directory Access Protocol (LDAP)
The NetScaler Insight Center appliance also supports authentication requests from SSH. The SSH authentication supports
only keyboard-interactive authentication requests. The authorization of SSH users is limited to Superuser privileges only.
Users with readonly privileges cannot log on through SSH.
To configure authentication, specify the authentication type, and configure an authentication server.
Authorization through the NetScaler Insight Center appliance is local. The NetScaler Insight Center appliance supports two
levels of authorization. Users with superuser privileges are allowed to perform any action on the appliance. Users with
readonly privileges are allowed to perform only read operations. The authorization of SSH users is limited to superuser
privileges only. Users with readonly privileges cannot log on through SSH.
Authorization for RADIUS and LDAP is supported by group extraction. You can set the group extraction attributes during
the configuration of RADIUS or LDAP servers on the NetScaler Insight Center appliance. The extracted group name is
matched with the group names on the NetScaler Insight Center appliance to determine the privileges given to the user. A
user can belong to multiple groups. In that case, if any group to which the user belongs has superuser privileges, the user
has superuser privileges. A Default authentication group attribute can be set during configuration. This group is considered
along with the extracted groups for authorization.
In the case of TACACS authorization, the TACACS server administrator must permit a special command, superuser for a user
who is to have superuser privileges and deny this command for users with readonly privileges. When a user logs on to
NetScaler Insight Center, it checks if the user has permission to execute this command and if the user has permission, the
user is assigned the superuser privileges else the user is assigned readonly privileges.
This topic provides you the following details:Configuring User Accounts
Adding a User Group
Setting the Authentication Type
A user logs on to the NetScaler Insight Center appliance to perform appliance management tasks. To allow a user to access
the appliance, you must create a user account on the NetScaler Insight Center appliance for that user. Users are
authenticated locally, on the appliance. You can also enable external authentication for the user and specify the amount
of time for which the a user can remain logged on.
To configure a user accountTo configure a user account
On the Configuration tab, navigate to System > User Administration > Users and, in the UsersUsers pane, add or edit a user
account.
© 1999-2017 Citrix Systems, Inc. All rights reserved. p.83https://docs.citrix.com
Groups are logical sets of users that need to access common information or perform similar kinds of tasks. You can
organize users into groups defined by a set of common operations. By providing specific permissions to groups rather than
individual users, you can save time when creating new users.
If you are using external authentication servers for authentication, groups in NetScaler Insight Center appliance can be
configured to match groups configured on authentication servers. When a user belonging to a group whose name matches
a group on an authentication server, logs on and is authenticated, the user inherits the settings for the group in NetScaler
Insight Center appliance.
To add a user groupTo add a user group
On the Configurat ionConfigurat ion tab, navigate to System > User Administration > Groups, and then, create a user group.
From the NetScaler Insight Center graphical user interface (GUI), you can specify local or external authentication. External
authentication is disabled for local users by default. It can be enabled by checking the Enable External Authentication
option when adding the local user or modifying the settings for the user.
Important: External authentication is supported only after you set up a RADIUS, LDAP, or TACACS authentication server.To set t he aut hent icat ion t ypeTo set t he aut hent icat ion t ype
1. On the Configuration tab, navigate to System > Authentication.
2. In the details pane, click Authentication Configuration.
3. Set the following parameters:
Server Type— Type of authentication server configured for user authentication. Possible values: LDAP, RADIUS,
TACACS, and Local.
Server Name— Name of the authentication server configured in the NetScaler Insight Center appliance. The menu
lists all the servers configured for the selected authentication type.
Enable fallback local authentication— Alternatively, you can choose to authenticate a user with the local
authentication when external authentication fails. This option is enabled by default.
4. Click OK.
© 1999-2017 Citrix Systems, Inc. All rights reserved. p.84https://docs.citrix.com
Configuring the External Authentication Server
May 14 , 2015
The NetScaler Insight Center appliance can authenticate users with local user accounts or by using an external
authentication server. The appliance supports the following authentication types:
Local— Authenticates to the NetScaler Insight Center appliance by using a password, without reference to an external
authentication server. User data is stored locally on theNetScaler Insight Center appliance.
RADIUS— Authenticates to an external RADIUS authentication server.
LDAP— Authenticates to an external LDAP authentication server.
TACACS— Authenticates to an external Terminal Access Controller Access-Control System (TACACS) authentication
server.
To configure an external authentication, specify the authentication type, and configure an authentication server.
To configure RADIUS authentication, specify the authentication type as RADIUS, and configure the RADIUS authentication
server.
NetScaler Insight Center supports RADIUS challenge response authentication according to the RADIUS specifications.
RADIUS users can be configured with a one-time password on RADIUS server. When the user logs on to NetScaler Insight
Center appliance, the user is prompted to specify this one time password.
To add a RADIUS serverTo add a RADIUS server
1. On the Conf igurat ionConf igurat ion tab, under Syst emSyst em, expand Aut hent icat ionAut hent icat ion, and then click RadiusRadius.
2. In the details pane, click AddAdd.
3. In the Create Radius Server dialogue box, type or select values for the parameters:
Name*— Name of the server.
IP Address*— Server IP address.
Port *Port * — Port on which the RADIUS server is running. Default value: 1812.
Time-out*— Number of seconds the system will wait for a response from the RADIUS server. Default value: 3.
Secret Key*— Key shared between the client and the server. This information is required for communication between
the system and the RADIUS server.
Enable NAS IP Address Extraction— If enabled, the system's IP address is sent to the server as the "nasip" in
accordance with the RADIUS protocol.
NASID— If configured, this string is sent to the RADIUS server as the "nasid" in accordance with the RADIUS protocol.
Group Prefix— Prefix string that precedes group names within a RADIUS attribute for RADIUS group extraction.
Group Vendor ID— Vendor ID for using RADIUS group extraction.
Group Attribute Type— Attribute type for RADIUS group extraction.
Group Separator— Group separator string that delimits group names within a RADIUS attribute for RADIUS group
extraction.
IP Address Vendor Identif ier— Vendor ID of the attribute in the RADIUS which denotes the intranet IP. A value of 0
denotes that the attribute is not vendor encoded.
IP Address Attribute Type— Attribute type of the remote IP address attribute in a RADIUS response.
Password Vendor Identif ier— Vendor ID of the password in the RADIUS response. Used to extract the user password.
Password Attribute Type— Attribute type of the password attribute in a RADIUS response.
© 1999-2017 Citrix Systems, Inc. All rights reserved. p.85https://docs.citrix.com
Password Encoding— How passwords should be encoded in the RADIUS packets traveling from the system to the
RADIUS server. Possible values: pap, chap, mschapv1, and mschapv2.
Default Authentication Group— Default group that is chosen when the authentication succeeds in addition to
extracted groups.
4. Click Create, and then, click Close.
To configure LDAP authentication, specify the authentication type as LDAP, and configure the LDAP authentication server.
To add an LDAP serverTo add an LDAP server
1. On the Conf igurat ionConf igurat ion tab, under Syst emSyst em, expand Aut hent icat ionAut hent icat ion, and then click LDAPLDAP .
2. In the details pane, click AddAdd.
3. In the Create LDAP Server dialogue box, type or select values for the parameters:
Name*— Name of the server.
IP Address*— Server IP address.
Port *Port * — Port on which the LDAP server is running. Default value: 389.
Time-out*— Number of seconds the system will wait for a response from the LDAP server.
Base DN— Base, or node where the LDAP search should start.
Type— Type of LDAP server. Possible values: Active Directory (AD) and Novell Directory Service (NDS).
Administrative Bind DN— Full distinguished name that is used to bind to the LDAP server.
Administrative Password— Password that is used to bind to the LDAP server.
Confirm Administrative Password— Password that is used to bind to the LDAP server.
Validate LDAP Certif icate— Check this option to validate the certif icate received from LDAP server.
LDAP Host Name— Hostname for the LDAP server. If the validateServerCert parameter is enabled, this parameter
specif ies the host name on the certif icate from the LDAP server. A host-name mismatch causes a connection failure.
Server Logon Name Attribute— Name attribute used by the system to query the external LDAP server or an Active
Directory.
Search Filter— String to be combined with the default LDAP user search string to form the value. For example,
vpnallowed=true with ldaploginame samaccount and the user-supplied username bob would yield an LDAP
search string of : (&(vpnallowed=true)(samaccount=bob).Group Attribute— Attribute name for group extraction from the LDAP server.
Sub Attribute Name— Subattribute name for group extraction from the LDAP server.
Security Type— Type of encryption for communication between the appliance and the authentication server. Possible
values:
PLAINTEXT: No encryption required.
TLS: Communicate using TLS protocol.
SSL: Communicate using SSL Protocol
Default Authentication Group— Default group that is chosen when the authentication succeeds in addition to
extracted groups.
Referrals— Enable following of LDAP referrals received from LDAP server.
Enable Change Password— Allow user to modify the password if the password expires. You can change the password
only when the Security Type configured is TLS or SSL.
Enable Nested Group Extraction— Enable Nested Group extraction feature.
Maximum Nesting Level— Number of levels at which group extraction is allowed.
© 1999-2017 Citrix Systems, Inc. All rights reserved. p.86https://docs.citrix.com
Group Name Identif ier— Name that uniquely identif ies a group in LDAP server.
Group Search Attribute— LDAP group search attribute. Used to determine to which groups a group belongs.
Group Search Subattribute— LDAP group search subattribute. Used to determine to which groups a group belongs.
Group Search Filter— String to be combined with the default LDAP group search string to form the search value.
4. Click Create, and then click Close.
To configure TACACS authentication, specify the authentication type as TACACS, and configure the TACACS
authentication server.
To add a TACACS serverTo add a TACACS server
1. On the Conf igurat ionConf igurat ion tab, under Syst emSyst em, expand Aut hent icat ionAut hent icat ion, and then click T ACACST ACACS .
2. In the details pane, click AddAdd.
3. In the Create TACACS Server dialogue box, type or select values for the parameters:
Name— Name of the TACAS server
IP Address— IP address of the TACACS server
Port— Port on which the TACACS Server is running. Default value: 49
Time-out— Maximum number of seconds the system will wait for a response from the TACACS server
TACACS Key — Key shared between the client and the server. This information is required for the system to
communicate with the TACACS server
Confirm TACACS Key — Key shared between the client and the server. This information is required for the system to
communicate with the TACACS server
Default Authentication Group— Default group that is chosen when the authentication succeeds in addition to
extracted groups.
4. Click Creat eCreat e , and then click CloseClose .
© 1999-2017 Citrix Systems, Inc. All rights reserved. p.87https://docs.citrix.com
Working with SSL Files
May 15, 2015
Before installing an SSL certificate, you must upload the SSL files to NetScaler Insight Center. Installing an SSL certificate
terminates all current client sessions with the NetScaler Insight Center, so you have to log in again for any additional
configuration tasks.
This topic includes the following details:Uploading SSL f iles to the NetScaler Insight Center
Installing an SSL Certif icate
Viewing SSL Certif icate Details
For any SSL transaction, the server needs a valid certificate and the corresponding private and public key pair. The certificate
file must be present on the NetScaler Insight Center virtual appliance when you install the SSL certificate on NetScaler
Insight Center. You can also download the SSL Certificate and key files to a local computer as a backup.
To upload SSL certificate files to NetScaler Insight Center
1. On the Configuration tab, expand NetScaler Insight Center, and then click SSL Certif icate f iles.
2. In the SSL Certif icates pane, from the Action drop-down list, select Upload.
3. In the Upload SSL Certif icate dialog box, click Browse and select the certif icate f ile that you want to upload.
To create a backup for an SSL certificate file
On the SSL Certificates pane, select the file that you want to download, and then from the Action drop-down list, select
Download and browse to the location where you want to save the file.
After installing the certificate and key files, you can install the SSL certificate.
To install an SSL certificate on NetScaler Insight Center
On the Configuration tab, click System, and in the Set up Set up Net Scaler Insight Cent erNet Scaler Insight Cent er,, group, click Install SSL Certificate
and install the SSL certificate.
The NetScaler Insight Center virtual appliance uses an SSL certif icate for secure client connections. After installing thecertif icate, you can view details such as certif icate's validity status, issuer, subject, days to expiration, valid from and todates, version, and serial number.
To view the SSL certificate on NetScaler Insight Center
1. In the navigation pane, click System.
2. In the System pane, under Setup NetScaler InsightSetup NetScaler Insight, click View SSL Certif icate. The certif icate
details appear.
© 1999-2017 Citrix Systems, Inc. All rights reserved. p.88https://docs.citrix.com
Configuring Clock Synchronization
May 15, 2015
You can configure your NetScaler Insight Center virtual appliance to synchronize its local clock with the Network Time
Protocol (NTP) server used by your servers and device. NetScaler Insight Center then has the same date and time settings
as the other servers and appliances in your network. The clock synchronization configuration does not change if NetScaler
Insight Center is restarted, upgraded, or downgraded.
The clock is synchronized immediately if you add a new NTP server or change any of the authentication parameters. You
can also explicitly enable and disable NTP synchronization.
Note: If you do not have a local NTP server, you can f ind a list of public and open access NTP servers at the off icial NTPsite, http://www.ntp.org. Before configuring a device or other network entity to use a public NTP server, be sure to readthe Rules of EngagementRules of Engagement page (link included on all Public T ime Servers pages).This topic includes the following details:
Configuring an NTP Server
Enabling an NTP Synchronization
Modifying the Authentication Options
To synchronize the local time of the NetScaler Insight Center appliance, you have to first configure an NTP server.
To add an NT P serverTo add an NT P server
1. On the Configuration tab, expand System > NTP Servers.
2. In the details pane, create or modify an NTP server.
After configuring the NTP server, you must enable the NTP synchronization for the lnsight appliance to synchronize its local
time with the NTP server.
To enable an NT P synchronizat ionTo enable an NT P synchronizat ion
On the Configuration tab, navigate to System> NTP Servers, Then, in the users pane, from the Action drop-down list, select
NTP Synchronization and enable NTP synchronization.
You can modify the options for authenticating an NTP server.
To modif y t he aut hent icat ion opt ionsTo modif y t he aut hent icat ion opt ions
On the Configuration tab, navigate to System > NTP Servers, and in users pane, from the Action drop-down list, select
Authentication Parameters and modify the authentication options.
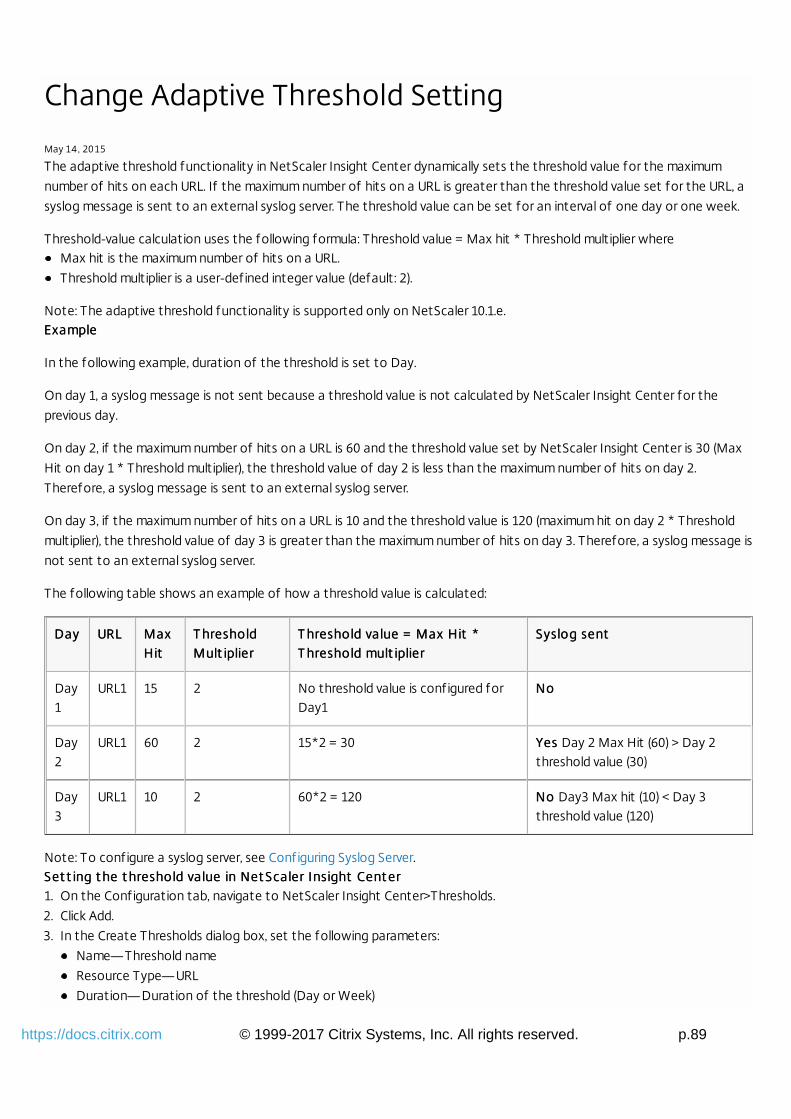
© 1999-2017 Citrix Systems, Inc. All rights reserved. p.89https://docs.citrix.com
Change Adaptive Threshold Setting
May 14 , 2015
The adaptive threshold functionality in NetScaler Insight Center dynamically sets the threshold value for the maximum
number of hits on each URL. If the maximum number of hits on a URL is greater than the threshold value set for the URL, a
syslog message is sent to an external syslog server. The threshold value can be set for an interval of one day or one week.
Threshold-value calculation uses the following formula: Threshold value = Max hit * Threshold multiplier whereMax hit is the maximum number of hits on a URL.
Threshold multiplier is a user-defined integer value (default: 2).
Note: The adaptive threshold functionality is supported only on NetScaler 10.1.e.ExampleExample
In the following example, duration of the threshold is set to Day.
On day 1, a syslog message is not sent because a threshold value is not calculated by NetScaler Insight Center for the
previous day.
On day 2, if the maximum number of hits on a URL is 60 and the threshold value set by NetScaler Insight Center is 30 (Max
Hit on day 1 * Threshold multiplier), the threshold value of day 2 is less than the maximum number of hits on day 2.
Therefore, a syslog message is sent to an external syslog server.
On day 3, if the maximum number of hits on a URL is 10 and the threshold value is 120 (maximum hit on day 2 * Threshold
multiplier), the threshold value of day 3 is greater than the maximum number of hits on day 3. Therefore, a syslog message is
not sent to an external syslog server.
The following table shows an example of how a threshold value is calculated:
DayDay URLURL MaxMaxHitHit
T hresholdT hresholdMult iplierMult iplier
T hreshold value = Max Hit *T hreshold value = Max Hit *T hreshold mult iplierT hreshold mult iplier
Syslog Syslog sentsent
Day1
URL1 15 2 No threshold value is configured forDay1
NoNo
Day2
URL1 60 2 15*2 = 30 YesYes Day 2 Max Hit (60) > Day 2threshold value (30)
Day3
URL1 10 2 60*2 = 120 NoNo Day3 Max hit (10) < Day 3threshold value (120)
Note: To configure a syslog server, see Configuring Syslog Server.Set t ing t he t hreshold value Set t ing t he t hreshold value in Net Scaler Insight Cent erin Net Scaler Insight Cent er1. On the Configuration tab, navigate to NetScaler Insight Center>Thresholds.
2. Click Add.
3. In the Create Thresholds dialog box, set the following parameters:
Name— Threshold name
Resource Type— URL
Duration— Duration of the threshold (Day or Week)

© 1999-2017 Citrix Systems, Inc. All rights reserved. p.90https://docs.citrix.com
Threshold Multiplier— User-defined integer value
4. Click Create.
© 1999-2017 Citrix Systems, Inc. All rights reserved. p.91https://docs.citrix.com
Diagnostics
May 15, 2015
The audit logs and task logs contains information which is useful in monitoring NetScaler Insight Center operations and
troubleshooting NetScaler Insight Center issues. Additionally, you can monitor the syslog events generated by the devices in
the NetScaler Insight Center inventory.
This document includes the following details:Using Audit Logs
Using Task Logs
Monitoring Syslog Events
Contacting Technical Support
Audit logs provide detailed information about user-initiated operations that are performed on the NetScaler Insight Center.
To view audit logs
1. On the Configuration tab, navigate to System > Audit.
2. View the following details of operations performed:
User nameUser name— Name of the user who performed the operation.
IP AddressIP Address— IP address of the devices on which the operation was performed.
PortPort — Port at which the system was sending and receiving data when the operation was performed.
Resource T ypeResource T ype — Type of resource on which the operation was performed.
Resource NameResource Name— Name of the resource used to perform the operation, and the user name used to log in.
Audit T imeAudit T ime— Time when the audit log was generated.
Operat ionOperat ion— Task that was performed, such as add, delete, or log out.
St at usSt at us— Status of the audit, such as success or failure.
MessageMessage— Message describing the status of a task and the cause of failure (if the operation failed).
Tasks logs provide detailed information about the operations that NetScaler Insight Center performs on NetScaler
appliances. The Task Logs category includes subcategories for devices and commands. The three types of logs can be
described as follows:
T ask LogsT ask Logs— The operations that were performed.
Device LogsDevice Logs— The devices on which the operations were performed.
Command LogsCommand Logs— The NetScaler or CloudBridge commands that were executed.
To view t he t ask logsTo view t he t ask logs
1. On the Configuration tab, navigate to Diagnostics > Task Log.
2. View the following details of tasks that were performed on the devices.
NameName— Name of the task that is being executed or has already been executed.
St at usSt at us— Status of the task, such as In progress, Completed, or Failed.
Execut ed byExecut ed by — NetScaler Insight Center user who performed the operation.
St art t imeSt art t ime— Time at which the task started.
© 1999-2017 Citrix Systems, Inc. All rights reserved. p.92https://docs.citrix.com
End t imeEnd t ime— Time at which the task ended.
3. Click a task to view the device logs. This is a list of the devices on which the operation was executed.
St at usSt at us— Status of the operation, such as In progress, Completed, or Failed.
IP addressIP address— IP address of the device.
St art T imeSt art T ime— Time at which the operation started.
End T ime.End T ime.— Time at which the operation ended.
4. Click a device to view the command logs. This is a list of the commands that were executed on that device.
St at usSt at us— Status of the operation, such as In progress, Completed, or Failed.
MessageMessage— Message describing the status of operation.
CommandCommand— The command that was executed.
St art T imeSt art T ime— Time at which the command started.
End T imeEnd T ime— Time at which the command ended.
You can monitor the syslog events generated by the devices in the NetScaler Insight Center inventory if you have
configured the NetScaler Insight Center virtual appliance to redirect all syslog messages to the syslog servers. To monitor
syslog events, you have to designate a syslog server. A syslog server is an external server that displays the log events
generated by NetScaler Insight Center. After you configure the syslog server, you can view the details of the events
generated by the devices.
Designating a Syslog Server
1. On the Configuration tab, navigate to System > Syslog Servers.
2. In the Syslogs Servers pane, click Add.
3. Enter the following details in the Add SysLog Server dialog box:
NameName— Name of the syslog server.
IP AddressIP Address— IP address of the syslog server.
PortPort — Port at which the system sends and receives data when the operation is performed.
By default, the port value is 514.
Log LevelsLog Levels— Select any of the log levels displayed.
4. Click Add. The syslog server is displayed on the Syslogs Servers pane.
Note: You can also select the date and time format to be displayed in the logs by selecting System Logs Parameters fromthe Action drop-down list.
Viewing Syslogs
1. On the Configuration tab, navigate to System > System logs.
2. The following details are displayed on System Logs pane:
Severit ySeverit y — Severity of the issue
SourceSource— IP address of the virtual server
Dat eDat e— Time and date when the issue was logged
Cat egoryCat egory — Category of the issue
MessageMessage— Details of the issue
Citrix recommends that before contacting technical support for debugging an issue, you generate an archive of the
© 1999-2017 Citrix Systems, Inc. All rights reserved. p.93https://docs.citrix.com
NetScaler Insight Center data and statistics. The archive is a TAR file that you send to the technical support team.
To create and send an archive file
1. On the Configuration tab, navigate to Diagnostics > Technical Support.
2. In the Generate Technical Support File dialog box, select either or all of the following and click OK.
Collect Debug Logs
Collect Data Distribution Logs
The archive f ile is created as a TAR f ile.
3. Download the f ile.
1. In the Technical Support pane, select the f ile to be downloaded.
2. From the Action drop-down list, select the Download option.
3. In the File Download message box, click Save.
4. In the Save As message box, browse to the location where you want to save the f ile, and then click Save.
4. Email the f ile to the Citrix technical support team.
© 1999-2017 Citrix Systems, Inc. All rights reserved. p.94https://docs.citrix.com
Troubleshooting Tips
Dec 30 , 2015
Following are some reported problems and their resolutions.
I cannot see any records on t he I cannot see any records on t he Net Scaler Insight Cent erNet Scaler Insight Cent er dashboard. dashboard.
If no reports appear on the dashboard after you have enabled AppFlow for at least one virtual server on a NetScaler ADC
or NetScaler Gateway that has been added to the inventory, check the following:
Is the NetScaler Insight Center version the same as or higher than the NetScaler ADC version?
Does the NetScaler ADC have the required license for NetScaler Insight Center to collect data? For details, see Licensing
Information.
Are all the configurations implemented from NetScaler Insight center, and not from the NetScaler ADC?
Did you wait for 5 minutes for the data to appear on the dashboard? If not, wait for at least 5 minutes for NetScaler
Insight Center to display the data.
Is the configuration utility displaying any repeating error messages? If so, check to see if there are any core dumps in the
/var/core directory.
Is AppFlow enabled on the NetScaler appliance?
Is AppFlow logging enabled on the virtual servers (load balancing, content switching, or VPN virtual servers) of the
NetScaler appliance?
Is AppFlow enabled for the services and service groups that are bound to the load balancing virtual servers?
Does the AppFlow policy for the virtual server have the highest priority for which AppFlow is most recently enabled? (If
AppFlow is enabled for a virtual server on more than one NetScaler Insight Center virtual appliance, the virtual appliance
on which AppFlow was most recently enabled for the NetScaler appliance collects the information). Follow the below
procedure to check the priority:
1. On the NetScaler appliance, navigate to Traff ic Management.
2. Expand Load Balancing, or expand Content Switching and then click Virtual servers.
3. Double-click the virtual server for which you want to see if AppFlow is enabled.
4. In the Conf igure Virt ual Server (Load Balancing)Conf igure Virt ual Server (Load Balancing) or Conf igure Virt ual Server (Cont ent Swit ching)Conf igure Virt ual Server (Cont ent Swit ching) dialog box,
on the PoliciesPolicies tab, click the arrow in the right corner of the dialog box.
5. Select AppFlowAppFlow from the drop-down list.
6. Check if the AppFlow policy name has the highest priority.
Also, from the command line interface, run the sh appflow global command to make sure that the global AppFlow
policies do not override the virtual server policies.
Are the NetScaler Insight Center virtual appliances and port values set correctly on the NetScaler appliance? To check:
1. On the Configuration tab of NetScaler appliance, navigate to System > AppFlow.
2. Under Policy manager select AppFlow policy Manager.
3. Select a virtual server (LB virtual server or CS Virtual server).
4. Double click Act ion NameAct ion Name and verify that if the NetScaler Insight Center IP address and port are correct.
On the NetScaler appliance, is traff ic f lowing through the virtual server for which data collection was enabled in
NetScaler Insight Center? Also verify that the hits counter is increasing on the AppFlow policy, by running the following
command from the NetScaler command line interface:
sh appflow policy <policyname>
Is UDP port 4739 on the NetScaler Insight Center virtual appliance reachable from NetScaler appliance?
To see Web Insight records, run the following command on the NetScaler command line interface to check if Log only
© 1999-2017 Citrix Systems, Inc. All rights reserved. p.95https://docs.citrix.com
client-side traff ic is set to NONO.
show appflow param
Example
> show appflow param AppFlow parameters IPFIX template refresh interval: 3600 seconds Appname refresh interval: 60 seconds IPFIX flow record export interval: 60 seconds IPFIX UDP Path MTU: 1472 bytes HTTP URL logging: ENABLED AAA username logging: ENABLED HTTP cookie logging: ENABLED HTTP referer logging: ENABLED HTTP method logging: ENABLED HTTP host logging: ENABLED HTTP user-agent logging: ENABLED HTTP Content-Type header logging: ENABLED HTTP Authorization header logging: ENABLED HTTP Via header logging: ENABLED HTTP X-Forwarded-For header logging: ENABLED HTTP Location header logging: ENABLED HTTP Setcookie header logging: ENABLED HTTP Setcookie2 header logging: ENABLED Log only cl ient-side traffic: NO Connection Chaining: DISABLED If Log only client-side traff ic is set to YES, then run the following command to change the setting to NO:
set appflow param -clientTrafficOnly (YES | NO)
Example:
set appflow param -clientTrafficOnly NOIs NetScaler Insight Center receiving data records from the device?
To verify that NetScaler Insight Center is receiving data records,
On the NetScaler Insight Center virtual machine, open the mps_afdecoder.log f ile located in /var/mps/log/ and check
to see if the f ile displays text similar to the following once every second:
Monday, 22 Dec 14 20:12:03 +0000 [Debug] For AFProto Thread id :: 34473829696, Elapsed time is:1010014 micro sec, Packet pick up is: 19, Packet processed is: 19, Decode rate is: 18/sec, Meandecode rate is: 13/sec, Data record processed is: 29, Data record routed is: 15
Following are descriptions of the parameters in the above text:
Elapsed time is: T ime consumed, in microseconds, since NetScaler Insight Center last displayed this text.
Packet pick up is: Number of UDP packets that NetScaler Insight Center has received in the elapsed time.
Packet processed is: Number of UDP packets that NetScaler Insight Center has processed in the elapsed time.
Decode rate is and Mean decode rate is: Rate at which NetScaler Insight Center has received UDP packets.
Data record processed is: Number of data records present in the UDP packets that were successfully decoded.
(One UDP packet can contain more than one data record).
© 1999-2017 Citrix Systems, Inc. All rights reserved. p.96https://docs.citrix.com
Data record routed is: Number of data records that were routed properly to a proper handler (such as Web Insight
or HDX Insight).
If the Dat a record rout ed isDat a record rout ed is parameter's value is consistently zero, the NetScaler Insight Center virtual machine is
not receiving any valid data records. Check the device's AppFlow configuration, or contact the technical support team
to debug the issue.
On the NetScaler Insight Center virtual machine, in the mps_afdecoder.log f ile located at /var/mps/log/, check to see
if NetScaler Insight Center displays the data records, such as :
ica_session_setup, ica_session_network_update, and ica_session_update, every second for HDX Insight.
l7_clt_to_ns, ns_es4ns_client_load and ns_es4ns_client_render records every second for Web Insight.
If it displays these records, the data records are being sent to NetScaler Insight Center. Otherwise, check the device's
AppFlow configuration.
Are the data record logs enabled for Web Insight and/or HDX Insight?
To check, on the Configuration tab, click System, and in the right pane, select Change Data Record Log Settings and
verify that the HDX Insight Logs or/and Web Insight logs option is selected.
Note: Web Insight logs are disabled by default.
Enable Web Insight Logs only if the value of Dat a record rout ed isDat a record rout ed is parameter in the var/mps/log/mps_afdecoder.log
file is in the range of 1 to 20. If the value is more than 20, disable AppFlow on the virtual server that has high traffic. If
you enable Web Insight logs for a virtual server that has high traffic, the load on the mps_afdecoder.log file can become
heavy and the appliance can become unresponsive.
Net Scaler Insight Cent er does not display report s f or a part icular user name. What should I do?Net Scaler Insight Cent er does not display report s f or a part icular user name. What should I do?
If you suspect that a particular user report is not being displayed, on the NetScaler Insight Center virtual machine, open the
mps_afdecoder.log f iles located in /var/mps/log/ f ile and run the following command:
grep <username> < mps_afdecoder.log>
If the output includes the user name, the user record is displayed in the reports. If the output does not display the user
name, verify that the Citrix Receiver version being used is supported by NetScaler Insight Center. For details, see Supported
Software.
Why does t he WAN lat ency and DC lat ency met rics display t he values zero?Why does t he WAN lat ency and DC lat ency met rics display t he values zero?
If the latency is less than 1 millisecond, the WAN latency and DC latency values are displayed as zero.
I am not able t o add a Net Scaler appliance. What are t he possible reasons?I am not able t o add a Net Scaler appliance. What are t he possible reasons?
Make sure that NetScaler appliance you add is UP and reachable when you add it to the Inventory. If the appliance is
DOWN, or OUT-OF-SERVICE, you cannot add it to the Inventory.
Make sure that you have not added a standalone Access Gateway Standard appliance.
T he session up t ime value is incorrect .T he session up t ime value is incorrect .
Make sure that the times set for the NetScaler appliance and NetScaler Insight Center are correct and in sync. For more
information, see Configuring Clock Synchronization.
T he graphs are not clearly displayed or t hey look scrambled.T he graphs are not clearly displayed or t hey look scrambled.
Clear the browser cache and retry. Also make sure the NetScaler Insight Center is supported on the browser. For details, see
Accessing NetScaler Insight Center.
I am unable t o log on t o I am unable t o log on t o Net Scaler Insight Cent erNet Scaler Insight Cent er t hrough t he Int ernet Explorer browser. t hrough t he Int ernet Explorer browser.
The browser might be set in compatibility mode. To disable compatibility mode, go to ToolsTools >Compat ibilit y ViewCompat ibilit y View
Set t ingsSet t ings and clear the Display all websit es in Compat ibilit y ViewDisplay all websit es in Compat ibilit y View check box.
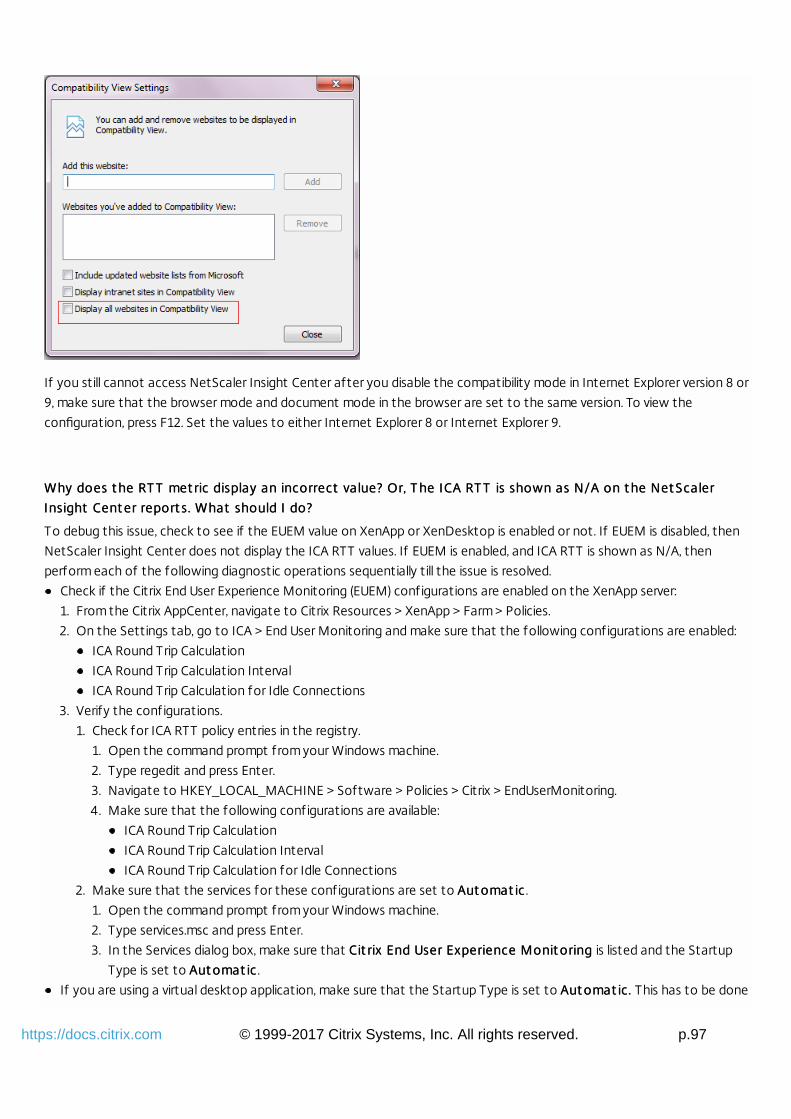
© 1999-2017 Citrix Systems, Inc. All rights reserved. p.97https://docs.citrix.com
If you still cannot access NetScaler Insight Center after you disable the compatibility mode in Internet Explorer version 8 or
9, make sure that the browser mode and document mode in the browser are set to the same version. To view the
configuration, press F12. Set the values to either Internet Explorer 8 or Internet Explorer 9.
Why does t he RT T met ric display an incorrect value? Or, T he ICA RT T is shown as N/A on t he Net ScalerWhy does t he RT T met ric display an incorrect value? Or, T he ICA RT T is shown as N/A on t he Net Scaler
Insight Cent er report s. What should I do?Insight Cent er report s. What should I do?
To debug this issue, check to see if the EUEM value on XenApp or XenDesktop is enabled or not. If EUEM is disabled, then
NetScaler Insight Center does not display the ICA RTT values. If EUEM is enabled, and ICA RTT is shown as N/A, then
perform each of the following diagnostic operations sequentially till the issue is resolved.
Check if the Citrix End User Experience Monitoring (EUEM) configurations are enabled on the XenApp server:
1. From the Citrix AppCenter, navigate to Citrix Resources > XenApp > Farm > Policies.
2. On the Settings tab, go to ICA > End User Monitoring and make sure that the following configurations are enabled:
ICA Round Trip Calculation
ICA Round Trip Calculation Interval
ICA Round Trip Calculation for Idle Connections
3. Verify the configurations.
1. Check for ICA RTT policy entries in the registry.
1. Open the command prompt from your Windows machine.
2. Type regedit and press Enter.
3. Navigate to HKEY_LOCAL_MACHINE > Software > Policies > Citrix > EndUserMonitoring.
4. Make sure that the following configurations are available:
ICA Round Trip Calculation
ICA Round Trip Calculation Interval
ICA Round Trip Calculation for Idle Connections
2. Make sure that the services for these configurations are set to Aut omat icAut omat ic .
1. Open the command prompt from your Windows machine.
2. Type services.msc and press Enter.
3. In the Services dialog box, make sure that Cit rix End User Experience Monit oringCit rix End User Experience Monit oring is listed and the Startup
Type is set to Aut omat icAut omat ic .
If you are using a virtual desktop application, make sure that the Startup Type is set to Aut omat ic.Aut omat ic. This has to be done
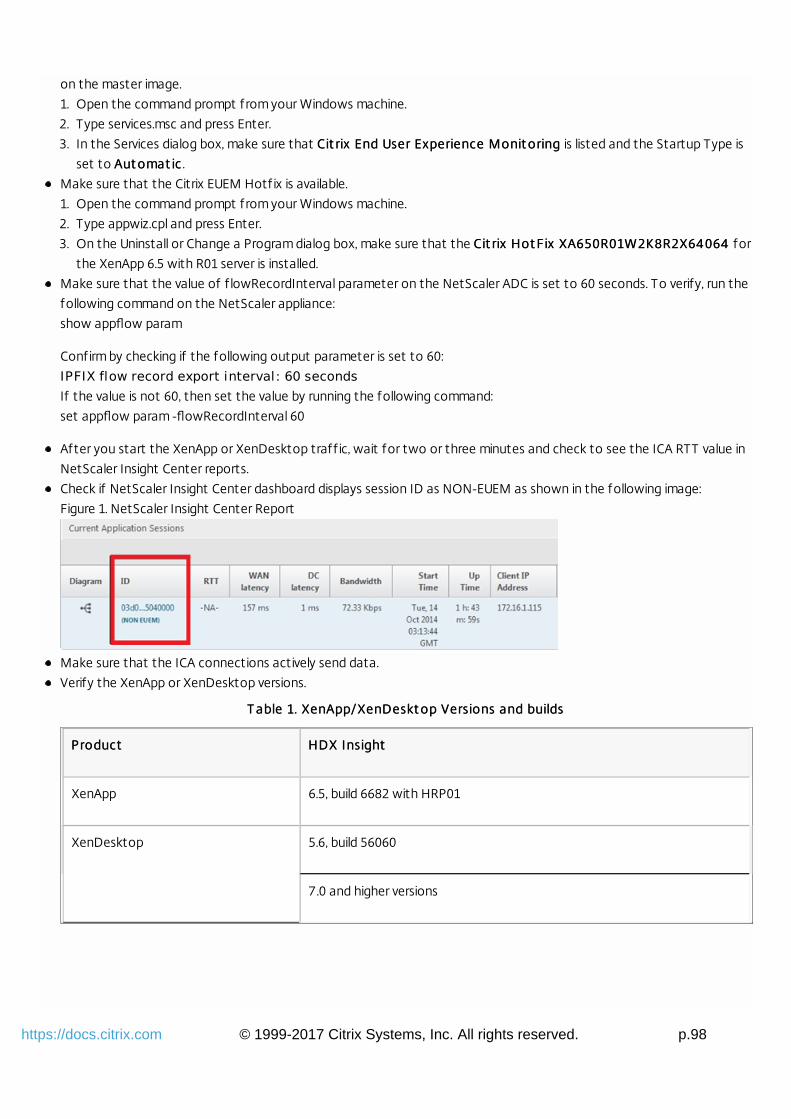
© 1999-2017 Citrix Systems, Inc. All rights reserved. p.98https://docs.citrix.com
on the master image.
1. Open the command prompt from your Windows machine.
2. Type services.msc and press Enter.
3. In the Services dialog box, make sure that Cit rix End User Experience Monit oringCit rix End User Experience Monit oring is listed and the Startup Type is
set to Aut omat icAut omat ic .
Make sure that the Citrix EUEM Hotfix is available.
1. Open the command prompt from your Windows machine.
2. Type appwiz.cpl and press Enter.
3. On the Uninstall or Change a Program dialog box, make sure that the Cit rix Hot Fix XA650R01W2K8R2X64 064Cit rix Hot Fix XA650R01W2K8R2X64 064 for
the XenApp 6.5 with R01 server is installed.
Make sure that the value of f lowRecordInterval parameter on the NetScaler ADC is set to 60 seconds. To verify, run the
following command on the NetScaler appliance:
show appflow param
Confirm by checking if the following output parameter is set to 60:
IPFIX flow record export interval: 60 secondsIf the value is not 60, then set the value by running the following command:
set appflow param -flowRecordInterval 60
After you start the XenApp or XenDesktop traff ic, wait for two or three minutes and check to see the ICA RTT value in
NetScaler Insight Center reports.
Check if NetScaler Insight Center dashboard displays session ID as NON-EUEM as shown in the following image:
Figure 1. NetScaler Insight Center Report
Make sure that the ICA connections actively send data.
Verify the XenApp or XenDesktop versions.
T able 1. XenApp/XenDeskt op Versions and buildsT able 1. XenApp/XenDeskt op Versions and builds
ProductProduct HDX InsightHDX Insight
XenApp 6.5, build 6682 with HRP01
XenDesktop 5.6, build 56060
7.0 and higher versions
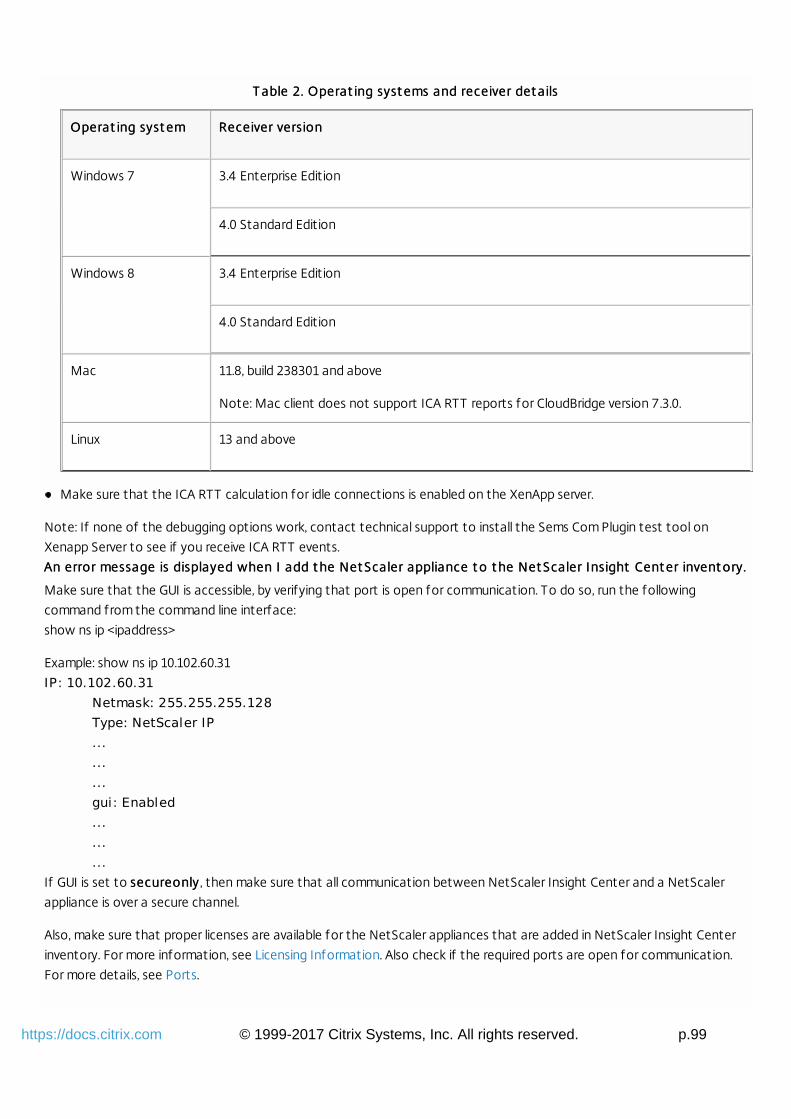
© 1999-2017 Citrix Systems, Inc. All rights reserved. p.99https://docs.citrix.com
T able 2. Operat ing syst ems and receiver det ailsT able 2. Operat ing syst ems and receiver det ails
Operat ing syst emOperat ing syst em Receiver versionReceiver version
Windows 7 3.4 Enterprise Edition
4.0 Standard Edition
Windows 8 3.4 Enterprise Edition
4.0 Standard Edition
Mac 11.8, build 238301 and above
Note: Mac client does not support ICA RTT reports for CloudBridge version 7.3.0.
Linux 13 and above
Make sure that the ICA RTT calculation for idle connections is enabled on the XenApp server.
Note: If none of the debugging options work, contact technical support to install the Sems Com Plugin test tool on
Xenapp Server to see if you receive ICA RTT events.
An error message is displayed when I add t he Net Scaler appliance t o t he Net Scaler Insight Cent er invent ory.An error message is displayed when I add t he Net Scaler appliance t o t he Net Scaler Insight Cent er invent ory.
Make sure that the GUI is accessible, by verifying that port is open for communication. To do so, run the following
command from the command line interface:
show ns ip <ipaddress>
Example: show ns ip 10.102.60.31
IP: 10.102.60.31 Netmask: 255.255.255.128 Type: NetScaler IP ... ... ... gui: Enabled ... ... ... If GUI is set to secureonlysecureonly , then make sure that all communication between NetScaler Insight Center and a NetScaler
appliance is over a secure channel.
Also, make sure that proper licenses are available for the NetScaler appliances that are added in NetScaler Insight Center
inventory. For more information, see Licensing Information. Also check if the required ports are open for communication.
For more details, see Ports.
© 1999-2017 Citrix Systems, Inc. All rights reserved. p.100https://docs.citrix.com
I am not able t o clear all t he AppFlow relat ed conf igurat ions f or a select ed virt ual server by using t heI am not able t o clear all t he AppFlow relat ed conf igurat ions f or a select ed virt ual server by using t he
Net Scaler Insight Cent er graphical user int erf ace.Net Scaler Insight Cent er graphical user int erf ace.
Log on to the NetScaler appliance by using the graphical user interface and delete the required collector and action. To
delete the action name, perform the following procedure:
1. Navigate to System > AppFlow > Actions.
2. Select the AppFlow action name that you want to delete.
3. Click Remove.
To delete the collector, perform the following procedure:
1. Navigate to System > AppFlow > Collectors.
2. Select the Collector name that you want to delete.
3. Click Remove.
T he f ollowing error is displayed when I upgrade t he Net Scaler Insight Cent er appliance: "Backup/ Rest oreT he f ollowing error is displayed when I upgrade t he Net Scaler Insight Cent er appliance: "Backup/ Rest ore
operat ion in progress. T ry af t er some t ime."operat ion in progress. T ry af t er some t ime."
Reboot the NetScaler Insight Center appliance or run the following commands at the NetScaler Insight Center shell
prompt:
/etc/rc.d/analyticsd stop /etc/rc.d/analyticsd startT he HDX Insight node does not appear on t he Net Scaler Insight Cent er dashboard.T he HDX Insight node does not appear on t he Net Scaler Insight Cent er dashboard.
Make sure that proper licenses are available for the NetScaler appliances that are added in NetScaler Insight Center
inventory. For more information, see Licensing Information. Also check if the required ports are open for communication.
For more details, see Ports.
An error message is displayed when I access Net Scaler Insight Cent er using Int ernet Explorer 8.An error message is displayed when I access Net Scaler Insight Cent er using Int ernet Explorer 8.
Some features of NetScaler Insight Center are not support on Internet Explorer 8. You can access the appliance using
Internet Explorer 9. For more details on browser support, see Accessing NetScaler Insight Center.
I cannot see t he wat erf all chart or t he Page Analysis but t on on t he Net Scaler Insight Cent er dashboard.I cannot see t he wat erf all chart or t he Page Analysis but t on on t he Net Scaler Insight Cent er dashboard.
Check the following possible causes:
1. Is the HTML Injection check box selected?
2. Is the URL response content type of the web page in text or HTML format? NetScaler Insight Center does not display
the waterfall charts if the response type is anything other than text or HTML.
3. Was the transaction for the web page successful? Make sure the response header indicates 200 OK.
4. Were the page rendering and loading successful? If either fails, the timing information is not received from the client and
the waterfall charts are not be displayed.
5. Check to see if the transactions are served by the NetScaler appliance (either NetScaler generated or served from
NetScaler cache). If so, the waterfall charts are not displayed.
6. Is the appropriate license installed on the NetScaler appliance?
Net Scaler Insight Cent er does not display t he HDX Insight report s f or CloudBridge appliances. What should INet Scaler Insight Cent er does not display t he HDX Insight report s f or CloudBridge appliances. What should I
do?do?
Check the f irewall configuration and make sure that the CloudBridge appliance and NetScaler Insight Center
communicate over port 4739.
Wait for 2 to 3 minutes after the traff ic is generated. NetScaler Insight Center usually takes two to three minutes to
display the HDX Insight reports for a user.
Check the CloudBridge discovery status on the NetScaler Insight Center Inventory.
Make sure that CloudBridge ICA connections are accelerated with Disk Based Compression (DBC) policy. To verify, on the
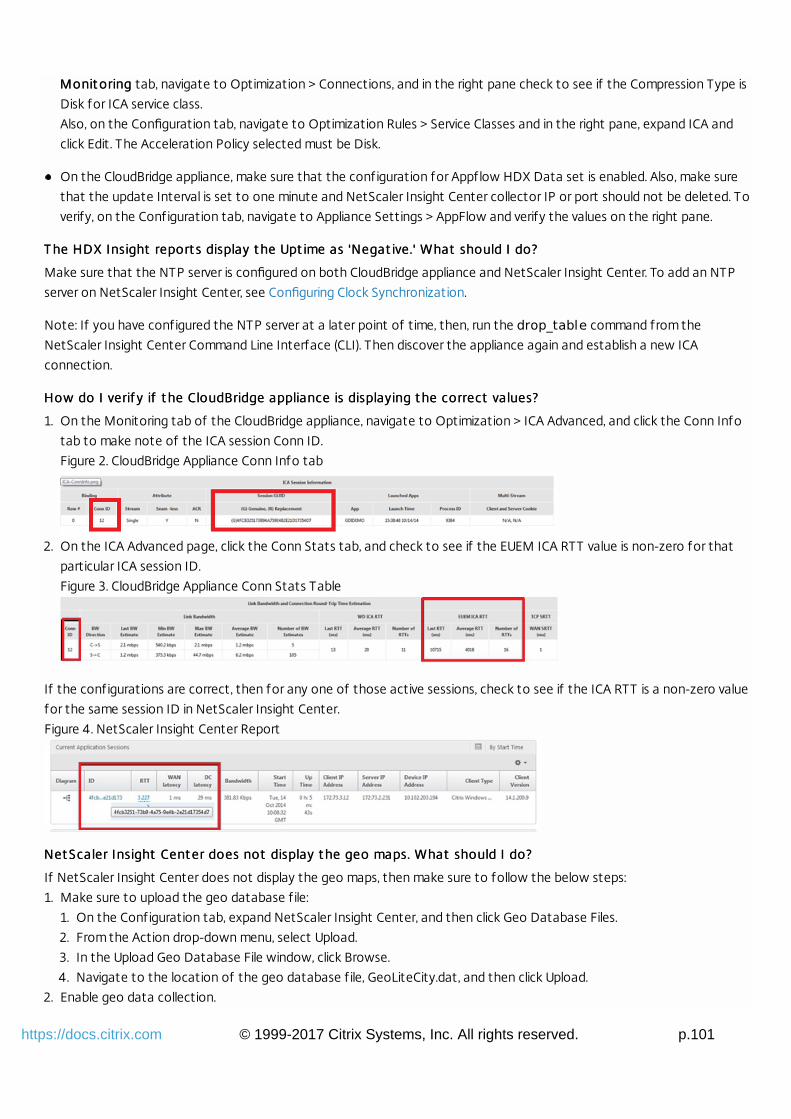
© 1999-2017 Citrix Systems, Inc. All rights reserved. p.101https://docs.citrix.com
Monit oringMonit oring tab, navigate to Optimization > Connections, and in the right pane check to see if the Compression Type is
Disk for ICA service class.
Also, on the Configuration tab, navigate to Optimization Rules > Service Classes and in the right pane, expand ICA and
click Edit. The Acceleration Policy selected must be Disk.
On the CloudBridge appliance, make sure that the configuration for Appflow HDX Data set is enabled. Also, make sure
that the update Interval is set to one minute and NetScaler Insight Center collector IP or port should not be deleted. To
verify, on the Configuration tab, navigate to Appliance Settings > AppFlow and verify the values on the right pane.
T he HDX Insight report s display t he Upt ime as 'Negat ive.' What should I do?T he HDX Insight report s display t he Upt ime as 'Negat ive.' What should I do?
Make sure that the NTP server is configured on both CloudBridge appliance and NetScaler Insight Center. To add an NTP
server on NetScaler Insight Center, see Configuring Clock Synchronization.
Note: If you have configured the NTP server at a later point of time, then, run the drop_table command from the
NetScaler Insight Center Command Line Interface (CLI). Then discover the appliance again and establish a new ICA
connection.
How do I verif y if t he CloudBridge appliance is displaying t he correct values?How do I verif y if t he CloudBridge appliance is displaying t he correct values?
1. On the Monitoring tab of the CloudBridge appliance, navigate to Optimization > ICA Advanced, and click the Conn Info
tab to make note of the ICA session Conn ID.
Figure 2. CloudBridge Appliance Conn Info tab
2. On the ICA Advanced page, click the Conn Stats tab, and check to see if the EUEM ICA RTT value is non-zero for that
particular ICA session ID.
Figure 3. CloudBridge Appliance Conn Stats Table
If the configurations are correct, then for any one of those active sessions, check to see if the ICA RTT is a non-zero value
for the same session ID in NetScaler Insight Center.
Figure 4. NetScaler Insight Center Report
Net Scaler Insight Cent er does not display t he geo maps. What should I do?Net Scaler Insight Cent er does not display t he geo maps. What should I do?
If NetScaler Insight Center does not display the geo maps, then make sure to follow the below steps:
1. Make sure to upload the geo database f ile:
1. On the Configuration tab, expand NetScaler Insight Center, and then click Geo Database Files.
2. From the Action drop-down menu, select Upload.
3. In the Upload Geo Database File window, click Browse.
4. Navigate to the location of the geo database f ile, GeoLiteCity.dat, and then click Upload.
2. Enable geo data collection.
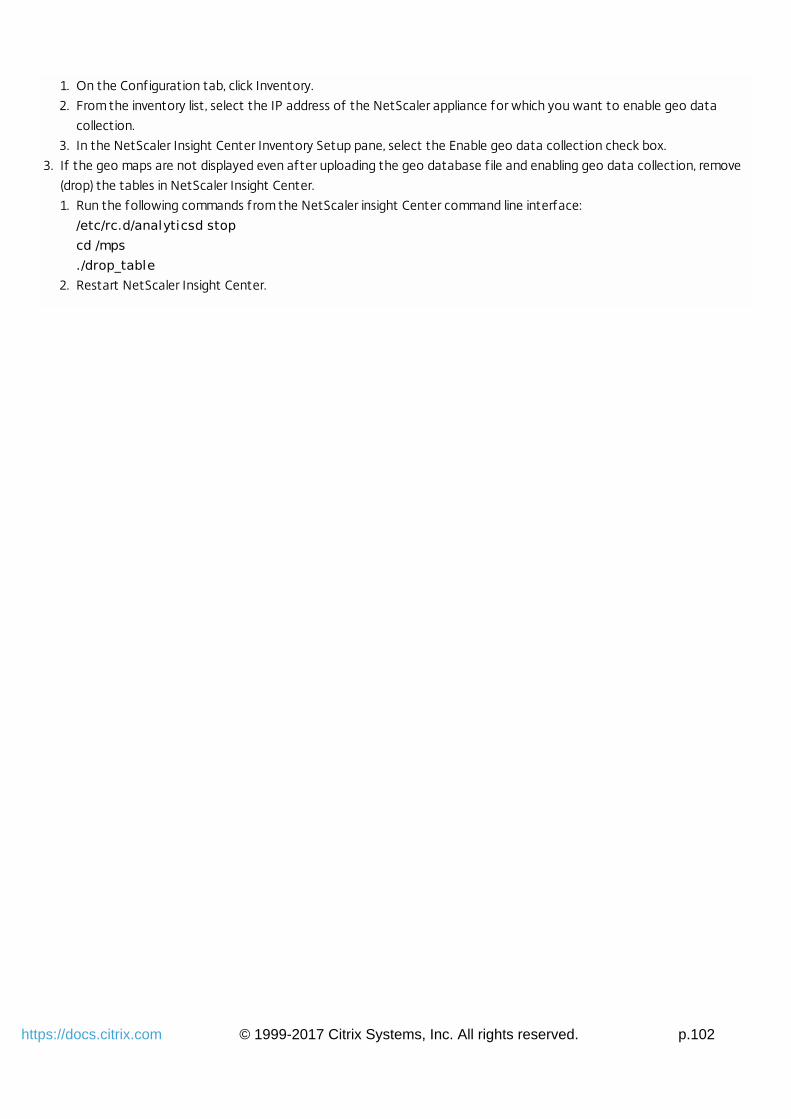
© 1999-2017 Citrix Systems, Inc. All rights reserved. p.102https://docs.citrix.com
1. On the Configuration tab, click Inventory.
2. From the inventory list, select the IP address of the NetScaler appliance for which you want to enable geo data
collection.
3. In the NetScaler Insight Center Inventory Setup pane, select the Enable geo data collection check box.
3. If the geo maps are not displayed even after uploading the geo database f ile and enabling geo data collection, remove
(drop) the tables in NetScaler Insight Center.
1. Run the following commands from the NetScaler insight Center command line interface:
/etc/rc.d/analyticsd stop cd /mps ./drop_table
2. Restart NetScaler Insight Center.
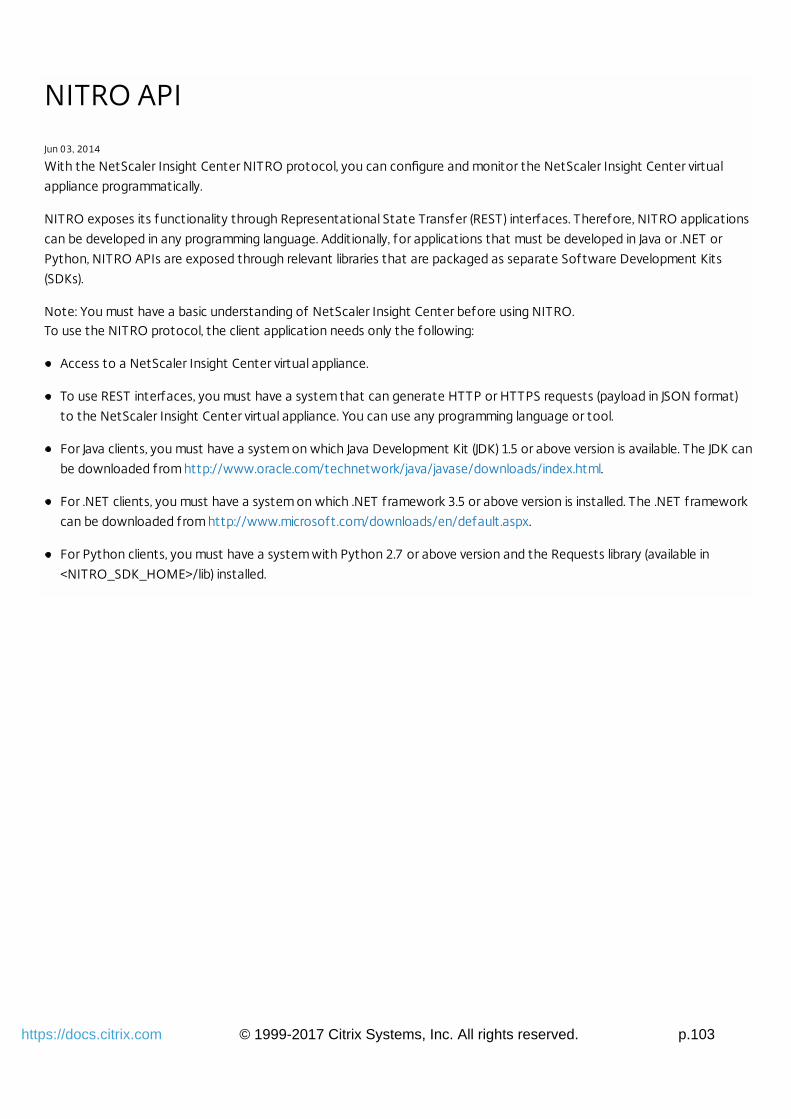
© 1999-2017 Citrix Systems, Inc. All rights reserved. p.103https://docs.citrix.com
NITRO API
Jun 03, 2014
With the NetScaler Insight Center NITRO protocol, you can configure and monitor the NetScaler Insight Center virtual
appliance programmatically.
NITRO exposes its functionality through Representational State Transfer (REST) interfaces. Therefore, NITRO applications
can be developed in any programming language. Additionally, for applications that must be developed in Java or .NET or
Python, NITRO APIs are exposed through relevant libraries that are packaged as separate Software Development Kits
(SDKs).
Note: You must have a basic understanding of NetScaler Insight Center before using NITRO.To use the NITRO protocol, the client application needs only the following:
Access to a NetScaler Insight Center virtual appliance.
To use REST interfaces, you must have a system that can generate HTTP or HTTPS requests (payload in JSON format)
to the NetScaler Insight Center virtual appliance. You can use any programming language or tool.
For Java clients, you must have a system on which Java Development Kit (JDK) 1.5 or above version is available. The JDK can
be downloaded from http://www.oracle.com/technetwork/java/javase/downloads/index.html.
For .NET clients, you must have a system on which .NET framework 3.5 or above version is installed. The .NET framework
can be downloaded from http://www.microsoft.com/downloads/en/default.aspx.
For Python clients, you must have a system with Python 2.7 or above version and the Requests library (available in
<NITRO_SDK_HOME>/lib) installed.
© 1999-2017 Citrix Systems, Inc. All rights reserved. p.104https://docs.citrix.com
Obtaining the NITRO Package
Jun 03, 2014
The NITRO package is available as a tar file on the Downloads page of the NetScaler Insight Center virtual appliance's
configuration utility. You must download and un-tar the file to a folder on your local system. This folder is referred to as
<NITRO_SDK_HOME> in this documentation.
The folder contains the NITRO libraries in the lib subfolder. The libraries must be added to the client application classpathto access NITRO functionality. The <NITRO_SDK_HOME> folder also provides samples and documentation that can helpyou understand the NITRO SDK.Note:
The REST package contains only documentation for using the REST interfaces.
For the Python SDK, the library must be installed on the client path. For installation instructions, read the
<NITRO_SDK_HOME>/README.txt file.
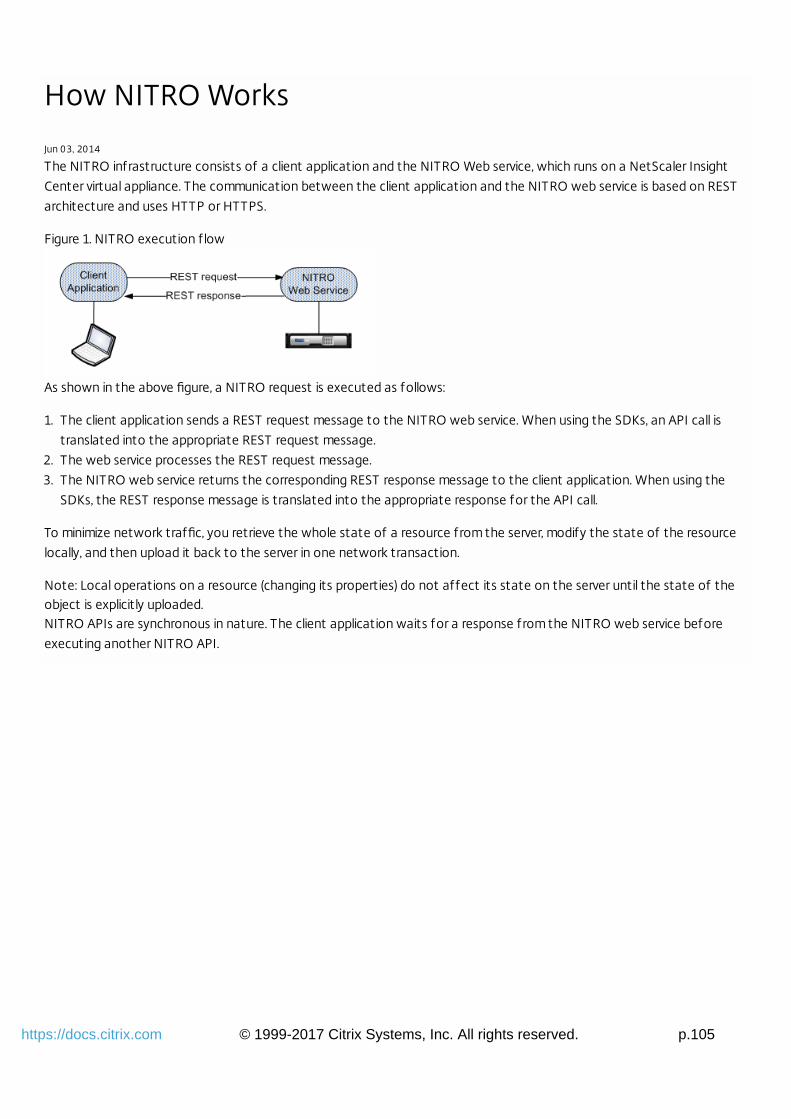
© 1999-2017 Citrix Systems, Inc. All rights reserved. p.105https://docs.citrix.com
How NITRO Works
Jun 03, 2014
The NITRO infrastructure consists of a client application and the NITRO Web service, which runs on a NetScaler Insight
Center virtual appliance. The communication between the client application and the NITRO web service is based on REST
architecture and uses HTTP or HTTPS.
Figure 1. NITRO execution f low
As shown in the above figure, a NITRO request is executed as follows:
1. The client application sends a REST request message to the NITRO web service. When using the SDKs, an API call is
translated into the appropriate REST request message.
2. The web service processes the REST request message.
3. The NITRO web service returns the corresponding REST response message to the client application. When using the
SDKs, the REST response message is translated into the appropriate response for the API call.
To minimize network traffic, you retrieve the whole state of a resource from the server, modify the state of the resource
locally, and then upload it back to the server in one network transaction.
Note: Local operations on a resource (changing its properties) do not affect its state on the server until the state of theobject is explicitly uploaded.NITRO APIs are synchronous in nature. The client application waits for a response from the NITRO web service before
executing another NITRO API.
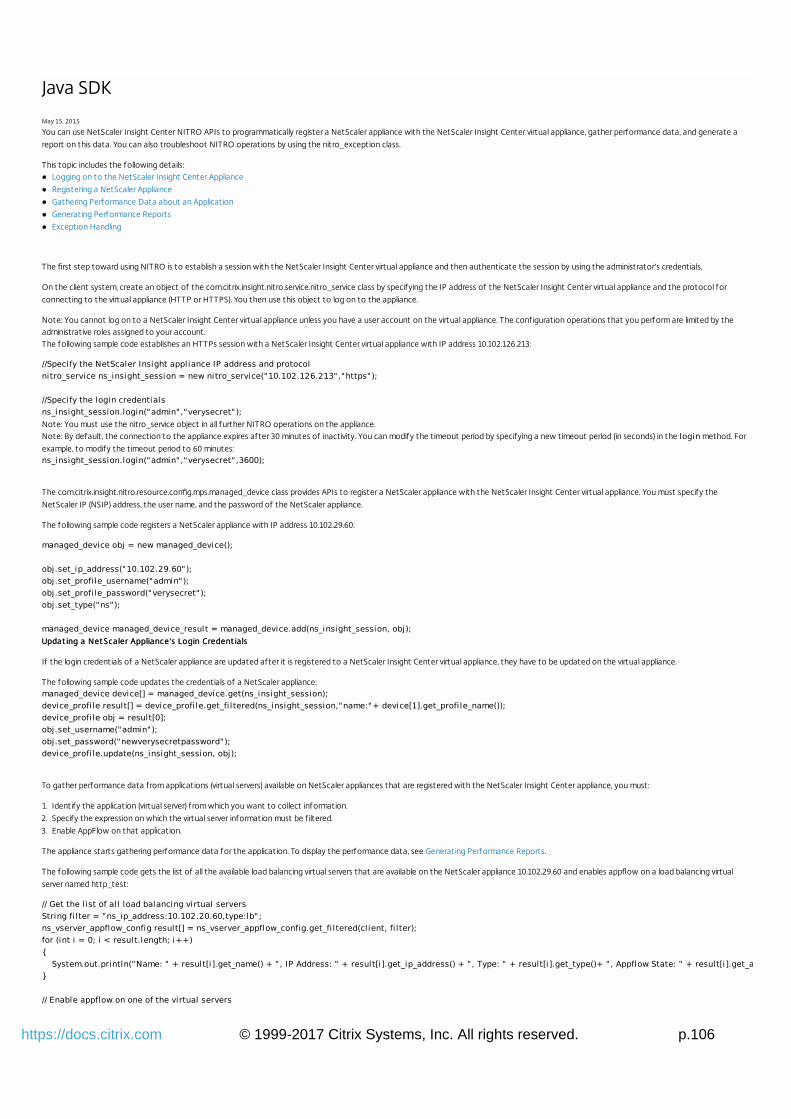
© 1999-2017 Citrix Systems, Inc. All rights reserved. p.106https://docs.citrix.com
Java SDK
May 15, 2015
You can use NetScaler Insight Center NITRO APIs to programmatically register a NetScaler appliance with the NetScaler Insight Center virtual appliance, gather performance data, and generate a
report on this data. You can also troubleshoot NITRO operations by using the nitro_exception class.
This topic includes the following details:Logging on to the NetScaler Insight Center Appliance
Registering a NetScaler Appliance
Gathering Performance Data about an Application
Generating Performance Reports
Exception Handling
The first step toward using NITRO is to establish a session with the NetScaler Insight Center virtual appliance and then authenticate the session by using the administrator's credentials.
On the client system, create an object of the com.citrix.insight.nitro.service.nitro_service class by specifying the IP address of the NetScaler Insight Center virtual appliance and the protocol for
connecting to the virtual appliance (HTTP or HTTPS). You then use this object to log on to the appliance.
Note: You cannot log on to a NetScaler Insight Center virtual appliance unless you have a user account on the virtual appliance. The configuration operations that you perform are limited by theadministrative roles assigned to your account.The following sample code establishes an HTTPs session with a NetScaler Insight Center virtual appliance with IP address 10.102.126.213:
//Specify the NetScaler Insight appliance IP address and protocol nitro_service ns_insight_session = new nitro_service("10.102.126.213","https"); //Specify the login credentials ns_insight_session.login("admin","verysecret");Note: You must use the nitro_service object in all further NITRO operations on the appliance.Note: By default, the connection to the appliance expires after 30 minutes of inactivity. You can modify the timeout period by specifying a new timeout period (in seconds) in the login method. For
example, to modify the timeout period to 60 minutes:ns_insight_session.login("admin","verysecret",3600);
The com.citrix.insight.nitro.resource.config.mps.managed_device class provides APIs to register a NetScaler appliance with the NetScaler Insight Center virtual appliance. You must specify the
NetScaler IP (NSIP) address, the user name, and the password of the NetScaler appliance.
The following sample code registers a NetScaler appliance with IP address 10.102.29.60:
managed_device obj = new managed_device(); obj.set_ip_address("10.102.29.60"); obj.set_profi le_username("admin"); obj.set_profi le_password("verysecret"); obj.set_type("ns"); managed_device managed_device_result = managed_device.add(ns_insight_session, obj);Updat ing a Net Scaler Appliance's Login Credent ialsUpdat ing a Net Scaler Appliance's Login Credent ials
If the login credentials of a NetScaler appliance are updated after it is registered to a NetScaler Insight Center virtual appliance, they have to be updated on the virtual appliance.
The following sample code updates the credentials of a NetScaler appliance:managed_device device[] = managed_device.get(ns_insight_session); device_profi le result[] = device_profi le.get_fi ltered(ns_insight_session,"name:"+ device[1].get_profi le_name()); device_profi le obj = result[0]; obj.set_username("admin"); obj.set_password("newverysecretpassword"); device_profi le.update(ns_insight_session, obj);
To gather performance data from applications (virtual servers) available on NetScaler appliances that are registered with the NetScaler Insight Center appliance, you must:
1. Identify the application (virtual server) from which you want to collect information.
2. Specify the expression on which the virtual server information must be f iltered.
3. Enable AppFlow on that application.
The appliance starts gathering performance data for the application. To display the performance data, see Generating Performance Reports.
The following sample code gets the list of all the available load balancing virtual servers that are available on the NetScaler appliance 10.102.29.60 and enables appflow on a load balancing virtual
server named http_test:
// Get the l ist of al l load balancing virtual servers String fi lter = "ns_ip_address:10.102.20.60,type:lb"; ns_vserver_appflow_config result[] = ns_vserver_appflow_config.get_fi ltered(client, fi lter); for (int i = 0; i < result.length; i++) { System.out.println("Name: " + result[i].get_name() + ", IP Address: " + result[i].get_ip_address() + ", Type: " + result[i].get_type()+ ", Appflow State: " + result[i].get_appflowlog()); } // Enable appflow on one of the virtual servers
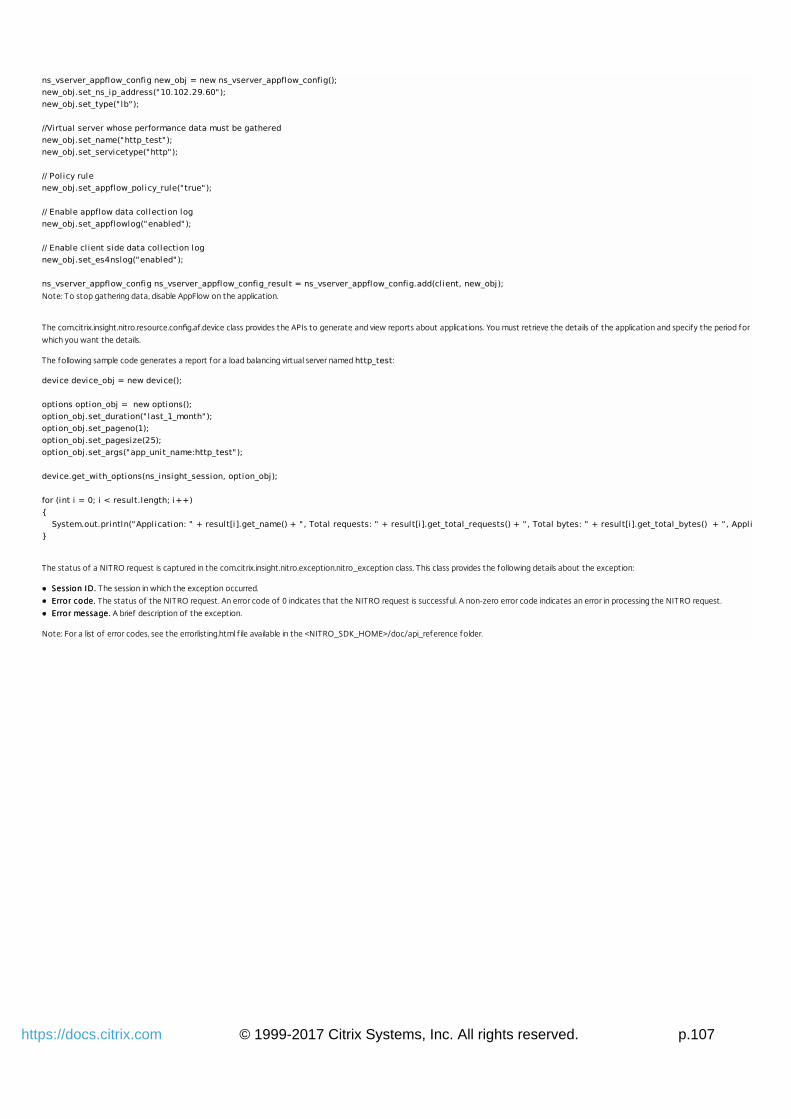
© 1999-2017 Citrix Systems, Inc. All rights reserved. p.107https://docs.citrix.com
ns_vserver_appflow_config new_obj = new ns_vserver_appflow_config(); new_obj.set_ns_ip_address("10.102.29.60"); new_obj.set_type("lb"); //Virtual server whose performance data must be gathered new_obj.set_name("http_test"); new_obj.set_servicetype("http"); // Policy rule new_obj.set_appflow_policy_rule("true"); // Enable appflow data collection log new_obj.set_appflowlog("enabled"); // Enable cl ient side data collection log new_obj.set_es4nslog("enabled"); ns_vserver_appflow_config ns_vserver_appflow_config_result = ns_vserver_appflow_config.add(client, new_obj);Note: To stop gathering data, disable AppFlow on the application.
The com.citrix.insight.nitro.resource.config.af.device class provides the APIs to generate and view reports about applications. You must retrieve the details of the application and specify the period for
which you want the details.
The following sample code generates a report for a load balancing virtual server named http_test:
device device_obj = new device(); options option_obj = new options(); option_obj.set_duration("last_1_month"); option_obj.set_pageno(1); option_obj.set_pagesize(25); option_obj.set_args("app_unit_name:http_test"); device.get_with_options(ns_insight_session, option_obj); for (int i = 0; i < result.length; i++) { System.out.println("Application: " + result[i].get_name() + ", Total requests: " + result[i].get_total_requests() + ", Total bytes: " + result[i].get_total_bytes() + ", Application response time: " + result[i].get_application_response_time()); }
The status of a NITRO request is captured in the com.citrix.insight.nitro.exception.nitro_exception class. This class provides the following details about the exception:
Session ID.Session ID. The session in which the exception occurred.
Error code.Error code. The status of the NITRO request. An error code of 0 indicates that the NITRO request is successful. A non-zero error code indicates an error in processing the NITRO request.
Error message.Error message. A brief description of the exception.
Note: For a list of error codes, see the errorlisting.html f ile available in the <NITRO_SDK_HOME>/doc/api_reference folder.
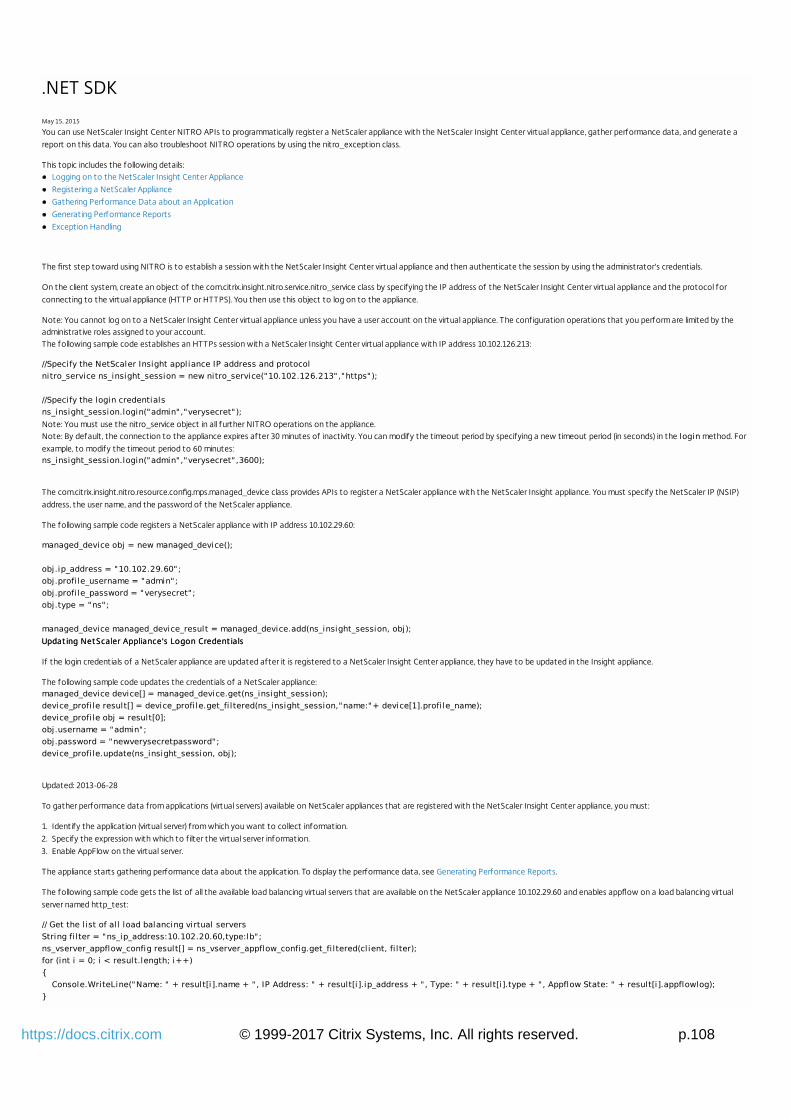
© 1999-2017 Citrix Systems, Inc. All rights reserved. p.108https://docs.citrix.com
.NET SDK
May 15, 2015
You can use NetScaler Insight Center NITRO APIs to programmatically register a NetScaler appliance with the NetScaler Insight Center virtual appliance, gather performance data, and generate a
report on this data. You can also troubleshoot NITRO operations by using the nitro_exception class.
This topic includes the following details:Logging on to the NetScaler Insight Center Appliance
Registering a NetScaler Appliance
Gathering Performance Data about an Application
Generating Performance Reports
Exception Handling
The first step toward using NITRO is to establish a session with the NetScaler Insight Center virtual appliance and then authenticate the session by using the administrator's credentials.
On the client system, create an object of the com.citrix.insight.nitro.service.nitro_service class by specifying the IP address of the NetScaler Insight Center virtual appliance and the protocol for
connecting to the virtual appliance (HTTP or HTTPS). You then use this object to log on to the appliance.
Note: You cannot log on to a NetScaler Insight Center virtual appliance unless you have a user account on the virtual appliance. The configuration operations that you perform are limited by theadministrative roles assigned to your account.The following sample code establishes an HTTPs session with a NetScaler Insight Center virtual appliance with IP address 10.102.126.213:
//Specify the NetScaler Insight appliance IP address and protocol nitro_service ns_insight_session = new nitro_service("10.102.126.213","https"); //Specify the login credentials ns_insight_session.login("admin","verysecret");Note: You must use the nitro_service object in all further NITRO operations on the appliance.Note: By default, the connection to the appliance expires after 30 minutes of inactivity. You can modify the timeout period by specifying a new timeout period (in seconds) in the login method. For
example, to modify the timeout period to 60 minutes:ns_insight_session.login("admin","verysecret",3600);
The com.citrix.insight.nitro.resource.config.mps.managed_device class provides APIs to register a NetScaler appliance with the NetScaler Insight appliance. You must specify the NetScaler IP (NSIP)
address, the user name, and the password of the NetScaler appliance.
The following sample code registers a NetScaler appliance with IP address 10.102.29.60:
managed_device obj = new managed_device(); obj.ip_address = "10.102.29.60"; obj.profi le_username = "admin"; obj.profi le_password = "verysecret"; obj.type = "ns"; managed_device managed_device_result = managed_device.add(ns_insight_session, obj);Updat ing Net Scaler Appliance's Logon Credent ialsUpdat ing Net Scaler Appliance's Logon Credent ials
If the login credentials of a NetScaler appliance are updated after it is registered to a NetScaler Insight Center appliance, they have to be updated in the Insight appliance.
The following sample code updates the credentials of a NetScaler appliance:managed_device device[] = managed_device.get(ns_insight_session); device_profi le result[] = device_profi le.get_fi ltered(ns_insight_session,"name:"+ device[1].profi le_name); device_profi le obj = result[0]; obj.username = "admin"; obj.password = "newverysecretpassword"; device_profi le.update(ns_insight_session, obj);
Updated: 2013-06-28
To gather performance data from applications (virtual servers) available on NetScaler appliances that are registered with the NetScaler Insight Center appliance, you must:
1. Identify the application (virtual server) from which you want to collect information.
2. Specify the expression with which to f ilter the virtual server information.
3. Enable AppFlow on the virtual server.
The appliance starts gathering performance data about the application. To display the performance data, see Generating Performance Reports.
The following sample code gets the list of all the available load balancing virtual servers that are available on the NetScaler appliance 10.102.29.60 and enables appflow on a load balancing virtual
server named http_test:
// Get the l ist of al l load balancing virtual servers String fi lter = "ns_ip_address:10.102.20.60,type:lb"; ns_vserver_appflow_config result[] = ns_vserver_appflow_config.get_fi ltered(client, fi lter); for (int i = 0; i < result.length; i++) { Console.WriteLine("Name: " + result[i].name + ", IP Address: " + result[i].ip_address + ", Type: " + result[i].type + ", Appflow State: " + result[i].appflowlog); }
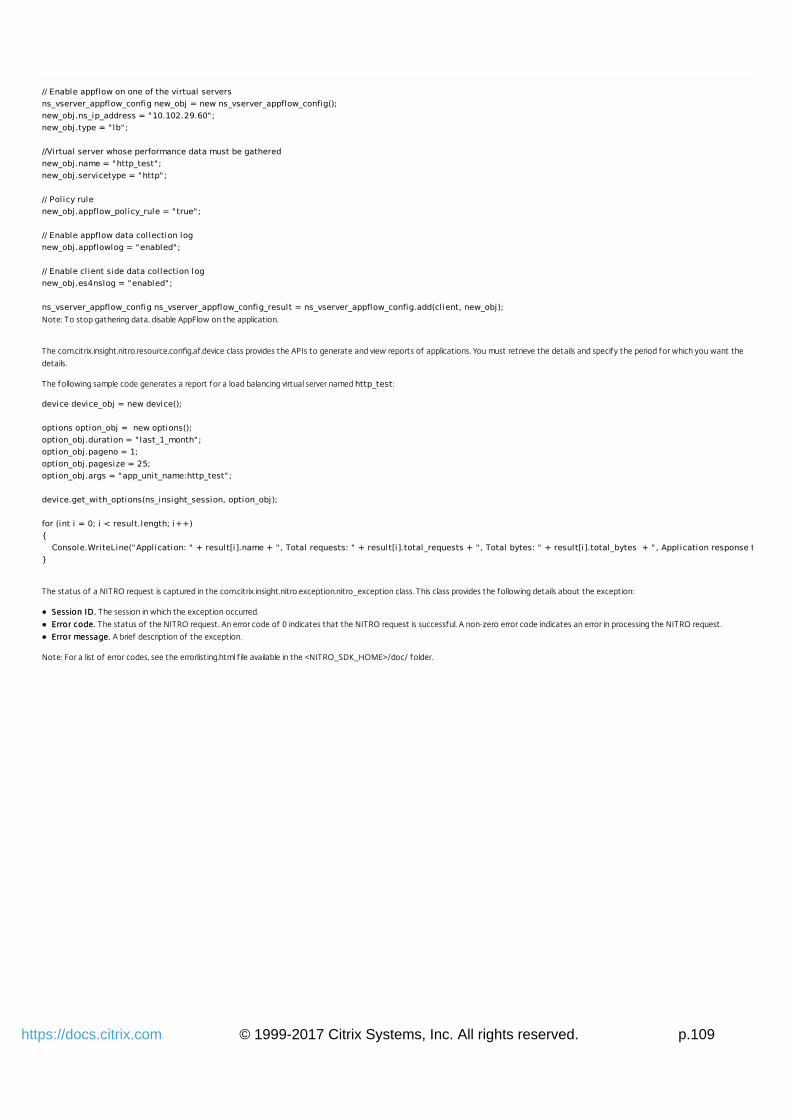
© 1999-2017 Citrix Systems, Inc. All rights reserved. p.109https://docs.citrix.com
// Enable appflow on one of the virtual servers ns_vserver_appflow_config new_obj = new ns_vserver_appflow_config(); new_obj.ns_ip_address = "10.102.29.60"; new_obj.type = "lb"; //Virtual server whose performance data must be gathered new_obj.name = "http_test"; new_obj.servicetype = "http"; // Policy rule new_obj.appflow_policy_rule = "true"; // Enable appflow data collection log new_obj.appflowlog = "enabled"; // Enable cl ient side data collection log new_obj.es4nslog = "enabled"; ns_vserver_appflow_config ns_vserver_appflow_config_result = ns_vserver_appflow_config.add(client, new_obj);Note: To stop gathering data, disable AppFlow on the application.
The com.citrix.insight.nitro.resource.config.af.device class provides the APIs to generate and view reports of applications. You must retrieve the details and specify the period for which you want the
details.
The following sample code generates a report for a load balancing virtual server named http_test:
device device_obj = new device(); options option_obj = new options(); option_obj.duration = "last_1_month"; option_obj.pageno = 1; option_obj.pagesize = 25; option_obj.args = "app_unit_name:http_test"; device.get_with_options(ns_insight_session, option_obj); for (int i = 0; i < result.length; i++) { Console.WriteLine("Application: " + result[i].name + ", Total requests: " + result[i].total_requests + ", Total bytes: " + result[i].total_bytes + ", Application response time: " + result[i].application_response_time); }
The status of a NITRO request is captured in the com.citrix.insight.nitro.exception.nitro_exception class. This class provides the following details about the exception:
Session ID.Session ID. The session in which the exception occurred.
Error code.Error code. The status of the NITRO request. An error code of 0 indicates that the NITRO request is successful. A non-zero error code indicates an error in processing the NITRO request.
Error message.Error message. A brief description of the exception.
Note: For a list of error codes, see the errorlisting.html f ile available in the <NITRO_SDK_HOME>/doc/ folder.
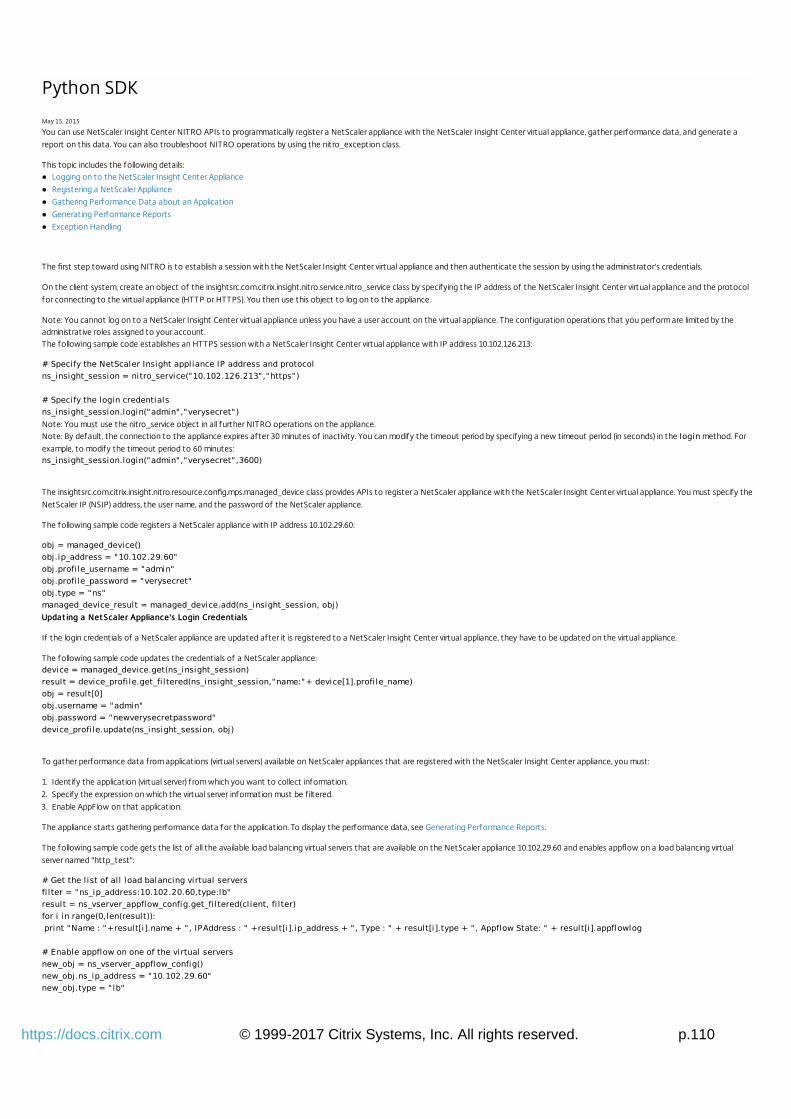
© 1999-2017 Citrix Systems, Inc. All rights reserved. p.110https://docs.citrix.com
Python SDK
May 15, 2015
You can use NetScaler Insight Center NITRO APIs to programmatically register a NetScaler appliance with the NetScaler Insight Center virtual appliance, gather performance data, and generate a
report on this data. You can also troubleshoot NITRO operations by using the nitro_exception class.
This topic includes the following details:Logging on to the NetScaler Insight Center Appliance
Registering a NetScaler Appliance
Gathering Performance Data about an Application
Generating Performance Reports
Exception Handling
The first step toward using NITRO is to establish a session with the NetScaler Insight Center virtual appliance and then authenticate the session by using the administrator's credentials.
On the client system, create an object of the insightsrc.com.citrix.insight.nitro.service.nitro_service class by specifying the IP address of the NetScaler Insight Center virtual appliance and the protocol
for connecting to the virtual appliance (HTTP or HTTPS). You then use this object to log on to the appliance.
Note: You cannot log on to a NetScaler Insight Center virtual appliance unless you have a user account on the virtual appliance. The configuration operations that you perform are limited by theadministrative roles assigned to your account.The following sample code establishes an HTTPS session with a NetScaler Insight Center virtual appliance with IP address 10.102.126.213:
# Specify the NetScaler Insight appliance IP address and protocol ns_insight_session = nitro_service("10.102.126.213","https") # Specify the login credentials ns_insight_session.login("admin","verysecret")Note: You must use the nitro_service object in all further NITRO operations on the appliance.Note: By default, the connection to the appliance expires after 30 minutes of inactivity. You can modify the timeout period by specifying a new timeout period (in seconds) in the login method. For
example, to modify the timeout period to 60 minutes:ns_insight_session.login("admin","verysecret",3600)
The insightsrc.com.citrix.insight.nitro.resource.config.mps.managed_device class provides APIs to register a NetScaler appliance with the NetScaler Insight Center virtual appliance. You must specify the
NetScaler IP (NSIP) address, the user name, and the password of the NetScaler appliance.
The following sample code registers a NetScaler appliance with IP address 10.102.29.60:
obj = managed_device() obj.ip_address = "10.102.29.60" obj.profi le_username = "admin" obj.profi le_password = "verysecret" obj.type = "ns" managed_device_result = managed_device.add(ns_insight_session, obj)Updat ing a Net Scaler Appliance's Login Credent ialsUpdat ing a Net Scaler Appliance's Login Credent ials
If the login credentials of a NetScaler appliance are updated after it is registered to a NetScaler Insight Center virtual appliance, they have to be updated on the virtual appliance.
The following sample code updates the credentials of a NetScaler appliance:device = managed_device.get(ns_insight_session) result = device_profi le.get_fi ltered(ns_insight_session,"name:"+ device[1].profi le_name) obj = result[0] obj.username = "admin" obj.password = "newverysecretpassword" device_profi le.update(ns_insight_session, obj)
To gather performance data from applications (virtual servers) available on NetScaler appliances that are registered with the NetScaler Insight Center appliance, you must:
1. Identify the application (virtual server) from which you want to collect information.
2. Specify the expression on which the virtual server information must be f iltered.
3. Enable AppFlow on that application.
The appliance starts gathering performance data for the application. To display the performance data, see Generating Performance Reports.
The following sample code gets the list of all the available load balancing virtual servers that are available on the NetScaler appliance 10.102.29.60 and enables appflow on a load balancing virtual
server named "http_test":
# Get the l ist of al l load balancing virtual servers fi lter = "ns_ip_address:10.102.20.60,type:lb" result = ns_vserver_appflow_config.get_fi ltered(client, fi lter) for i in range(0,len(result)): print "Name : "+result[i].name + ", IPAddress : " +result[i].ip_address + ", Type : " + result[i].type + ", Appflow State: " + result[i].appflowlog # Enable appflow on one of the virtual servers new_obj = ns_vserver_appflow_config() new_obj.ns_ip_address = "10.102.29.60" new_obj.type = "lb"
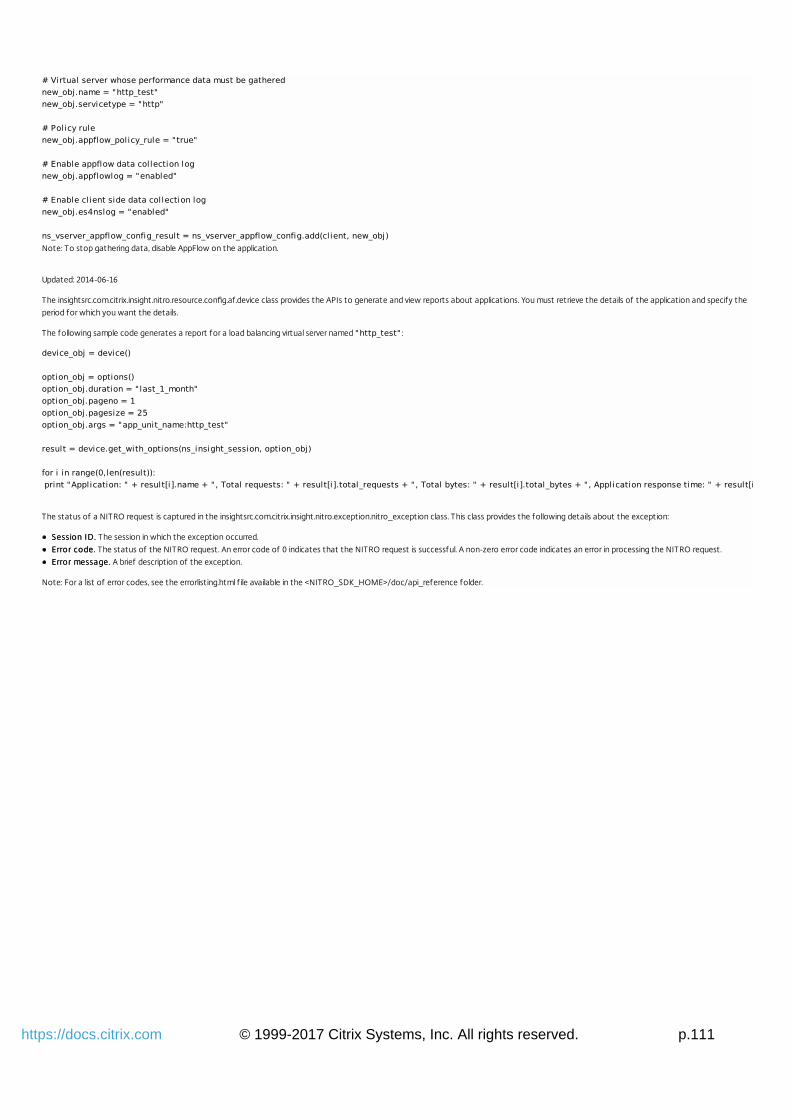
© 1999-2017 Citrix Systems, Inc. All rights reserved. p.111https://docs.citrix.com
# Virtual server whose performance data must be gathered new_obj.name = "http_test" new_obj.servicetype = "http" # Policy rule new_obj.appflow_policy_rule = "true" # Enable appflow data collection log new_obj.appflowlog = "enabled" # Enable cl ient side data collection log new_obj.es4nslog = "enabled" ns_vserver_appflow_config_result = ns_vserver_appflow_config.add(client, new_obj)Note: To stop gathering data, disable AppFlow on the application.
Updated: 2014-06-16
The insightsrc.com.citrix.insight.nitro.resource.config.af.device class provides the APIs to generate and view reports about applications. You must retrieve the details of the application and specify the
period for which you want the details.
The following sample code generates a report for a load balancing virtual server named "http_test" :
device_obj = device() option_obj = options() option_obj.duration = "last_1_month" option_obj.pageno = 1 option_obj.pagesize = 25 option_obj.args = "app_unit_name:http_test" result = device.get_with_options(ns_insight_session, option_obj) for i in range(0,len(result)): print "Application: " + result[i].name + ", Total requests: " + result[i].total_requests + ", Total bytes: " + result[i].total_bytes + ", Application response time: " + result[i].application_response_time
The status of a NITRO request is captured in the insightsrc.com.citrix.insight.nitro.exception.nitro_exception class. This class provides the following details about the exception:
Session ID.Session ID. The session in which the exception occurred.
Error code.Error code. The status of the NITRO request. An error code of 0 indicates that the NITRO request is successful. A non-zero error code indicates an error in processing the NITRO request.
Error message.Error message. A brief description of the exception.
Note: For a list of error codes, see the errorlisting.html f ile available in the <NITRO_SDK_HOME>/doc/api_reference folder.
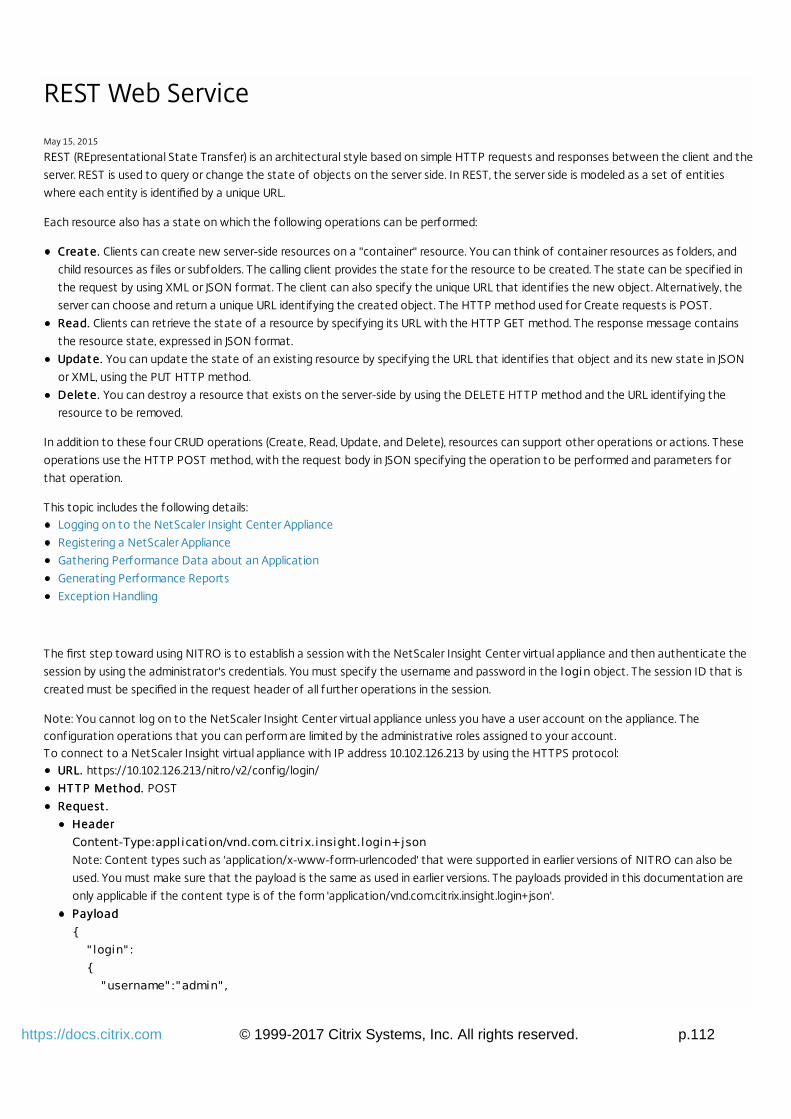
© 1999-2017 Citrix Systems, Inc. All rights reserved. p.112https://docs.citrix.com
REST Web Service
May 15, 2015
REST (REpresentational State Transfer) is an architectural style based on simple HTTP requests and responses between the client and the
server. REST is used to query or change the state of objects on the server side. In REST, the server side is modeled as a set of entities
where each entity is identified by a unique URL.
Each resource also has a state on which the following operations can be performed:
Creat e.Creat e. Clients can create new server-side resources on a "container" resource. You can think of container resources as folders, and
child resources as f iles or subfolders. The calling client provides the state for the resource to be created. The state can be specif ied in
the request by using XML or JSON format. The client can also specify the unique URL that identif ies the new object. Alternatively, the
server can choose and return a unique URL identifying the created object. The HTTP method used for Create requests is POST.
Read.Read. Clients can retrieve the state of a resource by specifying its URL with the HTTP GET method. The response message contains
the resource state, expressed in JSON format.
Updat e.Updat e. You can update the state of an existing resource by specifying the URL that identif ies that object and its new state in JSON
or XML, using the PUT HTTP method.
Delet e.Delet e. You can destroy a resource that exists on the server-side by using the DELETE HTTP method and the URL identifying the
resource to be removed.
In addition to these four CRUD operations (Create, Read, Update, and Delete), resources can support other operations or actions. These
operations use the HTTP POST method, with the request body in JSON specifying the operation to be performed and parameters for
that operation.
This topic includes the following details:Logging on to the NetScaler Insight Center Appliance
Registering a NetScaler Appliance
Gathering Performance Data about an Application
Generating Performance Reports
Exception Handling
The first step toward using NITRO is to establish a session with the NetScaler Insight Center virtual appliance and then authenticate the
session by using the administrator's credentials. You must specify the username and password in the login object. The session ID that is
created must be specified in the request header of all further operations in the session.
Note: You cannot log on to the NetScaler Insight Center virtual appliance unless you have a user account on the appliance. Theconfiguration operations that you can perform are limited by the administrative roles assigned to your account.To connect to a NetScaler Insight virtual appliance with IP address 10.102.126.213 by using the HTTPS protocol:
URL. URL. https://10.102.126.213/nitro/v2/config/login/
HT T P Met hod. HT T P Met hod. POST
Request .Request .
HeaderHeader
Content-Type:application/vnd.com.citrix.insight.login+jsonNote: Content types such as 'application/x-www-form-urlencoded' that were supported in earlier versions of NITRO can also be
used. You must make sure that the payload is the same as used in earlier versions. The payloads provided in this documentation are
only applicable if the content type is of the form 'application/vnd.com.citrix.insight.login+json'.
PayloadPayload
{ " login": { "username":"admin",
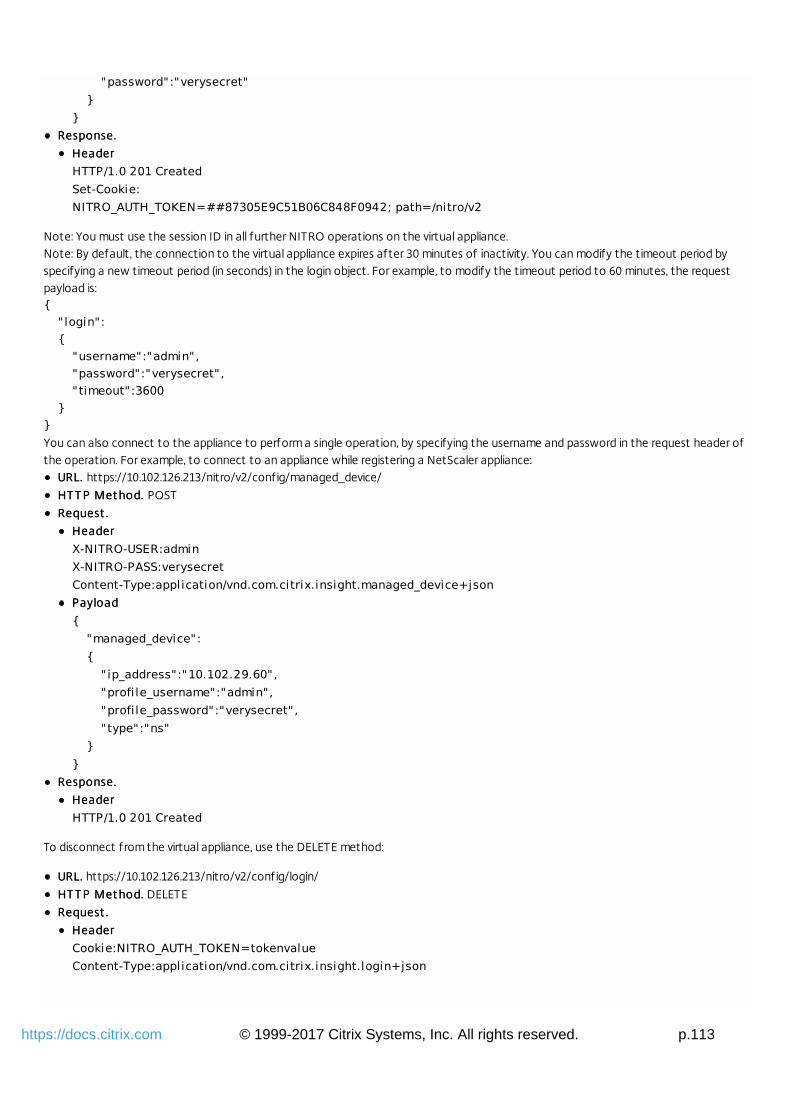
© 1999-2017 Citrix Systems, Inc. All rights reserved. p.113https://docs.citrix.com
"password":"verysecret" } }
Response.Response.
HeaderHeader
HTTP/1.0 201 Created Set-Cookie: NITRO_AUTH_TOKEN=##87305E9C51B06C848F0942; path=/nitro/v2
Note: You must use the session ID in all further NITRO operations on the virtual appliance.Note: By default, the connection to the virtual appliance expires after 30 minutes of inactivity. You can modify the timeout period byspecifying a new timeout period (in seconds) in the login object. For example, to modify the timeout period to 60 minutes, the requestpayload is:{ " login": { "username":"admin", "password":"verysecret", "timeout":3600 } }You can also connect to the appliance to perform a single operation, by specifying the username and password in the request header ofthe operation. For example, to connect to an appliance while registering a NetScaler appliance:
URL. URL. https://10.102.126.213/nitro/v2/config/managed_device/
HT T P Met hod. HT T P Met hod. POST
Request .Request .
HeaderHeader
X-NITRO-USER:admin X-NITRO-PASS:verysecret Content-Type:application/vnd.com.citrix.insight.managed_device+jsonPayloadPayload
{ "managed_device": { " ip_address":"10.102.29.60", "profi le_username":"admin", "profi le_password":"verysecret", "type":"ns" } }
Response.Response.
HeaderHeader
HTTP/1.0 201 Created
To disconnect from the virtual appliance, use the DELETE method:
URL.URL. https://10.102.126.213/nitro/v2/config/login/
HT T P Met hod.HT T P Met hod. DELETE
Request .Request .
HeaderHeader
Cookie:NITRO_AUTH_TOKEN=tokenvalue Content-Type:application/vnd.com.citrix.insight.login+json
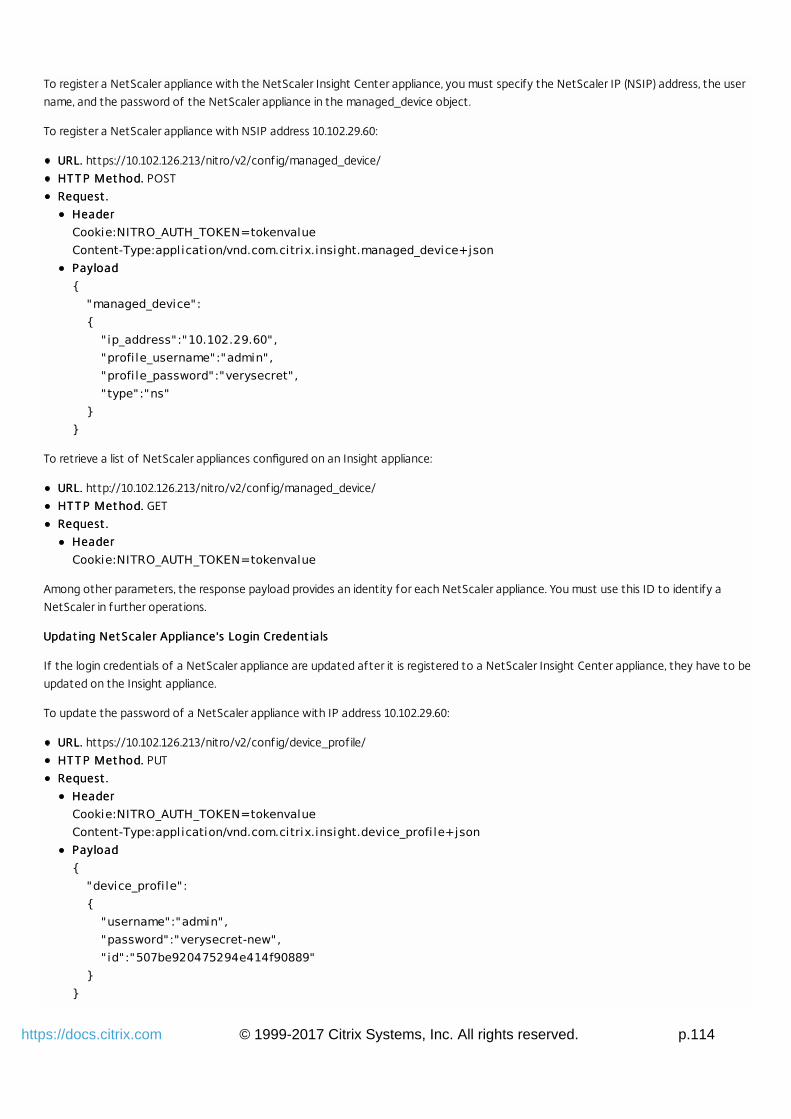
© 1999-2017 Citrix Systems, Inc. All rights reserved. p.114https://docs.citrix.com
To register a NetScaler appliance with the NetScaler Insight Center appliance, you must specify the NetScaler IP (NSIP) address, the user
name, and the password of the NetScaler appliance in the managed_device object.
To register a NetScaler appliance with NSIP address 10.102.29.60:
URL.URL. https://10.102.126.213/nitro/v2/config/managed_device/
HT T P Met hod.HT T P Met hod. POST
Request .Request .
HeaderHeader
Cookie:NITRO_AUTH_TOKEN=tokenvalue Content-Type:application/vnd.com.citrix.insight.managed_device+jsonPayloadPayload
{ "managed_device": { " ip_address":"10.102.29.60", "profi le_username":"admin", "profi le_password":"verysecret", "type":"ns" } }
To retrieve a list of NetScaler appliances configured on an Insight appliance:
URL.URL. http://10.102.126.213/nitro/v2/config/managed_device/
HT T P Met hod.HT T P Met hod. GET
Request .Request .
HeaderHeader
Cookie:NITRO_AUTH_TOKEN=tokenvalue
Among other parameters, the response payload provides an identity for each NetScaler appliance. You must use this ID to identify a
NetScaler in further operations.
Updat ing Net Scaler Appliance's Login Credent ialsUpdat ing Net Scaler Appliance's Login Credent ials
If the login credentials of a NetScaler appliance are updated after it is registered to a NetScaler Insight Center appliance, they have to be
updated on the Insight appliance.
To update the password of a NetScaler appliance with IP address 10.102.29.60:
URL.URL. https://10.102.126.213/nitro/v2/config/device_profile/
HT T P Met hod.HT T P Met hod. PUT
Request .Request .
HeaderHeader
Cookie:NITRO_AUTH_TOKEN=tokenvalue Content-Type:application/vnd.com.citrix.insight.device_profi le+jsonPayloadPayload
{ "device_profi le": { "username":"admin", "password":"verysecret-new", " id":"507be920475294e414f90889" } }
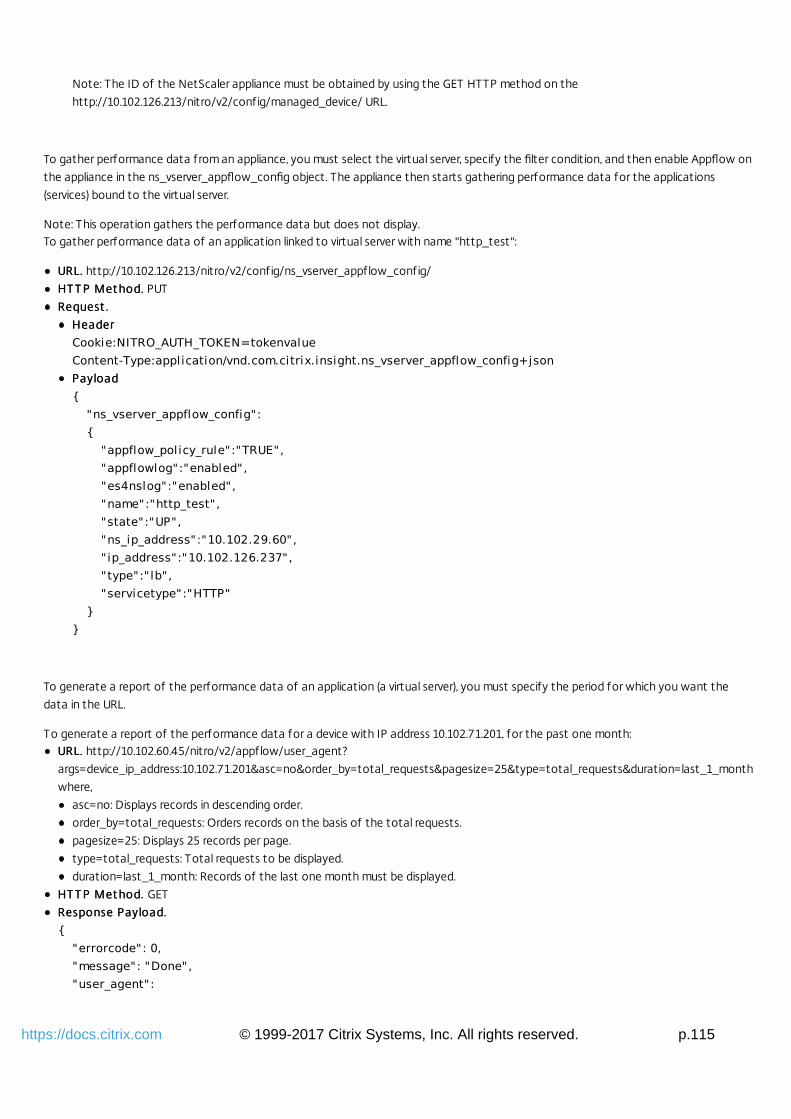
© 1999-2017 Citrix Systems, Inc. All rights reserved. p.115https://docs.citrix.com
Note: The ID of the NetScaler appliance must be obtained by using the GET HTTP method on the
http://10.102.126.213/nitro/v2/config/managed_device/ URL.
To gather performance data from an appliance, you must select the virtual server, specify the filter condition, and then enable Appflow on
the appliance in the ns_vserver_appflow_config object. The appliance then starts gathering performance data for the applications
(services) bound to the virtual server.
Note: This operation gathers the performance data but does not display.To gather performance data of an application linked to virtual server with name "http_test":
URL.URL. http://10.102.126.213/nitro/v2/config/ns_vserver_appflow_config/
HT T P Met hod.HT T P Met hod. PUT
Request .Request .
HeaderHeader
Cookie:NITRO_AUTH_TOKEN=tokenvalue Content-Type:application/vnd.com.citrix.insight.ns_vserver_appflow_config+jsonPayloadPayload
{ "ns_vserver_appflow_config": { "appflow_policy_rule":"TRUE", "appflowlog":"enabled", "es4nslog":"enabled", "name":"http_test", "state":"UP", "ns_ip_address":"10.102.29.60", " ip_address":"10.102.126.237", "type":"lb", "servicetype":"HTTP" } }
To generate a report of the performance data of an application (a virtual server), you must specify the period for which you want the
data in the URL.
To generate a report of the performance data for a device with IP address 10.102.71.201, for the past one month:URL.URL. http://10.102.60.45/nitro/v2/appflow/user_agent?
args=device_ip_address:10.102.71.201&asc=no&order_by=total_requests&pagesize=25&type=total_requests&duration=last_1_month
where,
asc=no: Displays records in descending order.
order_by=total_requests: Orders records on the basis of the total requests.
pagesize=25: Displays 25 records per page.
type=total_requests: Total requests to be displayed.
duration=last_1_month: Records of the last one month must be displayed.
HT T P Met hod. HT T P Met hod. GET
Response Payload.Response Payload.
{ "errorcode": 0, "message": "Done", "user_agent":
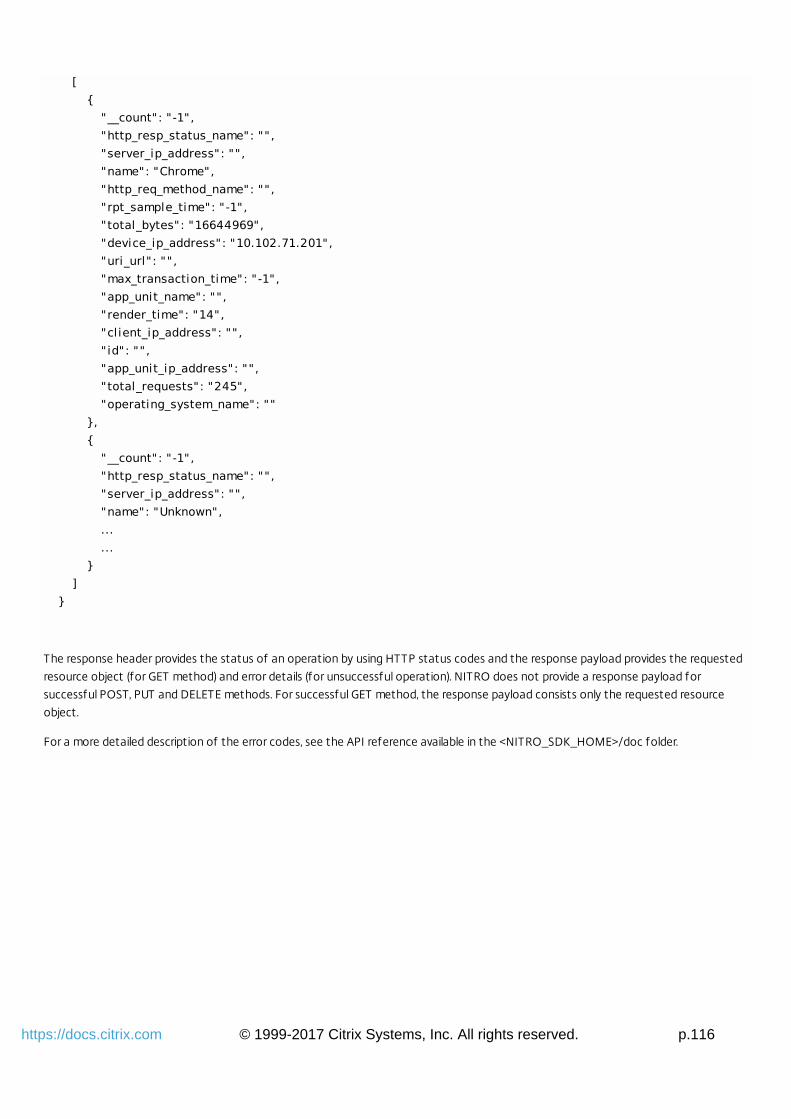
© 1999-2017 Citrix Systems, Inc. All rights reserved. p.116https://docs.citrix.com
[ { "__count": "-1", "http_resp_status_name": "", "server_ip_address": "", "name": "Chrome", "http_req_method_name": "", "rpt_sample_time": "-1", "total_bytes": "16644969", "device_ip_address": "10.102.71.201", "uri_url": "", "max_transaction_time": "-1", "app_unit_name": "", "render_time": "14", "cl ient_ip_address": "", " id": "", "app_unit_ip_address": "", "total_requests": "245", "operating_system_name": "" }, { "__count": "-1", "http_resp_status_name": "", "server_ip_address": "", "name": "Unknown", ... ... } ] }
The response header provides the status of an operation by using HTTP status codes and the response payload provides the requested
resource object (for GET method) and error details (for unsuccessful operation). NITRO does not provide a response payload for
successful POST, PUT and DELETE methods. For successful GET method, the response payload consists only the requested resource
object.
For a more detailed description of the error codes, see the API reference available in the <NITRO_SDK_HOME>/doc folder.