netscaler management, analytics, and optimizations cns-319 ... · the netscaler management and...
TRANSCRIPT
NetScaler Management, Analytics, and Optimizations CNS-319-1I Lab Guide
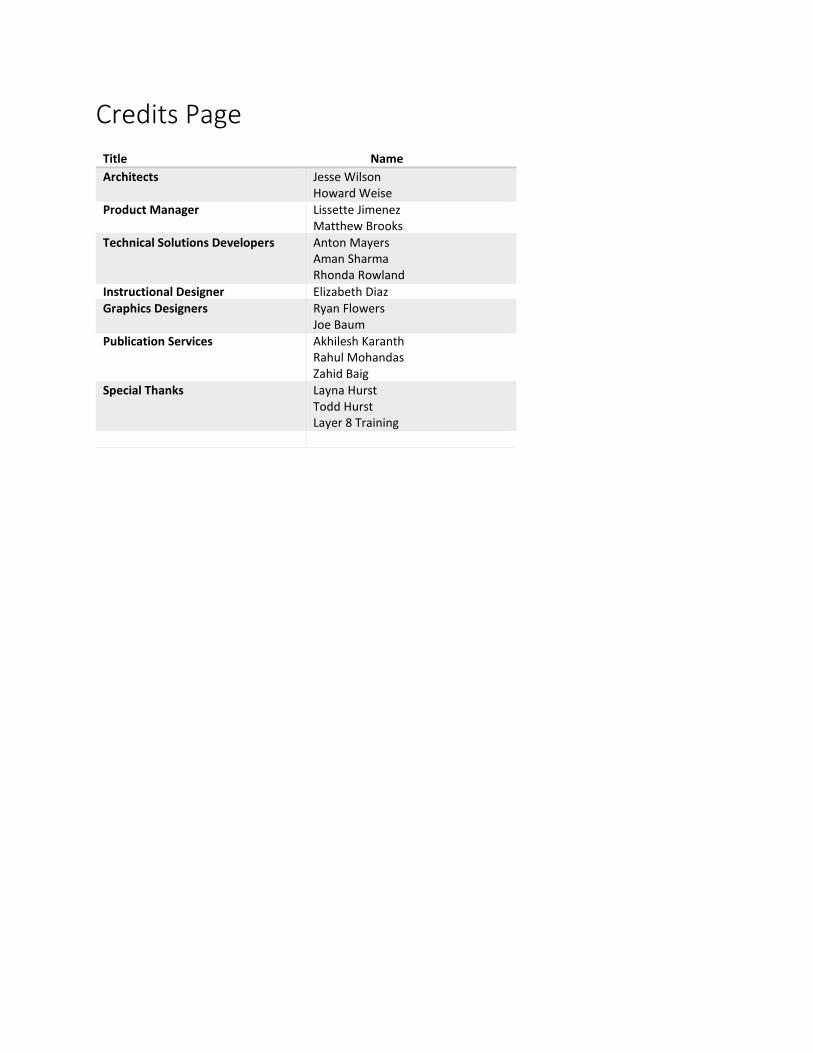
Credits Page Title
Name
Architects Jesse Wilson Howard Weise
Product Manager Lissette Jimenez Matthew Brooks
Technical Solutions Developers Anton Mayers Aman Sharma Rhonda Rowland
Instructional Designer Elizabeth Diaz
Graphics Designers Ryan Flowers Joe Baum
Publication Services Akhilesh Karanth Rahul Mohandas Zahid Baig
Special Thanks Layna Hurst Todd Hurst Layer 8 Training

Contents Credits Page ................................................................................................................................................................... 2
Lab Guide Overview ....................................................................................................................................................... 5
Lab Environment Overview ........................................................................................................................................... 6
Citrix Hands-on Labs .................................................................................................................................................. 10
Module 1: NetScaler MAS: Introduction and Configuration ........................................................................................ 11
Exercise 1-1: Initial Configuration and Integration of MAS with NetScaler VPX .................................................... 12
Module 2: NetScaler MAS: Managing and Monitoring NetScalers ............................................................................. 17
Exercise 2-1: Using MAS for NetScaler Instance Management .............................................................................. 18
Exercise 2-2: Viewing Events and Syslog ................................................................................................................ 27
Exercise 2-3: Managing SSL Certificates ................................................................................................................. 29
Module 3: NetScaler MAS: Managing NetScaler Configurations and Integrated Analytics ........................................ 33
Exercise 3.1: NetScaler Configuration Management with StyleBooks ................................................................... 34
Exercise 3.2: NetScaler Configuration Management with Record & Play .............................................................. 37
Exercise 3-3: Analytics using Web Insight and Security Insight .............................................................................. 47
Module 4: NetScaler Web Server Logging (NSWL) ...................................................................................................... 56
Exercise 4-1: Configuring NSWL ............................................................................................................................. 57
Module 5: Integrated Caching ..................................................................................................................................... 68
Exercise 5-1: Integrated Caching ............................................................................................................................ 69
Module 6: Front End Optimization (FEO) .................................................................................................................... 80
Exercise 6-1: Front End Optimizations ................................................................................................................... 81
Module 7: Tuning and Optimizations .......................................................................................................................... 88
Exercise 7-1: NetScaler MAS Configuration Advice ................................................................................................ 89
Exercise 7-2: Configuring TCP/HTTP/SSL Profiles ................................................................................................... 93
Exercise 7-3: Configuring Network Profiles .......................................................................................................... 100
Exercise 7-4: Replacing NetScaler Default Certificates with Trusted Certs .......................................................... 107
Appendix A: Transition to Part 2 ................................................................................................................................ 111

5
Lab Guide Overview
In this lab guide, you will get valuable hands-on experience with NetScaler management, monitoring and
optimization settings. The exercises in this module cover NetScaler MAS, NSWL, Integrated Caching, FEO. It also
includes additional tuning and optimization settings. This lab guide will enable you to work with product
components and perform required steps for configuration of the NetScaler for web application security.
6
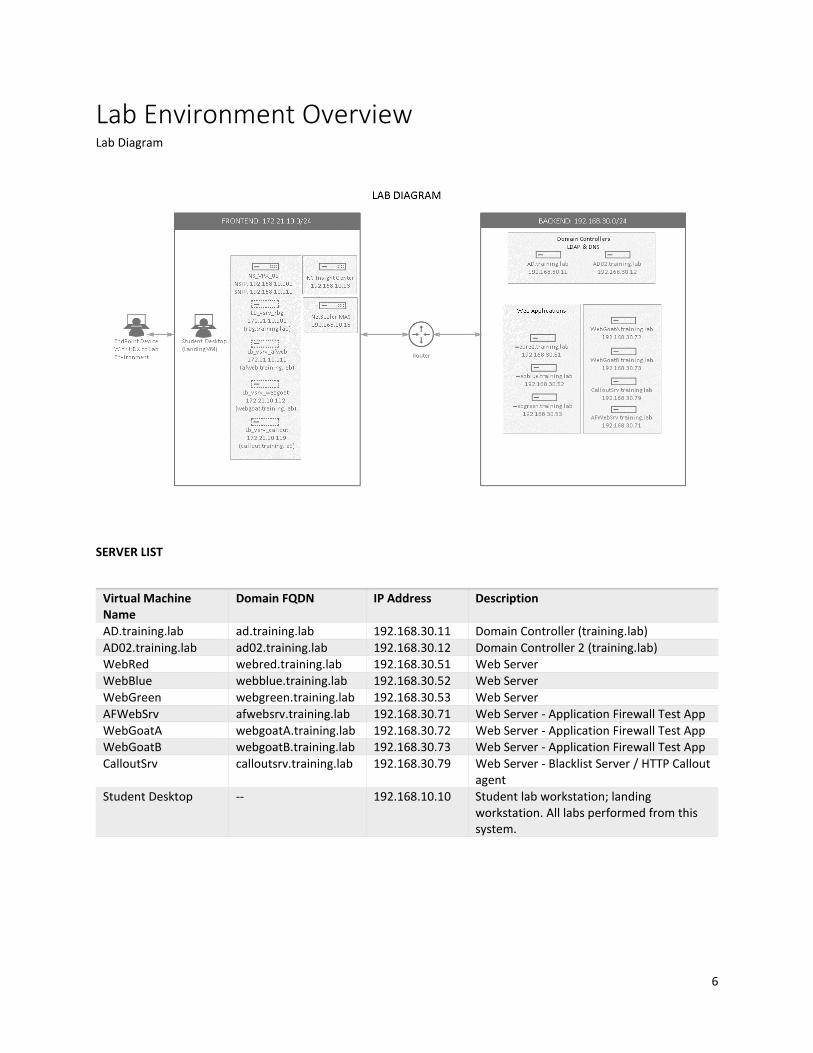
Lab Environment Overview Lab Diagram
SERVER LIST
Virtual Machine Name
Domain FQDN IP Address Description
AD.training.lab ad.training.lab 192.168.30.11 Domain Controller (training.lab)
AD02.training.lab ad02.training.lab 192.168.30.12 Domain Controller 2 (training.lab) WebRed webred.training.lab 192.168.30.51 Web Server
WebBlue webblue.training.lab 192.168.30.52 Web Server
WebGreen webgreen.training.lab 192.168.30.53 Web Server
AFWebSrv afwebsrv.training.lab 192.168.30.71 Web Server - Application Firewall Test App
WebGoatA webgoatA.training.lab 192.168.30.72 Web Server - Application Firewall Test App WebGoatB webgoatB.training.lab 192.168.30.73 Web Server - Application Firewall Test App
CalloutSrv calloutsrv.training.lab 192.168.30.79 Web Server - Blacklist Server / HTTP Callout agent
Student Desktop -- 192.168.10.10 Student lab workstation; landing workstation. All labs performed from this system.
7
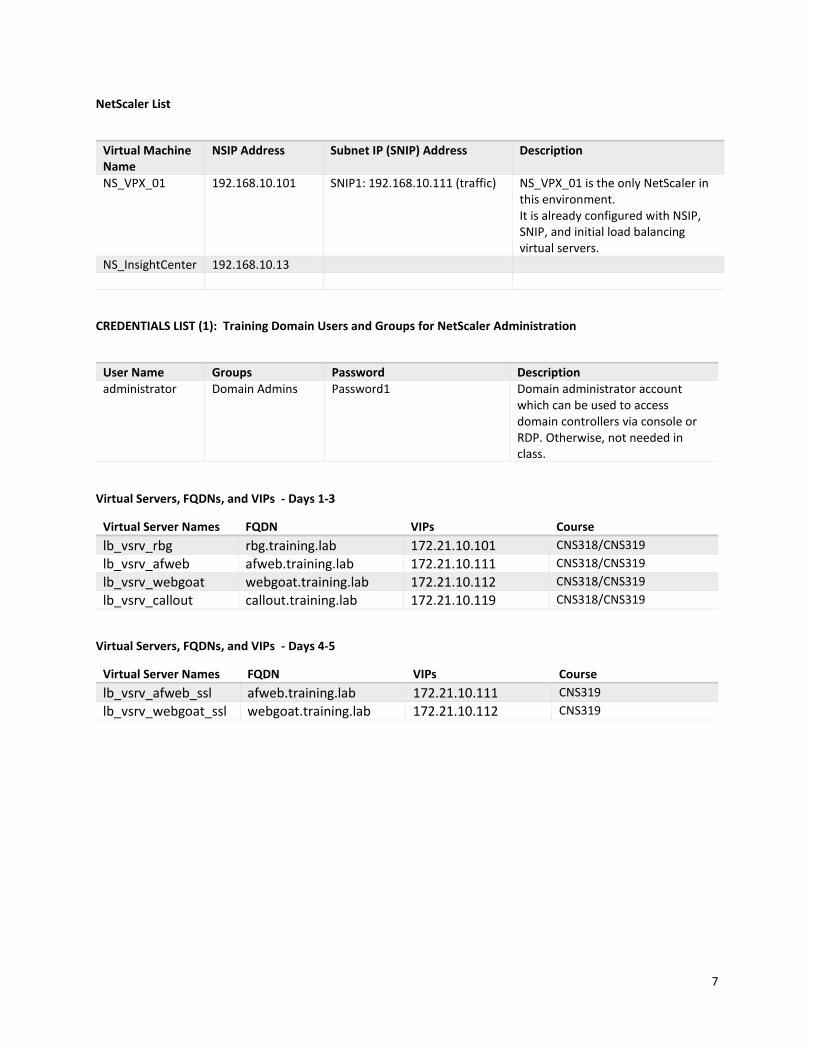
NetScaler List
Virtual Machine Name
NSIP Address Subnet IP (SNIP) Address Description
NS_VPX_01 192.168.10.101 SNIP1: 192.168.10.111 (traffic) NS_VPX_01 is the only NetScaler in this environment. It is already configured with NSIP, SNIP, and initial load balancing virtual servers.
NS_InsightCenter 192.168.10.13
CREDENTIALS LIST (1): Training Domain Users and Groups for NetScaler Administration
User Name Groups Password Description administrator Domain Admins Password1 Domain administrator account
which can be used to access domain controllers via console or RDP. Otherwise, not needed in class.
Virtual Servers, FQDNs, and VIPs - Days 1-3
Virtual Server Names FQDN VIPs Course
lb_vsrv_rbg rbg.training.lab 172.21.10.101 CNS318/CNS319
lb_vsrv_afweb afweb.training.lab 172.21.10.111 CNS318/CNS319
lb_vsrv_webgoat webgoat.training.lab 172.21.10.112 CNS318/CNS319
lb_vsrv_callout callout.training.lab 172.21.10.119 CNS318/CNS319
Virtual Servers, FQDNs, and VIPs - Days 4-5
Virtual Server Names FQDN VIPs Course
lb_vsrv_afweb_ssl afweb.training.lab 172.21.10.111 CNS319
lb_vsrv_webgoat_ssl webgoat.training.lab 172.21.10.112 CNS319
8
Working with the Labs
NetScaler Configuration and Application Testing
It is strong recommended, when running the exercises in this class, that you perform NetScaler configurations
using Chrome web browser to access the NetScaler Configuration Management utility and test application attacks
and protections in Firefox.
This will allow you to switch back-and-forth from the configuration utility to the test application multiple times during each exercise.
When certain labs require you to reset cookies or the browser's session state it will only affect Firefox and the test applications and not your connection to the management console in Chrome.
Many of the troubleshooting and test utilities that will be required for the Application Firewall and other exercises are only installed for Firefox.
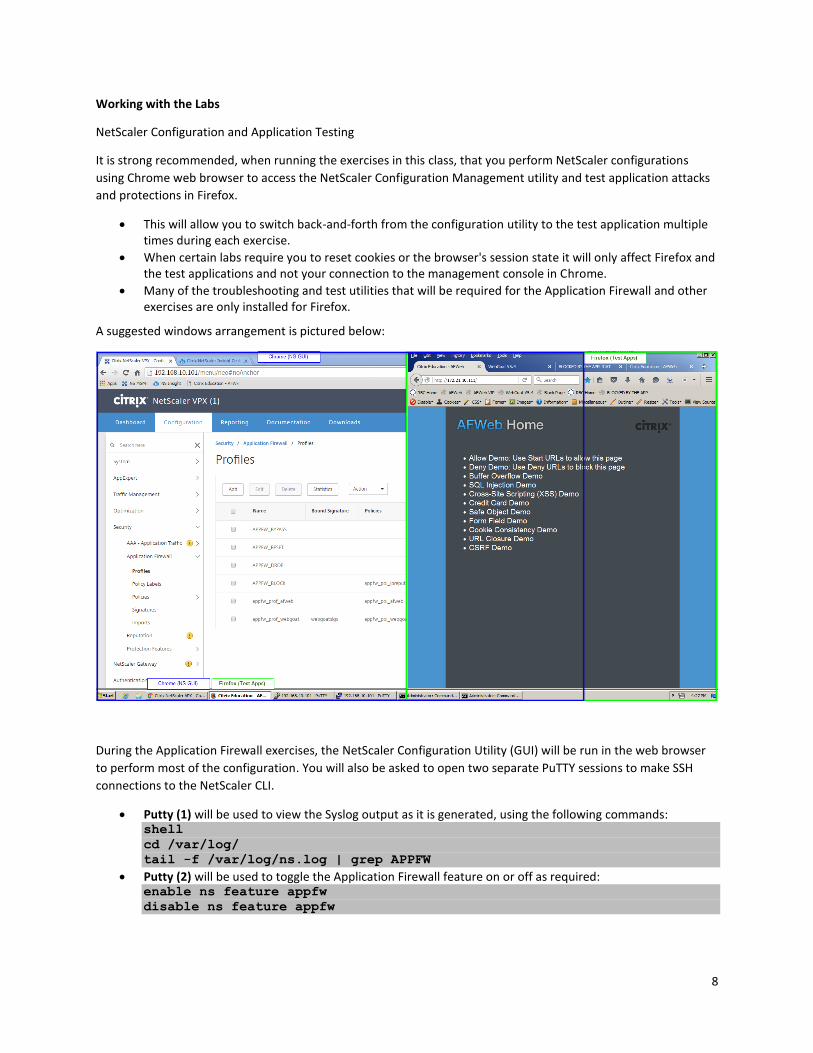
A suggested windows arrangement is pictured below:
During the Application Firewall exercises, the NetScaler Configuration Utility (GUI) will be run in the web browser
to perform most of the configuration. You will also be asked to open two separate PuTTY sessions to make SSH
connections to the NetScaler CLI.
Putty (1) will be used to view the Syslog output as it is generated, using the following commands: shell
cd /var/log/
tail -f /var/log/ns.log | grep APPFW
Putty (2) will be used to toggle the Application Firewall feature on or off as required: enable ns feature appfw
disable ns feature appfw
9
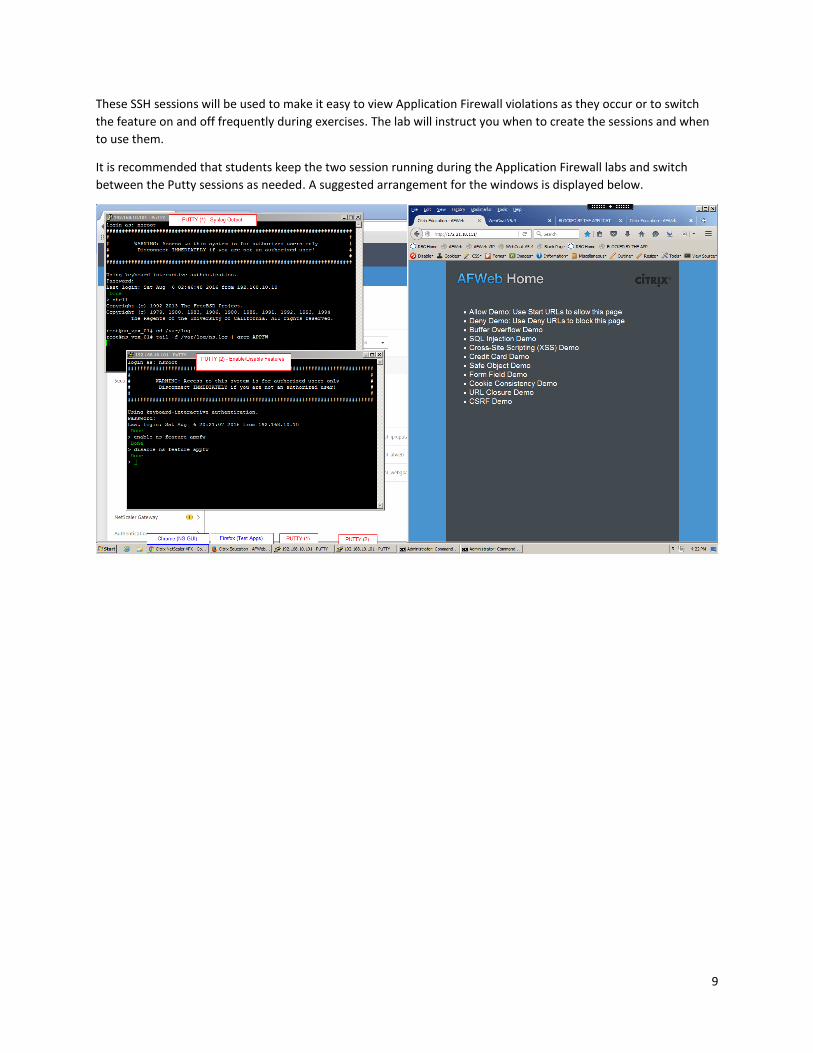
These SSH sessions will be used to make it easy to view Application Firewall violations as they occur or to switch
the feature on and off frequently during exercises. The lab will instruct you when to create the sessions and when
to use them.
It is recommended that students keep the two session running during the Application Firewall labs and switch
between the Putty sessions as needed. A suggested arrangement for the windows is displayed below.
10
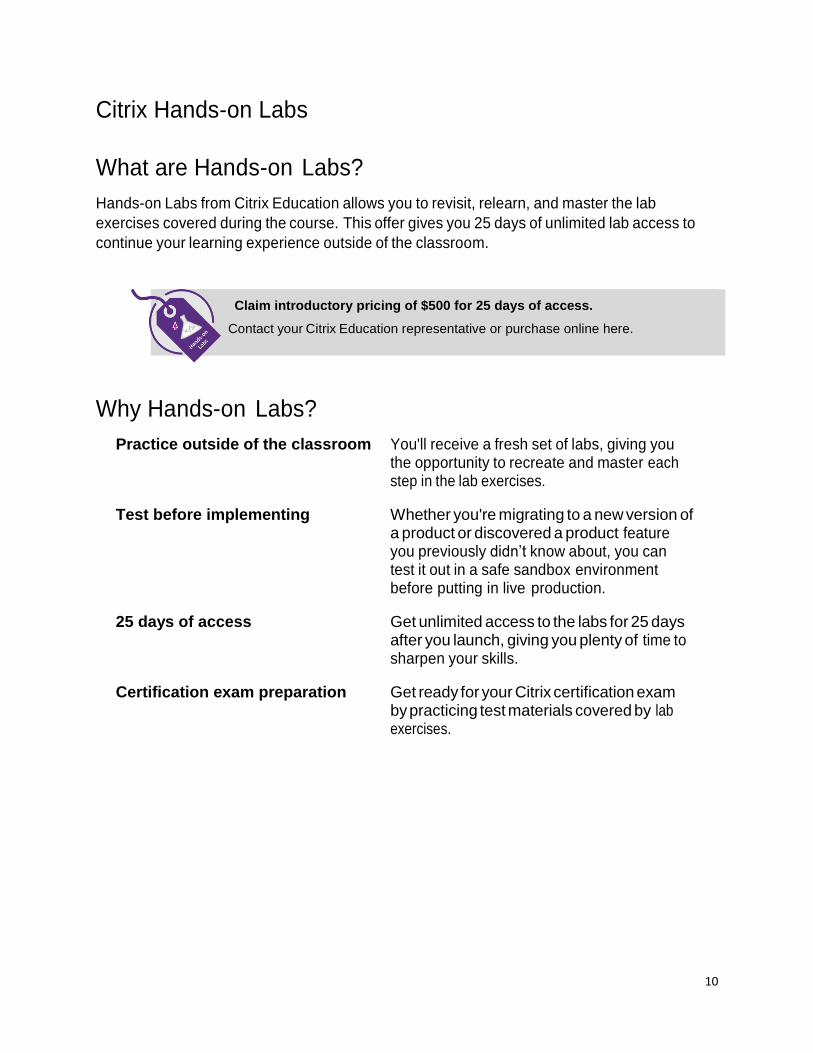
Citrix Hands-on Labs
What are Hands-on Labs?
Hands-on Labs from Citrix Education allows you to revisit, relearn, and master the lab
exercises covered during the course. This offer gives you 25 days of unlimited lab access to
continue your learning experience outside of the classroom.
Why Hands-on Labs?
Practice outside of the classroom You'll receive a fresh set of labs, giving you the opportunity to recreate and master each step in the lab exercises.
Test before implementing Whether you're migrating to a new version of a product or discovered a product feature you previously didn’t know about, you can test it out in a safe sandbox environment before putting in live production.
25 days of access Get unlimited access to the labs for 25 days after you launch, giving you plenty of time to sharpen your skills.
Certification exam preparation Get ready for your Citrix certification exam by practicing test materials covered by lab exercises.
Claim introductory pricing of $500 for 25 days of access.
Contact your Citrix Education representative or purchase online here.
11
Module 1: NetScaler MAS: Introduction and
Configuration Overview:
The NetScaler Management and Analytics System (NetScaler MAS) is a virtual appliance that integrates the
management, auditing, and configuration features of NetScaler Command Center using a new interface and
management engine with the Analytics capabilities of NetScaler Insight Center. The new NetScaler MAS can be
used to manage NetScaler MPX, VPX, and SDX deployments along with NetScaler SD-WAN products in one
centralized utility. Modules 1-3 in this exercise workbook will cover various aspects of configuring and using
NetScaler MAS to manage, configure, troubleshoot, and analyze NetScaler implementations.
NetScaler MAS lecture and exercises are divided into the following modules:
Module 1: NetScaler MAS: Introduction and Configuration
Module 2: NetScaler MAS: Managing and Monitoring NetScalers
Module 3: NetScaler MAS: Managing NetScaler Configurations and Integrated Analytics
This module demonstrates the integration of NetScaler MAS with a NetScaler ADC system and additional NetScaler
MAS configuration tasks.
After completing this lab module, you will be able to:
Describe NetScaler MAS setup requirements (though the initial virtual appliance configuration has already been performed, these settings will be reviewed during the exercise.)
Configure NetScaler MAS to manage one or more NetScaler systems and manage key settings of the initial MAS setup.
o Configure NetScaler appliances for management by NetScaler MAS. o Perform additional NetScaler MAS setup tasks such as session timeouts, NTP synchronization,
managed instance backup settings, and dashboard polling intervals.
This module contains the following exercises using the NetScaler Configuration Utility GUI:
Exercise 1-1: Initial Configuration and Integration of MAS with NetScaler VPX 15 min
Before you begin:
Estimated time to complete this lab module: 15 mnutes
12
Exercise 1-1: Initial Configuration and Integration of MAS with
NetScaler VPX In this exercise, you will access the NetScaler MAS management console and integrate the NetScaler NS_VPX_01
for management and reporting with NetScaler MAS. The initial NetScaler MAS configuration settings will be
reviewed and additional post-setup configuration changes will be applied.
This exercise introduces the initial NetScaler MAS setup and configuration.
Requirements for this scenario:
Access the NetScaler MAS management console.
Integrate a NetScaler for management by NetScaler MAS.
Update NetScaler MAS settings with appropriate values for polling and backup retention suitable for use within the lab environment.
In this exercise, you will perform the following tasks:
Connect to NetScaler MAS
Configure Additional MAS Settings
13
Connect to NetScaler MAS
Step Action
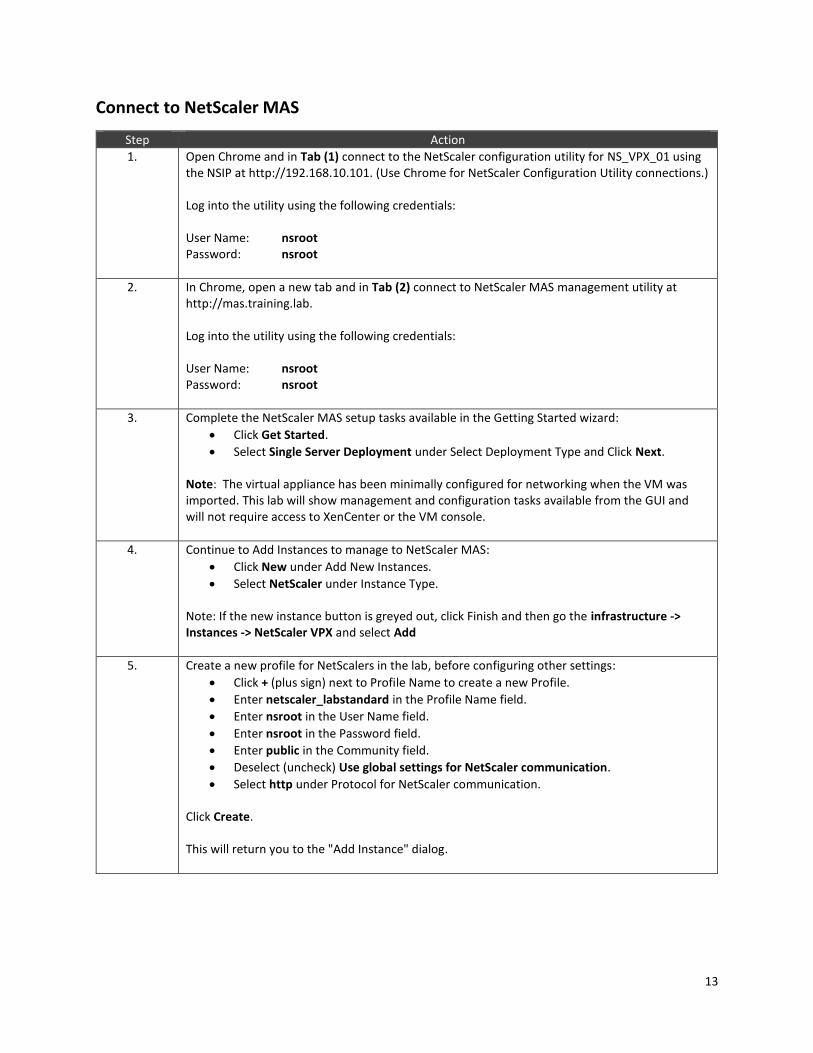
1. Open Chrome and in Tab (1) connect to the NetScaler configuration utility for NS_VPX_01 using the NSIP at http://192.168.10.101. (Use Chrome for NetScaler Configuration Utility connections.) Log into the utility using the following credentials: User Name: nsroot Password: nsroot
2. In Chrome, open a new tab and in Tab (2) connect to NetScaler MAS management utility at http://mas.training.lab. Log into the utility using the following credentials: User Name: nsroot Password: nsroot
3. Complete the NetScaler MAS setup tasks available in the Getting Started wizard:
Click Get Started.
Select Single Server Deployment under Select Deployment Type and Click Next. Note: The virtual appliance has been minimally configured for networking when the VM was imported. This lab will show management and configuration tasks available from the GUI and will not require access to XenCenter or the VM console.
4. Continue to Add Instances to manage to NetScaler MAS:
Click New under Add New Instances.
Select NetScaler under Instance Type. Note: If the new instance button is greyed out, click Finish and then go the infrastructure -> Instances -> NetScaler VPX and select Add
5. Create a new profile for NetScalers in the lab, before configuring other settings:
Click + (plus sign) next to Profile Name to create a new Profile.
Enter netscaler_labstandard in the Profile Name field.
Enter nsroot in the User Name field.
Enter nsroot in the Password field.
Enter public in the Community field.
Deselect (uncheck) Use global settings for NetScaler communication.
Select http under Protocol for NetScaler communication. Click Create. This will return you to the "Add Instance" dialog.
14
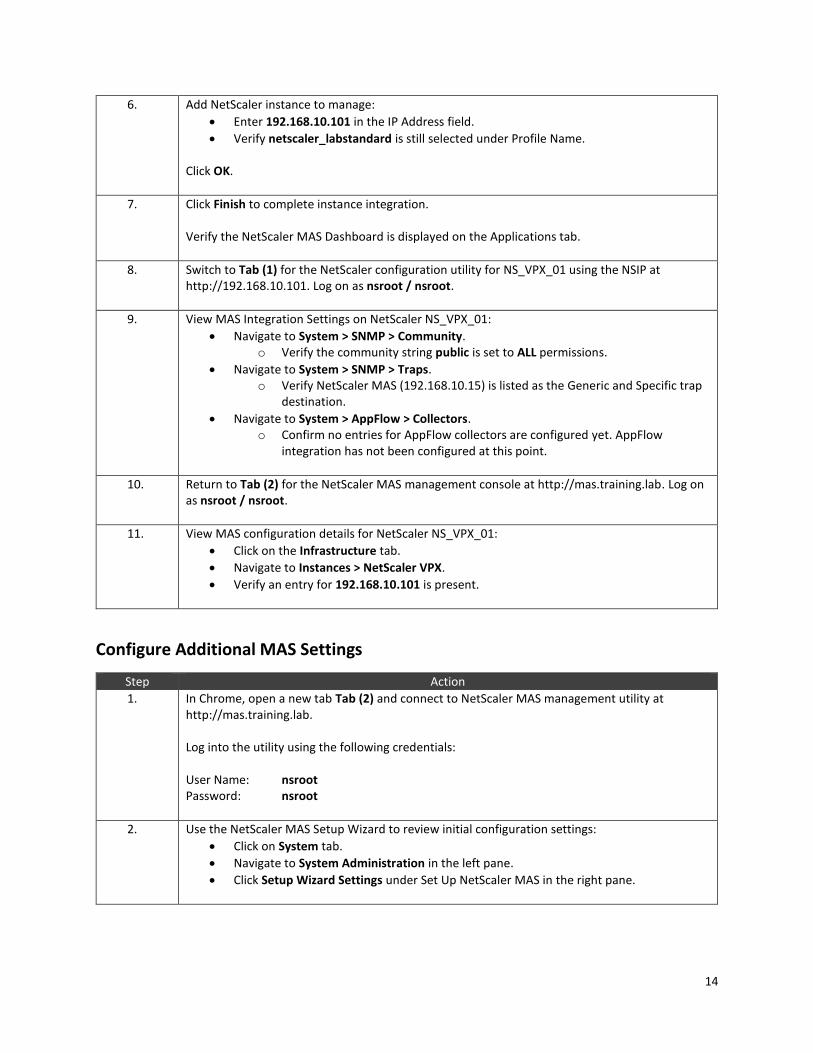
6. Add NetScaler instance to manage:
Enter 192.168.10.101 in the IP Address field.
Verify netscaler_labstandard is still selected under Profile Name. Click OK.
7. Click Finish to complete instance integration. Verify the NetScaler MAS Dashboard is displayed on the Applications tab.
8. Switch to Tab (1) for the NetScaler configuration utility for NS_VPX_01 using the NSIP at http://192.168.10.101. Log on as nsroot / nsroot.
9. View MAS Integration Settings on NetScaler NS_VPX_01:
Navigate to System > SNMP > Community. o Verify the community string public is set to ALL permissions.
Navigate to System > SNMP > Traps. o Verify NetScaler MAS (192.168.10.15) is listed as the Generic and Specific trap
destination.
Navigate to System > AppFlow > Collectors. o Confirm no entries for AppFlow collectors are configured yet. AppFlow
integration has not been configured at this point.
10. Return to Tab (2) for the NetScaler MAS management console at http://mas.training.lab. Log on as nsroot / nsroot.
11. View MAS configuration details for NetScaler NS_VPX_01:
Click on the Infrastructure tab.
Navigate to Instances > NetScaler VPX.
Verify an entry for 192.168.10.101 is present.
Configure Additional MAS Settings
Step Action
1. In Chrome, open a new tab Tab (2) and connect to NetScaler MAS management utility at http://mas.training.lab. Log into the utility using the following credentials: User Name: nsroot Password: nsroot
2. Use the NetScaler MAS Setup Wizard to review initial configuration settings:
Click on System tab.
Navigate to System Administration in the left pane.
Click Setup Wizard Settings under Set Up NetScaler MAS in the right pane.
15
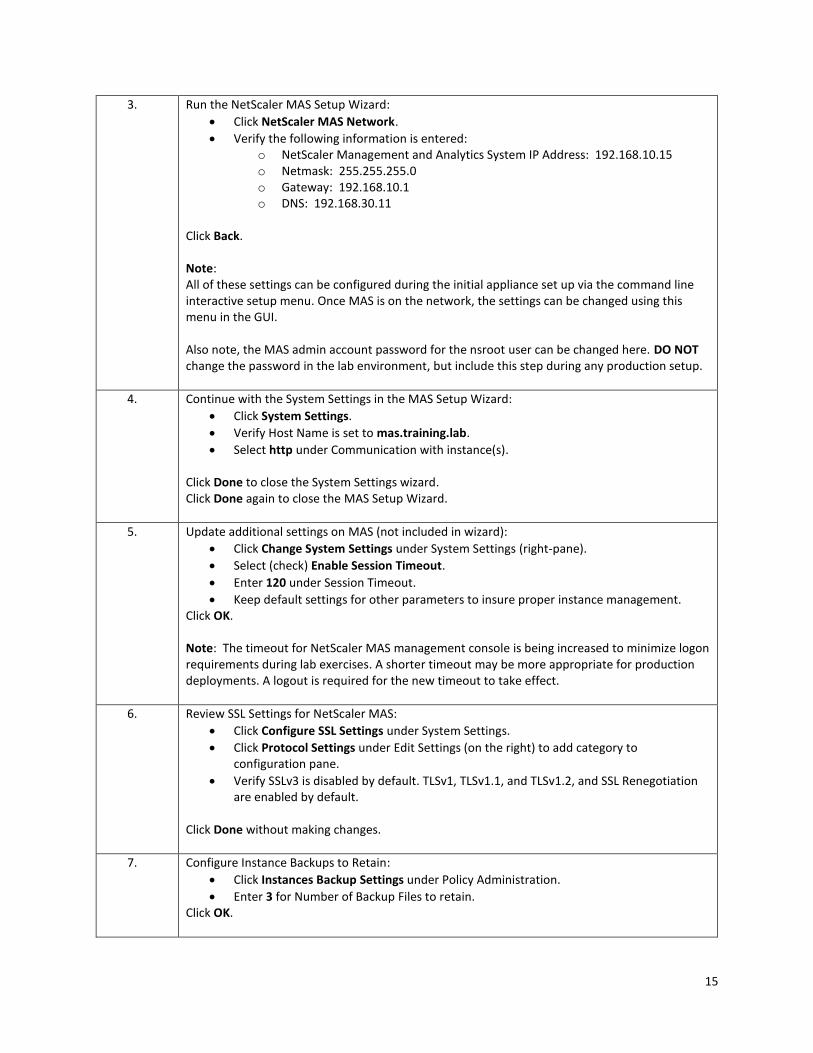
3. Run the NetScaler MAS Setup Wizard:
Click NetScaler MAS Network.
Verify the following information is entered: o NetScaler Management and Analytics System IP Address: 192.168.10.15 o Netmask: 255.255.255.0 o Gateway: 192.168.10.1 o DNS: 192.168.30.11
Click Back. Note: All of these settings can be configured during the initial appliance set up via the command line interactive setup menu. Once MAS is on the network, the settings can be changed using this menu in the GUI. Also note, the MAS admin account password for the nsroot user can be changed here. DO NOT change the password in the lab environment, but include this step during any production setup.
4. Continue with the System Settings in the MAS Setup Wizard:
Click System Settings.
Verify Host Name is set to mas.training.lab.
Select http under Communication with instance(s). Click Done to close the System Settings wizard. Click Done again to close the MAS Setup Wizard.
5. Update additional settings on MAS (not included in wizard):
Click Change System Settings under System Settings (right-pane).
Select (check) Enable Session Timeout.
Enter 120 under Session Timeout.
Keep default settings for other parameters to insure proper instance management. Click OK. Note: The timeout for NetScaler MAS management console is being increased to minimize logon requirements during lab exercises. A shorter timeout may be more appropriate for production deployments. A logout is required for the new timeout to take effect.
6. Review SSL Settings for NetScaler MAS:
Click Configure SSL Settings under System Settings.
Click Protocol Settings under Edit Settings (on the right) to add category to configuration pane.
Verify SSLv3 is disabled by default. TLSv1, TLSv1.1, and TLSv1.2, and SSL Renegotiation are enabled by default.
Click Done without making changes.
7. Configure Instance Backups to Retain:
Click Instances Backup Settings under Policy Administration.
Enter 3 for Number of Backup Files to retain. Click OK.
16
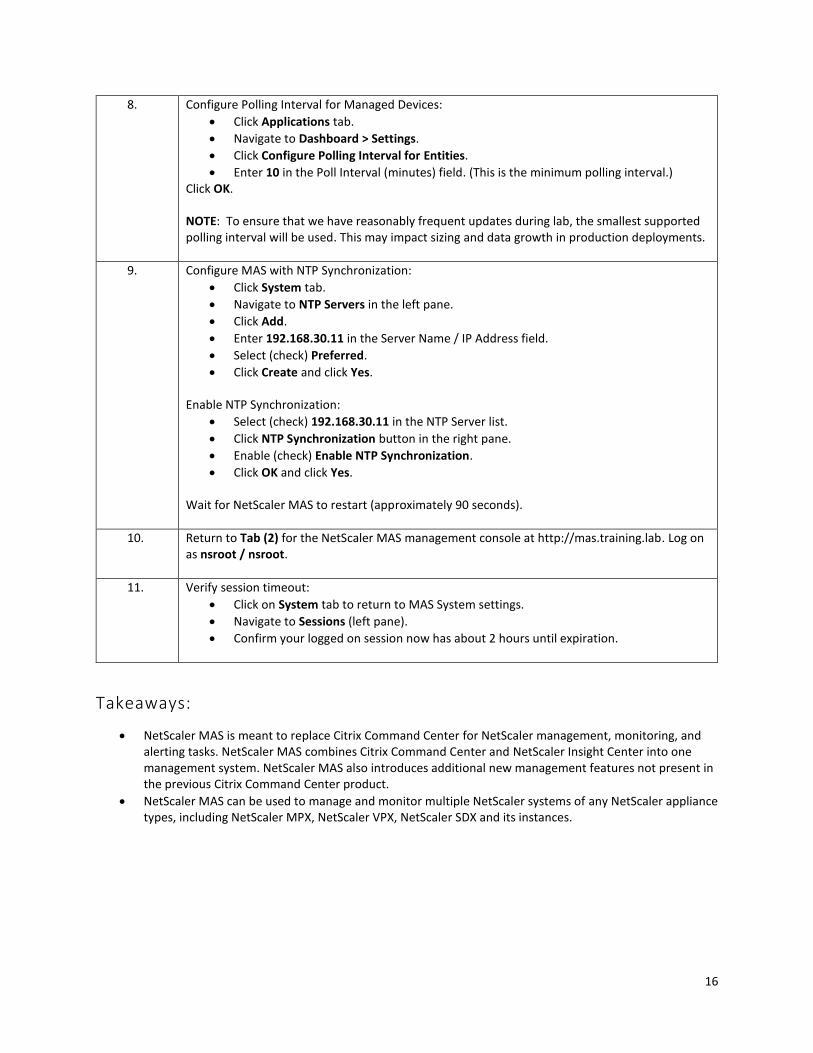
8. Configure Polling Interval for Managed Devices:
Click Applications tab.
Navigate to Dashboard > Settings.
Click Configure Polling Interval for Entities.
Enter 10 in the Poll Interval (minutes) field. (This is the minimum polling interval.) Click OK. NOTE: To ensure that we have reasonably frequent updates during lab, the smallest supported polling interval will be used. This may impact sizing and data growth in production deployments.
9. Configure MAS with NTP Synchronization:
Click System tab.
Navigate to NTP Servers in the left pane.
Click Add.
Enter 192.168.30.11 in the Server Name / IP Address field.
Select (check) Preferred.
Click Create and click Yes. Enable NTP Synchronization:
Select (check) 192.168.30.11 in the NTP Server list.
Click NTP Synchronization button in the right pane.
Enable (check) Enable NTP Synchronization.
Click OK and click Yes. Wait for NetScaler MAS to restart (approximately 90 seconds).
10. Return to Tab (2) for the NetScaler MAS management console at http://mas.training.lab. Log on as nsroot / nsroot.
11. Verify session timeout:
Click on System tab to return to MAS System settings.
Navigate to Sessions (left pane).
Confirm your logged on session now has about 2 hours until expiration.
Takeaways:
NetScaler MAS is meant to replace Citrix Command Center for NetScaler management, monitoring, and alerting tasks. NetScaler MAS combines Citrix Command Center and NetScaler Insight Center into one management system. NetScaler MAS also introduces additional new management features not present in the previous Citrix Command Center product.
NetScaler MAS can be used to manage and monitor multiple NetScaler systems of any NetScaler appliance types, including NetScaler MPX, NetScaler VPX, NetScaler SDX and its instances.
17
Module 2: NetScaler MAS: Managing and
Monitoring NetScalers Overview:
In this module, you will use NetScaler MAS to view current real-time dashboard and statistics information for
managed NetScaler appliances. The exercises in this module will demonstrate the different levels of information
available from the NetScaler MAS, Instance Dashboard, Infrastructure Dashboard, and the Application Dashboard
views. Additional monitoring capabilities using the events view and syslog will extend the NetScaler administrators
view of real-time operation of the managed NetScaler appliances.
Finally, SSL Certificate expiration and monitoring will be used to identify expiring certificates within the
environment. NetScaler MAS will then be used to update and replace the certificates with replacement files.
After completing this lab module, you will be able to:
Use NetScaler MAS to monitor real-time events and statistics on the managed NetScaler appliances.
Use NetScaler MAS to identify hotspots and trouble areas with specific NetScalers, entities, or applications to facilitiate a quicker time to resolution.
Use NetScaler MAS to monitor and manage event and syslog reporting.
Use NetScaler MAS to identify certificates in use, certificate expiration alerts, and to manage certificate replacement tasks.
This module contains the following exercises using the NetScaler Configuration Utility GUI:
Exercise 2-1: Using MAS for NetScaler Instance Management 25 min
Exercise 2-2: Viewing Events and Syslog 5 min
Exercise 2-3: Managing SSL Certificates 5 min
Before you begin:
Estimated time to complete this lab module: 35 minutes
18
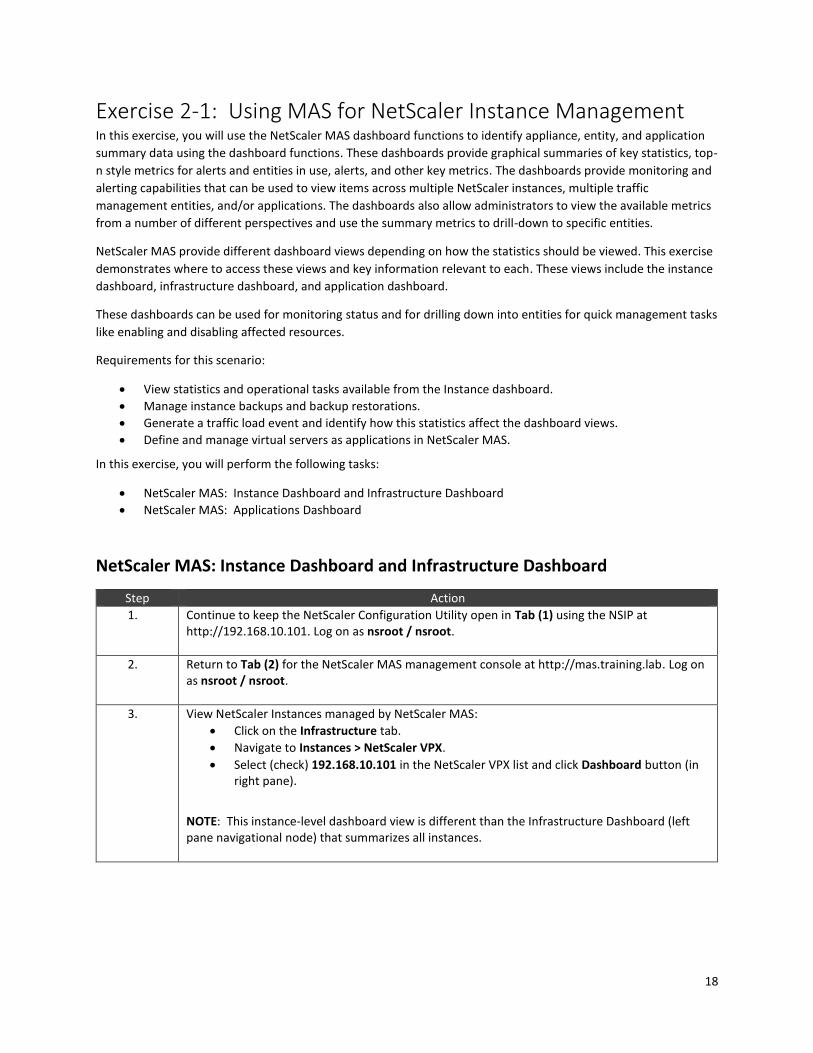
Exercise 2-1: Using MAS for NetScaler Instance Management In this exercise, you will use the NetScaler MAS dashboard functions to identify appliance, entity, and application
summary data using the dashboard functions. These dashboards provide graphical summaries of key statistics, top-
n style metrics for alerts and entities in use, alerts, and other key metrics. The dashboards provide monitoring and
alerting capabilities that can be used to view items across multiple NetScaler instances, multiple traffic
management entities, and/or applications. The dashboards also allow administrators to view the available metrics
from a number of different perspectives and use the summary metrics to drill-down to specific entities.
NetScaler MAS provide different dashboard views depending on how the statistics should be viewed. This exercise
demonstrates where to access these views and key information relevant to each. These views include the instance
dashboard, infrastructure dashboard, and application dashboard.
These dashboards can be used for monitoring status and for drilling down into entities for quick management tasks
like enabling and disabling affected resources.
Requirements for this scenario:
View statistics and operational tasks available from the Instance dashboard.
Manage instance backups and backup restorations.
Generate a traffic load event and identify how this statistics affect the dashboard views.
Define and manage virtual servers as applications in NetScaler MAS.
In this exercise, you will perform the following tasks:
NetScaler MAS: Instance Dashboard and Infrastructure Dashboard
NetScaler MAS: Applications Dashboard
NetScaler MAS: Instance Dashboard and Infrastructure Dashboard
Step Action
1. Continue to keep the NetScaler Configuration Utility open in Tab (1) using the NSIP at http://192.168.10.101. Log on as nsroot / nsroot.
2. Return to Tab (2) for the NetScaler MAS management console at http://mas.training.lab. Log on as nsroot / nsroot.
3. View NetScaler Instances managed by NetScaler MAS:
Click on the Infrastructure tab.
Navigate to Instances > NetScaler VPX.
Select (check) 192.168.10.101 in the NetScaler VPX list and click Dashboard button (in right pane).
NOTE: This instance-level dashboard view is different than the Infrastructure Dashboard (left pane navigational node) that summarizes all instances.
19
4. Review the summary information in the Instance Dashboard view:
Current NetScaler instance CPU, Memory, Disk utilization.
Status of Virtual Servers above 75% health. This is clickable and will take you to a pre-configured search filter of the affected virtual servers at the status level selected.
Summary of Events.
Certificate expiration summary. This is also clickable and will take you to a list of certificates in the affected categories. Notice that at least one certificate has expired; this will be addressed later.
Network Interface Summary.
Scroll down to the Information section and view NetScaler instance details:
View NetScaler system details such as: NSIP, uptime, build version, hardware version and system model ID details.
Note that the running vs. saved configuration comparison can be made on the instance dashboard.
Licensed Features shows which features are licensed (not which features are enabled).
Modes displays summary of enabled/disabled modes.
Note:
The Instance Dashboard is accessed by selecting the instance on the Infrastructure page and clicking the Dashboard button in the right-pane.
This is different than the Dashboard for all instances at the top of the navigation pane under the Infrastructure tab. (Which will be viewed in a later step.)
This is also separate from the Dashboard view present under the Applications tab.
20
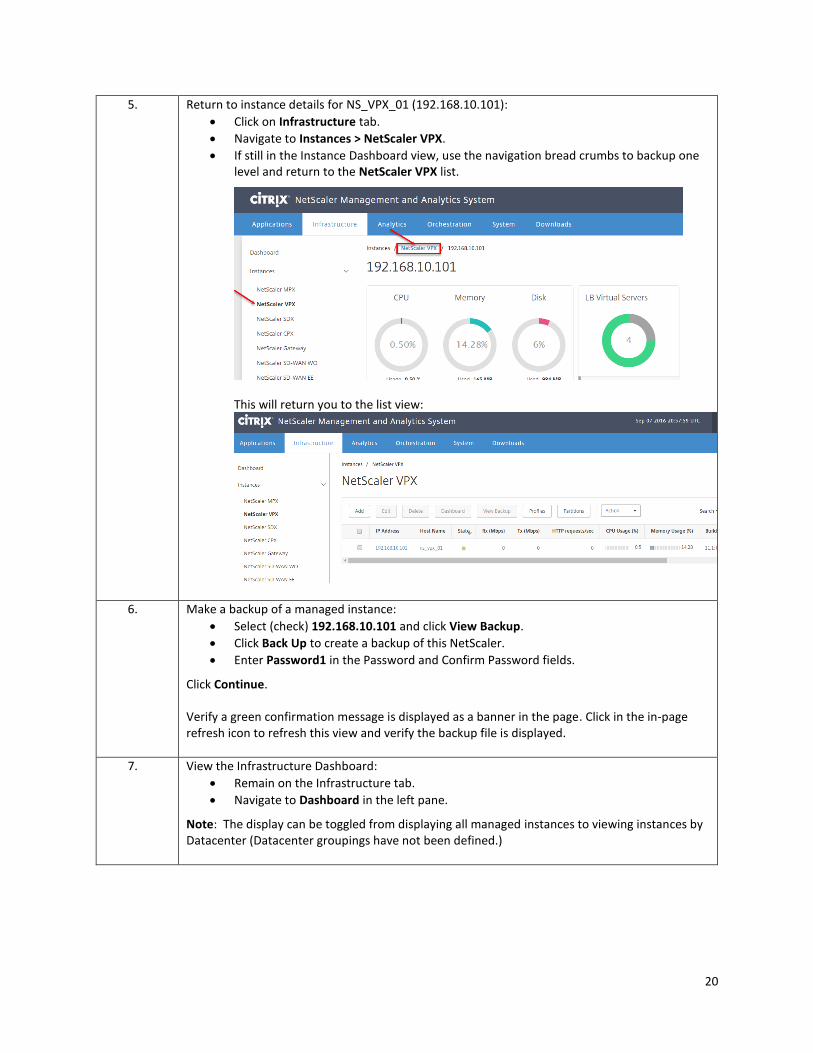
5. Return to instance details for NS_VPX_01 (192.168.10.101):
Click on Infrastructure tab.
Navigate to Instances > NetScaler VPX.
If still in the Instance Dashboard view, use the navigation bread crumbs to backup one level and return to the NetScaler VPX list.
This will return you to the list view:
6. Make a backup of a managed instance:
Select (check) 192.168.10.101 and click View Backup.
Click Back Up to create a backup of this NetScaler.
Enter Password1 in the Password and Confirm Password fields.
Click Continue. Verify a green confirmation message is displayed as a banner in the page. Click in the in-page refresh icon to refresh this view and verify the backup file is displayed.
7. View the Infrastructure Dashboard:
Remain on the Infrastructure tab.
Navigate to Dashboard in the left pane.
Note: The display can be toggled from displaying all managed instances to viewing instances by Datacenter (Datacenter groupings have not been defined.)
21
8. Scroll down the Infrastructure Dashboard view the following:
The top dashboard summary identifies total entities being across all managed devices.
Events by Severity (for all instances)
Health, Up Time, Models, and Versions for all instances.
NetScaler Certificates, Config Save Status, and NetScaler config drift across all instances.
9. Generate an event on the managed NetScaler:
Switch to Tab (1) and access the NetScaler Configuration Utility for http://192.168.10.101. Log on as nsroot / nsroot if required.
Save the NetScaler configuration.
Navigate to the System node in the left pane and click Reboot in the right-pane. (Ensure Save configuration is enabled before proceeding, in case you missed the previous step.)
Wait for the NetScaler to reboot and reconnect to http://192.168.10.101 in Tab (1) before continuing.
10. Verify the load balancing virtual servers are in an UP state following reboot.
Navigate to Traffic Management > Load Balancing > Virtual Servers.
Verify the virtual servers are in an UP state (except for lb_vsrv_callout).
If the virtual servers are DOWN, wait 30 seconds - 1 minute for all services to finish initializing following the reboot.
Use the in-page refresh to refresh the view.
Verify virtual servers are UP before continuing.
22
11. Generate an event on the managed NetScaler: Use the hulk.py scripts to generate a brief load event. Prep the CMD Prompt (2) with the taskkill command before actually generating load. Commands are located in C:\resources\hulk_commands.txt for easy reference. Open CMD Prompt (1) to run the load script:
Open an elevated CMD prompt on the Student Desktop: use the CMD prompt pinned to the Student Desktop.
When prompted select Notepad to open
In CMD Prompt (1) run the following command:
c:\hulk.py http://rbg.training.lab/home.php
Stop the script after the first 3-4 outputs are generated. Open CMD Prompt (2) to run the stop command:
Right-click the CMD prompt (elevated) pinned to the taskbar and click Command Prompt to open a second window.
When prompted select Notepad to open
In CMD Prompt (2) run the following command:
taskkill /im Python.exe /F
During the test, keep both CMD prompts running with access to the commands during the next several steps and you can start/restart the Python script and terminate the process as needed. When the test is done, remember the following:
If you have issues terminating the script, use task manager to terminate any running python process.
Be sure the hulk.py process is stopped before continuing after the test. NOTE: A text file containing both commands is located on the Student Desktop at C:\resources\hulk_commands.txt. Use this to copy and paste commands to the CMD prompts, if needed.
23
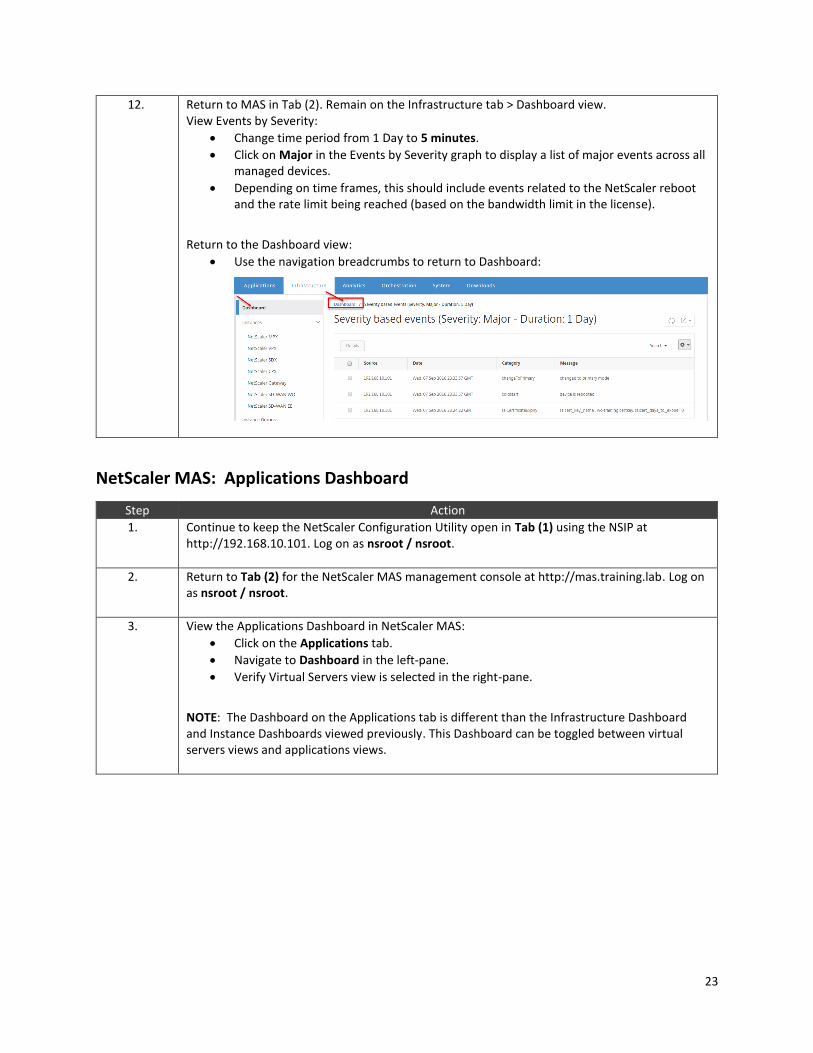
12. Return to MAS in Tab (2). Remain on the Infrastructure tab > Dashboard view. View Events by Severity:
Change time period from 1 Day to 5 minutes.
Click on Major in the Events by Severity graph to display a list of major events across all managed devices.
Depending on time frames, this should include events related to the NetScaler reboot and the rate limit being reached (based on the bandwidth limit in the license).
Return to the Dashboard view:
Use the navigation breadcrumbs to return to Dashboard:
NetScaler MAS: Applications Dashboard
Step Action
1. Continue to keep the NetScaler Configuration Utility open in Tab (1) using the NSIP at http://192.168.10.101. Log on as nsroot / nsroot.
2. Return to Tab (2) for the NetScaler MAS management console at http://mas.training.lab. Log on as nsroot / nsroot.
3. View the Applications Dashboard in NetScaler MAS:
Click on the Applications tab.
Navigate to Dashboard in the left-pane.
Verify Virtual Servers view is selected in the right-pane.
NOTE: The Dashboard on the Applications tab is different than the Infrastructure Dashboard and Instance Dashboards viewed previously. This Dashboard can be toggled between virtual servers views and applications views.
24
4. Review the information on the Applications Dashboard for Virtual Servers. Verify the information displayed for the following areas:
Top 5 Virtual Servers with Highest Client Connections should display spikes in activity for lb_vsrv_rbg and little to no activity for other virtual servers. (It may take a few minutes after stopping the hulk.py script before data is displayed.)
Top 5 Virtual Servers with Highest Server Connections.
Virtual Servers summarized by State: Up, Down, Out of Service.
Managed NetScaler instances providing virtual servers.
Summary views for Virtual Servers by health, protocols, load balancing methods, and persistence type.
NOTE: The virtual servers below each graph are clickable and you can customize the graph to show all, some, or specific virtual server data.
5. View Dashboard by Applications
Click Applications in the right-pane of the Dashboard node to switch from Virtual Servers to Applications view.
Create an Application for RBG Content:
Click New Application.
Enter RBG App in the Name field.
Click Add Virtual Servers > LB Virtual Servers.
Select (check) lb_vsrv_rbg and click Select.
Click OK.
Create an Application for WebGoat Content that includes the WebGoat and Callout virtual servers:
Click New Application.
Enter WebGoat App in the Name field.
Click Add Virtual Servers > LB Virtual Servers.
Select (check) lb_vsrv_callout, lb_vsrv_webgoat, and lb_vsrv_webgoat_ssl.
Click Select.
Click OK.
Note: An application in NetScaler MAS is a way to group multiple virtual servers together so that they can be managed and viewed as a single entity. This can be used to group virtual severs and dependencies together, such as if we were using the callout or an authentication virtual server in conjunction with a load balancing virtual server or content switching and the destination load balancing virtual servers could be combined together. This could also be useful to keep track of HTTP and HTTPS virtual servers that frontend the same application. This step was meant to illustrate the concept that an application does not have to be defined 1:1 per virtual server. Also note a given virtual server can appear in more than one Application definition in MAS, so different "views" can be used to monitor the same virtual server.
25
6. Use Applications Dashboard to manage NetScaler entities and perform operational tasks:
Remain on Applications tab.
Navigate to Dashboard > Load Balancing > Virtual Servers.
Select (check) lb_vsrv_afweb and lb_vsrv_webgoat and click Disable. Click Yes to confirm.
View Applications Dashboard:
Navigate to Dashboard node in left-pane (on Applications tab).
Scroll down to the State summary graph and verify 2 virtual servers are listed as "out of service".
7. Switch to Tab (1) in Chrome for the NetScaler Configuration Utility for NS_VPX_01 at http://192.168.10.101. Log on as nsroot / nsroot if needed.
Click ok on Infomational Pop-up
Navigate to Traffic Management > Load Balancing > Virtual Servers.
Refresh the view, if necessary.
Verify lb_vsrv_afweb and lb_vsrv_webgoat are disabled and listed as "out of service".
View the Saved v/s Running Configuration:
Navigate to System > Diagnostics.
Click Saved v/s Running in the right-pane under View Configuration.
Notice that the configuration was saved when changes were applied by NetScaler MAS.
Click Close to exit the Saved v/s Running Configuration display.
8. Return to Tab (2) in Chrome for the NetScaler MAS management console at http://mas.training.lab. Log on as nsroot / nsroot.
9. Manage a service using NetScaler MAS:
Remain on the Applications tab.
Navigate to Dashboard > Load Balancing > Services.
Select (check) svc_callout and click Bound Virtual Servers to see all references to this service before making changes. (Bound Service Groups are separate).
Use the Navigational breadcrumb to return to the Services view.
Select (check) svc_callout and click Enable and Yes to return the service to an UP state.
10. Return to the Virtual Servers node and view virtual server states.
Navigate to Dashboard > Load Balancing > Virtual Servers.
Notice after enabling svc_callout, lb_vsrv_callout is still DOWN. This is due to the polling frequency.
Click Poll Now and click Yes to confirm on the Virtual Servers plage to update all virtual servers.
Click OK to confirm polling initiatied successfully.
Click the in-page refresh to verify lb_vsrv_callout is now UP.
26
11. Return to the Virtual Servers node to re-enable the virtual servers.
Select (check) lb_vsrv_afweb and lb_vsrv_webgoat.
Click Enable and click Yes.
Takeaways:
NetScaler MAS can view NetScaler instance, entity, and application status and key dashboard metrics and top-n statistics.
NetScaler MAS dasbhoards and related drill-down views allow administrators to manage NetScaler instance configurations and backups.
NetScaler MAS application and infrastructure dashboards can allow administrators to enable/disable entities across multiple managed NetScalers.
NetScaler MAS allows administrators to switch from dashboard statistics and summary views to entity configuration and management views.
27
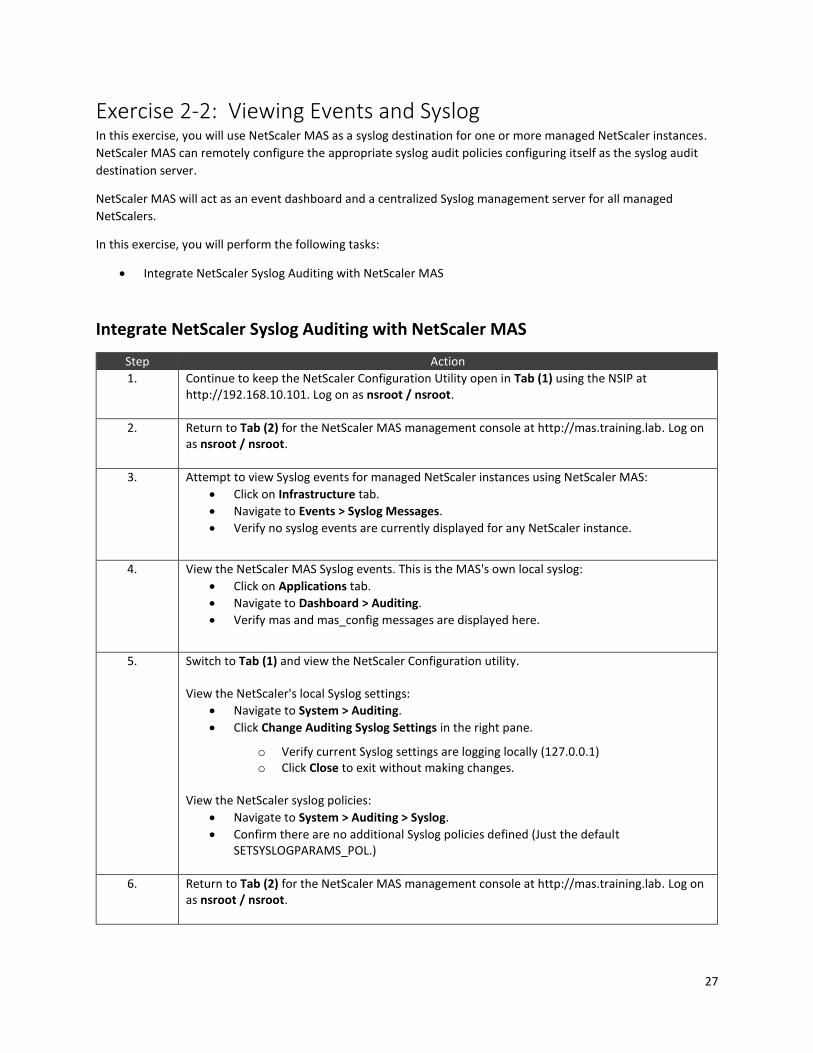
Exercise 2-2: Viewing Events and Syslog In this exercise, you will use NetScaler MAS as a syslog destination for one or more managed NetScaler instances.
NetScaler MAS can remotely configure the appropriate syslog audit policies configuring itself as the syslog audit
destination server.
NetScaler MAS will act as an event dashboard and a centralized Syslog management server for all managed
NetScalers.
In this exercise, you will perform the following tasks:
Integrate NetScaler Syslog Auditing with NetScaler MAS
Integrate NetScaler Syslog Auditing with NetScaler MAS
Step Action
1. Continue to keep the NetScaler Configuration Utility open in Tab (1) using the NSIP at http://192.168.10.101. Log on as nsroot / nsroot.
2. Return to Tab (2) for the NetScaler MAS management console at http://mas.training.lab. Log on as nsroot / nsroot.
3. Attempt to view Syslog events for managed NetScaler instances using NetScaler MAS:
Click on Infrastructure tab.
Navigate to Events > Syslog Messages.
Verify no syslog events are currently displayed for any NetScaler instance.
4. View the NetScaler MAS Syslog events. This is the MAS's own local syslog:
Click on Applications tab.
Navigate to Dashboard > Auditing.
Verify mas and mas_config messages are displayed here.
5. Switch to Tab (1) and view the NetScaler Configuration utility. View the NetScaler's local Syslog settings:
Navigate to System > Auditing.
Click Change Auditing Syslog Settings in the right pane.
o Verify current Syslog settings are logging locally (127.0.0.1) o Click Close to exit without making changes.
View the NetScaler syslog policies:
Navigate to System > Auditing > Syslog.
Confirm there are no additional Syslog policies defined (Just the default SETSYSLOGPARAMS_POL.)
6. Return to Tab (2) for the NetScaler MAS management console at http://mas.training.lab. Log on as nsroot / nsroot.
28
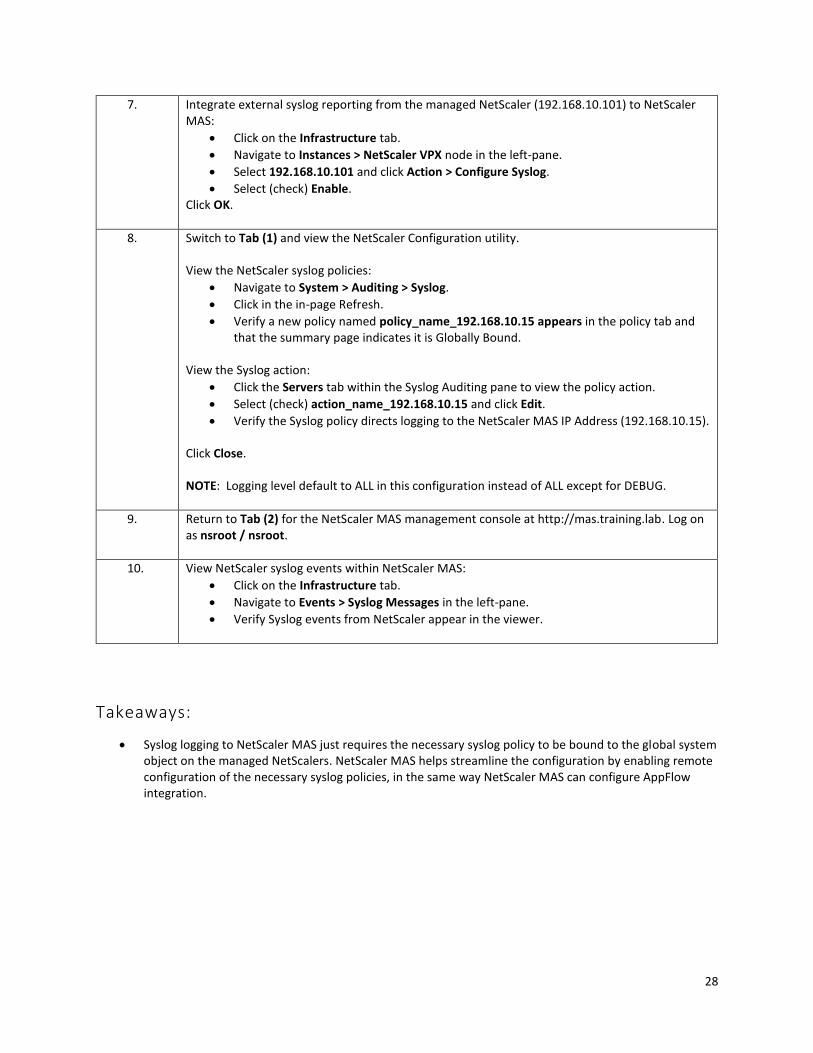
7. Integrate external syslog reporting from the managed NetScaler (192.168.10.101) to NetScaler MAS:
Click on the Infrastructure tab.
Navigate to Instances > NetScaler VPX node in the left-pane.
Select 192.168.10.101 and click Action > Configure Syslog.
Select (check) Enable. Click OK.
8. Switch to Tab (1) and view the NetScaler Configuration utility. View the NetScaler syslog policies:
Navigate to System > Auditing > Syslog.
Click in the in-page Refresh.
Verify a new policy named policy_name_192.168.10.15 appears in the policy tab and that the summary page indicates it is Globally Bound.
View the Syslog action:
Click the Servers tab within the Syslog Auditing pane to view the policy action.
Select (check) action_name_192.168.10.15 and click Edit.
Verify the Syslog policy directs logging to the NetScaler MAS IP Address (192.168.10.15). Click Close. NOTE: Logging level default to ALL in this configuration instead of ALL except for DEBUG.
9. Return to Tab (2) for the NetScaler MAS management console at http://mas.training.lab. Log on as nsroot / nsroot.
10. View NetScaler syslog events within NetScaler MAS:
Click on the Infrastructure tab.
Navigate to Events > Syslog Messages in the left-pane.
Verify Syslog events from NetScaler appear in the viewer.
Takeaways:
Syslog logging to NetScaler MAS just requires the necessary syslog policy to be bound to the global system object on the managed NetScalers. NetScaler MAS helps streamline the configuration by enabling remote configuration of the necessary syslog policies, in the same way NetScaler MAS can configure AppFlow integration.
29
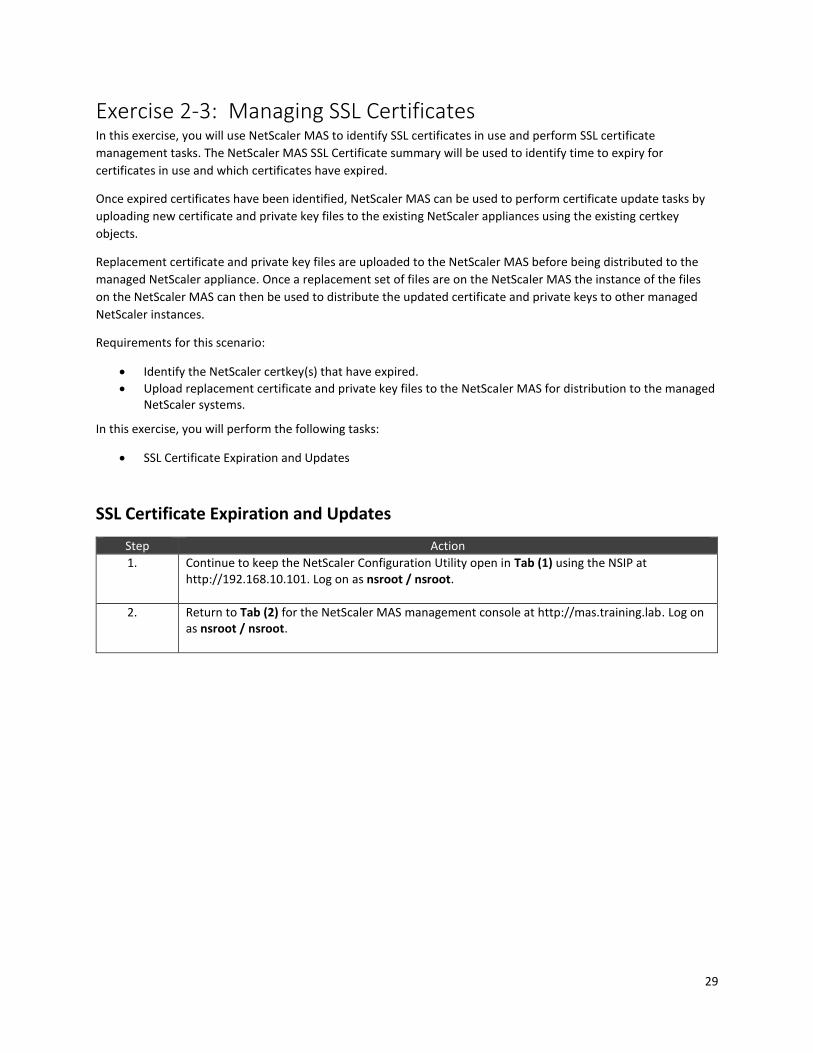
Exercise 2-3: Managing SSL Certificates In this exercise, you will use NetScaler MAS to identify SSL certificates in use and perform SSL certificate
management tasks. The NetScaler MAS SSL Certificate summary will be used to identify time to expiry for
certificates in use and which certificates have expired.
Once expired certificates have been identified, NetScaler MAS can be used to perform certificate update tasks by
uploading new certificate and private key files to the existing NetScaler appliances using the existing certkey
objects.
Replacement certificate and private key files are uploaded to the NetScaler MAS before being distributed to the
managed NetScaler appliance. Once a replacement set of files are on the NetScaler MAS the instance of the files
on the NetScaler MAS can then be used to distribute the updated certificate and private keys to other managed
NetScaler instances.
Requirements for this scenario:
Identify the NetScaler certkey(s) that have expired.
Upload replacement certificate and private key files to the NetScaler MAS for distribution to the managed NetScaler systems.
In this exercise, you will perform the following tasks:
SSL Certificate Expiration and Updates
SSL Certificate Expiration and Updates
Step Action
1. Continue to keep the NetScaler Configuration Utility open in Tab (1) using the NSIP at http://192.168.10.101. Log on as nsroot / nsroot.
2. Return to Tab (2) for the NetScaler MAS management console at http://mas.training.lab. Log on as nsroot / nsroot.
30
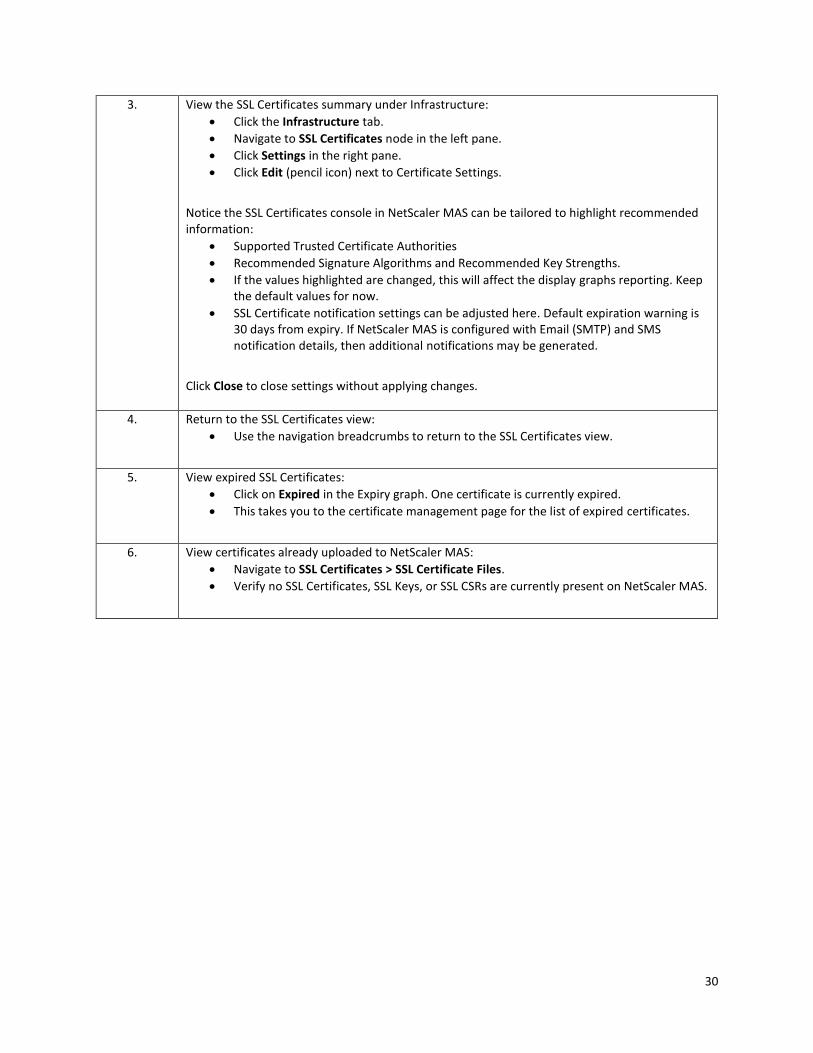
3. View the SSL Certificates summary under Infrastructure:
Click the Infrastructure tab.
Navigate to SSL Certificates node in the left pane.
Click Settings in the right pane.
Click Edit (pencil icon) next to Certificate Settings.
Notice the SSL Certificates console in NetScaler MAS can be tailored to highlight recommended information:
Supported Trusted Certificate Authorities
Recommended Signature Algorithms and Recommended Key Strengths.
If the values highlighted are changed, this will affect the display graphs reporting. Keep the default values for now.
SSL Certificate notification settings can be adjusted here. Default expiration warning is 30 days from expiry. If NetScaler MAS is configured with Email (SMTP) and SMS notification details, then additional notifications may be generated.
Click Close to close settings without applying changes.
4. Return to the SSL Certificates view:
Use the navigation breadcrumbs to return to the SSL Certificates view.
5. View expired SSL Certificates:
Click on Expired in the Expiry graph. One certificate is currently expired.
This takes you to the certificate management page for the list of expired certificates.
6. View certificates already uploaded to NetScaler MAS:
Navigate to SSL Certificates > SSL Certificate Files.
Verify no SSL Certificates, SSL Keys, or SSL CSRs are currently present on NetScaler MAS.
31
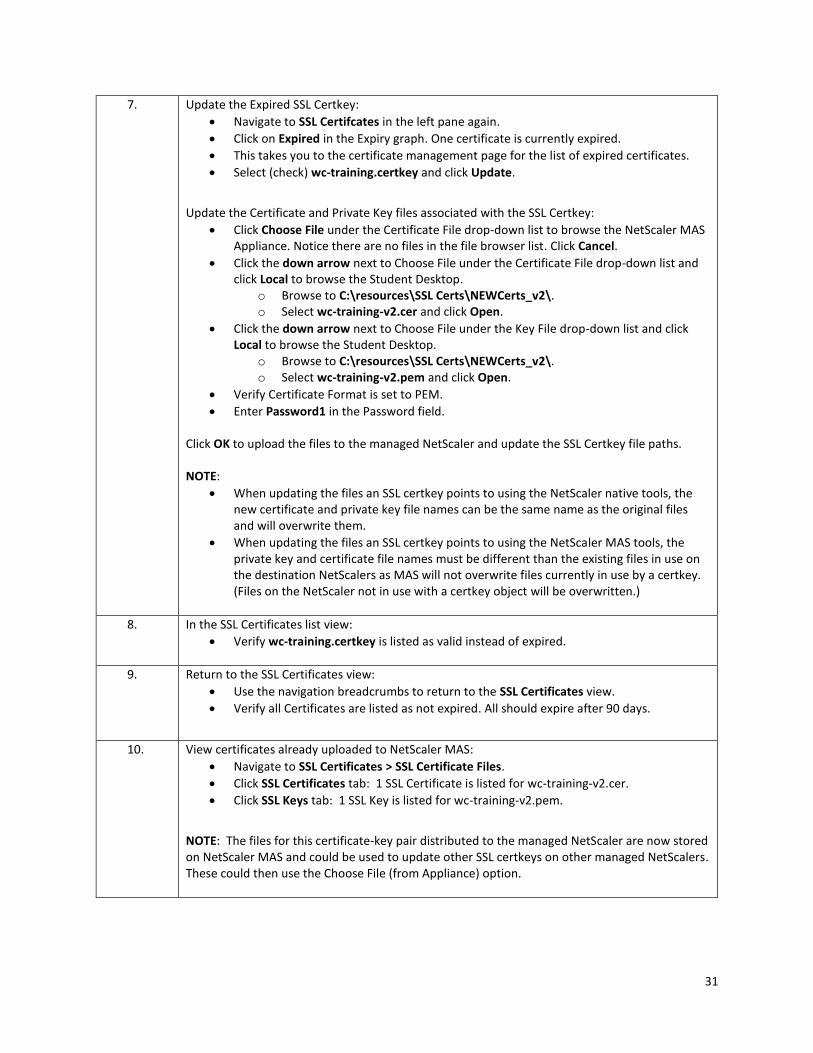
7. Update the Expired SSL Certkey:
Navigate to SSL Certifcates in the left pane again.
Click on Expired in the Expiry graph. One certificate is currently expired.
This takes you to the certificate management page for the list of expired certificates.
Select (check) wc-training.certkey and click Update.
Update the Certificate and Private Key files associated with the SSL Certkey:
Click Choose File under the Certificate File drop-down list to browse the NetScaler MAS Appliance. Notice there are no files in the file browser list. Click Cancel.
Click the down arrow next to Choose File under the Certificate File drop-down list and click Local to browse the Student Desktop.
o Browse to C:\resources\SSL Certs\NEWCerts_v2\. o Select wc-training-v2.cer and click Open.
Click the down arrow next to Choose File under the Key File drop-down list and click Local to browse the Student Desktop.
o Browse to C:\resources\SSL Certs\NEWCerts_v2\. o Select wc-training-v2.pem and click Open.
Verify Certificate Format is set to PEM.
Enter Password1 in the Password field. Click OK to upload the files to the managed NetScaler and update the SSL Certkey file paths. NOTE:
When updating the files an SSL certkey points to using the NetScaler native tools, the new certificate and private key file names can be the same name as the original files and will overwrite them.
When updating the files an SSL certkey points to using the NetScaler MAS tools, the private key and certificate file names must be different than the existing files in use on the destination NetScalers as MAS will not overwrite files currently in use by a certkey. (Files on the NetScaler not in use with a certkey object will be overwritten.)
8. In the SSL Certificates list view:
Verify wc-training.certkey is listed as valid instead of expired.
9. Return to the SSL Certificates view:
Use the navigation breadcrumbs to return to the SSL Certificates view.
Verify all Certificates are listed as not expired. All should expire after 90 days.
10. View certificates already uploaded to NetScaler MAS:
Navigate to SSL Certificates > SSL Certificate Files.
Click SSL Certificates tab: 1 SSL Certificate is listed for wc-training-v2.cer.
Click SSL Keys tab: 1 SSL Key is listed for wc-training-v2.pem.
NOTE: The files for this certificate-key pair distributed to the managed NetScaler are now stored on NetScaler MAS and could be used to update other SSL certkeys on other managed NetScalers. These could then use the Choose File (from Appliance) option.
32
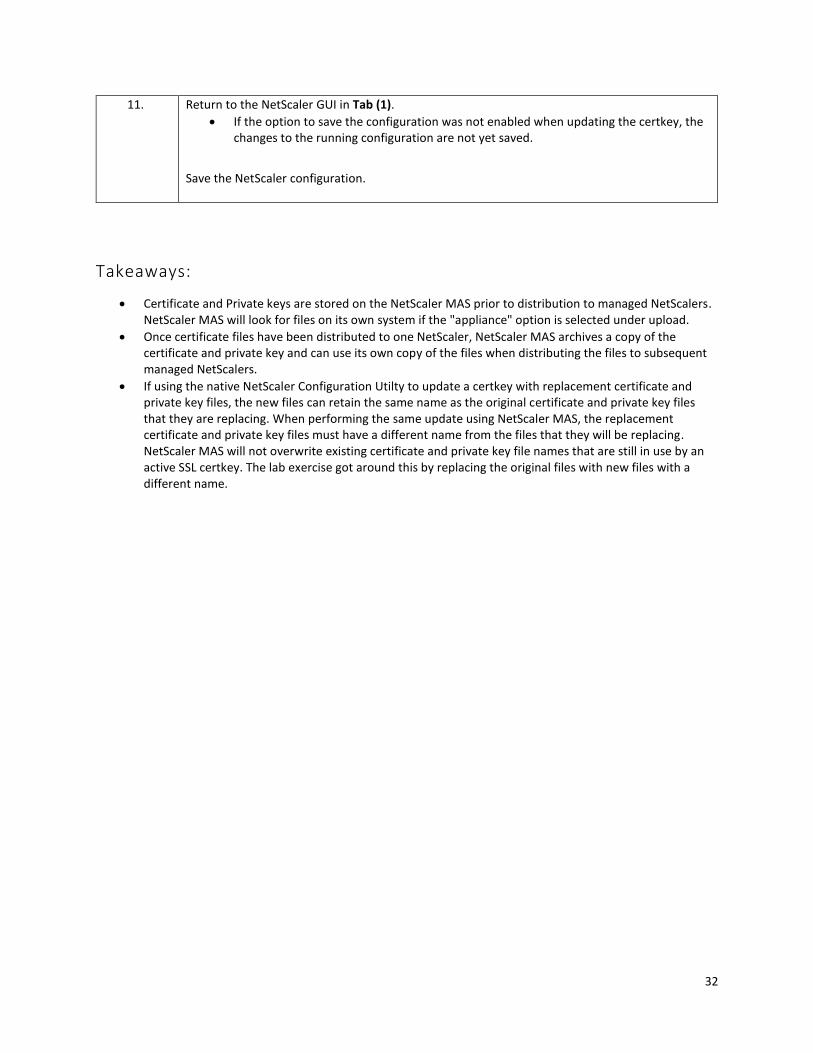
11. Return to the NetScaler GUI in Tab (1).
If the option to save the configuration was not enabled when updating the certkey, the changes to the running configuration are not yet saved.
Save the NetScaler configuration.
Takeaways:
Certificate and Private keys are stored on the NetScaler MAS prior to distribution to managed NetScalers. NetScaler MAS will look for files on its own system if the "appliance" option is selected under upload.
Once certificate files have been distributed to one NetScaler, NetScaler MAS archives a copy of the certificate and private key and can use its own copy of the files when distributing the files to subsequent managed NetScalers.
If using the native NetScaler Configuration Utilty to update a certkey with replacement certificate and private key files, the new files can retain the same name as the original certificate and private key files that they are replacing. When performing the same update using NetScaler MAS, the replacement certificate and private key files must have a different name from the files that they will be replacing. NetScaler MAS will not overwrite existing certificate and private key file names that are still in use by an active SSL certkey. The lab exercise got around this by replacing the original files with new files with a different name.
33
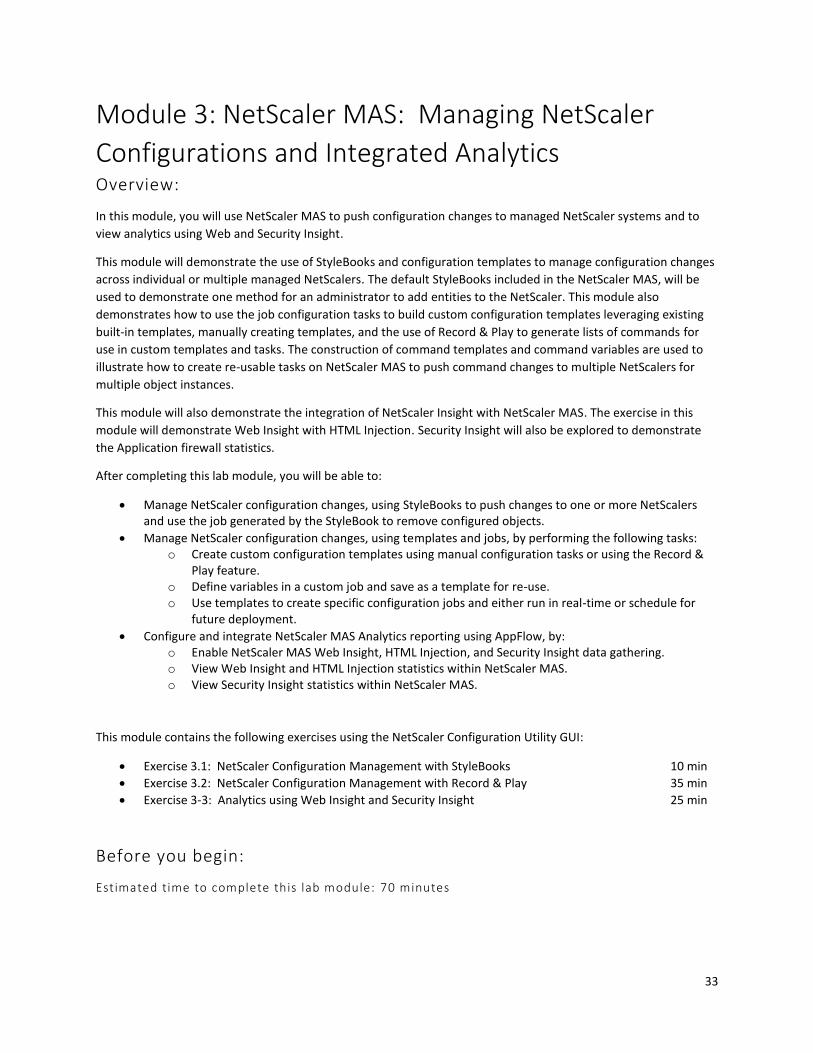
Module 3: NetScaler MAS: Managing NetScaler
Configurations and Integrated Analytics Overview:
In this module, you will use NetScaler MAS to push configuration changes to managed NetScaler systems and to
view analytics using Web and Security Insight.
This module will demonstrate the use of StyleBooks and configuration templates to manage configuration changes
across individual or multiple managed NetScalers. The default StyleBooks included in the NetScaler MAS, will be
used to demonstrate one method for an administrator to add entities to the NetScaler. This module also
demonstrates how to use the job configuration tasks to build custom configuration templates leveraging existing
built-in templates, manually creating templates, and the use of Record & Play to generate lists of commands for
use in custom templates and tasks. The construction of command templates and command variables are used to
illustrate how to create re-usable tasks on NetScaler MAS to push command changes to multiple NetScalers for
multiple object instances.
This module will also demonstrate the integration of NetScaler Insight with NetScaler MAS. The exercise in this
module will demonstrate Web Insight with HTML Injection. Security Insight will also be explored to demonstrate
the Application firewall statistics.
After completing this lab module, you will be able to:
Manage NetScaler configuration changes, using StyleBooks to push changes to one or more NetScalers and use the job generated by the StyleBook to remove configured objects.
Manage NetScaler configuration changes, using templates and jobs, by performing the following tasks: o Create custom configuration templates using manual configuration tasks or using the Record &
Play feature. o Define variables in a custom job and save as a template for re-use. o Use templates to create specific configuration jobs and either run in real-time or schedule for
future deployment.
Configure and integrate NetScaler MAS Analytics reporting using AppFlow, by: o Enable NetScaler MAS Web Insight, HTML Injection, and Security Insight data gathering. o View Web Insight and HTML Injection statistics within NetScaler MAS. o View Security Insight statistics within NetScaler MAS.
This module contains the following exercises using the NetScaler Configuration Utility GUI:
Exercise 3.1: NetScaler Configuration Management with StyleBooks 10 min
Exercise 3.2: NetScaler Configuration Management with Record & Play 35 min
Exercise 3-3: Analytics using Web Insight and Security Insight 25 min
Before you begin:
Estimated time to complete this lab module: 70 minutes
34
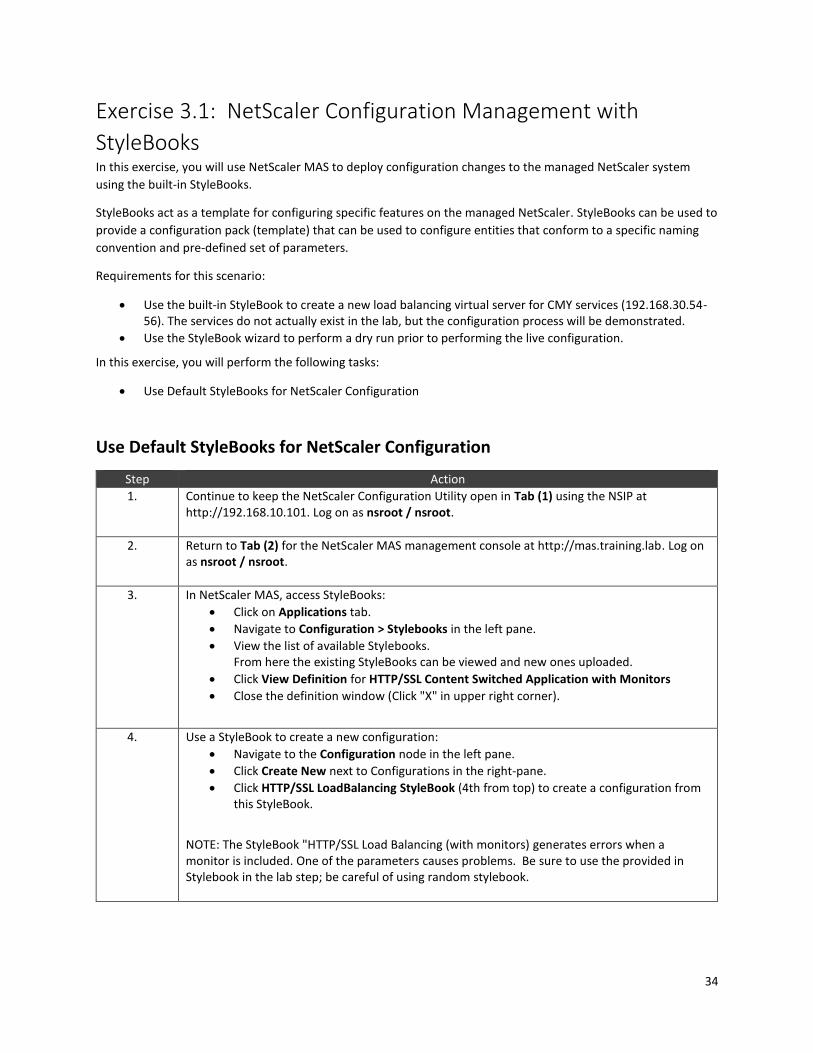
Exercise 3.1: NetScaler Configuration Management with
StyleBooks In this exercise, you will use NetScaler MAS to deploy configuration changes to the managed NetScaler system
using the built-in StyleBooks.
StyleBooks act as a template for configuring specific features on the managed NetScaler. StyleBooks can be used to
provide a configuration pack (template) that can be used to configure entities that conform to a specific naming
convention and pre-defined set of parameters.
Requirements for this scenario:
Use the built-in StyleBook to create a new load balancing virtual server for CMY services (192.168.30.54-56). The services do not actually exist in the lab, but the configuration process will be demonstrated.
Use the StyleBook wizard to perform a dry run prior to performing the live configuration.
In this exercise, you will perform the following tasks:
Use Default StyleBooks for NetScaler Configuration
Use Default StyleBooks for NetScaler Configuration
Step Action
1. Continue to keep the NetScaler Configuration Utility open in Tab (1) using the NSIP at http://192.168.10.101. Log on as nsroot / nsroot.
2. Return to Tab (2) for the NetScaler MAS management console at http://mas.training.lab. Log on as nsroot / nsroot.
3. In NetScaler MAS, access StyleBooks:
Click on Applications tab.
Navigate to Configuration > Stylebooks in the left pane.
View the list of available Stylebooks. From here the existing StyleBooks can be viewed and new ones uploaded.
Click View Definition for HTTP/SSL Content Switched Application with Monitors
Close the definition window (Click "X" in upper right corner).
4. Use a StyleBook to create a new configuration:
Navigate to the Configuration node in the left pane.
Click Create New next to Configurations in the right-pane.
Click HTTP/SSL LoadBalancing StyleBook (4th from top) to create a configuration from this StyleBook.
NOTE: The StyleBook "HTTP/SSL Load Balancing (with monitors) generates errors when a monitor is included. One of the parameters causes problems. Be sure to use the provided in Stylebook in the lab step; be careful of using random stylebook.
35
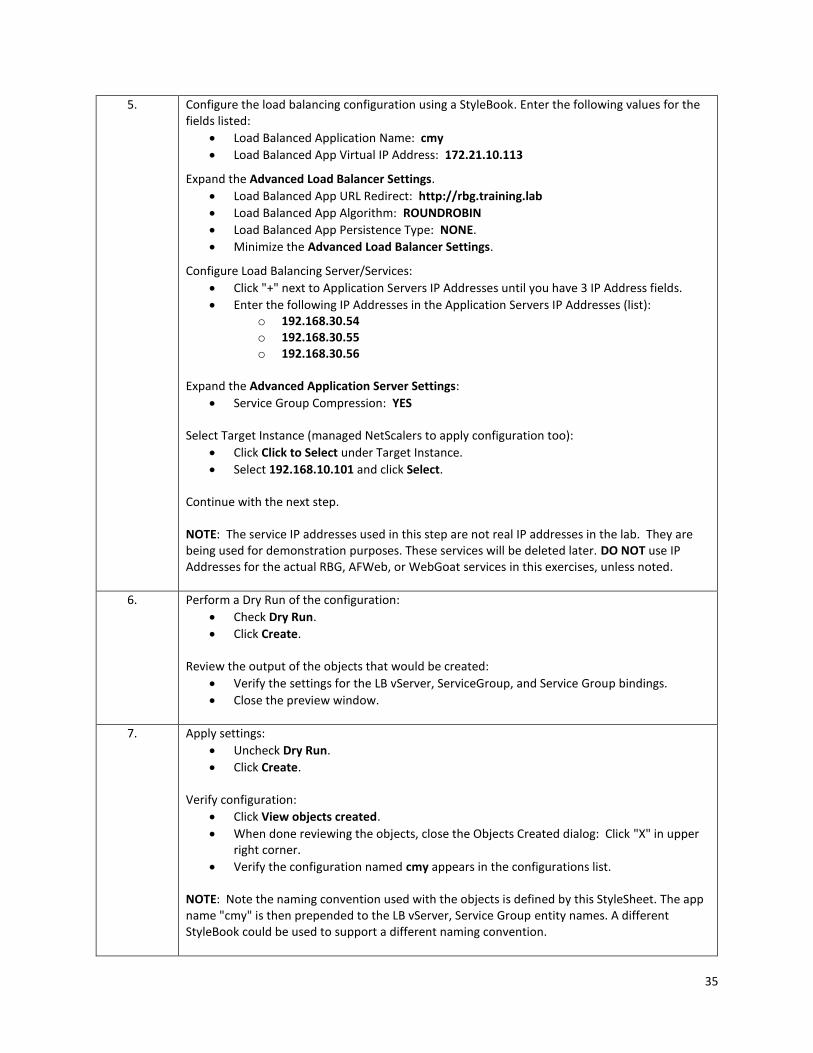
5. Configure the load balancing configuration using a StyleBook. Enter the following values for the fields listed:
Load Balanced Application Name: cmy
Load Balanced App Virtual IP Address: 172.21.10.113
Expand the Advanced Load Balancer Settings.
Load Balanced App URL Redirect: http://rbg.training.lab
Load Balanced App Algorithm: ROUNDROBIN
Load Balanced App Persistence Type: NONE.
Minimize the Advanced Load Balancer Settings.
Configure Load Balancing Server/Services:
Click "+" next to Application Servers IP Addresses until you have 3 IP Address fields.
Enter the following IP Addresses in the Application Servers IP Addresses (list): o 192.168.30.54 o 192.168.30.55 o 192.168.30.56
Expand the Advanced Application Server Settings:
Service Group Compression: YES Select Target Instance (managed NetScalers to apply configuration too):
Click Click to Select under Target Instance.
Select 192.168.10.101 and click Select. Continue with the next step. NOTE: The service IP addresses used in this step are not real IP addresses in the lab. They are being used for demonstration purposes. These services will be deleted later. DO NOT use IP Addresses for the actual RBG, AFWeb, or WebGoat services in this exercises, unless noted.
6. Perform a Dry Run of the configuration:
Check Dry Run.
Click Create. Review the output of the objects that would be created:
Verify the settings for the LB vServer, ServiceGroup, and Service Group bindings.
Close the preview window.
7. Apply settings:
Uncheck Dry Run.
Click Create. Verify configuration:
Click View objects created.
When done reviewing the objects, close the Objects Created dialog: Click "X" in upper right corner.
Verify the configuration named cmy appears in the configurations list. NOTE: Note the naming convention used with the objects is defined by this StyleSheet. The app name "cmy" is then prepended to the LB vServer, Service Group entity names. A different StyleBook could be used to support a different naming convention.
36
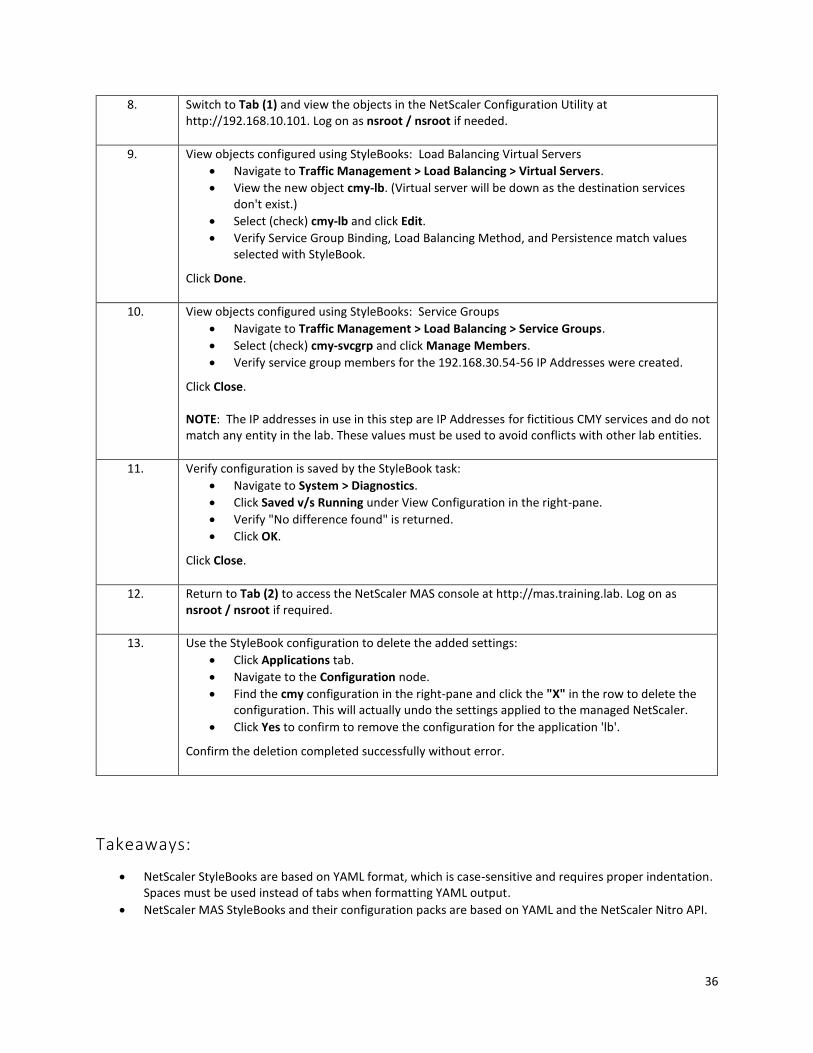
8. Switch to Tab (1) and view the objects in the NetScaler Configuration Utility at http://192.168.10.101. Log on as nsroot / nsroot if needed.
9. View objects configured using StyleBooks: Load Balancing Virtual Servers
Navigate to Traffic Management > Load Balancing > Virtual Servers.
View the new object cmy-lb. (Virtual server will be down as the destination services don't exist.)
Select (check) cmy-lb and click Edit.
Verify Service Group Binding, Load Balancing Method, and Persistence match values selected with StyleBook.
Click Done.
10. View objects configured using StyleBooks: Service Groups
Navigate to Traffic Management > Load Balancing > Service Groups.
Select (check) cmy-svcgrp and click Manage Members.
Verify service group members for the 192.168.30.54-56 IP Addresses were created.
Click Close. NOTE: The IP addresses in use in this step are IP Addresses for fictitious CMY services and do not match any entity in the lab. These values must be used to avoid conflicts with other lab entities.
11. Verify configuration is saved by the StyleBook task:
Navigate to System > Diagnostics.
Click Saved v/s Running under View Configuration in the right-pane.
Verify "No difference found" is returned.
Click OK.
Click Close.
12. Return to Tab (2) to access the NetScaler MAS console at http://mas.training.lab. Log on as nsroot / nsroot if required.
13. Use the StyleBook configuration to delete the added settings:
Click Applications tab.
Navigate to the Configuration node.
Find the cmy configuration in the right-pane and click the "X" in the row to delete the configuration. This will actually undo the settings applied to the managed NetScaler.
Click Yes to confirm to remove the configuration for the application 'lb'.
Confirm the deletion completed successfully without error.
Takeaways:
NetScaler StyleBooks are based on YAML format, which is case-sensitive and requires proper indentation. Spaces must be used instead of tabs when formatting YAML output.
NetScaler MAS StyleBooks and their configuration packs are based on YAML and the NetScaler Nitro API.
37
Exercise 3.2: NetScaler Configuration Management with Record
& Play In this exercise, you will use the NetScaler MAS to manage NetScaler configuration settings using configuration
templates. InBuilt templates provide pre-defined command definitions that can be used to create new
configuration jobs or as starting points for manually creating custom jobs. These templates can also contain
variable definitions so that the templates can be used to repeat configuration tasks.
To allow for greater flexibility in building complex tasks, NetScaler MAS contains a Record & Play feature that
allows an administrator to configure settings in a NetScaler (test or production) and then use the configuration
commands executed during the Record & Play session as the commands to seed the job with. These commands
can then be converted to a template, modified with variables, and then used to create additional jobs.
In this scenario, the Record & Play scenario will be used to generate a template that can be used to generate a load
balancing virtual server, create a service group, and bind the service group to the virtual server. The template will
allow administrators to supply custom values such as Virtual IP Address, port, virtual server name, and service
group name. To make the template truly useful as a repeatable task for multiple entities across multiple
NetScalers, the template will allow any number of service members to be bound to the service group by defining a
service IP or service IP range.
Requirements for this scenario:
View commands and variable definitions in the InBuilt template.
Use Record & Play to generate a template that can be used to create a service group with service group members, create a load balancing virtual server, and bind the service group.
Convert the explicit commands to a generic task and define the custom variables.
Save the job as a template so it can be reused.
Create a job from the template and apply the settings to the managed NetScaler.
In this exercise, you will perform the following tasks:
Create a Job from the InBuilt Template
Create a Custom Template and Job using Record & Play
Create a Job from the InBuilt Template
Step Action
1. Continue to keep the NetScaler Configuration Utility open in Tab (1) using the NSIP at http://192.168.10.101. Log on as nsroot / nsroot.
2. Return to Tab (2) for the NetScaler MAS management console at http://mas.training.lab. Log on as nsroot / nsroot. NOTE: For this exercise, ensure you are using Chrome. In order to use the Record & Play option, pop-up blockers in the browser must be disabled. This has already been done on the lab system in the Chrome browser.
38
3. Manage configuration jobs:
Click the Infrastructure tab.
Navigate to Configuration Jobs in the left-pane.
Click Create Job on the initial welcome pane.
4. Create a Test Job based on an existing Template:
Verify you are on the Select Configuration tab.
Enter Job1_syslog_demo in the Job Name field.
Verify NetScaler is selected in the Instance Type field.
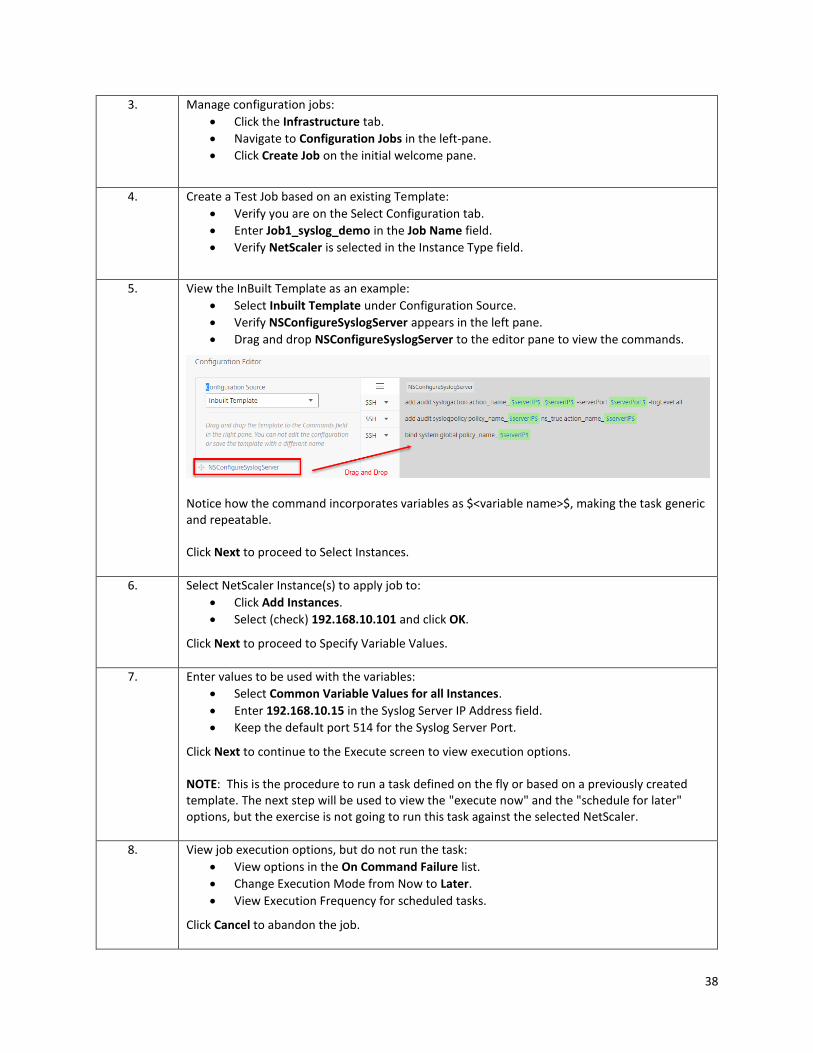
5. View the InBuilt Template as an example:
Select Inbuilt Template under Configuration Source.
Verify NSConfigureSyslogServer appears in the left pane.
Drag and drop NSConfigureSyslogServer to the editor pane to view the commands.
Notice how the command incorporates variables as $<variable name>$, making the task generic and repeatable. Click Next to proceed to Select Instances.
6. Select NetScaler Instance(s) to apply job to:
Click Add Instances.
Select (check) 192.168.10.101 and click OK.
Click Next to proceed to Specify Variable Values.
7. Enter values to be used with the variables:
Select Common Variable Values for all Instances.
Enter 192.168.10.15 in the Syslog Server IP Address field.
Keep the default port 514 for the Syslog Server Port.
Click Next to continue to the Execute screen to view execution options. NOTE: This is the procedure to run a task defined on the fly or based on a previously created template. The next step will be used to view the "execute now" and the "schedule for later" options, but the exercise is not going to run this task against the selected NetScaler.
8. View job execution options, but do not run the task:
View options in the On Command Failure list.
Change Execution Mode from Now to Later.
View Execution Frequency for scheduled tasks.
Click Cancel to abandon the job.
39
Create a Custom Template and Job using Record & Play
Step Action
1. Create a JOB using Record and Play to create a virtual server and bind a service group with services.
Click on Infrastructure tab.
Navigate to Configuration Jobs.
Click Create Job.
2. Create initial job settings on the Select configuration tab:
Enter job1_lbv_demo1 in the Job Name field.
Select NetScaler under Instance Type.
Select Record and Play under Configuration Source.
Select ns_vpx_01 (192.168.10.101) under Source Instance.
Click Record. If the NetScaler Configuration Utility for NS_VPX_01 doesn't open in a new window, verify pop-up blockers are disabled in your browser. This browser window will be restricted to the NetScaler Configuration Utility only.
3. Create a Service Group:
Navigate to Traffic Management > Load Balancing > Service Groups.
Click Add.
Configure the Service Group settings:
Enter svcg_cmy in the Name Field.
Click OK.
Click No Service Group Member under the Service Group Members category.
Enter IP Address Range: 192.168.30.54.
Enter 80 in the Port field.
Click Create.
Click OK under Service Group Members to advance the wizard. Click Done to complete the Service Group. NOTE: The IP address(es) in use in this step are IP Addresses for fictitious CMY services and do not match any entity in the lab. These values must be used to avoid conflicts with other lab entities.
40
4. Create a Load Balancing Virtual Server:
Navigate to Traffic Management > Load Balancing > Virtual Servers.
Click Add.
Enter lb_vsrv_cmy in the Name field.
Enter 172.21.10.113 in the IP Address field.
Click OK.
Bind a Service Group to the Load Balancing Virtual Server:
Click No Load Balancing Virtual Server ServiceGroup Binding under the Services and Service Group category.
Click Click to Select under Select Service Group Name*.
Select svcg_cmy and click Select.
Click Bind.
Click Continue.
Click Done to complete the Load Balancing Virtual Server.
5. Close the browser running the pop-up session of the NetScaler Configuration Utility (http://192.168.10.101). This will return you to the Record & Play session the browser instance running NetScaler MAS. Click Stop in the Configuration Editor to stop the Record and Play recording session. A link of 4 commands from 192.168.10.101 should appear in the configuration pane (left pane).
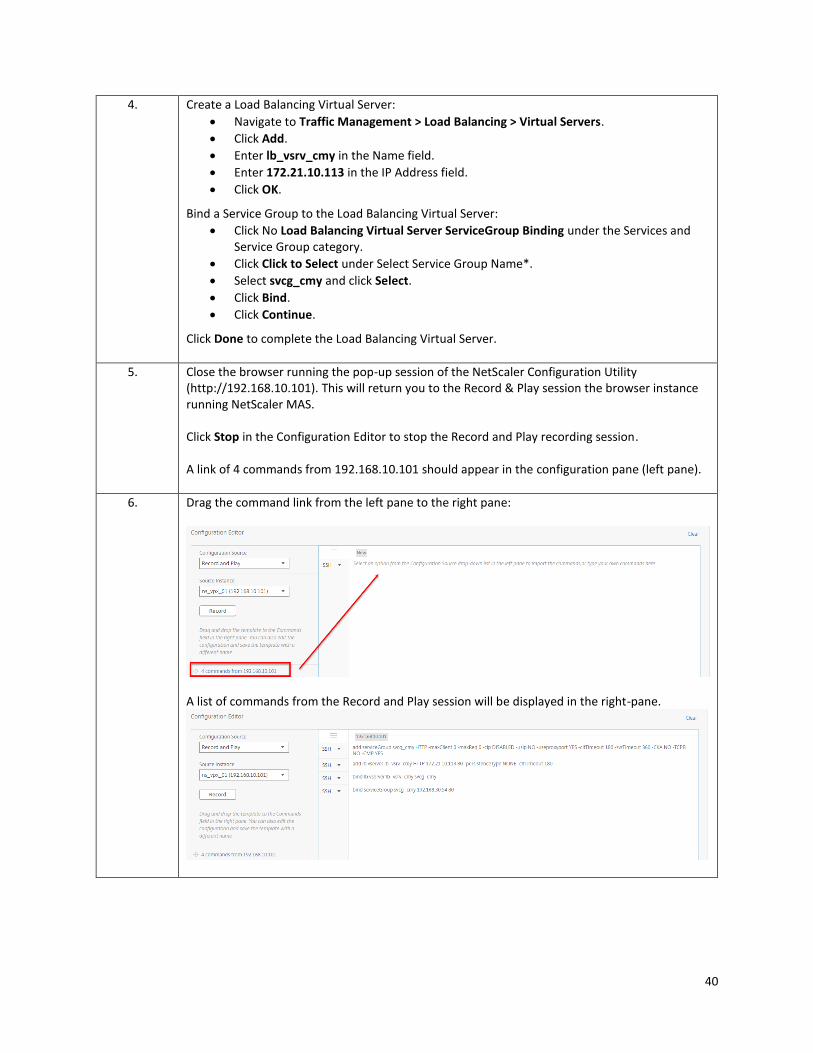
6. Drag the command link from the left pane to the right pane:
A list of commands from the Record and Play session will be displayed in the right-pane.
41
7. Update the list of commands, to make a generic task that can be used to create any LB vServer with a Service Group binding. Several lines will need to be edited. Notes on editing the CLI commands in the Configuration Editor:
To delete a command, highlight one command row at a time and use Backspace to delete. This will delete the row.
Variables can be defined using "$" signs around the variable name. Specific references to IP Addresses and Entity names will be replaced with variables to make a generic task.
Before proceeding, let's save the configuration at this point, so it can be recovered if a mistake is made:
Check Save as Configuration Template.
Enter Template_lbv_withSvcGroup in the Configuration Template Name field.
Click Save.
If you have an issue, you can re-drag and drop content from the template to replace commands. The template will be updated once all tasks have been completed.
8. Below is the current command list in the Configuration Editor (indented lines continue from preceding line):
add serviceGroup svcg_cmy HTTP -maxClient 0 -maxReq 0 -cip
DISABLED -usip NO -useproxyport YES -cltTimeout 180 -
svrTimeout 360 -CKA NO -TCPB NO -CMP YES
add lb vserver lb_vsrv_cmy HTTP 172.21.10.113 80 -
persistenceType NONE -cltTimeout 180
bind lb vserver lb_vsrv_cmy svcg_cmy
bind serviceGroup svcg_cmy 192.168.30.54 80
Edit the commands so they match the commands listed below. Notice that default settings are being removed to simplify commands. Detailed settings can be adjusted in the native console.
add serviceGroup $my_svcg$ HTTP
add lb vserver $my_lbvsrv$ HTTP $my_vip$ $my_port$
bind lb vserver $my_lbvsrv$ $my_svcg$
bind serviceGroup $my_svcg$ $my_svcIP_orRange$ $my_port$
The service members IP in the ServiceGroup bind command are meant to allow a user to supply an individual service IP Address or an IP Range using the following notation. Allowing this template to be used to bind any number of services in a single task: Example: bind serviceGroup svcg_demo 192.168.30.[1-3] NOTE: The IP addresses in use in this step are IP Addresses for fictitious CMY services and do not match any entity in the lab. These values must be used to avoid conflicts with other lab entities.
42
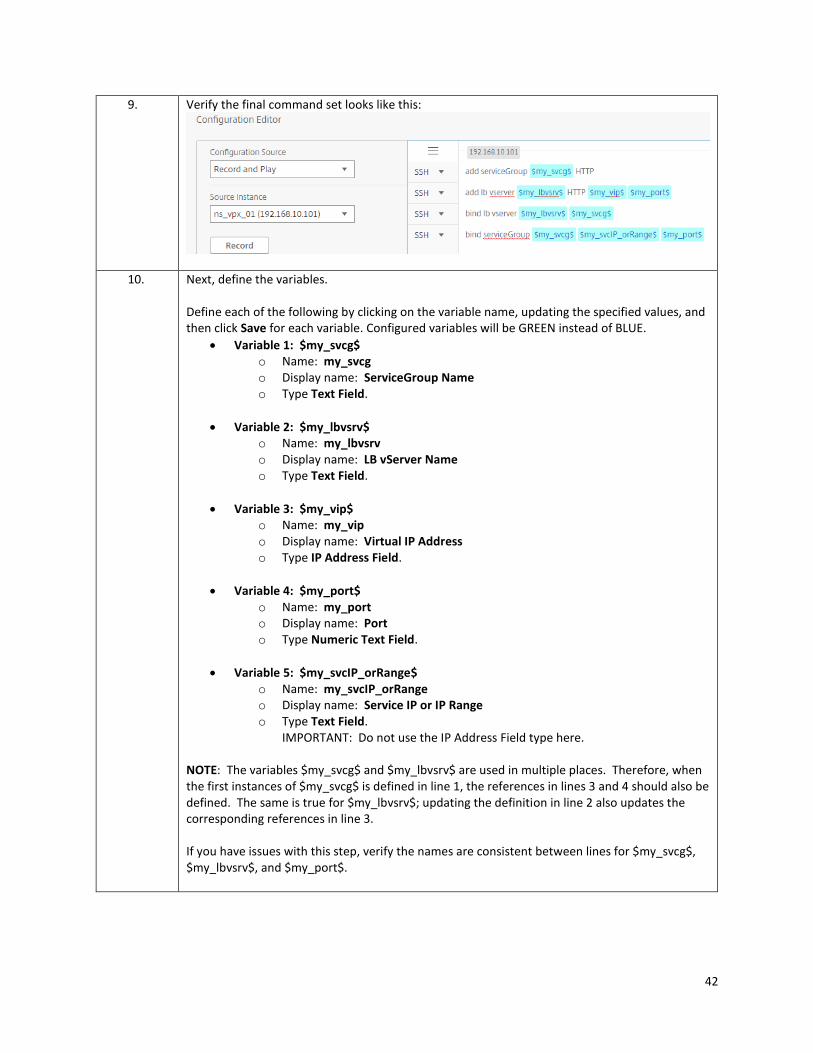
9. Verify the final command set looks like this:
10. Next, define the variables. Define each of the following by clicking on the variable name, updating the specified values, and then click Save for each variable. Configured variables will be GREEN instead of BLUE.
Variable 1: $my_svcg$ o Name: my_svcg o Display name: ServiceGroup Name o Type Text Field.
Variable 2: $my_lbvsrv$ o Name: my_lbvsrv o Display name: LB vServer Name o Type Text Field.
Variable 3: $my_vip$ o Name: my_vip o Display name: Virtual IP Address o Type IP Address Field.
Variable 4: $my_port$ o Name: my_port o Display name: Port o Type Numeric Text Field.
Variable 5: $my_svcIP_orRange$ o Name: my_svcIP_orRange o Display name: Service IP or IP Range o Type Text Field.
IMPORTANT: Do not use the IP Address Field type here.
NOTE: The variables $my_svcg$ and $my_lbvsrv$ are used in multiple places. Therefore, when the first instances of $my_svcg$ is defined in line 1, the references in lines 3 and 4 should also be defined. The same is true for $my_lbvsrv$; updating the definition in line 2 also updates the corresponding references in line 3. If you have issues with this step, verify the names are consistent between lines for $my_svcg$, $my_lbvsrv$, and $my_port$.
43
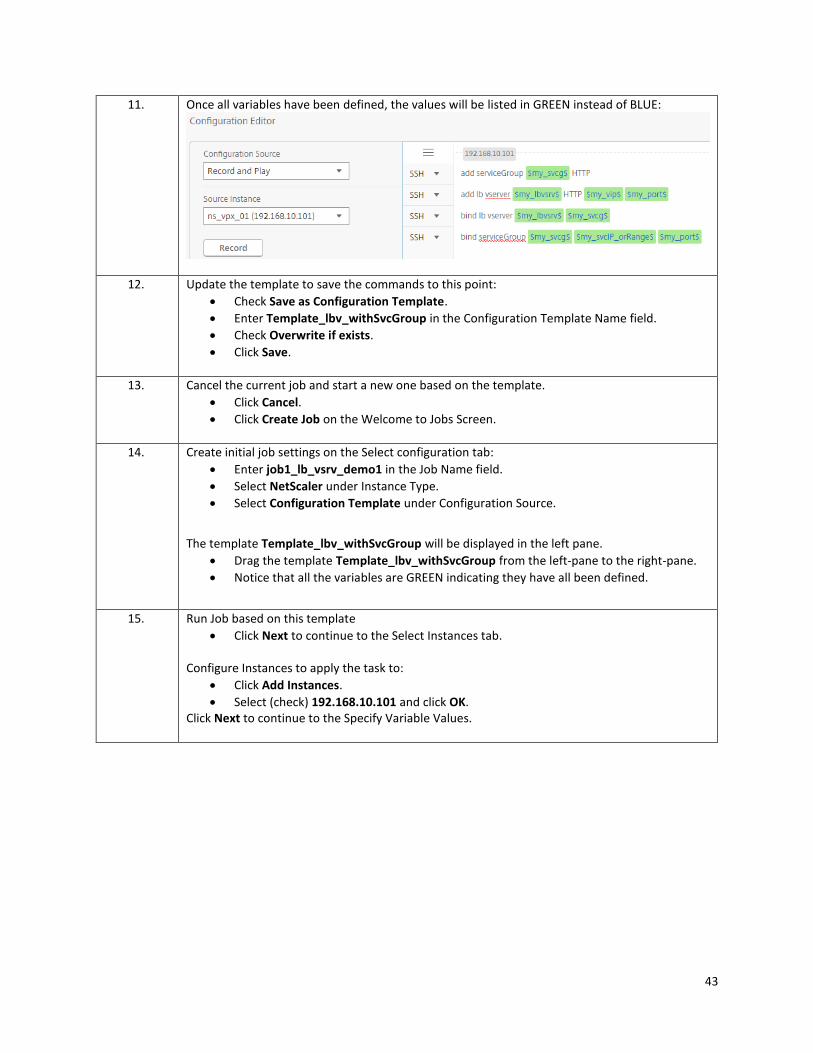
11. Once all variables have been defined, the values will be listed in GREEN instead of BLUE:
12. Update the template to save the commands to this point:
Check Save as Configuration Template.
Enter Template_lbv_withSvcGroup in the Configuration Template Name field.
Check Overwrite if exists.
Click Save.
13. Cancel the current job and start a new one based on the template.
Click Cancel.
Click Create Job on the Welcome to Jobs Screen.
14. Create initial job settings on the Select configuration tab:
Enter job1_lb_vsrv_demo1 in the Job Name field.
Select NetScaler under Instance Type.
Select Configuration Template under Configuration Source.
The template Template_lbv_withSvcGroup will be displayed in the left pane.
Drag the template Template_lbv_withSvcGroup from the left-pane to the right-pane.
Notice that all the variables are GREEN indicating they have all been defined.
15. Run Job based on this template
Click Next to continue to the Select Instances tab. Configure Instances to apply the task to:
Click Add Instances.
Select (check) 192.168.10.101 and click OK. Click Next to continue to the Specify Variable Values.
44
16. Configure variables in task:
Select Common Variable Values for all Instances. Enter the following values for the specified fields:
ServiceGroup Name: svcg_demo1
LB vServer Name: lb_vsrv_demo1
Virtual IP Address: 172.21.10.114
Port: 80
Service IP or IP Range: 192.168.30.[21-25] Click Next. This will create new entities that do not conflict with existing settings on the NetScaler. They can be removed after this exercise. NOTE: The IP addresses in use in this step are IP Addresses for fictitious CMY services and do not match any entity in the lab. These values must be used to avoid conflicts with other lab entities.
17. Configure Job Execution details: Set the following values for each of the fields specified:
On Command Failure: Ignore error and continue.
Execution Mode Now.
Execution Settings: Execute in Parallel. Click Finish. The job should complete successfully. Use the in-page refresh if necessary to update the status of the job.
18. View the job status and verify it completed successfully. To view job results (for success or failure):
Select (check) job1_lbv_demo1 and click Details.
Click Execution Summary.
Click instance 192.168.10.101 to view individual command status on this NetScaler.
Verify all commands succeeded or identify reason for any failures that occurred. When done reviewing output, return to Jobs pane.
Close the Command Log window by clicking "X" when done reviewing.
Close the Execution Summary by clicking "X" to return to the Job Details pane.
Click Jobs in the navigational breadcrumbs to return to the Jobs list. NOTE: If you need to run the task again, you must remove conflicting entities before repeating.
45
19. Use the custom template to create another virtual server. Select Configuration:
Click Create Job.
Enter job2_lb_vsrv_demo2 in the Job Name field.
Select NetScaler under instance Type.
Select Configuration Template under Configuration Source.
Drag and Drop the Template_lbv_withSvcGroup to the right-pane. (Verify all variable definitions are GREEN.)
Click Next to continue to Select Instances. Select Instances:
Click Add Instances.
Select (check) 192.168.10.101 and click OK.
Click Next.
20. Specify Variable Values:
Select Common Variable Values for all Instances. Enter the following values for the specified fields:
ServiceGroup Name: svcg_demo2
LB vServer Name: lb_vsrv_demo2
Virtual IP Address: 172.21.10.115
Port: 80
Service IP or IP Range: 192.168.30.[26-28] Click Next to continue to the Execute settings.
21. Configure Execution settings:
Click Finish to run the task now. This task should complete successfully.
46
22. Before continuing, remove the previously created entities. Open a Putty session to 192.168.10.101:
To open putty: Right click on Start > Run > putty 192.168.10.101.
Log on as nsroot / nsroot. Run the following commands:
rm lb vserver lb_vsrv_cmy
rm lb vserver lb_vsrv_demo1
rm lb vserver lb_vsrv_demo2
rm serviceGroup svcg_cmy
rm serviceGroup svcg_demo1
rm serviceGroup svcg_demo2
rm server 192.168.30.[54-56]
rm server 192.168.30.[21-28]
Save the NetScaler configuration:
save ns config
Close putty.
Takeaways:
Jobs are a specific task instance. Repeating a job uses the exact same conditions and values as when the job was created. This is useful for recreating entities again, but doesn't allow you to run the task with different values.
A template is a capture of a set of commands that can also contain variables and the variable definitions. Templates can therefore represent a simple or complex set of conditions that can be run multiple times with different values (in different jobs) or across multiple instances.
For complex configurations, consider defining small templates with individual elements like creating a virtual server, binding services, binding service groups, and then binding policies. Then these templates can be combined into more complex templates or jobs for re-use.
Templates and jobs can be generated manually, based on inbuilt templates, custom templates that you've built, or by reviewing commands generated on a specific NetScaler within a specific time period, or by using Record & Play.
47
Exercise 3-3: Analytics using Web Insight and Security Insight In this exercise, you will enable Web Insight with HTML injection and review the web site performance metrics
available within NetScaler MAS. Security Insight will also be demonstrated as NetScaler MAS can replace the use of
NetScaler Insight.
Requirements for this scenario:
Enable Web Insight with HTML Injection for the RBG web server. Review Web Insight metrics and HTML Injection.
Enable Security Insight for the AFWeb and WebGoat (HTTP) virtual servers. Briefly review Security Insight settings.
Verify that NetScaler Insight Center functions are fully embedded in NetScaler MAS, allowing MAS to replace independent NetScaler Insight deployments.
In this exercise, you will perform the following tasks:
Configure Web and Security Insight using NetScaler MAS Analytics
Generate and View AppFlow Web Insight Data
Generate and View AppFlow Security Insight Data
Configure Web and Security Insight using NetScaler MAS Analytics
Step Action
1. Switch to the NetScaler Configuration Utility open in Tab (1) using the NSIP at http://192.168.10.101. Log on as nsroot / nsroot.
2. Enable the Application Firewall feature, so that that AppFw policies are in effect on the AFWeb and WebGoat virtual servers (policies are already bound).
Navigate to System > Settings.
Click Configure Basic Features.
Enable (check) Application Firewall. (Do not modify any other existing features.)
Click OK.
NOTE: The existing profiles are not fully configured for use with the SSL virtual servers. Connections to Https:// will not be tested during this exercise.
3. Save the NetScaler configuration.
48
4. Open Firefox and verify Application Firewall settings are in effect. For best results, test applications in Firefox and manage NetScaler and NetScaler MAS configurations in Chrome. Test AFWeb in Firefox:
Browse to http://afweb.training.lab/. Return to this page between tests.
Click the Allow Demo link and verify page is successfully displayed.
Click the Deny Demo link and verify page is blocked by application firewall. The URL displays "/blocked.htm".
Test WebGoat:
Browse to http://webgoat.training.lab/WebGoat/attack or use the WebGoat bookmark. (Error will be generated if trailing "/" is included after attack.)
Log on as guest / guest.
Click Start WebGoat on the main page.
Navigate to Admin Functions > Report Card. This page should load successfully using the following URL:
http://webgoat.training.lab/WebGoat/attack?Screen=XXXX
&menu=XXXX
Attack 1: Generate a parameter violation in WebGoat:
Adjust the URL you are currently on and append the following query parameter to the current URL: &admin=true
The final URL will look like the following thought the Screen and Menu parameters will change. http://webgoat.training.lab/WebGoat/attack?Screen=XXXX
&menu=XXXX&admin=true
This modified URL should generate a violation and an Application Firewall custom output page.
This confirms that the Application Firewall settings are properly configured. NOTE: Many of the AppFw protections have been adjusted to allow certain behavior as part of the Application Firewall exercises. Meaning, not all attacks in WebGoat or AFWeb will generate the expected violations. During the NetScaler MAS demonstration of Security Insight, the attacks generated will be limited.
5. Return to Chrome and Tab (2) for the NetScaler MAS management console at http://192.168.10.15. Log on as nsroot / nsroot.
Verify you are connected by IP address and not FQDN: http://192.168.10.15/
IMPORTANT: For this exercise you must connect to MAS by IP address and not FQDN. There is a current issue in both NetScaler Insight Center and NetScaler MAS that when enabling AppFlow connections the server name in the management console connection is used as the AppFlow collector destination name. Connections by name fail, but connections by IP Address succeed.
6. Enable Web and Security Insight using NetScaler MAS:
Click on Infrastructure tab.
Navigate to Instances > NetScaler VPX.
Select (check) 192.168.10.101 and click Action > Enable/Disable Insight.
49
7. Enable Web Insight with HTML Injection for lb_vsrv_rbg:
Select (check) 172.21.10.101 lb_vsrv_rbg and click Enable AppFlow.
Enter true in the Expression field.
Check Web Insight.
Check HTML Injection.
Click OK.
Deselect (uncheck) 172.21.10.101 after the settings are applied.
8. Enable Web Insight, HTML Injection, and Security Insight for lb_vsrv_afweb and lb_vsrv_webgoat.
Select (check) 172.21.10.111 lb_vsrv_afweb (HTTP).
Select (check) 172.21.10.112 lb_vsrv_webgoat (HTTP).
Click Enable AppFlow.
Enter true in the Expression field.
Check Web Insight.
Check HTML Injection.
Check Security Insight.
Click OK.
NOTE: There are both SSL and HTTP virtual servers for AFWeb and Webgoat. Be sure you select the HTTP virtual servers, as App Firewall policies are not bound to the SSL virtual servers.
9. Switch to the NetScaler Configuration Utility open in Tab (1) using the NSIP at http://192.168.10.101. Log on as nsroot / nsroot.
10. Update the AppFlow parameters on NetScaler to enable Security Insight:
Navigate to System > AppFlow.
Click Change AppFlow Settings.
Enable (check) Security Insight Traffic.
Enter 60 into the Security Insight Record Interval field.
Keep all other values as is.
Click OK.
NOTE: These two parameters are not enabled by NetScaler MAS (or NetScaler Insight Center) when enabling AppFlow and Security Insight. The parameters can be updated manually.
11. Save the NetScaler configuration.
Generate and View AppFlow Web Insight Data
Step Action
1. Return to Tab (2) for the NetScaler MAS management console at http://192.168.10.15. Log on as nsroot / nsroot.
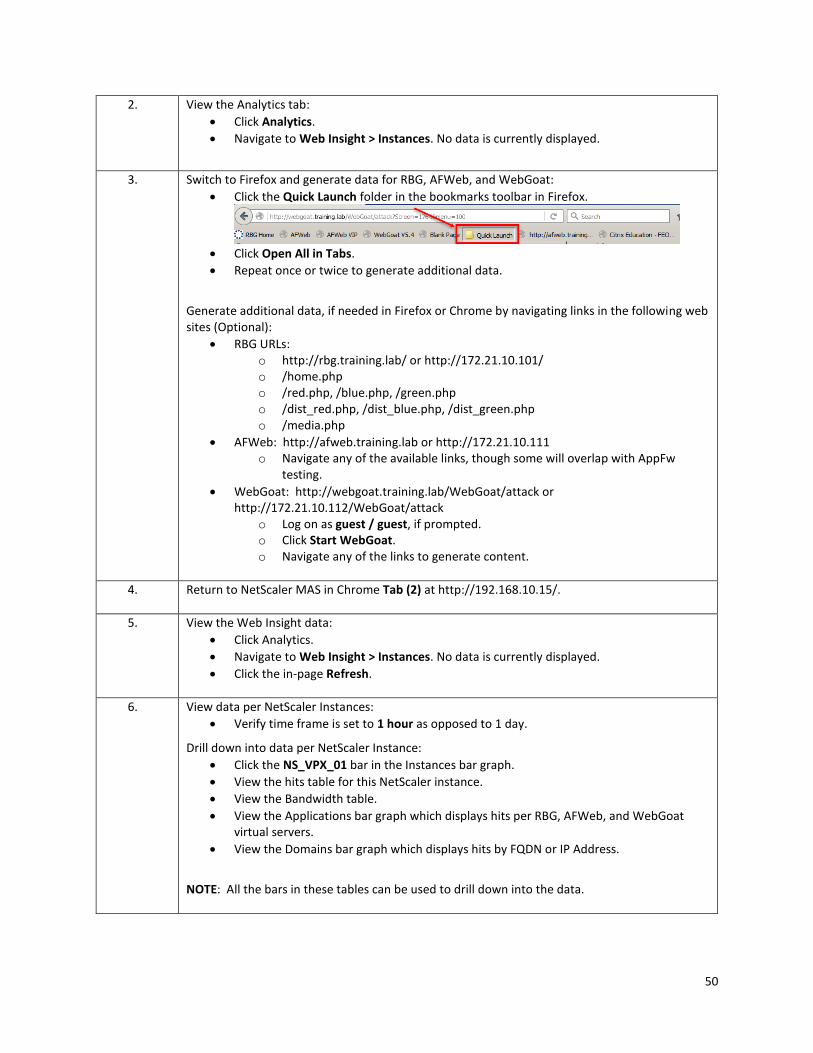
50
2. View the Analytics tab:
Click Analytics.
Navigate to Web Insight > Instances. No data is currently displayed.
3. Switch to Firefox and generate data for RBG, AFWeb, and WebGoat:
Click the Quick Launch folder in the bookmarks toolbar in Firefox.
Click Open All in Tabs.
Repeat once or twice to generate additional data.
Generate additional data, if needed in Firefox or Chrome by navigating links in the following web sites (Optional):
RBG URLs: o http://rbg.training.lab/ or http://172.21.10.101/ o /home.php o /red.php, /blue.php, /green.php o /dist_red.php, /dist_blue.php, /dist_green.php o /media.php
AFWeb: http://afweb.training.lab or http://172.21.10.111 o Navigate any of the available links, though some will overlap with AppFw
testing.
WebGoat: http://webgoat.training.lab/WebGoat/attack or http://172.21.10.112/WebGoat/attack
o Log on as guest / guest, if prompted. o Click Start WebGoat. o Navigate any of the links to generate content.
4. Return to NetScaler MAS in Chrome Tab (2) at http://192.168.10.15/.
5. View the Web Insight data:
Click Analytics.
Navigate to Web Insight > Instances. No data is currently displayed.
Click the in-page Refresh.
6. View data per NetScaler Instances:
Verify time frame is set to 1 hour as opposed to 1 day.
Drill down into data per NetScaler Instance:
Click the NS_VPX_01 bar in the Instances bar graph.
View the hits table for this NetScaler instance.
View the Bandwidth table.
View the Applications bar graph which displays hits per RBG, AFWeb, and WebGoat virtual servers.
View the Domains bar graph which displays hits by FQDN or IP Address.
NOTE: All the bars in these tables can be used to drill down into the data.
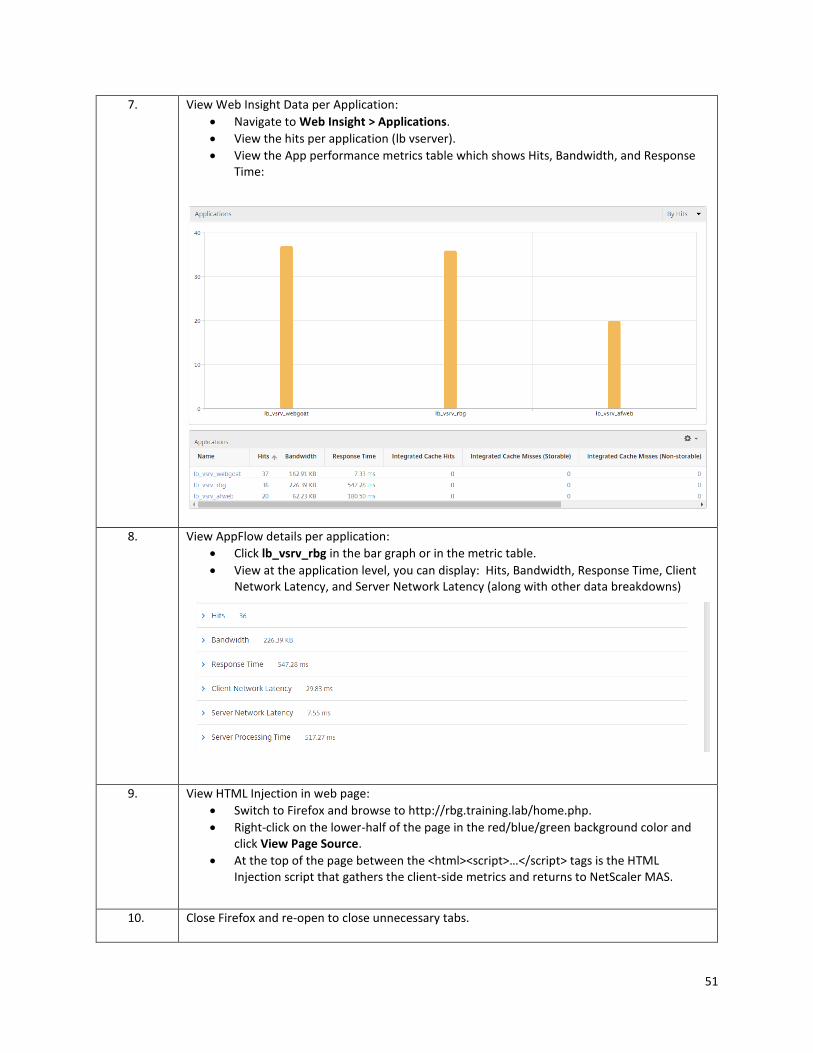
51
7. View Web Insight Data per Application:
Navigate to Web Insight > Applications.
View the hits per application (lb vserver).
View the App performance metrics table which shows Hits, Bandwidth, and Response Time:
8. View AppFlow details per application:
Click lb_vsrv_rbg in the bar graph or in the metric table.
View at the application level, you can display: Hits, Bandwidth, Response Time, Client Network Latency, and Server Network Latency (along with other data breakdowns)
9. View HTML Injection in web page:
Switch to Firefox and browse to http://rbg.training.lab/home.php.
Right-click on the lower-half of the page in the red/blue/green background color and click View Page Source.
At the top of the page between the <html><script>…</script> tags is the HTML Injection script that gathers the client-side metrics and returns to NetScaler MAS.
10. Close Firefox and re-open to close unnecessary tabs.
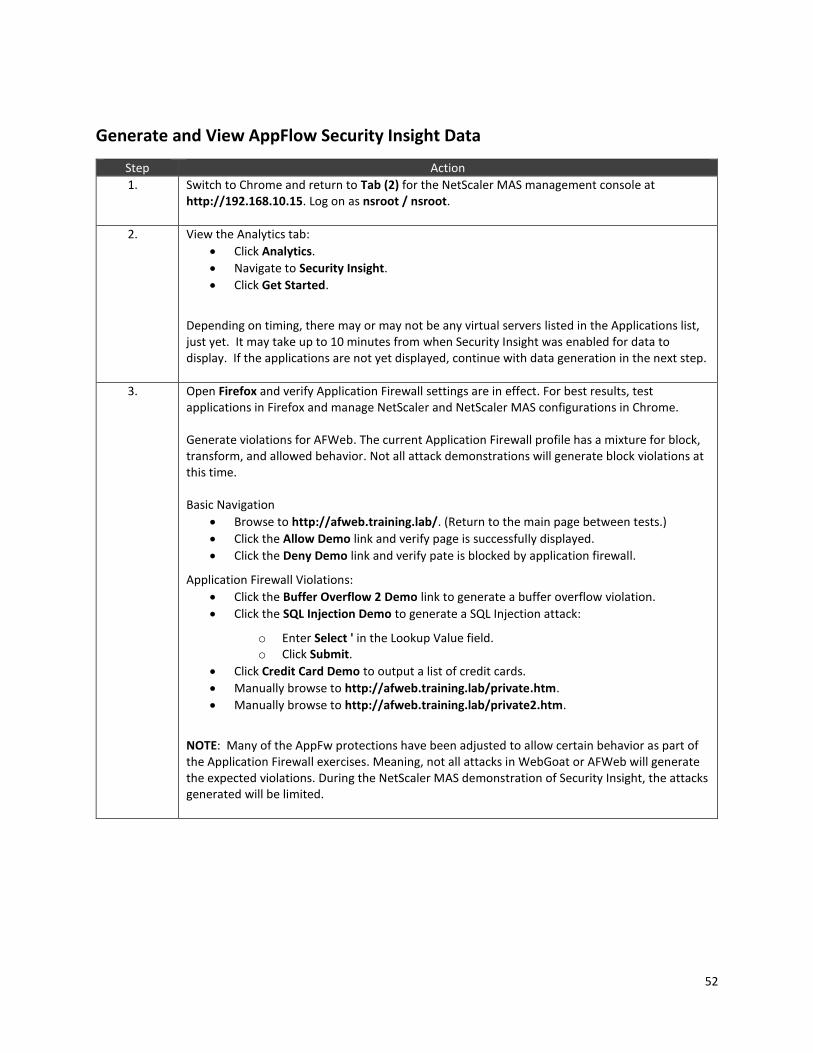
52
Generate and View AppFlow Security Insight Data
Step Action
1. Switch to Chrome and return to Tab (2) for the NetScaler MAS management console at http://192.168.10.15. Log on as nsroot / nsroot.
2. View the Analytics tab:
Click Analytics.
Navigate to Security Insight.
Click Get Started.
Depending on timing, there may or may not be any virtual servers listed in the Applications list, just yet. It may take up to 10 minutes from when Security Insight was enabled for data to display. If the applications are not yet displayed, continue with data generation in the next step.
3. Open Firefox and verify Application Firewall settings are in effect. For best results, test applications in Firefox and manage NetScaler and NetScaler MAS configurations in Chrome. Generate violations for AFWeb. The current Application Firewall profile has a mixture for block, transform, and allowed behavior. Not all attack demonstrations will generate block violations at this time. Basic Navigation
Browse to http://afweb.training.lab/. (Return to the main page between tests.)
Click the Allow Demo link and verify page is successfully displayed.
Click the Deny Demo link and verify pate is blocked by application firewall.
Application Firewall Violations:
Click the Buffer Overflow 2 Demo link to generate a buffer overflow violation.
Click the SQL Injection Demo to generate a SQL Injection attack:
o Enter Select ' in the Lookup Value field. o Click Submit.
Click Credit Card Demo to output a list of credit cards.
Manually browse to http://afweb.training.lab/private.htm.
Manually browse to http://afweb.training.lab/private2.htm.
NOTE: Many of the AppFw protections have been adjusted to allow certain behavior as part of the Application Firewall exercises. Meaning, not all attacks in WebGoat or AFWeb will generate the expected violations. During the NetScaler MAS demonstration of Security Insight, the attacks generated will be limited.
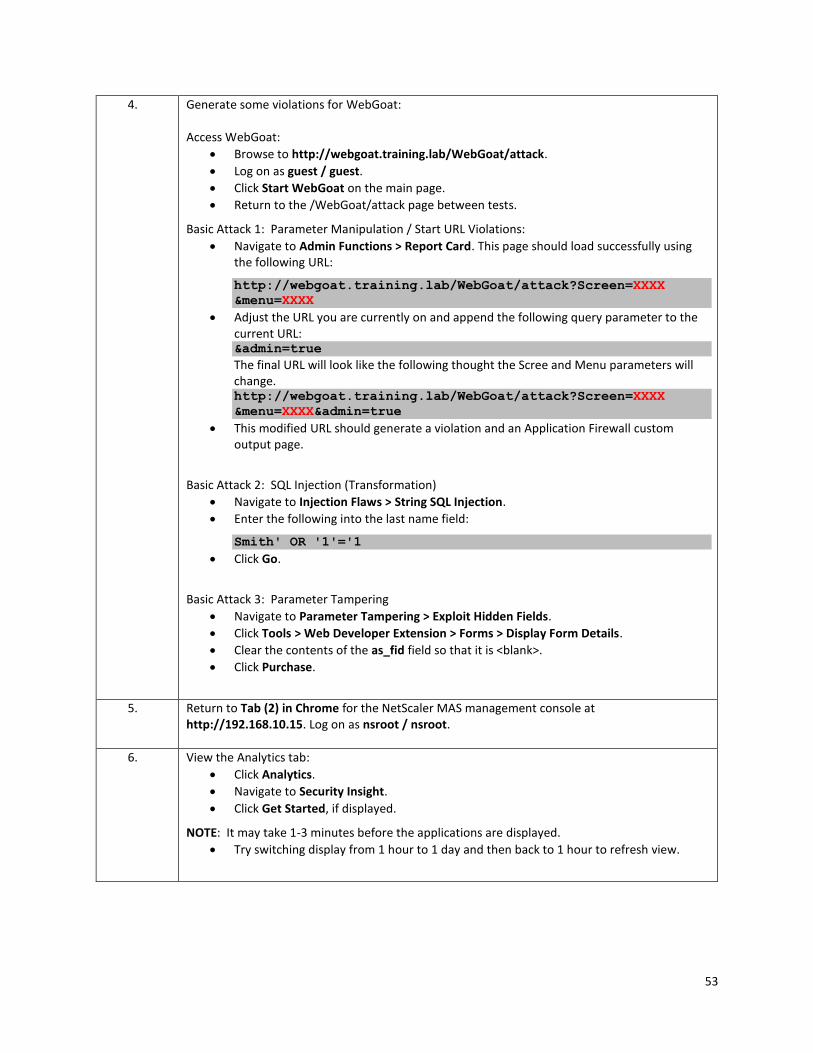
53
4. Generate some violations for WebGoat: Access WebGoat:
Browse to http://webgoat.training.lab/WebGoat/attack.
Log on as guest / guest.
Click Start WebGoat on the main page.
Return to the /WebGoat/attack page between tests.
Basic Attack 1: Parameter Manipulation / Start URL Violations:
Navigate to Admin Functions > Report Card. This page should load successfully using the following URL:
http://webgoat.training.lab/WebGoat/attack?Screen=XXXX
&menu=XXXX
Adjust the URL you are currently on and append the following query parameter to the current URL: &admin=true
The final URL will look like the following thought the Scree and Menu parameters will change. http://webgoat.training.lab/WebGoat/attack?Screen=XXXX
&menu=XXXX&admin=true
This modified URL should generate a violation and an Application Firewall custom output page.
Basic Attack 2: SQL Injection (Transformation)
Navigate to Injection Flaws > String SQL Injection.
Enter the following into the last name field:
Smith' OR '1'='1
Click Go.
Basic Attack 3: Parameter Tampering
Navigate to Parameter Tampering > Exploit Hidden Fields.
Click Tools > Web Developer Extension > Forms > Display Form Details.
Clear the contents of the as_fid field so that it is <blank>.
Click Purchase.
5. Return to Tab (2) in Chrome for the NetScaler MAS management console at http://192.168.10.15. Log on as nsroot / nsroot.
6. View the Analytics tab:
Click Analytics.
Navigate to Security Insight.
Click Get Started, if displayed.
NOTE: It may take 1-3 minutes before the applications are displayed.
Try switching display from 1 hour to 1 day and then back to 1 hour to refresh view.
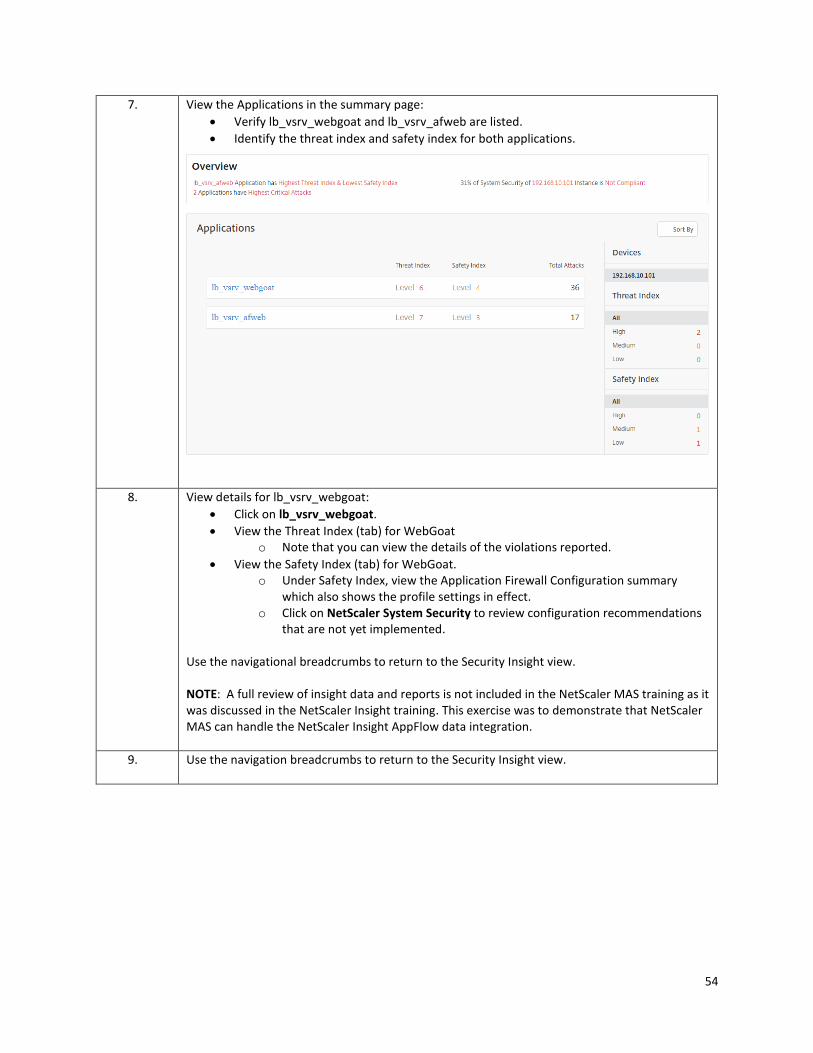
54
7. View the Applications in the summary page:
Verify lb_vsrv_webgoat and lb_vsrv_afweb are listed.
Identify the threat index and safety index for both applications.
8. View details for lb_vsrv_webgoat:
Click on lb_vsrv_webgoat.
View the Threat Index (tab) for WebGoat o Note that you can view the details of the violations reported.
View the Safety Index (tab) for WebGoat. o Under Safety Index, view the Application Firewall Configuration summary
which also shows the profile settings in effect. o Click on NetScaler System Security to review configuration recommendations
that are not yet implemented. Use the navigational breadcrumbs to return to the Security Insight view. NOTE: A full review of insight data and reports is not included in the NetScaler MAS training as it was discussed in the NetScaler Insight training. This exercise was to demonstrate that NetScaler MAS can handle the NetScaler Insight AppFlow data integration.
9. Use the navigation breadcrumbs to return to the Security Insight view.
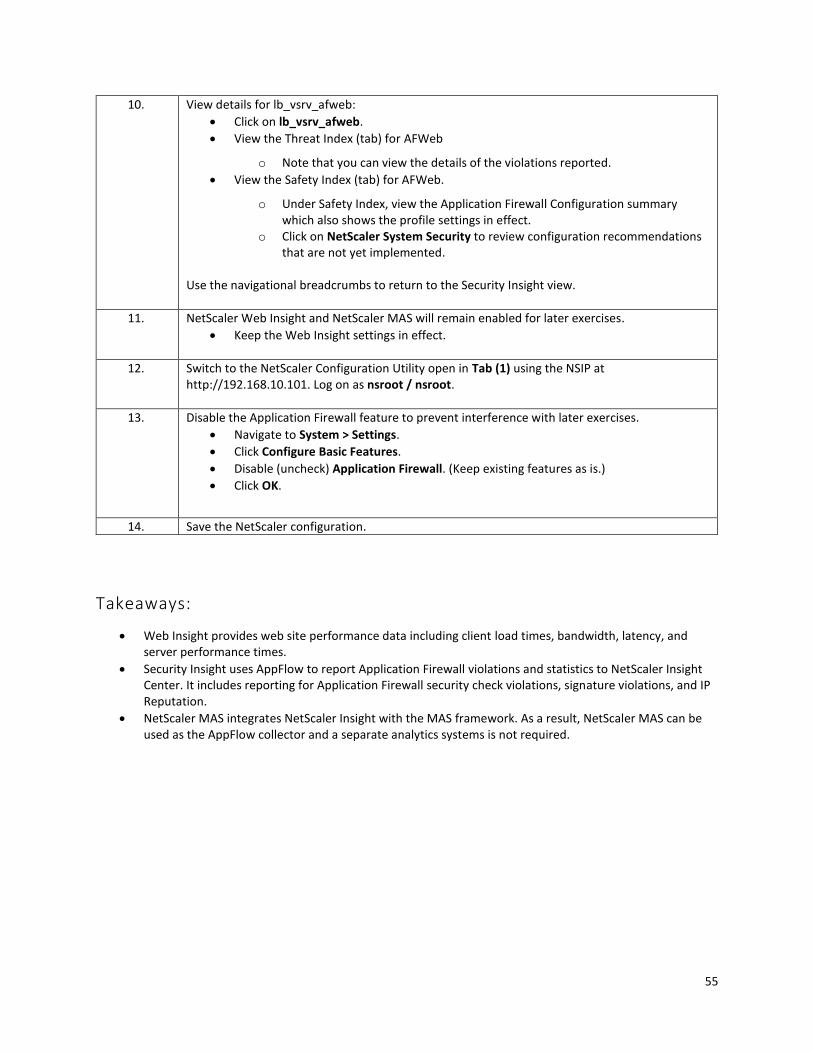
55
10. View details for lb_vsrv_afweb:
Click on lb_vsrv_afweb.
View the Threat Index (tab) for AFWeb
o Note that you can view the details of the violations reported.
View the Safety Index (tab) for AFWeb.
o Under Safety Index, view the Application Firewall Configuration summary which also shows the profile settings in effect.
o Click on NetScaler System Security to review configuration recommendations that are not yet implemented.
Use the navigational breadcrumbs to return to the Security Insight view.
11. NetScaler Web Insight and NetScaler MAS will remain enabled for later exercises.
Keep the Web Insight settings in effect.
12. Switch to the NetScaler Configuration Utility open in Tab (1) using the NSIP at http://192.168.10.101. Log on as nsroot / nsroot.
13. Disable the Application Firewall feature to prevent interference with later exercises.
Navigate to System > Settings.
Click Configure Basic Features.
Disable (uncheck) Application Firewall. (Keep existing features as is.)
Click OK.
14. Save the NetScaler configuration.
Takeaways:
Web Insight provides web site performance data including client load times, bandwidth, latency, and server performance times.
Security Insight uses AppFlow to report Application Firewall violations and statistics to NetScaler Insight Center. It includes reporting for Application Firewall security check violations, signature violations, and IP Reputation.
NetScaler MAS integrates NetScaler Insight with the MAS framework. As a result, NetScaler MAS can be used as the AppFlow collector and a separate analytics systems is not required.
56
Module 4: NetScaler Web Server Logging (NSWL) Overview:
In this module, you will configure NetScaler Web Server Logging (NSWL) to log web transaction details to a web
transaction client. The NSWL feature allows NetScaler administrators to generate and track web transaction logs
for web content served by the NetScaler either in place of gathering web transaction logs from the web servers
behind the NetScaler or in addition to the regular web transaction logs. The web transaction logs record client IP
addresses, web requests, response codes returned, server IP addresses where the content was fulfilled and other
transaction details. These logs are often used by NetScaler and/or web server administrators to audit requests
from users, verify responses returned, or used to identify certain types of issues during troubleshooting. Since web
transaction logs are not generated natively by the NetScaler, the NSWL client is deployed to write the content to
file on behalf of the NetScaler.
After completing this lab module, you will be able to:
Enable NSWL on the NetScaler.
Configure the NSWL agent to receive log content from one or more NetScaler appliances.
Customize the logging details and output locations based on application logging requirements.
This module contains the following exercises using the NetScaler Configuration Utility GUI:
Exercise 4-1: Configuring NSWL 25 min
Before you begin:
Estimated time to complete this lab module: 25 minutes
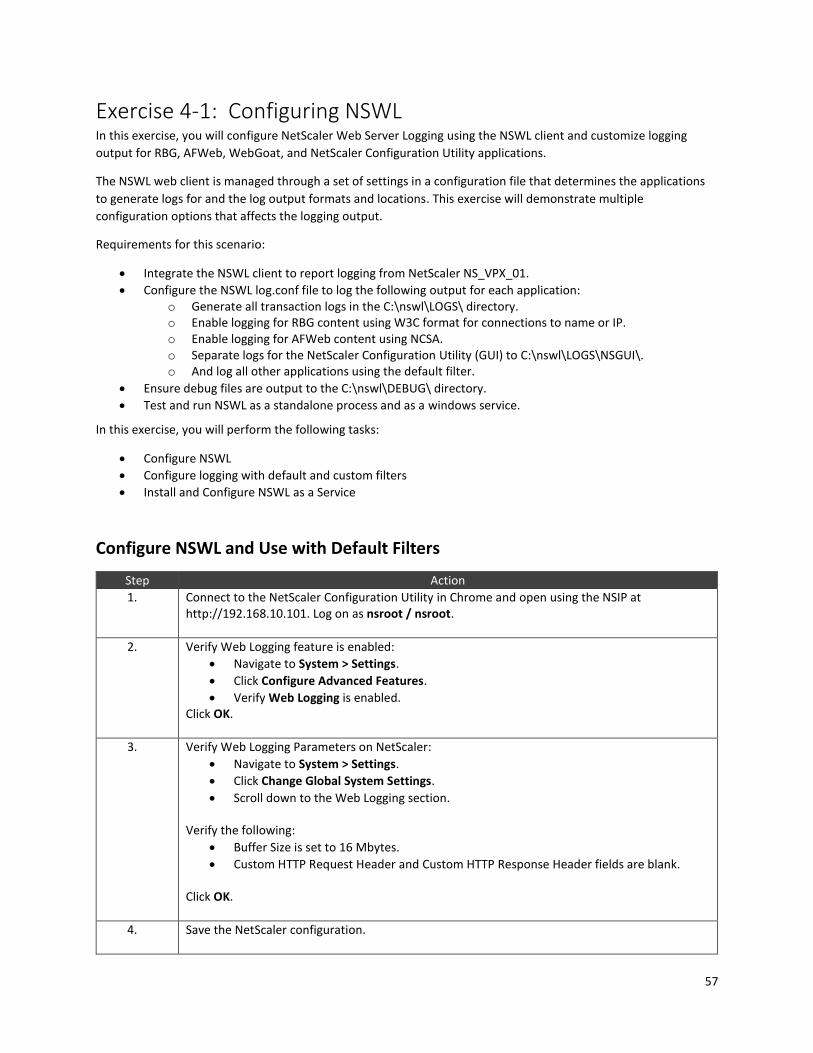
57
Exercise 4-1: Configuring NSWL In this exercise, you will configure NetScaler Web Server Logging using the NSWL client and customize logging
output for RBG, AFWeb, WebGoat, and NetScaler Configuration Utility applications.
The NSWL web client is managed through a set of settings in a configuration file that determines the applications
to generate logs for and the log output formats and locations. This exercise will demonstrate multiple
configuration options that affects the logging output.
Requirements for this scenario:
Integrate the NSWL client to report logging from NetScaler NS_VPX_01.
Configure the NSWL log.conf file to log the following output for each application: o Generate all transaction logs in the C:\nswl\LOGS\ directory. o Enable logging for RBG content using W3C format for connections to name or IP. o Enable logging for AFWeb content using NCSA. o Separate logs for the NetScaler Configuration Utility (GUI) to C:\nswl\LOGS\NSGUI\. o And log all other applications using the default filter.
Ensure debug files are output to the C:\nswl\DEBUG\ directory.
Test and run NSWL as a standalone process and as a windows service.
In this exercise, you will perform the following tasks:
Configure NSWL
Configure logging with default and custom filters
Install and Configure NSWL as a Service
Configure NSWL and Use with Default Filters
Step Action
1. Connect to the NetScaler Configuration Utility in Chrome and open using the NSIP at http://192.168.10.101. Log on as nsroot / nsroot.
2. Verify Web Logging feature is enabled:
Navigate to System > Settings.
Click Configure Advanced Features.
Verify Web Logging is enabled. Click OK.
3. Verify Web Logging Parameters on NetScaler:
Navigate to System > Settings.
Click Change Global System Settings.
Scroll down to the Web Logging section. Verify the following:
Buffer Size is set to 16 Mbytes.
Custom HTTP Request Header and Custom HTTP Response Header fields are blank. Click OK.
4. Save the NetScaler configuration.
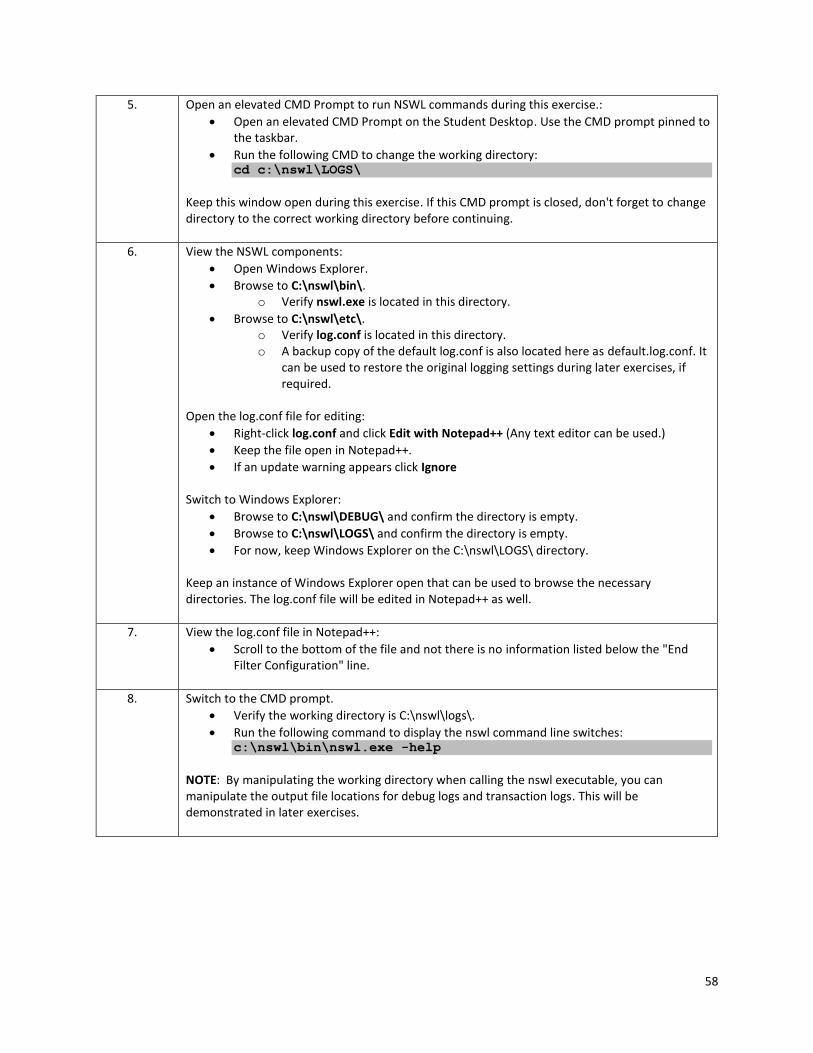
58
5. Open an elevated CMD Prompt to run NSWL commands during this exercise.:
Open an elevated CMD Prompt on the Student Desktop. Use the CMD prompt pinned to the taskbar.
Run the following CMD to change the working directory: cd c:\nswl\LOGS\
Keep this window open during this exercise. If this CMD prompt is closed, don't forget to change directory to the correct working directory before continuing.
6. View the NSWL components:
Open Windows Explorer.
Browse to C:\nswl\bin\. o Verify nswl.exe is located in this directory.
Browse to C:\nswl\etc\. o Verify log.conf is located in this directory. o A backup copy of the default log.conf is also located here as default.log.conf. It
can be used to restore the original logging settings during later exercises, if required.
Open the log.conf file for editing:
Right-click log.conf and click Edit with Notepad++ (Any text editor can be used.)
Keep the file open in Notepad++.
If an update warning appears click Ignore Switch to Windows Explorer:
Browse to C:\nswl\DEBUG\ and confirm the directory is empty.
Browse to C:\nswl\LOGS\ and confirm the directory is empty.
For now, keep Windows Explorer on the C:\nswl\LOGS\ directory. Keep an instance of Windows Explorer open that can be used to browse the necessary directories. The log.conf file will be edited in Notepad++ as well.
7. View the log.conf file in Notepad++:
Scroll to the bottom of the file and not there is no information listed below the "End Filter Configuration" line.
8. Switch to the CMD prompt.
Verify the working directory is C:\nswl\logs\.
Run the following command to display the nswl command line switches: c:\nswl\bin\nswl.exe -help
NOTE: By manipulating the working directory when calling the nswl executable, you can manipulate the output file locations for debug logs and transaction logs. This will be demonstrated in later exercises.
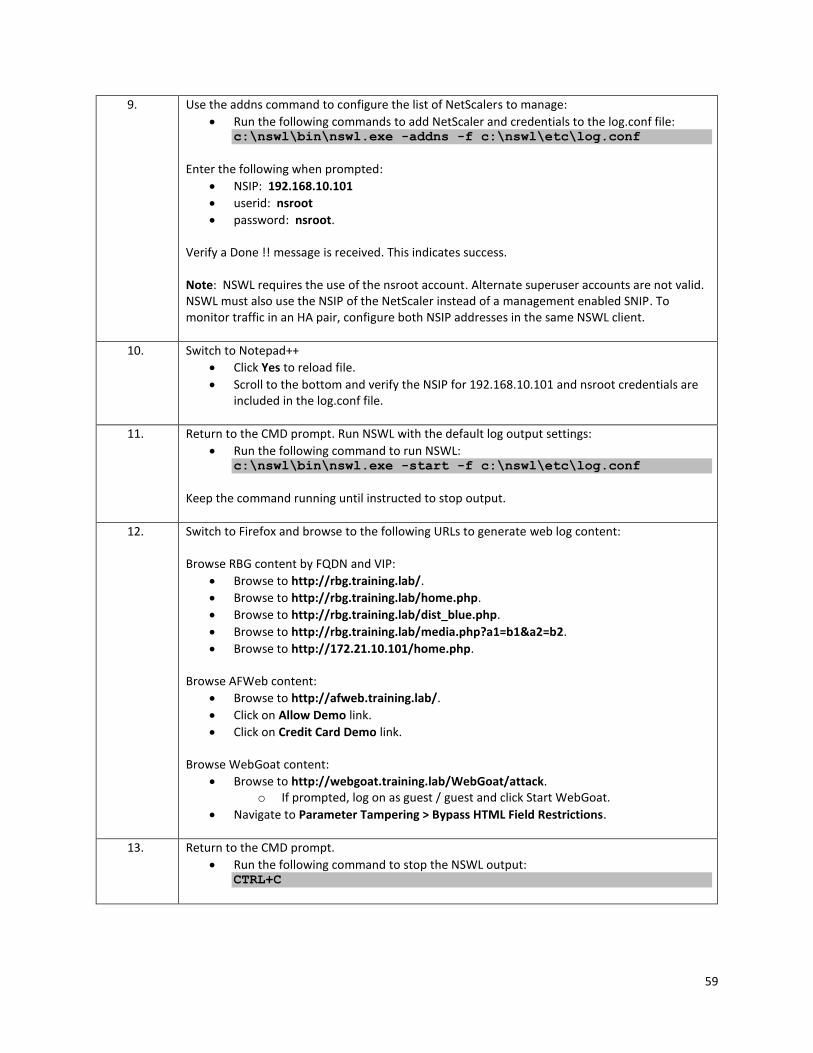
59
9. Use the addns command to configure the list of NetScalers to manage:
Run the following commands to add NetScaler and credentials to the log.conf file: c:\nswl\bin\nswl.exe -addns -f c:\nswl\etc\log.conf
Enter the following when prompted:
NSIP: 192.168.10.101
userid: nsroot
password: nsroot. Verify a Done !! message is received. This indicates success. Note: NSWL requires the use of the nsroot account. Alternate superuser accounts are not valid. NSWL must also use the NSIP of the NetScaler instead of a management enabled SNIP. To monitor traffic in an HA pair, configure both NSIP addresses in the same NSWL client.
10. Switch to Notepad++
Click Yes to reload file.
Scroll to the bottom and verify the NSIP for 192.168.10.101 and nsroot credentials are included in the log.conf file.
11. Return to the CMD prompt. Run NSWL with the default log output settings:
Run the following command to run NSWL: c:\nswl\bin\nswl.exe -start -f c:\nswl\etc\log.conf
Keep the command running until instructed to stop output.
12. Switch to Firefox and browse to the following URLs to generate web log content: Browse RBG content by FQDN and VIP:
Browse to http://rbg.training.lab/.
Browse to http://rbg.training.lab/home.php.
Browse to http://rbg.training.lab/dist_blue.php.
Browse to http://rbg.training.lab/media.php?a1=b1&a2=b2.
Browse to http://172.21.10.101/home.php. Browse AFWeb content:
Browse to http://afweb.training.lab/.
Click on Allow Demo link.
Click on Credit Card Demo link. Browse WebGoat content:
Browse to http://webgoat.training.lab/WebGoat/attack. o If prompted, log on as guest / guest and click Start WebGoat.
Navigate to Parameter Tampering > Bypass HTML Field Restrictions.
13. Return to the CMD prompt.
Run the following command to stop the NSWL output: CTRL+C
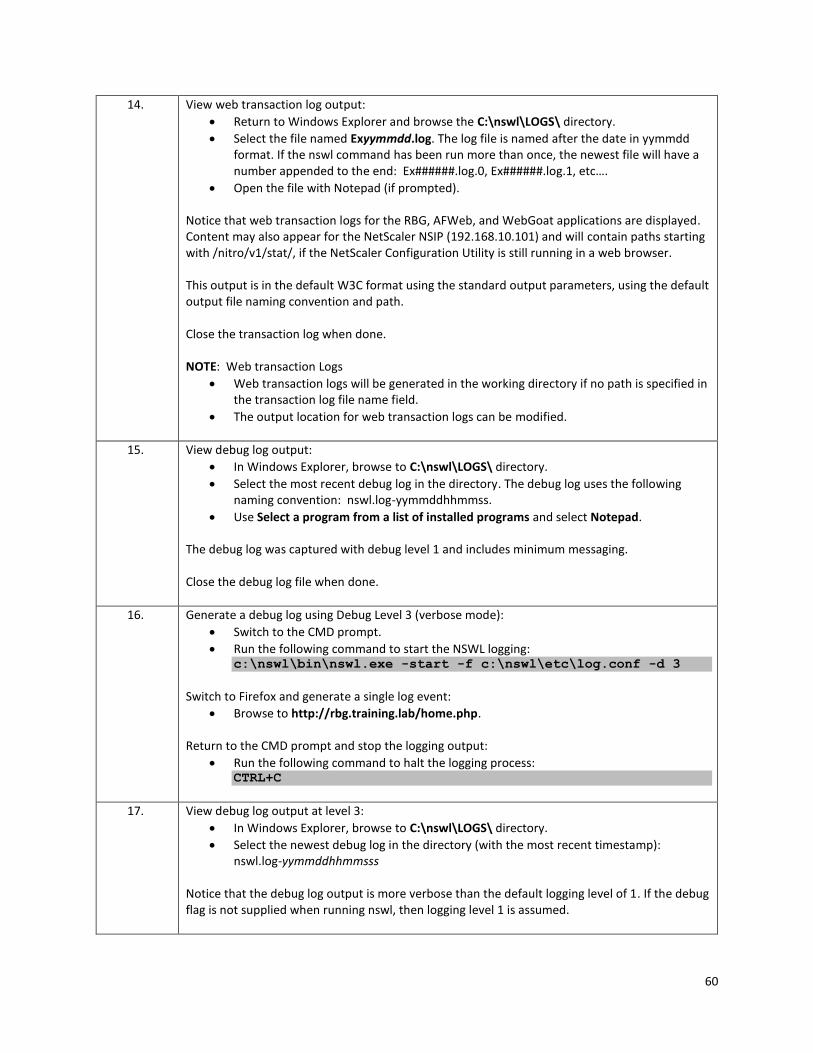
60
14. View web transaction log output:
Return to Windows Explorer and browse the C:\nswl\LOGS\ directory.
Select the file named Exyymmdd.log. The log file is named after the date in yymmdd format. If the nswl command has been run more than once, the newest file will have a number appended to the end: Ex######.log.0, Ex######.log.1, etc….
Open the file with Notepad (if prompted). Notice that web transaction logs for the RBG, AFWeb, and WebGoat applications are displayed. Content may also appear for the NetScaler NSIP (192.168.10.101) and will contain paths starting with /nitro/v1/stat/, if the NetScaler Configuration Utility is still running in a web browser. This output is in the default W3C format using the standard output parameters, using the default output file naming convention and path. Close the transaction log when done. NOTE: Web transaction Logs
Web transaction logs will be generated in the working directory if no path is specified in the transaction log file name field.
The output location for web transaction logs can be modified.
15. View debug log output:
In Windows Explorer, browse to C:\nswl\LOGS\ directory.
Select the most recent debug log in the directory. The debug log uses the following naming convention: nswl.log-yymmddhhmmss.
Use Select a program from a list of installed programs and select Notepad. The debug log was captured with debug level 1 and includes minimum messaging. Close the debug log file when done.
16. Generate a debug log using Debug Level 3 (verbose mode):
Switch to the CMD prompt.
Run the following command to start the NSWL logging: c:\nswl\bin\nswl.exe -start -f c:\nswl\etc\log.conf -d 3
Switch to Firefox and generate a single log event:
Browse to http://rbg.training.lab/home.php. Return to the CMD prompt and stop the logging output:
Run the following command to halt the logging process: CTRL+C
17. View debug log output at level 3:
In Windows Explorer, browse to C:\nswl\LOGS\ directory.
Select the newest debug log in the directory (with the most recent timestamp): nswl.log-yymmddhhmmsss
Notice that the debug log output is more verbose than the default logging level of 1. If the debug flag is not supplied when running nswl, then logging level 1 is assumed.
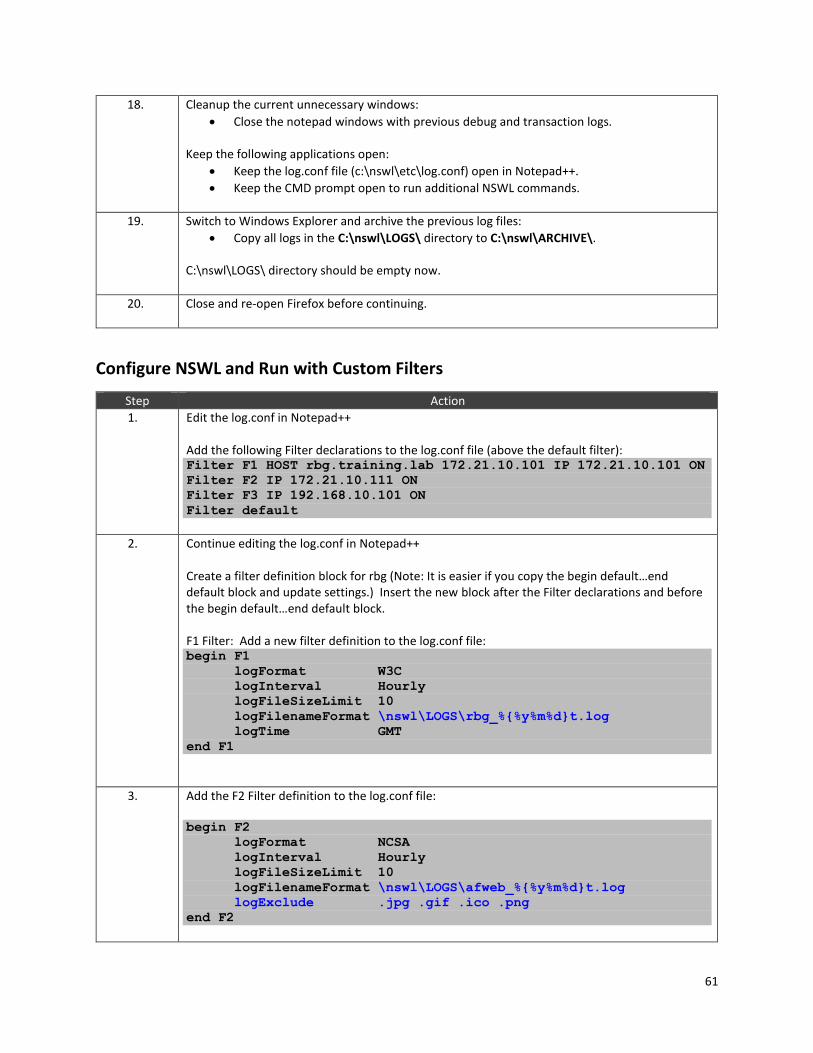
61
18. Cleanup the current unnecessary windows:
Close the notepad windows with previous debug and transaction logs. Keep the following applications open:
Keep the log.conf file (c:\nswl\etc\log.conf) open in Notepad++.
Keep the CMD prompt open to run additional NSWL commands.
19. Switch to Windows Explorer and archive the previous log files:
Copy all logs in the C:\nswl\LOGS\ directory to C:\nswl\ARCHIVE\. C:\nswl\LOGS\ directory should be empty now.
20. Close and re-open Firefox before continuing.
Configure NSWL and Run with Custom Filters
Step Action
1. Edit the log.conf in Notepad++ Add the following Filter declarations to the log.conf file (above the default filter): Filter F1 HOST rbg.training.lab 172.21.10.101 IP 172.21.10.101 ON
Filter F2 IP 172.21.10.111 ON
Filter F3 IP 192.168.10.101 ON
Filter default
2. Continue editing the log.conf in Notepad++ Create a filter definition block for rbg (Note: It is easier if you copy the begin default…end default block and update settings.) Insert the new block after the Filter declarations and before the begin default…end default block. F1 Filter: Add a new filter definition to the log.conf file: begin F1
logFormat W3C
logInterval Hourly
logFileSizeLimit 10
logFilenameFormat \nswl\LOGS\rbg_%{%y%m%d}t.log
logTime GMT
end F1
3. Add the F2 Filter definition to the log.conf file: begin F2
logFormat NCSA
logInterval Hourly
logFileSizeLimit 10
logFilenameFormat \nswl\LOGS\afweb_%{%y%m%d}t.log
logExclude .jpg .gif .ico .png
end F2
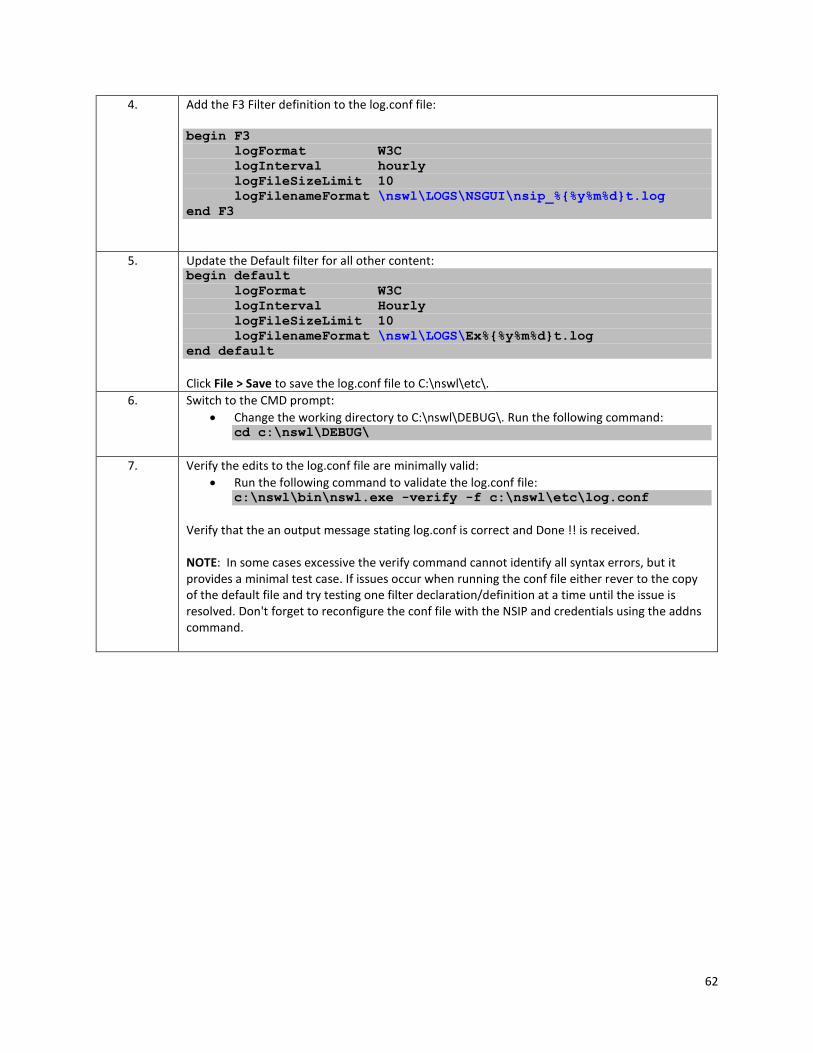
62
4. Add the F3 Filter definition to the log.conf file: begin F3
logFormat W3C
logInterval hourly
logFileSizeLimit 10
logFilenameFormat \nswl\LOGS\NSGUI\nsip_%{%y%m%d}t.log
end F3
5. Update the Default filter for all other content: begin default
logFormat W3C
logInterval Hourly
logFileSizeLimit 10
logFilenameFormat \nswl\LOGS\Ex%{%y%m%d}t.log
end default
Click File > Save to save the log.conf file to C:\nswl\etc\.
6. Switch to the CMD prompt:
Change the working directory to C:\nswl\DEBUG\. Run the following command: cd c:\nswl\DEBUG\
7. Verify the edits to the log.conf file are minimally valid:
Run the following command to validate the log.conf file: c:\nswl\bin\nswl.exe -verify -f c:\nswl\etc\log.conf
Verify that the an output message stating log.conf is correct and Done !! is received. NOTE: In some cases excessive the verify command cannot identify all syntax errors, but it provides a minimal test case. If issues occur when running the conf file either rever to the copy of the default file and try testing one filter declaration/definition at a time until the issue is resolved. Don't forget to reconfigure the conf file with the NSIP and credentials using the addns command.
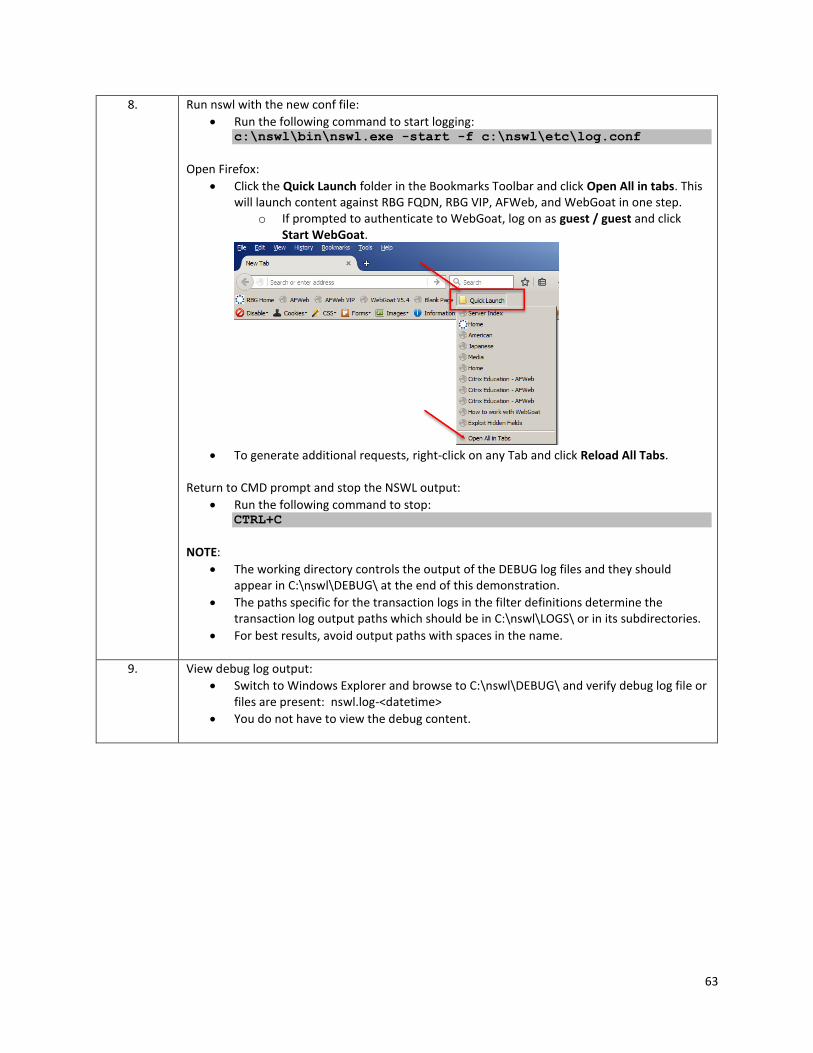
63
8. Run nswl with the new conf file:
Run the following command to start logging: c:\nswl\bin\nswl.exe -start -f c:\nswl\etc\log.conf
Open Firefox:
Click the Quick Launch folder in the Bookmarks Toolbar and click Open All in tabs. This will launch content against RBG FQDN, RBG VIP, AFWeb, and WebGoat in one step.
o If prompted to authenticate to WebGoat, log on as guest / guest and click Start WebGoat.
To generate additional requests, right-click on any Tab and click Reload All Tabs.
Return to CMD prompt and stop the NSWL output:
Run the following command to stop: CTRL+C
NOTE:
The working directory controls the output of the DEBUG log files and they should appear in C:\nswl\DEBUG\ at the end of this demonstration.
The paths specific for the transaction logs in the filter definitions determine the transaction log output paths which should be in C:\nswl\LOGS\ or in its subdirectories.
For best results, avoid output paths with spaces in the name.
9. View debug log output:
Switch to Windows Explorer and browse to C:\nswl\DEBUG\ and verify debug log file or files are present: nswl.log-<datetime>
You do not have to view the debug content.
64
10. View web transaction logs:
Browse to C:\nswl\LOGS\.
Verify log file for rbg_<date>.log and afweb_<date>.log are present. This will contain the transaction logs for these specific applications only.
The Ex<date>.log is generated by the default filter and will contain WebGoat and all other unmatched traffic.
The NSGUI director contains the logs for the NetScaler GUI. Select any of the transaction logs and view the output. Note the following:
The RBG transaction log should contain content the lb vserver whether users connected by name or VIP. This output is in W3C format.
The AFWeb log is capturing output in NCSA format but all image content was excluded for .jpeg, .gif, .png, and .ico extensions.
11. Cleanup the current unnecessary windows:
Close the notepad windows with previous debug and transaction logs. Keep the following applications open:
Keep the log.conf file (c:\nswl\etc\log.conf) open in Notepad++.
Keep the CMD prompt open to run additional NSWL commands.
12. Switch to Windows Explorer and archive the previous log files:
Delete all logs in the C:\nswl\LOGS\ directory.
Delete all logs in the C:\nswl\DEBUG\ directory. C:\nswl\LOGS\ and C:\nswl\DEBUG\ directories should be empty now.
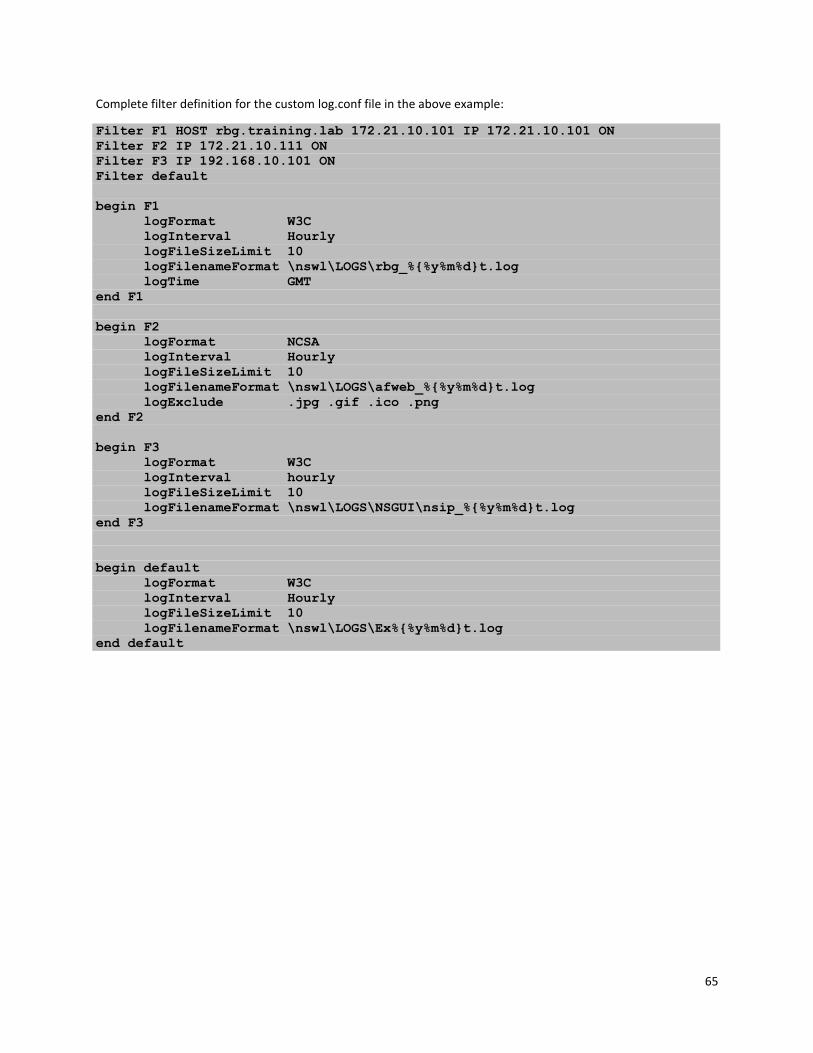
65
Complete filter definition for the custom log.conf file in the above example:
Filter F1 HOST rbg.training.lab 172.21.10.101 IP 172.21.10.101 ON
Filter F2 IP 172.21.10.111 ON
Filter F3 IP 192.168.10.101 ON
Filter default
begin F1
logFormat W3C
logInterval Hourly
logFileSizeLimit 10
logFilenameFormat \nswl\LOGS\rbg_%{%y%m%d}t.log
logTime GMT
end F1
begin F2
logFormat NCSA
logInterval Hourly
logFileSizeLimit 10
logFilenameFormat \nswl\LOGS\afweb_%{%y%m%d}t.log
logExclude .jpg .gif .ico .png
end F2
begin F3
logFormat W3C
logInterval hourly
logFileSizeLimit 10
logFilenameFormat \nswl\LOGS\NSGUI\nsip_%{%y%m%d}t.log
end F3
begin default
logFormat W3C
logInterval Hourly
logFileSizeLimit 10
logFilenameFormat \nswl\LOGS\Ex%{%y%m%d}t.log
end default
66
Configure NSWL and Run as a Service
Step Action
1. Return to the CMD prompt running NSWL. Run the following command to install NSWL as a service on Windows:
c:\nswl\bin\nswl.exe -install -f c:\nswl\etc\log.conf
Verify a confirmation message stating NetScaler Weblogging Service installed with a Done !! message is returned.
2. Open the Windows Services console:
Open the services console: Start > Run > services.msc.
Verify the service NetScaler Weblogging Service appears in the services console. Notice the service is not running yet.
Right-click NetScaler Weblogging Service and click Properties. o Verify Startup Type on the General tab is Automatic. o Click on the Recovery tab. Note that recovery is not configured. o Do not adjust these settings at this time. (Though for production Recovery is
recommended upon service failure.)
Click OK to close the Service Properties dialog. NOTE:
The NetScaler Weblogging Service can be started and stopped via the Services.msc console like any other Windows service or it can be started and stopped using the nswl.exe command, which will be demonstrated.
For lab purposes. we do not want the service running non-stop so recovery will not be configured at this time.
3. View the NSWL registry settings:
Open regedit: Start > Run > regedit.
In regedit browse to the following registry key: HKEY_LOCAL_MACHINE\SYSTEM\CurrentControlSet\services\
nswlsvc\
Verify the ImagePath registry key contains the location of the log.conf file: c:\nswl\bin\nswl.exe -log -f c:\nswl\etc\log.conf
NOTE:
Installing nswl as a service requires that the path to the log.conf file is supplied at the time of install.
The command parameter in the registry key is slightly different than the command used running manually from the command line.
4. Return to the CMD prompt to start NSWL as a service:
Run the following command: c:\nswl\bin\nswl.exe -startservice
5. Switch to Firefox and generate transaction logs:
Right-click any of the open tabs in Firefox and click Reload all tabs.
Click Resend if prompted to resubmit content.
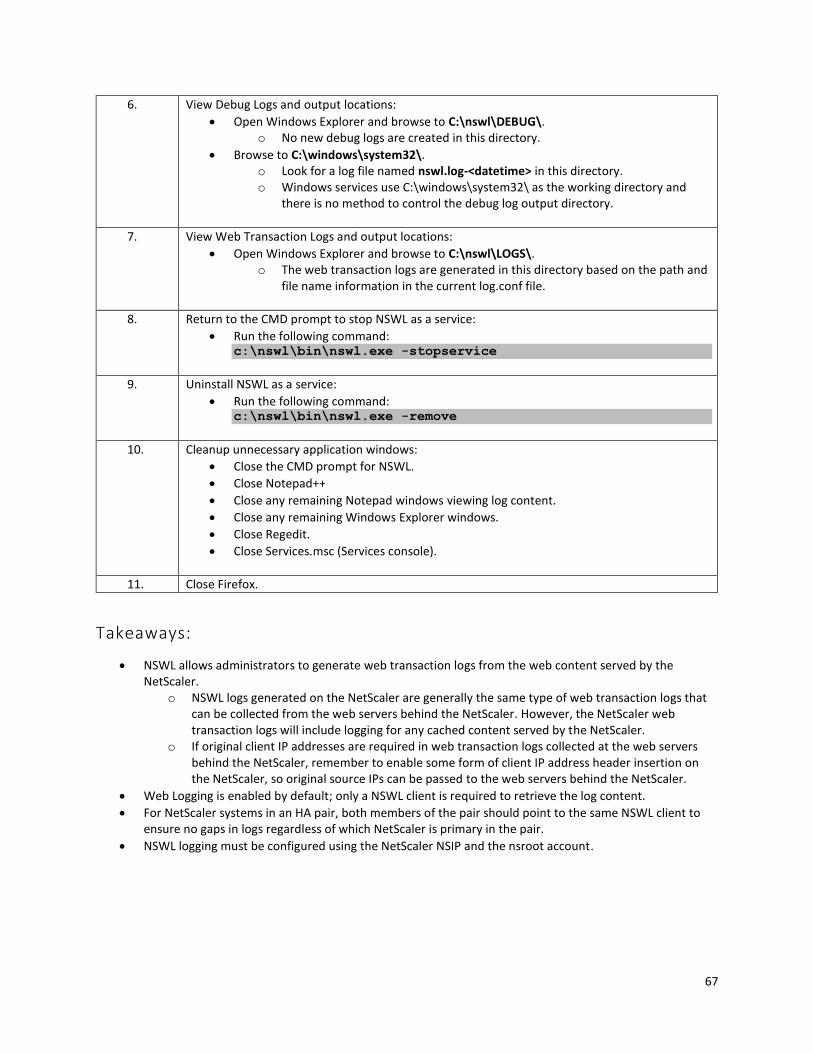
67
6. View Debug Logs and output locations:
Open Windows Explorer and browse to C:\nswl\DEBUG\. o No new debug logs are created in this directory.
Browse to C:\windows\system32\. o Look for a log file named nswl.log-<datetime> in this directory. o Windows services use C:\windows\system32\ as the working directory and
there is no method to control the debug log output directory.
7. View Web Transaction Logs and output locations:
Open Windows Explorer and browse to C:\nswl\LOGS\. o The web transaction logs are generated in this directory based on the path and
file name information in the current log.conf file.
8. Return to the CMD prompt to stop NSWL as a service:
Run the following command: c:\nswl\bin\nswl.exe -stopservice
9. Uninstall NSWL as a service:
Run the following command: c:\nswl\bin\nswl.exe -remove
10. Cleanup unnecessary application windows:
Close the CMD prompt for NSWL.
Close Notepad++
Close any remaining Notepad windows viewing log content.
Close any remaining Windows Explorer windows.
Close Regedit.
Close Services.msc (Services console).
11. Close Firefox.
Takeaways:
NSWL allows administrators to generate web transaction logs from the web content served by the NetScaler.
o NSWL logs generated on the NetScaler are generally the same type of web transaction logs that can be collected from the web servers behind the NetScaler. However, the NetScaler web transaction logs will include logging for any cached content served by the NetScaler.
o If original client IP addresses are required in web transaction logs collected at the web servers behind the NetScaler, remember to enable some form of client IP address header insertion on the NetScaler, so original source IPs can be passed to the web servers behind the NetScaler.
Web Logging is enabled by default; only a NSWL client is required to retrieve the log content.
For NetScaler systems in an HA pair, both members of the pair should point to the same NSWL client to ensure no gaps in logs regardless of which NetScaler is primary in the pair.
NSWL logging must be configured using the NetScaler NSIP and the nsroot account.
68
Module 5: Integrated Caching Overview: Dynamic caching evaluates HTTP requests and responses
based on parameter-value pairs, strings, string patterns, or other data
In this module, you will perform hands-on exercises that will demonstrate the configuration of Integrated Caching
and the impact of those settings on web site performance. Adding integrated caching to existing traffic
management virtual servers (such as load balancing and content switching) provides an additional performance
benefit for application delivery using the NetScaler and reduces load on backend servers.
After completing this lab module, you will be able to:
Configure Integrated Caching feature and key parameters.
Manage caching behavior per content group.
Create cache, nocache, and invalidation policies to manage cacheability.
Identify and confirm when content is served by cache from the NetScaler
This module contains the following exercises using the NetScaler Configuration Utility GUI:
Exercise 5-1: Integrated Caching 35 min
Before you begin:
Estimated time to complete this lab module: 35 minutes
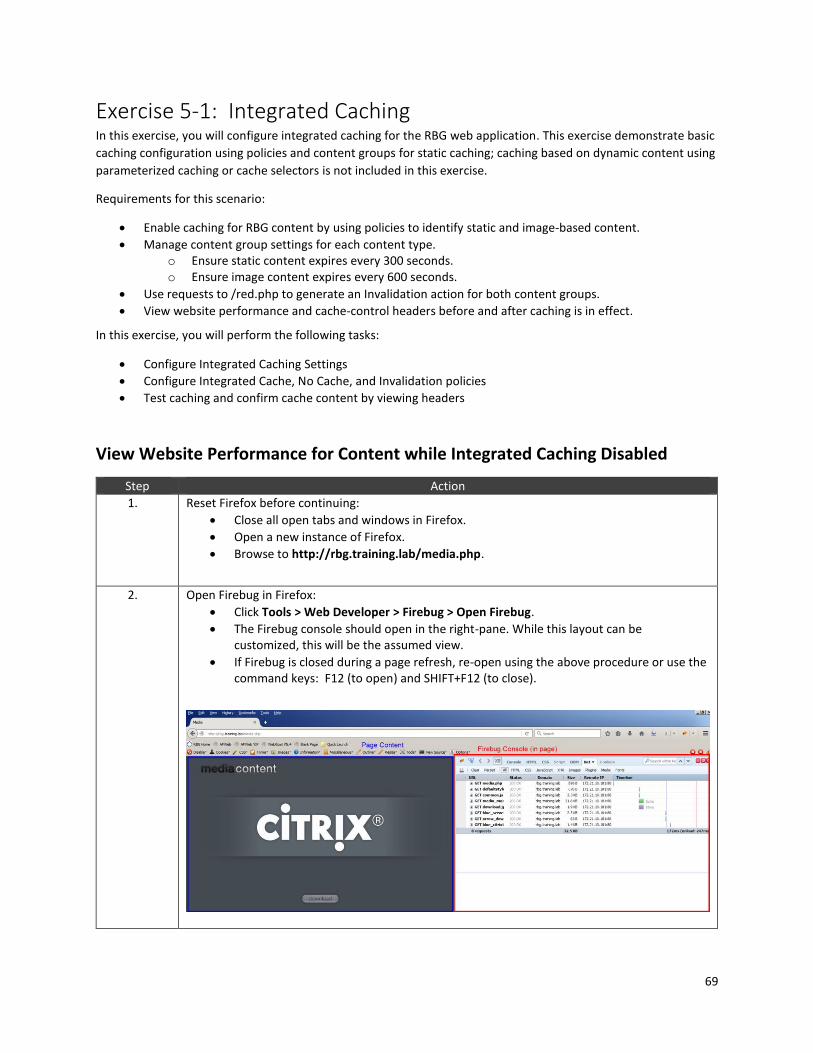
69
Exercise 5-1: Integrated Caching In this exercise, you will configure integrated caching for the RBG web application. This exercise demonstrate basic
caching configuration using policies and content groups for static caching; caching based on dynamic content using
parameterized caching or cache selectors is not included in this exercise.
Requirements for this scenario:
Enable caching for RBG content by using policies to identify static and image-based content.
Manage content group settings for each content type. o Ensure static content expires every 300 seconds. o Ensure image content expires every 600 seconds.
Use requests to /red.php to generate an Invalidation action for both content groups.
View website performance and cache-control headers before and after caching is in effect.
In this exercise, you will perform the following tasks:
Configure Integrated Caching Settings
Configure Integrated Cache, No Cache, and Invalidation policies
Test caching and confirm cache content by viewing headers
View Website Performance for Content while Integrated Caching Disabled
Step Action
1. Reset Firefox before continuing:
Close all open tabs and windows in Firefox.
Open a new instance of Firefox.
Browse to http://rbg.training.lab/media.php.
2. Open Firebug in Firefox:
Click Tools > Web Developer > Firebug > Open Firebug.
The Firebug console should open in the right-pane. While this layout can be customized, this will be the assumed view.
If Firebug is closed during a page refresh, re-open using the above procedure or use the command keys: F12 (to open) and SHIFT+F12 (to close).
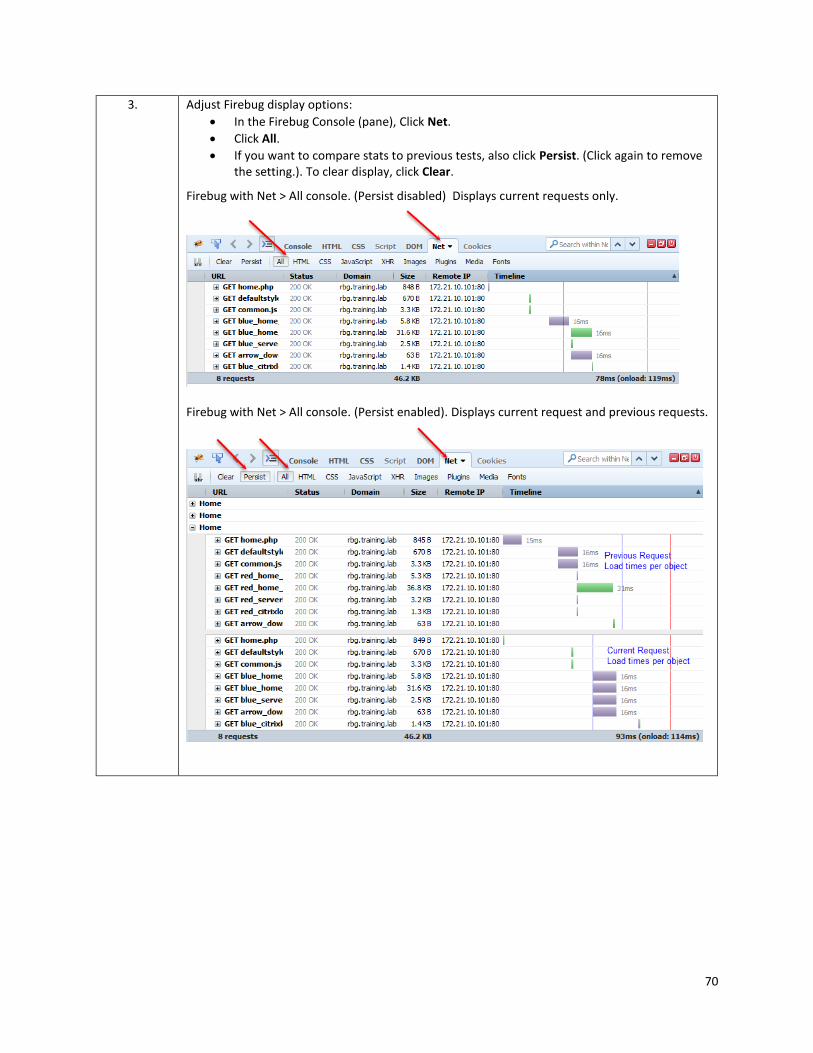
70
3. Adjust Firebug display options:
In the Firebug Console (pane), Click Net.
Click All.
If you want to compare stats to previous tests, also click Persist. (Click again to remove the setting.). To clear display, click Clear.
Firebug with Net > All console. (Persist disabled) Displays current requests only.
Firebug with Net > All console. (Persist enabled). Displays current request and previous requests.
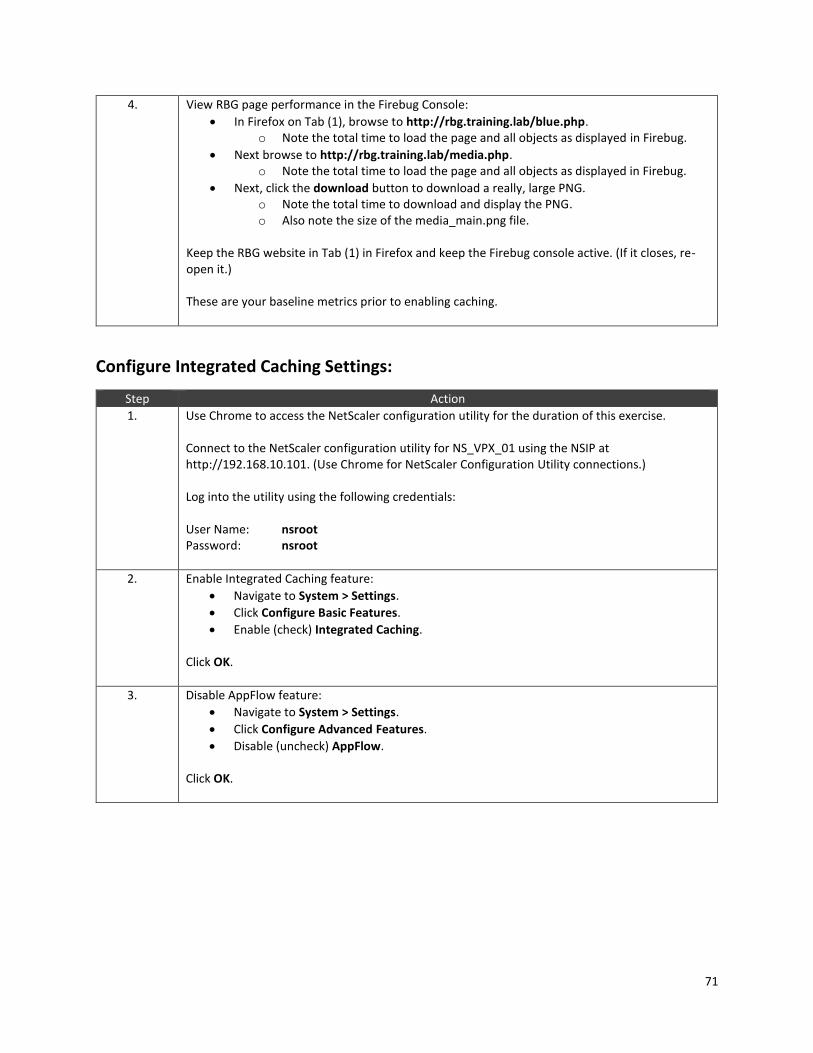
71
4. View RBG page performance in the Firebug Console:
In Firefox on Tab (1), browse to http://rbg.training.lab/blue.php. o Note the total time to load the page and all objects as displayed in Firebug.
Next browse to http://rbg.training.lab/media.php. o Note the total time to load the page and all objects as displayed in Firebug.
Next, click the download button to download a really, large PNG. o Note the total time to download and display the PNG. o Also note the size of the media_main.png file.
Keep the RBG website in Tab (1) in Firefox and keep the Firebug console active. (If it closes, re-open it.) These are your baseline metrics prior to enabling caching.
Configure Integrated Caching Settings:
Step Action
1. Use Chrome to access the NetScaler configuration utility for the duration of this exercise. Connect to the NetScaler configuration utility for NS_VPX_01 using the NSIP at http://192.168.10.101. (Use Chrome for NetScaler Configuration Utility connections.) Log into the utility using the following credentials: User Name: nsroot Password: nsroot
2. Enable Integrated Caching feature:
Navigate to System > Settings.
Click Configure Basic Features.
Enable (check) Integrated Caching. Click OK.
3. Disable AppFlow feature:
Navigate to System > Settings.
Click Configure Advanced Features.
Disable (uncheck) AppFlow. Click OK.
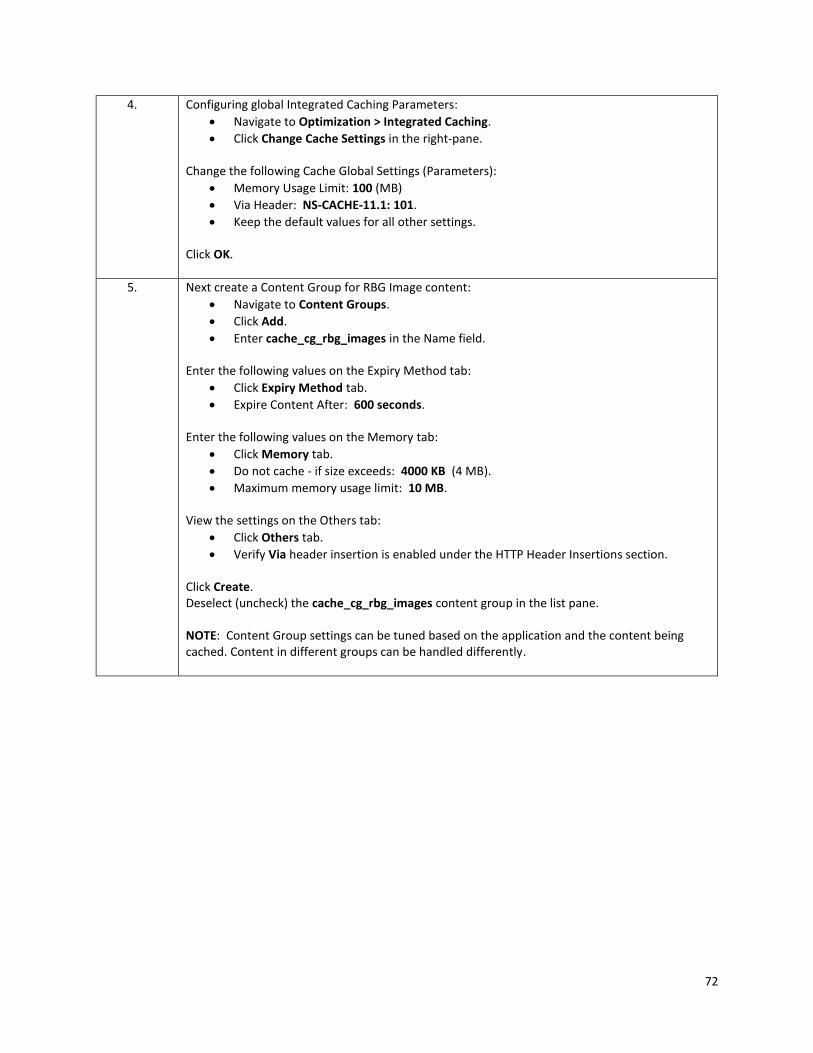
72
4. Configuring global Integrated Caching Parameters:
Navigate to Optimization > Integrated Caching.
Click Change Cache Settings in the right-pane. Change the following Cache Global Settings (Parameters):
Memory Usage Limit: 100 (MB)
Via Header: NS-CACHE-11.1: 101.
Keep the default values for all other settings. Click OK.
5. Next create a Content Group for RBG Image content:
Navigate to Content Groups.
Click Add.
Enter cache_cg_rbg_images in the Name field. Enter the following values on the Expiry Method tab:
Click Expiry Method tab.
Expire Content After: 600 seconds. Enter the following values on the Memory tab:
Click Memory tab.
Do not cache - if size exceeds: 4000 KB (4 MB).
Maximum memory usage limit: 10 MB. View the settings on the Others tab:
Click Others tab.
Verify Via header insertion is enabled under the HTTP Header Insertions section. Click Create. Deselect (uncheck) the cache_cg_rbg_images content group in the list pane. NOTE: Content Group settings can be tuned based on the application and the content being cached. Content in different groups can be handled differently.
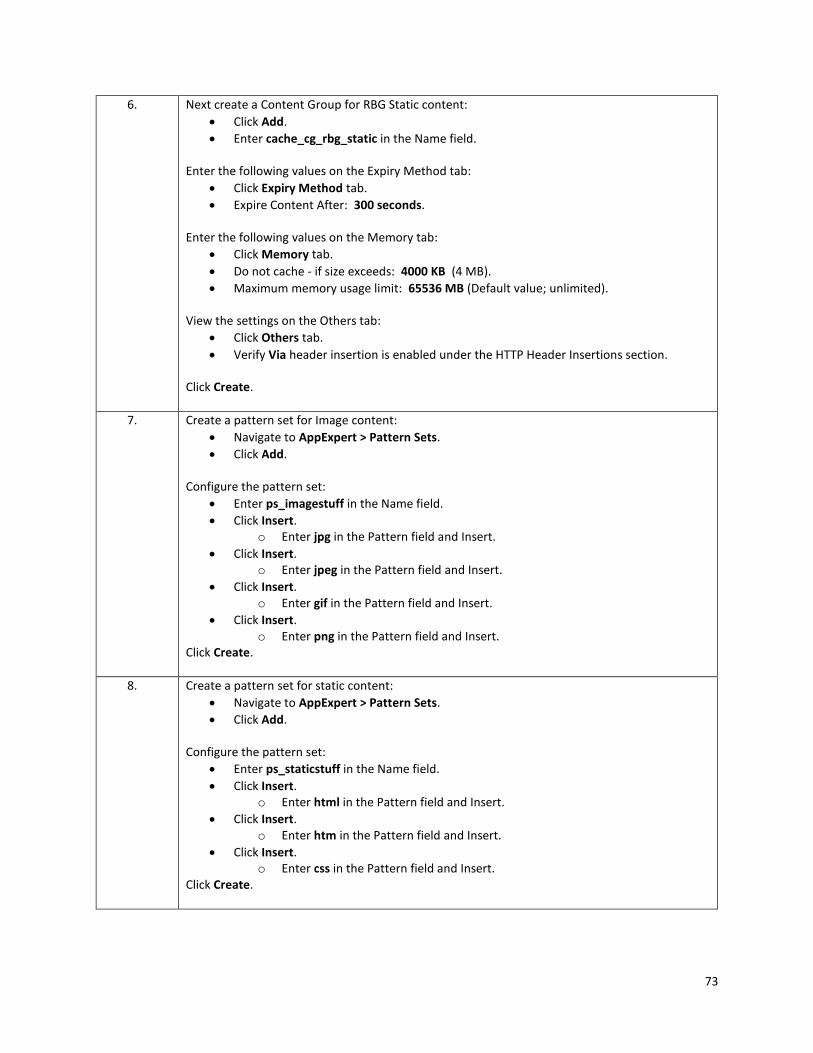
73
6. Next create a Content Group for RBG Static content:
Click Add.
Enter cache_cg_rbg_static in the Name field. Enter the following values on the Expiry Method tab:
Click Expiry Method tab.
Expire Content After: 300 seconds. Enter the following values on the Memory tab:
Click Memory tab.
Do not cache - if size exceeds: 4000 KB (4 MB).
Maximum memory usage limit: 65536 MB (Default value; unlimited). View the settings on the Others tab:
Click Others tab.
Verify Via header insertion is enabled under the HTTP Header Insertions section. Click Create.
7. Create a pattern set for Image content:
Navigate to AppExpert > Pattern Sets.
Click Add. Configure the pattern set:
Enter ps_imagestuff in the Name field.
Click Insert. o Enter jpg in the Pattern field and Insert.
Click Insert. o Enter jpeg in the Pattern field and Insert.
Click Insert. o Enter gif in the Pattern field and Insert.
Click Insert. o Enter png in the Pattern field and Insert.
Click Create.
8. Create a pattern set for static content:
Navigate to AppExpert > Pattern Sets.
Click Add. Configure the pattern set:
Enter ps_staticstuff in the Name field.
Click Insert. o Enter html in the Pattern field and Insert.
Click Insert. o Enter htm in the Pattern field and Insert.
Click Insert. o Enter css in the Pattern field and Insert.
Click Create.
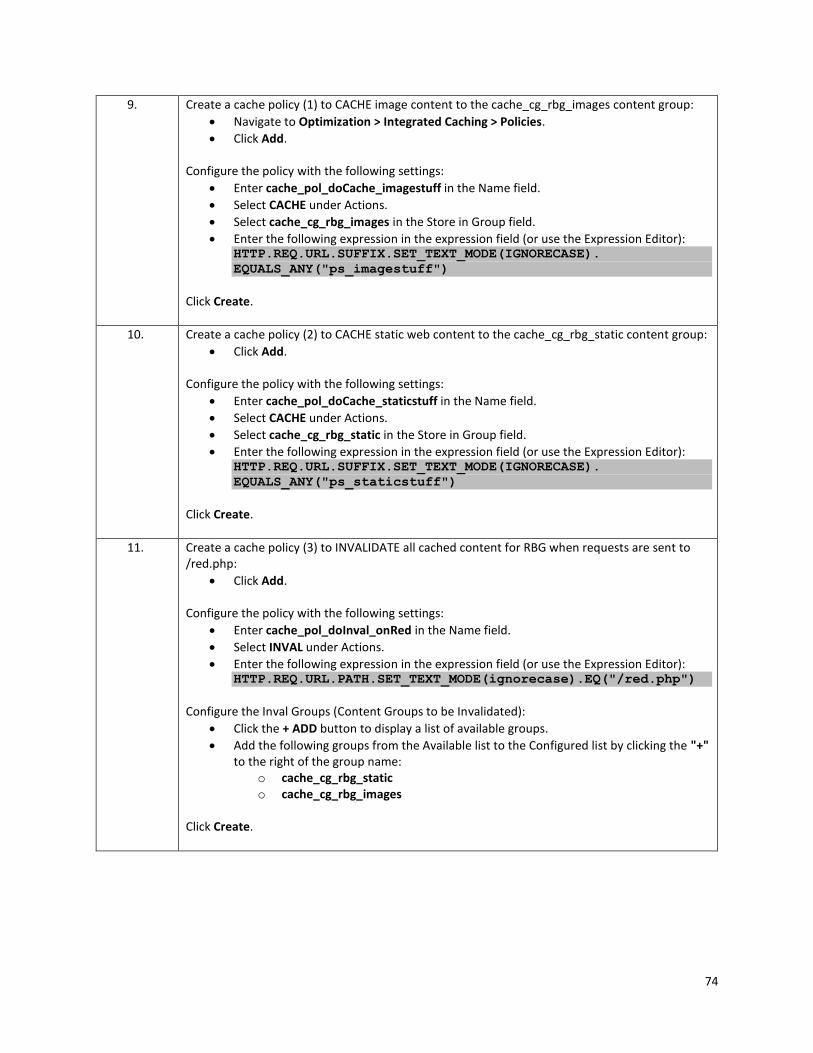
74
9. Create a cache policy (1) to CACHE image content to the cache_cg_rbg_images content group:
Navigate to Optimization > Integrated Caching > Policies.
Click Add. Configure the policy with the following settings:
Enter cache_pol_doCache_imagestuff in the Name field.
Select CACHE under Actions.
Select cache_cg_rbg_images in the Store in Group field.
Enter the following expression in the expression field (or use the Expression Editor): HTTP.REQ.URL.SUFFIX.SET_TEXT_MODE(IGNORECASE).
EQUALS_ANY("ps_imagestuff")
Click Create.
10. Create a cache policy (2) to CACHE static web content to the cache_cg_rbg_static content group:
Click Add. Configure the policy with the following settings:
Enter cache_pol_doCache_staticstuff in the Name field.
Select CACHE under Actions.
Select cache_cg_rbg_static in the Store in Group field.
Enter the following expression in the expression field (or use the Expression Editor): HTTP.REQ.URL.SUFFIX.SET_TEXT_MODE(IGNORECASE).
EQUALS_ANY("ps_staticstuff")
Click Create.
11. Create a cache policy (3) to INVALIDATE all cached content for RBG when requests are sent to /red.php:
Click Add. Configure the policy with the following settings:
Enter cache_pol_doInval_onRed in the Name field.
Select INVAL under Actions.
Enter the following expression in the expression field (or use the Expression Editor): HTTP.REQ.URL.PATH.SET_TEXT_MODE(ignorecase).EQ("/red.php")
Configure the Inval Groups (Content Groups to be Invalidated):
Click the + ADD button to display a list of available groups.
Add the following groups from the Available list to the Configured list by clicking the "+" to the right of the group name:
o cache_cg_rbg_static o cache_cg_rbg_images
Click Create.
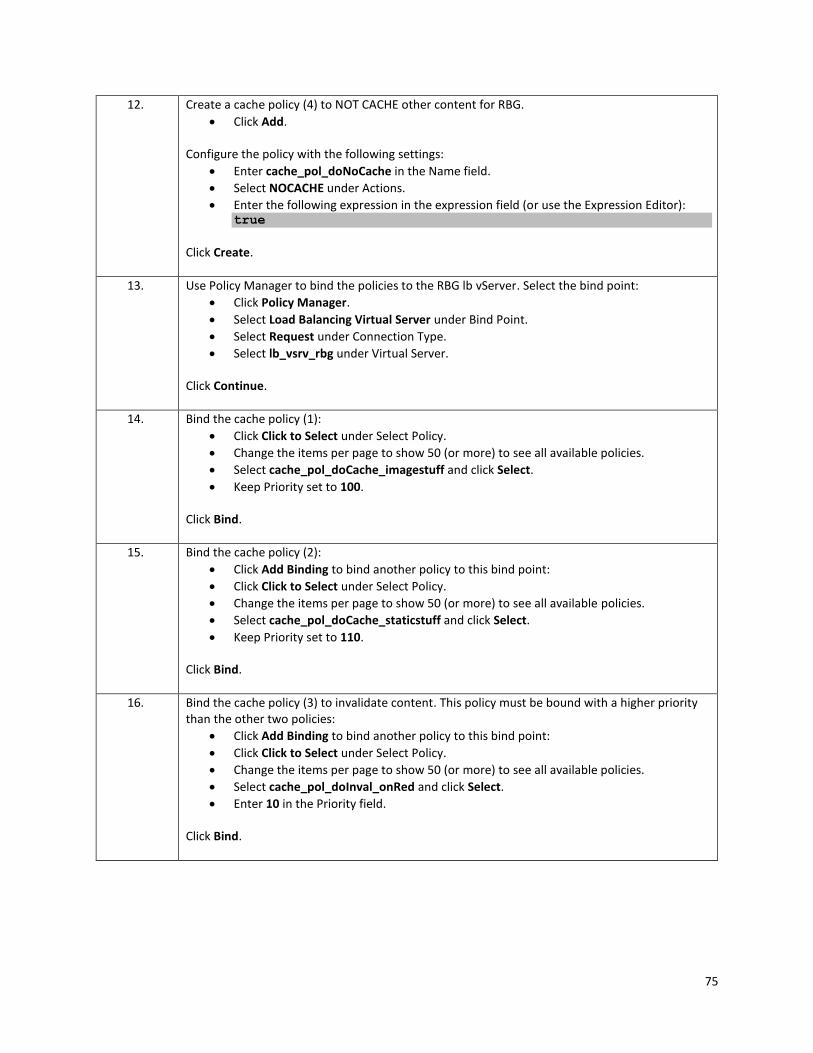
75
12. Create a cache policy (4) to NOT CACHE other content for RBG.
Click Add. Configure the policy with the following settings:
Enter cache_pol_doNoCache in the Name field.
Select NOCACHE under Actions.
Enter the following expression in the expression field (or use the Expression Editor): true
Click Create.
13. Use Policy Manager to bind the policies to the RBG lb vServer. Select the bind point:
Click Policy Manager.
Select Load Balancing Virtual Server under Bind Point.
Select Request under Connection Type.
Select lb_vsrv_rbg under Virtual Server. Click Continue.
14. Bind the cache policy (1):
Click Click to Select under Select Policy.
Change the items per page to show 50 (or more) to see all available policies.
Select cache_pol_doCache_imagestuff and click Select.
Keep Priority set to 100. Click Bind.
15. Bind the cache policy (2):
Click Add Binding to bind another policy to this bind point:
Click Click to Select under Select Policy.
Change the items per page to show 50 (or more) to see all available policies.
Select cache_pol_doCache_staticstuff and click Select.
Keep Priority set to 110. Click Bind.
16. Bind the cache policy (3) to invalidate content. This policy must be bound with a higher priority than the other two policies:
Click Add Binding to bind another policy to this bind point:
Click Click to Select under Select Policy.
Change the items per page to show 50 (or more) to see all available policies.
Select cache_pol_doInval_onRed and click Select.
Enter 10 in the Priority field. Click Bind.
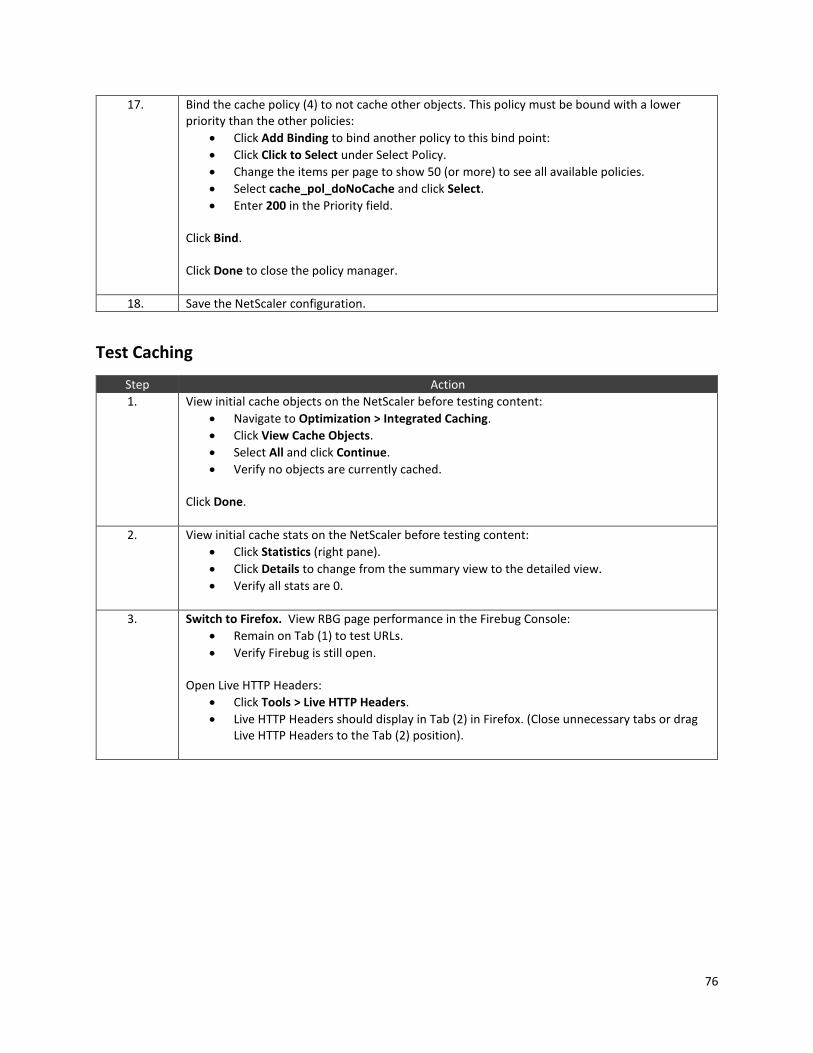
76
17. Bind the cache policy (4) to not cache other objects. This policy must be bound with a lower priority than the other policies:
Click Add Binding to bind another policy to this bind point:
Click Click to Select under Select Policy.
Change the items per page to show 50 (or more) to see all available policies.
Select cache_pol_doNoCache and click Select.
Enter 200 in the Priority field. Click Bind. Click Done to close the policy manager.
18. Save the NetScaler configuration.
Test Caching
Step Action
1. View initial cache objects on the NetScaler before testing content:
Navigate to Optimization > Integrated Caching.
Click View Cache Objects.
Select All and click Continue.
Verify no objects are currently cached. Click Done.
2. View initial cache stats on the NetScaler before testing content:
Click Statistics (right pane).
Click Details to change from the summary view to the detailed view.
Verify all stats are 0.
3. Switch to Firefox. View RBG page performance in the Firebug Console:
Remain on Tab (1) to test URLs.
Verify Firebug is still open. Open Live HTTP Headers:
Click Tools > Live HTTP Headers.
Live HTTP Headers should display in Tab (2) in Firefox. (Close unnecessary tabs or drag Live HTTP Headers to the Tab (2) position).
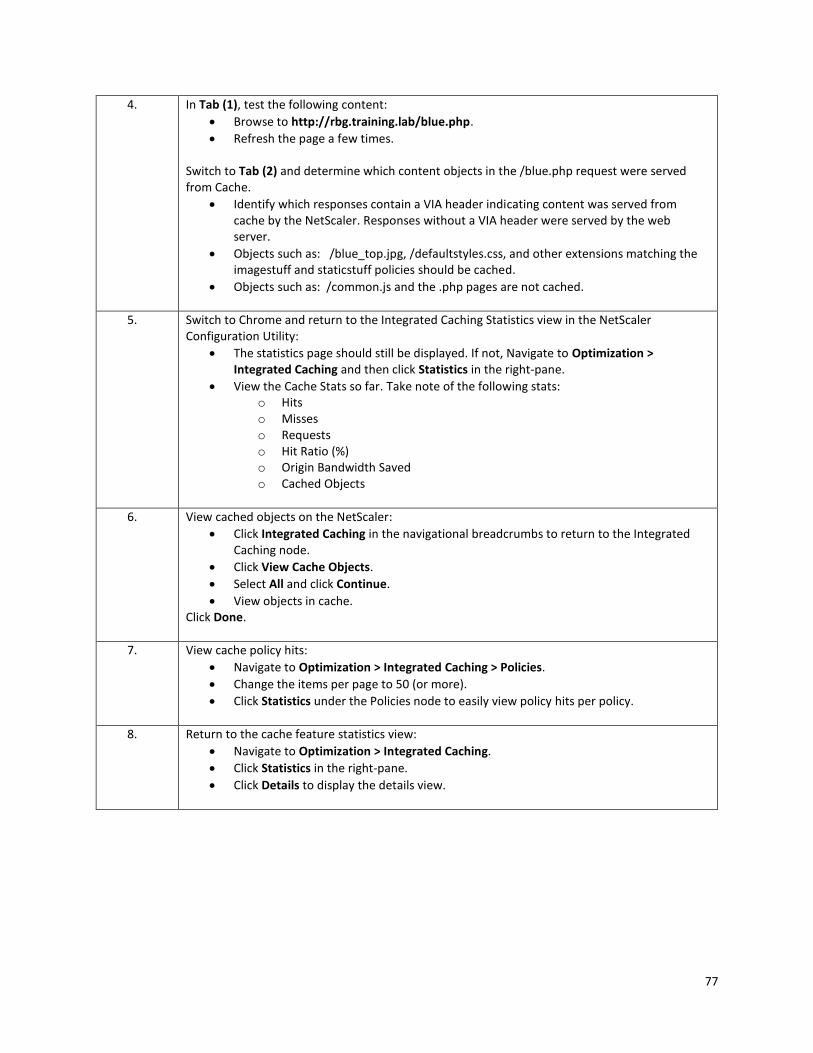
77
4. In Tab (1), test the following content:
Browse to http://rbg.training.lab/blue.php.
Refresh the page a few times. Switch to Tab (2) and determine which content objects in the /blue.php request were served from Cache.
Identify which responses contain a VIA header indicating content was served from cache by the NetScaler. Responses without a VIA header were served by the web server.
Objects such as: /blue_top.jpg, /defaultstyles.css, and other extensions matching the imagestuff and staticstuff policies should be cached.
Objects such as: /common.js and the .php pages are not cached.
5. Switch to Chrome and return to the Integrated Caching Statistics view in the NetScaler Configuration Utility:
The statistics page should still be displayed. If not, Navigate to Optimization > Integrated Caching and then click Statistics in the right-pane.
View the Cache Stats so far. Take note of the following stats: o Hits o Misses o Requests o Hit Ratio (%) o Origin Bandwidth Saved o Cached Objects
6. View cached objects on the NetScaler:
Click Integrated Caching in the navigational breadcrumbs to return to the Integrated Caching node.
Click View Cache Objects.
Select All and click Continue.
View objects in cache. Click Done.
7. View cache policy hits:
Navigate to Optimization > Integrated Caching > Policies.
Change the items per page to 50 (or more).
Click Statistics under the Policies node to easily view policy hits per policy.
8. Return to the cache feature statistics view:
Navigate to Optimization > Integrated Caching.
Click Statistics in the right-pane.
Click Details to display the details view.
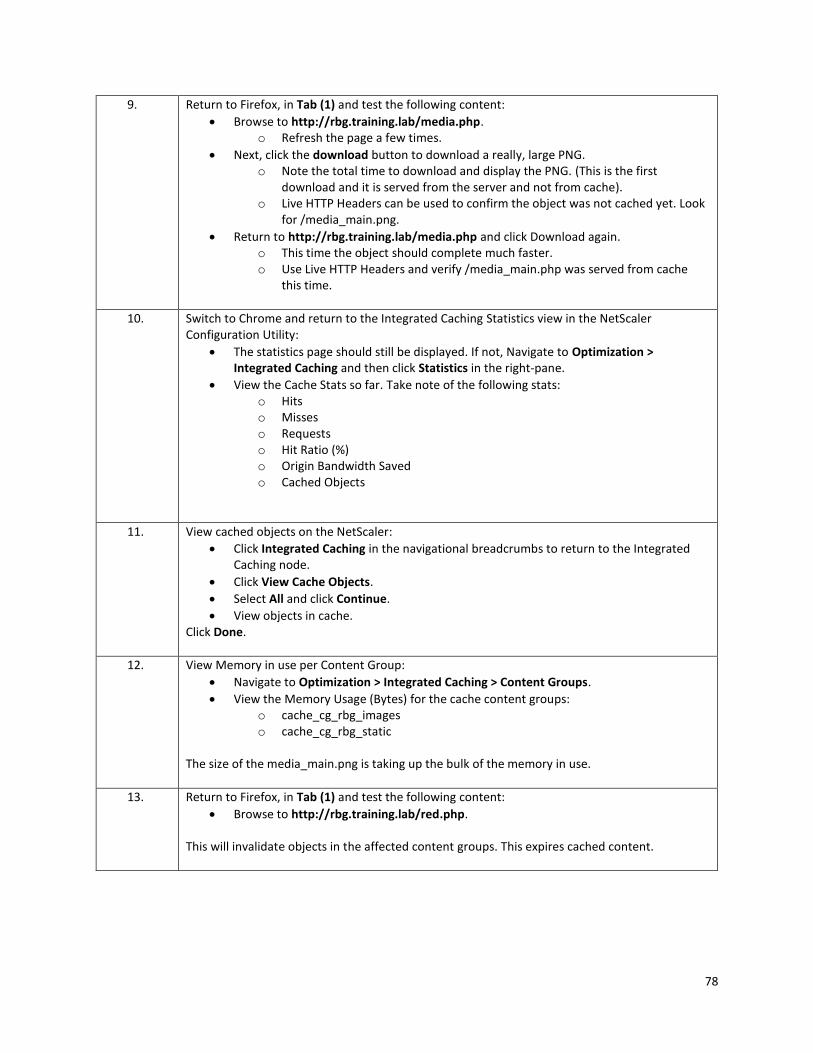
78
9. Return to Firefox, in Tab (1) and test the following content:
Browse to http://rbg.training.lab/media.php. o Refresh the page a few times.
Next, click the download button to download a really, large PNG. o Note the total time to download and display the PNG. (This is the first
download and it is served from the server and not from cache). o Live HTTP Headers can be used to confirm the object was not cached yet. Look
for /media_main.png.
Return to http://rbg.training.lab/media.php and click Download again. o This time the object should complete much faster. o Use Live HTTP Headers and verify /media_main.php was served from cache
this time.
10. Switch to Chrome and return to the Integrated Caching Statistics view in the NetScaler Configuration Utility:
The statistics page should still be displayed. If not, Navigate to Optimization > Integrated Caching and then click Statistics in the right-pane.
View the Cache Stats so far. Take note of the following stats: o Hits o Misses o Requests o Hit Ratio (%) o Origin Bandwidth Saved o Cached Objects
11. View cached objects on the NetScaler:
Click Integrated Caching in the navigational breadcrumbs to return to the Integrated Caching node.
Click View Cache Objects.
Select All and click Continue.
View objects in cache. Click Done.
12. View Memory in use per Content Group:
Navigate to Optimization > Integrated Caching > Content Groups.
View the Memory Usage (Bytes) for the cache content groups: o cache_cg_rbg_images o cache_cg_rbg_static
The size of the media_main.png is taking up the bulk of the memory in use.
13. Return to Firefox, in Tab (1) and test the following content:
Browse to http://rbg.training.lab/red.php. This will invalidate objects in the affected content groups. This expires cached content.
79
14. Re-retrieve the media_main.png file from /media.php:
Browse to http://rbg.training.lab/media.php. o Refresh the page a few times.
Next, click the download button to download a really, large PNG. o Since the content was invalidated, it should take longer to download this time
until the object is refreshed in cache.
15. Switch to Chrome and return to the NetScaler Configuration Utility. Keep the integrated caching feature enabled for the next exercise with FEO.
16. Save the NetScaler configuration.
Takeaways:
Integrated Caching should be configured prior to enabling the feature. Existing policies are already present on the NetScaler which will result in automatically cached content once the feature is enabled. Care should be taken to create necessary policies to prevent caching for content for which it is not wanted.
Memory must be allocated for use by the integrated caching feature.
Cache content groups control cache retention and expiration settings and therefore can be configured with content-specific settings for different content types and content groups.
80
Module 6: Front End Optimization (FEO) Overview:
In this module, you will perform hands-on exercises that will demonstrate the configuration of Front End
Optimization features and their impact on web content performance. FEO provides optimizations for JavaScript,
CSS, and image-rich content that can impact browser-level performance by reducing page load and page render
times.
After completing this lab module, you will be able to:
Enable and configure FEO policies to apply custom optimizations to a web application.
Review modifications made to content by reviewing headers and browser response and load times for optimized content.
This module contains the following exercises using the NetScaler Configuration Utility GUI:
Exercise 6-1: Front End Optimizations 20 min
Before you begin:
Estimated time to complete this lab module: 20 minutes
81
Exercise 6-1: Front End Optimizations In this exercise, you will configure custom a custom FEO action and policy to apply optimizations to the FEO
demonstration page hosted on the AFWeb web server. As different optimizations for CSS and Image content are
applied, the effects of the optimizations will be observed using browser-based tools.
Requirements for this scenario:
Enable FEO with basic CSS optimizations and observe impact of Combine CSS, Convert Imported CSS to links, and Minify optimizations.
Update CSS optimizations and observe impact of Inline image and Move to head options on multiple linked stylesheets.
Enable FEO with image optimizations and observe impact of Shrink to attributes, Make inline, optimize, and convert GIF to PNG.
Update FEO optimizations to include LazyLoad options and observe impact on large, content-rich page load times and performance.
In this exercise, you will perform the following tasks:
View page performance for an un-optimized page
Enable Front End Optimization feature by configuring parameters and policies
View Demo Page Before Optimizations
Step Action
1. Connect to the NetScaler configuration utility for NS_VPX_01 using the NSIP at http://192.168.10.101. (Use Chrome for NetScaler Configuration Utility connections.) Log into the utility using the following credentials: User Name: nsroot Password: nsroot
2. Disable Integrated Caching:
Navigate to System > Settings.
Click Configure Basic Feature.
Deselect (uncheck) Integrated Caching.
Click OK. Verify FEO is Disabled:
Click Configure Advanced Features.
Verify Front End Optimization is disabled.
Verify AppFlow is disabled.
Click OK. Note: The AppFlow settings in the lab will interfere with CSS optimizations that we are attempting to test. There is no problem using both features in a production environment.
82
3. Close all existing instances of Firefox and re-open a new window.
In Tab (1), open Firebug: Tools > Web developer > Firebug > Open Firebug. (Or use F12). Firebug should open in the right pane. Maximize the browser for best effect.
Browse in Tab (1) to http://afweb.training.lab/feo1.htm. Scroll down to view the page content.
Note that there are many images of different image size and quality
Take note of the following in Firebug:
How much data was loaded by all objects in the page.
The load time for all objects in the page.
Note: The NetScaler may have trouble delivering all content on the un-optimized site as the lab NetScalers have an artificially low bandwidth cap of 1 Mbps.
4. View the original page source within the Firefox:
Right-click the gray background in the /feo1.htm page and click View Page Source.
Keep this in Tab (2) for future reference.
Take note of the following elements in the page source:
There are comments with the phrase "FEODEMO" around the stylesheets. o Three of the stylesheets are linked in <link> tags. o Two additional stylesheets are imported.
Four Image Demos are included. o Each Demo has three different images. o The demos incorporate images in GIF, JPG, and PNG formats. o Some images are imported with specific size specifications. Some images are
referenced through relative links and others through explicit links. o The images are mixture of small, medium, and large file sizes.
5. Keep the content in Firefox Tab (1) and Tab (2) open until further notice.
Enable and Test FEO
Step Action
1. Return to the NetScaler Configuration Utility in Chrome.
2. Enable Integrated Caching and FEO features: Enable Integrated Caching:
Navigate to System > Settings.
Click Configure Basic Features.
Enable (check) Integrated Caching. Click OK. Enable FEO:
Navigate to System > Settings.
Click Configure Advanced Features.
Enable (check) Front End Optimization. Click OK.
83
3. Clear existing cache objects:
Navigate to Optimization > Integrated Caching.
Click View Cache Objects.
Select All and click Continue.
Select all objects (if present) and click Flush. Click Yes to confirm. Click Done.
4. Adjust FEO global parameters:
Navigate to Optimization > Front End Optimization.
Click Change Front End Optimization settings in the right-pane.
Enter 2048 under Inline CSS Threshold Size (Bytes).
Enter 2048 under Inline JavaScript Threshold Size (Byte).
Enter 2048 under Inline Image Threshold Size (Bytes). Click OK. NOTE:
A few of the stylesheets in the demonstration are 2KB in size. Therefore some of the inline optimizations will not be applied, with the default limit of 1024 Bytes.
5. Create a FEO Action with basic settings for stylesheets optimizations:
Navigate to Optimization > Front End Optimization > Actions.
Click Add.
Enter feo_act_custom in the Name field. Enable the following settings under the CSS category:
Enable (check) Combine
Enable (check) Convert Imports to Links
Enable (check) Minify Click Create.
6. Create a FEO Policy with the custom action:
Navigate to Optimization > Front End Optimization > Policies.
Click Add.
Enter feo_pol_custom.
Select feo_act_custom under the Action field.
Enter true in the Expression field. Click Create.
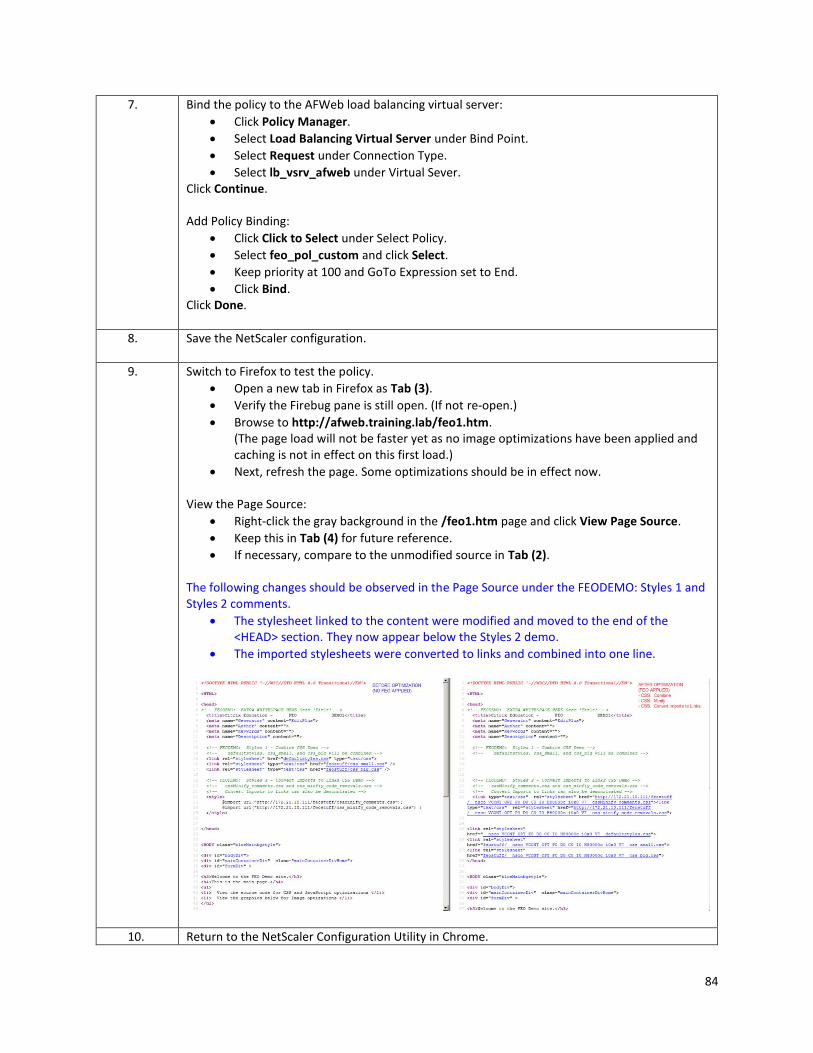
84
7. Bind the policy to the AFWeb load balancing virtual server:
Click Policy Manager.
Select Load Balancing Virtual Server under Bind Point.
Select Request under Connection Type.
Select lb_vsrv_afweb under Virtual Sever. Click Continue. Add Policy Binding:
Click Click to Select under Select Policy.
Select feo_pol_custom and click Select.
Keep priority at 100 and GoTo Expression set to End.
Click Bind. Click Done.
8. Save the NetScaler configuration.
9. Switch to Firefox to test the policy.
Open a new tab in Firefox as Tab (3).
Verify the Firebug pane is still open. (If not re-open.)
Browse to http://afweb.training.lab/feo1.htm. (The page load will not be faster yet as no image optimizations have been applied and caching is not in effect on this first load.)
Next, refresh the page. Some optimizations should be in effect now. View the Page Source:
Right-click the gray background in the /feo1.htm page and click View Page Source.
Keep this in Tab (4) for future reference.
If necessary, compare to the unmodified source in Tab (2). The following changes should be observed in the Page Source under the FEODEMO: Styles 1 and Styles 2 comments.
The stylesheet linked to the content were modified and moved to the end of the <HEAD> section. They now appear below the Styles 2 demo.
The imported stylesheets were converted to links and combined into one line.
10. Return to the NetScaler Configuration Utility in Chrome.
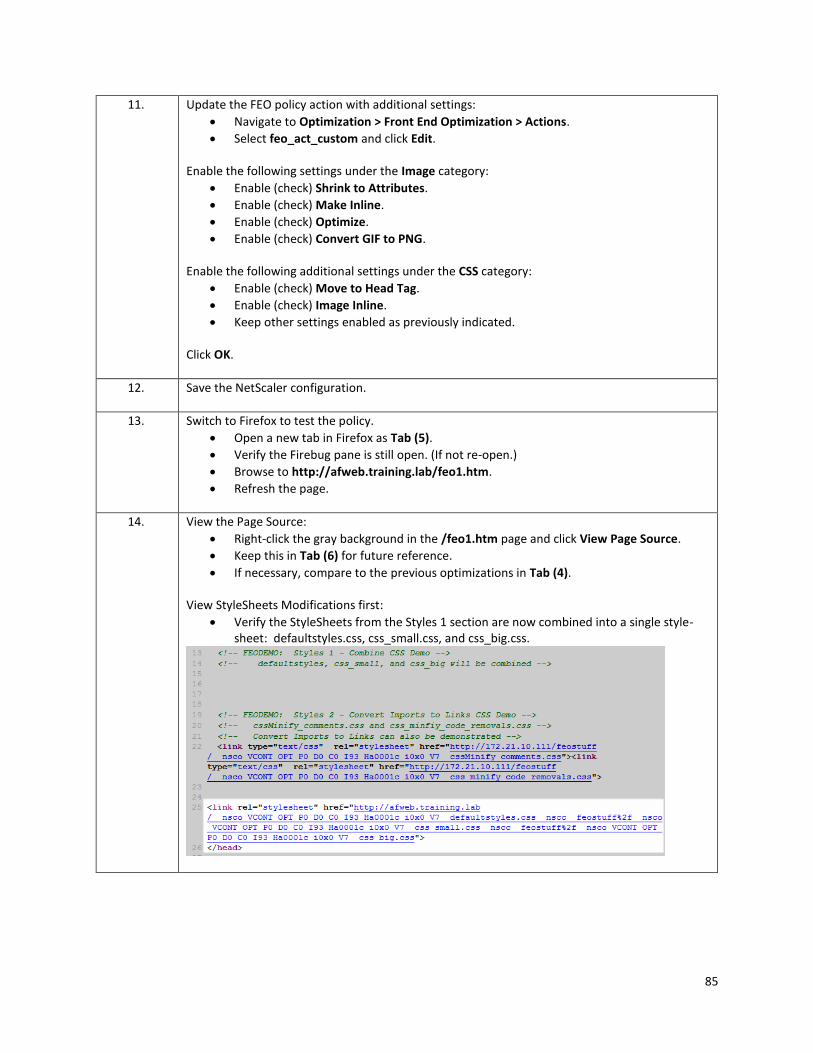
85
11. Update the FEO policy action with additional settings:
Navigate to Optimization > Front End Optimization > Actions.
Select feo_act_custom and click Edit. Enable the following settings under the Image category:
Enable (check) Shrink to Attributes.
Enable (check) Make Inline.
Enable (check) Optimize.
Enable (check) Convert GIF to PNG. Enable the following additional settings under the CSS category:
Enable (check) Move to Head Tag.
Enable (check) Image Inline.
Keep other settings enabled as previously indicated. Click OK.
12. Save the NetScaler configuration.
13. Switch to Firefox to test the policy.
Open a new tab in Firefox as Tab (5).
Verify the Firebug pane is still open. (If not re-open.)
Browse to http://afweb.training.lab/feo1.htm.
Refresh the page.
14. View the Page Source:
Right-click the gray background in the /feo1.htm page and click View Page Source.
Keep this in Tab (6) for future reference.
If necessary, compare to the previous optimizations in Tab (4). View StyleSheets Modifications first:
Verify the StyleSheets from the Styles 1 section are now combined into a single style-sheet: defaultstyles.css, css_small.css, and css_big.css.
86
15. Switch to Tab (5) and view the image optimizations:
Scroll down through the page and view the image content.
Notice that all images in page content have already loaded. Return to the Page Source in Tab (6):
Scroll down to the FEO Image DEMO 4 section and verify the small image objects were converted to inline image objects.
Close Tab (5) and Tab (6).
16. Return to the NetScaler Configuration Utility in Chrome.
17. Update the FEO policy action with additional settings:
Navigate to Optimization > Front End Optimization > Actions.
Select feo_act_custom and click Edit. Enable the following settings under the Image category:
Enable (check) Lazy Load.
Keep other settings enabled as previously indicated. Enable the following additional settings under the CSS category:
No changes. Keep other settings enabled as previously indicated. Enable the following additional settings under the HTML category:
Enable (check) Remove comments from HTML. Click OK.
18. Save the NetScaler configuration.
19. Switch to Firefox to test the policy.
Open a new tab in Firefox as Tab (5).
Verify the Firebug pane is still open. (If not re-open.)
Browse to http://afweb.training.lab/feo1.htm. Do not scroll down yet. NOTE: This time the page load time is much faster due to a combination of caching and lazy load. Images in non-displayed parts of the pages are not downloaded unless needed. You will see the timeline in Firebug include additional requests as you scroll down. The file size for all objects loaded in this request starts out significantly smaller but will increase as additional objects are retrieved. Take note of both values.
20. Scroll down the page and notice how page objects are loaded only when needed. The output in Firebug will indicate additional object requests.
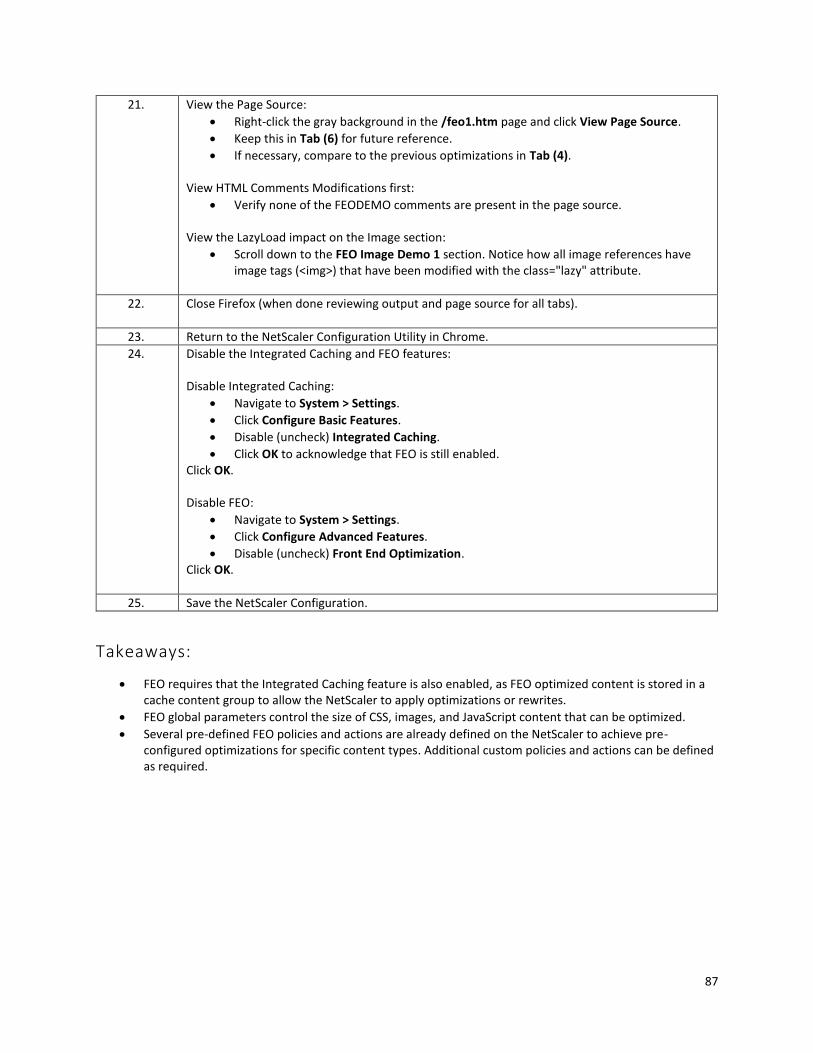
87
21. View the Page Source:
Right-click the gray background in the /feo1.htm page and click View Page Source.
Keep this in Tab (6) for future reference.
If necessary, compare to the previous optimizations in Tab (4). View HTML Comments Modifications first:
Verify none of the FEODEMO comments are present in the page source. View the LazyLoad impact on the Image section:
Scroll down to the FEO Image Demo 1 section. Notice how all image references have image tags (<img>) that have been modified with the class="lazy" attribute.
22. Close Firefox (when done reviewing output and page source for all tabs).
23. Return to the NetScaler Configuration Utility in Chrome.
24. Disable the Integrated Caching and FEO features: Disable Integrated Caching:
Navigate to System > Settings.
Click Configure Basic Features.
Disable (uncheck) Integrated Caching.
Click OK to acknowledge that FEO is still enabled. Click OK. Disable FEO:
Navigate to System > Settings.
Click Configure Advanced Features.
Disable (uncheck) Front End Optimization. Click OK.
25. Save the NetScaler Configuration.
Takeaways:
FEO requires that the Integrated Caching feature is also enabled, as FEO optimized content is stored in a cache content group to allow the NetScaler to apply optimizations or rewrites.
FEO global parameters control the size of CSS, images, and JavaScript content that can be optimized.
Several pre-defined FEO policies and actions are already defined on the NetScaler to achieve pre-configured optimizations for specific content types. Additional custom policies and actions can be defined as required.
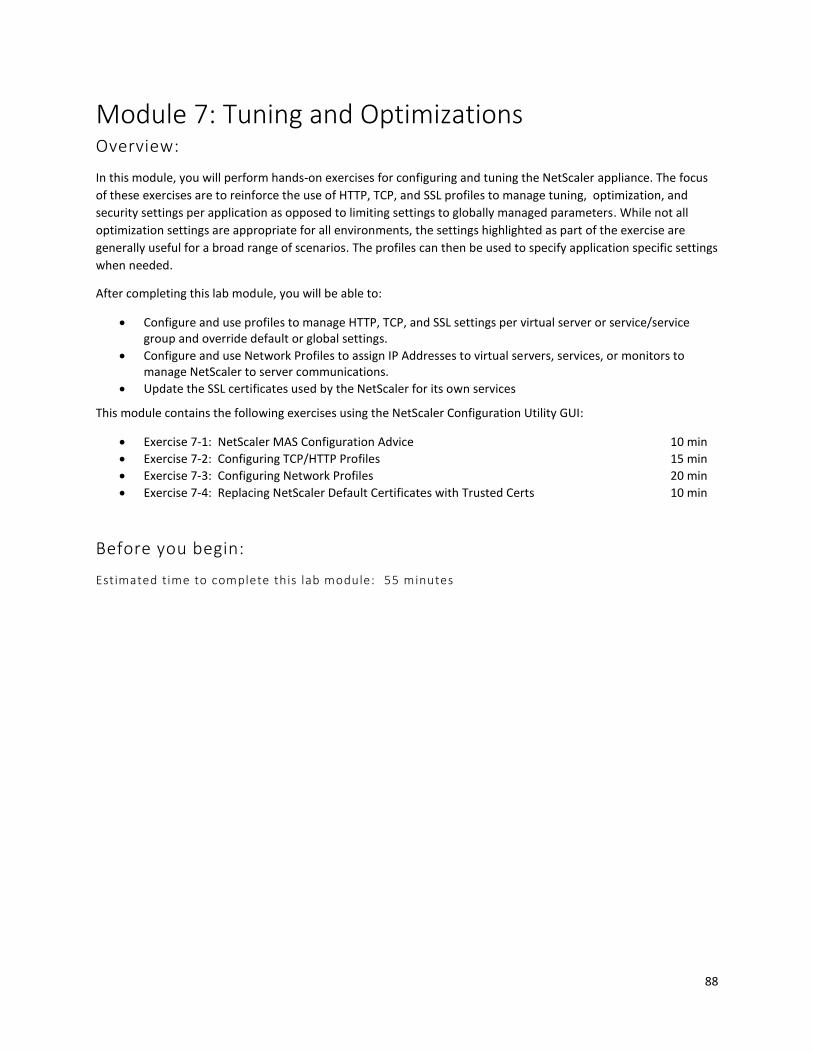
88
Module 7: Tuning and Optimizations Overview:
In this module, you will perform hands-on exercises for configuring and tuning the NetScaler appliance. The focus
of these exercises are to reinforce the use of HTTP, TCP, and SSL profiles to manage tuning, optimization, and
security settings per application as opposed to limiting settings to globally managed parameters. While not all
optimization settings are appropriate for all environments, the settings highlighted as part of the exercise are
generally useful for a broad range of scenarios. The profiles can then be used to specify application specific settings
when needed.
After completing this lab module, you will be able to:
Configure and use profiles to manage HTTP, TCP, and SSL settings per virtual server or service/service group and override default or global settings.
Configure and use Network Profiles to assign IP Addresses to virtual servers, services, or monitors to manage NetScaler to server communications.
Update the SSL certificates used by the NetScaler for its own services
This module contains the following exercises using the NetScaler Configuration Utility GUI:
Exercise 7-1: NetScaler MAS Configuration Advice 10 min
Exercise 7-2: Configuring TCP/HTTP Profiles 15 min
Exercise 7-3: Configuring Network Profiles 20 min
Exercise 7-4: Replacing NetScaler Default Certificates with Trusted Certs 10 min
Before you begin:
Estimated time to complete this lab module: 55 minutes
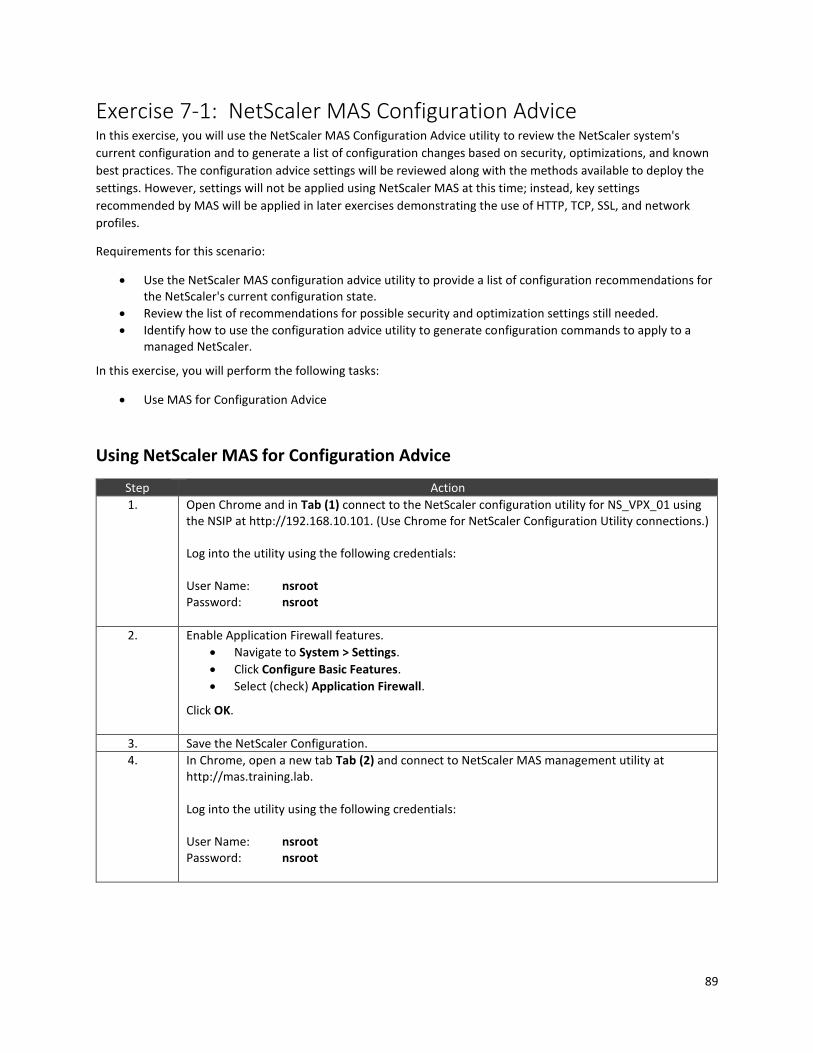
89
Exercise 7-1: NetScaler MAS Configuration Advice In this exercise, you will use the NetScaler MAS Configuration Advice utility to review the NetScaler system's
current configuration and to generate a list of configuration changes based on security, optimizations, and known
best practices. The configuration advice settings will be reviewed along with the methods available to deploy the
settings. However, settings will not be applied using NetScaler MAS at this time; instead, key settings
recommended by MAS will be applied in later exercises demonstrating the use of HTTP, TCP, SSL, and network
profiles.
Requirements for this scenario:
Use the NetScaler MAS configuration advice utility to provide a list of configuration recommendations for the NetScaler's current configuration state.
Review the list of recommendations for possible security and optimization settings still needed.
Identify how to use the configuration advice utility to generate configuration commands to apply to a managed NetScaler.
In this exercise, you will perform the following tasks:
Use MAS for Configuration Advice
Using NetScaler MAS for Configuration Advice
Step Action
1. Open Chrome and in Tab (1) connect to the NetScaler configuration utility for NS_VPX_01 using the NSIP at http://192.168.10.101. (Use Chrome for NetScaler Configuration Utility connections.) Log into the utility using the following credentials: User Name: nsroot Password: nsroot
2. Enable Application Firewall features.
Navigate to System > Settings.
Click Configure Basic Features.
Select (check) Application Firewall.
Click OK.
3. Save the NetScaler Configuration.
4. In Chrome, open a new tab Tab (2) and connect to NetScaler MAS management utility at http://mas.training.lab. Log into the utility using the following credentials: User Name: nsroot Password: nsroot
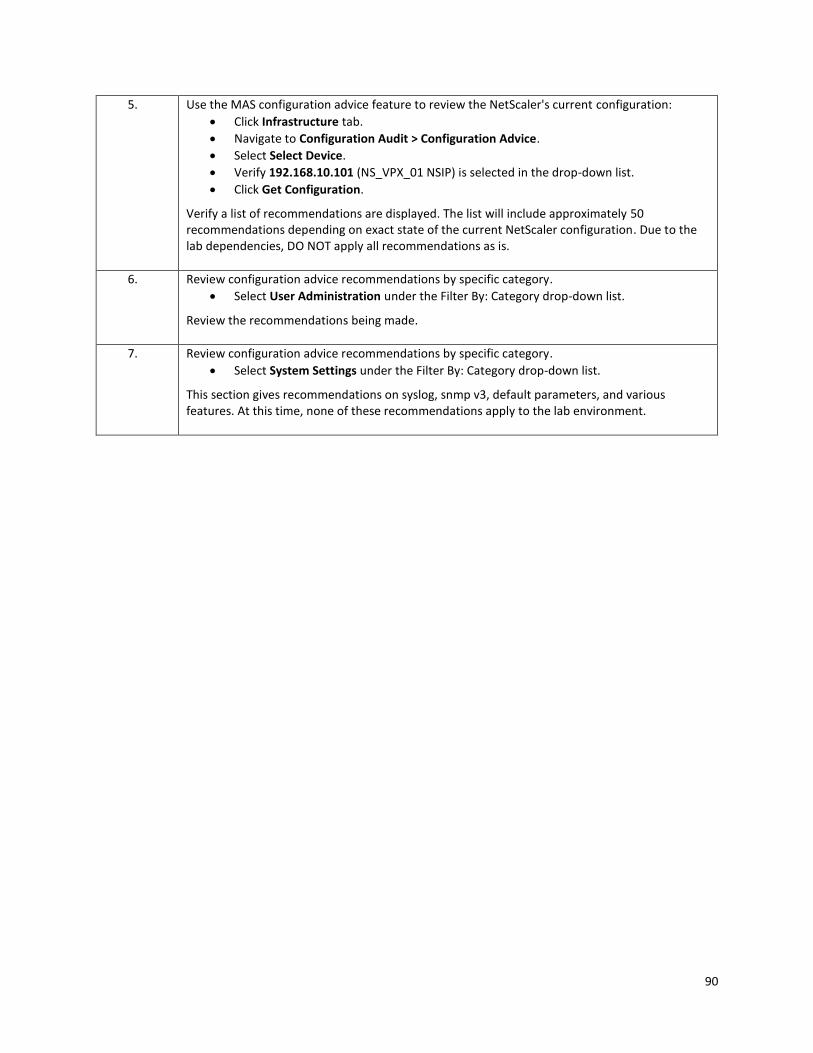
90
5. Use the MAS configuration advice feature to review the NetScaler's current configuration:
Click Infrastructure tab.
Navigate to Configuration Audit > Configuration Advice.
Select Select Device.
Verify 192.168.10.101 (NS_VPX_01 NSIP) is selected in the drop-down list.
Click Get Configuration.
Verify a list of recommendations are displayed. The list will include approximately 50 recommendations depending on exact state of the current NetScaler configuration. Due to the lab dependencies, DO NOT apply all recommendations as is.
6. Review configuration advice recommendations by specific category.
Select User Administration under the Filter By: Category drop-down list.
Review the recommendations being made.
7. Review configuration advice recommendations by specific category.
Select System Settings under the Filter By: Category drop-down list.
This section gives recommendations on syslog, snmp v3, default parameters, and various features. At this time, none of these recommendations apply to the lab environment.
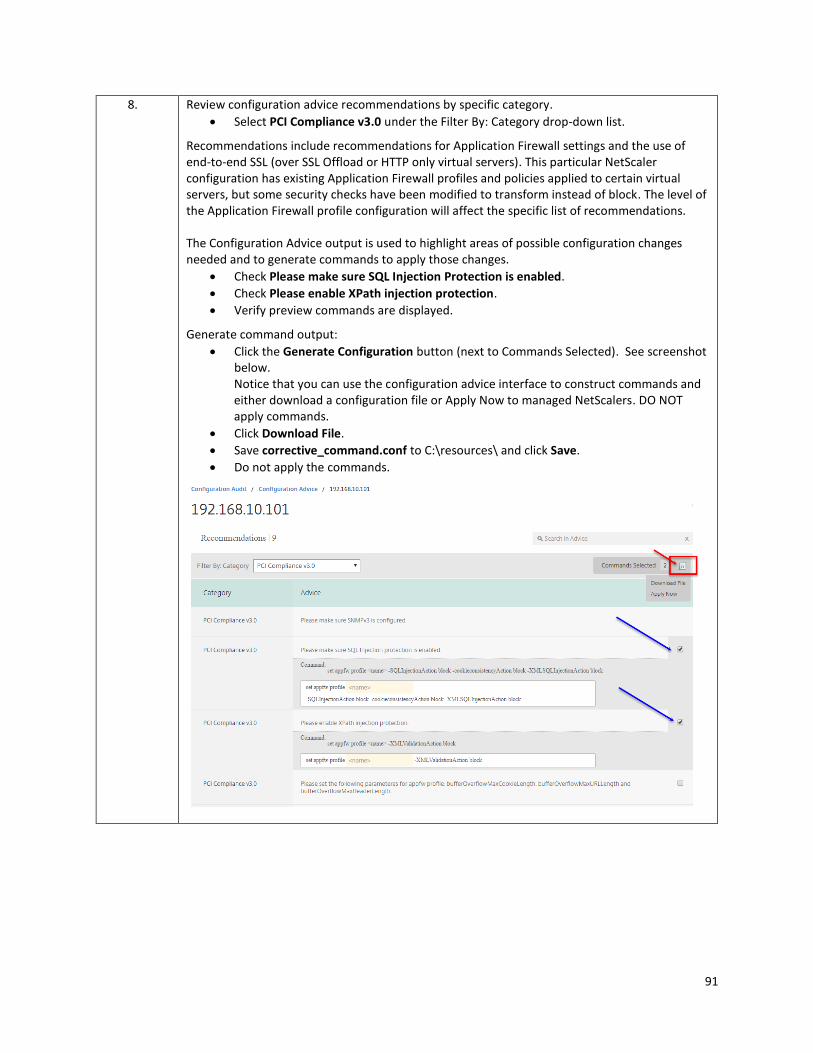
91
8. Review configuration advice recommendations by specific category.
Select PCI Compliance v3.0 under the Filter By: Category drop-down list.
Recommendations include recommendations for Application Firewall settings and the use of end-to-end SSL (over SSL Offload or HTTP only virtual servers). This particular NetScaler configuration has existing Application Firewall profiles and policies applied to certain virtual servers, but some security checks have been modified to transform instead of block. The level of the Application Firewall profile configuration will affect the specific list of recommendations. The Configuration Advice output is used to highlight areas of possible configuration changes needed and to generate commands to apply those changes.
Check Please make sure SQL Injection Protection is enabled.
Check Please enable XPath injection protection.
Verify preview commands are displayed.
Generate command output:
Click the Generate Configuration button (next to Commands Selected). See screenshot below. Notice that you can use the configuration advice interface to construct commands and either download a configuration file or Apply Now to managed NetScalers. DO NOT apply commands.
Click Download File.
Save corrective_command.conf to C:\resources\ and click Save.
Do not apply the commands.
92
9. Review configuration advice recommendations by specific category.
Select Best Practices under the Filter By: Category drop-down list.
Notice that these recommendations address various network and http settings affecting the NetScaler. The recommendations include Windows Scaling, Nagle's Algorithm, Drop invalid HTTP requests, SNMP Alarm recommendations, and Cookie Version (if still set to Version 0). Instead of using MAS to push these settings to the NetScaler. The next exercise will use HTTP and TCP profiles to manage some of the applicable settings.
10. Close the NetScaler MAS management console in Tab (2).
11. Return to Tab (1) for the NetScaler configuration utility.
12. Disable the Application Firewall feature before continuing:
Navigate to System > Settings.
Click Configure Basic Features.
Deselect (uncheck) Application Firewall.
Click OK.
13. Save the NetScaler configuration.
Takeaways:
NetScaler MAS can generate a list of recommended configurations based on the current configuration of a managed NetScaler. Settings identify key requirements for security, system, optimization, and best practices.
NetScaler MAS configuration advice can also be used to generate a configuration file to apply select recommendations or it can be used to directly apply commands to managed NetScalers.
93
Exercise 7-2: Configuring TCP/HTTP/SSL Profiles In this exercise, you will use TCP, HTTP, and SSL profiles to apply specific optimization and tuning settings to
individual virtual servers, in order to override global settings on the NetScaler. The TCP and HTTP profiles provide
granular control of TCP and HTTP parameters that can be used to tune settings per virtual server and/or service to
meet application specific requirements for WAN or LAN networks. The profiles can be used to override global
parameters and provide the ability to manage additional settings not handled by the global parameters.
Please note that the settings in use in this exercise, are generally recommended optimizations for most NetScaler
deployments. However, there may be some exceptions. Please review specific settings for applicability before
deploying in production. Not all settings are suitable for all environments.
The NetScaler has several built-in profiles that are already tuned for specific traffic types and LAN or WAN network
conditions. These existing profiles should be reviewed and used where applicable. Custom profiles can be created
as needed.
In this exercise, you will perform the following tasks:
Create a custom TCP Profile to apply basic optimizations: o Configure Windows Scaling with scaling factor 4 o Enable Selective Acknowledgement o Enable Nagle's Algorithm o Review other settings configurable within TCP Profiles
Create a custom HTTP Profile to apply basic optimizations: o Drop invalid HTTP requests o Mark HTTP/0.9 requests as invalid o Mark CONNECT requests as invalid
Create a custom SSL Profile to manage SSL settings and enforce SSLv3 is disabled.
Additional settings: o Enable support for HTTP/2.0 connections or SPDY protocol support for older clients that don't yet
support HTTP/2.0 connections. o Determine how to identify HTTP/2.0 connections (and therefore optimizations) are in effect.
Use TCP/HTTP Profiles to Apply Optimizations
Step Action
1. Connect to the NetScaler configuration utility for NS_VPX_01 using the NSIP at http://192.168.10.101. (Use Chrome for NetScaler Configuration Utility connections.) Log into the utility using the following credentials: User Name: nsroot Password: nsroot
94
2. Create a new TCP Profile with some basic optimizations and tuning settings for use:
Navigate to System > Profiles.
Click TCP Profiles tab.
Click Add.
Enter tcp_prof_custom1 in the Name field.
Configure settings for the following fields listed. Keep defaults for unspecified fields:
Enable (check) Windows Scaling. o Keep default Window Scaling Factor at 4. o Window Scaling must be tuned for your network and traffic type.
Verify TCP Flavor is set to Default. (This is used to set specific TCP congestion algorithm to use.)
Enable (check) Selective Acknowledgement.
Enable (check) Use Nagle's Algorithm. Click Create. NOTE: These settings will typically work for web traffic (and ICA traffic) in most situations, but are not universally applicable in all situations. The profiles can be used to override global TCP parameters and additional settings that cannot be managed at the global parameter level.
3. Create a custom HTTP profile with some basic optimization settings for use:
Click HTTP Profiles tab.
Click Add.
Enter http_prof_custom1 in the Name field. Configure settings for the following fields listed. Keep defaults for unspecified fields:
Enable (check) Drop invalid HTTP requests.
Enable (check) Mark HTTP/0.9 requests as invalid.
Enable (check) Mark CONNECT requests as invalid. Click Create. NOTE: Additional settings of note not tuned in this profile, include:
Client IP Header Expression which can be used to identify HEADER with client IP address so the NetScaler can extract the source IP. Such as an x-forwarded-for request arriving at the NetScaler
SPDY Protocol support, which will be demonstrated in a later exercise.
HTTP/2 connection support (HTTP 2.0 vs. 1.0 and 1.1 connection support), which will be demonstrated in a later exercise.
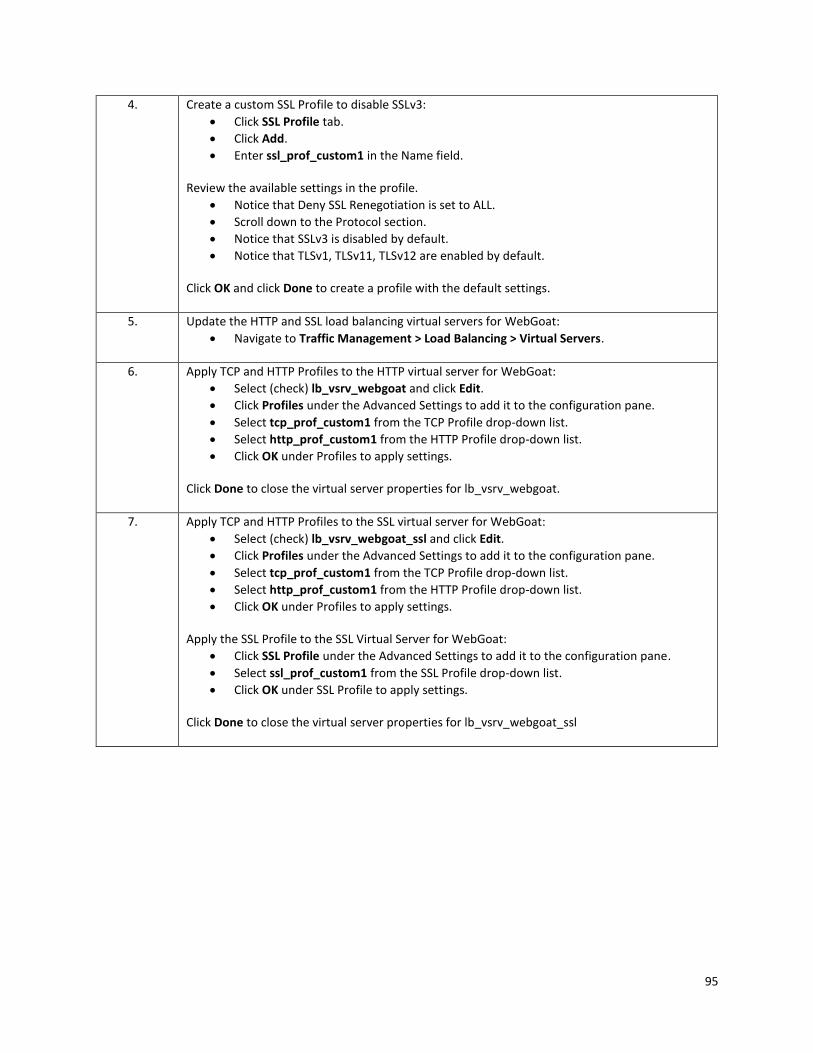
95
4. Create a custom SSL Profile to disable SSLv3:
Click SSL Profile tab.
Click Add.
Enter ssl_prof_custom1 in the Name field. Review the available settings in the profile.
Notice that Deny SSL Renegotiation is set to ALL.
Scroll down to the Protocol section.
Notice that SSLv3 is disabled by default.
Notice that TLSv1, TLSv11, TLSv12 are enabled by default. Click OK and click Done to create a profile with the default settings.
5. Update the HTTP and SSL load balancing virtual servers for WebGoat:
Navigate to Traffic Management > Load Balancing > Virtual Servers.
6. Apply TCP and HTTP Profiles to the HTTP virtual server for WebGoat:
Select (check) lb_vsrv_webgoat and click Edit.
Click Profiles under the Advanced Settings to add it to the configuration pane.
Select tcp_prof_custom1 from the TCP Profile drop-down list.
Select http_prof_custom1 from the HTTP Profile drop-down list.
Click OK under Profiles to apply settings. Click Done to close the virtual server properties for lb_vsrv_webgoat.
7. Apply TCP and HTTP Profiles to the SSL virtual server for WebGoat:
Select (check) lb_vsrv_webgoat_ssl and click Edit.
Click Profiles under the Advanced Settings to add it to the configuration pane.
Select tcp_prof_custom1 from the TCP Profile drop-down list.
Select http_prof_custom1 from the HTTP Profile drop-down list.
Click OK under Profiles to apply settings. Apply the SSL Profile to the SSL Virtual Server for WebGoat:
Click SSL Profile under the Advanced Settings to add it to the configuration pane.
Select ssl_prof_custom1 from the SSL Profile drop-down list.
Click OK under SSL Profile to apply settings. Click Done to close the virtual server properties for lb_vsrv_webgoat_ssl
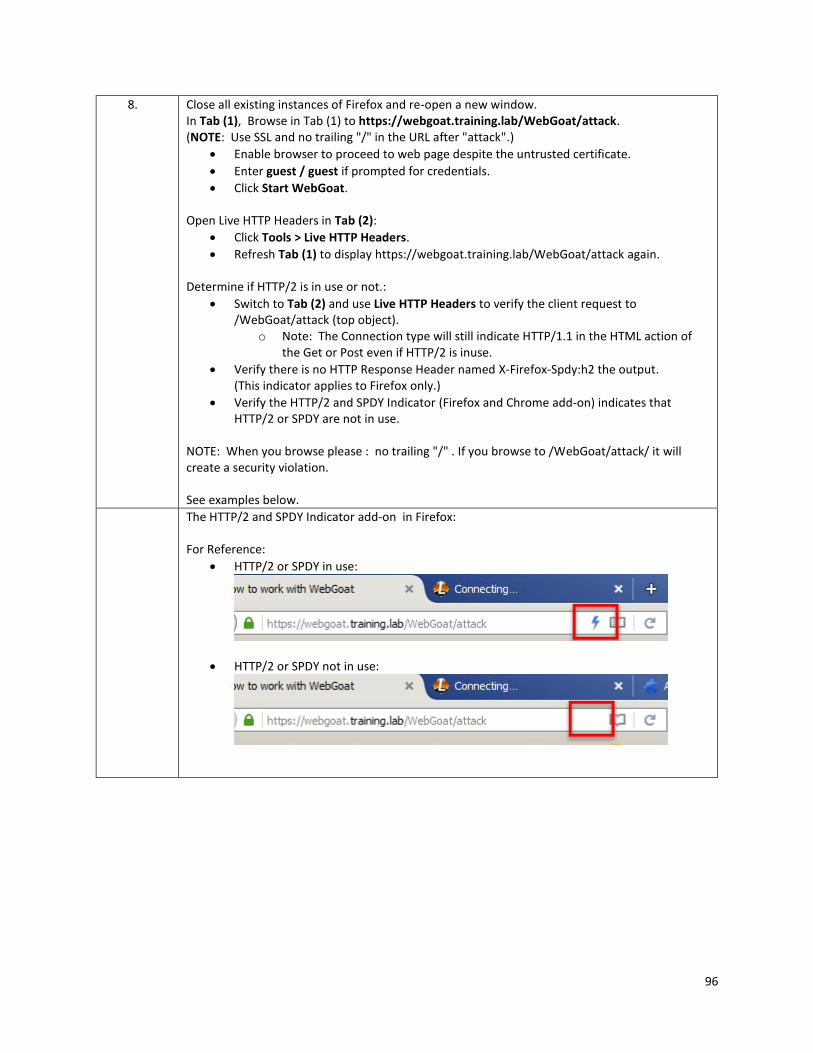
96
8. Close all existing instances of Firefox and re-open a new window. In Tab (1), Browse in Tab (1) to https://webgoat.training.lab/WebGoat/attack. (NOTE: Use SSL and no trailing "/" in the URL after "attack".)
Enable browser to proceed to web page despite the untrusted certificate.
Enter guest / guest if prompted for credentials.
Click Start WebGoat. Open Live HTTP Headers in Tab (2):
Click Tools > Live HTTP Headers.
Refresh Tab (1) to display https://webgoat.training.lab/WebGoat/attack again. Determine if HTTP/2 is in use or not.:
Switch to Tab (2) and use Live HTTP Headers to verify the client request to /WebGoat/attack (top object).
o Note: The Connection type will still indicate HTTP/1.1 in the HTML action of the Get or Post even if HTTP/2 is inuse.
Verify there is no HTTP Response Header named X-Firefox-Spdy:h2 the output. (This indicator applies to Firefox only.)
Verify the HTTP/2 and SPDY Indicator (Firefox and Chrome add-on) indicates that HTTP/2 or SPDY are not in use.
NOTE: When you browse please : no trailing "/" . If you browse to /WebGoat/attack/ it will create a security violation. See examples below.
The HTTP/2 and SPDY Indicator add-on in Firefox: For Reference:
HTTP/2 or SPDY in use:
HTTP/2 or SPDY not in use:
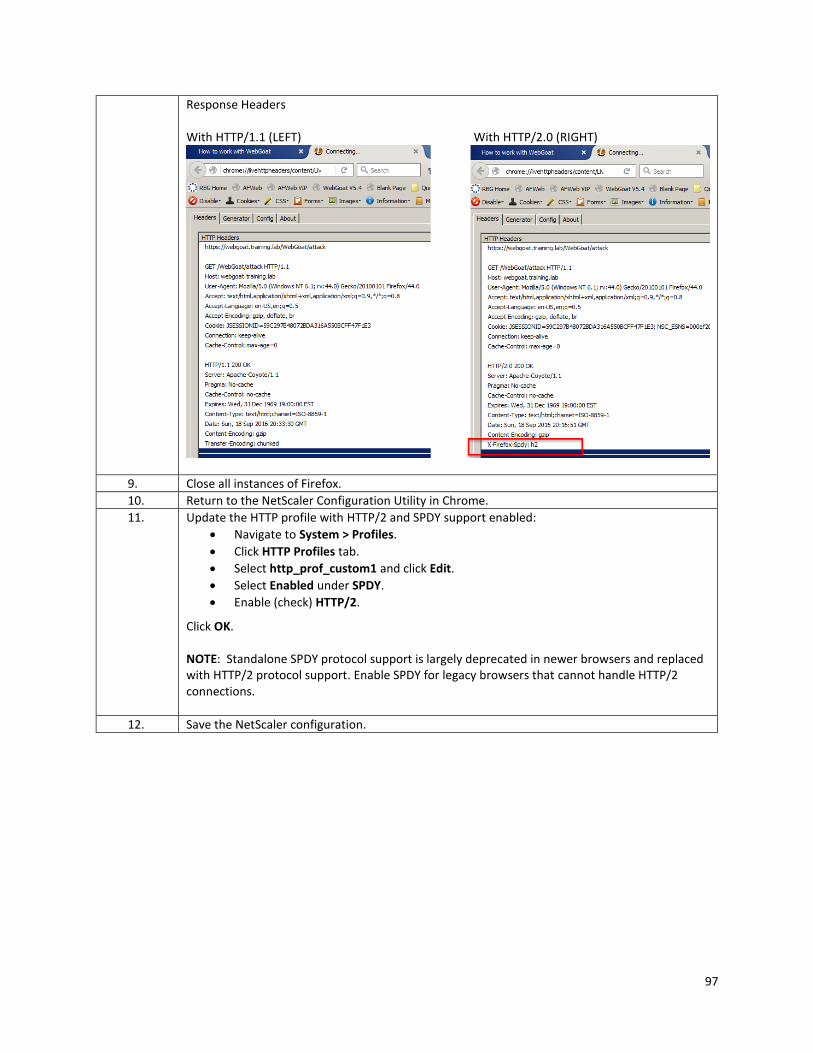
97
Response Headers With HTTP/1.1 (LEFT) With HTTP/2.0 (RIGHT)
9. Close all instances of Firefox.
10. Return to the NetScaler Configuration Utility in Chrome.
11. Update the HTTP profile with HTTP/2 and SPDY support enabled:
Navigate to System > Profiles.
Click HTTP Profiles tab.
Select http_prof_custom1 and click Edit.
Select Enabled under SPDY.
Enable (check) HTTP/2.
Click OK. NOTE: Standalone SPDY protocol support is largely deprecated in newer browsers and replaced with HTTP/2 protocol support. Enable SPDY for legacy browsers that cannot handle HTTP/2 connections.
12. Save the NetScaler configuration.
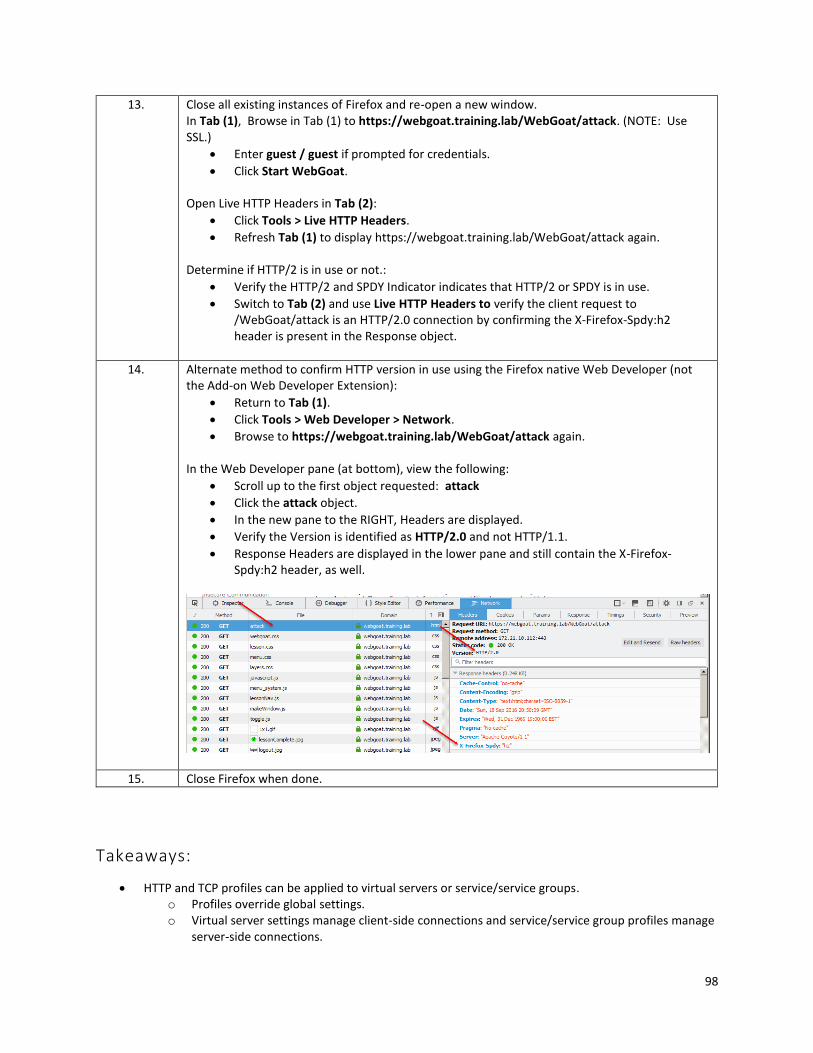
98
13. Close all existing instances of Firefox and re-open a new window. In Tab (1), Browse in Tab (1) to https://webgoat.training.lab/WebGoat/attack. (NOTE: Use SSL.)
Enter guest / guest if prompted for credentials.
Click Start WebGoat. Open Live HTTP Headers in Tab (2):
Click Tools > Live HTTP Headers.
Refresh Tab (1) to display https://webgoat.training.lab/WebGoat/attack again. Determine if HTTP/2 is in use or not.:
Verify the HTTP/2 and SPDY Indicator indicates that HTTP/2 or SPDY is in use.
Switch to Tab (2) and use Live HTTP Headers to verify the client request to /WebGoat/attack is an HTTP/2.0 connection by confirming the X-Firefox-Spdy:h2 header is present in the Response object.
14. Alternate method to confirm HTTP version in use using the Firefox native Web Developer (not the Add-on Web Developer Extension):
Return to Tab (1).
Click Tools > Web Developer > Network.
Browse to https://webgoat.training.lab/WebGoat/attack again. In the Web Developer pane (at bottom), view the following:
Scroll up to the first object requested: attack
Click the attack object.
In the new pane to the RIGHT, Headers are displayed.
Verify the Version is identified as HTTP/2.0 and not HTTP/1.1.
Response Headers are displayed in the lower pane and still contain the X-Firefox-Spdy:h2 header, as well.
15. Close Firefox when done.
Takeaways:
HTTP and TCP profiles can be applied to virtual servers or service/service groups. o Profiles override global settings. o Virtual server settings manage client-side connections and service/service group profiles manage
server-side connections.

99
o If no service-side profiles are specified, virtual server profiles are in use. o If no virtual server profiles are specified, global parameters are used.
SSL Profiles provide granular control of SSL parameters and can be applied to virtual server or service/service groups as needed.
100
Exercise 7-3: Configuring Network Profiles In this exercise, you will use Network profiles to assign unique IP addresses for NetScaler traffic for a specific
virtual server in order to separate its traffic from the default SNIP that is assigned. To demonstrate the use of net
profiles to assign IP addresses, one net profile will be assigned to a load balancing virtual server and a second net
profile will be assigned for use with service monitors.
A network trace will be generated using the nstrace command and the results viewed to confirm which source IP
addresses are assigned for NetScaler-to-server communication.
Requirements for this scenario:
Traffic for AFWeb, WebGoat, and any other non-specified traffic on the NetScaler should continue using the default SNIP.
Application traffic for the RBG virtual server will be assigned a unique IP address for NetScaler-to-server communication using 192.168.10.104.
Monitor traffic for the RBG services will be assigned a unique IP address for NetScaler-to-server communication using 192.168.10.105.
Confirm the results with a network trace.
In this exercise, you will perform the following tasks:
Create and bind two Net Profiles for each of the custom IP Addresses.
Generate a network trace to verify the configuration.
Create Net Profiles
Step Action
1. Connect to the NetScaler configuration utility for NS_VPX_01 using the NSIP at http://192.168.10.101. (Use Chrome for NetScaler Configuration Utility connections.) Log into the utility using the following credentials: User Name: nsroot Password: nsroot
101
2. Create additional VIPs on the NetScaler:
Navigate to System > Network > IPs.
Click Add.
Add new VIP (1):
Enter 192.168.10.104 in the IP Address field.
Enter 255.255.255.255 in the Netmask field.
Select Virtual IP in the IP Type field.
Disable (uncheck) Enable Management Access control. Click Yes to confirm.
Click Create.
Add new VIP(2):
Enter 192.168.10.105 in the IP Address field.
Enter 255.255.255.255 in the Netmask field.
Select Virtual IP in the IP Type field.
Disable (uncheck) Enable Access Management control. Click Yes to confirm.
Click Create.
3. Create a Net Profile using the VIP (1) address 192.168.10.104:
Navigate to System > Network > Net Profiles.
Click Add.
Enter net_prof_rbgweb_from104 in the Name field.
Select 192.168.10.104 from the IP Address drop-down list.
Click OK. Click OK and click Done.
4. Create a Net Profile using the VIP(2) address 192.168.10.105:
Click Add.
Enter net_prof_rbgmon_from105 in the Name field.
Select 192.168.10.105 from the IP Address drop-down list.
Click OK. Click OK and click Done.
5. Create a monitor for RBG using the Net Profile:
Navigate to Traffic Management > Load Balancing > Monitors.
Click Add.
Enter mon_rbg_http in the Name field.
Select HTTP in the Type field.
Configure the following parameter on the Standard Parameters tab:
Click Standard Parameters tab.
Select net_prof_rbgmon_from105 under Net Profile (at bottom).
Configure the following parameter on the Special Parameters tab:
Click Special Parameters tab.
Verify HEAD / is entered in the HTTP Request field.
Verify 200 is listed in the Response Codes field.
Click Create.
102
6. Bind monitor to svc_red:
Navigate to Traffic Management > Load Balancing > Services.
Select (check) svc_red and click Edit.
Click Service to Load Balancing Monitor Binding under Monitors.
Click Add Binding.
Click Click to Select under Select Monitor.
Select mon_rbg_http and click Select.
Click Bind and click Close.
Click Done. Bind monitor to svc_blue:
Select (check) svc_blue and click Edit.
Click Service to Load Balancing Monitor Binding under Monitors.
Click Add Binding.
Click Click to Select under Select Monitor.
Select mon_rbg_http and click Select.
Click Bind and click Close.
Click Done. Bind monitor to svc_green:
Select (check) svc_green and click Edit.
Click Service to Load Balancing Monitor Binding under Monitors.
Click Add Binding.
Click Click to Select under Select Monitor.
Select mon_rbg_http and click Select.
Click Bind and click Close.
Click Done.
7. Bind the Net Profile to the RBG load balancing virtual server:
Navigate to Traffic Management > Load Balancing > Virtual Servers.
Select lb_vsrv_rbg and click Edit.
Click Profiles under the Advanced Settings to add the category to the configuration area.
Select net_prof_rbgweb_from104 under Net Profile.
Click OK under the Profiles category.
Click Done.
8. Save the NetScaler configuration.
Generate a Network Trace using NSTrace to View IPs In Use
Step Action
103
1. Connect to the NetScaler configuration utility for NS_VPX_01 using the NSIP at http://192.168.10.101. (Use Chrome for NetScaler Configuration Utility connections.) Log into the utility using the following credentials: User Name: nsroot Password: nsroot
2. Start the NetScaler Trace:
Navigate to System > Diagnostics.
Click Start New Trace under Technical Support Tools.
Configure Trace with the following parameters:
Enter 0 in the Packet Size field.
Enable (check) Capture Trace in .PCAP format.
Enter the following expression in the Filter Expression field. Enter the expression manually or use the Expression Editor. (See Note below.) CONNECTION.IP.EQ(192.168.10.111)||CONNECTION.IP.EQ(192.168.
10.104)||CONNECTION.IP.EQ(192.168.10.105)
Enable (check) Trace Filtered connection's peer traffic.
Enable (check) Skip RPC.
Click Start and click OK. This expression is intended to capture any traffic using the SNIP or the VIPs associated with the net profiles regardless of whether the IP address is in the source or destination header of the packet. NOTE: When configuring the Expression in the Filter Expression field, ensure there are NO SPACES between the rules and the OR operator ("||"). While other advanced expressions can include spaces, the Trace screen treats this as an expression syntax error and will generate an error when starting the trace.
3. Switch to Firefox and generate test data:
Browse to http://rbg.training.lab/blue.php. Refresh 3 times.
Browse to http://afweb.training.lab/allow.demo. Refresh 3 times.
Browse to http://rbg.training.lab/blue.php. Refresh 3 times.
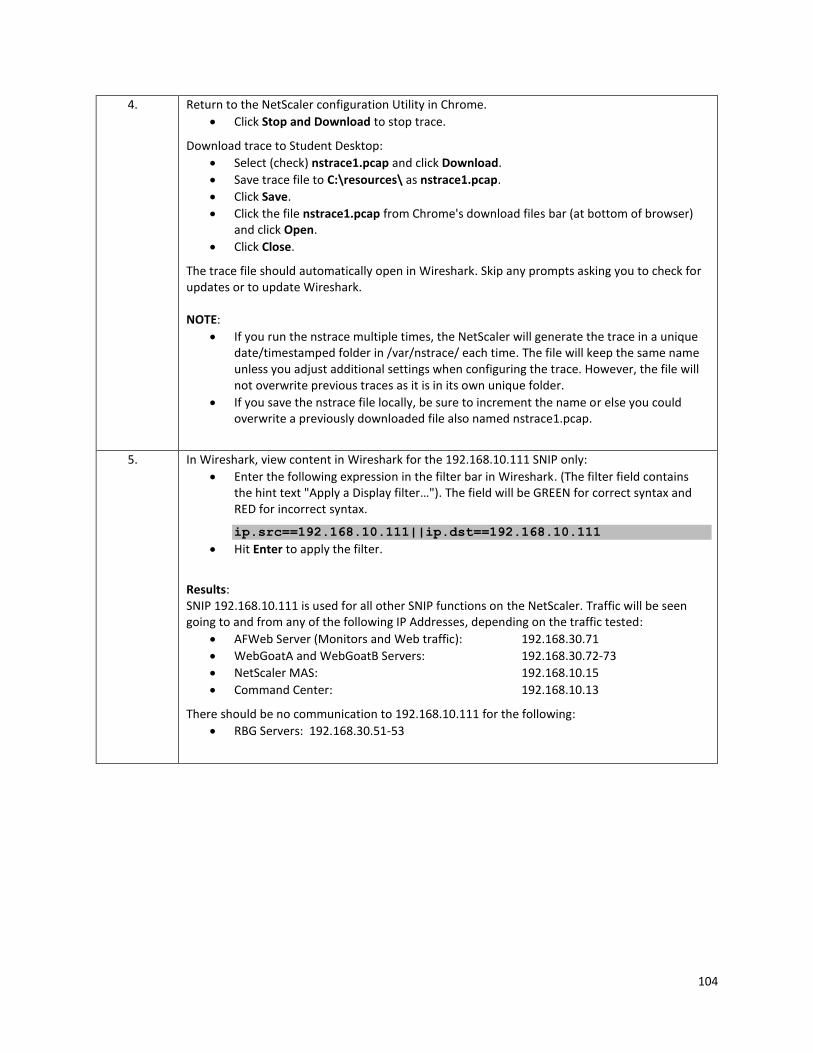
104
4. Return to the NetScaler configuration Utility in Chrome.
Click Stop and Download to stop trace.
Download trace to Student Desktop:
Select (check) nstrace1.pcap and click Download.
Save trace file to C:\resources\ as nstrace1.pcap.
Click Save.
Click the file nstrace1.pcap from Chrome's download files bar (at bottom of browser) and click Open.
Click Close.
The trace file should automatically open in Wireshark. Skip any prompts asking you to check for updates or to update Wireshark. NOTE:
If you run the nstrace multiple times, the NetScaler will generate the trace in a unique date/timestamped folder in /var/nstrace/ each time. The file will keep the same name unless you adjust additional settings when configuring the trace. However, the file will not overwrite previous traces as it is in its own unique folder.
If you save the nstrace file locally, be sure to increment the name or else you could overwrite a previously downloaded file also named nstrace1.pcap.
5. In Wireshark, view content in Wireshark for the 192.168.10.111 SNIP only:
Enter the following expression in the filter bar in Wireshark. (The filter field contains the hint text "Apply a Display filter…"). The field will be GREEN for correct syntax and RED for incorrect syntax.
ip.src==192.168.10.111||ip.dst==192.168.10.111
Hit Enter to apply the filter.
Results: SNIP 192.168.10.111 is used for all other SNIP functions on the NetScaler. Traffic will be seen going to and from any of the following IP Addresses, depending on the traffic tested:
AFWeb Server (Monitors and Web traffic): 192.168.30.71
WebGoatA and WebGoatB Servers: 192.168.30.72-73
NetScaler MAS: 192.168.10.15
Command Center: 192.168.10.13
There should be no communication to 192.168.10.111 for the following:
RBG Servers: 192.168.30.51-53
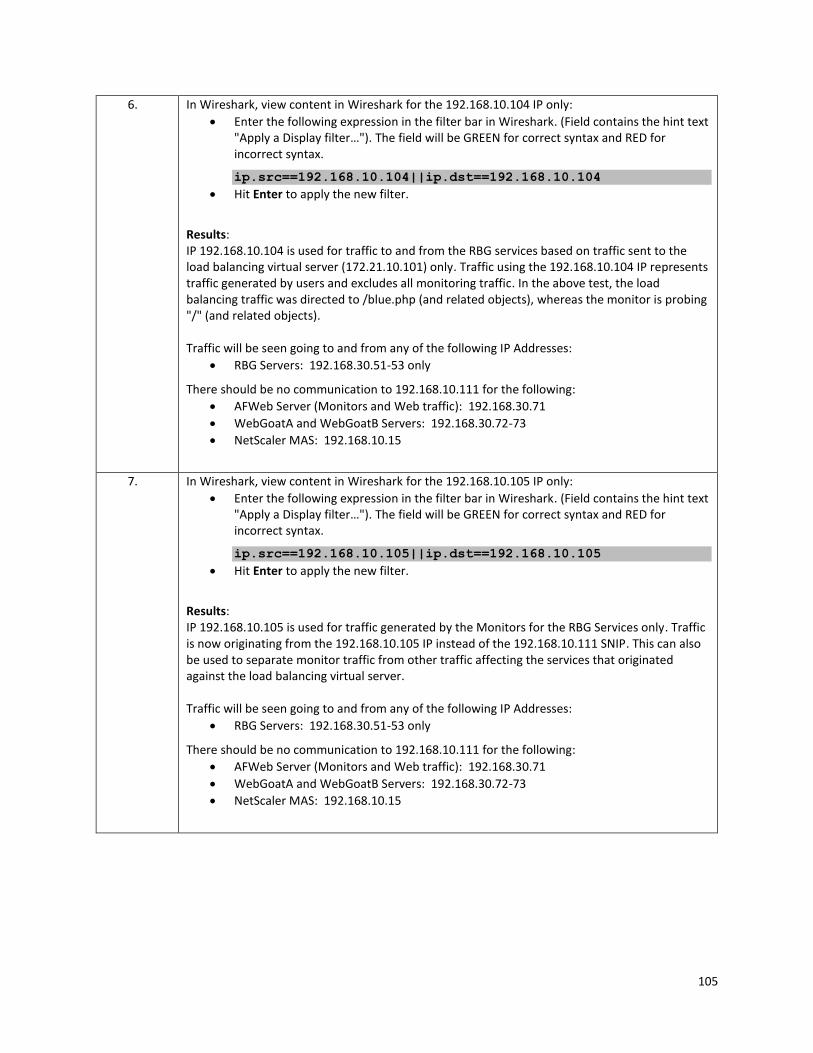
105
6. In Wireshark, view content in Wireshark for the 192.168.10.104 IP only:
Enter the following expression in the filter bar in Wireshark. (Field contains the hint text "Apply a Display filter…"). The field will be GREEN for correct syntax and RED for incorrect syntax.
ip.src==192.168.10.104||ip.dst==192.168.10.104
Hit Enter to apply the new filter.
Results: IP 192.168.10.104 is used for traffic to and from the RBG services based on traffic sent to the load balancing virtual server (172.21.10.101) only. Traffic using the 192.168.10.104 IP represents traffic generated by users and excludes all monitoring traffic. In the above test, the load balancing traffic was directed to /blue.php (and related objects), whereas the monitor is probing "/" (and related objects). Traffic will be seen going to and from any of the following IP Addresses:
RBG Servers: 192.168.30.51-53 only
There should be no communication to 192.168.10.111 for the following:
AFWeb Server (Monitors and Web traffic): 192.168.30.71
WebGoatA and WebGoatB Servers: 192.168.30.72-73
NetScaler MAS: 192.168.10.15
7. In Wireshark, view content in Wireshark for the 192.168.10.105 IP only:
Enter the following expression in the filter bar in Wireshark. (Field contains the hint text "Apply a Display filter…"). The field will be GREEN for correct syntax and RED for incorrect syntax.
ip.src==192.168.10.105||ip.dst==192.168.10.105
Hit Enter to apply the new filter.
Results: IP 192.168.10.105 is used for traffic generated by the Monitors for the RBG Services only. Traffic is now originating from the 192.168.10.105 IP instead of the 192.168.10.111 SNIP. This can also be used to separate monitor traffic from other traffic affecting the services that originated against the load balancing virtual server. Traffic will be seen going to and from any of the following IP Addresses:
RBG Servers: 192.168.30.51-53 only
There should be no communication to 192.168.10.111 for the following:
AFWeb Server (Monitors and Web traffic): 192.168.30.71
WebGoatA and WebGoatB Servers: 192.168.30.72-73
NetScaler MAS: 192.168.10.15
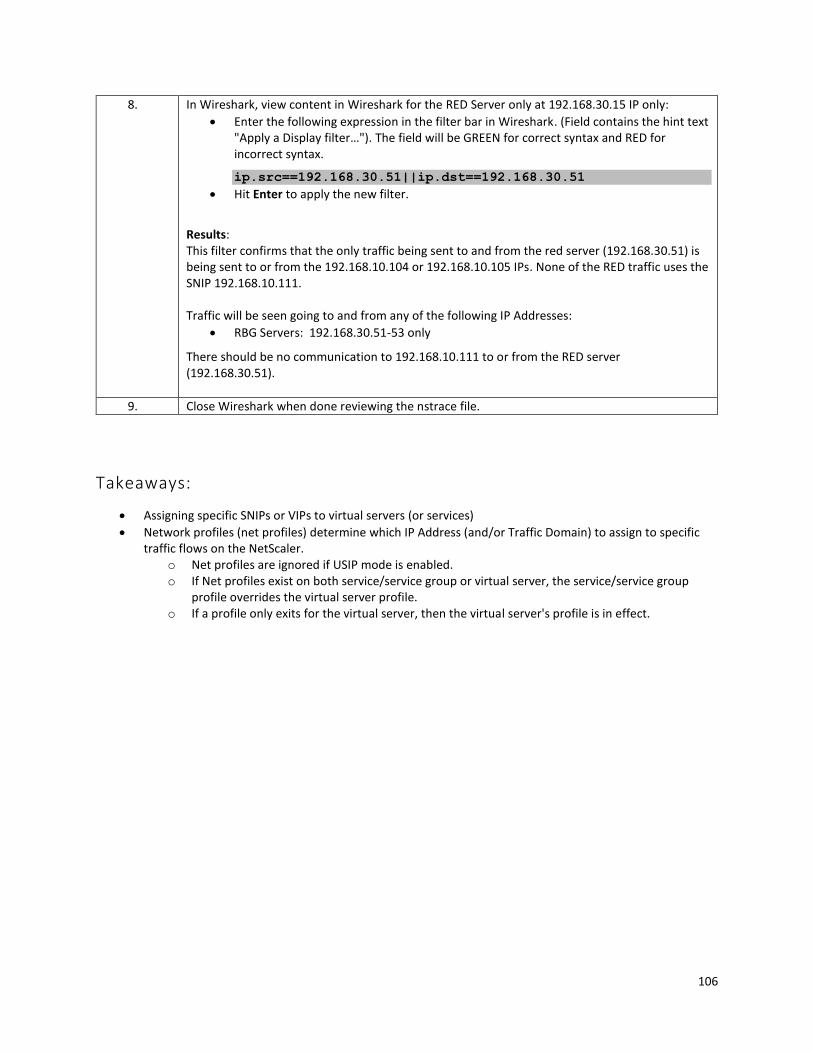
106
8. In Wireshark, view content in Wireshark for the RED Server only at 192.168.30.15 IP only:
Enter the following expression in the filter bar in Wireshark. (Field contains the hint text "Apply a Display filter…"). The field will be GREEN for correct syntax and RED for incorrect syntax.
ip.src==192.168.30.51||ip.dst==192.168.30.51
Hit Enter to apply the new filter.
Results: This filter confirms that the only traffic being sent to and from the red server (192.168.30.51) is being sent to or from the 192.168.10.104 or 192.168.10.105 IPs. None of the RED traffic uses the SNIP 192.168.10.111. Traffic will be seen going to and from any of the following IP Addresses:
RBG Servers: 192.168.30.51-53 only
There should be no communication to 192.168.10.111 to or from the RED server (192.168.30.51).
9. Close Wireshark when done reviewing the nstrace file.
Takeaways:
Assigning specific SNIPs or VIPs to virtual servers (or services)
Network profiles (net profiles) determine which IP Address (and/or Traffic Domain) to assign to specific traffic flows on the NetScaler.
o Net profiles are ignored if USIP mode is enabled. o If Net profiles exist on both service/service group or virtual server, the service/service group
profile overrides the virtual server profile. o If a profile only exits for the virtual server, then the virtual server's profile is in effect.
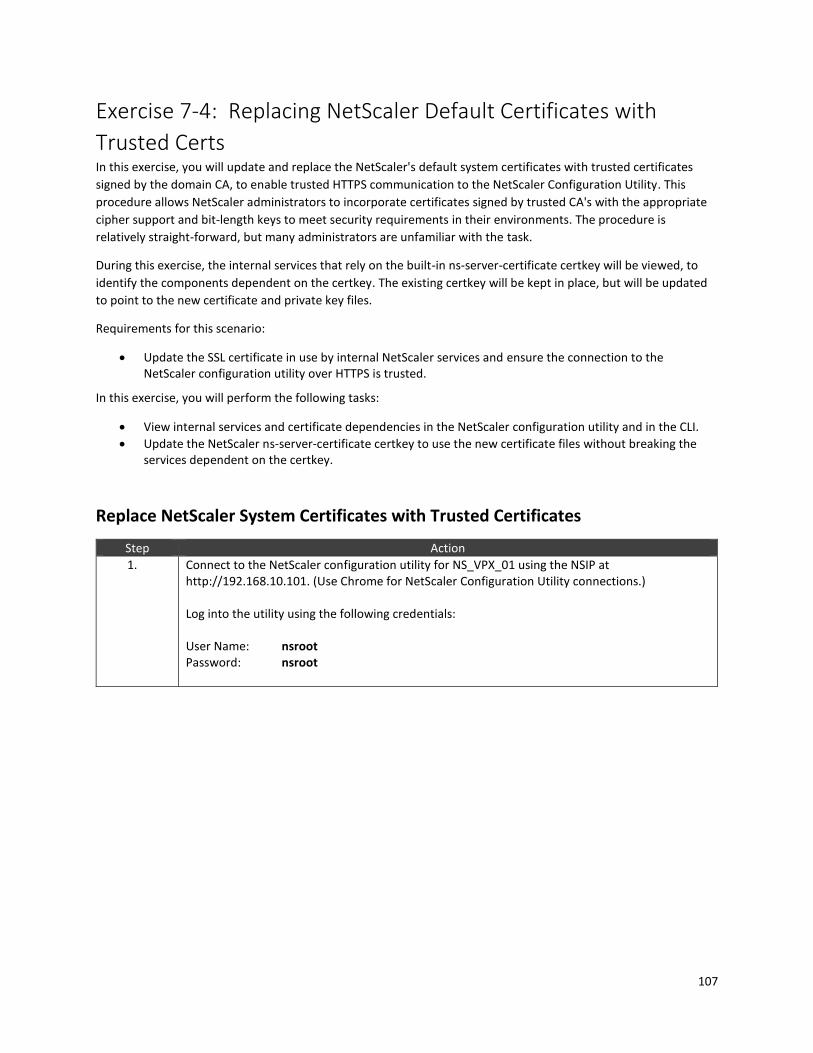
107
Exercise 7-4: Replacing NetScaler Default Certificates with
Trusted Certs In this exercise, you will update and replace the NetScaler's default system certificates with trusted certificates
signed by the domain CA, to enable trusted HTTPS communication to the NetScaler Configuration Utility. This
procedure allows NetScaler administrators to incorporate certificates signed by trusted CA's with the appropriate
cipher support and bit-length keys to meet security requirements in their environments. The procedure is
relatively straight-forward, but many administrators are unfamiliar with the task.
During this exercise, the internal services that rely on the built-in ns-server-certificate certkey will be viewed, to
identify the components dependent on the certkey. The existing certkey will be kept in place, but will be updated
to point to the new certificate and private key files.
Requirements for this scenario:
Update the SSL certificate in use by internal NetScaler services and ensure the connection to the NetScaler configuration utility over HTTPS is trusted.
In this exercise, you will perform the following tasks:
View internal services and certificate dependencies in the NetScaler configuration utility and in the CLI.
Update the NetScaler ns-server-certificate certkey to use the new certificate files without breaking the services dependent on the certkey.
Replace NetScaler System Certificates with Trusted Certificates
Step Action
1. Connect to the NetScaler configuration utility for NS_VPX_01 using the NSIP at http://192.168.10.101. (Use Chrome for NetScaler Configuration Utility connections.) Log into the utility using the following credentials: User Name: nsroot Password: nsroot
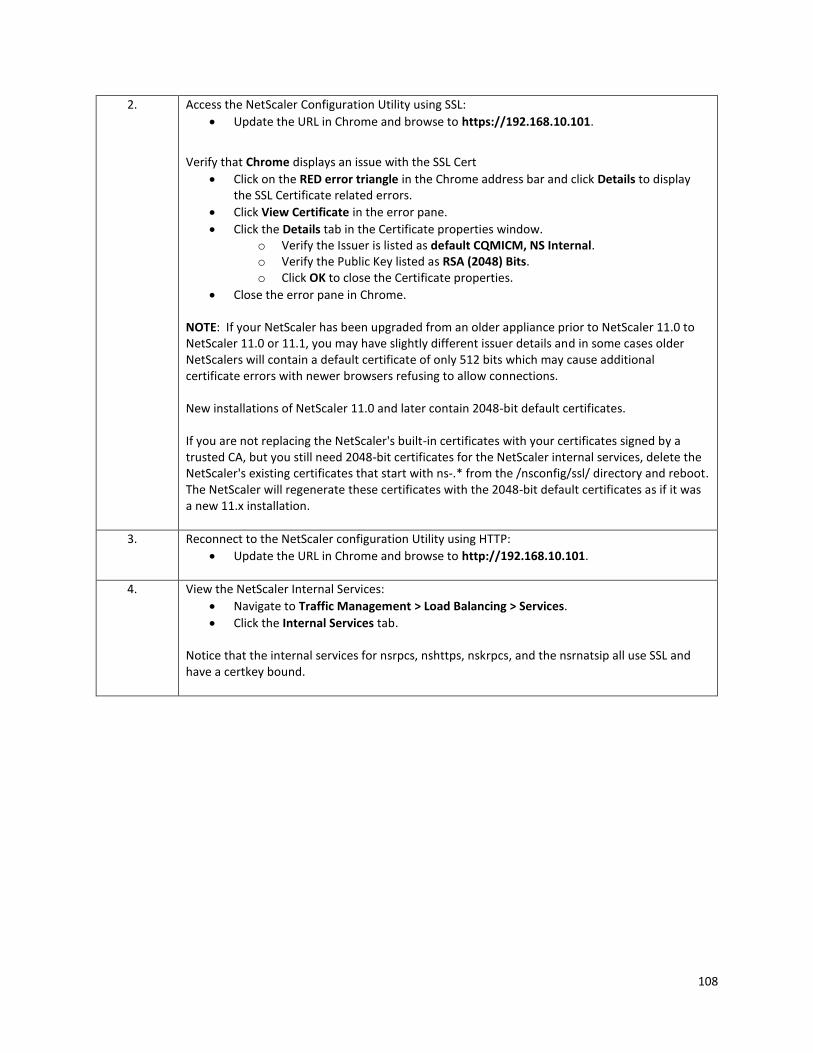
108
2. Access the NetScaler Configuration Utility using SSL:
Update the URL in Chrome and browse to https://192.168.10.101.
Verify that Chrome displays an issue with the SSL Cert
Click on the RED error triangle in the Chrome address bar and click Details to display the SSL Certificate related errors.
Click View Certificate in the error pane.
Click the Details tab in the Certificate properties window. o Verify the Issuer is listed as default CQMICM, NS Internal. o Verify the Public Key listed as RSA (2048) Bits. o Click OK to close the Certificate properties.
Close the error pane in Chrome. NOTE: If your NetScaler has been upgraded from an older appliance prior to NetScaler 11.0 to NetScaler 11.0 or 11.1, you may have slightly different issuer details and in some cases older NetScalers will contain a default certificate of only 512 bits which may cause additional certificate errors with newer browsers refusing to allow connections. New installations of NetScaler 11.0 and later contain 2048-bit default certificates. If you are not replacing the NetScaler's built-in certificates with your certificates signed by a trusted CA, but you still need 2048-bit certificates for the NetScaler internal services, delete the NetScaler's existing certificates that start with ns-.* from the /nsconfig/ssl/ directory and reboot. The NetScaler will regenerate these certificates with the 2048-bit default certificates as if it was a new 11.x installation.
3. Reconnect to the NetScaler configuration Utility using HTTP:
Update the URL in Chrome and browse to http://192.168.10.101.
4. View the NetScaler Internal Services:
Navigate to Traffic Management > Load Balancing > Services.
Click the Internal Services tab. Notice that the internal services for nsrpcs, nshttps, nskrpcs, and the nsrnatsip all use SSL and have a certkey bound.
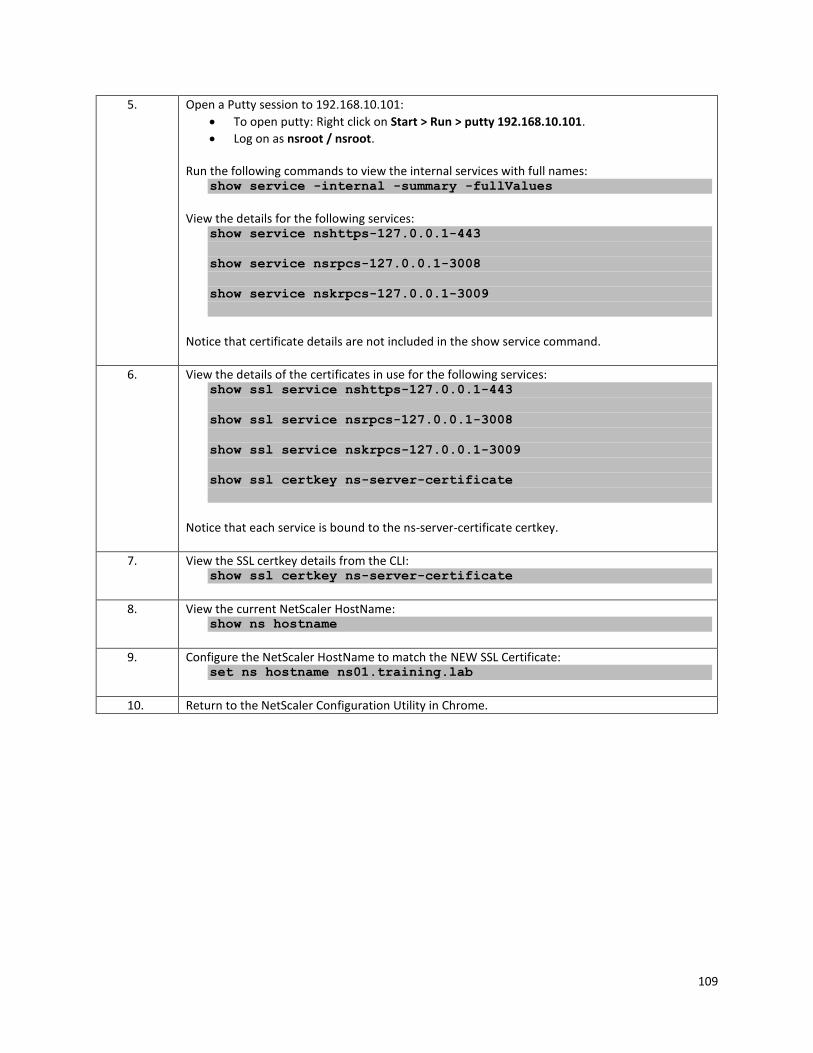
109
5. Open a Putty session to 192.168.10.101:
To open putty: Right click on Start > Run > putty 192.168.10.101.
Log on as nsroot / nsroot. Run the following commands to view the internal services with full names:
show service -internal -summary -fullValues
View the details for the following services:
show service nshttps-127.0.0.1-443
show service nsrpcs-127.0.0.1-3008
show service nskrpcs-127.0.0.1-3009
Notice that certificate details are not included in the show service command.
6. View the details of the certificates in use for the following services: show ssl service nshttps-127.0.0.1-443
show ssl service nsrpcs-127.0.0.1-3008
show ssl service nskrpcs-127.0.0.1-3009
show ssl certkey ns-server-certificate
Notice that each service is bound to the ns-server-certificate certkey.
7. View the SSL certkey details from the CLI: show ssl certkey ns-server-certificate
8. View the current NetScaler HostName: show ns hostname
9. Configure the NetScaler HostName to match the NEW SSL Certificate: set ns hostname ns01.training.lab
10. Return to the NetScaler Configuration Utility in Chrome.
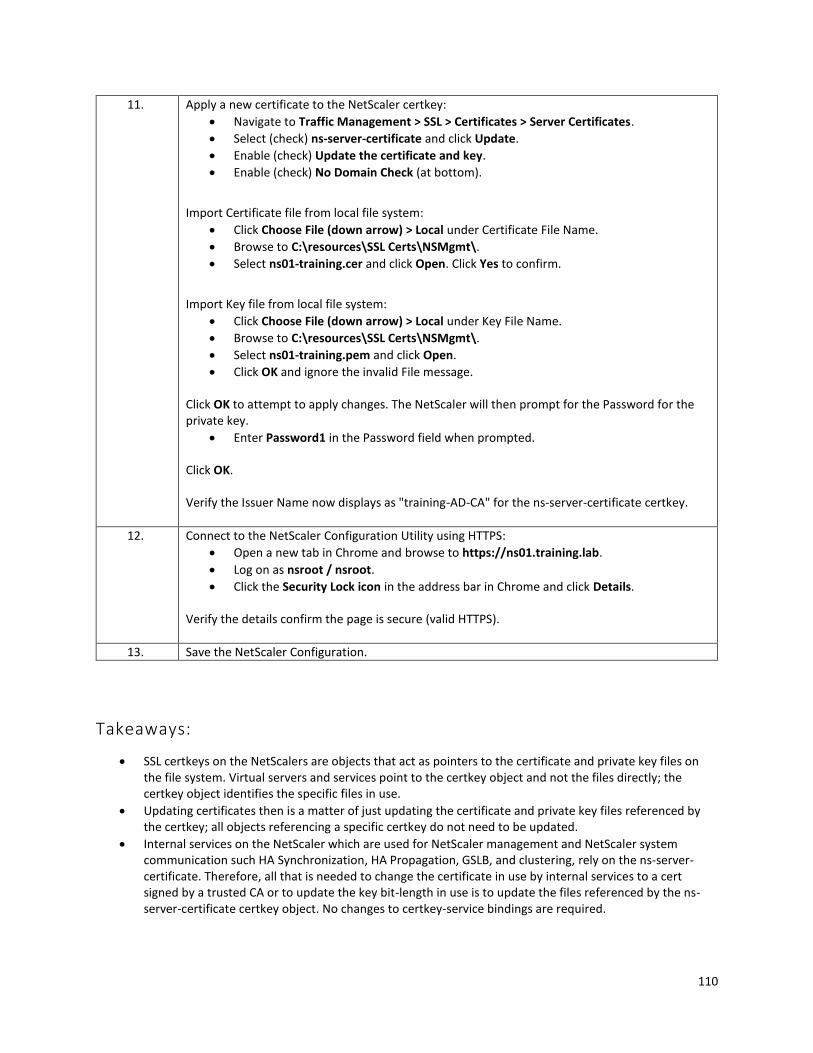
110
11. Apply a new certificate to the NetScaler certkey:
Navigate to Traffic Management > SSL > Certificates > Server Certificates.
Select (check) ns-server-certificate and click Update.
Enable (check) Update the certificate and key.
Enable (check) No Domain Check (at bottom).
Import Certificate file from local file system:
Click Choose File (down arrow) > Local under Certificate File Name.
Browse to C:\resources\SSL Certs\NSMgmt\.
Select ns01-training.cer and click Open. Click Yes to confirm.
Import Key file from local file system:
Click Choose File (down arrow) > Local under Key File Name.
Browse to C:\resources\SSL Certs\NSMgmt\.
Select ns01-training.pem and click Open.
Click OK and ignore the invalid File message. Click OK to attempt to apply changes. The NetScaler will then prompt for the Password for the private key.
Enter Password1 in the Password field when prompted. Click OK. Verify the Issuer Name now displays as "training-AD-CA" for the ns-server-certificate certkey.
12. Connect to the NetScaler Configuration Utility using HTTPS:
Open a new tab in Chrome and browse to https://ns01.training.lab.
Log on as nsroot / nsroot.
Click the Security Lock icon in the address bar in Chrome and click Details. Verify the details confirm the page is secure (valid HTTPS).
13. Save the NetScaler Configuration.
Takeaways:
SSL certkeys on the NetScalers are objects that act as pointers to the certificate and private key files on the file system. Virtual servers and services point to the certkey object and not the files directly; the certkey object identifies the specific files in use.
Updating certificates then is a matter of just updating the certificate and private key files referenced by the certkey; all objects referencing a specific certkey do not need to be updated.
Internal services on the NetScaler which are used for NetScaler management and NetScaler system communication such HA Synchronization, HA Propagation, GSLB, and clustering, rely on the ns-server-certificate. Therefore, all that is needed to change the certificate in use by internal services to a cert signed by a trusted CA or to update the key bit-length in use is to update the files referenced by the ns-server-certificate certkey object. No changes to certkey-service bindings are required.
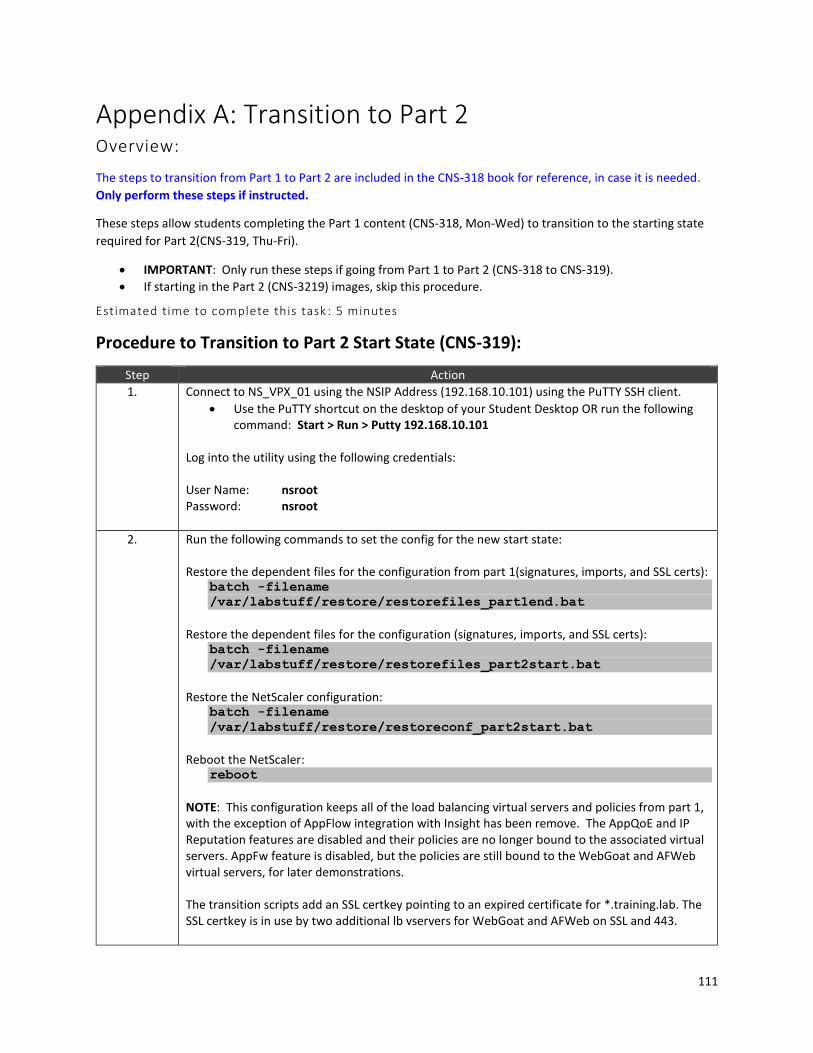
111
Appendix A: Transition to Part 2 Overview:
The steps to transition from Part 1 to Part 2 are included in the CNS-318 book for reference, in case it is needed.
Only perform these steps if instructed.
These steps allow students completing the Part 1 content (CNS-318, Mon-Wed) to transition to the starting state
required for Part 2(CNS-319, Thu-Fri).
IMPORTANT: Only run these steps if going from Part 1 to Part 2 (CNS-318 to CNS-319).
If starting in the Part 2 (CNS-3219) images, skip this procedure.
Estimated time to complete this task : 5 minutes
Procedure to Transition to Part 2 Start State (CNS-319):
Step Action
1. Connect to NS_VPX_01 using the NSIP Address (192.168.10.101) using the PuTTY SSH client.
Use the PuTTY shortcut on the desktop of your Student Desktop OR run the following command: Start > Run > Putty 192.168.10.101
Log into the utility using the following credentials: User Name: nsroot Password: nsroot
2. Run the following commands to set the config for the new start state: Restore the dependent files for the configuration from part 1(signatures, imports, and SSL certs):
batch -filename
/var/labstuff/restore/restorefiles_part1end.bat
Restore the dependent files for the configuration (signatures, imports, and SSL certs):
batch -filename
/var/labstuff/restore/restorefiles_part2start.bat
Restore the NetScaler configuration:
batch -filename
/var/labstuff/restore/restoreconf_part2start.bat
Reboot the NetScaler:
reboot
NOTE: This configuration keeps all of the load balancing virtual servers and policies from part 1, with the exception of AppFlow integration with Insight has been remove. The AppQoE and IP Reputation features are disabled and their policies are no longer bound to the associated virtual servers. AppFw feature is disabled, but the policies are still bound to the WebGoat and AFWeb virtual servers, for later demonstrations. The transition scripts add an SSL certkey pointing to an expired certificate for *.training.lab. The SSL certkey is in use by two additional lb vservers for WebGoat and AFWeb on SSL and 443.
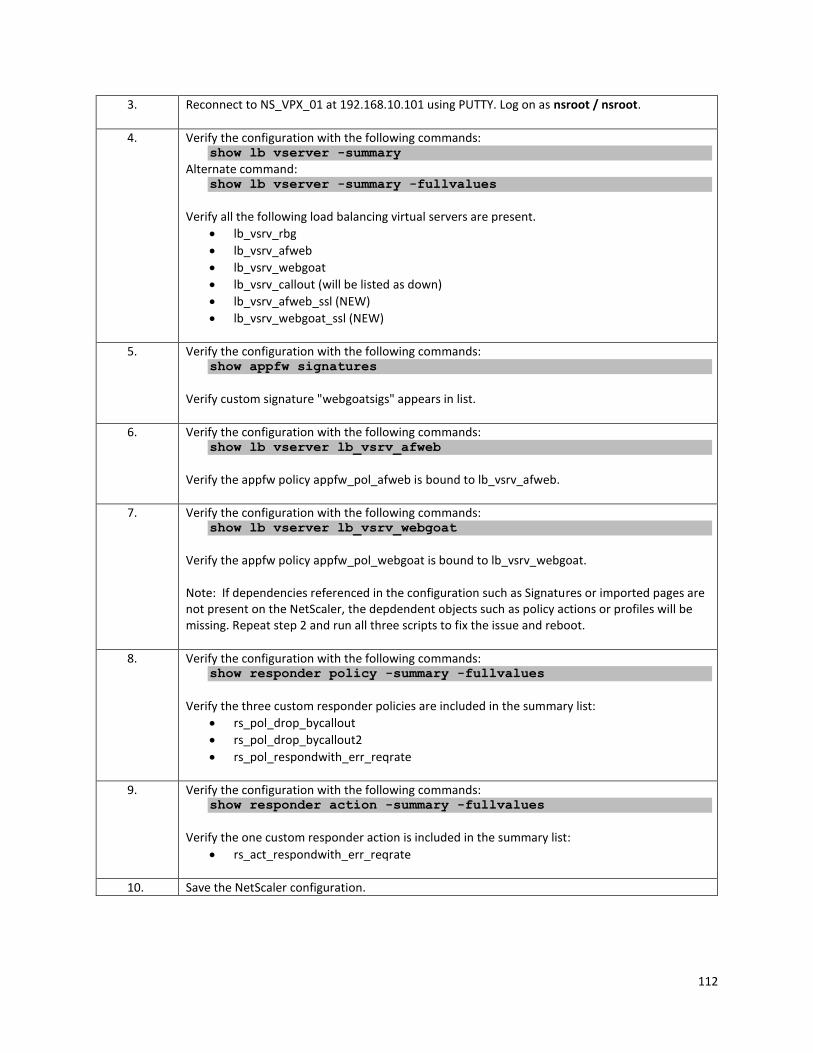
112
3. Reconnect to NS_VPX_01 at 192.168.10.101 using PUTTY. Log on as nsroot / nsroot.
4. Verify the configuration with the following commands: show lb vserver -summary
Alternate command: show lb vserver -summary -fullvalues
Verify all the following load balancing virtual servers are present.
lb_vsrv_rbg
lb_vsrv_afweb
lb_vsrv_webgoat
lb_vsrv_callout (will be listed as down)
lb_vsrv_afweb_ssl (NEW)
lb_vsrv_webgoat_ssl (NEW)
5. Verify the configuration with the following commands: show appfw signatures
Verify custom signature "webgoatsigs" appears in list.
6. Verify the configuration with the following commands: show lb vserver lb_vsrv_afweb
Verify the appfw policy appfw_pol_afweb is bound to lb_vsrv_afweb.
7. Verify the configuration with the following commands: show lb vserver lb_vsrv_webgoat
Verify the appfw policy appfw_pol_webgoat is bound to lb_vsrv_webgoat. Note: If dependencies referenced in the configuration such as Signatures or imported pages are not present on the NetScaler, the depdendent objects such as policy actions or profiles will be missing. Repeat step 2 and run all three scripts to fix the issue and reboot.
8. Verify the configuration with the following commands: show responder policy -summary -fullvalues
Verify the three custom responder policies are included in the summary list:
rs_pol_drop_bycallout
rs_pol_drop_bycallout2
rs_pol_respondwith_err_reqrate
9. Verify the configuration with the following commands: show responder action -summary -fullvalues
Verify the one custom responder action is included in the summary list:
rs_act_respondwith_err_reqrate
10. Save the NetScaler configuration.
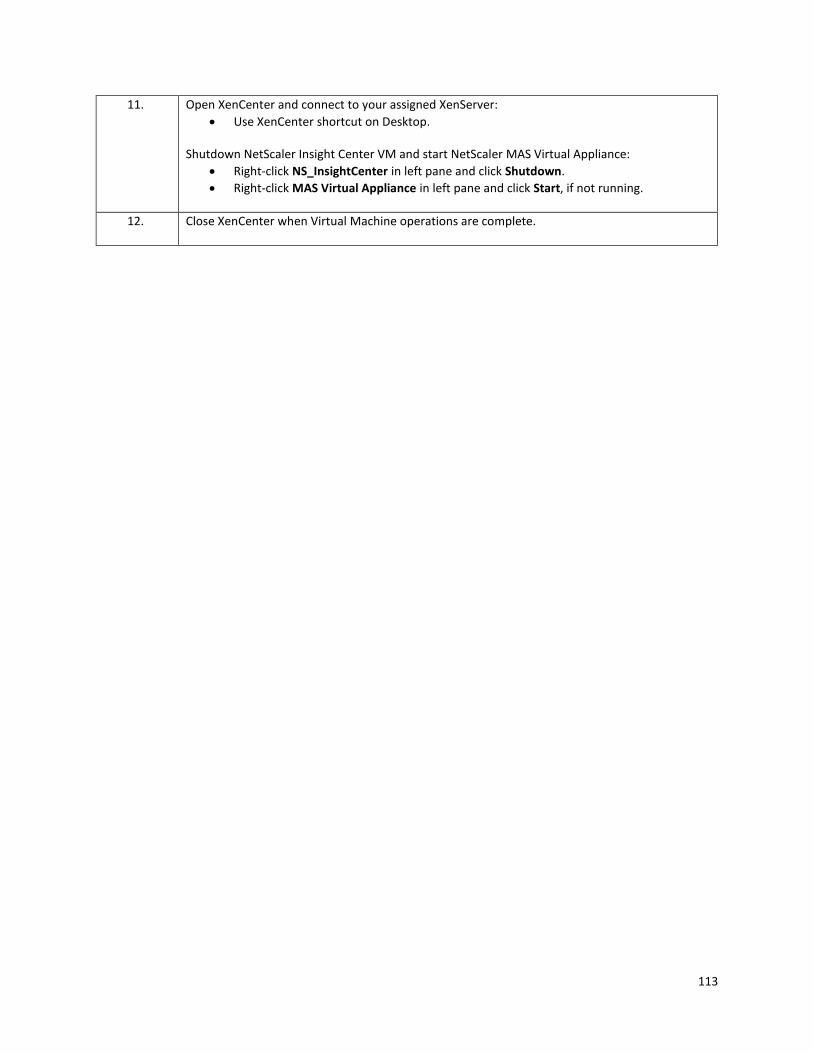
113
11. Open XenCenter and connect to your assigned XenServer:
Use XenCenter shortcut on Desktop. Shutdown NetScaler Insight Center VM and start NetScaler MAS Virtual Appliance:
Right-click NS_InsightCenter in left pane and click Shutdown.
Right-click MAS Virtual Appliance in left pane and click Start, if not running.
12. Close XenCenter when Virtual Machine operations are complete.

114