netter's physiology flash cards
TRANSCRIPT
Netter’sPhysiology Flash Cards
Susan E. Mulroney, PhDProfessor of Physiology & BiophysicsDirector, Special Master’s ProgramGeorgetown University Medical Center
Adam K. Myers, PhDProfessor of Physiology & BiophysicsAssociate Dean for Graduate EducationGeorgetown University Medical Center
Illustrations by Frank H. Netter, MDContributing IllustratorsCarlos A.G. Machado, MDJohn A. CraigJames A. Perkins, MS, MFA

1600 John F. Kennedy Blvd.Ste 1800Philadelphia, PA 19103-2899
NOTICE
Neither the Publisher nor the Authors assume any responsibility for any loss or injury and/or damage to persons or property arising out of or related to any use of the material contained in this book. It is the responsibility of the treating practitioner, relying on indepen-dent expertise and knowledge of the patient, to determine the best treatment and method of application for the patient.
The Publisher
Acquisitions Editor: Elyse O’GradyDevelopmental Editor: Marybeth ThielProject Manager: David SaltzbergMarketing Manager: Jason OberackerDesign Manager: Lou ForgioneIllustrations Manager: Karen GiacomucciEditorial Assistant: Julie Goolsby
Printed in China
Last digit is the print number: 9 8 7 6 5 4 3
NETTER’S PHYSIOLOGY FLASH CARDS ISBN: 978-1-4160-4628-8Copyright © 2010 by Saunders, an imprint of Elsevier Inc.
All rights reserved. No part of this book may be reproduced or transmitted in any form or by any means, electronic or mechanical, including photocopying, recording, or any information storage and retrieval system, without permission in writing from the publisher. Permissions for Netter Art figures may be sought directly from Elsevier’s Health Science Licensing Department in Philadelphia PA, USA: phone 1-800-523-1649, ext. 3276 or (215) 239-3276; or email [email protected].
Preface
Preface
As a naturally integrative fi eld of study, physiology cannot readily be learned by simple memorization or repetitive study of lecture notes or texts. Most
students fi nd that the best understanding of this fi eld comes when multiple learning modalities are utilized. While we recommend that students of physiol-ogy start with a standard textbook such as Netter’s Essential Physiology, many will fi nd that they desire additional learning materials. With this in mind, this set of over 200 cards has been developed to be used in conjunction with textbooks, lectures, and problem sets to cover topics in each of the major areas of physiology: cell physiology, neurophysiology, cardiovascular physiology, respiratory physiology, renal physiology, gastrointestinal physiology, and endocrinology. From the basic physiology and anatomy of these systems to their complex, integrative processes, Netter’s Physiology Flash Cards provides a visually rich platform for testing one’s knowledge of physiology and developing a deeper understanding of physiological concepts. Medical students, allied health students, and undergraduate students taking an advanced course in human physiology will enhance their knowledge of physiology by working with these cards.

Contents
Section 1 Cell Physiology and Fluid Homeostasis
Section 2 The Nervous System and Muscle
Section 3 Cardiovascular Physiology
Section 4 Respiratory Physiology
Section 5 Renal Physiology
Section 6 Gastrointestinal Physiology
Section 7 Endocrine Physiology
Appendix Key Equations
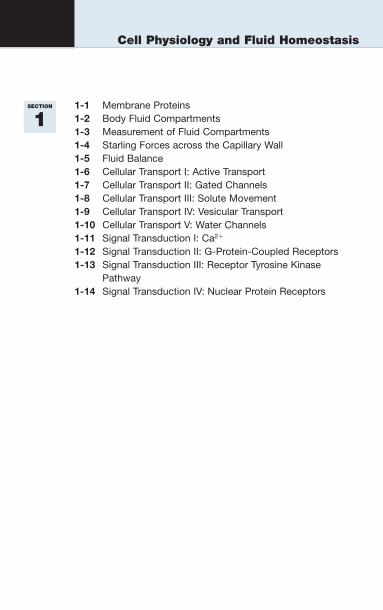
1-1 Membrane Proteins1-2 Body Fluid Compartments1-3 Measurement of Fluid Compartments1-4 Starling Forces across the Capillary Wall1-5 Fluid Balance1-6 Cellular Transport I: Active Transport1-7 Cellular Transport II: Gated Channels1-8 Cellular Transport III: Solute Movement1-9 Cellular Transport IV: Vesicular Transport1-10 Cellular Transport V: Water Channels1-11 Signal Transduction I: Ca2�
1-12 Signal Transduction II: G-Protein-Coupled Receptors1-13 Signal Transduction III: Receptor Tyrosine Kinase
Pathway1-14 Signal Transduction IV: Nuclear Protein Receptors
SECTION
1
Cell Physiology and Fluid Homeostasis

This page intentionally left blank

Membrane Proteins
Membrane Proteins 1-1
12
34
The cell membrane is made of a lipid bilayer, with many differentproteins that regulate cell function and activity. Name the typesof proteins represented by numbers 1–4.
Integralprotein Peripheral
proteins
Ion
AntibodyLigand Collagen
Cytoskeleton

1. Ion channels 2. Surface antigens 3. Receptors 4. Adhesion molecules
Comment: The amount and types of membrane proteins depend on the cell and on regulatory factors that are subject to change, such as immune status and hormone levels.
Membrane Proteins See Figure1.3
Membrane Proteins

Body Fluid Compartments 1-2
Capillary wallCell membrane
Bodyweight
1 2
1–5. Name the body fluid compartments, based on relative volumes.
6. How much fluid would be associated with each compartmentin a 60 kg person?
34
5
Body Fluid Compartments
1. Total body water (TBW) 2. Intracellular fl uid (ICF) 3. Extracellular fl uid (ECF) 4. Interstitial fl uid (ISF) 5. Plasma volume (PV) 6. TBW is about 60% of body weight, so in a 60-kg person,
TBW � 36 LICF is 2⁄3 of TBW, or 24 LECF is 1⁄3 of TBW, or 12 L
ISF is 3⁄4 of ECF, or 9 LPV is 1⁄4 of ECF, or 3 L
Body Fluid Compartments
Body Fluid Compartments See Figure 1.4

Measurement of Fluid Compartments 1-3
Measurement of Fluid Compartments
1 2 3
Plasmavolume
Indicator
1–3. Name the indicators that are used to measure plasmavolume (1), extracellular fluid volume (2), and total body water (3).
4. Give the formula used to calculate fluid compartment size by theindicator-dilution method.
Interstitialfluid
Intracellularfluid (ICF)
Extr
acel
lula
r flu
id (E
CF)
Tota
l bod
y w
ater
(TB
W)
1. Evans blue dye is used to measure plasma volume. 2. Inulin is used to measure extracellular volume. 3. Antipyrine or tritiated water is used to measure total body water. 4. Compartment volume can be calculated by the formula:
Volume (L)amount of indicator injected (
�mmg)
Final concentration of indicator (mg/L)
Measurement of Fluid Compartments
Measurement of Fluid Compartments See page 12

Starling Forces across the Capillary Wall 1-4
Starling Forces across the Capillary Wall
Arteriole Capillary
1. Write the Starling equation for the pressures governing fluidmovement into and out of the capillary shown below.
2. Describe the effect on net filtration pressure of: an increasein capillary hydrostatic pressure (Pc) to 40 mm Hg or areduction in capillary oncotic pressure (�c) to 20 mm Hg.
Pi = –3 mm Hg
�i = 8 mm Hg
Venule
Pc = 30 mm Hg Pc = 10 mm Hg
�c = 28 mm Hg

1. Net fi ltration pressure � [(forcing fl uid out) � (drawing fl uid in)] (HPc � �i) � (HPi � �c)
2. Increasing HPc forces more fl uid out of the capillaries. This can result in edema (pooling of fl uid in the interstitium). Reducing �c increases the net fi ltration pressure, increasing fl uid fl ux into the interstitium.
Starling Forces across the Capillary Wall
Starling Forces across the Capillary Wall See Figure 1.8

Intake(~2.5 L/day)
Excessfluid
?Fluiddeficit
Fluid balance
Fluid balance is necessary for regulation of vascular volume.Referring to the diagram:
1. Describe the effects of a decrease in fluid intake (from 2.5to 1.5 liters/day) on urine output and thirst.
2. Describe the effects of an increase in fluid intake (from 2.5to 3.5 liters/day) on urine output and thirst.
?
Beverages
Food
Oxidation
Output(~2.5 L/day)
Urine
Sweat andrespirationExcreted infeces (0.1 L)
1.3 L
0.9 L
0.3 L
1.5 L
0.9 L
Fluid Balance 1-5
Fluid Balance

1. A reduction in fl uid intake results in dehydration, an imbalance that tips the balance to the right (fl uid defi cit). Urine volume is greatly reduced, and thirst is stimulated.
2. An increase in fl uid intake (without equal losses), tips the balance to the left and results in signifi cantly increased urine output to compensate. Thirst is not stimulated.
Fluid Balance
Fluid Balance See Figure 1.10
Intake(~2.5 L/day)
Excessfluid
Increasedurine output
Fluiddeficit
Fluid balance
Increasedthirst
Beverages
Food
Oxidation
Output(~2.5 L/day)
Urine
Sweat andrespirationExcreted infeces (0.1 L)
1.3 L
0.9 L
0.3 L
1.5 L
0.9 L

Cellular Transport I: Active Transport 1-6
Cellular Transport I: Active Transport
���
��
1. Name the type of cellular transport process depicted.Give two examples of this type of transport.
2. What transporter is affected by the substance ouabain?
3. Define primary and secondary active transport.
ATP
ADP
�

1. Primary active transport. Major examples include Na�/K�-ATPase, H�-ATPase, H�/K�- ATPase, and Ca2�-ATPase.
2. Ouabain is an irreversible blocker of Na�/K�-ATPase. Ouabain (also called digitalis) is a glycoside that is used to correct cardiac arrhythmias and increase cardiac contractility.
3. Primary (1°) active transport is when the transport of ions across a membrane requires a direct expenditure of energy (in the form of ATP). Secondary (2°) active transport does not directly use en-ergy (ATP) but instead takes advantage of the electrochemical gra-dient established by 1° active transport.
Cellular Transport I: Active Transport See Figure 2.3
Cellular Transport I: Active Transport
Cellular Transport II: Gated Channels 1-7
Cellular Transport II: Gated Channels
A gated ion channel is depicted. Name two typesof gated channels, and the stimuli for gate opening.
Gateopen
Gateclosed

1. Ligand-gated channels open when a specifi c ligand (such as acetylcholine) binds to its receptor.
2. Voltage-gated channels open in response to a change in mem-brane voltage.
Comment: These channels are ion specifi c; the ions move down their concentration or electrochemical gradients.
Cellular Transport II: Gated Channels
Cellular Transport II: Gated Channels See Figure 2.2

1� Active
2K�3Na� 2K�3Na� 2K�3Na�XNa�
1� Active
YNa�
1� Active
Na�
Multiple transporters and channels use active transport systemsto create a gradient for solute movement. Identify which of thepanels depicts a passive channel, a secondary (2�) activesymporter, and a 2� active antiporter.
1 2 3
ATP ATP ATP
Cellular Transport III: Solute Movement 1-8
Cellular Transport III: Solute Movement

1. 2° Active symporter 2. 2° Active antiporter 3. Passive channel
Comment: In the cells depicted, the 1° active Na�/K�-ATPase (also called the sodium pump) maintains low intracellular sodium concen-trations, creating an out-to-in gradient for sodium. This allows the 2° active transport of other molecules ( X and Y in the fi gure) through many different transporters.
Cellular Transport III: Solute Movement
Cellular Transport III: Solute Movement See Figure 2.4

Cellular Transport IV: Vesicular Transport 1-9
Cellular Transport IV: Vesicular Transport
1 2 3
Transport of substances through the membrane can occur bythe formation and movement of lipid-membrane vesicles. Namethe types of vesicular transport represented in each panel.

1. Exocytosis involves fusion of the vesicle to the cell membrane for extrusion of vesicle contents.
2. Endocytosis involves engulfi ng substances or particles from the extracellular fl uid by the membrane, forming a vesicle within the cell.
3. Transcytosis occurs in capillary and intestinal epithelial cells and, using endocytosis and exocytosis, moves the material across the cell membrane.
Comment: Vesicular membrane transport requires energy in the form of ATP. This form of transport is especially important when the mate-rial to be transported needs to be isolated from the intracellular envi-ronment because of toxicity (e.g., iron, waste) or has the potential to alter signal transduction systems (e.g., Ca2�).
Cellular Transport IV: Vesicular Transport
Cellular Transport IV: Vesicular Transport See Figure 2.5

Cellular Transport V: Water Channels 1-10
Cellular Transport V: Water Channels
Osmosis
Water flux follows the osmotic pressure gradient, as shownin this diagram:
1. Name the membrane channels through which watermovement occurs.
2. What is the function of water channels?
H2OH2O
1. Aquaporins (AQPs) 2. AQPs are present in all membranes, selectively allowing solute-
free water movement. In select membranes such as in the renal collecting ducts, AQPs can be inserted and withdrawn to regulate fl uid homeostasis.
Cellular Transport V: Water Channels
Cellular Transport V: Water Channels See Figure 2.6

Signal Transduction I: Ca2� 1-11
Signal Transduction I: Ca2�
Calmodulin
Selective Ca2+ entry into cells is an important mechanism for initiatingintracellular signaling cascades.
1. In this diagram, name the type of channels used in this mechanism.
2. Name the substance calcium binds to in the cell in this pathway.
Ca2�
1
Increased Ca2�
Dedicated CaM kinase Multifunctional CaM kinase
Effect Effect
2

1. Ligand-gated Ca2� channels 2. Upon entering the cells, calcium binds with calmodulin, activating
specifi c kinases.
Comment: This pathway can initiate smooth muscle contraction, neurotransmitter release, and hormone secretion.
Signal Transduction I: Ca2�
Signal Transduction I: Ca2� See Figure 2.7
Calmodulin
Ca2�
Ligand-gatedCa2� channel
Increased Ca2�
Dedicated CaM kinase
Ca-Calmodulin
Multifunctional CaM kinase
Effect Effect

Signal Transduction II: G-Protein-Coupled Receptors 1-12
Signal Transduction II: G-Protein-Coupled Receptors
Receptor
Two main G-protein coupled transduction systems are illustrated.Name the elements of the transduction systems labeled 1 and 2.What protein kinases are labeled 3 and 4?
Receptor DAG
1
2 4
3 3
ATPcAMP
R
G protein
�
�
C
R
C
R
C
R
C
Effect
G protein
Endoplasmicreticulum
IP3Ca2�
�
�
Effect

1. Adenylyl cyclase 2. Phospholipase C 3. Protein kinase A (PK-A) 4. Protein kinase C (PK-C)
Comment: Most membrane receptors act through G proteins. Many of their effects are rapid because they do not involve stimulation of transcription factors and protein synthesis.
Signal Transduction II: G-Protein-Coupled Receptors
Signal Transduction II: G-Protein-Coupled Receptors See Figure 2.8
Receptor Adenylylcyclase
Receptor DAG PKCPhospho-lipase C
ATPcAMP
R
G protein
Inactive PK-A Active PK-A
��
C
R
C
R
C
R
CEffect
G protein
Endoplasmicreticulum
IP3Ca2�
��
Effect

Signal Transduction III: Receptor Tyrosine Kinase Pathway 1-13
Signal Transduction III: Receptor Tyrosine Kinase Pathway
DNA
Nucleus
mRNAProtein
synthesis
Effect
Receptor tyrosine kinase
1–4. In the receptor tyrosine kinase pathway, name the elements labeled 1–4.
5. Is this system simple or complex?
Growthfactor
PPP
PPP
1
2
3
4

1. Adapter protein 2. Monomeric G protein 3. Mitogen-activated protein kinase (MAP-kinase) 4. Nuclear transcription factors (activated by MAP-kinase) 5. This is an example of a complex pathway.
Signal Transduction III: Receptor Tyrosine Kinase Pathway
Signal Transduction III: Receptor Tyrosine Kinase Pathway See Figure 2.10
DNA
Nucleus
mRNAProtein
synthesis
Effect
MonomericG protein
Transcriptionfactors
MAP-kinase
Receptor tyrosine kinase
Growthfactor
Adapterprotein
PPP
PPP

Nuclear protein receptor
Name the seven major ligands that bind to the nuclear receptorto produce their actions.
?
Nucleus
mRNADNA Protein
synthesis
Effect
Signal Transduction IV: Nuclear Protein Receptors 1-14
Signal Transduction IV: Nuclear Protein Receptors

1. Aldosterone 2. Cortisol 3. Calcitriol 4. Estrogen 5. Progesterone 6. Testosterone 7. Thyroid hormones
Comment: In the diagram, these ligands passively diffuse into the cell, bind to a nuclear receptor, and initiate transcription and ultimately protein synthesis. Other than the thyroid hormones, all factors that use the nuclear receptor are steroid hormones (an easy mnemonic is ACCEPT-T).
Signal Transduction IV: Nuclear Protein Receptors
Signal Transduction IV: Nuclear Protein Receptors See Figure 2.9

2-1 Nernst Potential2-2 Resting Membrane Potential2-3 Axonal Action Potential2-4 Neurons2-5 Axonal Conduction2-6 Morphology of Synapses2-7 Chemical Synaptic Transmission2-8 Structure of the Neuromuscular Junction2-9 Sarcoplasmic Reticulum2-10 Excitation-Contraction Coupling2-11 Skeletal Muscle Contraction and Relaxation2-12 Biochemical Mechanics of Muscle Contraction2-13 Excitation-Contraction Coupling of Smooth Muscle2-14 Cardiac Muscle Structure2-15 Major Parts of the Central Nervous System and the
Vertebral Column2-16 Major Functions of the Hypothalamus2-17 Somatic Component of the Peripheral Nervous System2-18 Skin and Cutaneous Receptors2-19 Visual Receptors2-20 Cochlear Receptors2-21 Vestibular Receptors2-22 Taste Receptors2-23 Olfactory Receptors2-24 Muscle and Joint Receptors2-25 Spinal Refl ex Pathways for Stretch, Tendon Organ, and
Flexor Withdrawal Refl exes2-26 Corticospinal Tract2-27 Functional Subdivisions of Cerebellum2-28 General Characteristics of the Parasympathetic and
Sympathetic Nervous Systems2-29 Actions of the Autonomic Nervous System
The Nervous System and Muscle
SECTION
2

This page intentionally left blank

Nernst Potential
Nernst Potential 2-1
Extracellular fluid
10 K�
100 Na�
110 Cl–
100 K�
10 Na�
110 Cl�
1. State the formula for the Nernst equation.
2. For the hypothetical cell depicted, assume that the membraneis only permeable to K�. What is the membrane potential?
3. For the hypothetical cell depicted, assume that the membraneis only permeable to Na�. What is the membrane potential?

1. The Nernst equation is:
EX � (RT/ZF)ln([X]o/[X]i),
where Ex is the Nernst potential (equilibrium potential) for ion X, ln([X]o/[X]i) is the natural log of the ratio of the concentration of ion X outside a compartment ([X]o) to the concentration of the ion in-side the compartment ([X]i), R is the ideal gas constant, T is abso-lute temperature, Z is the charge of the ion, and F is Faraday’s number. In biologic systems at 37°C, this equation can be simpli-fi ed to:
EX � (61mV/Z)log([X]o/[X]i)
2. In the hypothetical situation in which only one ion is permeable in a system, the membrane potential will equal the Nernst potential for that ion. The Nernst potential for K� in this example (and thus the membrane potential) is:
EK� � (61mV/1)log([10]o/[100]i) � �61 mV
3. Because only one ion (Na�) is permeable, the membrane potential will equal the Nernst potential for Na�:
ENa� � (61mV/1)log([100]o/[10]i) � 61 mV
Nernst Potential
Nernst Potential See Figure 3.1

��
�
��
�
�
�
�
�
�
�
�
�
�
�
�
�
�
�
�
�
�
�
�
Extracellular fluid Membrane Axoplasm
Protein�
(anions)
Diffusion
Diffusion
Diffusio
n
Mito-chondrion
ATPase
ATP
1–3. Identify each ion.
4. Write and explain the Goldman-Hodgkin-Katz equation.
1
1
2
2
3 3
ADP
transport Ac
tive
Resting Membrane Potential 2-2
Resting Membrane Potential

1. Na�: Na� is constantly transported out of the cell by Na�/K�-ATPase.
2. K�: K� is constantly transported into the cell by Naa�/K�-ATPase. 3. Cl�: Cl� is not actively transported, and its concentrations refl ect
electrochemical equilibrium. 4.
Vm �RTF
InP [K P [Na ] P [CIK o Na o CI- i�
�
�
� �� �] ]
PP [K P [Na ] P [CIK i Na i CI- o�
�
�
� �� �] ]
where Vm is the resting membrane potential, PX is the membrane permeability to ion x, [X]i is the concentration of x inside the cell, [X]o is the concentration of x outside the cell, R is the ideal gas constant, T is absolute temperature, and F is Faraday’s number.
Comment: Although cells contain many ions, this simplifi ed G-H-K equation omits ions that are much less permeable to the cell mem-brane than K,� Na�, and Cl� because their contribution to resting membrane potential is usually negligible. Note also that the concen-tration of Cl� inside appears in the top of the right-hand term and the concentration of Cl� outside appears in the bottom, whereas the situ-ation for K� and Na� is opposite that of Cl�, because of the differ-ence in charge of these ions (negative versus positive).
The resting membrane potential for most cells is about �70, whereas in nerve cells, it is about �90 mV.
Resting Membrane Potential
Resting Membrane Potential See Figure 3.2

Axonal Action Potential
Axonal Action Potential 2-3
1.00.50
Mem
bran
e po
tent
ial o
r co
nduc
tanc
e
Identify 1–6.
1 2
3
5
4
6

1. Absolute refractory period (the period during which another action potential cannot be elicited)
2. Relative refractory period (the period during which a second action potential can be elicited, but only by a larger than normal stimulus)
3. Action potential 4. Threshold potential; depolarization of the membrane to this level
results in an action potential. 5. Na� conductance 6. K� conductance
Axonal Action Potential
Axonal Action Potential See Figure 3.3

Neurons
Neurons 2-4
Identify each structure.
1
2
3
4
5
6
7
8
9

1. Dendrites 2. Dendritic spines (gemmules) 3. Nucleus 4. Axon hillock 5. Axon 6. Soma (cell body) 7. Axosomatic synapse 8. Glial (astrocyte) process 9. Axodendritic synapse
Neurons
Neurons See Figure 3.4

Axonal Conduction
Axonal Conduction 2-5
B. Myelinated fibers
Impulse
� ��
� ��
� ��
� ��
Node of Ranvier
Axolemma
A. Unmyelinated fibers
��
��
��
��
��
��
��
��
�
��
��
��
��
��
��
��
��
��
��
��
��
��
��
��
��
��
��
��
��
��
�
�
�
�
��
��
��
��
��
��
��
��
��
��
��
��
��
Myelin sheath
Axoplasm
Explain how myelination affects each of these parameters in an axon:
1. Membrane resistance 2. Membrane capacitance3. Conduction velocity 4. Explain the term “saltatory conduction” in the context
of the diagram.

1. Membrane resistance (Rm) is increased by myelinization of axons. 2. Membrane capacitance is greatly reduced by myelinization. 3. Conduction velocity is increased by myelinization. With reduced
capacitance and increased membrane resistance, the current trav-els through the interior of the axon, but not across the membrane in myelinated segments of the axon. The action potential jumps rapidly between the nodes of Ranvier (unmyelinated breaks in the myelin sheath at 1- to 2-mm intervals; compare parts A and B).
4. This process of conduction whereby the action potential jumps between nodes is known as saltatory conduction and allows rapid propagation of the action potential despite small axon diameter. Local currents generated at one node during depolarization result in depolarization at the next node, and the action potential skips along the axon, bypassing the highly insulated segments, from one node to the next.
Axonal Conduction
Axonal Conduction See Figure 3.5

Morphology of Synapses
Morphology of Synapses 2-6
Enlarged section of bouton
1
2
3
4
5
6
78
Identify each structure.
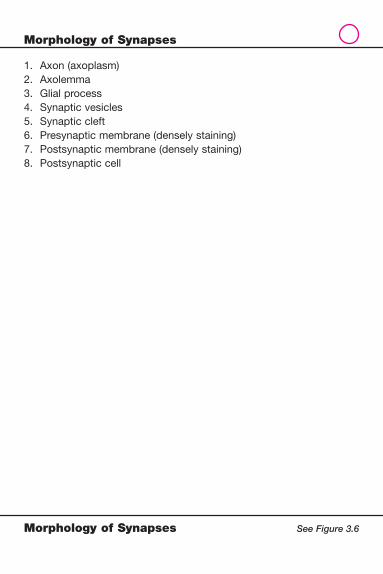
1. Axon (axoplasm) 2. Axolemma 3. Glial process 4. Synaptic vesicles 5. Synaptic cleft 6. Presynaptic membrane (densely staining) 7. Postsynaptic membrane (densely staining) 8. Postsynaptic cell
Morphology of Synapses
Morphology of Synapses See Figure 3.6

⎧⎪⎪⎨⎪⎪⎩ ⎧⎪⎪⎨⎪⎪⎩
Excitatory InhibitorySynaptic vesiclesin synaptic bouton
Presynaptic membrane
Transmitter substances
Synaptic cleftPostsynaptic membrane
Synaptic bouton
Cl�K���
��
��
��
��
��
��
��
��
��Na�
Current
Potential
Pote
ntia
l (m
V)
�700 4 8
msecCurrent flow and potential change
12 16
�65
Current
Potential
Pote
ntia
l (m
V)
�70 0 4 8msec
Current flow and potential change
12 16
�75
Describe the steps in chemical transmission that result inexcitatory effects (1–3) or inhibitory effects (4–6) at thepost-synaptic membrane.
1
2
3
5
6
4
Chemical Synaptic Transmission
Chemical Synaptic Transmission 2-7

1. An impulse reaching the excitatory synaptic bouton results in re-lease of a transmitter substance into the synaptic cleft.
2. Increased permeability of the postsynaptic membrane to Na� and K� results in greater Na� infl ux than K� effl ux, because of the greater electrochemical gradient for Na� fl ux.
3. The resultant current fl ow is in a direction that tends to depolarize the postsynaptic cell. If threshold is reached, an action potential occurs in the postsynaptic cell.
4. An impulse reaching the inhibitory synaptic bouton results in re-lease of a transmitter substance into the synaptic cleft.
5. Increased permeability of the postsynaptic membrane to Cl� results in Cl� infl ux.
6. The resultant current fl ow is in a direction that tends to hyperpo-larize the postsynaptic cell. As a result, greater depolarization of the postsynaptic cell is required to reach threshold.
Comment: In the bottom left and right panels, current fl ow and po-tential change in the postsynaptic membrane are illustrated. An action potential occurs in a postsynaptic cell when local potentials, through spatial and temporal summation, reach the threshold for generation of an action potential.
Chemical Synaptic Transmission
Chemical Synaptic Transmission See Figure 3.7

1
2
5
6
3
4
8
7
Identify each structure.
Structure of the Neuromuscular Junction
Structure of the Neuromuscular Junction 2-8

1. Postsynaptic membrane 2. Synaptic cleft 3. Myofi brils 4. Acetylcholine receptor sites 5. Myelin sheath 6. Axoplasm 7. Presynaptic membrane 8. Synaptic vesicles
Structure of the Neuromuscular Junction
Structure of the Neuromuscular Junction See Figure 3.10
Acetylcholinereceptor sites
Myofibrils
Synaptic cleft
Postsynapticmembrane
Myelin sheath
Axoplasm
Presynaptic membrane
Synaptic vesicles

Sarcoplasmic Reticulum
Sarcoplasmic Reticulum 2-9
Segment of muscle fiber greatlyenlarged to show sarcoplasmicstructures and inclusions
1
2
3
45
Identify each structure.

1. Transverse (T) tubule 2. Terminal cisternae 3. Sarcoplasmic reticulum 4. Myofi laments 5. Myofi bril
Comment: The T tubules are invaginations of the muscle cell mem-brane. They form triads with two terminal cisternae of the sarcoplas-mic reticulum.
Sarcoplasmic Reticulum
Sarcoplasmic Reticulum See Figure 3.12

Excitation-Contraction Coupling
Excitation-Contraction Coupling 2-10
Sarcoplasmicreticulum
Z bandCross-bridges
Thick filamentThin filament
Electric impulse
Sarcolemma
Sarcoplasm
Terminal cistern ofsarcoplasmic reticulum
Terminal cistern ofsarcoplasmic reticulum
Transverse (T) tubule
ExtrudedCa2�
K�
�����
�����
� � � � �� � � �
�
��
�
�
� � � � ��
� � � �
����
�����
�
� �
� �
� �
� �
��
� �
� �
� �
� �
� �
Ca2�
Ca2�
Ca2� Ca2�
Ca2� Ca2�
Ca2�Ca2�
Ca2�
Na�
K�Na�
List five major steps in excitation-contraction coupling in thecontext of this diagram, beginning with an axonal action potential.

1. The axonal action potential in the motor neuron results in acetyl-choline release at the neuromuscular junction.
2. Acetylcholine is bound on the postsynaptic membrane (sarco-lemma), resulting in opening of a cation channel and infl ux of Na�.
3. An action potential is produced and spreads into the transverse tubule, resulting in release of Ca2� from the sarcoplasmic reticulum.
4. Cross-bridge formation is initiated, and muscle contraction is produced.
5. Ca2� is resequestered into the sarcoplasmic reticulum by Ca2�-ATPase, terminating contraction.
Excitation-Contraction Coupling
Excitation-Contraction Coupling See Figure 3.13

1
1
2 2
2 2
3
33
3
5
5 5 5
4
4 44
Identify each structure.
Muscle contracted
Muscle relaxed
Skeletal Muscle Contraction and Relaxation
Skeletal Muscle Contraction and Relaxation 2-11

1. Sarcomere 2. Z band 3. I band 4. A band 5. H zone
Comment: During contraction of skeletal muscle, the thick myosin fi laments that extend through the A band cyclically form cross-bridges with the thin actin fi laments, resulting in sliding of the inter-digitated myosin and actin fi laments and shortening of sarcomeres. As a result, Z bands move closer together, and I bands and H zones narrow.
Skeletal Muscle Contraction and Relaxation
Skeletal Muscle Contraction and Relaxation See Figure 3.14

Biochemical Mechanics of Muscle Contraction
Biochemical Mechanics of Muscle Contraction 2-12
Actin Troponin Tropomyosin Z band
Myosin headgroup
Thin filament
Thick filament(myosin)
Ca2�Ca2�
ATPase
ATP
1
2
3
4
Describe the biochemical and mechanical steps in actinand myosin crossbridge formation and recycling.
ADP � Pi
ADP � Pi
ADP � PiADP�Pi
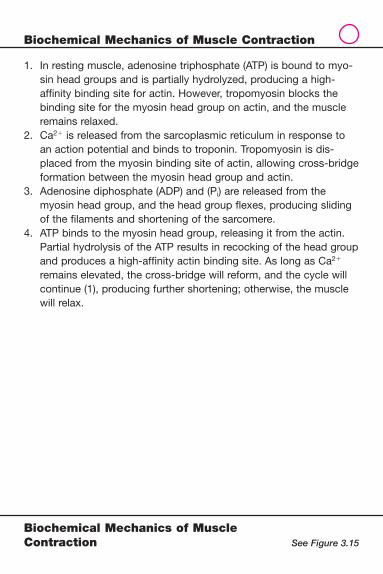
1. In resting muscle, adenosine triphosphate (ATP) is bound to myo-sin head groups and is partially hydrolyzed, producing a high-affi nity binding site for actin. However, tropomyosin blocks the binding site for the myosin head group on actin, and the muscle remains relaxed.
2. Ca2� is released from the sarcoplasmic reticulum in response to an action potential and binds to troponin. Tropomyosin is dis-placed from the myosin binding site of actin, allowing cross-bridge formation between the myosin head group and actin.
3. Adenosine diphosphate (ADP) and (Pi) are released from the myosin head group, and the head group fl exes, producing sliding of the fi laments and shortening of the sarcomere.
4. ATP binds to the myosin head group, releasing it from the actin. Partial hydrolysis of the ATP results in recocking of the head group and produces a high-affi nity actin binding site. As long as Ca2� remains elevated, the cross-bridge will reform, and the cycle will continue (1), producing further shortening; otherwise, the muscle will relax.
Biochemical Mechanics of Muscle Contraction
Biochemical Mechanics of Muscle Contraction See Figure 3.15

Excitation-Contraction Coupling of Smooth Muscle
Excitation-Contraction Coupling of Smooth Muscle 2-13
Receptor
Channel
Myosin
“Latch state”
Latch stateContraction cycle
Pi
PiPi
Pi
Pi
PiPi Pi
PiPi
ADP
ADPATP
ADP ADP
ADP
ATP
ATP
Bindsactin
1
1
2 3
4
5
6
7
7
SR
1–7. Identify the major regulatory ions, molecules or enzymes involved in excitation-contraction coupling of smooth muscle. 8. Explain their role in this process.

1. Ca2�
2. Phospholipase C 3. Inositol trisphosphate (IP3) 4. Calmodulin 5. Ca-calmodulin 6. Myosin kinase 7. Myosin phosphatase 8. Intracellular free Ca2� (1) can be elevated by depolarization of the
cell membrane and opening of Ca2� channels. It can also be ele-vated by binding of a ligand to a membrane receptor. In the latter case, this activates phospholipase C (2), which cleaves phosphati-dyl inositol to produce IP3 (3); IP3 binds to the sarcoplasmic reticu-lum causing release of stored Ca2�. In either case, Ca2� binds to the calcium binding protein calmodulin (4), forming Ca-calmodulin (5). The Ca-calmodulin activates myosin kinase (6), initiating cross-bridge formation and the contraction cycle, which continues as long as Ca2� is elevated. Otherwise, dephosphorylation of myosin by myosin phosphatase (7) ends the cycle. The latch state occurs when myosin is dephosphorylated while bound to actin, resulting in sustained contraction without requirement for additional ATP hydrolysis.
Excitation-Contraction Coupling of Smooth Muscle
Excitation-Contraction Coupling of Smooth Muscle See Figure 3.18

Cardiac Muscle Structure
Cardiac Muscle Structure 2-14
Identify each structure.
1
2
3
4
56

1. T tubule 2. Sarcomere 3. Sarcoplasmic reticulum 4. Intercalated disk 5. Thin fi lament (mainly actin) 6. Thick fi lament (myosin)
Cardiac Muscle Structure
Cardiac Muscle Structure See Figure 3.19

Major Parts of the Central Nervous System and the Vertebral Column 2-15
Major Parts of the Central Nervous System and the Vertebral Column
Left lateral view1
2
3
4
56
87 9
10
13
11
12
Identify each structure.

1. Cerebral cortex 2. Corpus callosum 3. Thalamus 4. Hypothalamic area 5. Pituitary gland (anterior and posterior) 6. Midbrain 7. Pons 8. Medulla oblongata 9. Cerebellum 10. Cervical vertebrae, C1–C7 11. Thoracic vertebrae, T1–T12 12. Lumbar vertebrae, L1–L5 13. Sacral vertebrae, S1–S5
Major Parts of the Central Nervous System and the Vertebral Column
Major Parts of the Central Nervous System and the Vertebral Column See Figure 4.1
Major Functions of the Hypothalamus 2-16
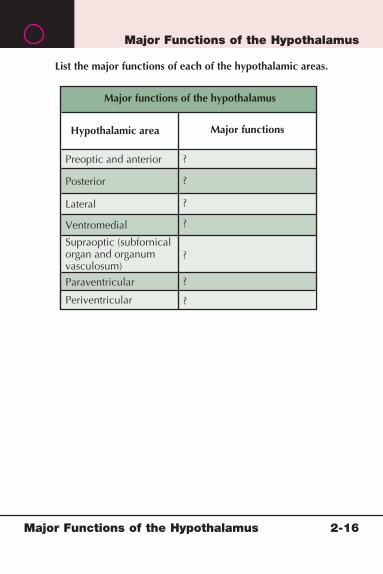
Major Functions of the Hypothalamus
List the major functions of each of the hypothalamic areas.
Hypothalamic area
Major functions of the hypothalamus
Major functions
Preoptic and anterior
Paraventricular
Periventricular
Posterior
?
?
?
?
?
?
?
Lateral
Ventromedial
Supraoptic (subfornicalorgan and organumvasculosum)

Major Functions of the Hypothalamus
Major Functions of the Hypothalamus See page 52
MAJOR FUNCTIONS OF THE HYPOTHALAMUS
HYPOTHALAMIC AREA MAJOR FUNCTIONS*
Preoptic and anterior Heat loss center: cutaneous vasodilation and sweating
Posterior Heat conservation center: cutaneous vasoconstriction and shivering
Lateral Feeding center: eating behavior
Ventromedial Satiety center: inhibits eating behavior
Supraoptic (subfornical organ and organum vasculosum)
Antidiuretic hormone (ADH) and oxytocin secretion
Paraventricular ADH and oxytocin secretion
Periventricular Secretion of releasing hormones for the anterior pituitary
*Stimulation of the center causes the responses listed.Reprinted with permission from Hansen J: Netter’s Atlas of Human Physiology. Philadelphia, Elsevier, 2002.

Somatic Component of the Peripheral Nervous System 2-17
Somatic Component of the Peripheral Nervous System
MuscleSkin
1 2
109
8
765
3
4
1–10. Identify each structure.
11. Explain the general organization of the somaticcomponent of the peripheral nervous system.

1. Posterior horn of the spinal cord (gray matter) 2. Dorsal root ganglion 3. Sensory neuron cell body 4. Dorsal root 5. Anterior horn of the spinal cord (gray matter) 6. Motor neuron cell body 7. Ventral root 8. Axons of motor (left) and sensory (right) neurons 9. Motor neuron 10. Sensory neuron 11. The peripheral nervous system includes somatic and autonomic
components and contains motor nerves and sensory nerves in-nervating the skin and muscles. The soma (cell bodies) of motor nerves and sensory nerves are located in the gray matter of the anterior horn of the spinal cord and the dorsal root ganglia, respectively.
Somatic Component of the Peripheral Nervous System
Somatic Component of the Peripheral Nervous System See Figure 4.9

Skin and Cutaneous Receptors 2-18
Skin and Cutaneous Receptors
Dermalpapilla(of papillarylayer)
Reticularlayer
Epidermis
Derm
isSubcutaneous tissue
12
3
4
5
1. Identify this cutaneous receptor. Describe its characteristics, includinglocation and the type of stimulus transduced.
2. Identify these structures. What type of stimuli do they detect?3. Identify this structure. What type of receptor is associated with it? Describe
the characteristics of the receptor and the type of stimulus transduced.4. Identify this cutaneous receptor. Describe its characteristics, including
the type of stimulus transduced.5. Identify the receptor in the bottom panel. Describe the characteristics
of the receptor and the type of stimulus transduced.6. What are Ruffini’s corpuscles (not illustrated)? What type of stimuli do they
respond to?

1. Meissner’s corpuscle, located in the dermal papillae, especially in fi ngertips, palms, soles, lips, face, tongue, and genital skin (non-hairy skin). These are rapidly adapting receptors with small recep-tive fi elds that allow point discrimination and detection of low-frequency stimuli such as fl utter.
2. Free nerve endings. Temperature and painful stimuli are detected by these nociceptors.
3. Hair follicle. Associated hair follicle receptors consist of nerve end-ings wrapped at the base of the follicle. The receptors are rapidly adapting and detect movement across the skin.
4. Pacinian corpuscle. These are rapidly adapting mechanoreceptors. The lamellated capsules allow response to rapid changes in pres-sure and vibration.
5. Merkel’s disks are slowly adapting receptors with small receptive fi elds; they respond to pressure and touch, especially to indenta-tion of the skin.
6. Ruffi ni’s corpuscles (not illustrated) are mechanoreceptors located in the dermis and joints. These slowly adapting receptors respond to stretch.
Skin and Cutaneous Receptors
Skin and Cutaneous Receptors See Figure 5.1

Visual Receptors 2-19
Visual Receptors
A. Eyeball
Suspensoryligament
IrisLens
CorneaCiliary body
RetinaChoroid
ScleraFovea
Optic nerve
Oraserrata
Anteriorchamber
Posteriorchamber
containingaqueous humor
Vitreous humor
B. Section through retina
Identify each cell type in the section through the retina. For the cellsthat act as photoreceptors, identify their roles in light perception.
1
2
3
4
5
6
7

1. Ganglion cell 2. Müller cell (supporting glial cell) 3. Amacrine cell 4. Bipolar cell 5. Horizontal cell 6. Rod; rods are sensitive photoreceptors adapted to respond to
light at low intensity. 7. Cone; color perception is mainly mediated by cones.
Comment: Light reception by photoreceptors (rods and cones) ulti-mately results in reduced Na� permeability and hyperpolarization of the photoreceptor membrane, which inhibits release of either inhibi-tory or excitatory neurotransmitters at synapses between photorecep-tors and bipolar and horizontal cells. Signals generated by this sys-tem are ultimately transmitted by ganglion cells, whose axons form the optic nerves.
Visual Receptors
Visual Receptors See Figure 5.5

Cochlear Receptors 2-20
Cochlear Receptors
UtricleSaccule
Semicircular canals
Cochlearnerve
Oval window and stapesRound window
A. Membranous labyrinth within bonylabyrinth (path of sound waves)
1. Describe the pathway whereby sound waves reach the inner ear.
2. Describe how vibration caused by sound waves is transduced intoneural signals within the inner ear in the context of this illustration.
B. Section through turnof cochlea
Spiral ganglion
Afferent nerve fibers
Efferent nerve fibers
Scala vestibuliCochlear duct (scala media)
Scala tympani
Scala vestibuli(perilymph);weaklypositive
�80 mV
Scala tympani(perilymph); 0 mV
Vestibular (Reissner’s) membrane
Cochlear duct(scala media; endolymph)
Tectorial membraneSpiral ligamentBone
Outer hair cells; �60 mVBasilar membrane
Inner hair cell; �60 mV
C. Spiral organ of Corti Hair cellsInner Outer
Tectorial membrane
Stereocilia
Basilar membraneSupporting cells
Afferent nerve fibersEfferent nerve fibers
Spiral laminaSpiral ganglion
Rods andtunnel ofCorti
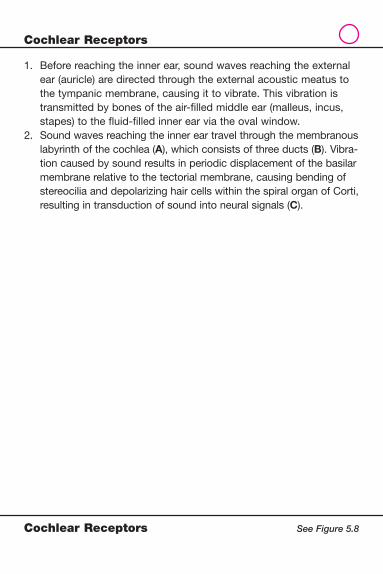
1. Before reaching the inner ear, sound waves reaching the external ear (auricle) are directed through the external acoustic meatus to the tympanic membrane, causing it to vibrate. This vibration is transmitted by bones of the air-fi lled middle ear (malleus, incus, stapes) to the fl uid-fi lled inner ear via the oval window.
2. Sound waves reaching the inner ear travel through the membranous labyrinth of the cochlea (A), which consists of three ducts (B). Vibra-tion caused by sound results in periodic displacement of the basilar membrane relative to the tectorial membrane, causing bending of stereocilia and depolarizing hair cells within the spiral organ of Corti, resulting in transduction of sound into neural signals (C).
Cochlear Receptors
Cochlear Receptors See Figure 5.8

Vestibular Receptors 2-21
Vestibular Receptors
Membranous labyrinth
Identify each structure and explain its role in balance and equilibrium.
1
2
3
4
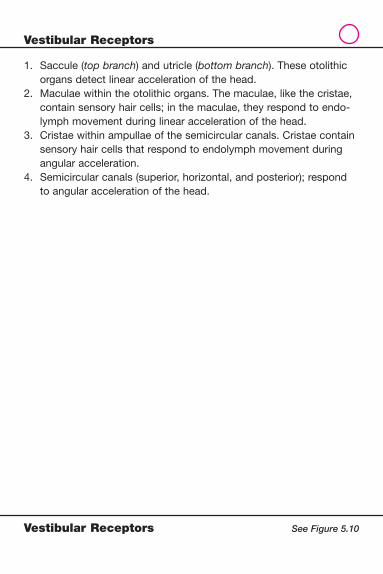
1. Saccule (top branch) and utricle (bottom branch). These otolithic organs detect linear acceleration of the head.
2. Maculae within the otolithic organs. The maculae, like the cristae, contain sensory hair cells; in the maculae, they respond to endo-lymph movement during linear acceleration of the head.
3. Cristae within ampullae of the semicircular canals. Cristae contain sensory hair cells that respond to endolymph movement during angular acceleration.
4. Semicircular canals (superior, horizontal, and posterior); respond to angular acceleration of the head.
Vestibular Receptors
Vestibular Receptors See Figure 5.10
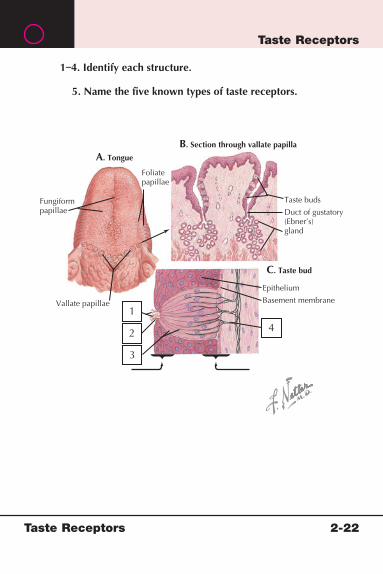
Taste Receptors 2-22
Taste Receptors
A. Tongue
Foliate papillae
Fungiformpapillae
Vallate papillae
B. Section through vallate papilla
1–4. Identify each structure.
5. Name the five known types of taste receptors.
Taste buds
Duct of gustatory(Ebner’s)gland
C. Taste bud
Epithelium
Basement membrane1
2
3
4

1. Microvilli 2. Taste pore 3. Taste cells 4. Nerve fi bers 5. Sweet, salty, sour, bitter, and umami (savory)
Taste Receptors
Taste Receptors See Figure 5.12

Olfactory Receptors 2-23
Olfactory Receptors
Olfactorybulb
Lateralnasal wall
Septum
A. Distribution of olfactory epithelium (blue area)
1–7. Identify each structure.8. Identify the specific location of the olfactory receptors
among these structures.9. Explain how smell is transduced into neural signals.
Cribriform plateof ethmoid bone
B. Schema of section through olfactory mucosa
1
2
3
4
5
7
6
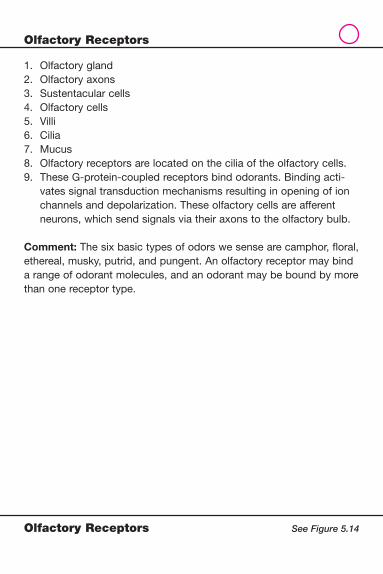
1. Olfactory gland 2. Olfactory axons 3. Sustentacular cells 4. Olfactory cells 5. Villi 6. Cilia 7. Mucus 8. Olfactory receptors are located on the cilia of the olfactory cells. 9. These G-protein-coupled receptors bind odorants. Binding acti-
vates signal transduction mechanisms resulting in opening of ion channels and depolarization. These olfactory cells are afferent neurons, which send signals via their axons to the olfactory bulb.
Comment: The six basic types of odors we sense are camphor, fl oral, ethereal, musky, putrid, and pungent. An olfactory receptor may bind a range of odorant molecules, and an odorant may be bound by more than one receptor type.
Olfactory Receptors
Olfactory Receptors See Figure 5.14
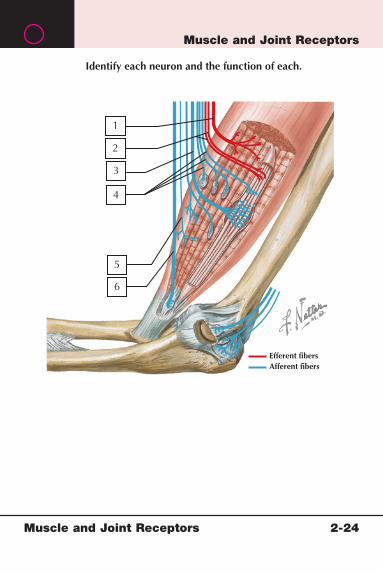
Muscle and Joint Receptors 2-24
Muscle and Joint Receptors
Efferent fibersAfferent fibers
1
2
3
4
5
6
Identify each neuron and the function of each.

1. �-Motor neurons; contract muscle through innervation of extra-fusal fi bers
2. �-Motor neurons; innervate intrafusal striated muscle endplates 3. Fibers from annulospiral endings; function in proprioception 4. Fibers from fl ower spray endings and from paciniform and pacin-
ian corpuscles; function in proprioception and detect pressure, respectively
5. Fibers from free nerve endings; detect pain 6. Fibers from Golgi tendon organs; function in proprioception
Muscle and Joint Receptors
Muscle and Joint Receptors See Figure 6.1

Spinal Refl ex Pathways for Stretch, Tendon Organ, and Flexor Withdrawal Refl exes 2-25
Spinal Refl ex Pathways for Stretch, Tendon Organ, and Flexor Withdrawal Refl exes
Nociceptive fibers
Ipsilateral flexion
Inhibitory synapse
Excitatory synapse
Excitatory synapse
Inhibitory synapse
To extensorsTo flexors
To extensorsTo flexors
Contralateral extension
From extensor spindlereceptor (Ia, II fibers)
Axosomatic oraxodendriticinhibitorysynapse
Excitatorysynapse
To extensors
To flexorsTo extensors
To flexors
From extensortendon organ(Ib fibers)
Inhibitorysynapse
Excitatorysynapse
1 2
3
Identify the spinal reflexes associated with the illustratedpathways. Explain the physiology of the reflex.

1. Stretch refl ex. Afferent nerves synapse directly with �-motor neu-rons in the spinal cord, making this a monosynaptic refl ex. An ex-ample is the knee jerk refl ex. A tap on the patellar tendon stretches muscle spindles within the quadriceps; type Ia afferent nerves conduct the signal to the spinal cord, where they synapse directly to �-motor neurons, which conduct the signal back to the quadriceps producing contraction. Simultaneously, activation of interneurons results in relaxation of opposing muscles.
2. Golgi tendon refl ex. It is a bisynaptic refl ex and constitutes a mechanism for preventing muscle damage due to excessive tension. Stretch of Golgi tendon organs activates type Ib afferent sensory nerves, which synapse in the spine with interneurons that subsequently inhibit �-motor neurons, causing relaxation. Simulta-neously, antagonistic muscles contract.
3. Flexor withdrawal refl ex. This refl ex occurs in response to pain or other noxious stimuli. Afferent signals are conducted through sensory nerves to the spine, where activation of multiple interneu-rons produces simultaneous fl exion and relaxation of the appropri-ate muscles to withdraw the limb.
Spinal Refl ex Pathways for Stretch, Tendon Organ, and Flexor Withdrawal Refl exes
Spinal Refl ex Pathways for Stretch, Tendon Organ, and Flexor Withdrawal Refl exes See Figure 6.4

Corticospinal Tract 2-26
Corticospinal Tract
Midbrain
Identify each structure as you trace the descendingpathway for voluntary motor control throughthe corticospinal (pyramidal) tract.
Pons
Medulla
Medulla
Spinalcord
Above mid-thoraciclevel
Below mid-thoraciclevel
Decussationof pyramids
Motorendplate
Motorendplate
1
2
3
4
5
8
8
76

1. Fibers originate in the motor cortex. 2. Fibers descend via the posterior limb of the internal capsule. 3. Fibers reach the basis pedunculi of the midbrain. 4. Longitudinal bundles branch upon entering the basis pontis. 5. Bundles rejoin to enter the pyramids of the medulla.6. At the lower medulla, the bulk of fi bers cross the median plane to
form the lateral corticospinal tract, whereas some fi bers con-tinue downward in the ipsilateral lateral corticospinal tract.
7. Other fi bers descend via the ipsilateral anterior corticospinal tract.
8. Synapse occurs at the spinal level, and secondary motor neurons innervate muscles at the motor endplates.
Corticospinal Tract
Corticospinal Tract See Figure 6.5

Functional Subdivisions of Cerebellum 2-27
Functional Subdivisions of Cerebellum
Middle vermisHemisphere Schema of
theoretical“unfolding”of cerebellarsurface inderivation ofabove diagram
UvulaPyramidVermis
LingulaFlocculusNodule
Identify the three functional subdivisions of the cerebellum.Explain the role of each in the cerebellum’s accessory roleto the motor cortex in regulation of posture and balance,movement, and planning and initiation of movement.
1
2
3

1. The archicerebellum is composed of the lingula, fl occulus, and nodule. It is involved in regulation of posture and balance and control of eye and head movement. It receives afferent signals from the vestibular apparatus and sends efferent signals through the relevant descending pathways.
2. The paleocerebellum (spinocerebellum) is composed of the uvula, pyramid, and vermis. It is involved in regulation of proximal limb movement. Afferent sensory signals regarding position and move-ment of limbs are used to fi ne-tune limb motion through relevant descending pathways.
3. The neocerebellum (pontocerebellum) is composed of the middle vermis and hemisphere. It has a coordinating role in the regulation of distal limb movement. It receives input from the cerebral cortex (via the pontine nuclei) and aids in the planning and initiation of motor activity through its efferent fi bers.
Comment: The cerebellum has also been conceptualized as anterior, middle, and fl occulonodular lobes. These subdivisions cannot be di-rectly equated to the subdivisions described above.
Functional Subdivisions of Cerebellum
Functional Subdivisions of Cerebellum See Figure 6.6

General Characteristics of the Parasympathetic and Sympathetic Nervous Systems 2-28
General Characteristics of the Parasympa-thetic and Sympathetic Nervous Systems
Complete the table by describing the location ofpreganglionic nerve cell bodies, location of ganglia,and neurotransmitters of the parasympatheticand sympathetic nervous systems.
Characteristic
General characteristics of the parasympatheticand sympathetic nervous systems
Parasympatheticnervous system
Sympatheticnervous system
Location of preganglionicnerve cell bodies
Major neurotransmitterreleased bypostganglionic neuron
?
?
?
?
?
?
?
?
Location of ganglia
Neurotransmitter ofpreganglionic neurons

General Characteristics of the Parasympathetic and Sympathetic Nervous Systems
General Characteristics of the Parasympathetic and Sympathetic Nervous Systems See page 88
GENERAL CHARACTERISTICS OF THE PARASYMPATHETIC AND SYMPATHETIC NERVOUS SYSTEMS
CHARACTERISTIC PARASYMPATHETIC NERVOUS SYSTEM
SYMPATHETIC NERVOUS SYSTEM
Location of preganglionic nerve cell bodies
Brainstem (nuclei of cranial nerves II, VII, IX, and X) or sacral spinal cord (S2–S4; sacral parasympa-thetic nucleus)
Intermediolateral and intermediomedial cell columns of the thoracolumbar spinal cord (T1–L3)
Location of ganglia In or adjacent to target organs
Paravertebral and prevertebral
Neurotransmitter of preganglionic neurons
Acetylcholine (acts at nicotinic receptors)
Acetylcholine (acts at nicotinic receptors)
Major neurotransmit-ter released by postganglionic neuron
Acetylcholine (acts at muscarinic receptors)
Norepinephrine (acts at �� and �-adrenergic receptors)

Identify the action at each site.
Site of action Action Action
Actions of the autonomic nervous system
Parasympatheticnervous system
Sympatheticnervous system
?
?
?
?
?
?
?
?
?
?
?
?
?
?
?
?
?
?
?
?
?
?
?
?
Cardiac pacemaker
Cardiac muscle
Cardiac AV node
Vascular smooth muscle
Gastrointestinal smooth muscle
Gastric parietal cells
Pancreas
Lung, bronchial smooth muscle
Sweat glands
Male reproductive system
Female reproductive system
Pupil
Actions of the Autonomic Nervous System 2-29
Actions of the Autonomic Nervous System

Actions of the Autonomic Nervous System
Actions of the Autonomic Nervous System See page 91
ACTIONS OF THE AUTONOMIC NERVOUS SYSTEM
PARASYMPATHETIC NERVOUS SYSTEM
SYMPATHETIC NERVOUS SYSTEM
SITE OF ACTION ACTION ACTION
Cardiac pacemaker Decreases heart rate Increases heart rate
Cardiac muscle Decreases contractility of atria; limited effects on ventricles
Increases contractility
Cardiac atrioventricular (AV) node
Decreases conduction velocity Increases conduction velocity
Vascular smooth muscle Indirect vasodilation (genital organs and lower gastrointes-tinal tract only) by nitric oxide released from endothelium
α1 Constriction (predominant effect in most vascular beds)β2 Vasodilation
Gastrointestinal smooth muscle
Increases motility Reduces motility
Relaxes sphincters Constricts sphincters
Gastric parietal cells
Acid secretion
Pancreas Exocrine secretion
Lung, bronchial smooth muscle
Constricts Dilates
Sweat glands Secretion
Male reproductive system
Erection Emission during orgasm
Female reproductive system
Vasocongestion, vaginal lubrication
Orgasmic smooth muscle constriction
Pupil Miosis (constriction) Mydriasis (dilation)

Cardiovascular Physiology
SECTION
33-1 Pressures in the Circulation3-2 Distribution of Cardiac Output3-3 Chambers of the Heart3-4 Cardiac Conduction System3-5 Action Potential of Sinoatrial Node Cells3-6 Action Potential of Ventricular Myocytes3-7 Arterial Pressure Wave3-8 Pressures in the Cardiovascular System3-9 Poiseuille’s Law I3-10 Poiseuille’s Law II3-11 Cross-Sectional Area and Flow Velocity3-12 Laminar and Turbulent Flow3-13 Wall Tension3-14 Cardiac Cycle: Atrial Pressure Curve3-15 Cardiac Cycle: Valve Opening and Closure3-16 Cardiac Cycle: The Electrocardiogram3-17 Autonomic Neurotransmitters and the Cardiovascular
System3-18 Baroreceptor Refl ex3-19 Cardiac Function Curve3-20 Force-Velocity Relationship3-21 Pressure-Volume Relationship3-22 Cardiac Function and Vascular Function Curves I3-23 Cardiac Function and Vascular Function Curves II3-24 Vascular Wall3-25 Microcirculation3-26 Lymphatic Flow3-27 Local Regulation of Blood Flow3-28 Renin-Angiotensin-Aldosterone System3-29 Coronary Blood Flow3-30 Fetal Circulation

This page intentionally left blank

Pressures in the Circulation
Pressures in the Circulation 3-1
What are the approximate resting systolic and diastolic bloodpressures (mm Hg) at points 1, 2, 3 and 4 for a normal, healthyperson?
2
4
1
3
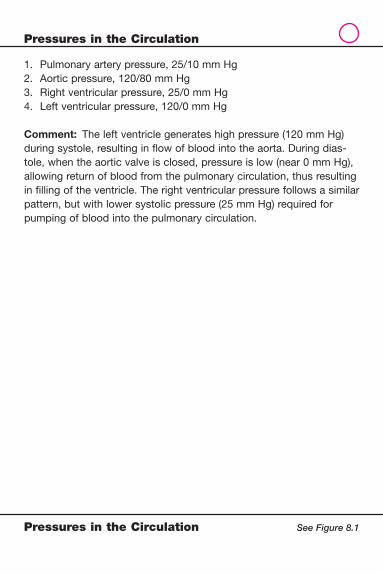
1. Pulmonaryarterypressure,25/10mmHg2. Aorticpressure,120/80mmHg3. Rightventricularpressure,25/0mmHg4. Leftventricularpressure,120/0mmHg
Comment: Theleftventriclegenerateshighpressure(120mmHg)duringsystole,resultinginflowofbloodintotheaorta.Duringdias-tole,whentheaorticvalveisclosed,pressureislow(near0mmHg),allowingreturnofbloodfromthepulmonarycirculation,thusresultinginfillingoftheventricle.Therightventricularpressurefollowsasimilarpattern,butwithlowersystolicpressure(25mmHg)requiredforpumpingofbloodintothepulmonarycirculation.
Pressures in the Circulation
Pressures in the Circulation See Figure 8.1

Distribution of Cardiac Output
Distribution of Cardiac Output 3-2
1. What is cardiac output and its normal, resting value?
2. Give the approximate percentage of cardiac output received by the organs at A through G.
A
B
C
D
E
F
G
Coronarycirculation
Skin and other organs
Kidney
Skeletalmuscle
Brain
Lungs
Liver and gastro-intestinal tract

1. Cardiac output (CO) is the fl ow from one side of the heart (fl ow from the right ventricle equals fl ow from the left ventricle). At rest, normal CO is about 5 L/min.
2. The approximate percentages of CO delivered to various organs are: A. Brain, 13% B. Lungs, 100% C. Coronary circulation, 4% D. Liver and gastrointestinal tract, 24% E. Skeletal muscle, 21% F. Kidneys, 20% G. Skin and other organs, 18%
Comments: These values are for the resting state and are altered with exercise. The lungs always receive 100% of the right ventricular output.
Distribution of Cardiac Output
Distribution of Cardiac Output See Figure 8.1

Identify the chambers and valves of the heartand note whether the blood coursing through thechambers is oxygenated or deoxygenated.
8
76
5
4
3
2
1
Chambers of the Heart 3-3
Chambers of the Heart

1. Left ventricle, oxygenated 2. Right ventricle, deoxygenated 3. Tricuspid valve 4. Right atrium, deoxygenated 5. Aortic valve 6. Mitral valve 7. Left atrium, oxygenated 8. Outfl ow track to the pulmonic valve
Comment: Deoxygenated blood returns from the systemic circulation to the right atrium, fl owing into the right ventricle during diastole. The right ventricle pumps blood into the pulmonary circulation. Oxygen-ated blood returns from the lungs to the left atrium, fl owing into the left ventricle during diastole. The left ventricle pumps this oxygenated blood into the systemic circulation.
The pulmonic valve is not visible in this illustration.
Chambers of the Heart
Chambers of the Heart See Figure 8.2

Identify the components of the cardiac conduction systemand describe the sequence of conduction through thesestructures.
1
2
3
4
5
7
6
Cardiac Conduction System 3-4
Cardiac Conduction System

1. Sinoatrial (SA) node 2. Internodal tracts 3. Atrioventricular (AV) node 4. Common AV bundle (bundle of His) 5. Right bundle branch 6. Left bundle branch 7. Purkinje fi bers
Comment: The SA node is the pacemaker of the heart. Depolariza-tion of this node results in subsequent conduction of the wave of depolarization along internodal tracts to the AV node. Conduction through the AV node is slow, allowing a pause between depolarization and contraction of the atria, and the subsequent depolarization and contraction of the ventricles. After the signal is conducted through the AV node, it is propagated rapidly along the bundle of His, to the bundle branches and Purkinje fi bers, resulting in depolarization and contraction of the ventricular myocardium.
Cardiac Conduction System
Cardiac Conduction System See Figure 9.1
0
Potential(mV)
Ioniccurrents
�65
Outward
Inward
Action potential of SA node cells
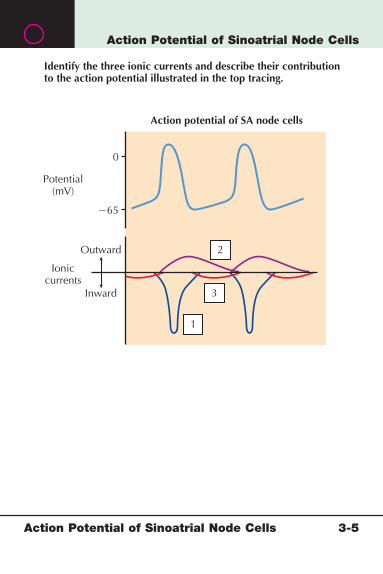
Identify the three ionic currents and describe their contributionto the action potential illustrated in the top tracing.
2
3
1
Action Potential of Sinoatrial Node Cells 3-5
Action Potential of Sinoatrial Node Cells

1. Ionic current iCa2� is an inward calcium current. The upstroke of the action potential is caused by opening of T-type and L-type Ca2� channels and the resultant calcium current. Closing of these channels, along with increased conductance of K�, causes repolarization.
2. Ionic current iK� is an outward potassium current; an increase in this current is responsible for repolarization of the SA node cells along with reduced inward Ca2� current.
3. Ionic current if is an inward current mainly carried by Na� and is responsible for the gradual, spontaneous depolarization of the AV node, leading to threshold and generation of an action potential. Infl ux of Ca2� and reduced activity of the inward potassium current also contribute to spontaneous depolarization.
Action Potential of Sinoatrial Node Cells
Action Potential of Sinoatrial Node Cells See Figure 9.1

Action Potential of Ventricular Myocytes
Action Potential of Ventricular Myocytes 3-6
0
4 4
0
1 2
3Potential(mV)
ERP RRP
Ioniccurrents
�80
Outward
Inward
Action potential of ventricular myocytes
Identify the three ionic currents and describe their contribution to the action potential illustrated in the top tracing.
2
3
1

1. Ionic current iNa� is an inward sodium current. The phase 0 up-stroke of the action potential (top panel) is caused by opening of sodium channels when ventricular cells reach threshold. Inactiva-tion of these channels contributes to the phase 1 rapid repolariza-tion to the plateau (phase 2).
2. Ionic current iK� is an outward potassium current; this current is reduced during much of the action potential. Increased outward potassium current leads to the rapid repolarization of phase 3 (top panel).
3. Ionic current iCa2� is an inward calcium current. Opening of voltage-sensitive slow L-type Ca2� channels and the resulting inward calcium current are responsible for the phase 2 plateau (top panel). Gradual inactivation of these channels leads to activa-tion of K� channels and therefore rapid repolarization owing to the increased outward potassium current.
Action Potential of Ventricular Myocytes
Action Potential of Ventricular Myocytes See Figure 9.1

Arterial Pressure Wave
Arterial Pressure Wave 3-7
120
Pres
sure
Time
80
Name each pressure in this tracing of arterial pressureand determine the value for each.
1
3
2
4

1. Systolic pressure, 120 mm Hg 2. Diastolic pressure, 80 mm Hg 3. Pulse pressure, 40 mm Hg, calculated as systolic pressure minus
diastolic pressure 4. Mean arterial pressure (MAP), 93 mm Hg, calculated by the
formula:
MAP � diastolic pressure � 1⁄3 pulse pressure
Comment: The formula, MAP � diastolic pressure � 1⁄3 pulse pres-sure, yields an approximation of MAP at normal heart rates, when the duration of diastole is about twice that of systole.
Arterial Pressure Wave
Arterial Pressure Wave See Figure 10.1
Pressures in the Cardiovascular System
Pressures in the Cardiovascular System 3-8
1201008060
Pres
sure
(mm
Hg)
40200
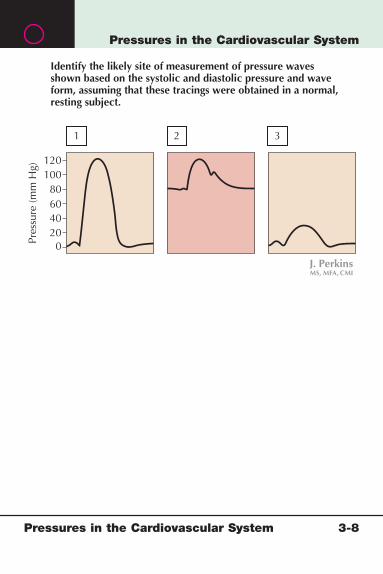
Identify the likely site of measurement of pressure wavesshown based on the systolic and diastolic pressure and waveform, assuming that these tracings were obtained in a normal,resting subject.
21 3
1. Left ventricular pressure, 120/0 mm Hg 2. Aortic pressure, 120/80 mm Hg 3. Right ventricular pressure, 25/0 mm Hg
Pressures in the Cardiovascular System
Pressures in the Cardiovascular System See Figure 10.2

Poiseuille’s Law I 3-9
Poiseuille’s Law I
P1 P2
Blood
Vessel wall
Length (L)
Radius
1. Give the formula for flow (Q) based on Poiseuille’s law.
2. Give a simplified formula for the relationship amongflow (Q), pressure, and resistance.
Q
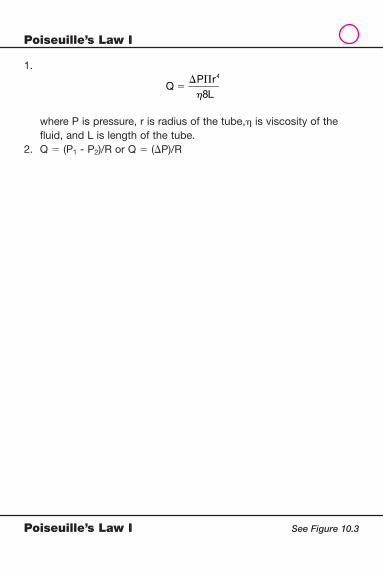
1.
QP r
L
4
�� �
�8
where P is pressure, r is radius of the tube,� is viscosity of the fl uid, and L is length of the tube.
2. Q � (P1 - P2)/R or Q � (�P)/R
Poiseuille’s Law I
Poiseuille’s Law I See Figure 10.3

Poiseuille’s Law II 3-10
Poiseuille’s Law II
Blood
Vessel wall
Length (L)
Radius
Predict the effect on flow (Q) for each of these changes,assuming that other parameters are held constant:
1. A doubling of the pressure gradient, �P2. A doubling of the length of the tube, L3. A doubling of the radius of the tube, r
P1 P2�P = P1 – P2
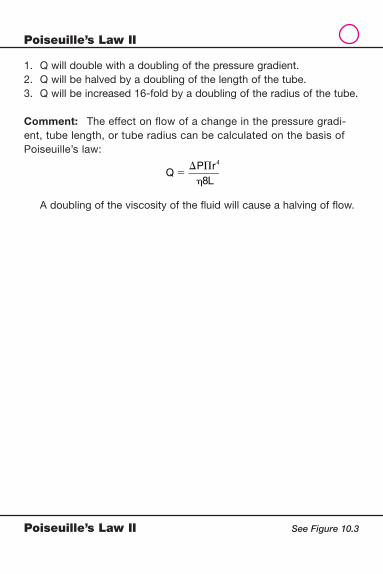
1. Q will double with a doubling of the pressure gradient. 2. Q will be halved by a doubling of the length of the tube. 3. Q will be increased 16-fold by a doubling of the radius of the tube.
Comment: The effect on fl ow of a change in the pressure gradi-ent, tube length, or tube radius can be calculated on the basis of Poiseuille’s law:
QP r
L
4
�� �
�8
A doubling of the viscosity of the fl uid will cause a halving of fl ow.
Poiseuille’s Law II
Poiseuille’s Law II See Figure 10.3

Cross-Sectional Area and Flow Velocity 3-11
Cross-Sectional Area and Flow Velocity
V2
V2
V2
V2
V2
V2
V2
V2
V2
A
BAorta
10010
20
30
40
200
300
400
500
600
Arteries
Area (A)
Velocity(V)
Cro
ss-S
ectio
nal A
rea
(cm
2 )
Vel
ocity
(cm
/sec
)
Arterioles VenulesCapillaries Veins
Vena cava
1. What is the relative velocity of fluid in the large tube (V1) compared with the velocity of fluid in one of the small tubes (V2), assuming thateach of the nine small tubes has a cross sectional area equal to oneninth the area of the large tube?
2. Give the appropriate equation for determining the answer.
V1
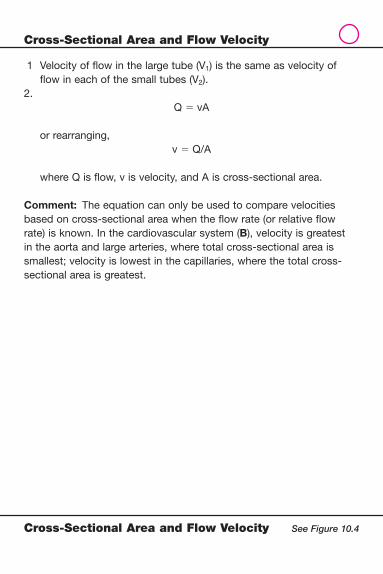
1 Velocity of fl ow in the large tube (V1) is the same as velocity of fl ow in each of the small tubes (V2).
2. Q � vA
or rearranging,v � Q/A
where Q is fl ow, v is velocity, and A is cross-sectional area.
Comment: The equation can only be used to compare velocities based on cross-sectional area when the fl ow rate (or relative fl ow rate) is known. In the cardiovascular system (B), velocity is greatest in the aorta and large arteries, where total cross-sectional area is smallest; velocity is lowest in the capillaries, where the total cross-sectional area is greatest.
Cross-Sectional Area and Flow Velocity
Cross-Sectional Area and Flow Velocity See Figure 10.4

Laminar and Turbulent Flow 3-12
Laminar and Turbulent Flow
Turbulent flow
1. Give the formula that predicts whether flow in a tube will belaminar or turbulent.
2. Explain how each of the variables in the formula affects theprobability that flow will be laminar or turbulent.
Laminar flow

1. Reynold’s number (Re) determines whether fl ow in a tube will be laminar or turbulent:
RvD
e � �
η
where v is velocity, D is diameter of the tube, � is density of the fl uid, and � is viscosity of the fl uid.
2. Assuming other variables are held constant, increased velocity, tube diameter, and density of fl uid are associated with greater like-lihood of turbulence; increased viscosity is associated with greater likelihood of laminar fl ow.
Laminar and Turbulent Flow
Laminar and Turbulent Flow See Figure 10.5

Wall Tension 3-13
Wall Tension
Ascending aorta
Rupture of aneurysm
Dissection ofaortic wall
Descending aorta
Note the change in vessel diameter in the area of the ruptured aneurysm.
1. What is the formula for wall tension in a vessel?
2. Explain why an aneurysm of this type is prone to rupturebased on this formula.
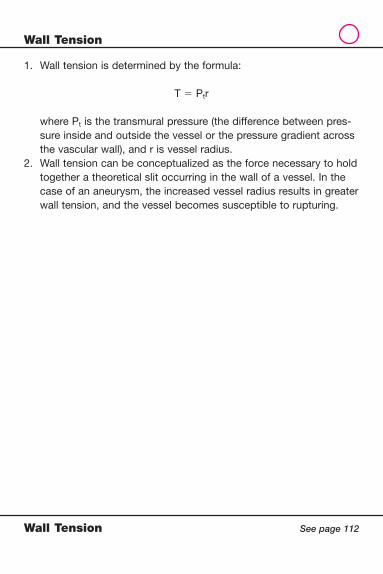
1. Wall tension is determined by the formula:
T � Ptr
where Pt is the transmural pressure (the difference between pres-sure inside and outside the vessel or the pressure gradient across the vascular wall), and r is vessel radius.
2. Wall tension can be conceptualized as the force necessary to hold together a theoretical slit occurring in the wall of a vessel. In the case of an aneurysm, the increased vessel radius results in greater wall tension, and the vessel becomes susceptible to rupturing.
Wall Tension
Wall Tension See page 112

Cardiac Cycle: Atrial Pressure Curve 3-14
Cardiac Cycle: Atrial Pressure Curve
120
100
80
60
40
20
0543210
130
90
50
110
70
Pres
sure
(mm
Hg)
Aor
tic b
lood
flow
(L/m
in)
Ven
tric
ular
volu
me
(mL)
In this cardiac cycle diagram, identify the three waves of the atrial pressure curve (dashed line). Explain the cause of each of these waves.
21
3

1. The a wave of the atrial pressure curve is caused by atrial con-traction.
2. The c wave occurs during isovolumetric contraction and is caused by bulging of the mitral valve back into the left atrium as the ven-tricle attempts to contract against a fi xed volume.
3. The v wave occurs during the ejection phase of the cardiac cycle as left atrial pressure rises slowly while venous return from the pulmonary circulation fi lls the atrium.
Cardiac Cycle: Atrial Pressure Curve
Cardiac Cycle: Atrial Pressure Curve See Figure 11.1

Cardiac Cycle: Valve Opening and Closure 3-15
Cardiac Cycle: Valve Opening and Closure
120
100
80
60
40
20
0543210
130
90
50
110
70
Pres
sure
(mm
Hg)
Aor
tic b
lood
flow
(L/m
in)
Ven
tric
ular
volu
me
(mL)
In this cardiac cycle diagram, identify the valve opening orclosure occurring at points 1– 4.
2
1
3
4

1. Mitral valve closure 2. Aortic valve opening 3. Aortic valve closure 4. Mitral valve opening
Cardiac Cycle: Valve Opening and Closure
Cardiac Cycle: Valve Opening and Closure See Figure 11.1

Cardiac Cycle: The Electrocardiogram 3-16
Cardiac Cycle: The Electrocardiogram
120
100
80
60
40
20
0543210
130
90
50
110
70
Pres
sure
(mm
Hg)
Aor
tic b
lood
flow
(L/m
in)
Ven
tric
ular
volu
me
(mL)
In this cardiac cycle diagram, identify the heart sounds that might be heard at points 1– 4 and the cardiac event associatedwith each sound.
21 3 4

1. S4, associated with active ventricular fi lling (atrial contraction); it is not heard in healthy adults
2. S1, associated with closure of the mitral and tricuspid valves 3. S2, associated with closure of the aortic and pulmonic valves 4. S3, associated with rapid, passive ventricular fi lling; it is often
heard in children but not in healthy adults
Cardiac Cycle: The Electrocardiogram
Cardiac Cycle: The Electrocardiogram See Figure 11.1
S4
S1 S2 S3
Hea
rtso
unds
120
100
80
60
40
20
0543210
130
90
50
110
70
Pres
sure
(mm
Hg)
Aor
tic b
lood
flow
(L/m
in)
Ven
tric
ular
volu
me
(mL)
Mitralvalvecloses
Aorticvalveopens
Aortic valve closes
Mitral valve opens
Aorticpressure
Left ventricularpressure
Left atrialpressure
Atri
al s
ysto
le
Isov
olum
etric
cont
ract
ion
Rapi
d ej
ectio
n
Redu
ced
ejec
tion
Isov
olum
etric
rela
xatio
n
Rapi
dve
ntric
ular
fillin
g
Redu
ced
vent
ricul
ar
fillin
g(d
iast
asis
)

Autonomic Neurotransmitters and the Cardiovascular System 3-17
Autonomic Neurotransmitters and the Cardiovascular System
Sacr
al
Spinalcord
Lum
bar
Thor
acic
Cer
vica
lB
rain
stem
Vagusnerves
Ganglion
Ganglion
Adrenalmedulla
Small arteriesand arterioles
Somevascular beds
SA
AV
Lum
bar
Thor
acic
Cer
vica
lB
rain
stem
Identify the major neurotransmitters released at points 1–4.
2
32
1
1
1
3
3
4
PARASYMPATHETIC SYMPATHETIC

1. Acetylcholine (ACh) is released by preganglionic fi bers of both the sympathetic and parasympathetic nervous systems.
2. ACh is released by postganglionic fi bers of the parasympathetic nervous system at the SA and AV nodes of the heart and in some vascular beds (in the genital region and lower gastrointestinal tract).
3. Norepinephrine (NE) is released by postganglionic fi bers of the sympathetic nervous system at the SA and AV nodes, ventricular myocardium, and blood vessels.
4. Epinephrine (two thirds) and NE (one third) are released by the ad-renal medullary chromaffi n cells in response to sympathetic ner-vous system activation.
Autonomic Neurotransmitters and the Cardiovascular System
Autonomic Neurotransmitters and the Cardiovascular System See Figure 11.2

Baroreceptor Refl ex 3-18
Baroreceptor Refl ex
Indicate the direction of change in the variables at points 1– 8,and explain the sequence of events that occurs asa result of the baroreceptor reflex following a rise in mean arterial pressure (MAP).
MAPStroke volume
Venous tone
Veins
Contractility
Ventricle
Peripheralresistance
Arterioles
Sympatheticefferent output
Cardiac output
Cardiac output
Heart rate CNS (medulla)
SA node
Firing rate ofbaroreceptorafferent fibers
Stroke volume
Venous return
Parasympatheticefferent output
MAP (mm Hg)Sy
mpa
thet
ic e
ffere
nt n
erve
activ
ity (%
bas
elin
e)
100
200
0
0 100 2002
4
5
1
3 8 7 6
Change in posture(standing to lying)
MAP
MAP

1. Increase in fi ring rate of baroreceptor afferent fi bers. The rise in MAP produces stretch of the arterial baroreceptors, which initiate signals to the medullary cardiovascular center.
2. Increase in parasympathetic efferent output occurs in response to the increased fi ring of baroreceptor afferent fi bers.
3. Decrease in heart rate, and therefore cardiac output, as a result of increased parasympathetic stimulation of the heart.
4. Decrease in sympathetic efferent output occurs in response to increased fi ring of baroreceptor afferent fi bers.
5. Decrease in peripheral resistance and venous tone are produced by vasodilation in response to reduced sympathetic efferent activity.
6. Decrease in contractility of the ventricle as a result of reduced sympathetic stimulation of the heart.
7. Decrease in stroke volume, and therefore cardiac output, in re-sponse to reduced venous tone and myocardial contractility.
8. Decrease in MAP is the result of reduced peripheral resistance and cardiac output.
Comment: Heart rate decreases as the result of increased parasym-pathetic outfl ow, as illustrated, and as a result of reduced sympa-thetic efferent activity. The decrease in stroke volume is the result of both reduced contractility and reduced preload. The latter is caused by the decrease in venous tone.
Baroreceptor Refl ex
Baroreceptor Refl ex See Figure 11.2

Cardiac Function Curve 3-19
Cardiac Function Curve
Right atrial pressureB
Strokevolume orcardiacoutput
Normal resting state
Normal cardiac function curve is illustrated in A. Identifythe changes or events that would produce a displacementof the curve to 1 or 2 in B.
Right atrial pressureA
Cardiacfunction curve
Strokevolume orcardiacoutput
1
2
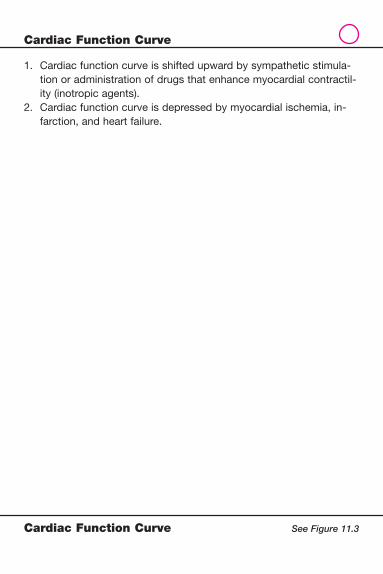
1. Cardiac function curve is shifted upward by sympathetic stimula-tion or administration of drugs that enhance myocardial contractil-ity (inotropic agents).
2. Cardiac function curve is depressed by myocardial ischemia, in-farction, and heart failure.
Cardiac Function Curve
Cardiac Function Curve See Figure 11.3

Force-Velocity Relationship 3-20
Force-Velocity Relationship
Vm
A
B
Vm
Afterload
Afterload
Vel
ocity
of s
hort
enin
gV
eloc
ity o
f sho
rten
ing
The solid line in A and B illustrates normal force-velocitycurve. Identify the change that would produce adisplacement of the curve to 1 or 2.
1
2

1. Increased preload 2. Increased contractility
Comment: Force-velocity curves are altered when preload or contractility is changed. When preload is increased, the curve is shifted upward, but Vm (the maximal velocity, occurring at zero afterload) is unchanged. Increased contractility, however, results in a shift in the curve with an increase in Vm.
Force-Velocity Relationship
Force-Velocity Relationship See Figure 11.5

Pressure-Volume Relationship 3-21
Pressure-Volume Relationship
120
40
100
50
Ventricular volume (mL)
Pressure(mm Hg)
Strokevolume
Aorticvalve
Close
Close
Open
OpenMitralvalve
1500
120
80
60
40
100
20
20
50 100 1500
120
80
60
40
100
20
50 100 1500
120
80
60
40
100
20
50 100 1500
Normal left ventricular pressure-volume relationship forthe heart is illustrated in A. Identify the manipulation thatwould change this relationship to those represented in B.
A
B
2
3
1

1. Increased preload (end-diastolic volume) 2. Increased afterload (arterial pressure) 3. Increased contractility
Comment: The top panel illustrates the normal, resting left ventricu-lar pressure-volume relationship during a cardiac cycle. An increase in preload (end-diastolic volume) results in greater stroke volume through the Frank-Starling mechanism (1). An increase in afterload results in opening of the aortic valve at a higher left ventricular pres-sure; stroke volume is reduced (2). Increase in contractility produces a greater stroke volume that is not dependent on a change in end-diastolic volume (3).
Pressure-Volume Relationship
Pressure-Volume Relationship See Figure 11.6

Cardiac Function and Vascular Function Curves I 3-22
Cardiac Function and Vascular Function Curves I
Right atrial pressure
Car
diac
out
put (
L/m
in)
MCP
2
0 2 4 6 8 10
4
6
8
10
The solid lines illustrate the normal, resting cardiac functionand vascular function curves. Identify the manipulation orevent that would result in vascular function curves 1 and 2.What effect would the altered vascular function haveon cardiac output?
2
1X
B
A

1. Hemorrhage (hypovolemia); decreased cardiac output 2. Increased blood volume or venoconstriction; increased cardiac
output
Comment: Hemorrhage results in a downward shift in the vascular function curve. The new equilibrium between the cardiac and vascular function curves at point A refl ects lower preload (as refl ected by lower right atrial pressure) and cardiac output. Hypervolemia causes an up-ward shift in the vascular function, and the new equilibrium at point B is at higher preload and cardiac output. Venoconstriction also causes an upward shift in the vascular function curve.
Cardiac Function and Vascular Function Curves I
Cardiac Function and Vascular Function Curves I See Figure 11.7

Cardiac Function and Vascular Function Curves II 3-23
Cardiac Function and Vascular Function Curves II
Right atrial pressure
MCP
2
0 2 4 6 8 10
4
6
8
10
The solid lines illustrate the normal, resting cardiac functionand vascular function curves. Identify the manipulation orevent that would result in cardiac function curves 1 and 2.
2
1
Car
diac
func
tion
(L/m
in)
X
C
D

1. Sympathetic stimulation or administration of inotropic drugs 2. Heart failure, ischemia, infarction
Comment: With sympathetic stimulation or inotropic drug adminis-tration, the cardiac function is shifted upward; the new equilibrium point (C) is at higher cardiac output and lower preload (as refl ected by right atrial pressure). With heart failure, the cardiac function curve shifts downward, resulting in lower cardiac output and higher preload (D).
Cardiac Function and Vascular Function Curves II
Cardiac Function and Vascular Function Curves II See Figure 11.7

Vascular Wall 3-24
Vascular Wall
Name each tissue layer in the wall of this vessel. Foreach, name the predominant cell or tissue types.
2
3
1

1. Tunica intima; this innermost layer consists of a single endothelial cell layer resting on a basement membrane
2. Tunica media; the media consists mainly of smooth muscle 3. Tunica adventitia; consists mainly of connective tissue
Comment: Absolute and relative thickness of media and adventitia varies between arteries and veins, and between small and large ves-sels. Connective tissue and cellular constituents of these layers vary between vessel types as well. Walls of large arterial vessels are rich in elastic tissue, with relatively thick adventitia compared with smaller arteries. Smaller arteries have a relatively thicker tunica media. Capil-laries contain no media or adventitia, and their vascular walls consist only of endothelial cells and basement membrane. The illustrated ves-sel is a small artery.
Vascular Wall
Vascular Wall See Figure 12.1
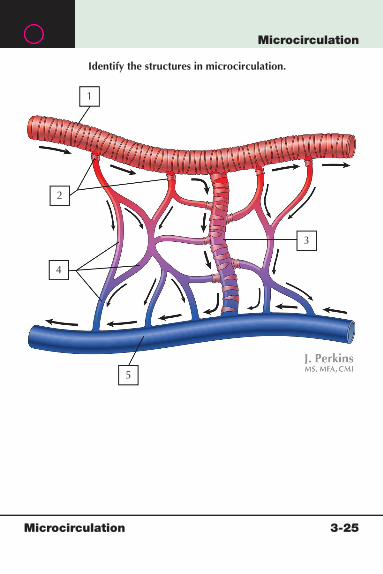
Microcirculation 3-25
Microcirculation
Identify the structures in microcirculation.
2
1
4
3
5

1. Arteriole 2. Precapillary sphincters 3. Metarteriole 4. Capillaries 5. Venules
Microcirculation
Microcirculation See Figure 12.2
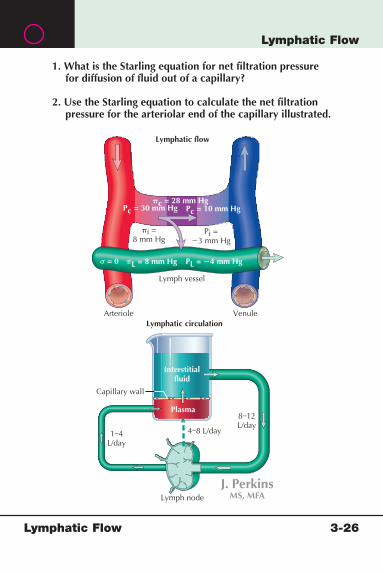
Lymphatic Flow 3-26
Lymphatic Flow
Pi =�3 mm Hg
i =8 mm Hg
�c = 28 mm Hg
Arteriole Venule
Lymph node
Lymph vessel
Lymphatic flow
Lymphatic circulation
Capillary wall
8–12L/day
4–8 L/day1–4L/day
1. What is the Starling equation for net filtration pressurefor diffusion of fluid out of a capillary?
2. Use the Starling equation to calculate the net filtrationpressure for the arteriolar end of the capillary illustrated.
PL = �4 mm HgL = 8 mm Hg = 0
Interstitialfluid
Plasma
Pc = 30 mm Hg Pc = 10 mm Hg

1. Net fi ltration pressure � (Pc � Pi) � (c � i), where Pc is capillary hydrostatic pressure, Pi is interstitial hydro-
static pressure, c is capillary oncotic pressure, and i is oncotic pressure in the interstitium.
2. Net fi ltration pressure � (30 mm Hg � [�3 mm Hg]) � (28 mm Hg � 8 mm Hg) � 13 mm Hg
Comment: Filtration pressure is higher at the arteriolar end of capil-laries than at the venular end because hydrostatic pressure falls as blood fl ows through capillaries. In the illustration, the net fi ltration pressure at the venular end of the capillary is �7 mm Hg.
Lymphatic Flow
Lymphatic Flow See Figure 12.3
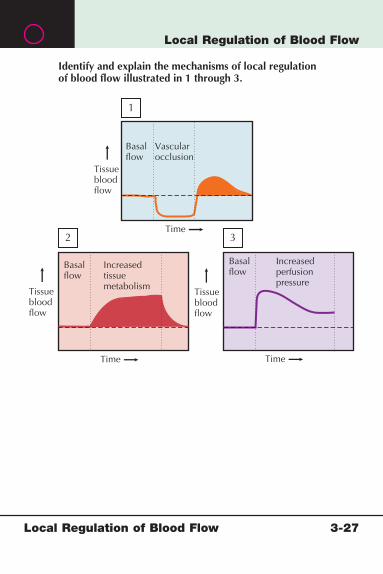
Local Regulation of Blood Flow 3-27
Local Regulation of Blood Flow
Basalflow
Increasedperfusionpressure
Increasedtissuemetabolism
Basalflow
Basalflow
Vascularocclusion
Time
Tissuebloodflow
Tissuebloodflow
Tissuebloodflow
Time
Time
Identify and explain the mechanisms of local regulationof blood flow illustrated in 1 through 3.
2 3
1

1. Reactive hyperemia. Occlusion of blood fl ow to a region results in buildup of metabolic products; when fl ow is restored, the accu-mulated vasodilator metabolites produce increased blood fl ow.
2. Active hyperemia. Increased tissue metabolism results in greater local blood fl ow, caused by increased metabolic products with va-sodilatory actions.
3. Myogenic regulation (autoregulation). Arterial smooth muscle constricts in response to increased transmural pressure, resulting in autoregulation of local fl ow. Thus, when perfusion pressure is artifi cially increased, although fl ow immediately rises, in many vas-cular beds it subsequently returns toward normal.
Local Regulation of Blood Flow
Local Regulation of Blood Flow See Figure 12.5
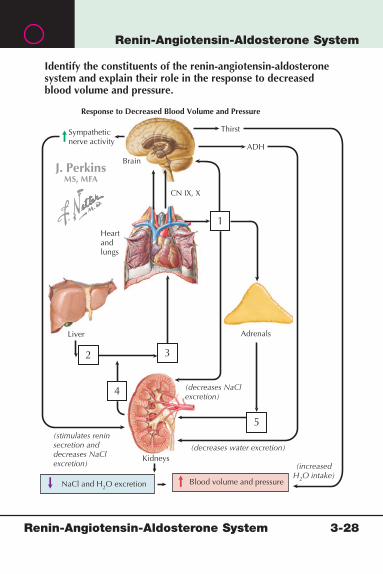
Renin-Angiotensin-Aldosterone System 3-28
Renin-Angiotensin-Aldosterone System
Response to Decreased Blood Volume and Pressure
Thirst
Brain
Heart andlungs
Liver Adrenals
CN IX, X
Sympatheticnerve activity
Kidneys
ADH
(stimulates reninsecretion anddecreases NaClexcretion)
(decreases water excretion)
(decreases NaClexcretion)
(increasedH2O intake)
NaCl and H2O excretion Blood volume and pressure
Identify the constituents of the renin-angiotensin-aldosteronesystem and explain their role in the response to decreasedblood volume and pressure.
4
2
1
3
5

1. Angiotensin II. Angiotensin-converting enzyme (ACE) is found on the surface of endothelial cells, particularly in the lungs, and converts angiotensin I to angiotensin II. Through its various renal effects, angiotensin II reduces NaCl and water excretion.
2. Angiotensinogen. The liver produces angiotensinogen, the precursor for angiotensin I and II.
3. Angiotensin I. Angiotensin I is produced by the action of the enzyme renin on angiotensinogen.
4. Renin. This enzyme is released by the kidney in response to re-duced renal blood fl ow and sympathetic nerve activity; it cleaves angiotensinogen to form angiotensin I.
5. Aldosterone. This steroid is produced by cells of the zona glo-merulosa of the adrenal cortex in response to angiotensin II. At the kidney, its actions result in retention of NaCl and water.
Comment: Angiotensin II is a vasoconstrictor but does not play a role in the normal regulation of vascular smooth muscle tone in most vascular beds. However, in states such as hemorrhagic shock, the vasoconstriction by angiotensin II may be important as one of the mechanisms that raise total peripheral resistance.
Note that in contrast to other vascular beds, in the kidney, angio-tensin II does have a physiologic role in regulating the tone of afferent and efferent arterioles.
Renin-Angiotensin-Aldosterone System
Renin-Angiotensin-Aldosterone System See Figure 12.7

Coronary Blood Flow 3-29
Coronary Blood Flow
1
2
3
4
Aorta
120
100
80
400
300
200
100
0
6040200
0.2 0.4 0.6Time (seconds)
Left coronaryartery
Right coronaryartery
Aor
tic p
ress
ure
(mm
Hg)
Phas
ic c
oron
ary
bloo
d flo
w(m
L/m
in)
0.8 1.0
Sternocostal aspect
Aorta
Identify coronary arteries labelled 1– 4. In the bottom panel, explainthe basis for the changes in left coronary artery flow at 5 and 6.
5
6

1. Right coronary artery 2. Left coronary artery 3. Circumfl ex branch of the left coronary artery 4. Anterior descending (anterior interventricular) branch of the left
coronary artery 5. This fall in left coronary fl ow occurs at the beginning of cardiac
systole during isovolumetric contraction. It is caused by extravas-cular tissue pressure, which compresses the coronary vasculature in the wall of the left ventricle as the heart contracts. For the re-mainder of systole, left coronary fl ow remains low and follows the pattern of the systolic aortic pressure curve.
6. The great rise in left coronary fl ow during early diastole is caused by the fall in extravascular tissue pressure as the heart relaxes, along with vasodilator effects of metabolites (particularly adenos-ine) that build up during systole, when fl ow is low.
Comment: The pattern of right coronary artery fl ow follows that of aortic pressure. This is because extravascular tissue pressure in the right ventricular wall is much lower than in the left ventricular wall and therefore has only a modest effect on coronary fl ow.
Coronary Blood Flow
Coronary Blood Flow See Figure 12.9

Fetal Circulation 3-30
Fetal Circulation
Identify the structures in fetal circulation, and for eachexplain the basis for its closure after birth.
1
2
3
4
5
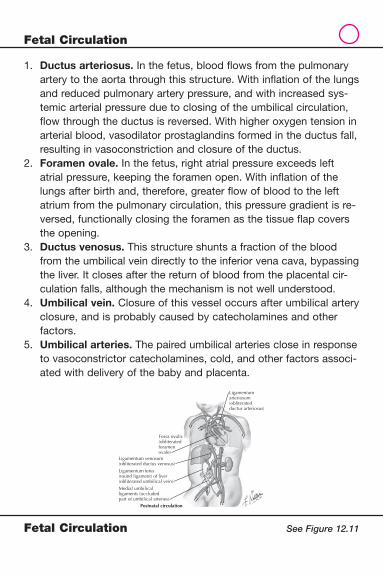
Postnatal circulation
Ligamentumarteriosum(obliteratedductus arteriosus)
Fossa ovalis(obliteratedforamenovale)
Ligamentum venosum(obliterated ductus venosus)
Ligamentum teres(round ligament) of liver(obliterated umbilical vein)
Medial umbilicalligaments (occludedpart of umbilical arteries)
1. Ductus arteriosus. In the fetus, blood fl ows from the pulmonary artery to the aorta through this structure. With infl ation of the lungs and reduced pulmonary artery pressure, and with increased sys-temic arterial pressure due to closing of the umbilical circulation, fl ow through the ductus is reversed. With higher oxygen tension in arterial blood, vasodilator prostaglandins formed in the ductus fall, resulting in vasoconstriction and closure of the ductus.
2. Foramen ovale. In the fetus, right atrial pressure exceeds left atrial pressure, keeping the foramen open. With infl ation of the lungs after birth and, therefore, greater fl ow of blood to the left atrium from the pulmonary circulation, this pressure gradient is re-versed, functionally closing the foramen as the tissue fl ap covers the opening.
3. Ductus venosus. This structure shunts a fraction of the blood from the umbilical vein directly to the inferior vena cava, bypassing the liver. It closes after the return of blood from the placental cir-culation falls, although the mechanism is not well understood.
4. Umbilical vein. Closure of this vessel occurs after umbilical artery closure, and is probably caused by catecholamines and other factors.
5. Umbilical arteries. The paired umbilical arteries close in response to vasoconstrictor catecholamines, cold, and other factors associ-ated with delivery of the baby and placenta.
Fetal Circulation
Fetal Circulation See Figure 12.11

4-1 Pressures in the Pulmonary Circulation4-2 Pulmonary Artery Pressure and Pulmonary Vascular
Resistance4-3 Lung Volume and Pulmonary Vascular Resistance4-4 Chemical and Humoral Control of Pulmonary Vascular
Resistance4-5 Intrapulmonary Airways4-6 Ultrastructure of Airways4-7 Lung Volumes4-8 Respiratory Muscles4-9 Partial Pressure of Gases in the Atmosphere4-10 Partial Pressure of Oxygen and Carbon Dioxide in
Inspired Air, Alveolar Air, and Blood4-11 Alveolar Gas Equation4-12 Distribution of Pulmonary Blood Flow4-13 Ventilation–Perfusion Relationships4-14 Pressure–Volume Relationships of Respiratory System4-15 Pulmonary Compliance4-16 Surface Forces in the Lung4-17 Airway Flow I4-18 Airway Flow II4-19 Expiratory Flow–Volume Relationship4-20 Lung Disease I4-21 Lung Disease II4-22 Oxyhemoglobin Dissociation Curve I4-23 Oxyhemoglobin Dissociation Curve II4-24 Oxyhemoglobin Dissociation Curve III4-25 Oxyhemoglobin Dissociation Curve IV4-26 Carbon Dioxide Transport I4-27 Carbon Dioxide Transport II4-28 Role of Lungs in pH Balance4-29 Control of Respiration4-30 Respiratory Response to Exercise
SECTION
4
Respiratory Physiology

This page intentionally left blank

Pressures in the Pulmonary Circulation
Pressures in the Pulmonary Circulation 4-1
Contrast the approximate resting pressures in the pulmonarycirculation and right side of the heart to those of systemiccirculation and left side of the heart:
1. Pulmonary artery vs. aorta2. Right ventricle vs. left ventricle3. Right atrium vs. left atrium
VeinsVeins
Arteries Arteries
Leftatrium
Rightatrium
Leftventricle
Rightventricle
Systemiccirculation
Pulmonarycirculation
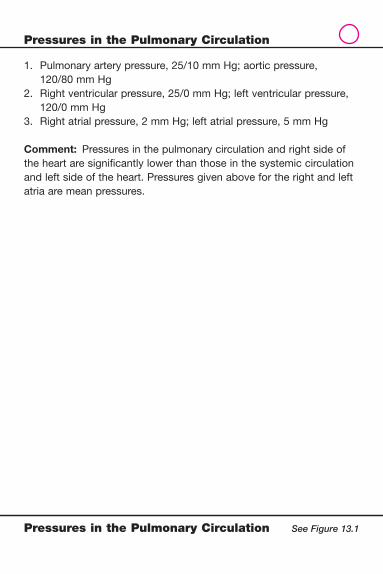
1. Pulmonary artery pressure, 25/10 mm Hg; aortic pressure, 120/80 mm Hg
2. Right ventricular pressure, 25/0 mm Hg; left ventricular pressure, 120/0 mm Hg
3. Right atrial pressure, 2 mm Hg; left atrial pressure, 5 mm Hg
Comment: Pressures in the pulmonary circulation and right side of the heart are signifi cantly lower than those in the systemic circulation and left side of the heart. Pressures given above for the right and left atria are mean pressures.
Pressures in the Pulmonary Circulation
Pressures in the Pulmonary Circulation See Figure 13.1
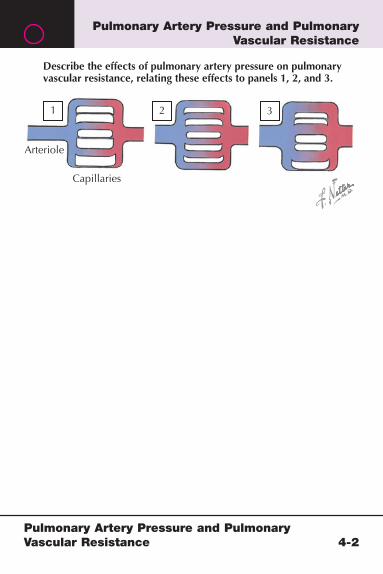
1 2 3
Describe the effects of pulmonary artery pressure on pulmonaryvascular resistance, relating these effects to panels 1, 2, and 3.
Arteriole
Capillaries
Pulmonary Artery Pressure and Pulmonary Vascular Resistance
Pulmonary Artery Pressure and Pulmonary Vascular Resistance 4-2

1. Not all capillaries in the pulmonary circulation are normally open; collapsed capillaries do not conduct blood.
2. An increase in pulmonary artery pressure results in recruitment of capillaries, whereby collapsed vessels are opened when pulmo-nary artery pressure increases, resulting in a fall in pulmonary vascular resistance.
3. Higher pressure also results in distention of pulmonary vessels, which also reduces resistance owing to increased radius of the vessels.
Pulmonary Artery Pressure and Pulmonary Vascular Resistance
Pulmonary Artery Pressure and Pulmonary Vascular Resistance See Figure 13.2

Describe how changes in lung volume affect pulmonary vascularresistance, referring to the illustration.
Effects of lung volumeExtra-alveolarvessels Alveolar
vesselsAlveolus
Alveolus
Low lung vol. High lung vol.
Alveolus
Alveolus
Lung Volume and Pulmonary Vascular Resistance 4-3
Lung Volume and Pulmonary Vascular Resistance

Comment: As lung volume rises (from left panel to right panel), traction distends extra-alveolar vessels, reducing their resistance. In alveolar vessels, on the other hand, increase in lung volume raises resistance as they are compressed by the enlargement of alveoli. Starting from the collapsed state, as a lung is infl ated, pulmonary vascular resistance fi rst falls as a result of distension of extra-alveolar vessels, and then rises as the lung is infl ated further and alveolar vessels are compressed.
Lung Volume and Pulmonary Vascular Resistance
Lung Volume and Pulmonary Vascular Resistance See Figure 13.2
Alveolarvessels
Extra-alveolarvessels
Alveolus
Alveolus
Low lung vol. High lung vol.
Alveolus
Alveolus
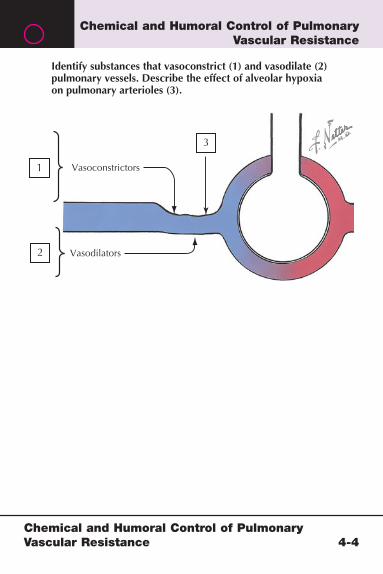
Identify substances that vasoconstrict (1) and vasodilate (2)pulmonary vessels. Describe the effect of alveolar hypoxiaon pulmonary arterioles (3).
1
2
3
Vasoconstrictors
Vasodilators
Chemical and Humoral Control of Pulmonary Vascular Resistance 4-4
Chemical and Humoral Control of Pulmonary Vascular Resistance

1. �-Adrenergic agonists, thromboxane, norepinephrine, angiotensin II, histamine, and endothelin constrict pulmonary vessels.
2. �-Adrenergic agonists, bradykinin, prostacyclin, and nitric oxide dilate pulmonary vessels.
3. Alveolar hypoxia constricts pulmonary arterioles, redirecting blood fl ow toward areas of the lung that are better ventilated.
Chemical and Humoral Control of Pulmonary Vascular Resistance
Chemical and Humoral Control of Pulmonary Vascular Resistance See Figure 13.2

Intrapulmonary Airways 4-5
Intrapulmonary Airways
Name the structures labeled 1–4.5. Which structures (labeled 1– 4) constitute the respiratory
zone of the lungs?
1
4
3
2
1. Acinus 2. Terminal bronchiole 3. Respiratory bronchioles 4. Alveolar sacs and alveoli 5. Structures distal to the terminal bronchiole constitute the respira-
tory zone of the lungs (respiratory bronchioles, alveolar ducts, and alveoli).
Intrapulmonary Airways
Intrapulmonary Airways See Figure 13.5

Ultrastructure of Airways 4-6
Ultrastructure of Airways
Identify each cell type.
1
1
7
5
6
7
43
3
2
Mucus
Nerve
Nerve
Nerves
B. Bronchioles.
A. Trachea and large bronchi.

1. Ciliated cells 2. Goblet (mucous) cell 3. Basal cell 4. Brush cell 5. Kulchitsky cell 6. Serous cell 7. Clara cell
Comment: Ciliated cells and goblet cells are predominant in the tra-chea and large bronchi. Ciliated cells are predominant in the bronchi-oles; Clara cells increase distally through the airways, whereas goblet cells and serous cells decrease distally and are absent in the terminal bronchioles.
Ultrastructure of Airways
Ultrastructure of Airways See Figure 13.6
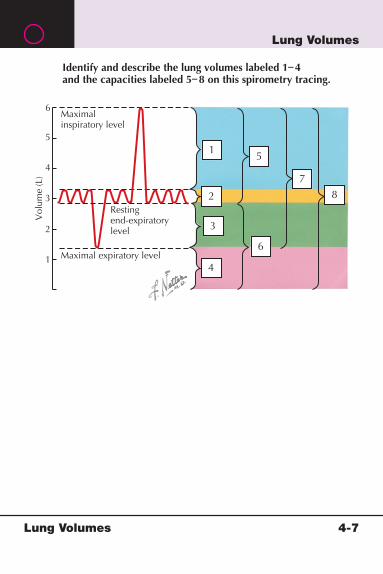
Identify and describe the lung volumes labeled 1– 4and the capacities labeled 5– 8 on this spirometry tracing.
1
78
5
6
4
3
2
Maximalinspiratory level
6
5
4
3
Vol
ume
(L)
2
1 Maximal expiratory level
Restingend-expiratorylevel
Lung Volumes 4-7
Lung Volumes
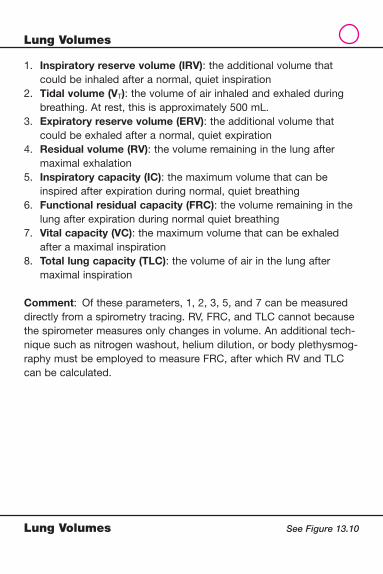
1. Inspiratory reserve volume (IRV): the additional volume that could be inhaled after a normal, quiet inspiration
2. Tidal volume (VT): the volume of air inhaled and exhaled during breathing. At rest, this is approximately 500 mL.
3. Expiratory reserve volume (ERV): the additional volume that could be exhaled after a normal, quiet expiration
4. Residual volume (RV): the volume remaining in the lung after maximal exhalation
5. Inspiratory capacity (IC): the maximum volume that can be inspired after expiration during normal, quiet breathing
6. Functional residual capacity (FRC): the volume remaining in the lung after expiration during normal quiet breathing
7. Vital capacity (VC): the maximum volume that can be exhaled after a maximal inspiration
8. Total lung capacity (TLC): the volume of air in the lung after maximal inspiration
Comment: Of these parameters, 1, 2, 3, 5, and 7 can be measured directly from a spirometry tracing. RV, FRC, and TLC cannot because the spirometer measures only changes in volume. An additional tech-nique such as nitrogen washout, helium dilution, or body plethysmog-raphy must be employed to measure FRC, after which RV and TLC can be calculated.
Lung Volumes
Lung Volumes See Figure 13.10

Respiratory Muscles 4-8
Respiratory Muscles
1–7. Identify the muscles of breathing.
8. Which muscles are involved in normal, quiet breathing?
6
7
1
2
3
4
5

1. Sternocleidomastoid 2. Anterior, middle, and posterior scalenes (from right to left) 3. External intercostals 4. Internal intercostals (interchondral portion) 5. Diaphragm 6. Internal intercostals (except interchondral portion) 7. Abdominal muscles (from top to bottom: rectus abdominis,
external oblique, internal oblique, and transversus abdominis) 8. The diaphragm is the main muscle used in normal, quiet
breathing.
Comment: The principal muscles of inspiration are the external inter-costals, interchondral portion of the internal intercostals, and the dia-phragm; the sternocleidomastoid and scalenes play an accessory role. In quiet respiration, the diaphragm is the main muscle involved. The main muscles of expiration are the internal intercostals (except the interchondral portion) and the abdominal muscles. However, in normal, quiet breathing, no muscles are involved; expiration in this case is driven by passive recoil of the lungs.
Respiratory Muscles
Respiratory Muscles See Figure 14.1

Partial Pressure of Gases in the Atmosphere 4-9
Partial Pressure of Gases in the Atmosphere
Pulmonary artery(mixed venousblood)
Pulmonary vein(arterial blood)
Alveolus
Capillaries
Inspired air
Atmosphere
1. Give the composition of the Earth’s atmosphere in terms of percentage O2, N2, and CO2 in our air.
2. Equate these percentages with partial pressures of the gasesin dry air at sea level.
3. Explain Dalton’s law and how it is used to calculate partialpressure of gases in a mixture.
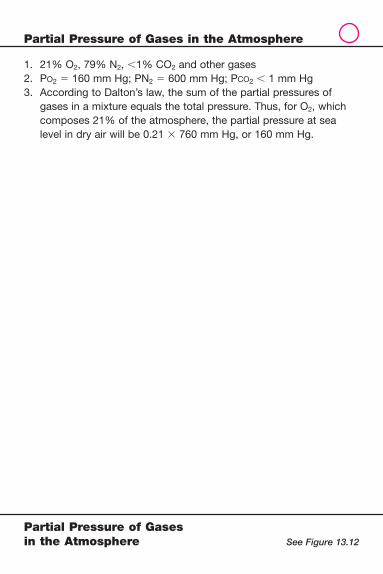
1. 21%O2,79%N2,,1%CO2andothergases2. Po25160mmHg;PN25600mmHg;Pco2,1mmHg3. AccordingtoDalton’slaw,thesumofthepartialpressuresof
gasesinamixtureequalsthetotalpressure.Thus,forO2,whichcomposes21%oftheatmosphere,thepartialpressureatsealevelindryairwillbe0.213760mmHg,or160mmHg.
Partial Pressure of Gases in the Atmosphere
Partial Pressure of Gases in the Atmosphere See Figure 13.12
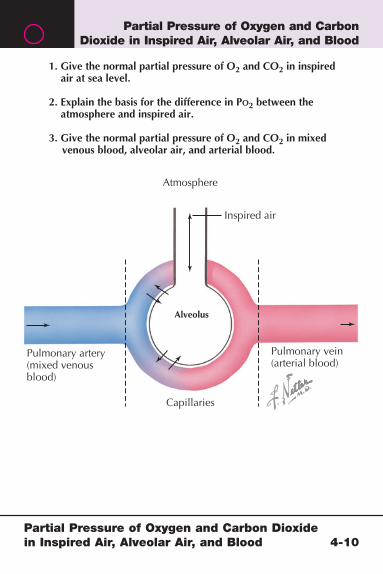
Partial Pressure of Oxygen and Carbon Dioxide in Inspired Air, Alveolar Air, and Blood 4-10
Partial Pressure of Oxygen and Carbon Dioxide in Inspired Air, Alveolar Air, and Blood
Pulmonary artery(mixed venousblood)
Pulmonary vein(arterial blood)
Alveolus
Capillaries
Inspired air
Atmosphere
1. Give the normal partial pressure of O2 and CO2 in inspiredair at sea level.
2. Explain the basis for the difference in PO2 between the atmosphere and inspired air.
3. Give the normal partial pressure of O2 and CO2 in mixedvenous blood, alveolar air, and arterial blood.

1. PO2 � 150 mm Hg; PCO2 � 1 mm Hg 2. Dry air at sea level contains 21% O2 , and the PO2 is 160 mm Hg
(0.21 � 760 mm Hg). When this air is inspired, it is saturated with water vapor, such that the partial pressure of H2O is 47 mm Hg. Thus, PO2 in inspired air is 150 mm Hg (0.21 � 713 mm Hg).
3. For mixed venous blood in a normal, resting individual, PO2 is 40 mm Hg, and PCO2 is 45 mm Hg. For alveolar air and arterial blood, PO2 is 100 mm Hg, and PCO2 is 40 mm Hg.
Comment: PO2 and PCO2 in arterial blood are normally the same as in alveolar air because oxygen and carbon dioxide completely equili-brate between blood and alveolus as blood courses through the alveolar capillaries.
Partial Pressure of Oxygen and Carbon Dioxide in Inspired Air, Alveolar Air, and Blood
Partial Pressure of Oxygen and Carbon Dioxide in Inspired Air, Alveolar Air, and Blood See Figure 13.12

Alveolar Gas Equation 4-11
Alveolar Gas Equation
Pulmonary artery(mixed venous blood)
Pulmonary vein(arterial blood)
Alveolus
Capillaries
Inspired air
Atmosphere
1. Give the alveolar gas equation for determining partial pressureof oxygen in alveolar air.
2. Given the various partial pressures in the diagram below,calculate the partial pressure of oxygen in the alveolar air (PAO2).
PO2 � 160 mm HgPCO2 � 0 mm Hg
PO2 � 150 mm HgPCO2 � 0 mm Hg
PCO2 � 60 mm Hg
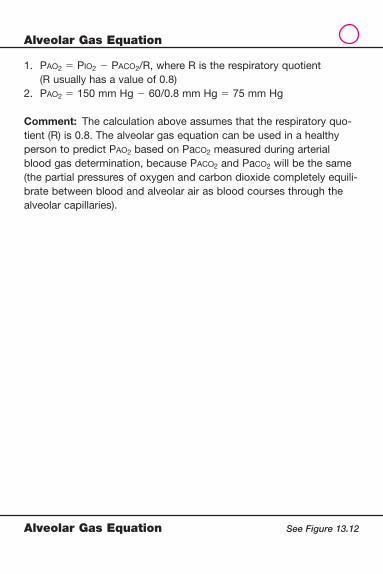
1. PAO2 � PIO2 � PACO2/R, where R is the respiratory quotient (R usually has a value of 0.8)
2. PAO2 � 150 mm Hg � 60/0.8 mm Hg � 75 mm Hg
Comment: The calculation above assumes that the respiratory quo-tient (R) is 0.8. The alveolar gas equation can be used in a healthy person to predict PAO2 based on PaCO2 measured during arterial blood gas determination, because PACO2 and PaCO2 will be the same (the partial pressures of oxygen and carbon dioxide completely equili-brate between blood and alveolar air as blood courses through the alveolar capillaries).
Alveolar Gas Equation
Alveolar Gas Equation See Figure 13.12

Arterialpressure(mm Hg)
Alveolar pressure(mm Hg)
Venous pres-sure (mm Hg)
2
2
2
2
2
2
2
2 12
10
8
6
214
16
18
20
22
24
0
2
4
6
8
10
0
0
0
0
Zone 1.
Zone 2.
Zone 3.
Describe the relationship among arterial, alveolar, and venouspressures in the three zones of the lung and how the relationshipaffects pulmonary blood flow in that zone.
Distribution of Pulmonary Blood Flow 4-12
Distribution of Pulmonary Blood Flow
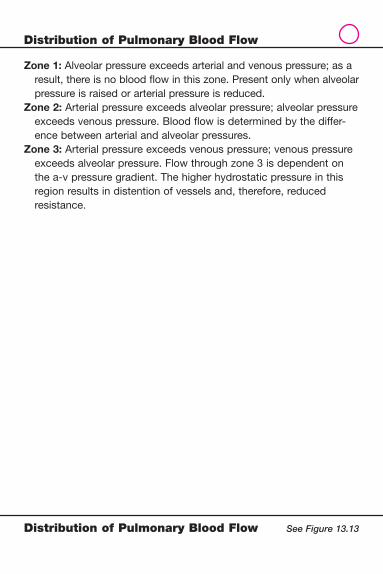
Zone 1: Alveolar pressure exceeds arterial and venous pressure; as a result, there is no blood fl ow in this zone. Present only when alveolar pressure is raised or arterial pressure is reduced.
Zone 2: Arterial pressure exceeds alveolar pressure; alveolar pressure exceeds venous pressure. Blood fl ow is determined by the differ-ence between arterial and alveolar pressures.
Zone 3: Arterial pressure exceeds venous pressure; venous pressure exceeds alveolar pressure. Flow through zone 3 is dependent on the a-v pressure gradient. The higher hydrostatic pressure in this region results in distention of vessels and, therefore, reduced resistance.
Distribution of Pulmonary Blood Flow
Distribution of Pulmonary Blood Flow See Figure 13.13

Ventilation–Perfusion Relationships 4-13
Ventilation–Perfusion Relationships
Ventilationor bloodflow/unitlung vol.
Bottom Top
VA/QC
ratio
Identify the lines representing ventilation, blood flow,and VA/QC from bottom to top of the lung.
1
3
2

1. Line 1 represents blood fl ow (perfusion) from the bottom to the top of the lung. Note the greater gradient for perfusion than for ventilation (line 3).
2. Line 2 represents V· A/Q
· C (the ventilation/perfusion ratio) from
bottom to the top of the lung. Note that the ratio is lowest at the bottom of the lung and greatest at the apex of the lung, and that ventilation and perfusion are best matched in the middle of the lung.
3. Line 3 represents ventilation from bottom to top of the lung. The gradient for ventilation is not nearly as steep as the gradient for perfusion.
Ventilation–Perfusion Relationships
Ventilation–Perfusion Relationships See Figure 13.14

Pressure–Volume Relationships of Respiratory System
Pressure–Volume Relationships of Respiratory System 4-14
�30 �20 �10 0 10 20 30 40Pressure (cm H2O)
100
80
60% TLC % VC
40
20
100
80
60
40
20
0
Identify the lines 1, 2, and 3, and identify the volumes or capacities of 4, 5, and 6.
1
2
3
4
5
6

1. Elastic recoil pressure of the chest wall 2. Elastic recoil pressure of the lung 3. Elastic recoil pressure of the lung and chest wall (the algebraic
sum of elastic recoil pressure of the chest wall and lung) 4. Total lung capacity 5. Functional residual capacity 6. Residual volume
Comment: At functional residual capacity (FRC), the mechanical sys-tem is at rest, with elastic recoil of the lung equal and opposing that of the chest wall. This is the state after quiet expiration in breathing.
Pressure–Volume Relationships of Respiratory System
Pressure–Volume Relationships of Respiratory System See Figure 14.3

Pulmonary Compliance 4-15
Pulmonary Compliance
100
30252015Transpulmonary pressure (cm H2O)
105
A
B
C
0
Lung
vol
. (%
TLC
)
RVFRC
Time
�P
�V
90
80
70
60
50
4030
20
10
1. Define the term “compliance.”
2. Explain the concept of pulmonary compliance in the context of this diagram.
1. Compliance is the change in volume produced by a change in pressure:
Compliance � �V/�P
2. The slope of the pressure–volume relationship in this plot is com-pliance. In the graph, lung volume (percent total lung capacity, or TLC) is plotted against transpulmonary pressure; the latter is measured during periodic interruptions of a slow expiration from TLC. The spirometry tracing during the procedure is illustrated at the left.
Pulmonary Compliance
Pulmonary Compliance See Figure 14.4
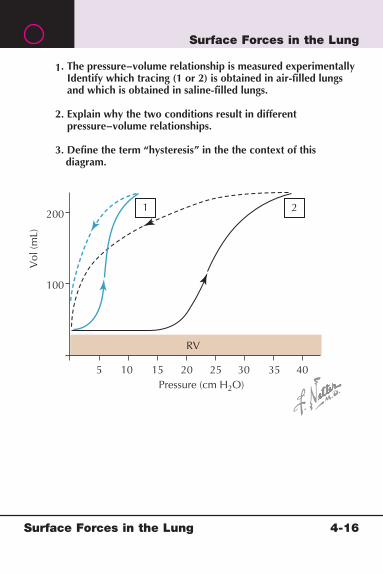
Surface Forces in the Lung 4-16
Surface Forces in the Lung
5 10 15 20
RV
100
Vol
(mL)
200
25Pressure (cm H2O)
30 35 40
1. The pressure−volume relationship is measured experimentallyIdentify which tracing (1 or 2) is obtained in air-filled lungsand which is obtained in saline-filled lungs.
2. Explain why the two conditions result in different pressure−volume relationships.
3. Define the term “hysteresis” in the the context of thisdiagram.
1 2

1. Tracing 1 is obtained in saline-fi lled lungs, whereas tracing 2 is obtained in air-fi lled lungs.
2. In air-fi lled lungs, the surface tension associated with the liquid–air interface results in a higher pressure required to maintain a given lung volume.
3. Hysteresis is the difference in the pressure–volume curve obtained during inspiration (indicated in the diagram by upward arrows) and the curve obtained during expiration (downward arrows). Lung vol-ume associated with any pressure during inspiration is lower than volume at that pressure during expiration, mainly because surface forces must be overcome during inspiration.
Surface Forces in the Lung
Surface Forces in the Lung See Figure 14.5

Airway Flow I 4-17
Airway Flow I
1
2
r � 2
r r
r´ � 1
L � 2 L´ � 4
Resistance �4Resistance �2
1. In pair 1, which of the two tubes has highest resistance, assuming length is the same? By what factor? Explain.
2. In pair 2, which of the two tubes has highest resistance,assuming radius is the same? By what factor? Explain.

1. The smaller of the two tubes has the highest resistance, 16 times greater than in the larger tube. Flow through airways follows Poiseuille’s law, which defi nes resistance (R) as:
RL
r4�
8
where is viscosity of the fl uid, L is length of the tube, and r is ra-dius of the tube. Thus, resistance is inversely related to the fourth power of the radius, and therefore the smaller tube, with half the radius of the larger tube, has 16 times greater resistance.
2. The longer of the two tubes has twice the resistance of the shorter tube. Resistance is directly related to the length of a tube.
Airway Flow I
Airway Flow I See Figure 14.6

Airway Flow II 4-18
Airway Flow II
Identify the type of airflow illustrated in each airway.For each, identify the type of airway in which thistype of flow is likely to occur.
1 2 3

1. Laminar fl ow; occurs mainly in small airways where diameter and velocity are low, both factors favoring laminar fl ow
2. Turbulent fl ow; occurs mainly in trachea and larger airways, where velocity is high and diameter is large, both factors favoring turbu-lent fl ow
3. Transitional fl ow; occurs mainly in larger airways, particularly at branch points and points of narrowing
Comment: Reynold’s number (Re) determines whether fl ow in a tube will be laminar or turbulent:
RVD
e ��
where V is velocity, D is diameter of the tube, � is density of the fl uid, and is viscosity of the fl uid. Higher Re is associated with turbulence.
Airway Flow II
Airway Flow II See Figure 14.6

Expiratory Flow–Volume Relationship 4-19
Expiratory Flow–Volume Relationship
80 60 40 20 01000
2
4
6
8
Flow
(L/s
ec)
% VC
Expiratory flow–volumecurves performed withmaximal effort (solid line)and reduced effort (dotted line)
1
2
3
Identify points 1 and 2 on these curves.Explain the convergence of the down slopesof the two curves in the segment labeled 3.

1. Peak expiratory fl ow rate (PEFR) at maximum effort (during a forced vital capacity maneuver)
2. PEFR at reduced effort 3. The downward slope (expiratory phase) of the fl ow–volume curve
is effort independent. During this phase of the curve, fl ow is lim-ited by dynamic compression of the airways. Thus, once maxi-mum fl ow rate is reached, further increases in pleural pressure will only increase resistance proportionally, and the two lines overlap (solid line represents a forced vital capacity maneuver; dotted line represents the fl ow–volume curve performed at reduced effort)
Expiratory Flow–Volume Relationship
Expiratory Flow–Volume Relationship See Figure 14.7

Lung Disease I 4-20
Lung Disease I
Lung volume (liters)
Flow
(lite
rs/s
econ
d)
2
4
6
8
8 7 6 5 4 3
Maximum expiratory flow–volume curves
1. Identify the category of lung disease characterized bythe expiratory flow–volume curve labeled 1.
Describe how the following parameters are affected (increased, decreased, or unchanged) in this type of disease:
2. Total lung capacity (TLC)3. Functional residual capacity (FRC)4. Residual volume (RV)5. Forced vital capacity (FVC)6. FEV1 (forced expiratory volume in the first second of a vital capacity maneuver)7. FEV1/FVC
1
Normal

1. Obstructive lung disease 2. TLC is increased in obstructive lung disease. 3. FRC is increased. 4. RV is increased. 5. FVC is reduced slightly. 6. FEV1 is reduced. 7. FEV1/FVC is reduced.
Lung Disease I
Lung Disease I See Figure 14.8

Lung Disease II 4-21
Lung Disease II
Lung volume (liters)
Maximum expiratory flow−volume curves
Flow
(lite
rs/s
econ
d)
2
4
6
8
7 6 5 4 3 2
1. Identify the category of lung disease characterized by the expiratory flow–volume curve labeled 1.
Describe how the following parameters are affected (increased, decreased, or unchanged) in this type of disease
2. Total lung capacity (TLC)3. Functional residual capacity (FRC)4. Residual volume (RV)5. Forced vital capacity (FVC)6. FEV1 (forced expiratory volume in the first second of a vital capacity maneuver)7. FEV1/FVC
1
Normal

1. Restrictive lung disease 2. TLC is decreased in restrictive lung disease. 3. FRC is decreased. 4. RV is decreased. 5. FVC is reduced. 6. FEV1 is reduced. 7. FEV1/FVC is normal or elevated.
Comment: Lung volumes are reduced in restrictive lung diseases. Although FEV1 is reduced, the FEV1/FVC ratio is usually normal or elevated because FVC is also diminished in restrictive disease.
Lung Disease II
Lung Disease II See Figure 14.8

Oxyhemoglobin Dissociation Curve I 4-22
Oxyhemoglobin Dissociation Curve I
SO2
(%)
O2
cont
ent (
mL/
100
mL
bloo
d)
10020
12
10
8
4
2
80
60
40
20
20 40 60PO2 (mm Hg)
80 100
Oxyhemoglobin dissociation curve(at pH 7.4, PCO2 40 mm Hg, 37° C)
1. Identify this line. Give the formula for calculation ofthe maximum amount of oxygen that can be carriedin blood in this form.
2. Identify this line. Give the formula relating the amountof oxygen carried in blood in this form to partialpressure of oxygen.
1
2

1. Oxygen combined with hemoglobin:
O2 binding capacity � (1.34 mL O2/g Hb) � (g Hb/100 mL blood)
2. Dissolved oxygen:
Dissolved O2 � 0.003 mL O2/ 100 mL blood/mm Hg Po2
Comment: At normal blood hemoglobin concentration of 15 g/dL, O2 binding capacity of blood is 20.1 mL O2/100 mL blood. Based on PO2 of 100 mm Hg in arterial blood, the concentration of dissolved oxygen will be 0.3 mL O2/100 mL blood.
Oxyhemoglobin Dissociation Curve I
Oxyhemoglobin Dissociation Curve I See Figure 15.2

Oxyhemoglobin Dissociation Curve II 4-23
Oxyhemoglobin Dissociation Curve II
SO2
(%)
O2
cont
ent (
mL/
100
mL
bloo
d)
100 20
12
10
8
4
2
80
60
40
20
20 40 60PO2 (mm Hg)
80 100
Oxyhemoglobin dissociation curve(at pH 7.4, PCO2 40 mm Hg, 37° C)
The illustration is based on the assumption that hemoglobin content of blood is 15g/100 mL. How would a change in hemoglobin concentration to 12g/100 mLblood affect:
1. SO2 (percentage saturation of hemoglobin with oxygen)?2. O2 content of blood?3. Dissolved O2 in blood?
1. A fall in hemoglobin concentration will not affect saturation of hemoglobin with O2. Thus, looking the top line in the graph (the oxyhemoglobin dissociation curve) at PO2 of 40 mm Hg, for exam-ple, hemoglobin will still be 75% saturated with oxygen, but the oxygen content of blood will be reduced (below).
2. A fall in hemoglobin concentration will proportionally reduce the concentration of oxyhemoglobin at a given PO2. Thus, at PO2 of 40 mm Hg and hemoglobin concentration of 12 g/100 mL (reduced from 15 g/100 mL), hemoglobin will still be 75% satu-rated with oxygen, but the oxygen content of blood will be reduced by 20% because there is 20% less hemoglobin.
3. Dissolved oxygen (bottom line on the graph) will be unaffected by a change in hemoglobin concentration.
Oxyhemoglobin Dissociation Curve II
Oxyhemoglobin Dissociation Curve II See Figure 15.2

Oxyhemoglobin Dissociation Curve III 4-24
Oxyhemoglobin Dissociation Curve III
SO2
(%) PCO2 40
100
80
60
40
20
20 40 60PO2 (mm Hg)
80 100
Effects of PCO2, pH,and temperature on
O2 dissociation curve
pH 7.4
100
80
60
40
20
20 40 60PO2 (mm Hg)
80 100
37° C
100
80
60
40
20
20 40 60PO2 (mm Hg)
80 100
The solid lines in graphs 1, 2, and 3 represent the normaloxyhemoglobin dissociation curve. The effect of changesin PCO2, pH and temperature on the binding of oxygenby hemoglobin are illustrated by the dotted and dashedlines in graphs 1, 2, and 3, respectively.
Describe the qualitative effects of an increase or decreasein PCO2, pH and temperature on the oxyhemoglobindissociation curve in the context of the graphs.
1
2 3

1. A rise in PCO2 shifts the oxyhemoglobin dissociation curve to the right (dashed line), whereas a fall in PCO2 shifts the curve to the left (dotted line).
2. A rise in pH shifts the curve to the left (dotted line), whereas a fall in pH shifts the curve to the right (dashed line).
3. A rise in temperature shifts the curve to the right (dashed line), whereas a fall in temperature shifts the curve to the left (dotted line).
Comment: Note that the oxyhemoglobin dissociation curve is shifted to the right under conditions of increased PCO2, low pH and high tem-perature, conditions that occur locally during tissue hypoxia and in-creased metabolism (e.g., during exercise). The rightward shift of the curve results in decreased affi nity of hemoglobin for oxygen and there-fore enhances delivery of oxygen to tissues. 2,3-Disphosphoglycerate (2,3-DPG), a metabolite of red blood cell glycolysis, also shifts the curve to the right and is elevated during hypoxia.
Oxyhemoglobin Dissociation Curve III
Oxyhemoglobin Dissociation Curve III See Figure 15.2

Oxyhemoglobin Dissociation Curve IV 4-25
Oxyhemoglobin Dissociation Curve IVO
2 co
nten
t (m
L O
2/10
0 m
L bl
ood)
20
15
10
5
0
0 20 40 60PO2 (mm Hg)
80 100
1–3. Identify oxyhemoglobin dissociation curves as curves expected in the normal state (15g Hb/100 mL), anemic state(7.5 g Hb/100 mL) and carbon monoxide poisoning.
4. Describe the effects of anemia on oxygen content of blood.
5. Describe the effects of carbon monoxide poisoning on oxygen content of blood.
1
2
3
1. Normal Hb (15 g Hb/100 mL) 2. Carbon monoxide poisoning (as illustrated, normal Hb but 50% as
carboxyhemoglobin) 3. Anemia (7.5 g Hb/100 mL) 4. In anemia, the content of oxygen in blood is reduced at any PO2 in
proportion to the reduction of hemoglobin concentration. Thus, on the graph, at any PO2, O2 concentration of the anemic blood (line 3) is half that of normal blood (line 1).
5. Carbon monoxide has much higher affi nity for hemoglobin than oxygen. In carbon monoxide poisoning, CO displaces oxygen bound to hemoglobin, forming carboxyhemoglobin and therefore reducing the oxygen carrying capacity of blood.
Comment: Finger-probe and earlobe-probe pulse oximeters used to monitor arterial SO2 rely on colorimetric measurements, but because carboxyhemoglobin, like oxyhemoglobin, is red, false, high SO2 read-ings result when this instrument is used in patients suffering from CO poisoning.
Oxyhemoglobin Dissociation Curve IV
Oxyhemoglobin Dissociation Curve IV See page 184
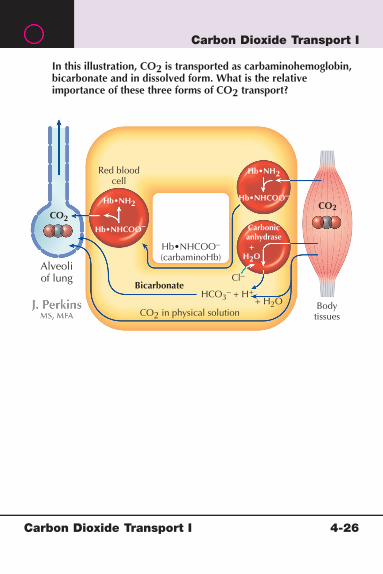
Carbon Dioxide Transport I 4-26
Carbon Dioxide Transport I
CO2
CO2
+ H2OHCO3
– + H+
Cl–Alveoliof lung
Bodytissues
Red bloodcell
CO2 in physical solution
Bicarbonate
Hb•NHCOO–
(carbaminoHb)
In this illustration, CO2 is transported as carbaminohemoglobin,bicarbonate and in dissolved form. What is the relativeimportance of these three forms of CO2 transport?
+H2O
Hb•NH2
Hb•NHCOO–
Hb•NH2
Hb•NHCOO–
Carbonicanhydrase
1. About 70% of CO2 in blood is carried in the form of bicarbonate anion (HCO3
�). 2. Up to 23% of CO2 may be combined with protein, including he-
moglobin (as carbaminohemoglobin). CO2 binds to terminal amino groups of blood proteins.
3. About 7% of CO2 in blood is dissolved CO2. Because solubility of CO2 in plasma is relatively high (20 � the solubility of O2), the dis-solved form of CO2 has a signifi cant role in its transport.
Carbon Dioxide Transport I
Carbon Dioxide Transport I See Figure 15.3

Carbon Dioxide Transport II 4-27
Carbon Dioxide Transport II
CO
2 co
nten
t (m
L/dL
blo
od)
55
50
45
40
30 40PCO2 (mm Hg)
50
CO2 Equilibrium Curves(for normal arterial and venous blood)
Based on this illustration, explain the Haldaneeffect and how it facilitates transport of CO2.

Comment: The dissociation curve for CO2 in blood is linear and is shifted to the left when hemoglobin is in the form of deoxyhemoglo-bin, as in venous blood. Thus, the left, upper line in the fi gure is the curve for venous blood (the normal PvO2 marked), whereas the right, lower line represents the CO2 dissociation curve for arterial blood (the point marked is the normal PaO2. This shift is the Haldane effect. As a result of this effect, as hemoglobin is deoxygenated in systemic capil-laries, its affi nity for CO2 is increased, facilitating CO2 transport. In the lungs, as hemoglobin is oxygenated, its affi nity for CO2 is reduced, and as a result, transfer of CO2 from blood to alveolar air is facilitated.
Carbon Dioxide Transport II
Carbon Dioxide Transport II See Figure 15.3

Role of Lungs in pH Balance 4-28
Role of Lungs in pH Balance
“Acid Load”
Bodytissues
CO2
CO2+
H2O+
NaA
NH4+
NH4AReplenishNaHCO3
NaHCO3
1. Write the Henderson-Hasselbalch equation as it appliesto the bicarbonate buffer system.
2. Write the equation in a form whereby pH can be calculatedbased on PCO2 and plasma bicarbonate concentration.
3. Explain, in the context of this diagram, how the lungs actas a buffer for changes in blood pH.
4. Explain, in the context of this diagram, how changes in respiratory function can be a cause of acidosis or alkalosis.
Volatile Acid(CO2)
Nonvolatile Acid(HA)
H+
H+
H+
H+
H+
H+ H+
H+
H+H+
H+ + HCO3– H2O + CO2 CO2
H+ + A– HA

1. pH pK log
HCO
H CO2
� ��[ ]
[ ]3
3
2.
pH logHCO
Pco� �
�
�
6 10 03
3
2
.[ ]
.
3. CO2 formed during metabolism of lipids and carbohydrates is normally readily eliminated by the respiratory system. By adjusting respiration, the system can compensate for pH imbalances pro-duced by metabolic disturbances. Thus, metabolic acidosis is compensated for in part by increased respiration, whereas reduced ventilation will occur in metabolic alkalosis.
4. Disturbances in respiration can result in acid–base imbalance because changes in CO2 elimination will directly affect carbonic acid levels. Hypoventilation will cause respiratory acidosis, whereas hyperventilation will cause respiratory alkalosis. When a respiratory acid–base disturbance occurs, the compensation is primarily renal.
Role of Lungs in pH Balance
Role of Lungs in pH Balance See Figure 15.4
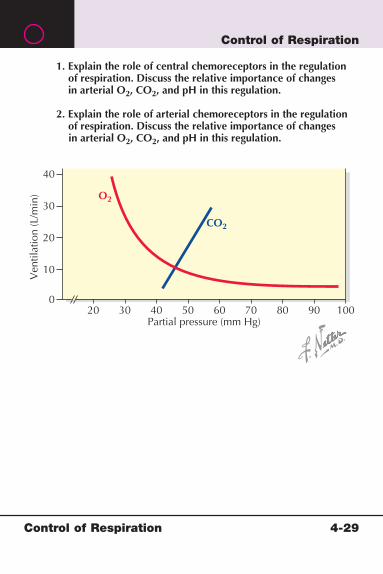
Control of Respiration 4-29
Control of Respiration
1. Explain the role of central chemoreceptors in the regulationof respiration. Discuss the relative importance of changesin arterial O2, CO2, and pH in this regulation.
2. Explain the role of arterial chemoreceptors in the regulationof respiration. Discuss the relative importance of changes in arterial O2, CO2, and pH in this regulation.
40
30
20
Ven
tilat
ion
(L/m
in)
10
020 30 40 50
Partial pressure (mm Hg)60 70 80 90 100
CO2
O2
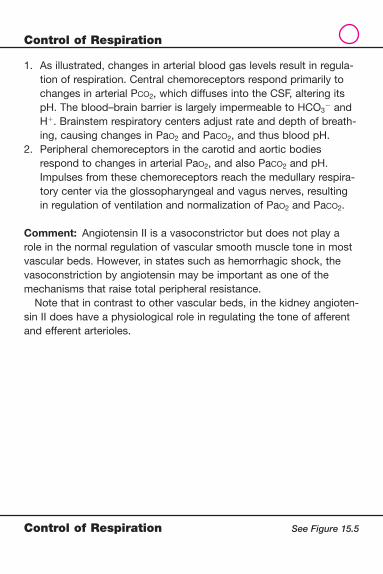
1. As illustrated, changes in arterial blood gas levels result in regula-tion of respiration. Central chemoreceptors respond primarily to changes in arterial PCO2, which diffuses into the CSF, altering its pH. The blood–brain barrier is largely impermeable to HCO3
� and H�. Brainstem respiratory centers adjust rate and depth of breath-ing, causing changes in PaO2 and PaCO2, and thus blood pH.
2. Peripheral chemoreceptors in the carotid and aortic bodies respond to changes in arterial PaO2, and also PaCO2 and pH. Impulses from these chemoreceptors reach the medullary respira-tory center via the glossopharyngeal and vagus nerves, resulting in regulation of ventilation and normalization of PaO2 and PaCO2.
Comment: Angiotensin II is a vasoconstrictor but does not play a role in the normal regulation of vascular smooth muscle tone in most vascular beds. However, in states such as hemorrhagic shock, the vasoconstriction by angiotensin may be important as one of the mechanisms that raise total peripheral resistance.
Note that in contrast to other vascular beds, in the kidney angioten-sin II does have a physiological role in regulating the tone of afferent and efferent arterioles.
Control of Respiration
Control of Respiration See Figure 15.5
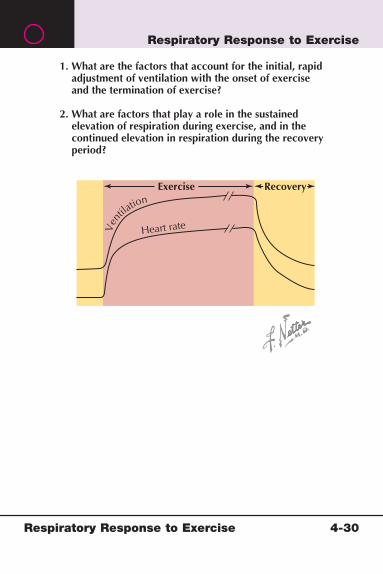
Respiratory Response to Exercise 4-30
Respiratory Response to Exercise
Exercise Recovery
Ven
tilation
Heart rate
1. What are the factors that account for the initial, rapidadjustment of ventilation with the onset of exerciseand the termination of exercise?
2. What are factors that play a role in the sustained elevation of respiration during exercise, and in thecontinued elevation in respiration during the recoveryperiod?

1. The rapid increase in respiration at the onset of exercise is through neural and refl exive mechanisms. Although not all of the mecha-nisms are known, one mechanism is that activation of motor pathways results in collateral activation of the respiratory center. Afferent signals from muscle and joint mechanoceptors result in further activation of respiration.
2. The slow responses that play a role in sustained elevation of respi-ration during exercise and during the recovery period are feedback responses. Chemoreceptor activation by changes in PaO2, PaCO2, and blood pH is important; the rise in core body temperature during exercise also has a role in stimulating respiration.
Respiratory Response to Exercise
Respiratory Response to Exercise See Figure 15.6

5-1 Anatomy of the Kidney5-2 Anatomy of the Kidney: The Nephron5-3 Anatomy of the Kidney: Nephron Populations5-4 Anatomy of the Kidney: The Glomerulus5-5 Glomerular Filtration5-6 Renal Handling of Substances: Calculations5-7 Regulation of Renal Hemodynamics I5-8 Regulation of Renal Hemodynamics II5-9 General Solute Handling through the Nephron I5-10 General Solute Handling through the Nephron II5-11 General Solute Handling through the Nephron III5-12 General Solute Handling through the Nephron IV5-13 Nephron Sites of Sodium Handling5-14 Hormonal Control of Renal Sodium Reabsorption5-15 Reabsorption of Glucose I5-16 Reabsorption of Glucose II5-17 Renal Bicarbonate Handling5-18 Renal Solute Handling: Potassium Handling I5-19 Renal Solute Handling: Potassium Handling II5-20 Renal Calcium Handling5-21 Renal Phosphate Handling5-22 Interstitial Concentration Gradient5-23 Urine Concentration5-24 Renin-Angiotensin-Aldosterone System (RAAS) I5-25 Renin-Angiotensin-Aldosterone System (RAAS) II5-26 Renin-Angiotensin-Aldosterone System (RAAS) III5-27 Renin-Angiotensin-Aldosterone System (RAAS) IV5-28 Volume Regulation I: Integrative Response to Volume
Contraction5-29 Volume Regulation II: Integrated Response to Volume
Expansion5-30 Acid–Base I: Renal Mechanisms of Acid–Base
Homeostasis5-31 Acid–Base II: Ammonia Synthesis
SECTION
5
Renal Physiology

5-32 Acid–Base III: Net Acid Excretion (NAE)5-33 Acid–Base IV: Titratable Acids5-34 Acid–Base V: Acidosis and Anion Gap5-35 Acid–Base Imbalances I5-36 Acid–Base Imbalances II
Renal Physiology
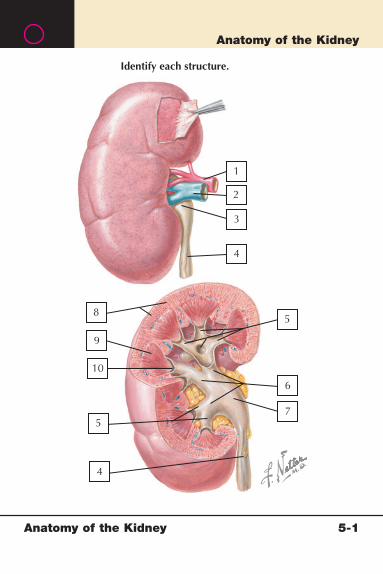
Anatomy of the Kidney
Anatomy of the Kidney 5-1
Identify each structure.
2
3
4
5
6
7
8
9
10
5
4
1
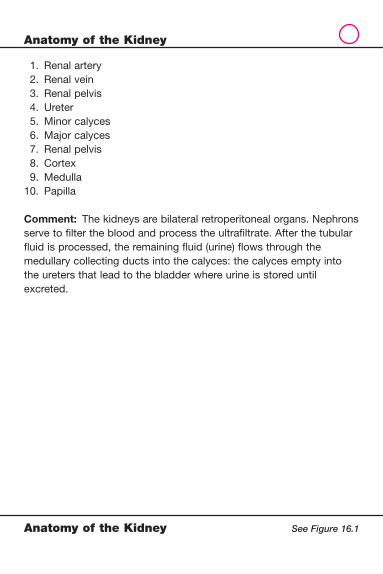
1. Renal artery 2. Renal vein 3. Renal pelvis 4. Ureter 5. Minor calyces 6. Major calyces 7. Renal pelvis 8. Cortex 9. Medulla 10. Papilla
Comment: The kidneys are bilateral retroperitoneal organs. Nephrons serve to fi lter the blood and process the ultrafi ltrate. After the tubular fl uid is processed, the remaining fl uid (urine) fl ows through the medullary collecting ducts into the calyces: the calyces empty into the ureters that lead to the bladder where urine is stored until excreted.
Anatomy of the Kidney
Anatomy of the Kidney See Figure 16.1
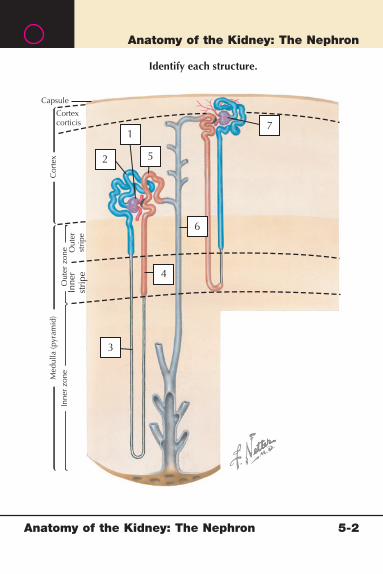
Anatomy of the Kidney: The Nephron
Anatomy of the Kidney: The Nephron 5-2
Inne
r zo
neIn
ner
stri
peOut
er z
one O
uter
stri
pe
Cortexcorticis
Capsule
Med
ulla
(pyr
amid
)C
orte
x
3
4
6
5
1
Identify each structure.
2
7

1. Juxtamedullary glomerulus 2. Proximal convoluted tubule 3. Thin descending limb of Henle 4. Thick ascending limb of Henle 5. Distal tubule 6. Collecting duct 7. Cortical glomerulus
Comment: The nephrons are the functional units of the kidneys. In humans, each kidney contains more than 1 million nephrons. Damage to, or loss of, up to 70% of the nephrons will not severely impair the ability of the kidneys to control fl uid and electrolyte homeostasis.
Anatomy of the Kidney: The Nephron
Anatomy of the Kidney: The Nephron See Figure 16.2
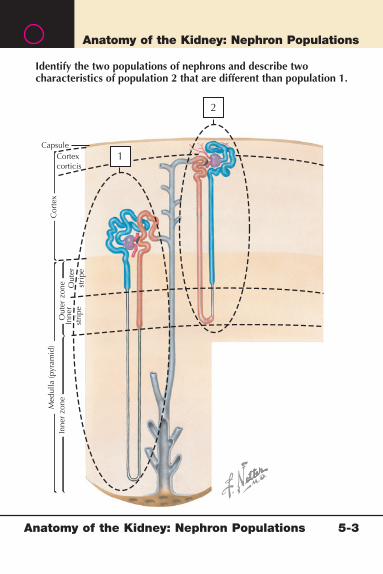
Anatomy of the Kidney: Nephron Populations
Anatomy of the Kidney: Nephron Populations 5-3
Inne
r zo
neIn
ner
stri
pe
Out
er z
one Out
erst
ripe
Cortexcorticis
Capsule
Med
ulla
(pyr
amid
)C
orte
x
1
Identify the two populations of nephrons and describe twocharacteristics of population 2 that are different than population 1.
2

1. Cortical, or superfi cial, nephrons have glomeruli near the surface of the kidney and short loops of Henle that are found in the cortex and outer zone of the medulla. There are more than 1 million nephrons in each kidney, and 80% of the nephrons are cortical.
2. Juxtamedullary, or deep, nephrons have glomeruli in the cortex, but on the border of the medulla, with long loops of Henle, extending far into the medulla. Juxtamedullary nephrons have longer proximal convoluted tubules and loops of Henle than corti-cal nephrons. The longer proximal tubule contributes to greater proximal tubule bulk reabsorption of solutes, and the long loops of Henle establish and maintain a large interstitial osmotic gradient in the medulla, which is necessary for the concentration of urine.
Anatomy of the Kidney: Nephron Populations
Anatomy of the Kidney: Nephron Populations See Figure 16.2

Anatomy of the Kidney: The Glomerulus
Anatomy of the Kidney: The Glomerulus 5-4
Identify each structure.
7
6
532
1 4
8
9
10
11
12
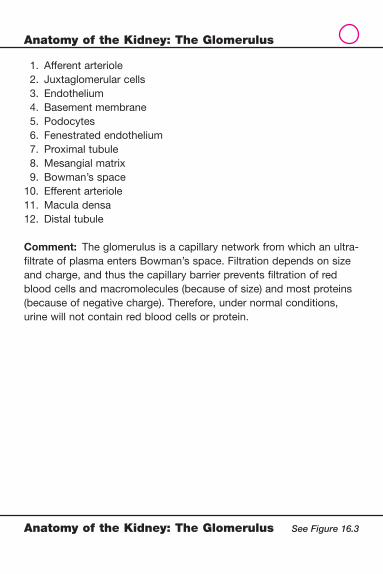
1. Afferent arteriole 2. Juxtaglomerular cells 3. Endothelium 4. Basement membrane 5. Podocytes 6. Fenestrated endothelium 7. Proximal tubule 8. Mesangial matrix 9. Bowman’s space 10. Efferent arteriole 11. Macula densa 12. Distal tubule
Comment: The glomerulus is a capillary network from which an ultra-fi ltrate of plasma enters Bowman’s space. Filtration depends on size and charge, and thus the capillary barrier prevents fi ltration of red blood cells and macromolecules (because of size) and most proteins (because of negative charge). Therefore, under normal conditions, urine will not contain red blood cells or protein.
Anatomy of the Kidney: The Glomerulus
Anatomy of the Kidney: The Glomerulus See Figure 16.3

Glomerular Filtration
Glomerular Filtration 5-5
1. Describe the effects of a selective increase in hydrostatic pressure(HP) in the afferent arteriole on glomerular filtration rate (GFR).
2. Describe the effect of an increase in tubular fluid flow ratethrough the macula densa on GFR.
3. Describe the effects of an increase in mesangial matrix on the GFR.
Afferentarteriole
Endothelium
Basementmembraneof capillary
Visceral epithelium(podocytes)
Fenestratedendothelium
Proximaltubule
Mesangialmatrixand cell
Efferentarteriole
Maculadensa
Distalconvolutedtubule
Juxtaglomerularcells

1. Increasing hydrostatic pressure (P) in the afferent arteriole will in-crease PGC • PGC is the major pressure forcing fl uid out of the capil-lary and contributes to the GFR • GFR � Kf � [(PGC � �BS) � (PBS � �GC)]. Thus, increasing P to the glomerulus will elevate GFR.
2. The juxtaglomerular apparatus (macula densa cells of the distal tubule and juxtaglomerular cells surrounding the afferent arteriole) are key factors in tubuloglomerular feedback control of GFR. Because of this association between the distal tubule and afferent arteriole, increasing tubular fl ow past the macula densa will increase afferent arteriolar resistance and reduce GFR. This mech-anism allows regulation of GFR over a wide range of systemic blood pressures.
3. Increasing mesangial matrix increases the barrier to fi ltration and results in a reduction in GFR. Increased deposition of matrix can occur from pathologic processes involved in chronic renal failure and diabetes.
Glomerular Filtration
Glomerular Filtration See Figure 16.3

Renal Handling of Substances: Calculations
Renal Handling of Substances: Calculations 5-6
V �2 mL/minPin�20 mg%Px �1 mg%Py �90 mg%
Uin�1000 mg%Ux �25 mg%Uy �0 mg%
If the urine flow rate (V) is 2 mL/min, for the values given, determine:
1. Glomerular filtration rate (GFR)2. Fractional excretion of x (FEx)3. Fractional reabsorption of x (FRx)4. Filtered load of y (FLy)5. Describe the net renal handling of substance Y.

1. Glomerular fi ltration rate: GFR � (Uin/Pin) � V̇, thus (1000 mg%/20 mg%) � 2 mL/min � 100 mL/min
2. Fractional excretion of x: FEx � [(Ux/Px)/(Uin/Pin)] �100, thus [(25 mg%/1 mg%)/(1000 mg%/20 mg%)] � 100 � 50%
3. Fractional reabsorption of x: FRx � 100% � FEx, thus 100% � 50% � 50%
4. Filtered load of y: FLy � GFR � Py, thus because 90 mg% � 90 mg/100 mL, 100 mL/min � 90 mg/100 mL � 90 mg/min
5. Net handling of a substance can be determined by comparing the clearance of the substance to the GFR (clearance of inulin). The clearance of substance Y is:
[(Uy/Py)] � V̇ � [(0 mg%/90 mg%)] � 2 mL/min � 0 mL/min
Thus, the clearance of Y is less than the clearance of inulin, so net reabsorption occurred. Furthermore, in this particular case, sub-stance Y was 100% reabsorbed because excretion was zero.
Renal Handling of Substances: Calculations
Renal Handling of Substances: Calculations See Figure 6.5

Regulation of Renal Hemodynamics I
Regulation of Renal Hemodynamics I 5-7
Afferentarteriole
Maculadensa
Smoothmuscle
Efferentarteriole
Juxtaglomerularcells
Endothelium
Basementmembraneof capillary
1. Identify the sites where angiotensin II regulates glomerularfiltration rate (GFR); does angiotensin II raise or lower GFR?
2. Describe the role of intrarenal prostaglandins on the GFR.
Fenestratedendothelium
Proximaltubule
Mesangialmatrixand cell
1. Angiotensin (Ang) II is a hormone that causes vasoconstriction of the renal arteries (not shown) and the renal arterioles, reducing glomerular capillary hydrostatic pressure. Ang II also constricts glomerular mesangial cells, and this, in addition to the decrease in capillary hydrostatic pressure, reduces GFR. Ang II is part of the renin-angiotensin-aldosterone system (RAAS).
2. Intrarenal prostaglandins (PGE2 and PGI2) are vasodilators and pri-marily serve to oppose the vasoconstrictor actions of Ang II on ar-terioles and mesangial cells.
Regulation of Renal Hemodynamics I
Regulation of Renal Hemodynamics I See Figure 16.3

Regulation of Renal Hemodynamics II
Regulation of Renal Hemodynamics II 5-8
Afferentarteriole
Maculadensa
Efferentarteriole
Juxtaglomerularcells
Endothelium
Basementmembraneof capillary
1. Identify the sites where sympathetic nerves and catecholaminesregulate glomerular filtration rate (GFR).
2. Does stimulation of sympathetic nerves and catecholamines raise or lower GFR?
Fenestratedendothelium
Proximaltubule
Mesangialmatrixand cell

1. Sympathetic nerves and catecholamines are released in response to reductions in systemic blood pressure and cause constriction of renal arteries (not shown) and arterioles.
2. Decrease GFR.
Regulation of Renal Hemodynamics II
Regulation of Renal Hemodynamics II See Figure 16.3
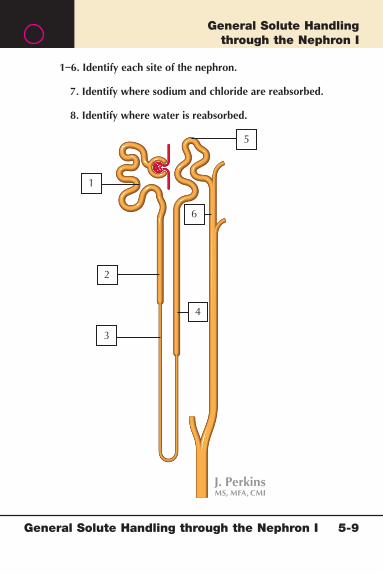
General Solute Handling through the Nephron I
General Solute Handling through the Nephron I 5-9
5
1–6. Identify each site of the nephron.
7. Identify where sodium and chloride are reabsorbed.
8. Identify where water is reabsorbed.
1
3
2
4
6

1. Proximal convoluted tube 2. Proximal straight tube 3. Thin descending limb of Henle 4. Thick ascending limb of Henle 5. Distal tubule 6. Collecting duct 7. Sodium is reabsorbed in the proximal convoluted tubule, proximal
straight tubule, thick ascending limb of Henle, distal tubule, and collecting duct. Chloride follows sodium reabsorption in proximal convoluted tubule, proximal straight tubule, thick ascending limb of Henle, distal tubule, and collecting duct.
8. Water is reabsorbed with sodium movement in proximal convo-luted tubule, proximal straight tubule, thick ascending limb of Henle, distal tubule, and collecting duct. In addition, solute-free water is reabsorbed in the thin descending limb of Henle, and in the presence of antidiuretic hormone (ADH), in the collecting ducts.
General Solute Handling through the Nephron I
General Solute Handling through the Nephron I See Figure 17.1

General Solute Handling through the Nephron II
General Solute Handling through the Nephron II 5-10
1. Identify where amino acids and glucose are reabsorbed.
2. Identify where bicarbonate is reabsorbed.
Proximalconvolutedtubule
Proximalstraight tubule
Distal tubule
Collectingduct
Thin descendinglimb of Henle
Thick ascendinglimb of Henle

1. Amino acids and glucose are reabsorbed (100%) in the proximal convoluted tubule.
2. Bicarbonate is reabsorbed in the proximal convoluted tubule, thick ascending limb of Henle, and collecting duct. Under most normal conditions, the fi ltered bicarbonate is 100% reabsorbed; however, if the person is alkalemic (higher then normal blood pH), bicarbon-ate will be secreted into the collecting ducts and excreted in the urine.
General Solute Handling through the Nephron II
General Solute Handling through the Nephron II See Figure 17.1
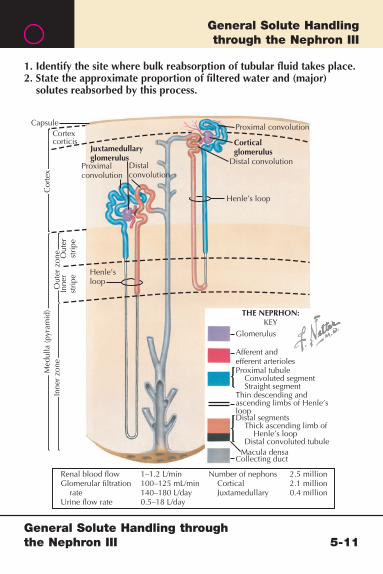
General Solute Handling through the Nephron III
General Solute Handling through the Nephron III 5-11
Proximal convolution
Corticalglomerulus
Distal convolution
Inne
r zo
ne
Henle’s loop
Inne
rst
ripe
Out
er z
one Out
erst
ripe
Proximalconvolution
Distalconvolution
Cortexcorticis
Capsule
1. Identify the site where bulk reabsorption of tubular fluid takes place. 2. State the approximate proportion of filtered water and (major)
solutes reabsorbed by this process.
Glomerulus
Afferent andefferent arteriolesProximal tubule Convoluted segment Straight segmentThin descending andascending limbs of Henle’sloop
Renal blood flow Glomerular filtration rateUrine flow rate
1–1.2 L/min100–125 mL/min140–180 L/day0.5–18 L/day
Number of nephons Cortical Juxtamedullary
2.5 million2.1 million0.4 million
Distal segments Thick ascending limb of Henle’s loop Distal convoluted tubule
Collecting ductMacula densa
Med
ulla
(pyr
amid
)C
orte
x
Juxtamedullaryglomerulus
Henle’sloop
THE NEPRHON:KEY

1. Bulk reabsorption of tubular fl uid takes place in the proximal tubule.
2. About 60% to 70% of the sodium and water, 80% to 85% of K�, 65% of Cl�, and 100% of the glucose and amino acids in the tubular fl uid are reabsorbed.
General Solute Handling through the Nephron III
General Solute Handling through the Nephron III See Figure 16.2
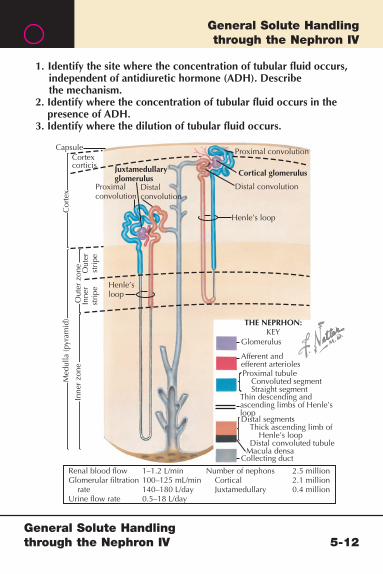
General Solute Handling through the Nephron IV
General Solute Handling through the Nephron IV 5-12
Proximal convolution
Cortical glomerulus
Distal convolution
Inne
r zo
ne
Henle’s loop
Inne
rst
ripe
Out
er z
one
Out
erst
ripe
Proximalconvolution
Distalconvolution
Cortexcorticis
Capsule
1. Identify the site where the concentration of tubular fluid occurs,independent of antidiuretic hormone (ADH). Describethe mechanism.
2. Identify where the concentration of tubular fluid occurs in thepresence of ADH.
3. Identify where the dilution of tubular fluid occurs.
Glomerulus
Afferent andefferent arteriolesProximal tubule Convoluted segment Straight segment
Thin descending andascending limbs of Henle’sloop
Renal blood flow Glomerular filtration rateUrine flow rate
1–1.2 L/min100–125 mL/min140–180 L/day0.5–18 L/day
Number of nephons Cortical Juxtamedullary
2.5 million2.1 million0.4 million
Distal segments Thick ascending limb of Henle’s loop Distal convoluted tubule
Collecting ductMacula densa
Med
ulla
(pyr
amid
)C
orte
x
Juxtamedullaryglomerulus
Henle’sloop
THE NEPRHON:KEY
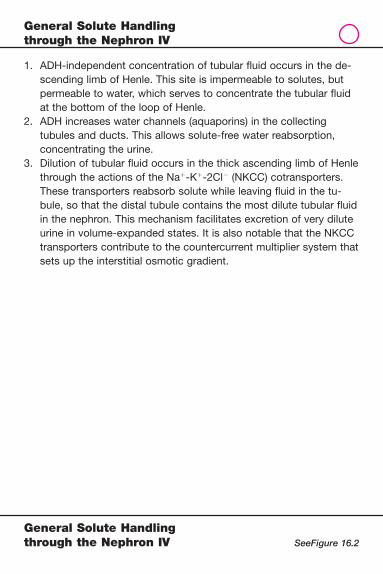
1. ADH-independent concentration of tubular fl uid occurs in the de-scending limb of Henle. This site is impermeable to solutes, but permeable to water, which serves to concentrate the tubular fl uid at the bottom of the loop of Henle.
2. ADH increases water channels (aquaporins) in the collecting tubules and ducts. This allows solute-free water reabsorption, concentrating the urine.
3. Dilution of tubular fl uid occurs in the thick ascending limb of Henle through the actions of the Na�-K�-2Cl� (NKCC) cotransporters. These transporters reabsorb solute while leaving fl uid in the tu-bule, so that the distal tubule contains the most dilute tubular fl uid in the nephron. This mechanism facilitates excretion of very dilute urine in volume-expanded states. It is also notable that the NKCC transporters contribute to the countercurrent multiplier system that sets up the interstitial osmotic gradient.
General Solute Handling through the Nephron IV
General Solute Handling through the Nephron IV SeeFigure 16.2

Nephron Sites of Sodium Handling
Nephron Sites of Sodium Handling 5-13
Describe the mechanisms by which sodiumreabsorption occurs at each site.
Proximalconvolutedtubule
Proximalstraight tubule
Distal tubule
Collectingduct
Thick ascendinglimb of Henle

1. Proximal convoluted tubule: by cotransport (secondary active) with glucose, amino acids, phosphate, organic anions; antiport in ex-change for H�
2. Proximal straight tubule: by antiport in exchange for H�
3. Thick ascending limb of Henle: by cotransport with K� and Cl� (Na�-K�-2Cl� transporters), antiport in exchange for H�
4. Distal tubule: by cotransport with Cl�
5. Collecting duct: by aldosterone-sensitive Na� channels in principal cells
Comment: At each of these sites, the Na� gradient into the cells is generated by the basolateral Na�/K� ATP.
Nephron Sites of Sodium Handling
Nephron Sites of Sodium Handling See Figure 17.1
GlucoseAmino acidsOrganicanions & Pi
Lumen
Na+
XATP
Na+
Na+
Na+
K+
Ca2+
Blood
OH–Oxalate–HCO3
– & SO4–
A– =
X=
Lumen
Thiazide-sensitivechannel
Na+
Ca2+
Cl–ATP
Na+
K+
Na+
K+
Cl–
ATP
Blood
ATPNa+
Cl–
ATPNa+
2Cl–K+
2K+
X
CA
3Na+
H+
CO2 + H2O
HCO3–
2K+
K+
Cl–
3Na+
H+
A–
CAH+
CO2 + H2O
HCO3–
2K+
Cl–
3Na+
Ca2+
2K+
Cl–
3Na+
2K+
3Na+

Hormonal Control of Renal Sodium Reabsorption
Hormonal Control of Renal Sodium Reabsorption 5-14
Angiotensin (Ang) II, aldosterone and atrial natriuretic peptide(ANP) all regulate renal sodium reabsorption. Identify howthese substances affect sodium reabsorption at sites 1–3.
1
2
3

1. At the proximal tubule, Ang II stimulates sodium reabsorption by increasing activity of the Na�/H� antiporters.
2. Aldosterone is released from the adrenal cortex in response to ele-vated circulating Ang II concentrations. At the late distal tubules, aldosterone acts to increase apical Na� channels, thus increasing sodium (and Cl� and water) reabsorption. Atrial natriuretic peptide (ANP) has indirect actions on distal sodium reabsorption by sup-pressing adrenal aldosterone release.
3. Aldosterone acts on collecting ducts to increase apical Na� chan-nels, thus increasing sodium (and Cl� and water) reabsorption. (Ang II has indirect actions to increase distal sodium reabsorption through its ability to reduce GFR and increase aldosterone re-lease.) ANP is released from cardiac myocytes primarily in the right atrium in response to elevated volume. At the renal collecting ducts, ANP inhibits apical Na� channels, reducing Na� reabsorp-tion and producing natriuresis and diuresis.
Hormonal Control of Renal Sodium Reabsorption
Hormonal Control of Renal Sodium Reabsorption See Figure 17.1
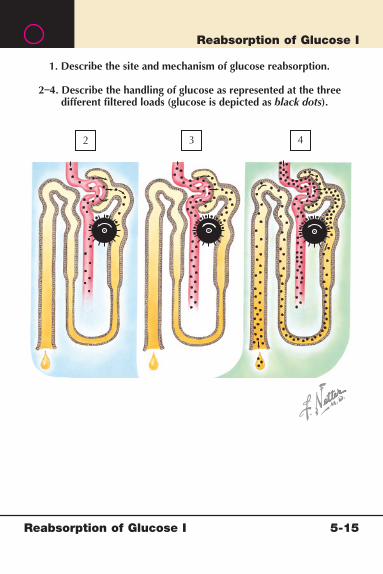
Reabsorption of Glucose I
Reabsorption of Glucose I 5-15
2
1. Describe the site and mechanism of glucose reabsorption.
2–4. Describe the handling of glucose as represented at the threedifferent filtered loads (glucose is depicted as black dots).
3 4
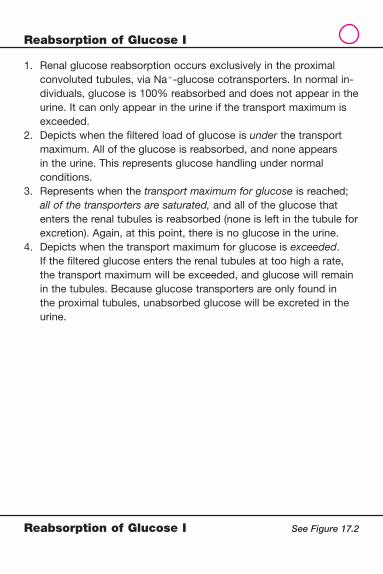
1. Renal glucose reabsorption occurs exclusively in the proximal convoluted tubules, via Na�-glucose cotransporters. In normal in-dividuals, glucose is 100% reabsorbed and does not appear in the urine. It can only appear in the urine if the transport maximum is exceeded.
2. Depicts when the fi ltered load of glucose is under the transport maximum. All of the glucose is reabsorbed, and none appears in the urine. This represents glucose handling under normal conditions.
3. Represents when the transport maximum for glucose is reached; all of the transporters are saturated, and all of the glucose that enters the renal tubules is reabsorbed (none is left in the tubule for excretion). Again, at this point, there is no glucose in the urine.
4. Depicts when the transport maximum for glucose is exceeded. If the fi ltered glucose enters the renal tubules at too high a rate, the transport maximum will be exceeded, and glucose will remain in the tubules. Because glucose transporters are only found in the proximal tubules, unabsorbed glucose will be excreted in the urine.
Reabsorption of Glucose I
Reabsorption of Glucose I See Figure 17.2
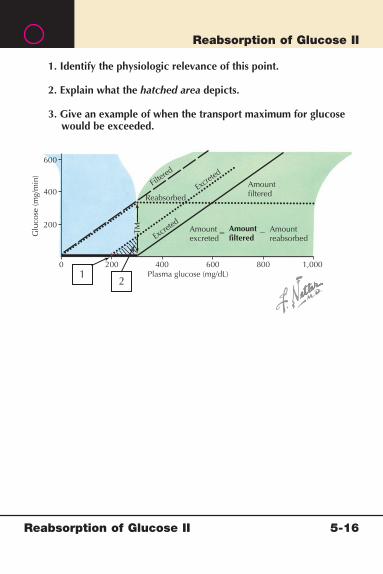
Reabsorption of Glucose II
Reabsorption of Glucose II 5-16
0 200
200
400
600
400
Excret
ed
Filter
ed
Excret
ed
600Plasma glucose (mg/dL)
800 1,000
Glu
cose
(mg/
min
)
TM
Reabsorbed
Amountexcreted
Amountfiltered
Amountfiltered
1. Identify the physiologic relevance of this point.
2. Explain what the hatched area depicts.
3. Give an example of when the transport maximum for glucosewould be exceeded.
Amountreabsorbed
� �
12
1. Plasma level above which glucose will start appearing in the urine. 2. The hatched area indicates splay. Splay refers to the phenomenon
whereby glucose appears in the urine when plasma glucose is un-der the calculated plasma level at which the transport maximum (TM) (in this case for glucose) should be reached. The TM actually occurs at a plasma value that is less than the calculated value, because of nephron heterogeneity (whereby different nephron populations have different TMs).
3. The TM for glucose can be exceeded in poorly controlled diabe-tes: elevated plasma glucose concentrations will increase the fi l-tered load of glucose above the renal threshold for reabsorption. The transporters will be saturated, and glucose will appear in the urine (glucosuria). Also, because glucose is an osmotic agent, the glucosuria will be accompanied by diuresis.
Reabsorption of Glucose II
Reabsorption of Glucose II See Figure 17.2

Renal Bicarbonate Handling
Renal Bicarbonate Handling 5-17
K+ATP
ATP
Na+
Na+
H+
H+
CO2 + H2O
3HCO3–
CACA
K+
Na+
Na+
H+
H+
CO2 + H2O
3HCO3–
CA
H+
H+
CO2 + H2O
CA
Cl–
HCO3–
K+
Lumen
Na+
H+
CO2+
H2O
+HCO3–
H2CO3
BloodLumen Blood
ATP
ATP
Na+
H+
CO2+
H2O
+HCO3–
H2CO3
ATP
K+
H+
CO2+
H2O
+HCO3–
H2CO3
1
1–3. Give the percent of filtered bicarbonate (HCO3�) reabsorbed
at each site.
4. From what cells of the nephron can HCO3� be secreted into
the tubular fluid?
3
2

1. Proximal tubule: about 80% of bicarbonate 2. Thick ascending limb of Henle: 15% 3. Collecting ducts: 5% 4. Under normal conditions, 100% of the fi ltered bicarbonate is reab-
sorbed, and thus none is found in the urine. However, when HCO3
� needs to be removed from the blood (as during alkalosis), HCO3
�/Cl� exchangers are inserted in the apical membranes of the �-intercalated cells of the collecting ducts. This allows HCO3
� secretion into tubular fl uid and excretion in urine.
Renal Bicarbonate Handling
Renal Bicarbonate Handling See Figure 17.3
K+ATP
ATP
Na+
Na+
H+
H+
CO2 + H2O
3HCO3–
CACA
K+
Na+
Na+
H+
H+
CO2 + H2O
3HCO3–
CA
H+
H+
CO2 + H2O
CA
Cl–
HCO3–
K+
Lumen
Na+
H+
CO2+
H2O
+HCO3
–
H2CO3
BloodLumen Blood
ATP
Reabsorbs 80% of filtered load
Reabsorbs 15% of filtered load
Reabsorbs 5% of filtered load
ATP
Na+
H+
CO2+
H2O
+HCO3–
H2CO3
ATP
K+
H+
CO2+
H2O
+HCO3–
H2CO3

Renal Solute Handling: Potassium Handling I
Renal Solute Handling: Potassium Handling I 5-18
Proximalconvolutedtubule
Proximalstraighttubule
Thick ascendinglimb ofHenle
Distal tubule
1. Identify the nephron sites of potassium secretion.
2. Describe three physiologic factors or conditions thatcan stimulate potassium secretion into the renal tubule.
Collectingducts

1. Potassium secretion can only occur distally, in late distal tubules, and collecting ducts. The principal cells of the collecting ducts have apical K� channels, which can transport potassium into the tubular fl uid.
2. Potassium secretion can be stimulated by a diet high in potas-sium, which increases plasma potassium (hyperkalemia), aldoste-rone (which is elevated in response to hyperkalemia or stimulation of the RAAS), and acute and chronic alkalosis.
Renal Solute Handling: Potassium Handling I
Renal Solute Handling: Potassium Handling I See Figure 17.4
Principal Cell
Lumen
ATP
Na+
Blood
K+
Na+
Normal and High K+ Diet
67%
20%
10%–50%
15%–80%
5%–30%

Renal Solute Handling: Potassium Handling II
Renal Solute Handling: Potassium Handling II 5-19
1. Identify the potential sites of K+ reabsorption.
2. Describe two physiologic factors/conditionsthat stimulate K+ reabsorption.
Proximalconvolutedtubule
Proximalstraighttubule
Thick ascendinglimb ofHenle
Distal tubule
Collectingducts

1. Proximal convoluted tubule, thick ascending limb of Henle, distal tubule, collecting ducts. Note: Under normal conditions reabsorp-tion does not occur in the distal tubules and collecting ducts.
2. Potassium reabsorption can be increased when plasma potassium concentrations are low (hypokalemia, as from a diet low in potas-sium) or from acidosis. The �-intercalated cells of the collecting duct are an important site of distal K� reabsorption, with K� enter-ing the cells via H�/K� exchangers; this results in secretion of H� into the tubular fl uid.
Renal Solute Handling: Potassium Handling II
Renal Solute Handling: Potassium Handling II See Figure 17.4
Cl–
K+H+
H+
Low K+ diet
Intercalated cell
67%
3%
1%
9%
Lumen
ATP
ATP
K+
HCO3–
Blood
20%
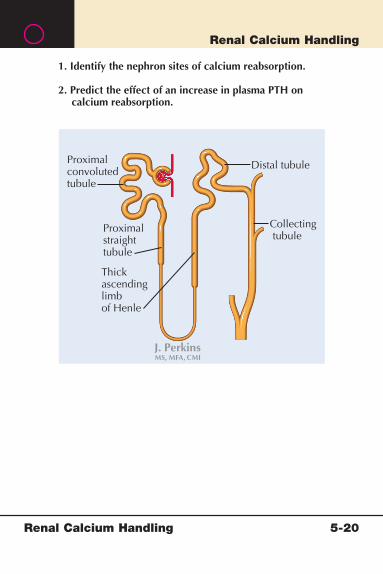
Renal Calcium Handling
Renal Calcium Handling 5-20
Distal tubuleProximalconvolutedtubule
1. Identify the nephron sites of calcium reabsorption.
2. Predict the effect of an increase in plasma PTH oncalcium reabsorption.
Proximalstraight tubule
Collecting tubule
Thickascendinglimbof Henle

1. Proximal convoluted tubule, thick ascending limb of Henle, late distal tubules, collecting ducts. Under normal conditions, about 99% of fi ltered calcium is reabsorbed.
2. PTH will increase calcium channels in the apical membranes of cells in the distal tubules, ensuring effi cient reabsorption of all calcium in the tubular fl uid.
Renal Calcium Handling
Renal Calcium Handling See Figure 17.5
70%
20%
~9%
1%
1%
Lumen
3Na+
Ca2+
Ca2+
Blood
Calcium excretion
Distal tubule
Ca2+
Ca2+
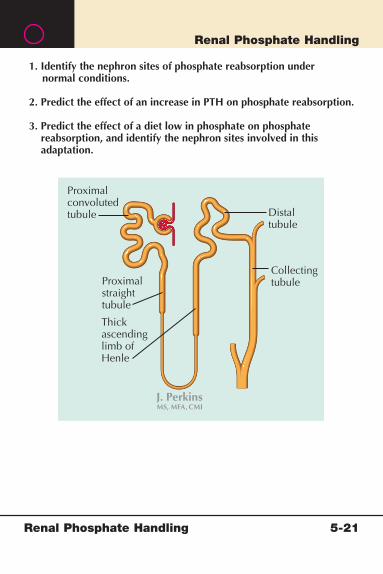
Renal Phosphate Handling
Renal Phosphate Handling 5-21
Proximalconvolutedtubule
1. Identify the nephron sites of phosphate reabsorption undernormal conditions.
2. Predict the effect of an increase in PTH on phosphate reabsorption.
3. Predict the effect of a diet low in phosphate on phosphate reabsorption, and identify the nephron sites involved in this adaptation.
Proximalstraight tubule
Thick ascendinglimb ofHenle
Collectingtubule
Distal tubule

1. Under normal conditions, about 75% of the fi ltered phosphate is reabsorbed in the proximal convoluted tubule, and the remaining 25% is excreted in the urine.
2. PTH acts at the proximal tubule to inhibit sodium-phosphate co-transporters. This signifi cantly increases phosphate excretion.
3. Diets low in phosphate will reduce plasma phosphate concentra-tion, which is a main stimulus for phosphate reabsorption. Sodium-phosphate cotransporters will be inserted in membranes of the proximal convoluted, proximal straight, and distal tubules, reducing phosphate excretion.
Renal Phosphate Handling
Renal Phosphate Handling See Figure 17.5
~5%
25%–75%
10%–15%
5%–25%
Lumen
ATP
II
A–
Pi
2Na+
P
Blood
Phosphate excretion
Proximal tubule
K+
Na+
Pi

Interstitial Concentration Gradient
Interstitial Concentration Gradient 5-22
15% of filtrate
280
280
280
280
280
280
300
100
350
325
75
375
40050
10%of filtr.
100
100
100
100
280
300
100% offiltrate
15% of
filtrate
28030%offiltr.
15%offiltr.
280Urea
Na�Cl�
Na�Cl�
H2O
UreaH2O
H2 O
Urea
H2O
H2O
H2O
H2ONa�Cl�
H2O
Na�Cl�
H2O
Na�Cl�
H2O
H2ONa�Cl�
H2ONa�Cl�
Urea
UreaH2ONa�Cl�
H2ONa�Cl�
H2O Na�Cl�
Na�Cl�
H2O
H2O
Na�Cl�
H2O
Na�Cl�
Na�Cl�
H2O
H2O
Na�Cl�
Na�Cl�
H2ONa�Cl�
Na�Cl�
Na �Cl �
280
280
280
280
300300
325
350Urea
175
150
125
100
375
325
350
375
375350
350
325
375
325300
280
400 400 400
Cor
tex
Med
ulla
1– 5. Identify the mechanisms associated with establishing the renal medullaryinterstitial concentration gradient at each site during concentration ofurine (values given below occur during urine dilution).
6. Identify the site of action of “loop” diuretics, and predict the effectof such a compound on the interstitial concentration gradient.
5
3
2
4
1
Note: Figures given areexemplary rather than specific
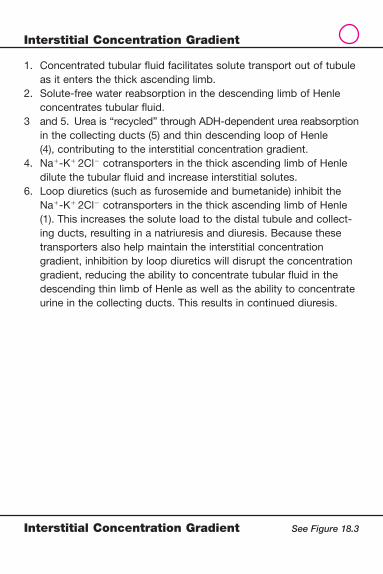
1. Concentrated tubular fl uid facilitates solute transport out of tubule as it enters the thick ascending limb.
2. Solute-free water reabsorption in the descending limb of Henle concentrates tubular fl uid.
3 and 5. Urea is “recycled” through ADH-dependent urea reabsorption in the collecting ducts (5) and thin descending loop of Henle
(4), contributing to the interstitial concentration gradient. 4. Na�-K� 2Cl� cotransporters in the thick ascending limb of Henle
dilute the tubular fl uid and increase interstitial solutes. 6. Loop diuretics (such as furosemide and bumetanide) inhibit the
Na�-K� 2Cl� cotransporters in the thick ascending limb of Henle (1). This increases the solute load to the distal tubule and collect-ing ducts, resulting in a natriuresis and diuresis. Because these transporters also help maintain the interstitial concentration gradient, inhibition by loop diuretics will disrupt the concentration gradient, reducing the ability to concentrate tubular fl uid in the descending thin limb of Henle as well as the ability to concentrate urine in the collecting ducts. This results in continued diuresis.
Interstitial Concentration Gradient
Interstitial Concentration Gradient See Figure 18.3

Urine Concentration
Urine Concentration 5-23
285
285
285
285
285
300
525525
750750
975975
12001200
1% offiltr.
285
200
100
100
285 315
100% offiltrate
15% of
filtrate
28530%offiltr.
15%offiltr.
285Urea
Na�Cl�
Na�Cl�
H2O
UreaH2O H2O
H2O
H2OUrea
H2 O
Urea
H2OUrea
UreaH2O
UreaH2O
H2O
Na�Cl�
UreaH2O
H2OUrea
Na�Cl�
H2OUrea
Na�Cl�
H2OUreaNa�Cl�
H2OUreaNa�Cl�
Na�Cl�
UreaH2O
UreaH2O
UreaNa�Cl�
UreaNa�Cl�
Na�Cl�
UreaH2O
Na�Cl�UreaH2O
Na�Cl�
Na�Cl�
Na�Cl�
H2OUrea
H2OUrea
Na�Cl�
Na�Cl�
H2OUrea
Na�Cl�
Na�Cl�
Na �Cl �
UreaH2O
285
285
300
525 525
750 750
775
550
325
100
975 975
750
750
525
975
525300
285
1200
Proximalconvoluted tubule
Proximalstraighttubule
Thickascendinglimb ofHenle
Distaltubule
Col-lectingtubule
1. Identify the site of action of antidiuretic hormone (ADH)on water reabsorption.
2. Describe under what conditions ADH would be elevated,and predict the effect of increased plasma ADH onurine volume.
120012001000
Cor
tex
Med
ulla
15% of filtrate
Note: Figures given areexemplary rather than specific
2
1
4
3
4
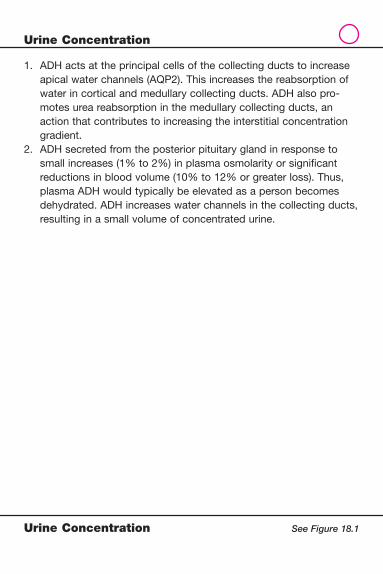
1. ADH acts at the principal cells of the collecting ducts to increase apical water channels (AQP2). This increases the reabsorption of water in cortical and medullary collecting ducts. ADH also pro-motes urea reabsorption in the medullary collecting ducts, an action that contributes to increasing the interstitial concentration gradient.
2. ADH secreted from the posterior pituitary gland in response to small increases (1% to 2%) in plasma osmolarity or signifi cant reductions in blood volume (10% to 12% or greater loss). Thus, plasma ADH would typically be elevated as a person becomes dehydrated. ADH increases water channels in the collecting ducts, resulting in a small volume of concentrated urine.
Urine Concentration
Urine Concentration See Figure 18.1

Renin-Angiotensin-Aldosterone System (RAAS) I
Renin-Angiotensin-Aldosterone System (RAAS) I 5-24
NaClNaCl
NaClNaCl
1–4. Identify structures associated with the juxtoglomerular apparatus.
5. Define the components of the RAAS.
1
2
3
4

1. Juxtaglomerular (JG) cells 2. Afferent arteriole 3. Macula densa 4. Efferent arteriole 5. The components of the RAAS are: the enzyme renin, which
cleaves the circulating protein angiotensinogen to angiotensin I; angiotensin-converting enzyme (ACE), which acts on Ang I to produce Ang II; and the adrenal mineralocorticoid, aldosterone, the release of which is stimulated by Ang II. Ang II and aldosterone act primarily through the blood to regulate fl uid homeostasis and blood pressure.
Renin-Angiotensin-Aldosterone System (RAAS) I
Renin-Angiotensin-Aldosterone System (RAAS) I See Figure 19.1
Mechanisms of Renin Release
Juxtaglomerular(JG) cells
NaCl
Maculadensa
EfferentarterioleNaCl
NaClNaCl
Afferentarteriole
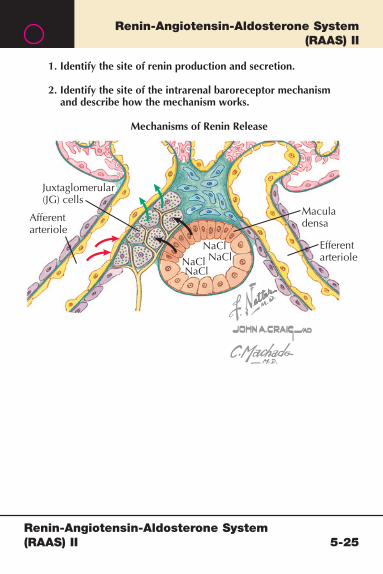
Renin-Angiotensin-Aldosterone System (RAAS) II
Renin-Angiotensin-Aldosterone System (RAAS) II 5-25
Mechanisms of Renin Release
1. Identify the site of renin production and secretion.
2. Identify the site of the intrarenal baroreceptor mechanismand describe how the mechanism works.
Juxtaglomerular(JG) cells
NaCl
Maculadensa
EfferentarterioleNaCl
NaClNaCl
Afferentarteriole

1. The juxtaglomerular cells produce and secrete renin into the affer-ent arteriole in response to low distal tubular sodium or increased distal tubular fl uid fl ow rate.
2. The intrarenal baroreceptor mechanism responds to changes in pressure in the afferent arteriole. An increase in afferent arteriolar pressure will inhibit renin release from the juxtaglomerular cells; a decrease in pressure will stimulate renin release.
Renin-Angiotensin-Aldosterone System (RAAS) II
Renin-Angiotensin-Aldosterone System (RAAS) II See Figure 19.1

Renin-Angiotensin-Aldosterone System (RAAS) III
Renin-Angiotensin-Aldosterone System (RAAS) III 5-26
Blood pressure
Fluid volume
�1-Sympathetic
Renin
Predict the effect of a decrease in blood pressureand fluid volume, and an increase in �1-adrenergicstimulation on:
1. Plasma angiotensin and aldosterone levels.
2. Renal sodium and fluid handling.
ACE
Angiotensinogen
Angiotensin I?
?
?
?
?
?
Aldosterone
Vasoconstriction
NaCl/H2Oreabsorption
H2ONaCl
Angiotensin II

1. A reduction in blood pressure and fl uid volume or β1- adrenergic stimulation will increase the RAAS by elevating renin release from the juxtaglomerular cells. The increased renin secretion into the blood will facilitate conversion of angiotensinogen to Ang I, which will be converted to Ang II by ACE in the lungs and in other tissues. The Ang II will stimulate aldosterone secretion from the adrenal cortex.
2. At the kidney, Ang II acts to constrict afferent and efferent arterioles, with an overall effect of decreasing glomerular fi ltration rate, promot-ing sodium retention; Ang II also increases sodium reabsorption at the renal proximal tubule. Aldosterone acts at the late distal tubules and collecting tubules to stimulate sodium (and water) reabsorption. The overall effect is to increase renal sodium and water retention.
Renin-Angiotensin-Aldosterone System (RAAS) III
Renin-Angiotensin-Aldosterone System (RAAS) III See Figure 19.1
Blood pressureFluid volume�1-Sympathetic
Renin
ACE
Angiotensinogen
Angiotensin I
Aldosterone
Vasoconstriction
NaCl/H2Oreabsorption
H2ONaCl
Angiotensin II

Renin-Angiotensin-Aldosterone System (RAAS) IV
Renin-Angiotensin-Aldosterone System (RAAS) IV 5-27
Blood pressure
Fluid volume
�1-Sympathetic
ANP
Renin?
?
?
??
?
ACE
Angiotensinogen
Predict the effect of an increase in blood pressureand fluid volume, and a decrease in �1-adrenergicstimulation on:
1. Plasma angiotensin and aldosterone levels.
2. Renal sodium and fluid handling.
Angiotensin I
AldosteroneVasoconstriction
NaCl/H2Oreabsorption
H2ONaCl
Angiotensin II

1. An increase in blood pressure or fl uid volume or a decrease in β- adrenergic stimulation will reduce renin secretion, suppressing the RAAS. In addition, myocytes in the right cardiac atrium respond to the elevated blood volume and stretch by releasing ANP into the systemic circulation.
2. ANP increases sodium and fl uid excretion and suppresses aldo-sterone, reducing volume load. Renal renin secretion into the blood decreases (due to the increased afferent arteriole pressure), reducing conversion of angiotensinogen to Ang I, and thus reduc-ing circulating Ang II. The overall effect is to increase renal sodium and water excretion.
Renin-Angiotensin-Aldosterone System (RAAS) IV
Renin-Angiotensin-Aldosterone System (RAAS) IV See Figure 19.1
Blood pressureFluid volume�1-SympatheticANP
Renin
ACE
Angiotensinogen
Angiotensin I
AldosteroneVasoconstriction
NaCl/H2Oreabsorption
H2ONaCl
Angiotensin II
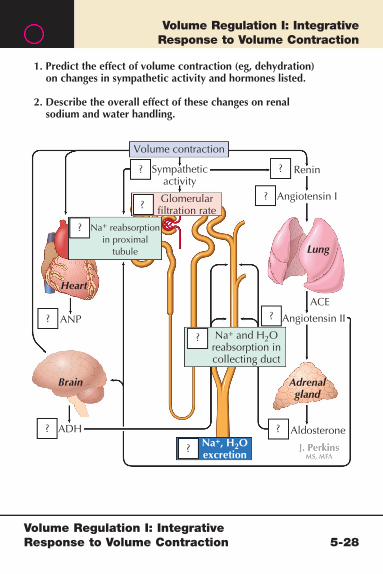
Volume Regulation I: Integrative Response to Volume Contraction
Volume Regulation I: Integrative Response to Volume Contraction 5-28
Heart
Volume contraction
Sympatheticactivity
Renin
1. Predict the effect of volume contraction (eg, dehydration)on changes in sympathetic activity and hormones listed.
2. Describe the overall effect of these changes on renalsodium and water handling.
Glomerularfiltration rate
Angiotensin I
Angiotensin II
ACE
Aldosterone
ANP
ADH?
?
??
?
?
?
?
?
??
Na+ reabsorptionin proximal
tubule
Na+ and H2Oreabsorption incollecting duct
Lung
Adrenalgland
Brain
Na+, H2Oexcretion

1. See diagram below. 2. The overall response to volume contraction is a decrease in renal
sodium and water excretion.
Volume Regulation I: Integrative Response to Volume Contraction
Volume Regulation I: Integrative Response to Volume Contraction See Figure 19.2
Heart
Volume contraction
Sympatheticactivity
Renin
Glomerularfiltration rate
Angiotensin I
Angiotensin II
ACE
Aldosterone
ANP
ADH
Na+ reabsorptionin proximal
tubule
Na+ and H2Oreabsorption incollecting duct
Lung
Adrenalgland
Brain
Na+, H2Oexcretion

Volume Regulation II: Integrated Response to Volume Expansion
Volume Regulation II: Integrated Response to Volume Expansion 5-29
Volume expansion
Sympatheticactivity
?
?
?
??
?
?
?
?
??
1. Predict the effect of volume expansion (e.g., drinking an extraliter of fluid) on changes in sympathetic activity and hormoneslisted.
2. Describe the overall effect of these changes on renal sodiumand water handling.
Renin
Glomerularfiltration rate
Angiotensin I
Angiotensin IIACE
Aldosterone
ANP
ADH
Na+ reabsorptionin proximal
tubule
Na+ and H2Oreabsorption incollecting duct
Urodilatin
Lung
Adrenalgland
Heart
Brain
Na+, H2Oexcretion

1. See diagram below for volume expansion. 2. The overall response to volume expansion is natriuresis and diure-
sis, reducing plasma volume.
Volume Regulation II: Integrated Response to Volume Expansion
Volume Regulation II: Integrated Response to Volume Expansion See Figure 19.2
Lung
Adrenal gland
Volume expansion
Sympatheticactivity
Renin
Glomerularfiltration rate
Angiotensin I
Angiotensin II
ACE
Aldosterone
ANP
ADH
Na+ reabsorptionin proximal
tubule
Na+ and H2Oreabsorption incollecting duct
Urodilatin
Heart
Brain
Na+, H2Oexcretion
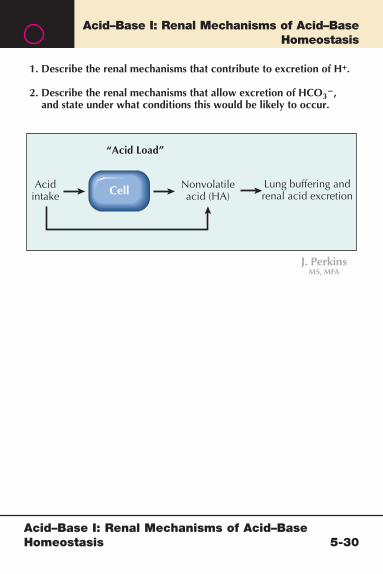
Acid–Base I: Renal Mechanisms of Acid–Base Homeostasis
Acid–Base I: Renal Mechanisms of Acid–Base Homeostasis 5-30
“Acid Load”
1. Describe the renal mechanisms that contribute to excretion of H+.
2. Describe the renal mechanisms that allow excretion of HCO3�,
and state under what conditions this would be likely to occur.
Acidintake
Nonvolatileacid (HA)
Lung buffering andrenal acid excretionCell

1. H� is buffered and excreted by the kidneys in the form of ammo-nium (NH4
�) and titratable acids (TA) (primarily phosphoric acid, H2PO4
�). 2. The �-intercalated cells of the collecting ducts are the sites of api-
cal HCO3�/Cl� exchangers. These apical HCO3
�/Cl� transporters allow secretion of HCO3
� into the tubular fl uid and reabsorption of Cl�. Under normal conditions, this antiporter is not active; how-ever, the antiporter is increased during alkalosis, compensating for the elevated plasma pH by excreting HCO3
� in the urine.
Comment: Although there is secretion of H� in many segments of the nephron, the �-intercalated cell of the collecting ducts is a key site contributing to H� secretion. In this late segment of the nephron the H� that is secreted will be buffered (as NH4
� or TA) and excreted in the urine.
Acid–Base I: Renal Mechanisms of Acid–Base Homeostasis
Acid–Base I: Renal Mechanisms of Acid–Base Homeostasis See Figure 20.1

Acid–Base II: Ammonia Synthesis
Acid–Base II: Ammonia Synthesis 5-31
1. Identify the site of renal ammonia (NH3) production,and describe the mechanism for ammonia generation.
2. Predict the effect of systemic acidosis on urinaryammonium excretion.
Proximalconvolutedtubule
Proximalstraight tubule
Distal tubule
Collectingduct
Thick ascendinglimb of Henle

1. Renal ammoniagenesis occurs in the proximal tubule. The tubular cells can synthesize glutamine, which is the substrate for ammo-nia. The glutamine is hydrolyzed to produce glutamate and one NH3. The glutamate is further metabolized to �-ketoglutarate and an additional NH3. The �-ketoglutarate metabolism yields two HCO3
�, which is reabsorbed as new bicarbonate. Thus, the reac-tion yields two NH3 and two HCO3
�. The NH3 is secreted into the tubule, immediately binding free H�, forming NH4
� (ammonium). 2. To compensate for acidosis, the kidneys will increase ammonia-
genesis and increase secretion of H� from the �-intercalated cells of the collecting ducts, resulting in increased urinary excretion of NH4
�.
Acid–Base II: Ammonia Synthesis
Acid–Base II: Ammonia Synthesis See Figure 17.1
LumenNa+
Blood
+H+
H+
Na+
Production and Excretion of Ammonium
NH4+
NH3NH4
+
NH3NH4
+
NH3
NH4+
NH4+
NH3
NH3
NH3
NH4+NH3
NH4+
GlutamineH+
A–
NH3NH4
+2NH4
+
2HCO3–
H+
CO2 + H2O
HCO3–
CA

Acid–Base III: Net Acid Excretion (NAE)
Acid–Base III: Net Acid Excretion (NAE) 5-32
Net acid excretion�?
1. Complete the equation shown.
2. Predict daily NAE if a person is in acid−base balanceand they ingest 40 �mol of H+ in food and drink each day.

1. NAE � UTA � UNH4� � UHCO3�
2. If a person is in balance, intake will equal urine output (40 mol H�).
Acid–Base III: Net Acid Excretion (NAE)
Acid–Base III: Net Acid Excretion (NAE) See Page 233

Acid–Base IV: Titratable Acids
Acid–Base IV: Titratable Acids 5-33
1. State the primary form of urinary titratable acids.
2. Predict the effect of systemic acidosis on urinary TA excretion,and identify the main site of H+ secretion during acidosis.
Proximalconvolutedtubule
Proximalstraight tubule
Distal tubule
Collectingduct
Thick ascendinglimb of Henle
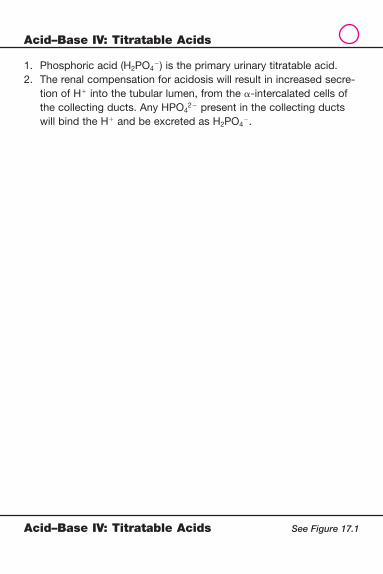
1. Phosphoric acid (H2PO4�) is the primary urinary titratable acid.
2. The renal compensation for acidosis will result in increased secre-tion of H� into the tubular lumen, from the �-intercalated cells of the collecting ducts. Any HPO4
2� present in the collecting ducts will bind the H� and be excreted as H2PO4
�.
Acid–Base IV: Titratable Acids
Acid–Base IV: Titratable Acids See Figure 17.1

Acid–Base V: Acidosis and Anion Gap
Acid–Base V: Acidosis and Anion Gap 5-34
AG 8
1–3. Describe the anion gap (AG) presented in each paneland what the electrolyte concentrations indicate.
4. Predict urinary HCO3� excretion in a person with values
depicted in panel 3.
HCO3� 24
Na�
140Cl�108
AG 17
HCO3� 15
Na�
140Cl�108
AG 10HCO3
� 12
Na�
140Cl�118
2 31

1. Normal anion gap (AG) (typically 8–12 mEq/L) and normal elec-trolyte levels
2. Acidosis from acid loading. In this case, AG increases from the acid load, and HCO3
� values decrease as the acid is buffered by plasma bicarbonate. Chloride remains at normal values.
3. Acidosis from base loss. In this case, AG is within normal values: the plasma HCO3
� (base) loss is offset by an increase in plasma chloride. The HCO3
� losses (e.g., in feces) are caused by HCO3�/
Cl� exchangers, which secrete HCO3� and reabsorb Cl�.
4. In normal (panel 1) and acidotic (panel 3) individuals, HCO3�
excretion will be zero.
Acid–Base V: Acidosis and Anion Gap
Acid–Base V: Acidosis and Anion Gap See Figure 20.4

Acid–Base Imbalances I
Acid–Base Imbalances I 5-35
The following blood values were obtained from a patientbeing assessed for renal insufficiency:
1. Using the values above, determine the acid−base imbalance,and state whether or not compensation has occurred.
2. In general terms, describe the cause of the imbalance.
pH
7.28
PCO2
26 mm Hg
HCO3�
14 mEq/L
Na�
136 mEq/L
K�
5.0 mEq/L
Cl�
100 mEq/L

1. A pH of 7.28 indicates acidosis (pH 7.4). When the pH is com-pared with the status of the plasma Pco2 and HCO3
� values, the value that matches the state of the pH determines whether the primary imbalance is respiratory (Pco2) or metabolic (HCO3
�). In this case, the Pco2 is “alkaline” (40 mm Hg), and the HCO3
� is “acid” (24 mEq/L), indicating metabolic acidosis. It is compen-sated because the Pco2 is lower than normal, refl ecting the at-tempt to blow off volatile CO2 and reduce the acid load.
2. The AG is used to determine whether the acidosis is caused by acid loading or base loss: AG � Na� � (Cl� � HCO3
�) � 136 � (100 � 14) � 22. A normal AG is 8 to 12, and an increased AG in-dicates acid loading (AG would be in normal range with base loss). Potential causes of acid loading include diabetic ketoacidosis, chronic renal failure, and lactic acidosis. In this case, because the patient has renal insuffi ciency, the acidosis is most likely from chronic renal failure.
Acid–Base Imbalances I
Acid–Base Imbalances I See Page 232

Acid–Base Imbalances II
Acid–Base Imbalances II 5-36
A 30-year-old man had persistent vomiting for 2 days,during which time he was unable to keep fluids down.Upon examination he was found to be severelydehydrated, with blood values shown below:
1. Using the values above, determine the acid−base imbalance,and state whether or not compensation has occurred.
2. In general terms, describe the cause of the imbalance.
pH
7.55
PCO2
48 mm Hg
HCO3�
45 mEq/L
Na�
136 mEq/L
K�
3.0 mEq/L
Cl�
85 mEq/L

1. The high pH (�7.4) indicates alkalosis, which is matched by the alkaline HCO3
� value of 45 mEq/L. Thus, the imbalance is metabolic alkalosis. The elevated Pco2 levels indicate respiratory compensation.
2. The chronic vomiting resulted in a large loss of stomach acid (HCl) that initiated the alkalosis. The normal compensation for alkalosis would be for the �-intercalated cells of the collecting duct to se-crete HCO3
� for excretion in urine; however, this is not able to oc-cur owing to the person’s volume-contracted state. Dehydration due to chronic vomiting stimulates vasoconstrictor and fl uid-retaining mechanisms (sympathetic nerve activity, ADH [also called vasopressin], and the renin-angiotensin-aldosterone system), which serve to retain fl uids and electrolytes and limit urinary losses. Because of this, almost all of the sodium, chloride, and water are reabsorbed by the late distal tubule, and there is not enough chloride present in the lumen of the collecting ducts to “run” the HCO3
�/Cl� exchangers and allow secretion of HCO3�.
Therefore, the plasma HCO3� remains high, and respiratory
compensation must occur. This condition is contraction alkalosis.
Acid–Base Imbalances II
Acid–Base Imbalances II See Page 232
6-1 GI Anatomy: Overview of the GI Tract6-2 GI Anatomy: Enteric Nervous System6-3 GI Anatomy: Portal System6-4 The Thirst Response6-5 Autonomic Nerves in the GI Tract6-6 Peristalsis6-7 Electrical Potentials in the GI Tract6-8 Control of Gastric Emptying6-9 Motility of the Colon6-10 General Gastrointestinal Refl exes6-11 Saliva6-12 Gastric Pit Cells6-13 Parietal Cell Production of Acid6-14 Stimulation of Gastric Acid Secretion6-15 GI Anatomy: Ductal System for Liver, Gallbladder,
and Pancreatic Secretions6-16 Major GI Hormones6-17 Anatomy of the Liver6-18 Liver Metabolism6-19 Bile Production and Secretion6-20 Portal Hypertension6-21 Stimulation of Digestive Enzymes6-22 Carbohydrate Digestion6-23 Carbohydrate Absorption6-24 Protein Digestion6-25 Protein Absorption6-26 Lipid Digestion I: Enzymes6-27 Lipid Digestion II: Bile and Micelle Formation6-28 Intracellular Lipid Processing6-29 Fluid and Electrolyte Absorption6-30 Calcium Absorption6-31 Vitamin B12 Absorption
SECTION
6
Gastrointestinal Physiology

This page intentionally left blank

GI Anatomy: Overview of the GI Tract
GI Anatomy: Overview of the GI Tract 6-1
1
2
3
4
8
Identify each structure.
7
6
5

1. Liver 2. Pancreas 3. Gallbladder 4. Colon (large intestine) 5. Small intestine 6. Stomach 7. Esophagus 8. Salivary glands
GI Anatomy: Overview of the GI Tract
GI Anatomy: Overview of the GI Tract See Figure 21.1
8. Salivary glandsSecretion oflubricating fluidcontaining enzymesthat initiate digestion
1. LiverSecretion of bile (important for lipid
digestion), storage of nutrients,production of cellular fuels, plasma
proteins, clotting factors, anddetoxification and phagocytosis
2. PancreasSecretion of buffers and
digestive enzymes byexocrine cells;
secretion of hormonesby endocrine cells
to regulate digestion
3. GallbladderStorage and
concentrationof bile
4. Large intestineDehydration and compaction
of indigestible materials forelimination; resorption of water
and electrolytes; host defense
7. EsophagusTransport of foodinto the stomach
6. StomachChemicalbreakdownof food by acidand enzymes;mechanicalbreakdownvia muscularcontractions
5. Small intestineEnzymatic digestionand absorptionof water, organicsubstrates, vitamins,and ions; host defense
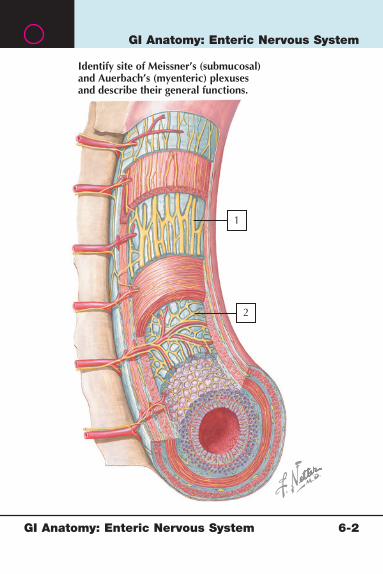
GI Anatomy: Enteric Nervous System
GI Anatomy: Enteric Nervous System 6-2
Identify site of Meissner’s (submucosal)and Auerbach’s (myenteric) plexusesand describe their general functions.
1
2

Identify site of Meissner’s (submucosal) and Auerbach’s (myenteric) plexuses and describe their general functions. 1. The myenteric nerve plexus is located between the longitudinal
and circular muscle layers of the gastrointestinal tract, from the esophagus to the anus. Stimulation of the myenteric nerves initiates contraction of muscles.
2. The submucosal nerve plexus is located between the circular muscle and the submucosa. Stimulation of the submucosal plexus increases secretion of buffers and mucus into the gastrointestinal tract.
Comment: The enteric nerves are singular, in that they are intrinsic to the gastrointestinal tract, and if necessary, they can function without input from the autonomic nervous system. Under normal conditions, the enteric nerves receive input from the autonomic nerves, hormones, and chemoreceptors, osmoreceptors, and mechanoreceptors located in the lumen of the GI tract.
GI Anatomy: Enteric Nervous System
GI Anatomy: Enteric Nervous System See Figure 21.3

3
4
5
2
1
3
1–5. Identify the main vessels in the portal system. 6. Explain the “first pass” effect.
GI Anatomy: Portal System
GI Anatomy: Portal System 6-3

1. Superior mesenteric vein 2. Portal vein 3. Esophageal veins 4. Splenic vein 5. Inferior mesenteric vein 6. The portal system includes the veins that drain blood from the
circulation surrounding the esophagus, intestines, and anus. All substances absorbed into capillaries in the small and large intestines fl ow through the portal vein and into the liver, where processing occurs. Flow of blood through the liver before entry into systemic circulation is termed the fi rst-pass effect.
GI Anatomy: Portal System
GI Anatomy: Portal System See Figure 21.4

The Thirst Response
The Thirst Response 6-4
? plasmaosmolality
THIRST
Water uptakeby GI tract
bloodvolume
Osmoreceptors
Baroreceptors
The thirst response can be mediated by several different mechanisms1–4. State what effect the changes in factors 1–4 will have on thirst.
5. Describe how the thirst response contributes to fluid homeostasis.
(arterial)(renal)
Renin
1 2 3
4

1. Decreased blood volume 2. Increased plasma osmolarity 3. Increased water intake by the GI tract 4. Increased angiotensin II 5. Because small increases in plasma osmolarity rapidly stimulate
thirst, fl uid usually enters the GI tract before dehydration has delete-rious effects on cells. Once the fl uid enters the body, any oversup-ply will be handled by the kidneys and excreted. Thus, thirst helps provide a supply of fl uid to maintain proper extracellular volume.
The Thirst Response
The Thirst Response See Figure 21.5
Increased plasmaosmolality
THIRST
Water uptakeby GI tract
Decreasedblood volume
Osmoreceptors
Angiotensin II
Baroreceptors
(arterial)(renal)
Renin

Autonomic Nerves in the GI Tract
Autonomic Nerves in the GI Tract 6-5
Sacr
alsp
inal
cor
dB
rain
stem
Sympatheticganglia
Preganglionicfibers
Postganglionicfibers
Blood vessels
Smooth muscle
The autonomic nerves help fine-tune motility and secretion throughthe GI tract. 1. Name the parasympathetic nerves from the brainstem that
innervate the enteric nervous system. 2. Name the parasympathetic nerves from the sacral spinal cord
that innervate the enteric nervous system. 3. Which branch of the autonomic nervous system stimulates,
and which inhibits motility and secretion?
Secretory cells
ENTERIC NERVOUS SYSTEM
Lum
bar
spin
al c
ord
Thor
acic
spin
al c
ord
AUTONOMIC NERVOUS SYSTEM
Myentericplexus
Submucosalplexus
1
2
PARASYMPATHETIC DIVISION SYMPATHETIC DIVISION

1. Parasympathetic vagus nerves innervate the GI tract down to the transverse colon.
2. Pelvic nerves innervate the GI tract from transverse colon to the anus.
3. In general, the parasympathetic nerves promote motility and secretion in the GI tract, whereas the sympathetic nerves slow or stop motility and secretion.
Autonomic Nerves in the GI Tract
Autonomic Nerves in the GI Tract See Figure 22.1

Peristalsis
Peristalsis 6-6
MUCOSA
Sensory neuron(mechanical,
chemical)
Ascending(oral) pathway
Both mechanical and chemical stimulation can elicit motility in theGI tract. Identify the major neurotransmitters that are releasedduring peristalsis from excitatory motor neurons (1) and inhibitorymotor neurons (2). Describe whether stimulation of the respectivemotor neuron populations results in smooth muscle contractionor relaxation.
Excitatorymotor neuron
Inhibitorymotor neuron
Descending(anal)
pathway
1
2
GUT LUMEN
Villi
Mechanicalstimulation
Chemicalstimulation
Sensoryneuron(stretch)
MUSCULARIS
S T
R E
T C
H

1. Excitatory motor neurons in the GI tract can release acetylcholine (ACh) and substance P (tachykinin); these substances cause contraction of the smooth muscle.
2. Inhibitory motor neurons release vasoactive intestinal peptide (VIP) or nitric oxide (NO); these substances cause relaxation of the smooth muscle.
Comment: The oral constriction and aboral relaxation are the hallmark of peristalsis, allowing aboral movement of the chyme.
Peristalsis
Peristalsis See Figure 22.2
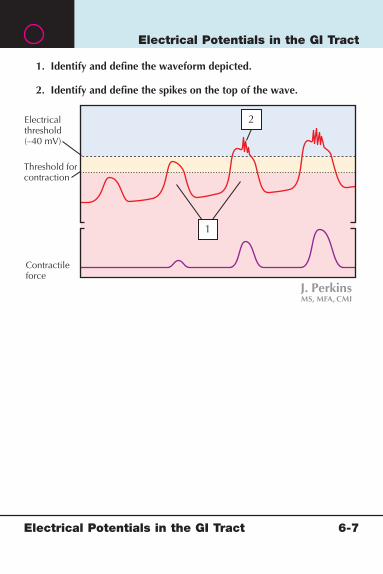
Electrical Potentials in the GI Tract
Electrical Potentials in the GI Tract 6-7
Electricalthreshold(–40 mV)
1. Identify and define the waveform depicted.
2. Identify and define the spikes on the top of the wave.
Threshold forcontraction
Contractileforce
1
2

1. Slow waves are the resting membrane potential found in the smooth muscle of the GI tract. The undulating waves occur at regular intervals, and they are called the basic electrical rhythm (BER). Depolarization of the slow waves above threshold (�40 mV) stimulates action potentials, which cause contractions.
2. Action or spike potentials are generated on the peaks of slow waves, when slow waves are depolarized above the electrical threshold (�40 mV). The action potential results from entry of calcium into the cells via voltage-gated channels; calcium binds to calmodulin, which initiates cellular events leading to contraction.
Comment: Depolarization of slow waves can be caused by stretch, ACh, or parasympathetic stimulation, for example. The force of con-traction increases with the number of action potentials generated. Thus, the stronger the stimulus (e.g., local stretch due to presence of chyme), the greater the depolarization and number of action potentials, and the stronger the contraction.
Electrical Potentials in the GI Tract
Electrical Potentials in the GI Tract See Figure 22.3
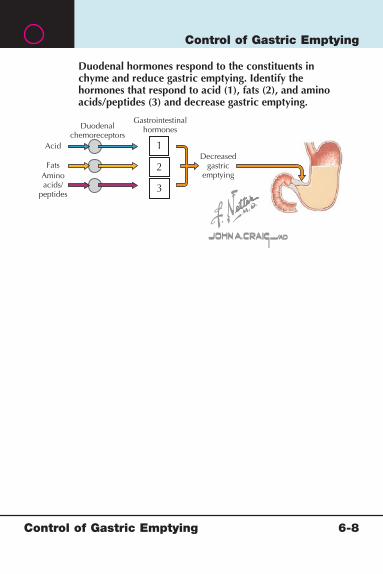
Control of Gastric Emptying
Control of Gastric Emptying 6-8
Duodenalchemoreceptors
Gastrointestinalhormones
Acid
Duodenal hormones respond to the constituents inchyme and reduce gastric emptying. Identify thehormones that respond to acid (1), fats (2), and aminoacids/peptides (3) and decrease gastric emptying.
FatsAminoacids/
peptides
Decreasedgastric
emptying
1
2
3

1. Secretin is released in response to acidic chyme. 2. Cholecystokinin (CCK) and gastric inhibitory peptide (GIP) are
released in response to fats in the chyme. 3. Gastrin is released in response to peptides and amino acids in
the chyme.
Control of Gastric Emptying
Control of Gastric Emptying See Figure 22.5

Motility of the Colon
Motility of the Colon 6-9
1
2
1. Name the type of slow movement depicted by “haustra”formation at this site.
2. Name the type of rapid propulsive movement depicted at this site.
3. Explain the defecation (or rectosphincteric) reflex.
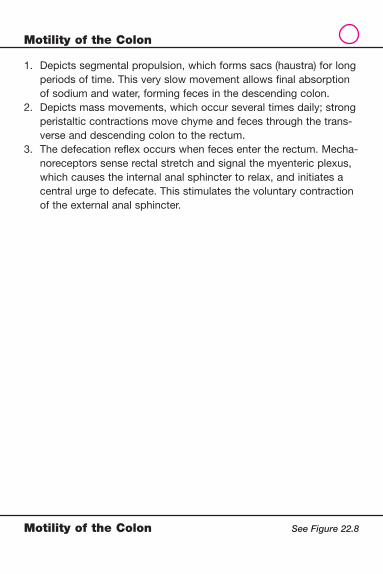
1. Depicts segmental propulsion, which forms sacs (haustra) for long periods of time. This very slow movement allows fi nal absorption of sodium and water, forming feces in the descending colon.
2. Depicts mass movements, which occur several times daily; strong peristaltic contractions move chyme and feces through the trans-verse and descending colon to the rectum.
3. The defecation refl ex occurs when feces enter the rectum. Mecha-noreceptors sense rectal stretch and signal the myenteric plexus, which causes the internal anal sphincter to relax, and initiates a central urge to defecate. This stimulates the voluntary contraction of the external anal sphincter.
Motility of the Colon
Motility of the Colon See Figure 22.8
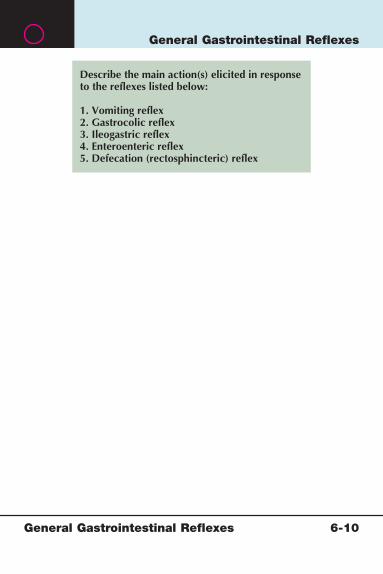
General Gastrointestinal Refl exes
General Gastrointestinal Refl exes 6-10
Describe the main action(s) elicited in response to the reflexes listed below:
1. Vomiting reflex2. Gastrocolic reflex3. Ileogastric reflex4. Enteroenteric reflex5. Defecation (rectosphincteric) reflex

1. The vomiting refl ex causes expulsion of upper intestinal and gastric contents via reverse peristalsis.
2. The gastrocolic refl ex stimulates colonic mass movements in response to food or chyme in the stomach.
3. The ileogastric refl ex reduces gastric emptying when there is chyme in the ileum.
4. The enteroenteric refl ex will relax an area of the intestines when an adjacent area is distended.
5. The defecation refl ex is initiated by feces entering and stretching the rectum. This elicits the relaxation of the internal anal sphincter (IAS) and the urge to defecate.
Comment: These refl exes do not occur in an all-or-nothing manner, and many act in concert to promote effi cient movement of the chyme. These represent only a few of the refl ex actions present in the GI tract.
General Gastrointestinal Refl exes
General Gastrointestinal Refl exes

Saliva
Saliva 6-11
Na+
Cl– HCO3–
K+
Saliva
In the salivary gland shown:1. State the general components of the primary secretion. 2. State the general components of the saliva.
3. Describe the effects of autonomic stimulationon salivary gland secretion.
1
2

1. Primary secretion contains electrolyte concentrations similar to plasma (Na�, K�, Cl�, HCO3
�) as well as the enzyme salivary �-amylase, which initiates starch digestion, and R proteins (R binders) that bind vitamin B12.
2. Saliva is always hypotonic to plasma, at any fl ow rate, primarily due to reabsorption of Na� and Cl� in the striated ducts. In the mouth, the saliva also contains lingual lipase (secreted from glands in the tongue), which has a small role in initial hydrolysis of lipids.
3. The facial and glossopharyngeal parasympathetic nerves innervate the salivary glands and stimulate salivation. Sympathetic nerves constrict blood supply and reduce salivation. The main control of salivation is through the parasympathetic nerves: if they are severed, the glands will atrophy.
Saliva
Saliva See Figure 23.3

Gastric Pit Cells
Gastric Pit Cells 6-12
Mucous(neck) cell
Parietalcell
Name the secretions from the chief, parietal,and mucous cells of the gastric pit.
Chief(zymogen)
cell

1. Chief cells release the zymogen form of pepsins. The pepsino-gens are cleaved to active pepsins (proteolytic enzymes) in the acid lumen of the stomach. Chief cells also release lipase, which hydrolyzes lipids.
2. Parietal cells secrete HCl (and to a lesser extent, KCl) as well as intrinsic factor (IF), which is required for vitamin B12 absorption in the terminal ileum.
3. Mucous (neck) cells secrete mucus, which sequesters HCO3�
and serves to protect the gastric mucosa from damage by acid and enzymes.
Gastric Pit Cells
Gastric Pit Cells See Figure 23.4
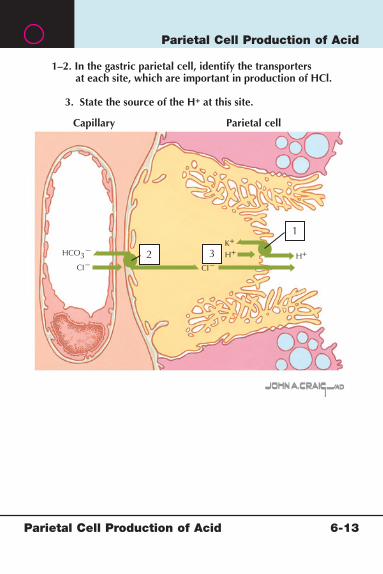
Parietal Cell Production of Acid
Parietal Cell Production of Acid 6-13
1
2 3
1–2. In the gastric parietal cell, identify the transportersat each site, which are important in production of HCl.
3. State the source of the H+ at this site.
H+
CI�CI�
K+
Capillary Parietal cell
H+HCO3�
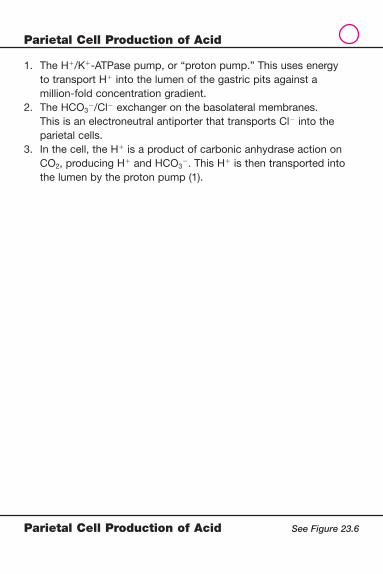
1. The H�/K�-ATPase pump, or “proton pump.” This uses energy to transport H� into the lumen of the gastric pits against a million-fold concentration gradient.
2. The HCO3�/Cl� exchanger on the basolateral membranes.
This is an electroneutral antiporter that transports Cl� into the parietal cells.
3. In the cell, the H� is a product of carbonic anhydrase action on CO2, producing H� and HCO3
�. This H� is then transported into the lumen by the proton pump (1).
Parietal Cell Production of Acid
Parietal Cell Production of Acid See Figure 23.6
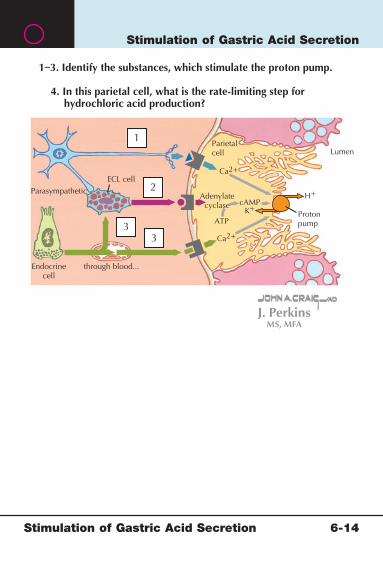
Stimulation of Gastric Acid Secretion
Stimulation of Gastric Acid Secretion 6-14
1–3. Identify the substances, which stimulate the proton pump.
4. In this parietal cell, what is the rate-limiting step forhydrochloric acid production?
ECL cellParasympathetic
Parietalcell
Ca2+
ATP
Adenylatecyclase cAMP
K+
H+
Lumen
Protonpump
Endocrinecell
through blood...
Ca2+
1
2
33

1. Acetylcholine, from parasympathetic nerve terminals 2. Histamine, from enterochromaffi n-like cells in the gastric pits 3. Gastrin, from endocrine G-cells in the stomach (antrum), and
duodenum 4. The rate-limiting step in hydrochloric acid production is the proton
pump. Stimulation of acid secretion results in insertion of more pumps in the luminal membrane. This is also the site of pharma-cologic suppression of gastric acid: PPI (proton pump inhibitors) such as omeprazole act at this site.
Stimulation of Gastric Acid Secretion
Stimulation of Gastric Acid Secretion See Figure 23.7

GI Anatomy: Ductal System for Liver, Gallbladder, and Pancreatic Secretions
GI Anatomy: Ductal System for Liver, Gallbladder, and Pancreatic Secretions 6-15
1
2
Secretions from the pancreas, liver, and gallbladder are necessaryfor the efficient digestion and absorption of nutrients. Name thestructures labeled 1–5, related to the ductal systems of these organs.
3
4
5

1. Papilla of Vater 2. Cystic duct 3. Common hepatic duct 4. Common bile duct 5. Pancreatic duct
GI Anatomy: Ductal System for Liver, Gallbladder, and Pancreatic Secretions
GI Anatomy: Ductal System for Liver, Gallbladder, and Pancreatic Secretions See Figure 23.9

Major GI Hormones
Major GI Hormones 6-16
Several hormones are produced in cells of the GI tract, arereleased into the blood, and facilitate GI secretion and/ormotility at different sites. Complete the table for the fiveGI hormones listed.
GI hormones
Major GI hormones
Site ofsecretion
Primarystimuli
General actions
Gastrin
Motilin
Secretin
?
?
?
?
?
?
?
?
?
?
?
?
?
?
?
Cholecystokinin (CCK)
Gastric inhibitorypeptide, aka glucoseinsulinotropicpeptide (GIP)

Major GI Hormones
Major GI Hormones See page 280
MAJOR GI HORMONES
GI HORMONES
SITE OF SECRETION
PRIMARY STIMULI
GENERAL ACTIONS
Gastrin G cells in antrum of stomach and duodenum
Stretch, pep-tides and amino acids, vagus (through GRP)
↑ Gastric H+
↑ Gastric mixing↑ Lower GI tract motility
Secretin S cells of the duodenum
Acidic chyme ↑ Pancreatic buffer (HCO3−) secretion↑ Biliary and small intestine buffer secretion↓ Gastric H+ (by ↓gastrin)↓ Gastric emptying
Cholecystokinin (CCK)
I cells of the duodenum and jejunum
Small peptides and amino acids, fats
↑ Pancreatic enzyme secretion contracts gallbladder and relaxes sphincter of Oddi↑ Pancreatic and biliary buffer secretion↓ Gastric emptying↑ Lower GI tract motility
Gastric inhibitory peptide, aka glu-cose insulinotropic peptide
Duodenum and jejunum
Fatty acids, glucose, amino acids
↓ Gastric H+ secretion↑ Pancreatic insulin secretion ↓ Gastric emptying
Motilin Mo cells of the duodenum
Fasting ↑ Phase III contractions of the MMC
GRP, gastrin-releasing peptide; MMC, migrating myoelectric complex.Reprinted with permission from Hansen J: Netter’s Atlas of Human Physiology. Philadelphia, Elsevier, 2002.

Anatomy of the Liver
Anatomy of the Liver 6-17
2
1
Identify each structure.
2
3
4
7
6
5

1. Hepatocytes 2. Central veins 3. Lymph vessel 4. Connective tissue 5. Bile duct 6. Portal vein branch 7. Hepatic artery branch
Comment: The liver has metabolic, vascular, and secretory functions, much of which are carried out by the hepatocytes. The hepatocytes are surrounded by capillary sinusoids, which perfuse the tissues: the ability of the liver to sequester blood (“sponge” function) helps to regulate systemic blood volume. Under normal conditions, the liver contains about 450 mL of blood.
Anatomy of the Liver
Anatomy of the Liver See Figure 24.2

Liver Metabolism
Liver Metabolism 6-18
Hepatocytes metabolize many of the nutrients absorbedby the GI tract. Complete the table.
Major nutrientsoccurring
Constituents enteringthe liver
Metabolic processes
Carbohydrates
Proteins
?
?
?
?
?
?Lipids
Liver Metabolism
Liver Metabolism
MAJOR NUTRIENTS OCCURRING
CONSTITUENTS ENTERING THE LIVER
MAIN LIVER PROCESSES
Carbohydrates Glucose, galactose, fructose
Glycogen synthesis and storageGluconeogenesisMetabolism to other compounds
Proteins Amino acids DeaminationUrea productionSynthesis of plasma proteins
Lipids Triglycerides, fatty acids, cholesterol esters
�-Oxidation of fatty acids Formation of lipoproteinsSynthesis of cholesterol and phospholipids

Bile Production and Secretion
Bile Production and Secretion 6-19
Distributingvein
SublobularveinSinusoids
Intralobular bile ductule
1. Name the neural and hormonal mechanisms that stimulateproduction of primary bile acids by the hepatocytes.
2. Identify the structure where modification of bile “juice” occurs.
3. Through which vessel does bile recycling occur?
Perisinusoidalspaces (of Disse)Central
veins
Lymph vessel
HepatocytesConnectivetissue
Bile ductPortalveinbranch
Hepaticarterybranch
Centralvein

1. Production of primary bile acids is stimulated through vagal affer-ent nerves as well as by the hormone cholecystokinin (CCK), which is released into blood in response to chyme entering the duodenum.
2. Modifi cation of bile occurs in the bile ducts. Bile is an osmotic agent, and when bile acids are secreted from the hepatocytes into the bile ducts they draw water, and electrolytes (sodium chloride, bicarbonate) follow. Thus, bile also provides buffering in the relatively acidic early duodenum.
3. Bile recycling occurs through the portal vein. Primary bile is reabsorbed in the terminal ileum and fl ows back to the liver, where it can be secreted again through the bile ducts. In a typical meal, bile will be recycled three to fi ve times, before it is stored in the gallbladder when chyme leaves the upper GI tract.
Bile Production and Secretion
Bile Production and Secretion See Figure 24.2

Portal Hypertension
Portal Hypertension 6-20
Tricuspid incompetence
Thrombosis of hepaticveins (Chiari syndrome)
Liverenlarged
Liver cirrhosis (or schistosomiasis)
Esophageal varices
Portal vein thrombosis
Spleen decidedly enlarged
Esophageal varicesSpleen markedlyenlarged
Spleen moderately enlarged
Constrictive pericarditisNo or few esophageal varices
Suprahepatic causes
1. Explain how suprahepatic pathology (such as hepatic vein thrombosis, tricuspid incompetence, and constrictive pericarditis)can increase portal vein pressure.
2. Explain how a cirrhotic liver can cause portal hypertension.3. Explain how infrahepatic pathology (such as portal vein thrombosis)
can cause portal hypertension.4. Explain why the esophagus is sensitive to developing varices during
portal hypertension associated with cirrhosis or infrahepatic causes.
Intrahepatic causes
Infrahepatic causes
1. With suprahepatic causes, the pressure in the hepatic veins is elevated, causing pooling of blood in the liver and increasing pressure in the portal and splenic veins.
2. With cirrhotic livers (intrahepatic cause), blood fl ow through the liver is dramatically reduced because of the scarring. Thus, while the hepatic vein pressure is normal (low), the portal and splenic vein pressures are high.
3. With infrahepatic causes of portal hypertension, blockage in some of the portal veins will increase blood fl ow and pressure in the other veins.
4. Portal hypertension can result in a backup of pressure in the veins coming from the stomach and esophagus. The increased pressure causes enlargement and thinning of the vessel walls and can make them prone to rupture. Because of the superfi cial nature of the vessels serving the esophagus, the vessels are sensitive to forming varices and rupturing and bleeding into the esophagus. Esophageal varices occur more often from intrahepatic and infra-hepatic causes, which directly affect pressure in the portal system and the vessels serving the esophagus.
Comment: Normal hepatic vein pressure is less than 1 mm Hg, which allows the unimpeded fl ow of blood out of the liver. If hepatic vein pressure increases, blood pools in the liver, and the portal vein pressure can also become elevated.
Portal Hypertension
Portal Hypertension See page 288

Stimulation of Digestive Enzymes
Stimulation of Digestive Enzymes 6-21
Fats
?
Prote
in
Carboh
ydrat
es
Hormones
Pancreas
As nutrients enter the small intestine, hormones are secreted from the duodenum and stimulate pancreaticsecretions. Name the two hormones involved and the pancreatic secretions that they stimulate.
?

1. Entry of acidic chyme into the duodenum stimulates the release of secretin into the blood. At the pancreas, secretin stimulates secretion of buffers, which enter the duodenum through the papilla of Vater. The buffers serve to neutralize the acidic chyme and bring the pH up to about 7.
2. In response to carbohydrates, fats, and proteins, cholecystokinin (CCK) is secreted into the blood. At the pancreas, CCK stimulates secretion of pancreatic proenzymes, including:• Pancreatic proteases (e.g., trypsinogen, chymotrypsinogen,
procarboxypeptidase, proelastase) (protein digestion)• Pancreatic �-amylase (starch digestion)• Pancreatic lipase and colipase (lipid digestion)
Stimulation of Digestive Enzymes
Stimulation of Digestive Enzymes See Figure 25.2

Carbohydrate Digestion
Carbohydrate Digestion 6-22
Name the major dietary carbohydrates and identify the carbohydrate-specific digestive enzymes, theirsite of secretion, their substrates, and their products.
3
4
1
2
5

The major dietary carbohydrates are starches (which are polymers of glucose) and simple sugars, such as the disaccharides, sucrose, and lactose, and the monosaccharide fructose. 1. Mouth secretes salivary �-amylase, which digests starch to
glucose polymers 2. Stomach (none) 3. Pancreas secretes �-amylase, which digests starch to glucose
polymers 4. Liver (none) 5. Small intestine: brush-border enzymes; maltase digests maltose
to glucose, isomaltase digests isomaltose to glucose, sucrase digests sucrose to glucose, and fructose, lactase digests lactose to glucose and galactose
Comment: Final digestion of carbohydrates is at the intestinal brush border. The enzymes maltase, isomaltase, sucrase, and lactase are fi xed in the brush-border membrane and serve to digest the disac-charides and polysaccharides to the constitutive monosaccharides glucose, galactose, and fructose.
Carbohydrate Digestion
Carbohydrate Digestion
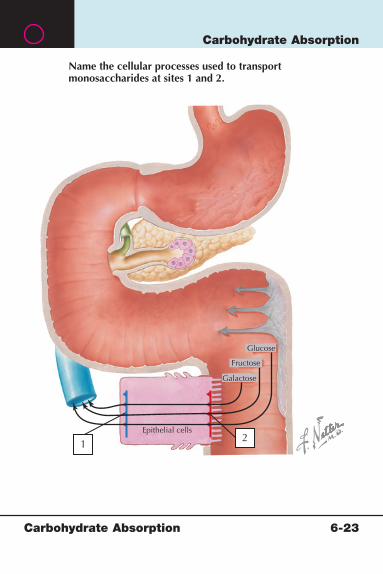
Carbohydrate Absorption
Carbohydrate Absorption 6-23
Glucose
Fructose
Name the cellular processes used to transportmonosaccharides at sites 1 and 2.
Galactose
Epithelial cells
12

1. Basolateral transport of all monosaccharides is through facilitated transport and diffusion through the interstitium and into the capillaries.
2. Luminal absorption of glucose and galactose is via Na�-cotransporters; the two monosaccharides share this transporter. Fructose enters the cells via facilitated transport (special transport protein).
Carbohydrate Absorption
Carbohydrate Absorption See Figure 25.2

Protein Digestion
Protein Digestion 6-24
1
2
3
4
Portal vein (to liver)
Lymphatics(to thoracicduct andthence tovenous system)
Identify the enzymes facilitating protein digestion at eachlabeled site. Describe how the pancreatic proteases areactivated at site 2.
ProteinB12
IntrinsicfactorB12
Intrinsic
factor
H� Cl�
Hormones

1. In the stomach, pepsinogens are released from the chief cells and activated to pepsins (proteases) by the acid environment. The hormone gastrin is released early in the digestive process and stimulates release of stomach acid and pepsinogens.
2. The pancreatic proteases (stimulated by cholecystokinin) are re-leased into the duodenum as inactive proenzymes. The enzyme enterokinase is secreted from the intestinal epithelial cells into the gut lumen and activates trypsin. Trypsin activates itself as well as the other proteases (chymotrypsin, carboxypeptidases, elastase), and digestion to smaller oligopeptides proceeds.
3. Final digestion of proteins to amino acids and dipeptides and tripeptides occurs at the brush border of the small intestine, where enzymes are fi xed in the membrane.
4. In the enterocytes (intestinal epithelial cells), any dipeptides and tripeptides that are absorbed are digested to amino acids by cytoplasmic proteases.
Protein Digestion
Protein Digestion See Figure 25.2
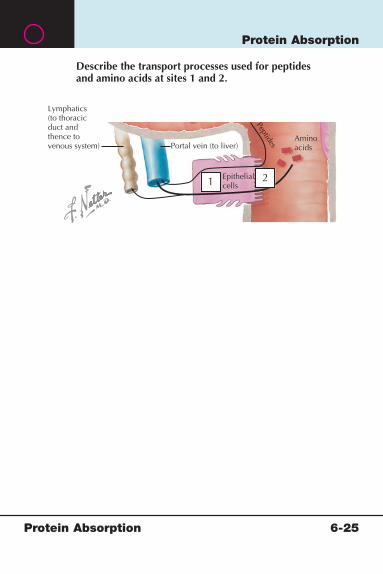
Protein Absorption
Protein Absorption 6-25
Portal vein (to liver)Aminoacids
Peptides
Epithelialcells
Lymphatics(to thoracicduct andthence tovenous system)
Describe the transport processes used for peptidesand amino acids at sites 1 and 2.
1 2

1. At the basolateral membrane, amino acids exit the cells by facilitated transport and diffuse into capillaries.
2. At the luminal membrane, amino acids are absorbed using separate Na�-dependent cotransporters for basic, acidic, neutral, and imino acids. Dipeptides and tripeptides enter the cells by H�-cotransport.
Protein Absorption
Protein Absorption See Figure 25.3

Lipid Digestion I: Enzymes
Lipid Digestion I: Enzymes 6-26
Identify the lipid-specific digestive enzymessecreted (if any) at each site and theirsubstrates and products.
Liver
Mouth
Stomach
SmallintestinePancreas
3
4
1
2
5
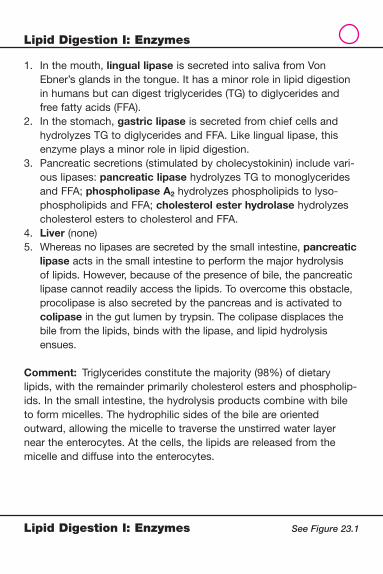
1. In the mouth, lingual lipase is secreted into saliva from Von Ebner’s glands in the tongue. It has a minor role in lipid digestion in humans but can digest triglycerides (TG) to diglycerides and free fatty acids (FFA).
2. In the stomach, gastric lipase is secreted from chief cells and hydrolyzes TG to diglycerides and FFA. Like lingual lipase, this enzyme plays a minor role in lipid digestion.
3. Pancreatic secretions (stimulated by cholecystokinin) include vari-ous lipases: pancreatic lipase hydrolyzes TG to monoglycerides and FFA; phospholipase A2 hydrolyzes phospholipids to lyso-phospholipids and FFA; cholesterol ester hydrolase hydrolyzes cholesterol esters to cholesterol and FFA.
4. Liver (none) 5. Whereas no lipases are secreted by the small intestine, pancreatic
lipase acts in the small intestine to perform the major hydrolysis of lipids. However, because of the presence of bile, the pancreatic lipase cannot readily access the lipids. To overcome this obstacle, procolipase is also secreted by the pancreas and is activated to colipase in the gut lumen by trypsin. The colipase displaces the bile from the lipids, binds with the lipase, and lipid hydrolysis ensues.
Comment: Triglycerides constitute the majority (98%) of dietary lipids, with the remainder primarily cholesterol esters and phospholip-ids. In the small intestine, the hydrolysis products combine with bile to form micelles. The hydrophilic sides of the bile are oriented outward, allowing the micelle to traverse the unstirred water layer near the enterocytes. At the cells, the lipids are released from the micelle and diffuse into the enterocytes.
Lipid Digestion I: Enzymes
Lipid Digestion I: Enzymes See Figure 23.1
Lipid Digestion II: Bile and Micelle Formation
Lipid Digestion II: Bile and Micelle Formation 6-27
PancreasTriglycerides (long and short chain)Diglycerides (long and short chain)
Monoglycerides (long and short chain)Fatty acids (long and short chain)
Glycerol Na, K
SolubleInsoluble
Mg, Ca
CholesterolCarotene
Cholesterol esters
KEY
Emulsion
To liver
Lymphatics
Chylomicron
1. Micelles are shown in the small intestine; what purposedo micelles serve?
2. Describe the process of micelle formation.
To systemiccirculation viathoracic duct
Portal vein
MicrovilliEpithelial cell
BilePancreatic
juice
Pancreatic lipase
Intestinallipase
Intestinal wall
Hydrolysis(partial orcomplete)
Glycocalyx
Mice
lles
Chole-
cystokinin
Secretin

1. Micelles are “taxis” that carry lipids across the unstirred water layer adjacent to the intestinal epithelial cells. Because lipids are hydrophobic, they cannot traverse this water layer, and thus absorption would be very ineffi cient. The micelles are digested lipids surrounded by bile salts, which can readily move through the water layer and “drop off” the fats at the enterocytes, where they can diffuse into the cells.
2. Bile is secreted early in the digestive process, in response to stim-ulation of the gallbladder and liver by the vagus nerves and chole-cystokinin. Bile salts and pancreatic enzymes (including lipase and colipase) are released into the duodenum. Primary bile salts are detergents that are amphipathic (hydrophilic and lipophilic sides); their detergent action emulsifi es lipids. This does not digest the lipids; it only reduces the size of the lipid droplets. Digestion is by pancreatic lipase; however, the lipase cannot access the lipids through the hydrophilic ends of the bile. The colipase displaces the bile and binds to the lipase, allowing hydrolysis of the lipids. When there is a critical mass of bile along with, for example, monoglycerides, free fatty acids, and cholesterol, micelles are formed, with the lipophilic ends inside, surrounding the fats, and the hydrophilic ends on the outside, allowing movement through the water layer.
Comment: When the micelle “taxi’ drops the fats off at the villi, the bile stays in the lumen of the gut, where most is absorbed in the terminal ileum by sodium-dependent cotransport.
Lipid Digestion II: Bile and Micelle Formation
Lipid Digestion II: Bile and Micelle Formation See Figure 25.4

Intracellular Lipid Processing
Intracellular Lipid Processing 6-28
21
3
4
Chylomicron
The diagram illustrates uptake of lipids by the small intestineand intracellular processing to chylomicrons.
1. After lipids are absorbed, in what organelle doesre-esterification occur?
2. Name the products of the re-esterification process.3. What are chylomicrons, and how do they exit the cells?4. How do chylomicrons enter the systemic circulation?
MicrovilliEpithelial cell
Intracellularprocessing

1. Re-esterifi cation takes place in the smooth endoplasmic reticulum. 2. Re-esterifi cation adds FFA back to the monoglycerides, lysophos-
pholipids, and cholesterol to produce TG, phospholipids (PL), and cholesterol esters (CE), respectively.
3. Chylomicrons are large groups of TG (and to a much lesser extent, PL and CE) surrounded by a �-lipoprotein coat. These large globs of lipid exit the cells by exocytosis.
4. The chylomicrons are too large to enter the capillaries and portal blood. Instead, they enter the lymph lacteals and access the sys-temic circulation in the large vessels in the thorax. Once in the systemic circulation, they enter the liver through the hepatic artery.
Intracellular Lipid Processing
Intracellular Lipid Processing See Figure 25.4

Fluid and Electrolyte Absorption
Fluid and Electrolyte Absorption 6-29
Na+
Aminoacids,
glucoseATP
Cl–
Na+
Na+
2Cl–
K+
Na+
Aminoacids,
glucose
Jejunum Ileum
Colon
1. Which area (jejunum, ileum, or colon) is the siteof the greatest bulk absorption of fluid and electrolytes?
2. What transporter creates the main gradient for sodiumreabsorption?
ATP
HCO3–
+ H+
H2CO3
H2O
Na+
Na+
2Cl–
K+
Na+
ATP
Cl– CA
2K+
Cl–
3Na+
CO2
H+
2K+
Cl–
3Na+
CO2+
H2OHCO3–
H+
CA
2K+
Cl–
3Na+
CO2 + H2O
HCO3–
Na+
K+
H+
1. The jejunum is the major site of bulk reabsorption of fl uids and electrolytes. Much of the absorption occurs via cotransport with glucose, amino acids, and other nutrients.
2. As in all cells, the basolateral Na�,K�-ATPase pump (seen in all sites) maintains a low intracellular concentration of sodium, which creates a large gradient for sodium absorption. As sodium is ab-sorbed, other electrolytes and water follow. There is a great deal of electrolyte and water absorption in the ileum, although most is absorbed by the jejunum.
Fluid and Electrolyte Absorption
Fluid and Electrolyte Absorption See Figure 25.5
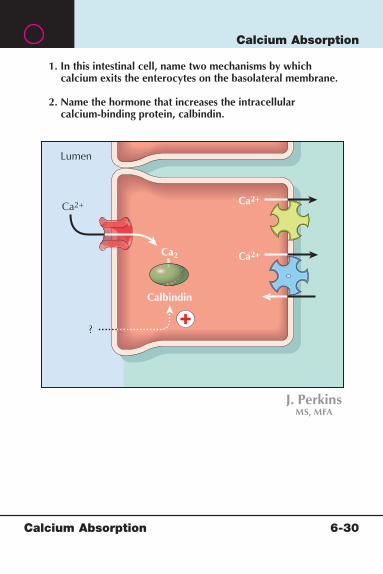
Calcium Absorption
Calcium Absorption 6-30
Lumen
1. In this intestinal cell, name two mechanisms by whichcalcium exits the enterocytes on the basolateral membrane.
2. Name the hormone that increases the intracellularcalcium-binding protein, calbindin.
Ca2+
?
Ca2
Calbindin
Ca2+
Ca2+
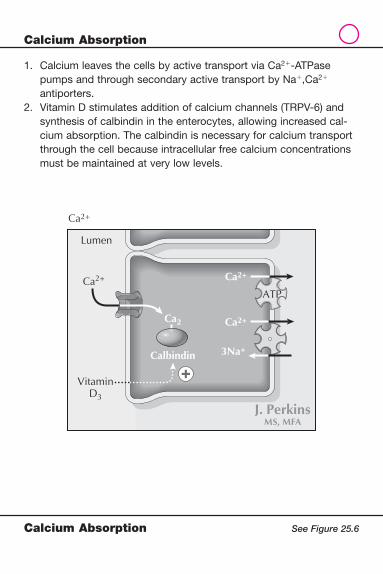
1. Calcium leaves the cells by active transport via Ca2�-ATPase pumps and through secondary active transport by Na�,Ca2� antiporters.
2. Vitamin D stimulates addition of calcium channels (TRPV-6) and synthesis of calbindin in the enterocytes, allowing increased cal-cium absorption. The calbindin is necessary for calcium transport through the cell because intracellular free calcium concentrations must be maintained at very low levels.
Calcium Absorption
Calcium Absorption See Figure 25.6
Lumen
ATPCa2+
Ca2+
VitaminD3
Ca2
Calbindin
Ca2+
Ca2+
3Na+

Vitamin B12 Absorption 6-31
Vitamin B12 Absorption
Vitamin B12
1. Vitamin B12 binds to enterocytes in the form of a complex (1).Name this complex.
2. What binding protein (2) binds B12 in the enterocytes and blood?
B12
1
2 2
B12-IF B12
B12

1. Receptors recognize B12/intrinsic factor (B12/IF) dimers. 2. Receptors for the B12/IF dimers are located in the terminal ileum.
Comment: B12 binds with transcobalamin II (TCII; labeled 2) in the cytosol, exits the cell, and is transported to bone marrow (for use) or is stored in the liver.
Vitamin B12 Absorption
Vitamin B12 Absorption See Figure 25.7
Vitamin B12
B12 IF
B12-IF
B12-IF
B12
TCII
B12

SECTION
77-1 General Principles of Hormone Binding I7-2 General Principles of Hormone Binding II7-3 Hypothalamus and Pituitary: Anatomy7-4 Pituitary Gland: Anterior Pituitary Hormones7-5 Pituitary Hormones I: General Actions7-6 Pituitary Hormones II: Growth Hormone Feedback Systems7-7 Pituitary Hormones III: Male Reproductive Hormones7-8 Pituitary Hormones IV: Female Reproductive Hormones7-9 Thyroid Hormone I: Control of Thyroid Hormone Synthesis7-10 Thyroid Hormone II: Synthesis7-11 Thyroid Hormone III: Intracellular Actions7-12 Thyroid Hormone IV: General Systemic Actions7-13 Adrenal Hormones I: Adrenal Gland Structure7-14 Adrenal Hormones II: Adrenal Cortical Hormones7-15 The Endocrine Pancreas I: Major Hormones7-16 The Endocrine Pancreas II: Insulin Secretion7-17 The Endocrine Pancreas III: Actions of Insulin7-18 The Endocrine Pancreas IV: Actions of Glucagon7-19 Calcium-Regulating Hormones I: Vitamin D7-20 Calcium-Regulating Hormones II: Actions of Vitamin D7-21 Calcium-Regulating Hormones III: Actions of Parathyroid
Hormone7-22 Calcium-Regulating Hormones IV: Altered Parathyroid
Secretion7-23 Reproductive Hormones I: Development of Genital Sex7-24 Reproductive Hormones II: Puberty and Secondary Sex
Characteristics7-25 Reproductive Hormones III: Hormonal Regulation of the
Menstrual Cycle7-26 Reproductive Hormones IV: Feedback Regulation of the
Menstrual Cycle7-27 Reproductive Hormones V: The Testes and
Spermatogenesis7-28 Reproductive Hormones VI: Control of Testicular Function
Endocrine Physiology

This page intentionally left blank

General Principles of Hormone Binding I
General Principles of Hormone Binding I 7-1
PPP
PPP
Receptor
ReceptorSignalgenerator
Regulation of metabolicpathways, cell growth, etc.
Identify the hormones that work through receptor mechanisms 1–3.
Cell membrane
1 2 3
DNA
Transcriptionfactors
mRNA
MonomericG protein
Second messengers(cAMP, cGMP, Ca2+,IP3, diacylglycerol)
Tyrosine kinaseactivity
HeterotrimericG protein
Regulation ofactivity andconcentrationof enzymesand other proteins
Nucleus
Nuclearreceptor
Cytoplasm
��� �

1. Nuclear receptors: steroid hormones, thyroid hormones, and vitamin D
2. Monomeric G-protein receptors: growth hormones (growth hormone, insulin-like growth factors)
3. Heteromeric G-protein receptors: peptide hormones, catecholamine hormones
General Principles of Hormone Binding I See Figure 26.2
General Principles of Hormone Binding I

General Principles of Hormone Binding II
General Principles of Hormone Binding II 7-2
Celltype 1
Celltype 1
Hormone
Effect
Celltype 1
Celltype 2
Hormone
Effect
Identify the types of hormonal actions depicted.
Celltype 1
Bloodstream
Celltype 2
Effect
Neuron
Axon
Celltype 2
Effect
Bloodstream
1 2 3 4
Hormone Hormone

1. Autocrine: feeds back to same cells 2. Paracrine: affects adjacent cells 3. Endocrine: secreted into bloodstream 4. Neuroendocrine: secreted from neurons into bloodstream
Comment: True hormones are produced by ductless glands and are carried through the blood to target tissues. As noted above, various secretions have been shown to act both locally (autocrine, paracrine) and through the bloodstream (endocrine, neuroendocrine).
General Principles of Hormone Binding II
General Principles of Hormone Binding II See Figure 26.2

Hypothalamus and Pituitary: Anatomy
Hypothalamus and Pituitary: Anatomy 7-3
Thalamus
Hypothalamic sulcus
Neu
rohy
poph
ysis A
denohypophysis
Hypothalamohypophyseal tract
Interventricularforamen
Optic chiasmMamillary body
Identify each structure.
Neuralstalk
Infundibular stem
Infundibularprocess
Pars tuberalis
Parsdistalis
Connectivetissue(trabecula)
Cleft
12
3
45
6
78

1. Hypothalamic area 2. Paraventricular nucleus (PVN) 3. Supraoptic nucleus (SON) 4. Median eminence 5. Hypophyseal stalk 6. Pars intermedia 7. Anterior pituitary (adenohypophysis) 8. Posterior pituitary (neurohypophysis)
Comment: Nuclei in the hypothalamus (PVN and SON) synthesize the posterior pituitary hormones vasopressin (antidiuretic hormone) and oxytocin; axons carry the hormones from the hypothalamus to the posterior pituitary (hence the name, neurohypophysis). The vasopressin and oxytocin are stored in the posterior pituitary until release.
Hypothalamus and Pituitary: Anatomy
Hypothalamus and Pituitary: Anatomy See Figure 26.3

Pituitary Gland: Anterior Pituitary Hormones 7-4
Pituitary Gland: Anterior Pituitary Hormones
Emotional and exteroceptiveinfluences via afferent nerves
Hypothalamicartery
Neurohypophysis
Blo
od le
vels
—re
gula
tory
influ
ence
Paraventricular nucleus
The anterior pituitary gland secretes hormones that targetdifferent organs. Identify the hormones (1–6) that act onthese organs. Identify the hormones (7–10) that arereleased from the target organs after stimulationby the pituitary hormone.
Supraoptic nucleus
Hypothetical site for TSHstimulation
Neurosecretions from hypothalamus releasedinto primary plexus of hypophyseal portalcirculation after passing down nerve fibers
Hypophyseal portal veins carry neurosecretionsto adenohypophysis
Specific secretory cellsof adenohypophysis influencedby neurosecretions fromhypothalamus
IGFs
Thyroidgland
Adrenalcortex Testis
OvaryBreast (milkproduction)
Bone,muscle,organs (growth)
Mus
cle
Fat tissue
Superiorhypophysealartery
1 2 3
45
6
7 8 9 10

1. Thyroid-stimulating hormone (TSH) 2. Adrenocorticotropic hormone (ACTH) 3. Follicle-stimulating hormone (FSH) (works at both testes
and ovaries) 4. Luteinizing hormone (LH) (works at both testes and ovaries) 5. Prolactin 6. Growth hormone (GH) 7. Thyroid hormones 8. Cortical hormones (cortisol) 9. Testosterone 10. Estrogen and progesterone
Pituitary Gland: Anterior Pituitary Hormones
Pituitary Gland: Anterior Pituitary Hormones See Figure 26.4

Pituitary Hormones I: General Actions
Pituitary Hormones I: General Actions 7-5
Emotional and exteroceptiveinfluences via afferent nerves
Hypothalamicartery
Neurohypophysis
Oxytocin
Vas
opre
ssin
Blo
od le
vels
—re
gula
tory
influ
ence
Paraventricular nucleus
State the general actions of the pituitary hormones:1. Growth hormone2. Prolactin3. Thyroid-stimulating hormone4. Adrenocorticotropic hormone
Supraoptic nucleus
Hypothetical site for TSHstimulation
Neurosecretions from hypothalamus releasedinto primary plexus of hypophyseal portalcirculation after passing down nerve fibers
Hypophyseal portal veins carry neurosecretionsto adenohypophysis
Specific secretory cellsof adenohypophysis influencedby neurosecretions fromhypothalamus
IGFs
GH
LHFSHACTHTSH
Thyroidgland
ProgesteroneThyroidhormones
Corticalhormones
TestosteroneEstrogen
Adrenalcortex Testis
Ovary
Prolactin
Breast Bone,muscle,organs
Mus
cle
Fat tissue
Superiorhypophysealartery
5. Follicle-stimulating hormone6. Luteinizing hormone7. Oxytocin8. Vasopressin
1. Growth hormone promotes the synthesis of insulin-like growth factors; has growth-promoting and anabolic effects.
2. Prolactin stimulates production of breast milk. 3. Thyroid-stimulating hormone stimulates thyroid hormone produc-
tion by the thyroid gland. Thyroid hormones affect virtually all systems and generally act to increase metabolism and growth processes.
4. Adrenocorticotropic hormone (ACTH) stimulates synthesis of adre-nocortical steroids. In the adrenal cortex, ACTH stimulates cortisol synthesis; ACTH also can stimulate adrenal androgen synthesis and has permissive effects on aldosterone production.
5. Follicle-stimulating hormone promotes development of primordial ovarian follicles in the fi rst half of the menstrual cycle. In the male, FSH promotes spermatogenesis, in conjunction with testosterone.
6. Luteinizing hormone promotes ovulation during the ovulatory phase of menstruation. In the male, LH stimulates Leydig cell testosterone synthesis.
7. Oxytocin stimulates milk let-down and uterine contraction. 8. Vasopressin acts on the renal collecting ducts to insert water chan-
nels (aquaporins) in the lumenal membranes, increasing solute-free water reabsorption. These effects help conserve fl uid and maintain blood pressure during dehydration or volume loss. It is also a potent vasoconstrictor.
Pituitary Hormones I: General Actions
Pituitary Hormones I: General Actions See Figure 26.4

Pituitary Hormones II: Growth Hormone Feedback Systems
Pituitary Hormones II: Growth Hormone Feedback Systems 7-6
PituitaryGH
Liver andother tissues
GH
Hypothalamus
Somatostatin
Somatomedin(IGF)
Somatomedin(IGF)
Amino acids
1. Identify the substances that contribute to negative feedbackregulation of growth hormone.
2. Predict the effect of uncontrolled elevation in circulatinggrowth hormone in an adult.
GHRH

1. Circulating insulin-like growth factor-1 (IGF-1) and growth hormone will down-regulate hypothalamic GHRH secretion, reducing pituitary GH secretion. In addition, increases in glucose and free fatty acids (FFA), as well as GHRH itself, will also exert negative feedback on GHRH.
2. Uncontrolled hypersecretion of GH in adulthood results in acro-megaly, which is characterized by thickening of the bones of the jaw and brow ridges, enlargement of the tongue, cardiovascular and renal complications, diabetes, and other effects. This condition is usually caused by a pituitary tumor (adenoma).
Pituitary Hormones II: Growth Hormone Feedback Systems
Pituitary Hormones II: Growth Hormone Feedback Systems See Figure 26.8
PituitaryGH
Liver andother tissues
GH
Hypothalamus
Somatostatin
Somatomedin(IGF)
Somatomedin(IGF)
Amino acids
GHRH
Glucose FFA
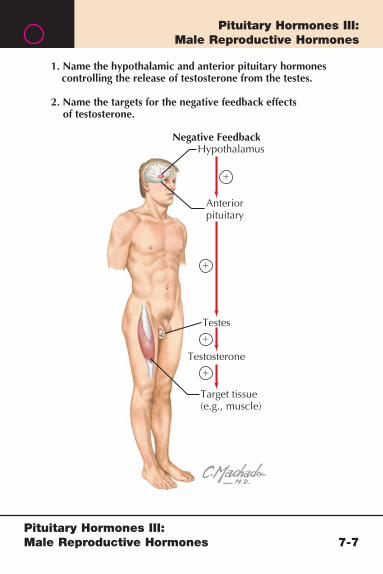
Pituitary Hormones III: Male Reproductive Hormones
Pituitary Hormones III: Male Reproductive Hormones 7-7
Negative Feedback
1. Name the hypothalamic and anterior pituitary hormonescontrolling the release of testosterone from the testes.
2. Name the targets for the negative feedback effectsof testosterone.
Hypothalamus
Anteriorpituitary
Testes
Testosterone
Target tissue(e.g., muscle)
�
�
�
�
1. Hypothalamic gonadotropin-releasing hormone (GnRH) stimulates LH and FSH from the anterior pituitary gland. LH stimulates testosterone synthesis.
2. Testosterone exerts negative feedback on both the hypothalamus and pituitary.
Pituitary Hormones III: Male Reproductive Hormones
Pituitary Hormones III: Male Reproductive Hormones See Figure 26.5

Pituitary Hormones IV: Female Reproductive Hormones
Pituitary Hormones IV: Female Reproductive Hormones 7-8
�
�
�
�
1. Name the hypothalamic and anterior pituitary hormonescontrolling estrogen secretion.
2. Name the hormonal targets for the negative feedback effectsof estrogen.
3. Name the hormonal targets for the positive feedback effectsof estrogen. When does this occur?
Hypothalamus
Ovary
Estradiol
Target tissue(e.g., breast,uterineendometrium)
Anteriorpituitary

1. Hypothalamic GnRH stimulates LH and FSH from the anterior pituitary gland. LH stimulates androgen production by theca interna cells; FSH stimulates the conversion of these androgens to estradiol in the granulosa cells of the ovarian follicles.
2. Estrogen (mainly estradiol) exerts negative feedback on GnRH, LH, and FSH.
3. High levels of estradiol can exert positive effects on both LH and FSH. This occurs near midcycle of the menstrual cycle and stimulates a surge in LH and FSH resulting in ovulation.
Pituitary Hormones IV: Female Reproductive Hormones
Pituitary Hormones IV: Female Reproductive Hormones See Figure 26.5

Thyroid Hormone I: Control of Thyroid Hormone Synthesis
Thyroid Hormone I: Control of Thyroid Hormone Synthesis 7-9
Pituitary
Thyroid
Hypothalamus
1. Name the hypothalamic releasing hormone indicated. 2. Name the pituitary trophic hormone indicated in this axis.3. Describe the effect of increased circulating T4 and T3 on the
hypothalamic releasing hormone and the pituitary trophichormone in this axis.
4. Describe the effect of decreased circulating T4 and T3 on the hypothalamic releasing hormone and the pituitary trophichormone in this axis.
5. Describe the effect of increased cortisol or growth hormoneon the pituitary trophic hormone in this axis.
1
2

1. Thyrotropin-releasing hormone (TRH) 2. TSH 3. Increased circulating triiodothyronine (T3) and thyroxine
(T4; through conversion to T3) exert negative feedback at both hypothalamic TRH and pituitary TSH.
4. Decreased circulating T3 and T4 will stimulate TRH and TSH production and secretion; the elevated TSH will stimulate release of thyroid hormones.
5. In addition to T3 and T4, cortisol and growth hormone can also inhibit TSH and thus inhibit thyroid hormone release.
Thyroid Hormone I: Control of Thyroid Hormone Synthesis
Thyroid Hormone I: Control of Thyroid Hormone Synthesis See Figure 27.3

Thyroid Hormone II: Synthesis
Thyroid Hormone II: Synthesis 7-10
1 2
34
5
6
Follicular epithelial cell
ThyroglobulinEndoplasmicreticulum mRNA
Aminoacids
Vesicle Golgiapparatus
Colloiddroplets Lysosomes
Proteolysis
Deiodinase
I– I– I–
Na+
T3T4
DIT
Thyroid
Thyroid hormone synthesis is illustrated in this thyroid follicularcell. Describe the events outlined in 1–6.
Thyroid folliclelumen
T3 T4
MIT DITPeroxidase
Endocytosis
Apicalmembrane
Basalmembrane
TG
T3 T4
MIT DIT
TG
TG
I–Iodidetrap
Na+
T3 T4
T3T4
MIT DIT
MIT
TG

1. Thyroglobulin molecules are produced in the endoplasmic reticulum and exocytosed into the follicular lumen.
2. Iodide enters the cell through the iodide trap and exits the cell into the lumen of the follicle.
3. Iodide is oxidized by thyroid peroxidase to iodine and substituted for the H� on the benzene ring of tyrosine residues of thyroglobulin.
4. Binding of one iodine forms monoiodotyrosine (MIT), and binding of two iodine moieties forms diiodotyrosine (DIT). The thyroid per-oxidase catalyzes the binding of DIT to DIT, forming T4, and DIT to MIT, forming T3.
5. The mature thyroglobulin (containing DIT, MIT, T4, and T3) is endocytosed and can be stored as colloid.
6. TSH stimulates lysosomal proteolysis of the colloid, release of T4 and T3 into the blood, and reentry of the DIT and MIT into the synthetic pool.
Thyroid Hormone II: Synthesis
Thyroid Hormone II: Synthesis See Figure 27.3

Thyroid Hormone III: Intracellular Actions 7-11
Thyroid Hormone III: Intracellular Actions
MitochondriaRespiratory enzymesNa+, K+-ATPaseOther enzymes
????
??
O2 consumptionMetabolic rate
T4 Cell membrane
The diagram illustrates binding of thyroid hormone (TH) to itsnuclear receptor and subsequent intracellular actions.
1. What is the major form of circulating thyroid hormone?2. What is the active form of TH?3. What are the effects of thyroid hormone on the processes
within the cell listed in the inset box?
DNA mRNA
Other proteinsand hormones
T3Nucleus
Nuclearreceptor
Cytoplasm
Intracellular effects
Deiodination
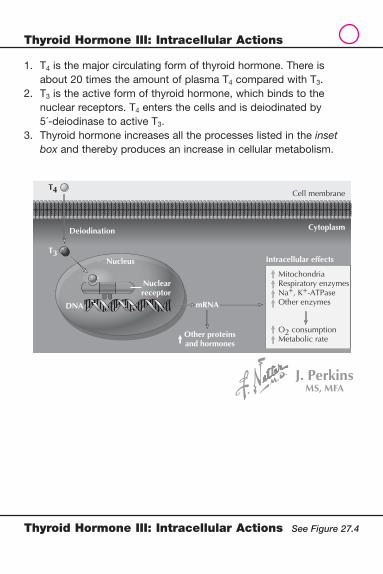
1. T4 is the major circulating form of thyroid hormone. There is about 20 times the amount of plasma T4 compared with T3.
2. T3 is the active form of thyroid hormone, which binds to the nuclear receptors. T4 enters the cells and is deiodinated by 5´-deiodinase to active T3.
3. Thyroid hormone increases all the processes listed in the inset box and thereby produces an increase in cellular metabolism.
Thyroid Hormone III: Intracellular Actions
Thyroid Hormone III: Intracellular Actions See Figure 27.4
MitochondriaRespiratory enzymesNa+, K+-ATPaseOther enzymes
O2 consumptionMetabolic rate
T4 Cell membrane
DNA mRNA
Other proteinsand hormones
T3Nucleus
Nuclearreceptor
Cytoplasm
Intracellular effects
Deiodination

Thyroid Hormone IV: General Systemic Actions
Thyroid Hormone IV: General Systemic Actions 7-12
Whole body effects
Thyroid hormone has effects on all organ systems. Describe:
1. The general effects on growth and development of the centralnervous system and bone.
2. The effects of thyroid hormone on the parameters listed belowfor the lungs, heart, and kidneys.
Bones Centralnervous system
CO2Ventilation
UreaCardiacoutput
Normal growthand development
Renalfunction

1. Thyroid hormone (TH) promotes normal growth and development of the central nervous system and bone. Typically, it acts in a synergistic manner with growth factors.
2. TH increases CO2 production and increases ventilation and car-diac output. TH also increases renal function and urea production.
Comment: Remember, although T4 is the predominant circulating thyroid hormone, once in tissues, T4 is converted to active T3 by 5´-deiodinase. In general, TH increases cellular metabolism and thus will promote hormone production, Na�/K�-ATPase activity, and O2 consumption.
Thyroid Hormone IV: General Systemic Actions
Thyroid Hormone IV: General Systemic Actions See Figure 27.4

Adrenal Hormones I: Adrenal Gland Structure
Adrenal Hormones I: Adrenal Gland Structure 7-13
Capsule
Capsular plexus
Suprarenal artery (one of many)
Glomerulosa
Reticularis
Medulla
Medullary capillaries
Medullary arteriole
Cortical capillaries
Central vein
Muscle veins
Fasciculata
Schematic stereogram of intrinsicsuprarenal circulation
Referring to this adrenal gland structure, name the sitesof production of:
1. Cortisol2. Aldosterone3. Androgens4. Epinephrine5. Norepinephrine

1. Zona fasciculata 2. Zona glomerulosa 3. Zona reticularis 4. Medullary chromaffi n cells 5. Medullary chromaffi n cells
Comment: The adrenal steroids (cortisol, aldosterone, and the androgens dehydroepiandrosterone and androstenedione) are synthesized in cells of the adrenal cortex. Small amounts of testosterone and estradiol are also produced. The medullary cells synthesize catecholamines, primarily epinephrine.
Adrenal Hormones I: Adrenal Gland Structure
Adrenal Hormones I: Adrenal Gland Structure See Figure 28.2

Adrenal Hormones II: Adrenal Cortical Hormones
Adrenal Hormones II: Adrenal Cortical Hormones 7-14
1
2
PituitaryACTH
ACTH
Progesterone
11-Deoxycorticosterone
Corticosterone Dehydroepiandrosterone(DHEA)
17�-OH-Pregnenolone
17�-OH-Progesterone
11-Deoxycortisol
CORTISOL
ALDOSTERONE DHEA-SULFATE(DHEA-S)
ANDROSTENEDIONE TESTOSTERONE ESTRADIOL
Gonads
Cortisol
HypothalamusCRH
CRH
1–2. Identify the major elements in the biosynthetic pathwayfound in the adrenal cortex.
3. Predict the effect of chronically elevated cortisol as observedin Cushing’s syndrome on blood pressure, blood glucose, and bone density.
O
OOHO HC
HSO3
C
CH2OH
O
O O OH OH
HOO O
O
OHO OH
C
CH2OH
CYP11A1
CYP17*
sulfotransferase CYP17*
3�-HSD 2
CYP21A2
CYP11B1
CYP11B2
CYP17
3�-HSD 2
CYP21A2
CYP11B1
1. Cholesterol2. �5-Pregnenolone 3. Symptoms of Cushing’s syndrome include increased blood
pressure (hypertension), hyperglycemia and insulin resistance, and decreased bone density and osteoporosis.
Comment: In addition, Cushing’s syndrome is also commonly associated with:
• “Moon face”• Centripetal obesity, with muscle wasting in the extremities• Thinning and bruising of the skin
Other important actions of the glucocorticoids include anti-infl ammatory, immunosuppressive, and vascular effects.
Adrenal Hormones II: Adrenal Cortical Hormones
Adrenal Hormones II: Adrenal Cortical Hormones See Figure 28.3

The Endocrine Pancreas I: Major Hormones
The Endocrine Pancreas I: Major Hormones 7-15
2
2
1
Identify the structure labeled 1, and describe its function.
Identify the structure labeled 2, and name the cell typesin this structure and identify their products.
1
Low-power section of pancreas
High-power sectionof pancreas

1. Acinar cells produce exocrine buffers and enzymes that are secreted through ducts into the small intestine.
2. The islet cells produce hormones that are released into systemic blood:Insulin is produced by the � cells.Glucagon is produced by the � cells.Somatostatin is produced by the � cells.
The Endocrine Pancreas I: Major Hormones
The Endocrine Pancreas I: Major Hormones See Figure 29.1

The Endocrine Pancreas II: Insulin Secretion
The Endocrine Pancreas II: Insulin Secretion 7-16
S
SS
Proinsulin
Insulin
Illustration depicts the proinsulin molecule.
1. Cleavage of the connecting peptide (C-peptide) occursin what organelle?
2. Name the insulin-sensitive glucose transporters (GLUT)that are on skeletal and cardiac muscle and adipose tissue.
3. When is C-peptide useful in determining insulin secretion?
Phe
Val
AsnGln
HisLeu
CysGly Ser
GlyIle
ValGluGln CysCys Thr Ser Ile Cys Ser Leu Tyr GlnLeu GluAsn Tyr Cys
SS
S
Asn
His Leu Val GluAla Leu Tyr Leu Val CysGlyGluArg
GlyPhe
PheTyr
Thr
Pro
Lys
Ala
Arg
ArgGlu
AlaGln
AsnPro
GlnAlaGlyAlaValGluLeu
GlyGly
GlyGlyGly LeuLeuGlnAlaAlaLeuGlu
GlyPro
Pro
Gln
Lys
Arg
Leu
NH2
123
45
67 8 9 10 11 12 13 14 15 16 17 18 19 20 21
2223
2425
26
27
28
29
30
31
32
33
34
3536
37383940414243
4445
464748495051525354555657
58
59
60
61
62
63 12 3 4 5 6 7 8 9 10 11 12 13 14 15 16 17 18 19 20
21COOHA chain
Connectingpeptide
B chain

1. C-peptide is cleaved from proinsulin in the Golgi apparatus, forming insulin. Both insulin and C-peptide are secreted.
2. GLUT4 transporters are the insulin-sensitive transporters on these tissues.
3. C-peptide is used to determine endogenous insulin secretion in diabetic patients who receive insulin injections. Because C-peptide is secreted with insulin, the amount of C-peptide refl ects endogenous insulin production.
The Endocrine Pancreas II: Insulin Secretion
The Endocrine Pancreas II: Insulin Secretion See Figure 29.2

The Endocrine Pancreas III: Actions of Insulin
The Endocrine Pancreas III: Actions of Insulin 7-17
Liver
Adiposetissue
InsulinStimulates
Glycogen
Glucose-P
Glucose
Keto acids
Free fatty acids
Glucose
Aminoacids
Muscle
PyruvateCO2
Insulin is a hypoglycemic, or “fuel storage” hormone.Describe the actions of insulin on each site.
Inhibits
1
2
3

1. In muscle, insulin increases GLUT4 transporters in membranes, promoting effi cient glucose entry into cells. Insulin also stimulates glycogen production and inhibits glycogenolysis.
2. In the liver, insulin increases glycogen production and inhibits glycogenolysis and gluconeogenesis. This inhibits glucose release into the blood. In addition, insulin inhibits oxidation of fatty acids, reducing formation of keto acids.
3. In adipose tissue, insulin inhibits lipolysis, reducing circulating free fatty acids. Insulin also inhibits oxidation of fatty acids, reducing formation of keto acids.
The Endocrine Pancreas III: Actions of Insulin
The Endocrine Pancreas III: Actions of Insulin See Figure 29.4

The Endocrine Pancreas IV: Actions of Glucagon
The Endocrine Pancreas IV: Actions of Glucagon 7-18
Glucagon
Glucagon is a hyperglycemic, or “fuel mobilization” hormone.Describe the actions of glucagon at each site.
Liver
Adiposetissue
Glycogen
Muscle
Glucose-P Glucose
Keto acids
Free fatty acids
Glucose
Aminoacids Pyruvate
CO2
1
2
3

1. In muscle, glucagon inhibits protein synthesis, releasing amino acids into the circulation for use in gluconeogenesis in the liver.
2. In the liver, glucagon inhibits glycolysis and stimulates glycogenol-ysis and gluconeogenesis; this releases glucose into the blood.
3. In adipose tissue, glucagon stimulates lipolysis and increases �-oxidation of fatty acids. Circulating free fatty acids and keto acids are increased.
The Endocrine Pancreas IV: Actions of Glucagon
The Endocrine Pancreas IV: Actions of Glucagon See Figure 29.5

Calcium-Regulating Hormones I: Vitamin D
Calcium-Regulating Hormones I: Vitamin D 7-19
Sun
Skin
Liver
Kidney
Ultraviolet light
Active vitamin D (1,25-dihydroxycholecalciferol) is a majorcalcium regulatory hormone. Describe the products in the pathway foractive vitamin D synthesis by the organs:
1. Skin2. Liver3. Kidneys4. State under what conditions vitamin D would be stimulated.
Ca2� and Pi in foodVit. D
?
?
?

1. Skin: Exposure to ultraviolet light can produce vitamin D (cholecalciferol) from 7-dehydroxycholesterol in skin cells.
2. Liver: Cholecalciferol from the skin (and from dietary intake) is hydroxylated in the liver to 25-hydroxycholecaliferol.
3. Kidneys: Circulating 25-hydroxycholecalciferol is further hydroxylated to 1, 25-dihydroxycholecalciferol in the kidneys. This is the active form of vitamin D.
4. Active vitamin D production is stimulated when plasma calcium level is low. Parathyroid hormone (PTH) secretion is stimulated when plasma calcium falls; the PTH stimulates renal 1-�-hydroxylase to increase formation of active vitamin D.
Calcium-Regulating Hormones I: Vitamin D
Calcium-Regulating Hormones I: Vitamin D See Figure 30.2
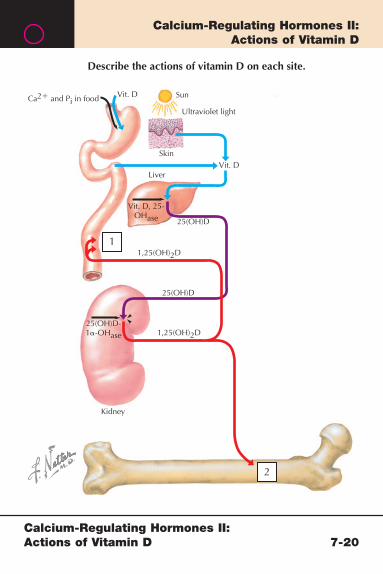
Calcium-Regulating Hormones II: Actions of Vitamin D
Calcium-Regulating Hormones II: Actions of Vitamin D 7-20
Sun
Skin
Liver
25(OH)D
1,25(OH)2D
Kidney
1,25(OH)2D25(OH)D-1�-OHase
Vit. D, 25-OHase
25(OH)D
Ultraviolet light
Ca2� and Pi in food Vit. D
Describe the actions of vitamin D on each site.
Vit. D
1
2
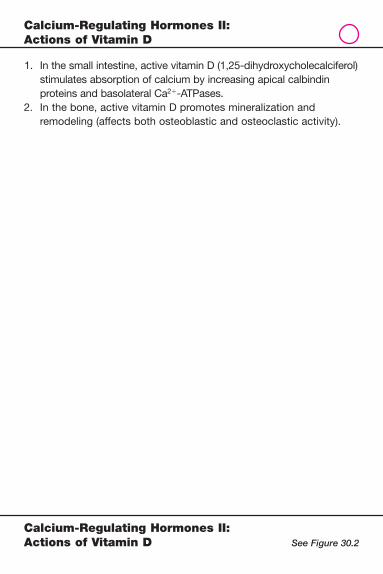
1. In the small intestine, active vitamin D (1,25-dihydroxycholecalciferol) stimulates absorption of calcium by increasing apical calbindin proteins and basolateral Ca2�-ATPases.
2. In the bone, active vitamin D promotes mineralization and remodeling (affects both osteoblastic and osteoclastic activity).
Calcium-Regulating Hormones II: Actions of Vitamin D
Calcium-Regulating Hormones II: Actions of Vitamin D See Figure 30.2
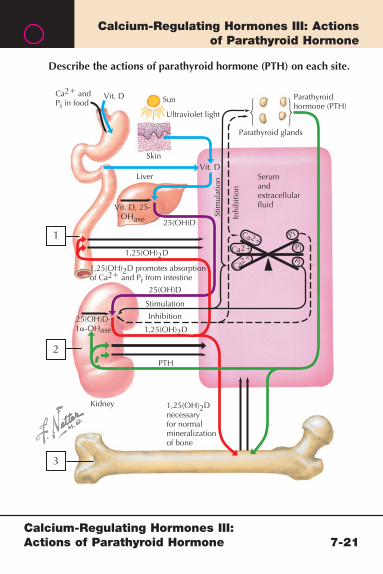
Calcium-Regulating Hormones III: Actions of Parathyroid Hormone 7-21
Calcium-Regulating Hormones III: Actions of Parathyroid Hormone
Sun
Describe the actions of parathyroid hormone (PTH) on each site.
Skin
Parathyroid glands
Serumandextracellularfluid
Parathyroidhormone (PTH)
Liver
25(OH)D
Ca2�
Ca2�
Ca2�
1,25(OH)2DPiPi
Pi
PTH
Kidney
1,25(OH)2D25(OH)D-1�-OHase
Vit. D, 25-OHase
1,25(OH)2Dnecessaryfor normalmineralizationof bone
25(OH)D
Stimulation
Inhibition
Stim
ulat
ion
Inhi
bitio
n
1,25(OH)2D promotes absorptionof Ca2� and Pi from intestine
Ultraviolet light
Ca2� andPi in food
Vit. D
Vit. D
1
2
3

1. Small Intestine: PTH indirectly promotes intestinal calcium ab-sorption by increasing the formation of active vitamin D by the kidneys. This is a slow mechanism for adjusting plasma calcium level because it is dependent on calcium intake.
2. Kidneys: PTH directly increases calcium reabsorption in the distal tubule; decreases phosphate reabsorption in the proximal tubule; and increases the formation of active vitamin D. These actions are rapid and are the primary pathway for restoration of plasma calcium levels.
3. Bone: PTH promotes the osteoclastic resorption of bone matrix, which adds both calcium and phosphate to the plasma. The actions of PTH also contribute to normal bone remodeling.
Comment: PTH responds rapidly to decreased plasma calcium levels and acts to increase intestinal absorption and bone resorption of both calcium and phosphate, and renal reabsorption of only calcium. PTH also reduces renal phosphate reabsorption, so surplus phosphate in the plasma is eliminated in the urine.
Calcium-Regulating Hormones III: Actions of Parathyroid Hormone
Calcium-Regulating Hormones III: Actions of Parathyroid Hormone See Figure 30.2

Calcium-Regulating Hormones IV: Altered Parathyroid Secretion
Calcium-Regulating Hormones IV: Altered Parathyroid Secretion 7-22
Gut
Skin
Describe the effects of hyperparathyroidismon calcium handling at each site.
Ca2+
Ca2+Ca2+
Ca2+
Ca2+
Ca2+
Ca2+
Pi
Pi
?
Pi
Pi
Pi
Pi
PiPi
Vit.D
Parathyroid hormone(PTH) elevated25(OH)D
Liver
Serum andextracellular fluid
Renal tubuleHigh 1,25(OH)2D promotesabsorption of Ca2+ from gut
Serum Ca2+increased;fails to suppressPTH secretion
Ca2+ filtration
25(OH)D normal
1,25(OH)2D elevated
Serum Pi lowor normal
PTH
UrineCa2+
1
2
3
Adenoma (~85% of cases)
Hyperplasia (~15% of cases)
Carcinoma(rare)

1. Small intestine: Intestinal calcium and phosphate absorption is stimulated by the high plasma vitamin D levels.
2. Kidneys: Elevated PTH will increase the formation of active vitamin D, increase calcium reabsorption in the distal tubules, and decrease phosphate reabsorption in the proximal tubules. The continual elevation of PTH in hyperparathyroidism will result in abnormally high plasma calcium and low plasma phosphate levels. The normal feedback regulation of PTH by high plasma calcium is not operant in hyperparathyroidism.
3. Bone: High PTH levels will increase osteoclastic resorption of bone; however, there can be a compensatory increase in osteoblastic activity (stimulated by vitamin D); thus, although remodeling is increased, reduction in bone density is not always observed.
Comment: The abnormally high fi ltered load of calcium results in hypercalciuria. The high concentration of calcium in the tubular fl uid may result in the formation of calculi (kidney stones). The primary cause of hyperparathyroidism is adenoma.
Calcium-Regulating Hormones IV: Altered Parathyroid Secretion
Calcium-Regulating Hormones IV: Altered Parathyroid Secretion See page 352
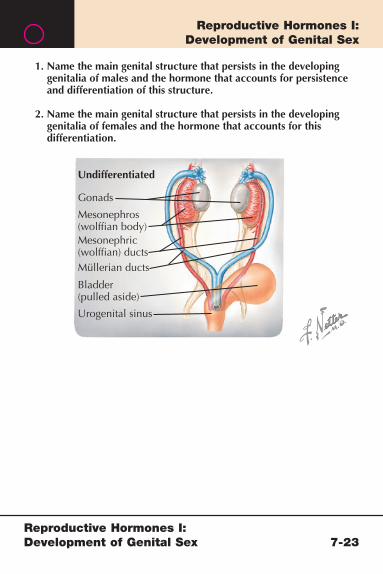
Reproductive Hormones I: Development of Genital Sex 7-23
Reproductive Hormones I: Development of Genital Sex
Gonads
Undifferentiated
1. Name the main genital structure that persists in the developinggenitalia of males and the hormone that accounts for persistenceand differentiation of this structure.
2. Name the main genital structure that persists in the developinggenitalia of females and the hormone that accounts for thisdifferentiation.
Mesonephros(wolffian body)Mesonephric(wolffian) ductsMüllerian ducts
Bladder(pulled aside)
Urogenital sinus

1. The wolffi an ducts persist in the male fetus and become the vas deferens. Testosterone, secreted from the fetal testes, induces this differentiation. The testes also secrete müllerian-inhibiting factor, which causes degeneration of the müllerian ducts.
2. In the female fetus, the absence of testosterone allows the persistence of the müllerian ducts and degeneration of the wolffi an ducts. The müllerian ducts become the fallopian tubes.
Comment: Differentiation in the early embryo depends on the prod-ucts encoded by the X and Y chromosomes. Importantly, the SRY gene on the Y chromosome results in the differentiation of the gonads into testes. By 8 to 9 weeks of development, the Leydig cells of the fetal testes begin to secrete testosterone.
Reproductive Hormones I: Development of Genital Sex
Reproductive Hormones I: Development of Genital Sex See Figure 31.1
Female MaleOvary
Wolffian ductdegeneratesandmüllerian ductpersistsin absenceof testosterone
Testis
Degeneratingmüllerian ductPersistentwolffian duct(vas deferens)
Fallopian tubeGartner’s ductEpoöphoron
Appendixvesiculosa
Paroöphoron
OvaryUterus
Round lig.Upper vaginaWolffian ductremnant
UrethraLower vaginaSkene's duct
Bartholin's gland
Vas deferens
Seminal vesicleProstatic utricleProstate glandBulbourethralgland
AppendixepididymidisAppendix testisEpididymisVasa efferentiaTestisGubernaculum
Vas deferens
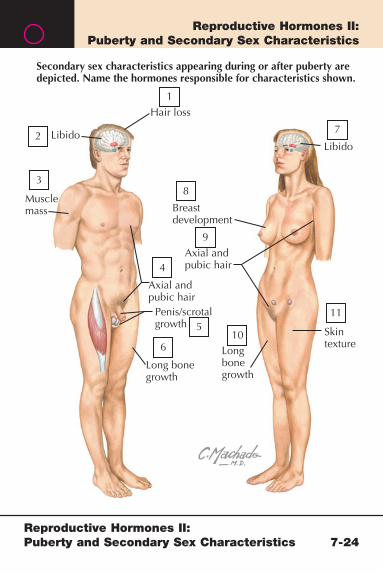
Reproductive Hormones II: Puberty and Secondary Sex Characteristics
Reproductive Hormones II: Puberty and Secondary Sex Characteristics 7-24
Long bonegrowth
Longbonegrowth
Breastdevelopment
Hair loss
Secondary sex characteristics appearing during or after puberty aredepicted. Name the hormones responsible for characteristics shown.
LibidoLibido
Musclemass
Axial andpubic hair
Axial andpubic hair
Skintexture
Penis/scrotalgrowth
1
2
3
9
6
5
4
8
11
10
7
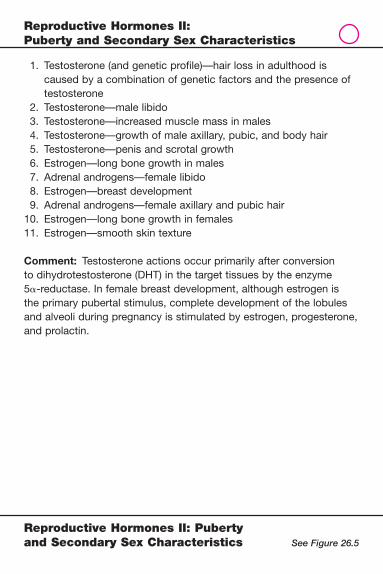
1. Testosterone (and genetic profi le)—hair loss in adulthood is caused by a combination of genetic factors and the presence of testosterone
2. Testosterone—male libido 3. Testosterone—increased muscle mass in males 4. Testosterone—growth of male axillary, pubic, and body hair 5. Testosterone—penis and scrotal growth 6. Estrogen—long bone growth in males 7. Adrenal androgens—female libido 8. Estrogen—breast development 9. Adrenal androgens—female axillary and pubic hair 10. Estrogen—long bone growth in females 11. Estrogen—smooth skin texture
Comment: Testosterone actions occur primarily after conversion to dihydrotestosterone (DHT) in the target tissues by the enzyme 5�-reductase. In female breast development, although estrogen is the primary pubertal stimulus, complete development of the lobules and alveoli during pregnancy is stimulated by estrogen, progesterone, and prolactin.
Reproductive Hormones II: Puberty and Secondary Sex Characteristics
Reproductive Hormones II: Puberty and Secondary Sex Characteristics See Figure 26.5

Reproductive Hormones III: Hormonal Regulation of the Menstrual Cycle
Reproductive Hormones III: Hormonal Regulation of the Menstrual Cycle 7-25
Ovariancycle
Menstruation Proliferative Secretory
Uterinecycle
FOLLICULAR
Identify the hormones primarily responsiblefor changes in the ovary and uterus.
OVULATORY LUTEAL
4 Days Days
Bleeding
Developing follicles Rupturedfollicle
Corpus luteum
Ovum
Endometrialsloughing
Furtherendometrial proliferation
Ovulation
Endometrialproliferation
and vascularization
Maturefollicle
Gland Venous lakesSpiralartery
VeinBleeding
14 28
6
41
Follicular development
2
3
5

1. Follicular development—FSH 2. Endometrial proliferation and vascularity—estrogen 3. Ovulation—LH, stimulated by surge in estrogen 4. Further endometrial proliferation—progesterone 5. Endometrial sloughing—reduction in progesterone (with absence
of implantation of fertilized egg)
Reproductive Hormones III: Hormonal Regulation of the Menstrual Cycle
Reproductive Hormones III: Hormonal Regulation of the Menstrual Cycle See Figure 31.3

Reproductive Hormones IV: Feedback Regulation of the Menstrual Cycle
Reproductive Hormones IV: Feedback Regulation of the Menstrual Cycle 7-26
Pituitary
HypothalamusA. Late follicularand ovulatoryphases
1. Name the hormone that produces positive feedback effects onthe hypothalamus and pituitary during the late follicularand ovulatory phases.
2. Name the precursor of this hormone (1) produced by the thecainterna cells.
3. Name the hormones produced by the granulosa cells of the corpusluteum that produce negative feedback on both the pituitaryand hypothalamus.
4. Name the hormone produced by the granulosa cells that exertsnegative feedback on pituitary FSH secretion.
LH FSH
Granulosacell
Thecacell
GnRH
Pituitary
HypothalamusB. Luteal phase
LH FSH
Granulosacell
Thecacell
GnRH
FSHLH
1
2
4
33

1. Estrogen 2. Androgens 3. Estrogen and progesterone 4. Inhibin
Reproductive Hormones IV: Feedback Regulation of the Menstrual Cycle
Reproductive Hormones IV: Feedback Regulation of the Menstrual Cycle See Figure 31.5
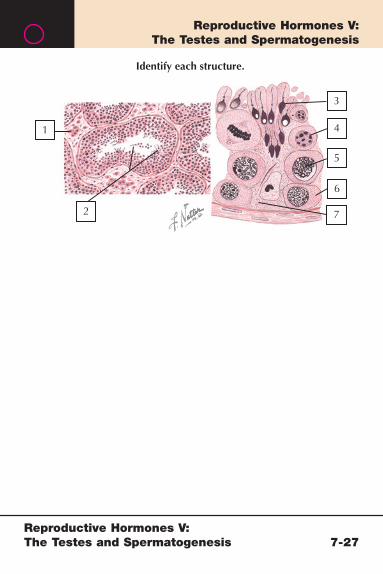
Reproductive Hormones V: The Testes and Spermatogenesis 7-27
Reproductive Hormones V: The Testes and Spermatogenesis
7
1
2
6
5
4
3
Identify each structure.

1. Leydig cells 2. Seminiferous tubules 3. Spermatid 4. Secondary spermatocyte 5. Primary spermatocyte 6. Spermatogonium 7. Sertoli cell
Reproductive Hormones V: The Testes and Spermatogenesis
Reproductive Hormones V: The Testes and Spermatogenesis See Figure 31.7
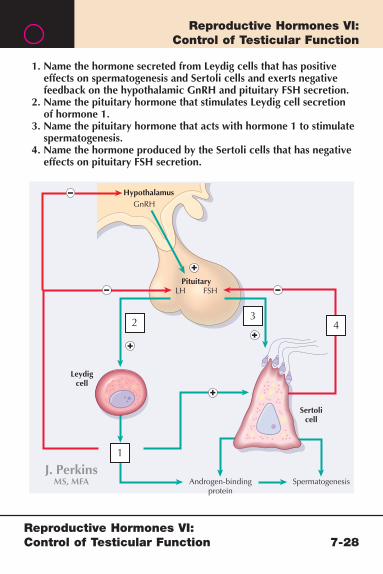
Reproductive Hormones VI: Control of Testicular Function
Reproductive Hormones VI: Control of Testicular Function 7-28
PituitaryLH FSH
Hypothalamus
Spermatogenesis
1. Name the hormone secreted from Leydig cells that has positiveeffects on spermatogenesis and Sertoli cells and exerts negativefeedback on the hypothalamic GnRH and pituitary FSH secretion.
2. Name the pituitary hormone that stimulates Leydig cell secretionof hormone 1.
3. Name the pituitary hormone that acts with hormone 1 to stimulatespermatogenesis.
4. Name the hormone produced by the Sertoli cells that has negativeeffects on pituitary FSH secretion.
Androgen-bindingprotein
Sertolicell
Leydigcell
GnRH
1
2 43
1. Testosterone 2. LH 3. FSH 4. Inhibin
Reproductive Hormones VI: Control of Testicular Function
Reproductive Hormones VI: Control of Testicular Function See Figure 31.8

Net filtration � Kf [(HPc � πi)�(Pi � πc)]
Starling’s equation, where Kf is the filtration coefficent, HPc is capillaryhydrostatic pressure, πi is interstitial oncotic pressure, Pi is interstitialhydrostatic pressure and πc is capillary oncotic pressure.
Simplified Nernst equation, where EX is the equilibrium potential, z is charge of ion x, [X]o is its concentration outside the cell and [X]i is its concentration inside the cell.
Simplified Goldman-Hodgkin-Katz equation, where Vm is resting membrane potential, and Px is membrane permeability to ion x.
V � IROhm’s law, where V is potential difference (voltage), I is currentand R is resistance.
G � 1/RWhere G is conductance.
Ix � G(Vm � Ex)Where Ix is current for ion x and Ex is the Nernst potential of the ion.
τ � RmCmWhere τ is the time constant, Rm is membrane resistanceand Cm is membrane capacitance.
� � (Rm/Ri)Where � is the space constant and Ri is internal resistance.
Fluid Homeostasis
Nerve and Muscle Physiology
61 mVEX �
61 mVPK�[K�
o] � PNa� [Na�o] � PC l�[Cl�i]
PK�[K�i] � PNa� [Na�
i] � PC l�[Cl�o]Vm �
zlog
log
[X]o
[X]i
*
*
Key Equations
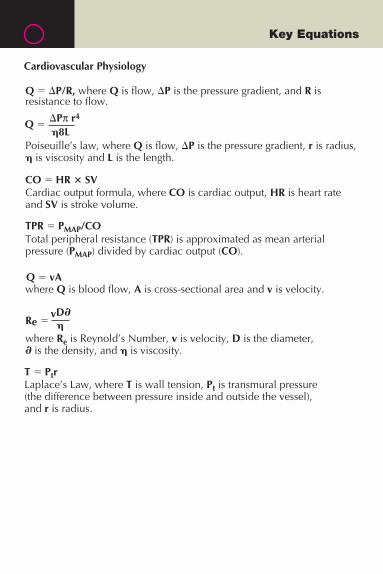
Key Equations
Q � �P/R, where Q is flow, �P is the pressure gradient, and R isresistance to flow.
Cardiac output formula, where CO is cardiac output, HR is heart rateand SV is stroke volume.
Total peripheral resistance (TPR) is approximated as mean arterialpressure (PMAP) divided by cardiac output (CO).
where Q is blood flow, A is cross-sectional area and v is velocity.
Laplace’s Law, where T is wall tension, Pt is transmural pressure(the difference between pressure inside and outside the vessel),and r is radius.
vD�
�Pπ r4
Cardiovascular Physiology
Poiseuille’s law, where Q is flow, �P is the pressure gradient, r is radius,� is viscosity and L is the length.
�8L
where Re is Reynold’s Number, v is velocity, D is the diameter,� is the density, and � is viscosity.
�
Q �
Re �
CO � HR � SV
TPR � PMAP/CO
Q � vA
T � Ptr

Key Equations
TLC � RV � ERV � V� � IRV � RV � VC,where TLC is total lung capacity, RV is residual volume, ERV is expiratoryreserve volume, V� is tidal volume, IRV is inspiratory reserve volume,and VC is vital capacity.
FRC � ERV � RV, where FRC is functional residual capacity, ERV is expiratoryreserve volume and RV is residual volume.
V � R � V�, where V is minute ventilation, R is the respiratory rateand V� is the tidal volume.
V � R(V� � VD), where V is alveolar ventilation, R is respiratory rate,V� is tidal volume and VD is dead space volume.
Fick’s law, where Vgas is diffusion of gas between two compartments, A is the area of a membrane separating the compartments, T is thickness, D is the dif-fusion constant and P1 and P2 are gas concentrations in the two compartments.
PO2 � PIO2 � PCO2 /R,
the alveolar gas equation, where PO2 is partial pressure of oxygen in alveolar
air, PIO2 is partial pressure of oxygen in inspired air, PCO2 is partial pressureof CO2 in alveolar air, and R is the respiratory quotient.
DLCO� VCO/PCO, where DLCO is diffusion capacity of the lung for CO,VCO is diffusion of CO and PCO is alveolar partial pressure of CO.
Rate of airflow � (P � P��)/Raw, where P is alveolar pressure,P�� is atmospheric pressure and Raw is airway resistance.
Respiratory Physiology
. .
. .
.
.�
..
�Pπ r4 Poiseuille’s law, where Q is airflow, �P is the pressure gradient, r is radius, � is viscosity and L is the length.
Henderson-Hasselbalch equation for bicarbonate buffering system in blood.
O2 binding capacity � (1.34 ml O2/g Hb) � (g Hb/100 ml blood).
O2 content � % Saturation � O2 binding capacity � dissolved O2.
O2 consumption � [a � v]O2 � Cardiac Output.
�8L
[HCO3�]
0.03 . PCO2
Q �
pH � 6.1� log
A . D . (P1 - P2)Vgas �

Key Equations
Cx � (Ux*V)/Pxwhere Cx is the clearance of substance x, Ux is its urine concentration,V is urine flow rate and Px is plasma concentration of substance x.
Renal Physiology .
.
GFR � Cin � (Uin*V)/Pinwhere GFR is glomerular filtration rate, which is equal to clearanceof inulin (Cin).
.
eRPF � CPAH � (UPAH*V)/PPAHwhere eRPF is effective renal plasma flow, which is equal to clearanceof PAH (paraminohippurate).
FF � GFR/RPFwhere FF is the filtration fraction, the fraction of the renal plasma flowthat is filtered.
eRBF � (eRPF)/(1-HCT)where eRBF is effective renal blood flow and HCT is hematocrit.
FLx � Px * GFRwhere FLx is the filtered load of substance x, and Px is plasmaconcentration of substance x.
Ex � UxVwhere Ex is urinary excretion rate of substance x, Ux is its urineconcentration and V is urine flow rate.
.
.
.
Rx � FLx � UxVwhere Rx is the reabsorption rate of substance x.
.
FEx � [(U/P)x /(U/P)in]*100where FEx is fractional excretion of substance x, (U/P)x is the ratioof urinary to plasma concentration of x, and (U/P)in is the ratio ofurinary to plasma concentration of inulin.
FRx � [1� (Ex/FLx)]*100where FRx is fractional reabsorption of substance x.
uploaded by [stormrg]