network theory analysis of antibody-antigen reactivity data: the …€¦ · network theory...
TRANSCRIPT

Network Theory Analysis of Antibody-Antigen ReactivityData: The Immune Trees at Birth and AdulthoodAsaf Madi1,2., Dror Y. Kenett1., Sharron Bransburg-Zabary1,2, Yifat Merbl3,4, Francisco J. Quintana3,5,
Alfred I. Tauber6, Irun R. Cohen3*, Eshel Ben-Jacob1,7*
1 School of Physics and Astronomy, Tel Aviv University, Tel Aviv, Israel, 2 Faculty of Medicine, Tel Aviv University, Tel Aviv, Israel, 3Department of Immunology, Weizmann
Institute of Science, Rehovot, Israel, 4Department of Systems Biology, Harvard Medical School, Boston, Massachusetts, United States of America, 5Center for Neurologic
Diseases, Brigham and Women’s Hospital, Harvard Medical School, Boston, Massachusetts, United States of America, 6 School of Medicine, Boston University, Boston,
Massachusetts, United States of America, 7Center for Theoretical and Biological Physics, University of California San Diego, La Jolla, California, United States of America
Abstract
Motivation: New antigen microarray technology enables parallel recording of antibody reactivities with hundreds ofantigens. Such data affords system level analysis of the immune system’s organization using methods and approaches fromnetwork theory. Here we measured the reactivity of 290 antigens (for both the IgG and IgM isotypes) of 10 healthy mothersand their term newborns. We constructed antigen correlation networks (or immune networks) whose nodes are theantigens and the edges are the antigen-antigen reactivity correlations, and we also computed their correspondingminimum spanning trees (MST) – maximal information reduced sub-graphs. We quantify the network organization(topology) in terms of the network theory divergence rate measure and rank the antigen importance in the full antigencorrelation networks by the eigen-value centrality measure. This analysis makes possible the characterization andcomparison of the IgG and IgM immune networks at birth (newborns) and adulthood (mothers) in terms of topology andnode importance.
Results: Comparison of the immune network topology at birth and adulthood revealed partial conservation of the IgGimmune network topology, and significant reorganization of the IgM immune networks. Inspection of the antigenimportance revealed some dominant (in terms of high centrality) antigens in the IgG and IgM networks at birth, which retaintheir importance at adulthood.
Citation: Madi A, Kenett DY, Bransburg-Zabary S, Merbl Y, Quintana FJ, et al. (2011) Network Theory Analysis of Antibody-Antigen Reactivity Data: The ImmuneTrees at Birth and Adulthood. PLoS ONE 6(3): e17445. doi:10.1371/journal.pone.0017445
Editor: Joseph Najbauer, City of Hope National Medical Center and Beckman Research Institute, United States of America
Received September 5, 2010; Accepted February 3, 2011; Published March 8, 2011
Copyright: ! 2011 Madi et al. This is an open-access article distributed under the terms of the Creative Commons Attribution License, which permitsunrestricted use, distribution, and reproduction in any medium, provided the original author and source are credited.
Funding: This research has been supported by the Maugy-Glass Chair in Physics of Complex Systems and the Tauber Family Foundation at Tel Aviv University,and by the National Science Foundation-sponsored Center for Theoretical Biological Physics (CTBP) Grants PHY-0216576 and 0225630, the University of Californiaat San Diego. The funders had no role in study design, data collection and analysis, decision to publish, or preparation of the manuscript.
Competing Interests: Eshel Ben-Jacob is a PLoS ONE Academic Editor.
* E-mail: [email protected] (IRC); [email protected] (EBC)
. These authors contributed equally to this work.
Introduction
The recently introduced new antigen microarray chip enablesdetection in parallel of the patterns of antibodies binding tohundreds of antigens, and so provides a system-level view of theantibody repertoire [1,2,3]. Recently, we analyzed autoantibodyreactivity data of IgM and IgG isotypes present in the sera of 10healthy mothers at childbirth and in the sera of the cord bloods oftheir offspring. The data were obtained using an antigen chip with290 antigens (see Supporting Information S1). The antigen-antigen correlation matrices revealed that the IgG repertoires ofeach mother and her offspring were very closely related anddistinct for each mother-newborn pair [4]. The IgM repertoires, incontrast, differed markedly between mothers and offspring; eachmother manifested a different pattern of IgM reactivities that wasdistinct from her offspring’s cord IgM repertoire. However, theIgM reactivities of each of the newborn samples manifested verysimilar antigen-binding profiles indicating that in utero eachdeveloping fetus produced autoantibodies to a similar set of self-
molecules. A subsequent analysis of the data revealed that thereactivity profiles to certain self-molecules were highly correlatedas sets of functional antigen-reactivity cliques [4].Here, we extended the study of these data by applying graph
and network theory analysis methods [5,6,7]; the aim was toconfirm the previous findings and search for additional insightsinto the internal structures of the natural autoantibody repertoires.To this end, we present the antigen-antigen correlation matrices interms of immune correlation networks (or immune networks).Each node in these networks represents a specific antigen and theedges that connect the nodes represent the corresponding antigen-antigen correlations. To extract the most relevant information, weevaluated the corresponding Minimum Spanning Trees (MST), orimmune trees, for the networks of antigen correlations computedfrom the correlation matrices [5,6,7,8]. The MST is a widely usedsub-graph of the complete network that is constructed using aspecial algorithm that enables to extract the most relevantinformation from the full network [9]. In the complete network,every node is linked to all other nodes with most of the links
PLoS ONE | www.plosone.org 1 March 2011 | Volume 6 | Issue 3 | e17445
representing very weak correlations. Therefore, the completegraph contains a large amount of non-significant information thatcould mask the essential motifs. The objective of the MSTalgorithm is to select the subset of more informative links(regarding the hierarchical structure of the system) and reducethe complete all-to-all network (that contains N(N-1) links) to arepresentative sub-graph (that contains only N-1 links). Hence,generating the maximum information immune networks (orimmune trees) by the MST, makes it possible to investigate theessential organization motifs, such as the network topologicalorganization.We assessed and compared the topological organization of the
IgG and IgM immune trees of the mothers and newborns. Next,the networks of the two subject groups, mothers and newborns,were compared by employing the widely used divergence ratemeasure [10]. The analysis revealed high topological similaritybetween the newborns’ and mothers’ IgG networks and significanttopological differences between the newborns’ and the mothers’IgM networks. These results indicate partial conservation of theIgG immune network topology at birth and adulthood, andsignificant reorganization of the IgM immune networks during theimmune system development. This observation is consistent withthe fact that most of the IgG antibodies in cord blood originatefrom the mother, as they are actively transported across theplacenta to the developing fetus [11]. In contrast, the IgMantibodies do not cross the placenta, so IgM autoantibodies incord blood are necessarily produced by the developing fetusduring pregnancy before birth [4,12].Much effort has been devoted to assessing the importance of
nodes in complex biological networks such as gene transcrip-tional regulatory networks, protein interaction networks andneural networks. The commonly used measures of nodeimportance include node degree, node centrality, betweenness,and node vulnerability score [13]. Here, we ranked the antigenimportance in the complete correlation networks using the eigen-value centrality measure [6,14]. This measure assigns a highscore to the nodes that are strongly linked (have highcorrelations) with high-score nodes. The node centrality retainsinformation that could be lost by the construction of the MSTreduced graph. So, we developed a hybrid presentation in whichthe node centrality information is superimposed on the evaluatedMST. This is simply done by coloring each node according to itseigen-value centrality score. The results presented here indicatethat, indeed, the hybrid analysis revealed additional featuresbeyond those that could be obtained by each analysis (MST andnode centrality) alone.
Methods
Serum samplesBlood samples were obtained by random availability from 10
healthy women at the onset of term labor and from 10 serumsamples of the cord blood of their newborns, in the course ofnormal procedures. All samples were collected with informedconsent and approval by the Institutional Review Board (HelsinkiCommittee) of the Tel-Aviv Sourasky Medical Center. Thenewborns were healthy at the term of pregnancy (weeks 38–42)and normal in development and weight for gestational age. Theblood samples were allowed to clot at room temperature. Aftercentrifugation, sera were collected and stored at 220uC [4,12].
Antigens305 antigens were spotted on each microarray, as described
previously [4,12]. For the most part, we used the same antigens as
in the previous studies of natural autoimmune repertoires [4,12];these included proteins, synthetic peptides from the sequences ofkey proteins, nucleotides, phospholipids, and other self and non-self molecules. See Supporting Information S1 for the full list.
Antigen microarrayAntigen microarrays were prepared and studied as described
previously [1,2,3].
Data preprocessing and background filteringAntigen reactivity was defined by the mean intensity of the 4
replicates binding to that antigen on the microarray; however,antigen intensities with mean value lower than 1000 in removedfrom the datasets leaving us with 290 antigens. Each chip was thennormalized by its mean reactivity divided by the standarddeviation. This was done in order to account for differences intotal protein concentrations that affect the background intensitylevel [4,12].
The correlation matrices and their collectivenormalizationFollowing Madi et al. [4], we started by calculating the antigen
correlation matrices from the antibody reactivity data obtainedusing the antigen microarray technology. The correlationsbetween the antigen reactivity profiles (the reactivities of theantigen in all subjects), were calculated by Pearson’s formula [15]:
C(i,j)~S Xi(n){mi! " Xj(n){mj
! "Tn
sisj: !1"
Where Xi n! " and Xj n! " are the reactivity of antigens i and j ofsubject n and si and sj are the STD of the reactivity profiles ofantigens i and j. Note that the antigen-antigen correlations (or forsimplicity the antigen correlations) for all pairs of antigen define asymmetric correlation matrix whose (i,j) element is the correlationbetween antigens i and j.Similar to neural and gene networks, the immune system can
exhibit activated and inhibited reactivity responses; both positiveand negative antigen correlations contain important information.To ease the calculations while retaining the information aboutnegative correlations, we start by transforming the Pearsoncorrelation values C(i,j) from the originally computed range of(21,+1) to the range of (0,1). We saved the original values of thecorrelations in the range (21,+1) and used these values in thevisualization of the edges in immune networks as is described ingreater detail below.Following Baruchi et al. [16], we normalized the correlation
matrices using the following meta-correlations procedure: themeta-correlation MC(i,j) - the Pearson correlation betweenrows i and j of the correlation matrix after reordering. In thereordering process, the elements C(i,i) and C(j,j) are removedfrom the calculation. The correlation vector for i is {C(i,j),C(i,1), C(i,2),. . .}, and for j it is {C(j,i), C(j,1), C(j,2),. . .}.In other words, the meta-correlation is a measure of thesimilarity between the correlations of antigen i with all otherantigens and the correlations of antigen j with all otherantigens. To ease the following calculations the meta-correlationmatrix MC was transformed to the range of (0,1). The meta-correlations were then used to generate the normalizedcorrelations Aff (i,j) between antigens i and j, given by[4,17,18],
The Immune Networks at Birth and Adulthood
PLoS ONE | www.plosone.org 2 March 2011 | Volume 6 | Issue 3 | e17445

Aff (i,j)~#############################C(i,j):MC(i,j)
p: !2"
The collective normalization further signifies features and canreveal collective motifs related to functional connectivity in thenetwork [4,17]. Additional comparison to the informationembedded in the normalized correlation matrices using calculationof eigen-value entropies [19] can be found in SupportingInformation S2. To retrieve the significant negative correlations,we transformed the normalized correlation to the range of (21,1)and took the absolute values of the results usingAffabsolute(i,j)~ Aff (i,j):2{1k k. This process amplifies groupswithin the data set as is illustrated in Figure 1.
Network representation of the correlationIn the current work we represented the correlation matrices by
employing network theory approaches [5,6,7,8]. In these immunenetwork representations, each node corresponds to a specificantigen of the 290 antigens on the chip and the edges represent theantigen-antigen correlations (or normalized correlations) for acertain group of subjects (mothers or newborns).
The weighted adjacency matrixIn network theory, an adjacency matrix commonly describes the
network topology by containing the information of whether a link
between two nodes exists or not. In the case of activity networks(e.g. correlations between stocks in financial networks [5] orsynchronization between neuron activity patterns [14]), a weightedadjacency matrix, in which the "distances" between the nodesrepresent the activity similarity, is constructed. Here we used theultrametric distance, suggested by Mantegna et al. [5], bytransforming the normalized correlation between two nodes,Affabsolute(i,j), into a distance by
D(i,j)~########################################2: 1{Affabsolute(i,j)# $
p: !3"
Defined this way, the distance###2
p§Dij§0 satisfies the metric
requirements: 1.) Dij =0 if and only if i= j, 2.) Dij =Dji, 3.)Dij§DikzDkj , and also the requirements for ultrametricity [5].In correlation based networks, such as the one described here, a
weight, which is monotonically related to the correlationcoefficient of each pair of elements, can be associated with eachlink. Therefore one can directly associate a weighted completegraph with the correlation matrix among N elements of interest.
The reduced adjacency matrix and eigen-value centralityAnother approach to extract relevant information is by
reduction of the weighted adjacency matrix into a reduced binarymatrix, the elements of which are assigned values A(i,j)~1, if the
Figure 1. The process of transforming antigen-reactivity correlations into correlation-based distance: (A) correlation matrix; (B)normalized correlation matrix; (C) absolute value of the normalized correlation matrix after transformation to the range of (21,1);and (D) distance matrix. The matrices presented here are for the mothers’ IgM dataset. We note that for visualization proposes, the originalcorrelation matrix (A) was reordered using the dendrogram algorithm, while all other matrices were reordered according to it.doi:10.1371/journal.pone.0017445.g001
The Immune Networks at Birth and Adulthood
PLoS ONE | www.plosone.org 3 March 2011 | Volume 6 | Issue 3 | e17445

nodes i and j have a distance shorter than a threshold level, andA(i,j)~0. In simple words, this adjacency matrix describes anetwork in which two nodes i and j are linked if they are stronglycorrelated - the correlation between them is above a thresholdlevel. Determining which threshold to use is not a simple task.Here we have chosen to use a measure of normalized STD of theprinciple eigenvector.We begin by choosing a correlation threshold, and use it to
create an adjacency matrix A as described above. We diagonalizethe adjacency matrix, and focus on the principle eigenvector (theeigenvector corresponding to the largest eigenvalue). Thecentrality of each variable is defined as the weight of each variablein the principle eigenvector. We then compute the STD of thecomponents for the principle eigenvector, and normalize it by thenumber of variables with a non-zero component. This allows us tosearch for a threshold that gives a compromise between highvalues of centrality and a small number of variables; in so doing,we can identify a significant sub-group of variables with the highestcentrality in the network.We then calculate the normalized STD of the eigenvalue
centrality for different thresholds, ranging from 0 to 0.95correlations. We test the normalized STD as a function of thecorrelation threshold for each of the datasets. The evaluationcontinues by investigating the second derivative of the resultingnormalized STD’s. This process revealed that the fluctuations inthe second derivative of the STD begin at thresholds above 0.79and more specifically above 0.82 for the maternal IgM, above 0.82for the cord IgM, above 0.79 for the maternal IgG and above 0.86for the cord IgG (see Supporting Information S3, Figures S1, S2for additional explanations).We used the information embedded in the reduced adjacency matrix
described above to sort the antigens according to their reactivitydominance by their eigenvalue centrality score in the fullcorrelation network. Mathematically, the eigenvector centralityliof node (i) is the largest eigen-value of the matrix equation
liXi~1
l
Xn
j~1
AijX
j, !4"
where Xi is the corresponding eigen-vector centrality of node i andA is the reduced adjacency matrix. According to the Perron–Frobenius theorem, li is positive [6].
Minimum Spanning TreeAs was mentioned, a complete graph (in which each node is
linked to all other nodes), contains too much irrelevantinformation (links that correspond to very weak correlations);hence, relevant information can be obscured [9]. The MinimumSpanning Tree (MST), is an algorithm designed to identify theinformative links and reduce the complete network that containsN(N{1) links to N{1 links.Here we applied the commonly used Kruskal algorithm [20,21]
to compute the MST, but other algorithms can also be used[22,23,24]. This algorithm looks for a subset of the branchesforming a tree that includes every node, where the total weight ofall the branches in the tree, namely the score that is derived fromthe correlation, is minimized (see Supporting Information S4,Figure S3 for additional information).
Network comparison based on divergence rateWe performed quantitative comparisons between the IgM and
the IgG immune trees (Minimal Spanning Tree or MSTs) of the
newborns and the mothers using the divergence rate measuredeveloped by Lee et al. [10].The divergence rate measure developed by Lee and Kim, 2006
[6] is based on the idea of quantification of the informationdifference between two process (variables) based on the notion ofconditional entropy. In information theory, the specific conditionalentropy h(X jY~y) is the entropy of a process (variable), underthe condition that another process Y is assigned the value y. TheConditional Entropy H(X jY ) is then the average of h(X jY~y)over all possible y that Y can take. It can be shown thatH(X jY )~H(X jY ){H(X ), where H(X jY ) is the combinedentropy of processes X and Y and H(X ) is the entropy of processX. The conditional entropy [6] has been used to define the metricdistance or information distance ID(X ,Y ) between two processesX and Y as ID(X ,Y ):H(X jY )zH(Y jX ).Motivated by this idea, Lee and Kim [6], define the notion of
the metric distance MD(GX ,GY ) between two graphs GXf g andGYf g to be:
MD(GX ,GY ):CDiv(GX jGY )zCDiv(GY jGX ): !5"
Where CDiv(GX jGY ) and CDiv(GY jGX ) can be viewed asconditional divergences and are calculated as follows: First wedefine DGX (i) to be the sum of the topological distances from anode i to all its neighborhoods nodes if gNN . Then we define theconditional distances CDiv(GX jGY )(i) to be the sum of thetopological distances in graph GYf g from node i to the group ofnodes if gNN defined in graph GXf g. Note that these nodes, whichare in the neighborhood of i in graph GXf g need not be in theneighborhood of i in the graph GYf g. We also note that DGY (i)and CDiv(GY jGX )(i) are defined in a similar way. With thesedefinition at hand, CDiv(GX jGY ) is defined to be:
CDiv(GX jGY )~1
N
XN
i~1
log10CDiv(GX jGY )(i)
DGX (i)
$$$$
$$$$: !6"
Note that in the informative sub-graphs studied here, eachdirected link from node i to node j corresponds to a topologicaldistance 1 from i to j and we take the neighborhoods nodes if gNN
to be the nodes that have a topological distance 1 with node i. Thetopological distance between two nodes that are not directlyconnected by an edge is the number of directed edges of theshortest path connecting the two nodes.
Results
We investigated the antigen correlation matrices of the IgG andIgM isotype antigen-reactivity data of 10 pairs of mothers andtheir newborns. We also studied the combined (or integrated) IgGand IgM correlation networks. The immune trees for the mothersand their newborns were calculated separately and compared.
Global view of the combined antigen-reactivity networksAntibodies of the IgM isotype are produced by B cells in the first
phase of an antibody immune response, and IgM antibodies havebeen proposed to regulate the development of IgG autoantibodies[25] and prevent autoimmune diseases [26]. To test whether theIgM network might influence the IgG network, we analyzed theintegrated correlation matrices of IgM and IgG datasets for themothers and cords (see Supporting Information S5, Figure S4 foradditional details).
The Immune Networks at Birth and Adulthood
PLoS ONE | www.plosone.org 4 March 2011 | Volume 6 | Issue 3 | e17445

Figure 2 shows the merged MST (immune trees) that correspondto the IgM-IgG integrated antibody correlation matrices. Inspectionof these immune trees reveals a higher integration between the IgGand IgM isotypes for the mothers (Figure 2A) compared to thenewborns (Figure 2B): for the mothers’ tree, the two isotypes appearon the same branches, but tend to be segregated into differentbranches in the newborns’ tree. To quantify these differencesbetween the newborn and the maternal merged MSTs, wemeasured the topological distances between the different nodes ineach of the trees, where the topological distance is measured interms of the number of edges (see Supporting Information S6 fordetailed statistics). The most significant result is that the averagedistance between IgG and IgM nodes in the newborns tree is 27.47with a STD of 1.9 compared to 21.38 with STD of 1.6 in thematernal tree. This result suggests that natural maturation of theimmune system from the newborn to young adulthoodmight lead tothe evolution of greater coordination between antibody reactivitiesof the IgG and IgM isotypes.
Immune tree architecture and node centralityFigure 3 shows the separated IgG and IgM MSTs for mothers
and newborns (Figure 3A and 3B, respectively). The node colors
indicated the eigen-value centrality, ranging from dark red forhigh centrality to dark blue for low centrality. In the constructionof the trees, we selected the first node in each MST to be that withthe highest centrality. Yet, we note that most of the nodes at thefirst levels of the trees (which are selected by the tree constructionalgorithm), also manifest a high centrality value. Negativecorrelations are indicated by red edges. It can be seen that thelinks within a single branch can turn from positive to negative, andvice versa. This finding indicates that both negative and positiverelations between antigen-reactivities participate in connectivitythroughout the MST network.Quantified comparison between the MSTs (immune trees)
revealed that the maternal (Figure 3C) and newborns (Figure 3D)IgG immune trees are very similar (with p-value = 0) followed bythe similarity between the different isotypes within the groups(Figure 3B,D and Figure 3A,C). A moderate level of similarity wasfound between the newborns’ IgG immune tree and the mothers’IgM immune tree and also between the newborns’ IgM immunetree and the mothers’ IgG immune tree. Significantly lowersimilarity was found between the IgM MSTs of the newborns andthe mothers (Figure 3A,B p-value = 0). The similarity between theIgG immune trees of the mothers and newborns is consistent withthe fact that IgG antibodies are actively transported from motherto her developing fetus [4,11]. However, the difference betweenthe IgM immune trees of the newborns and the mothers is a newobservation, and indicates reorganization of the IgM networktopology between birth and adulthood. We note that this result isconsistent with our previous findings regarding the formation ofantigen cliques in the maternal immune network [4].
Central nodesAnalyses of node centrality (see Supporting Information S7,
Figures S5, S6, S7, S8, S9 for details) revealed that about 10–15% ofthe nodes are highly ranked (or act as central nodes) - they manifestsignificantly higher centralities than those of the other nodes. Thesecentral nodes, or network hubs, are usually located at the first level ofbranches of the immune trees, as is seen in Figure 3.We found that the central nodes of the IgG networks are
prominently constituted by peptides of heat shock proteins (HSPs)(8 out of 10 for the mothers and 7 out of 10 for the cords) (seeTable 1). In contrast, most of the central antigens of the IgMnetworks are associated with tissue and immune-related antigens (9out of 10 for the mothers and 7 out of 10 for the cords) such as,cardiolipin, glucocerebroside and interleukin-4. It is conceivablethat the dominance of HSP molecules as IgG hubs might be due totheir over-representation on the antigen chip. However, the lack ofhighly ranked HSP molecules in the IgM network suggests that thedominance of these molecules in the IgG network is not an artifact.We also note that HSP60 appears to function as a biomarker ofinflammation and stress for the immune system [27,28], whichsuits the position of HSPs as hubs in the IgG networks.
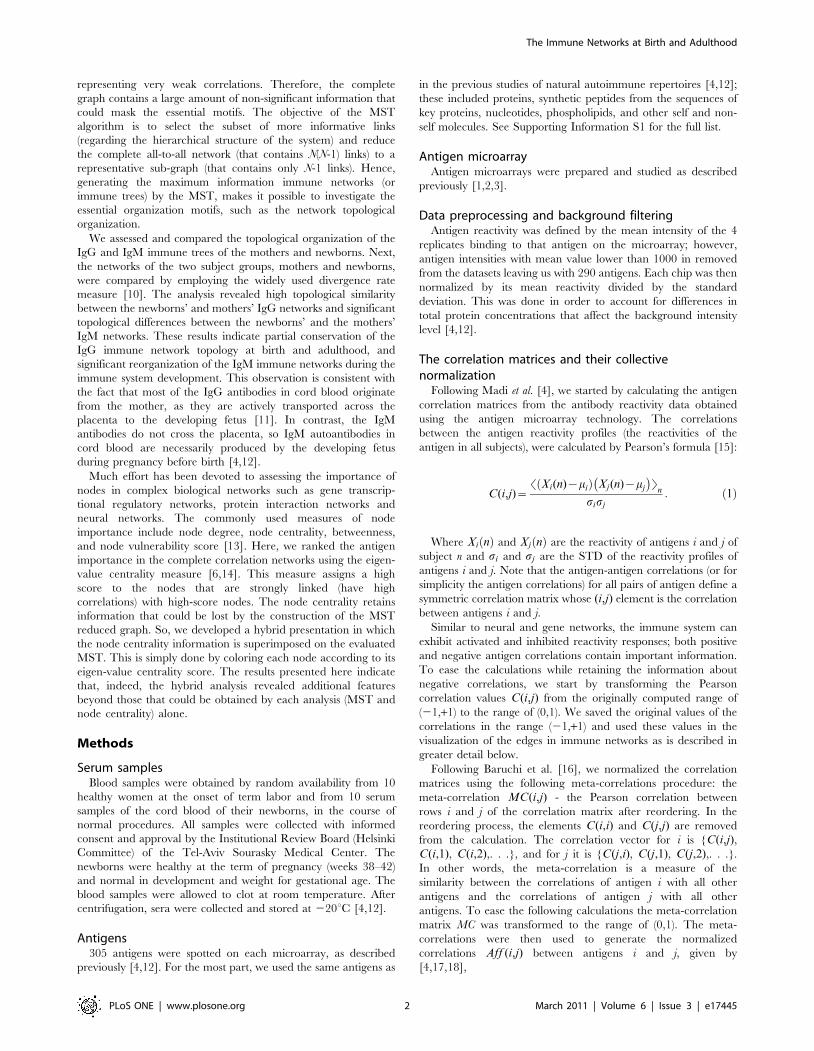
Centrality developmentTo decipher the development of node centrality between birth
and adulthood, we present in Figure 4 the newborns immune treesshown in Figures 3B and 3D, while coloring the nodes accordingto their centrality values as calculated for the maternal networks(Figures 3A and 3C). Doing so revealed that node centrality ispartially retained between birth and adulthood both for the IgMand the IgG isotypes. This is mostly reflected by central nodeslocated at early levels of the corresponding immune trees. Theresult for IgG is expected, since it is consistent with theconservation of the network organization (similar topology of thenewborns’ and mothers’ IgG immune trees). Regarding the IgM
Figure 2. The IgM-IgG merged Minimal Spanning Trees. (A) Themerged MST for the mothers. (B) The merged MST for the cords. Thegreen (ellipse) and purple (diamond) nodes represent the IgG and IgMisotypes respectively. Negative correlations between two nodes areindicated by red lines.doi:10.1371/journal.pone.0017445.g002
The Immune Networks at Birth and Adulthood
PLoS ONE | www.plosone.org 5 March 2011 | Volume 6 | Issue 3 | e17445

network (whose topology does change from birth to adulthood),the retained centrality suggest that there exist a core of central IgMreactivities shared by both newborns and mothers, despite thedifferences in the immune network overall architectures. Thesefindings suggest that during the development of the immune
system from birth to adulthood, some cliques of central antigensare conserved.As mentioned above, the IgG isotypes are transferred during
pregnancy from the mothers to the fetus. Hence, the findings ofdifferent IgG central nodes in the mothers and in the cords
Figure 3. Hierarchical organization of the separated immune trees for the IgM and IgG isotypes. (A) The MST for of the maternal IgM; (B)The MST of the cords’ IgM; (C) The MST of the maternal IgG; and (D) The MST of the cords’ IgG. The nodes’ colors indicate their centrality level fromdark red for high centrality to dark blue for low centrality. The first node in the trees is the one with the highest centrality. Negative correlationsbetween nodes are designated by red edges and constitute about 7–10% of the links.doi:10.1371/journal.pone.0017445.g003
Table 1. Antigen-reactivity hubs in IgM and IgG networks in maternal and newborns’ sera.
Maternal IgM Association Newborns’ IgM Association Maternal IgG Association Newborns’ IgG Association
GroEL-14 HSP Vasoactive intestinalPeptide 16
Hormone HSP70-37 HSP HSP60-35 HSP
IFN-gamma Immune Poly aspartyl Enzyme Poly aspartyl C peptide Tissue
Kinetensin Immune Phospho-ethanolamine
Enzyme GroEL-12 HSP GroEL-24 HSP
Endothelin 2 Tissue Matrixmetalloproteinasesprotein
Protease GroEL-29 HSP HSP70-31 HSP
C peptide Tissue C peptide Tissue HSP70-36 HSP somatostatin Hormone
Spectrin Tissue GroEL-33 HSP GroEL-4 HSP Complement C9 Immune
Vasoactive intestinalpeptide 16
Hormone Interleukin 4 Immune HSP60-28 HSP GroEL-31 HSP
Cardiolipin Tissue Glucocerebroside Tissue HSP60-34 HSP HSP60-23 HSP
Elastase Enzyme GroEL-10 HSP Kinetensin Immune GroEL-6 HSP
Alpha 2macroglubulin
Plasmaprotein
HSP60-21 HSP GroEL-6 HSP HSP70-39 HSP
doi:10.1371/journal.pone.0017445.t001
The Immune Networks at Birth and Adulthood
PLoS ONE | www.plosone.org 6 March 2011 | Volume 6 | Issue 3 | e17445
networks suggest that the IgG antibodies are transferred in aselective way. Such selective transfer can lead to the differencesbetween the mothers and newborns IgG immune networksdiscovered here.
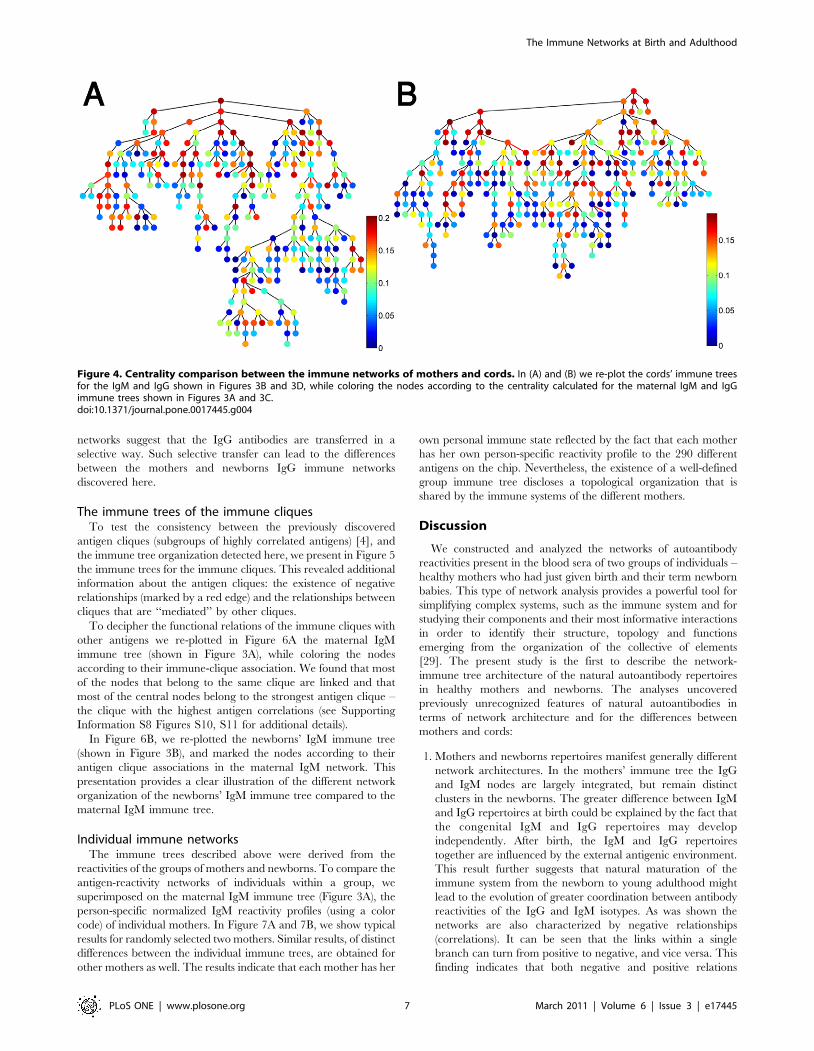
The immune trees of the immune cliquesTo test the consistency between the previously discovered
antigen cliques (subgroups of highly correlated antigens) [4], andthe immune tree organization detected here, we present in Figure 5the immune trees for the immune cliques. This revealed additionalinformation about the antigen cliques: the existence of negativerelationships (marked by a red edge) and the relationships betweencliques that are ‘‘mediated’’ by other cliques.To decipher the functional relations of the immune cliques with
other antigens we re-plotted in Figure 6A the maternal IgMimmune tree (shown in Figure 3A), while coloring the nodesaccording to their immune-clique association. We found that mostof the nodes that belong to the same clique are linked and thatmost of the central nodes belong to the strongest antigen clique –the clique with the highest antigen correlations (see SupportingInformation S8 Figures S10, S11 for additional details).In Figure 6B, we re-plotted the newborns’ IgM immune tree
(shown in Figure 3B), and marked the nodes according to theirantigen clique associations in the maternal IgM network. Thispresentation provides a clear illustration of the different networkorganization of the newborns’ IgM immune tree compared to thematernal IgM immune tree.
Individual immune networksThe immune trees described above were derived from the
reactivities of the groups of mothers and newborns. To compare theantigen-reactivity networks of individuals within a group, wesuperimposed on the maternal IgM immune tree (Figure 3A), theperson-specific normalized IgM reactivity profiles (using a colorcode) of individual mothers. In Figure 7A and 7B, we show typicalresults for randomly selected two mothers. Similar results, of distinctdifferences between the individual immune trees, are obtained forother mothers as well. The results indicate that each mother has her
own personal immune state reflected by the fact that each motherhas her own person-specific reactivity profile to the 290 differentantigens on the chip. Nevertheless, the existence of a well-definedgroup immune tree discloses a topological organization that isshared by the immune systems of the different mothers.
Discussion
We constructed and analyzed the networks of autoantibodyreactivities present in the blood sera of two groups of individuals –healthy mothers who had just given birth and their term newbornbabies. This type of network analysis provides a powerful tool forsimplifying complex systems, such as the immune system and forstudying their components and their most informative interactionsin order to identify their structure, topology and functionsemerging from the organization of the collective of elements[29]. The present study is the first to describe the network-immune tree architecture of the natural autoantibody repertoiresin healthy mothers and newborns. The analyses uncoveredpreviously unrecognized features of natural autoantibodies interms of network architecture and for the differences betweenmothers and cords:
1. Mothers and newborns repertoires manifest generally differentnetwork architectures. In the mothers’ immune tree the IgGand IgM nodes are largely integrated, but remain distinctclusters in the newborns. The greater difference between IgMand IgG repertoires at birth could be explained by the fact thatthe congenital IgM and IgG repertoires may developindependently. After birth, the IgM and IgG repertoirestogether are influenced by the external antigenic environment.This result further suggests that natural maturation of theimmune system from the newborn to young adulthood mightlead to the evolution of greater coordination between antibodyreactivities of the IgG and IgM isotypes. As was shown thenetworks are also characterized by negative relationships(correlations). It can be seen that the links within a singlebranch can turn from positive to negative, and vice versa. Thisfinding indicates that both negative and positive relations
Figure 4. Centrality comparison between the immune networks of mothers and cords. In (A) and (B) we re-plot the cords’ immune treesfor the IgM and IgG shown in Figures 3B and 3D, while coloring the nodes according to the centrality calculated for the maternal IgM and IgGimmune trees shown in Figures 3A and 3C.doi:10.1371/journal.pone.0017445.g004
The Immune Networks at Birth and Adulthood
PLoS ONE | www.plosone.org 7 March 2011 | Volume 6 | Issue 3 | e17445
between antigen reactivities participate in connectivitythroughout the immune tree network.
2. Comparison of network topology between birth and adulthoodreveals partial conservation of the IgG immune network topologybetween birth and adulthood and significant reorganization ofthe IgM immune networks. The similarity between the IgGimmune trees of the mothers and newborns is expected as isexplained above [4,11]. However, the difference between theIgM immune trees of the newborns and the mothers is new and
indicates reorganization of the IgM network topology betweenbirth and adulthood. This result is consistent and providesadditional support to our previous findings about the formationof antigen cliques in the maternal immune network [4].
3. The reactivities to central antigens in the mothers andnewborns show both similarities and differences in both IgGand IgM isotypes. For example, antibodies to cytokines arecentral in the IgM trees of both mothers and newborns, but thematernal cytokine hub is INF-gamma, and the newborns’
Figure 5. Immune trees of the immune cliques. The correlation matrices for the antigens that belong to the immune cliques identified in (Madi,et al., 2009), are shown in (A) for the maternal IgG isotypes and (B) for the maternal IgM isotypes. The corresponding immune trees for the maternalIgG cliques and the maternal IgM cliques are shown in (C) and (D), respectively. Note that the nodes colored green, purple and cyan in panel Ccorrespond to the top left, middle and lower right clusters in panel A. The nodes colored red, green, blue and yellow in panel D correspond to thefour clusters (from top left to bottom right) in panel B.doi:10.1371/journal.pone.0017445.g005
The Immune Networks at Birth and Adulthood
PLoS ONE | www.plosone.org 8 March 2011 | Volume 6 | Issue 3 | e17445

central cytokine is IL-4. Antibodies to heat shock proteins suchas HSP60 are hubs in both maternal and newborns’ IgM trees,but the HSP60 peptide epitopes differ in each tree (Table 1).Thus, the classes of antigens in central antibody reactivities canbe conserved in molecular class, although they show differencesin epitope selection. Moreover, in general we see that IgMreactivities to HSP molecules appear as the prominent centralantigens in both mothers and newborns. We note, that heatshock proteins were initially discovered as participants in thecellular response to stress. It is now clear, however, that self andmicrobial HSPs also play an important role in the control ofthe immune response [30,31]; in contrast, immune system
molecules and tissue molecules are the prominent centralantigens in the IgG immune trees of both mothers and cords.
4. Cliques of antigen reactivities, previously revealed by correla-tion analysis [4], are more tightly organized and integrated inthe maternal network trees than they are in the newborns’network trees. However, this analysis further reveals additionalinformation about the antigen cliques such as the existence ofnegative relationships and the relationships between cliquesthat are ‘‘mediated’’ by other cliques.
The results presented here illustrate the efficiency of the presentmethod in revealing new and possibly important motifs of the
Figure 6. The clique association of the nodes on the immune trees. (A) The clique locations for the maternal IgM tree. The cliques associationof the nodes is marked on the trees using different shapes and colors: clique 1 – red square, clique 2 – blue ellipse, clique 3 – dark green rectangleand clique 4 – yellow diamond. Note that although most of the cliques appear to be linked in the MST presentation, some were not linked, probablydue to the loss of information in the dimension reduction process. (B) The clique locations on the cords’ IgM tree. Panel B shows that maternal cliquemembers are scattered in the network according to the cord dataset.doi:10.1371/journal.pone.0017445.g006
Figure 7. Individual immune trees. Hierarchical graph representations of two individual mother immune networks superimposed on thematernal IgM group dataset, as was presented in Figure 4A. The nodes are colored according to normalized antigen reactivity levels for two selectedmothers, (A) and (B), from the most reactive node (light brown) to the least reactive nodes (dark brown). Note that the first nodes in each of the MSTshave high centrality value, as was shown previously in Figure 3.doi:10.1371/journal.pone.0017445.g007
The Immune Networks at Birth and Adulthood
PLoS ONE | www.plosone.org 9 March 2011 | Volume 6 | Issue 3 | e17445

immune system. For example the findings that show thepersistence of central antigens from birth (newborns) to adulthood(mothers) might account for the reports that IgM repertoires showlittle change from early age [32,33,34]. These other studies,however, were done using crude tissue blots of undefined self-molecules; the defined-antigen microarray technology used hereapparently made it possible for us to detect the changes in finespecificity of the autoimmune repertoire occurring subsequent tobirth.In general, the results presented here are consistent with the
concept of the Immunological Homunculus, the idea that healthyimmune repertoires contain certain T cells and B cells that havebeen positively selected to respond to key body molecules to form afunctional ‘‘internal image’’ of the body [27,28,35,36,37,38]. Theinternal image described here consists of natural autoantibodiesinteracting specifically with a small group of different extracellular,membrane, cytoplasmic, and nuclear self-antigens. The homun-culus theory is based on the regularity of immune self-recognitionconsistently observed in healthy individuals. In practice, auto-reactivity is not the aberration proposed by the Clonal-SelectionTheory (CST) of adaptive immunity, but is actually structuredwithin the functional architecture of the immune system. The hubsof self-reactivity we report here would seem to reflect the biases ofselected self-recognition within groups of human populations [39].Note that both the CST and the anti-idiotypic network paradigms[40,41] are based on individual differences between the immunerepertoires developed by individual subjects; the immunologicalhomunculus idea, in contrast, highlights the existence of antigenreactivities shared by individuals within a population. The relativeuniformity of IgM autoantibody repertoires in newborns as agroup [4,11] fits the homunculus idea; the demonstration ofnetwork MSTs with dominant hubs shown here provides anadditional way to view the homunculus.The analysis of immune system network architecture shown
here and elsewhere [42] serve as an introduction to basic questionsin systems immunology: What mechanisms connect nodes ofantigen-reactivity, including anti-idiotypic networks of autoanti-bodies [43,44]? What is the dynamic function of the relativelylarge number of central nodes that serve as hubs (,10–15%)? Andhow is the architecture of the immune network tree modified byvaccinations, infections, neoplasia, autoimmune diseases, andother conditions that perturb immune homeostasis? The antigenmicroarray provides a tool to help study these questions. We arepresently undertaking a longitudinal study of the evolution of theantibody repertoires of individual humans from birth with anarray of antigens, including those directed to self-constituents andto foreign molecules.
Supporting Information
Figure S1 Normalized eigenvalue centrality STD, asfunction of correlation threshold. Calculated for thematernal IgM (A), cords IgM (B), maternal IgG (C), and cordsIgG (D).(TIF)
Figure S2 Second derivative of the normalized eigen-value centrality STD, as function of correlation thresh-old. Calculated for the maternal IgM (A), cords IgM (B), maternalIgG (C), and cords IgG (D). In all four cases, there is a significantchange in normalized STD for thresholds larger than 0.79 andmore specifically 0.79 for the cords’ IgM, 0.85 for the cords’ IgG,0.89 for the maternal IgG and 0.85 for the maternal IgM.(TIF)
Figure S3 Illustration of the Kruskal algorithm.(TIF)
Figure S4 The integrated correlation matrices of theIgM and IgG datasets. Shown for (A) the mothers and (B) thecords. In each matrix, the IgM isotypes are in the top left frameand the IgG isotypes are in the bottom right frame. Both frames(isotypes) are ordered using a dendrogram algorithm demonstrat-ing the relationships between correlated groups of antibodies ofboth isotypes.(TIF)
Figure S5 Antigen centrality values in descending order.Calculated for the maternal IgM (A), cord IgM (B), maternal IgG(C), and cord IgG (D). Marked in red dots are the numbers ofantigens whose centrality values constitute 30 percent of the totalcentrality values in the network. Note that for clearer visualizationzero values were removed prior to plotting the data.(TIF)
Figure S6 Zipf plots of node centrality values. Presentedin descending order for the maternal IgM (A), cords’ IgM (B),maternal IgG (C), and cords’ IgG (D). Note that zero values wereremoved prior to plotting the data and the plots are presented inlog scale.(TIF)
Figure S7 Semi-log plots of node centrality values.Presented in descending order for the maternal IgM (A), cordsIgM (B), maternal IgG (C), and cords IgG (D). Note that zerovalues were removed prior to plotting the data and the plots arepresented in semi-log scale.(TIF)
Figure S8 Zipf plots of the descending sorted eigenval-ues of the correlation matrices (absolute values).Calculated for the maternal IgM (A), cords IgM (B), maternalIgG (C), and cords’ IgG (D). Note that the plots are presented inlog scale.(TIF)
Figure S9 Zipf plots of the descending sorted eigenval-ues of the correlation matrices (absolute values).Calculated for the maternal IgG and IgM (A), cords IgG andIgM (B). Note that the plots are presented in log scale.(TIF)
Figure S10 Robustness of the trees. We calculated thedistance from all nodes to all others and subtracted it from theoriginal calculated distance (before removal of the random nodes),this process was repeated 100 times and the results were plotted for(A) the maternal IgG and (B) maternal IgM.(TIF)
Figure S11 Maternal conservation of FIGs. For each ofthese randomly ‘‘trimmed’’ trees, we also calculated the averagedistance between all the nodes (members) within each FIG andsubtracted it from the original calculated distance (before removalof the random nodes). (A) maternal IgM and (b) maternal IgG.(TIF)
Supporting Information S1 Complete list of antigensspotted on the antigen chip.(PDF)
The Immune Networks at Birth and Adulthood
PLoS ONE | www.plosone.org 10 March 2011 | Volume 6 | Issue 3 | e17445

Supporting Information S2 The eigen-values’ entropy ofthe correlation matrices.(DOC)
Supporting Information S3 Calculation of the nodecentrality.(DOC)
Supporting Information S4 Construction of the immunetrees by the Kruskal algorithm.(DOC)
Supporting Information S5 The integrated correlationmatrices.(DOC)
Supporting Information S6 The topological statistics ofthe immune trees.(DOC)
Supporting Information S7 The central nodes – thenetwork hubs.(DOC)
Supporting Information S8 The immune tree robust-ness.(DOC)
Acknowledgments
We are thankful to Stefano Boccaletti for stimulating conversations aboutnetwork theory methods, to Vitor Pordeus for useful discussions about theimmune system and to Yael Jacob and Alexandra Sirota-Madi for theirhelp.
Author Contributions
Conceived and designed the experiments: YM FJQ IRC. Performed theexperiments: YM FJQ. Analyzed the data: AM DYK SBZ EBJ.Contributed reagents/materials/analysis tools: AM DYK SBZ EBJ. Wrotethe paper: AM DYK AIT IRC EBJ.
References
1. Quintana FJ, Cohen IR (2004) The natural autoantibody repertoire andautoimmune disease. Biomed Pharmacother 58: 276–281.
2. Quintana FJ, Hagedorn PH, Elizur G, Merbl Y, Domany E, et al. (2004)Functional immunomics: microarray analysis of IgG autoantibody repertoirespredicts the future response of mice to induced diabetes. Proc Natl Acad Sci U S A101(Suppl 2): 14615–14621.
3. Robinson WH (2006) Antigen arrays for antibody profiling. Curr Opin ChemBiol 10: 67–72.
4. Madi A, Hecht I, Bransburg-Zabary S, Merbl Y, Pick A, et al. (2009)Organization of the autoantibody repertoire in healthy newborns and adultsrevealed by system level informatics of antigen microarray data. Proc Natl AcadSci U S A 106: 14484–14489.
5. Mantegna RN, Stanley HE (2000) An Introduction to Econophysics:Correlations and Complexity in Finance. Cambridge UK: CambridgeUniversity Press.
6. Newman MEJ (2003) The structure and function of complex networks. SIAMRev 45: 167–256.
7. Reka A, Barabasi AL (2002) Statistical mechanics of complex networks. RevMod Phys 74: 47–97.
8. Graham RL, Hell P (1985) On the History of the Minimum Spanning TreeProblem. IEEE Ann Hist Comput 7: 43–57.
9. West DB (2001) An Introduction to Graph Theory. Englewood CliffsNJ:Prentice-Hall.
10. Lee U, Kim S (2006) Classification of epilepsy types through global networkanalysis of scalp electroencephalograms. Phys Rev E 73: 041920.
11. Hanson LA, Korotkova M, Lundin S, Haversen L, Silfverdal SA, et al. (2003)The transfer of immunity from mother to child. Ann N Y Acad Sci 987:199–206.
12. Merbl Y, Zucker-Toledano M, Quintana FJ, Cohen IR (2007) Newborn humansmanifest autoantibodies to defined self molecules detected by antigen microarrayinformatics. J Clin Invest 117: 712–718.
13. Qiang Q, Nagurney A (2008) A unified network performance measure withimportance identication and the ranking of network components. OptimizationLetters 2: 127–142.
14. Fuchs E, Ayali A, Ben-Jacob E, Boccaletti S (2009) The formation ofsynchronization cliques during the development of modular neural networks.Phys Biol 6: 36018.
15. Rodgers JL, Nicewander WA (1988) Thirteen Ways to Look at the CorrelationCoefficient. Am Stat 42: 59–66.
16. Baruchi I, Grossman D, Volman V, Shein M, Hunter J, et al. (2006) Functionalholography analysis: simplifying the complexity of dynamical networks. Chaos16: 015112.
17. Madi A, Friedman Y, Roth D, Regev T, Bransburg-Zabary S, et al. (2008)Genome holography: deciphering function-form motifs from gene expressiondata. PLoS One 3: e2708.
18. Shapira Y, Kenett DY, Ben-Jacob E (2009) The Index Cohesive Effect on StockMarket Correlations. Eur J Phys B.
19. Varshavsky R, Gottlieb A, Horn D, Linial M (2007) Unsupervised featureselection under perturbations: meeting the challenges of biological data.Bioinformatics 23: 3343–3349.
20. Kruskal JB (1956) On the Shortest Spanning Subtree of a Graph and theTraveling Salesman Problem. P Am Math Soc 7: 48–50.
21. Xu Y, Olman V, Xu D (2001) Minimum spanning trees for gene expression dataclustering. Genome Inform 12: 24–33.
22. Chazelle B (2000) A Minimum Spanning Tree Algorithm with Inverse-Ackermann Type Complexity. Journal of the ACM 47: 1028–1047.
23. Kleinberg J, Tardos E (2006) Algorithm Design. New York: Pearson Education.24. Prim R (1957) Shortest Connection Networks and Some Generalizations. Bell
Syst Tech J 36: 1389–1401.25. Boes M, Schmidt T, Linkemann K, Beaudette BC, Marshak-Rothstein A, et al.
(2000) Accelerated development of IgG autoantibodies and autoimmune diseasein the absence of secreted IgM. Proc Natl Acad Sci U S A 97: 1184–1189.
26. Cohen IR, Cooke A (1986) Natural autoantibodies might prevent autoimmunedisease. Immunol Today 7: 363–364.
27. Cohen IR (2007) Real and artificial immune systems: computing the state of thebody. Nat Rev Immunol 7: 569–574.
28. Cohen IR (2007) Biomarkers, self-antigens and the immunological homunculus.J Autoimmun 29: 246–249.
29. Tieri P, Grignolio A, Zaikin A, Mishto M, Remondini D, et al. Network,degeneracy and bow tie integrating paradigms and architectures to grasp thecomplexity of the immune system. Theor Biol Med Model 7: 32.
30. Prohaszka Z (2007) Chaperones as part of immune networks. Adv Exp Med Biol594: 159–166.
31. Quintana FJ, Cohen IR (2011) The HSP60 immune system network. TrendsImmunol.
32. Lacroix-Desmazes S, Mouthon L, Coutinho A, Kazatchkine MD (1995) Analysisof the natural human IgG antibody repertoire: life-long stability of reactivitiestowards self antigens contrasts with age-dependent diversification of reactivitiesagainst bacterial antigens. Eur J Immunol 25: 2598–2604.
33. Lacroix-Desmazes S, Mouthon L, Kaveri SV, Kazatchkine MD, Weksler ME(1999) Stability of natural self-reactive antibody repertoires during aging. J ClinImmunol 19: 26–34.
34. Mouthon L, Lacroix-Desmazes S, Nobrega A, Barreau C, Coutinho A, et al.(1996) The self-reactive antibody repertoire of normal human serum IgM isacquired in early childhood and remains conserved throughout life.Scand J Immunol 44: 243–251.
35. Cohen IR (2000) Tending Adam’s Garden: Evolving the Cognitive ImmuneSelf. London: Academic Press.
36. Cohen IR (2000) Discrimination and dialogue in the immune system. SeminImmunol 12: 215–219; discussion 257-344.
37. Poletaev A, Osipenko L (2003) General network of natural autoantibodies asimmunological homunculus (Immunculus). Autoimmun Rev 2: 264–271.
38. Poletaev AB (2002) The immunological homunculus (immunculus) in normalstate and pathology. Biochemistry (Mosc) 67: 600–608.
39. Cohen IR (1989) Natural autoantibodies might prevent autoimmune disease.Atlan H, ed. Berlin: Springer-Verlag. pp 6–12.
40. Jerne NK (1967) [Various basic problems of current immunology]. Landarzt 43:1526–1530.
41. Jerne NK (1974) Towards a network theory of the immune system. AnnImmunol (Paris) 125C: 373–389.
42. Frankenstein Z, Alon U, Cohen IR (2006) The immune-body cytokine networkdefines a social architecture of cell interactions. Biol Direct 1: 32.
43. Behn U (2007) Idiotypic networks: toward a renaissance? Immunol Rev 216:142–152.
44. Tzioufas AG, Routsias JG (2010) Idiotype, anti-idiotype network of autoanti-bodies: pathogenetic considerations and clinical application. Autoimmun Rev 9:631–633.
The Immune Networks at Birth and Adulthood
PLoS ONE | www.plosone.org 11 March 2011 | Volume 6 | Issue 3 | e17445