neural coding of the temporal envelope of speech: relation to modulation...
TRANSCRIPT

Neural coding of the temporal envelope of speech: Relation to modulation transfer functions B. Delgutte, B.M. Hammond, and P.A. Cariani Eaton-Peabody Laboratory, Massachusetts Eye and Ear Infirmary, Boston, MA 1. Introduction
Continuous speech shows pronounced low-frequency modulations in its tempo-ral envelope. Modulation frequencies near the average syllabic rate of 3-4 Hz are the most prominent. Degradations in these low-frequency modulations reduce speech intelligibility (Drullman et al., 1994; Drullman et al., 1994; Houtgast and Steeneken, 1973), while speech processed to have minimal spectral information is intelligible providing that low-frequency modulations are preserved (Shannon et al., 1995). Thus, low-frequency modulations are both necessary and almost sufficient for accu-rate speech reception.
The ability of auditory neurons to encode amplitude modulation has been char-acterized using modulation transfer functions (MTFs) (reviews by Eggermont, 1993; Langner, 1992). The MTF expresses, as a function of frequency, the complex ratio (magnitude and phase) of the modulation in the neural response to the modulation in the acoustic stimulus. Previous neurophysiological studies have rarely focused on low modulation frequencies most important for speech reception, and have not explic-itly related the MTFs of auditory neurons to their response to speech. In the present study, we measured both MTFs and responses to a speech utterance for single units in the auditory nerve (AN), cochlear nucleus (CN), and inferior colliculus (IC) of anesthetized cats. We also developed a functional model for predicting the neural re-sponse to speech based in part on the MTF.
2. Method
Electrophysiological recordings. Techniques used in our laboratory for sin-gle-unit recordings in dial-anesthetized cats have been described elsewhere (Cariani and Delgutte, 1996). Glass micropipettes were used to record from AN fibers, while parilene-insulated tungsten microelectrodes were used for single-unit recordings from the CN and IC. Acoustic stimuli were delivered through calibrated closed acoustic assemblies. For IC recordings, stimuli were usually presented binaurally (diotically), although monaural presentation to the most effective ear was occasionally used if this produced an appreciably stronger response.
Stimuli. Two types of stimuli were used: modulated broadband noise for MTF measurements, and a speech utterance. The utterance was the IEEE sentence “Wood

is best for making toys and blocks” pronounced by a male speaker. The waveform and spectrogram of this utterance are shown in the bottom right of Fig. 4.
The noise had the same long-term average spectrum as speech, and its intensity (not amplitude) was 100% sinusoidally modulated. For the data presented here, the sound pressure level of both the speech and the modulated noise was always 60 dB.
2.1 Measurement of Neural Modulation Transfer Functions (MTFs)
The method for meas-uring neural MTFs is illus-trated in Fig. 1 for an AN fiber. The same method was used for CN and IC neurons. Noise modulated at fre-quency (256 Hz in this case) was presented (Fig. 1A), and a period histogram constructed from the single-unit response (Fig. 1B). The complex modulation
index at is a vector whose magnitude is twice the synchronization index, and whose angle is the mean phase (e.g. Rees and Møller, 1983). The MTF at is the ratio of the complex modulation index in the neural response to the modulation index in the stimulus intensity (which is always 1). This complex ratio has both a magni-tude and a phase (arrows in Fig. 1C and 1D).
f m
f mf m
IDFT
0 50 100 150 200 250
0 50 100 150 200 250
1000
800
600
400
200
0
1000
800
600
400
200
0
Time (ms)
Mag
nitu
deD
isch
arge
Rat
e (s
p/se
c)
Peristimulus Time (ms)
MTF Step ResponseE.
Noise Burst ResponseF.
0 0.5 1 1.5 2Periods
Neural ResponseB.
0 0.5 1 1.5 2Periods
Inte
nsity
AM NoiseA.
Modulation Frequency (Hz)
Mod
ulat
ion
Gai
n (d
B)
Pha
se (c
ycle
s)
Modulation Frequency (Hz)
0
-10
-20
-30
1
0
-1
-2
-3
-4
1 10 100 1000
0 200 400 600 800 1000
MTF Magnitude & PhaseC.
Dis
char
ge R
ate
D.
fm = 256 Hz
fm = 256 Hz
Fig. 1. Method for measuring modulation transfer functions of auditory neurons.
This procedure was repeated for varying from 1 Hz to 512-1024 Hz in ei-ther octave or half-octave steps to obtain a complete neural MTF (circles in Fig. 1C and 1D). A Butterworth filter was least-squares fitted to the MTF magnitude (solid line in Fig. 1C), and a straight line (representing both a phase shift and a delay) fitted to the phase (solid line in Fig. 1D). Together, the 5 parameters of the Butterworth fil-ter fit to the magnitude and the 2-parameter, straight-line fit to the phase specify a Model MTF. The model MTF was inverse Fourier transformed and temporally inte-grated to obtain the MTF Step Response (Fig. 1E). This represents the model neural response to an abrupt increase in intensity. In the case of this AN fiber, the MTF step response resembles the envelope of the neural response to a broadband noise burst (Fig. 1F).
f m
3. Results
3.1 Comparison of neural MTFs in the AN, CN and IC
Fig. 2 shows the MTF magnitude, phase, and step response for two IC units with similar characteristic frequencies (CFs) recorded in the same electrode penetra-tion. Both units have similar, bandpass MTF magnitudes, but their step responses are clearly different. The left unit has a monophasic MTF step response, rapidly rising to a maximum, then decaying to a positive value after 300 msec (a typical syllable dura-tion). In contrast, the biphasic step response of the unit on the right decays to a nega-tive value.

Res
pons
e A
mpl
itude
Pha
se (
cycl
es) 0
-2
-4
-6
-8
MTF Magnitude
MTF Phase
Modulation Frequency (Hz)0 500 1000
0
-10
-20
-30
10
1 10 100 1000
Time (msec)0 100 200 300
0
0.4
0.8
1.2
1.6
MTF Step ResponseBiphasic
Gai
n (d
B)
MTF Step Response
Time (msec)0 100 200 300
1.5
1.0
0.5
0
PhasicRatio
=P
R
MTF Magnitude
MTF Phase
Modulation Frequency (Hz)0 1000500
10
0
-10
-20
-301 10 100 1000
0
-2
-4
-6
-8
PR
MonophasicG
ain
(dB
)P
hase
(cy
cles
)
Res
pons
e A
mpl
itude
PhasicRatio
=P
R
PR
Fig. 2. MTF magnitudes, phases and step responses of two IC neurons. Left: Unit BD181-9, CF = 430 Hz. Right: Unit BD 181-7, CF= 550 Hz, IPD sensitive.
The MTF step response represents the neural response to an abrupt increase in intensity, as occurs at the onset of a tone burst or noise burst. Because it depends on both the magnitude and the phase of the MTF, it provides a more complete characteri-zation of the neural sensitivity to modulation than does the magnitude alone. Because the two units in Fig. 2 have similar MTF magnitudes, the differences in step responses must reflect differences in phase. Indeed, the limit of the phase when ap-proaches 0 Hz is 0.24π for the monophasic unit, and 0.44π for the biphasic unit (these differences are hard to see in Fig. 2). In general, we found a strong correlation be-tween the MTF phase at DC and the shape of the MTF step response, with phase shifts greater than π/3 typically giving biphasic step responses.
f m
The phasic ratio (Fig. 2) is a simple measure that characterizes the shape of the MTF step response. It is smaller than 1 for monophasic responses, and greater than 1 for biphasic responses. Phasic ratios of AN and CN neurons ranged from 0.4 to 1.3, while ratios of IC neurons could exceed 2. Thus, while both monophasic and biphasic MTF step responses were found in the AN and CN as well as the IC, there was both a greater proportion of biphasic units and more strongly biphasic responses in the IC than at the other two sites.
In order to obtain a representative MTF for each of the three recording sites, model MTFs were synthesized from the me-dian values of the 7 MTF parameters at each site. The resulting median MTFs are shown in Fig. 3. For all three sites, median MTF magnitudes are bandpass, with broad tuning on the low-frequency side. Upper
cutoff frequencies are markedly lower for the IC than for the AN and CN. The modu-lation gain in the passband is higher for the IC than for the CN, and higher for the CN than for the AN. These findings are consistent with previous studies of MTF magni-
Auditory Nerve
Cochlear Nucleus
Inferior Colliculus
0
0.5
1
1.5
2MTF Step Response
Res
pons
e A
mpl
itude
0 50 100 150 200 250 300
Time (msec)1 10 100 1000
-30
-20
-10
0
10
Mod
ulat
ion
Gai
n (d
B)
Modulation Frequency (Hz)
MTF Magnitude
Fig. 3. Median MTF magnitudes and step responses for AN, CN, and IC neurons.

tude characteristics (AN: Joris and Yin, 1992; Hammond et al., 1996; CN: Frisina et al., 1990; IC: Langner and Schreiner, 1988; Rees and Møller, 1983).
The MTF step responses reveal additional differences that are not apparent in the magnitudes. The peak latency increases from the AN to the CN and then to the IC, consistent with neural conduction delays. In addition, the median step response for the IC is biphasic, while it is monophasic for the AN and CN. Thus, both the dis-tribution of phasic ratios and the median MTFs indicate that responses to modulations are more phasic in the IC than in the AN or CN.
3.2 Neural responses to the speech utterance
Figure 4 shows neural re-sponses to the speech utterance for populations of neurons from the AN, CN and IC. Neural re-sponses are displayed as neuro-grams, where each trace repre-sents the average response of all units whose CF spans a ½-octave band of frequencies. The AN response clearly shows ef-fects of neural adaptation in that there is a rapid rise in discharge rate followed by a more gradual decay whenever the stimulus shows a rapid increase in inten-sity near the CF of the neuron (Delgutte, 1997). On these slow time scales, the response of the CN is broadly similar to that of the AN. However, our sample of CN cells contained few onset responders, and consisted almost entirely of primary-like, chopper and pauser neurons, so that this result may be somewhat sample-dependent.
The response of the IC population is clearly distinct from those of the other two sites in that it is primarily restricted to brief burst of activity occurring
at the onsets of syllables and bursts of stop consonants. Thus, the IC response to speech is more phasic than that of the AN or CN. This finding is qualitatively con-sistent with the greater proportion of biphasic MTF step responses found in the IC as opposed to the AN and CN. This observation raises the possibility that differences in responses to speech between the three sites might be entirely accounted for by differ-ences in MTFs. This hypothesis was tested using a functional model of auditory neu-rons incorporating the MTF.
2000 3000 0 1000 2000 3000200
283
400
566
800
1131
1600
2263
3200
4525
6400
B. Cochlear Nucleus
2000 3000
Fre
quen
cy (
kHz)
Wood is best for making toys and blocks
0 1000 2000 30000
1
2
3
4
5
0 1000 2000 3000−1
0
1
Time (msec) Fig. 4. Neural response to the speech utterance “Wood is best for making toys and blocks” for populations of neurons in the AN, CN, and IC. Neural responses (A-C) are shown as “neurograms”, where each trace represents the average PST histogram for all neurons whose CF was contained in one of 11 ½-octave bands. The center frequency of each band is shown at the left. The bottom right panels show the waveform and broadband spectrogram of the utterance.
0 1000200
283
400
566
800
1131
1600
2263
3200
4525
6400
Time (msec)
Cha
ract
eris
tic F
requ
ency
(H
z)
C. Inferior Colliculus
0 1000200
283
400
566
800
1131
1600
2263
3200
4525
6400
Cha
ract
eris
tic F
requ
ency
(H
z)
A. Auditory Nerve
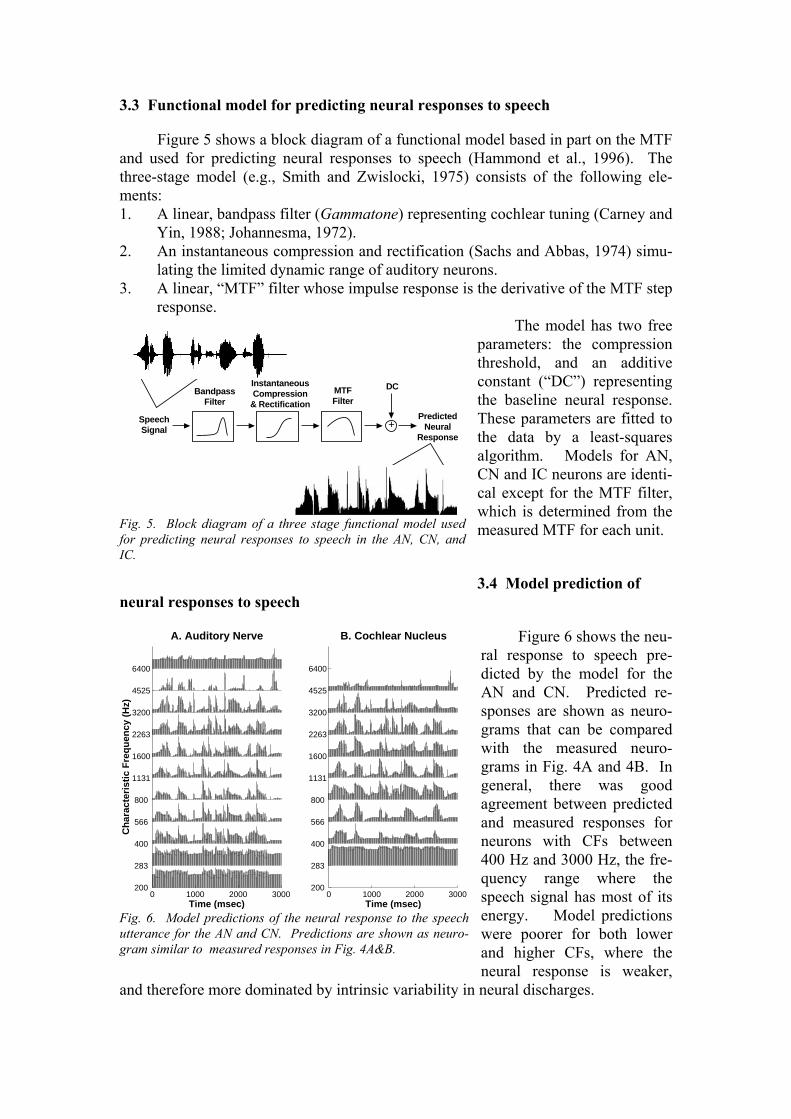
3.3 Functional model for predicting neural responses to speech
Figure 5 shows a block diagram of a functional model based in part on the MTF and used for predicting neural responses to speech (Hammond et al., 1996). The three-stage model (e.g., Smith and Zwislocki, 1975) consists of the following ele-ments: 1. A linear, bandpass filter (Gammatone) representing cochlear tuning (Carney and
Yin, 1988; Johannesma, 1972). 2. An instantaneous compression and rectification (Sachs and Abbas, 1974) simu-
lating the limited dynamic range of auditory neurons. 3. A linear, “MTF” filter whose impulse response is the derivative of the MTF step
response. The model has two free
parameters: the compression threshold, and an additive constant (“DC”) representing the baseline neural response. These parameters are fitted to the data by a least-squares algorithm. Models for AN, CN and IC neurons are identi-cal except for the MTF filter, which is determined from the measured MTF for each unit.
PredictedNeural
Response
InstantaneousCompression
& RectificationBandpass
FilterMTFFilter
+
DC
SpeechSignal
Fig. 5. Block diagram of a three stage functional model used for predicting neural responses to speech in the AN, CN, and IC.
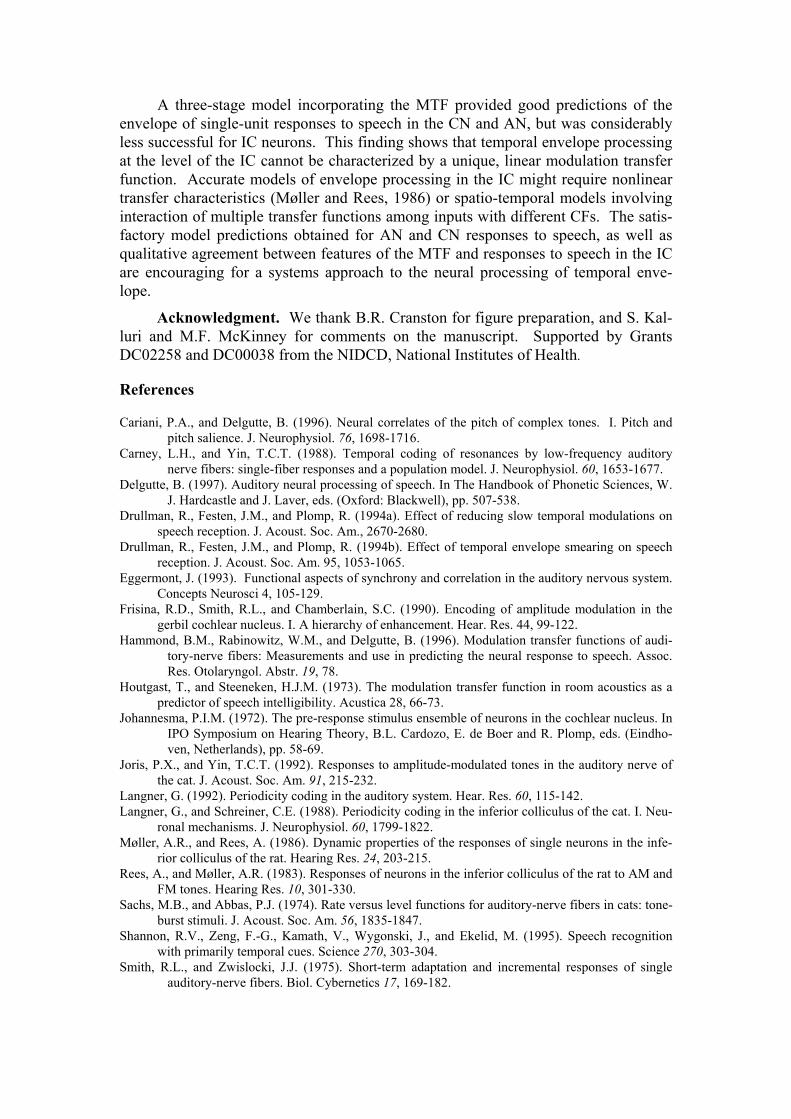
3.4 Model prediction of neural responses to speech
Figure 6 shows the neu-ral response to speech pre-dicted by the model for the AN and CN. Predicted re-sponses are shown as neuro-grams that can be compared with the measured neuro-grams in Fig. 4A and 4B. In general, there was good agreement between predicted and measured responses for neurons with CFs between 400 Hz and 3000 Hz, the fre-quency range where the speech signal has most of its energy. Model predictions were poorer for both lower and higher CFs, where the neural response is weaker,
and therefore more dominated by intrinsic variability in neural discharges.
0 1000 2000 3000200
283
400
566
800
1131
1600
2263
3200
4525
6400
Time (msec)
Cha
ract
eris
tic F
requ
ency
(H
z)
A. Auditory Nerve
0 1000 2000 3000200
283
400
566
800
1131
1600
2263
3200
4525
6400
Time (msec)
B. Cochlear Nucleus
Fig. 6. Model predictions of the neural response to the speech utterance for the AN and CN. Predictions are shown as neuro-gram similar to measured responses in Fig. 4A&B.

Model predictions were consid-erably less satisfactory for IC neurons than for the AN and CN. Results are shown for a representative IC unit in Fig. 7. The unit had a biphasic MTF step response, and its measured re-sponse to speech was almost entirely limited to brief bursts of discharges. While the model did a fair job of pre-dicting the times of onset of neural ac-tivity, predicted bursts of activity lasted considerably longer than actual responses. Overall, predicted neural responses tended to be less phasic than actual responses of IC neurons, even for units with biphasic MTF step re-sponses such as that of Fig. 7.
4. Summary and conclusions
Not only the magnitude, but also the phase of the modulation transfer function, as reflected in the step re-
sponse, is an important determinant of neural responses to modulated stimuli. Neu-rons can have similar magnitude characteristics, but very different step responses (Fig. 2). These differences in step responses are related to small, but systematic phase shifts at very low modulation frequencies. Models that fail to take into account these phase shifts (or, equivalently, the shape of the MTF step response) can only give an incomplete picture of the neural coding of temporal envelopes.
1 10 100 1000−30
−20
−10
0
10
Modulation Frequency (Hz)
Gai
n (d
B)
MTF Magnitude
BD177−43
0 100 200 300−0.5
0
0.5
1
1.5
Time (msec)
MTF Step Response
0 500 1000 1500 2000 2500 30000
200
400
600
800Measured Response to Speech
IC Cell, CF=1200 Hz, 60 dB SPL
0 500 1000 1500 2000 2500 30000
50
100
150
Peri−Stimulus Time (msec)
Predicted Response to Speech, Correlation = 0.32
Dis
char
ge R
ate
(spi
kes/
sec)
Fig. 7. Neural MTF and predicted and measured responses to speech for a single unit in the IC.
Modulation transfer functions of AN, CN and IC neurons have certain proper-ties in common. Although their magnitude characteristics are bandpass, their tuning is very shallow on the low-frequency side, so that discharge patterns of neurons at all three sites convey the low-frequency (< 20 Hz) modulations most important for speech and music. Neurons in the AN, CN, and IC can have either monophasic or biphasic MTF step responses. Monophasic step responses in the AN are likely to re-flect short-term adaptation (Hammond et al., 1996; Smith and Zwislocki, 1975). A possible mechanism underlying biphasic step responses would be a long-lasting inhi-bition following a brief excitatory phase. However, the finding of biphasic step re-sponses in the AN, which receives no inhibitory inputs, suggests that inhibition is not always involved. In general, the MTF step response characterizes the processing of temporal envelope for the entire system from the cochlea to the recording site, so that there is no reason to expect a one-to-one correspondence between features of the step response and any particular neural mechanism such as inhibition.
A major transformation in sensitivity to modulation occurs between the CN and the IC. MTFs of most IC neurons have more phasic step responses and lower high-frequency cutoffs than those of CN and AN neurons. A lower high-frequency cutoff means that the most important, low-frequency modulations are enhanced in the IC relative to higher-frequency modulations. These transformations are reflected in neu-ral responses to speech, which are more phasic in the IC than at the other two sites.
A three-stage model incorporating the MTF provided good predictions of the envelope of single-unit responses to speech in the CN and AN, but was considerably less successful for IC neurons. This finding shows that temporal envelope processing at the level of the IC cannot be characterized by a unique, linear modulation transfer function. Accurate models of envelope processing in the IC might require nonlinear transfer characteristics (Møller and Rees, 1986) or spatio-temporal models involving interaction of multiple transfer functions among inputs with different CFs. The satis-factory model predictions obtained for AN and CN responses to speech, as well as qualitative agreement between features of the MTF and responses to speech in the IC are encouraging for a systems approach to the neural processing of temporal enve-lope.
Acknowledgment. We thank B.R. Cranston for figure preparation, and S. Kal-luri and M.F. McKinney for comments on the manuscript. Supported by Grants DC02258 and DC00038 from the NIDCD, National Institutes of Health.
References
Cariani, P.A., and Delgutte, B. (1996). Neural correlates of the pitch of complex tones. I. Pitch and pitch salience. J. Neurophysiol. 76, 1698-1716.
Carney, L.H., and Yin, T.C.T. (1988). Temporal coding of resonances by low-frequency auditory nerve fibers: single-fiber responses and a population model. J. Neurophysiol. 60, 1653-1677.
Delgutte, B. (1997). Auditory neural processing of speech. In The Handbook of Phonetic Sciences, W. J. Hardcastle and J. Laver, eds. (Oxford: Blackwell), pp. 507-538.
Drullman, R., Festen, J.M., and Plomp, R. (1994a). Effect of reducing slow temporal modulations on speech reception. J. Acoust. Soc. Am., 2670-2680.
Drullman, R., Festen, J.M., and Plomp, R. (1994b). Effect of temporal envelope smearing on speech reception. J. Acoust. Soc. Am. 95, 1053-1065.
Eggermont, J. (1993). Functional aspects of synchrony and correlation in the auditory nervous system. Concepts Neurosci 4, 105-129.
Frisina, R.D., Smith, R.L., and Chamberlain, S.C. (1990). Encoding of amplitude modulation in the gerbil cochlear nucleus. I. A hierarchy of enhancement. Hear. Res. 44, 99-122.
Hammond, B.M., Rabinowitz, W.M., and Delgutte, B. (1996). Modulation transfer functions of audi-tory-nerve fibers: Measurements and use in predicting the neural response to speech. Assoc. Res. Otolaryngol. Abstr. 19, 78.
Houtgast, T., and Steeneken, H.J.M. (1973). The modulation transfer function in room acoustics as a predictor of speech intelligibility. Acustica 28, 66-73.
Johannesma, P.I.M. (1972). The pre-response stimulus ensemble of neurons in the cochlear nucleus. In IPO Symposium on Hearing Theory, B.L. Cardozo, E. de Boer and R. Plomp, eds. (Eindho-ven, Netherlands), pp. 58-69.
Joris, P.X., and Yin, T.C.T. (1992). Responses to amplitude-modulated tones in the auditory nerve of the cat. J. Acoust. Soc. Am. 91, 215-232.
Langner, G. (1992). Periodicity coding in the auditory system. Hear. Res. 60, 115-142. Langner, G., and Schreiner, C.E. (1988). Periodicity coding in the inferior colliculus of the cat. I. Neu-
ronal mechanisms. J. Neurophysiol. 60, 1799-1822. Møller, A.R., and Rees, A. (1986). Dynamic properties of the responses of single neurons in the infe-
rior colliculus of the rat. Hearing Res. 24, 203-215. Rees, A., and Møller, A.R. (1983). Responses of neurons in the inferior colliculus of the rat to AM and
FM tones. Hearing Res. 10, 301-330. Sachs, M.B., and Abbas, P.J. (1974). Rate versus level functions for auditory-nerve fibers in cats: tone-
burst stimuli. J. Acoust. Soc. Am. 56, 1835-1847. Shannon, R.V., Zeng, F.-G., Kamath, V., Wygonski, J., and Ekelid, M. (1995). Speech recognition
with primarily temporal cues. Science 270, 303-304. Smith, R.L., and Zwislocki, J.J. (1975). Short-term adaptation and incremental responses of single
auditory-nerve fibers. Biol. Cybernetics 17, 169-182.