neural correlates of behavioral variation in healthy...
TRANSCRIPT
Neural correlates of behavioral variation in healthy adults’antisaccade performance
DAVID J. SCHAEFFER,a MICHAEL T. AMLUNG,b QINGYANG LI,c CYNTHIA E. KRAFFT,b
BENJAMIN P. AUSTIN,d KARA A. DYCKMAN,b and JENNIFER E. MCDOWELLa,b,e
aDepartment of Neuroscience, University of Georgia, Athens, Georgia, USAbDepartment of Psychology, University of Georgia, Athens, Georgia, USAcChild Mind Institute, New York, New York, USAdUW Cardiovascular Research Center, University of Wisconsin School of Medicine and Public Health, Madison, Wisconsin, USAeBio-Imaging Research Center, University of Georgia, Athens, Georgia, USA
Abstract
Cognitive control is required for correct antisaccade performance. High antisaccade error rates characterize certainpsychiatric disorders, but can be highly variable, even among healthy groups. Antisaccade data were acquired from alarge sample of healthy undergraduates, and error rate was quantified. Participants who reliably made few errors (good,n = 13) or many errors (poor, n = 13) were recruited back to perform antisaccades during fMRI acquisition. A data-derived model was used to compare signal between good and poor performers during blocks of antisaccade trials.Behaviorally derived regressors were used to compare signal between good and poor performers during correct and errortrials. Results show differential activation in middle frontal gyrus and inferior parietal lobule between good and poorperformers, suggesting that failure to recruit these top-down control regions corresponds to poor antisaccade perform-ance in healthy young adults.
Descriptors: Functional magnetic resonance imaging (fMRI), Antisaccade, Cognitive control
Saccades support reflexive-like exploration of our environment viarapid redirection of gaze to center the fovea on an object or place ofinterest (Leigh & Zee, 2006). In daily life, however, goal-directedbehavior may require cognitive control to modify reflexiveresponses. For instance, cognitive control over reflexive saccadescan avert gaze from aversive or inappropriate stimuli. As such,evaluating the ability to inhibit reflexive saccades in the face ofprepotent stimuli provides a simple and effective index of cognitivecontrol. Antisaccade tasks require the inhibition of a saccadetoward a suddenly appearing visual cue and the subsequent gen-eration of a saccade away from the cue (Hallett, 1978). An initialglance towards the cue constitutes an error and may be considereda failure to instate cognitive control. High antisaccade error ratescharacterize certain psychiatric disorders, but error rates can behighly variable, even among healthy groups (Hutton & Ettinger,2006). This study sought to (a) identify a subset of healthy partici-pants who, based on antisaccade performance, may have difficultyinstating cognitive control, and (b) characterize that deficit in termsof neural circuitry.
Prosaccades and antisaccades share functional neuroanatomy(for review, see McDowell, Dyckman, Austin, & Clementz, 2008);however, changed levels of activation in the basic saccadiccircuitry may be required to support antisaccade performance(Hutton & Ettinger, 2006; Munoz & Everling, 2004). Whendirectly compared with prosaccades, antisaccades show increasedactivation in posterior parietal cortex (PPC), frontal eye fields(FEF), and supplementary eye fields (SEF; Connolly, Goodale,DeSouza, Menon, & Vilis, 2000; DeSouza, Menon, & Everling,2002; Dyckman, Camchong, Clementz, & McDowell, 2007).
In addition to differences in the levels of activation within thebasic saccadic circuitry, additional regions may be recruited tosupport the increased cognitive complexity of antisaccade perform-ance. Of the possible regions involved in antisaccade-related cog-nitive control, PPC and prefrontal cortex (PFC) seem to play acritical role in correct antisaccade performance. Specifically, datafrom nonhuman primate electrophysiology, human lesion, andhuman functional neuroimaging studies converge to suggest thatregions of PPC are involved in the coordinate transformationrequired for correct antisaccade performance. Recordings of neuralactivity in PPC of nonhuman primates during pro- and antisaccadeshave shown PPC to be active just prior to an antisaccade, suggest-ing that the PPC encodes the signal to look away from the cue,rather than toward it (Zhang & Barash, 2000). Humans with pari-etal lobe lesions have displayed impairment in the ability to gen-erate antisaccades, providing further support for the thesis thatparietal cortex updates visuomotor space to allow for movements
Support was provided by National Institute of Mental Health(MH001852), the National Science Foundation Graduate Research Fellow-ship Program, and the UGA Bio-Imaging Research Center.
Address correspondence to: Jennifer E. McDowell, Department of Psy-chology, University of Georgia, Athens, GA 30602. E-mail: [email protected]
bs_b
s_ba
nner
Psychophysiology, 50 (2013), 325–333. Wiley Periodicals, Inc. Printed in the USA.Copyright © 2013 Society for Psychophysiological ResearchDOI: 10.1111/psyp.12030
325
away from the cue (Sharpe, Cheng, & Eizenman, 2011). Althoughregions of parietal cortex are important for processing position datafor both pro- and antisaccades, functional neuroimaging has shownthat, when compared to prosaccades, blood oxygenation leveldependent (BOLD) signal during antisaccades is greater in regionsof inferior parietal cortex (Connolly et al., 2000; Krafft et al.,2012).
Regions of PFC also have been shown to be involved in correctantisaccade performance. Functional neuroimaging studies com-paring pro- and antisaccades have provided evidence that the PFCshows activation during antisaccade trials, but not prosaccade trials(DeSouza et al., 2002; Dyckman et al., 2007). Other studiessuggest a more specific timing role of the PFC, such that activationbegins before response generation (McDowell et al., 2005), a nec-essary characteristic for PFC modulation of error avoidance on theantisaccade task. During the period prior to pro- and antisaccades,the dorsolateral PFC (DLPFC) has shown greater activation forantisaccades, suggesting that the DLPFC is involved in the prepa-ration necessary to suppress prosaccades toward the cue(DeSouza et al., 2002). Electrophysiological recordings suggestthat singals from the PFC suppress unwanted eye movments bymodulating the activity of the FEF and superior colliculous throughdirect projections to those regions (Johnston & Everling, 2006;Munoz & Everling, 2004). Furthermore, data from electroencepha-lography (EEG) suggest that prestimulus signals from the PFCmodulate correct antisaccade performance by sending top-downsignals to visual cortex, which function to complement motorpreparation in reducing the propensity to glance toward the cue(Clementz et al., 2010).
Additional information regarding the functional roles of thePPC and PFC has been provided by studies that dissociate patternsof activation between correct and error antisaccade trials. In anevent-related functional magnetic resonance imaging (fMRI) study,Curtis and D’Esposito (2003) demonstrated increased levels ofactivation in PPC and FEF during correct antisaccade performancenot present during antisaccade errors or prosaccade trials. Ford,Goltz, Brown, & Everling (2005) compared brain activation duringcorrect and error antisaccade trials and found that activation infrontal and cingulate cortices was associated with correct, but noterror antisaccade trials. Taken together, results from the Curtis andFord studies highlight the requisite role of parietal and frontalactivation in correct antisaccade performance.
Although neural deficits associated with poor antisaccade per-formance have been well documented in clinical populations (forreview, see Hutton & Ettinger, 2006), there is a relative dearth ofinformation regarding the neural correlates of poor antisaccadeperformance in the healthy population. Understanding the neuralcorrelates underlying poor saccadic control within the healthypopulation may (a) help to identify neural circuitry functioningassociated with low levels of cognitive control within nonclinicalpopulations, and (b) serve as an impetus to explore failures ofcognitive control in other domains, particularly among people whoare vulnerable to these types of failures. In healthy adults, forinstance, measures of the antisaccade task performance (e.g., per-centage of direction errors) have been shown to correlate withcognitive measures of working memory and intelligence domains(Klein, Rauh, & Biscaldi, 2010).
By acquiring eye movement data from a large sample of healthyundergraduates, the present study sought to identify both good- andpoor-performing (based on percent of correct responses) subsets ofa healthy sample. Once participants were divided into good- andpoor-performing groups, patterns of brain activation corresponding
to antisaccade performance were compared. Because poor per-formers generate a higher proportion of error trials, it washypothesized that the poor group would show reduced pre-frontal (DeSouza et al., 2002; Ford et al., 2005) and parietal(Connolly et al., 2000) activation when compared to the goodgroup. To test for differences between good and poor performersacross the blocks of antisaccade trials, a hybrid independent com-ponent analysis (ICA; McKeown, 2000) was used. Furthermore,good and poor performers were expected to show differential acti-vation of frontal and parietal regions during correct and error trials(Curtis & D’Esposito, 2003; Ford et al., 2005). The effects of theinteraction of Group ¥ Trial Performance were assessed by con-volving hemodynamic responses based on correct and errorresponses separately, then comparing activation patterns correlatedwith each type of response.
Method
Participants
A large initial sample (N = 296, mean age = 19.3 years, SD = 1.7;60.8% female) of right-handed undergraduate students wasrecruited through the Psychology Research Pool to participate inthis study (see Li et al., 2012, for more information). Participantshad no history of psychiatric illness or severe head trauma viaself-report. Two groups, good performers (n = 13) and poor per-formers (n = 13), were selected via performance on screening ses-sions to perform the antisaccade task in the MRI while eyemovements were recorded. One participant from each group wasomitted from the final analysis due to excessively noisy eye move-ment data, resulting in 12 participants in each group (good, meanage = 19.2 years, SD = 1.2, 46.1% female; poor, mean age = 19.5years, SD = 0.9, 61.5% female). Groups did not differ on thesedemographic variables. Participants provided written informedconsent and were given course credit or monetary payment for theirtime. The University of Georgia Institutional Review Boardapproved this study.
Testing Sessions
Sessions 1 and 2. The present study consisted of two behavioraltesting sessions and a fMRI session. During Sessions 1 and 2,participants completed the antisaccade task while their eye move-ments were recorded at 500 Hz using an infrared-based eye track-ing system (Eye Track Model 310; Applied Science Laboratories,Waltham, MA). A chin rest placed participants 70 cm from a flatcolor monitor and was used to prevent head movements. A blockdesign was used in which seven fixation blocks were alternatedwith six antisaccade blocks (eight trials per block). On fixationblocks, participants were instructed to stare at a magenta cue (1°diameter) in the center of the screen. On antisaccade trials, a bluecue (1° diameter) was presented in the center of the screenfor a random interval between 1,500 ms and 2,000 ms (meanduration = 1,750 ms). The center cue disappeared, and then after agap of 200 ms, a blue peripheral cue was presented at � 5° or 10°from fixation on the horizontal plane for 1,250 ms. A 200-ms gapwas used because it has been shown to produce more error trialsthan nongap versions of the task (Fischer, Gezeck, & Hartnegg,2000). Participants were instructed not to look at the cue when itjumped to the side, and to move their eyes to the opposite side ofthe screen at the same distance from the center.
326 D.J. Schaeffer et al.

Eye movement data were analyzed using MATLAB (The Math-works Inc., Natick, MA). Trials with blinks during stimulus onsetand trials with no saccades were eliminated. Eye movement reac-tion times within 80 ms of peripheral cue onset were excluded, asthe movements were likely not in response to the cue. Saccadeswere scored for direction, latency, and gain. Trials with antisaccadeerrors (initial saccades made in the same direction of the cue) werescored for error correction (saccades in the opposite direction aftera first movement in the wrong direction).
Participants with correct antisaccade performance in the upper(� 80% correct) or lower (� 65% correct) thirds of the distributionin Session 1 were invited to return for Session 2 (Figure 1). If a
participant’s correct antisaccade score in Session 2 remained in thesame third of the distribution as it was in Session 1, then perform-ance was considered to be reliable. Participants with reliable per-formance were invited to Session 3, during which fMRI data werecollected while participants were engaged in the antisaccade task.
Session 3. During Session 3, participants completed the antisac-cade task in the MRI where functional images and eye movementswere recorded simultaneously. fMRI data were acquired using a 3TGE Signa scanner at the University of Georgia Bio-ImagingResearch Center. During scanning, heads were stabilized bypadding and a forehead strap. Eye movements were recorded usinga MR compatible eye tracker (MeyeTrack, SensoMotoric Instru-ments, Inc., Berlin, Germany). A dual mirror system was mounted16 mm from the participant’s nasion on the head coil; one mirrorreflected the image of the participant’s eye to an infrared cameraplaced at the rear of the bore, while a second mirror allowedparticipants to view a projection screen placed in front of the bore.Eye movements were digitized at 60 Hz and displayed on a com-puter screen to be monitored by the experimenter during the task.Stimulus presentation was controlled using Presentation software(Neurobehavioral Systems, Albany, CA). The stimuli of Session 3(Figure 2) were identical to Sessions 1 and 2, apart from a centralfixation time fixed at 1,600 ms and the peripheral cue time of950 ms. Before entering the scanner, participants were instructednot to look at the cue when it jumped to the side, and to move theireyes to the opposite side of the screen at the same distance from thecenter. Eye movement data were scored for saccade direction todetermine correct or error responses on a trial-by-trial basis.
During each scan session, two localizer images were taken toensure accurate whole brain coverage. T1-weighted structuralimages were acquired axially using spoiled gradient-recall protocol(.9375 ¥ .9375 ¥ 1.2 mm, 150 slices, TR = 7.8 ms, TE = 3 ms, flipangle = 20°, scan time = 6 min 20 s). For the antisaccade run,T2*-weighted images were acquired using 33 gradient-recalledecho-planar images (EPI; 3.44 ¥ 3.44 ¥ 4 mm, TR = 2,000 ms,TE = 30 ms, flip angle = 90°). To allow for scanner stabilization,four images (8-s scan time) were acquired before the run began;these images were discarded, then image recoding for the func-tional run began (scan time = 4 min 46 s). The images were
Figure 1. Distribution of percent correct antisaccades from screeningsession 1 (N = 296). Lines represent upper and lower third cutoff points;good performers were defined as scoring above 80% (dashed line) correctand poor performers below 65% (solid line).
Figure 2. Stimuli and experimental design for fMRI session. The arrow indicates where the participant should look for each stimulus presentation. The runconsisted of seven fixation blocks alternated with six blocks consisting of eight antisaccade trials. During the experiment, the fixation and antisaccade cueswere presented as magenta and blue, respectively.
Neural correlates of antisaccade variation 327
collected obliquely, with the slices aligned to the superior marginof the participants’ anterior commissure and the inferior margin ofthe posterior commissure.
Image Analysis
Individual preprocessing. fMRI analyses were conducted usingAnalysis of Functional NeuroImages (AFNI; Cox, 1996). Func-tional EPI data processing began with voxelwise despiking of thetime series data. For each individual, motion correction was doneby registering functional volumes to a base volume, which wasidentified by the following criteria: the median volume of thelongest window of time points with the lowest number of outliervoxels. Functional images were slice-time corrected and aligned toT1-weighted anatomical volumes. Each functional volume wasthen blurred using a 4-mm full-width at half-maximum (FWHM)Gaussian filter. Functional time series were normalized by dividingthe signal at each voxel by the mean signal intensity across theentire time series and multiplying the result by 100.
GLM analyses. This study sought to (a) use a data-derivedapproach to assess differences between good and poor performersacross the blocks of antisaccade trials, and (b) use a behaviorallyderived approach to assess differences between good and poorperformers on correct and error trials. Thus, two separate GLManalyses were conducted: one data driven and the other behavio-rally driven.
Data-derived model. To acquire a model-free task-relatedregressor for the first GLM analysis, a hybrid ICA was performedsimilar to the approach developed by McKeown (2000) and imple-mented in Dyckman et al. (2007). First, all subjects’ preprocesseddata were transformed into Talaraich space (Talaraich & Tournoux,1998). Second, an averaged dataset was created for input to FSLsMELODIC (Beckmann & Smith, 2004). The ICA yielded 33 spa-tially independent components. To avoid under- or overfitting, thenumber of ICA components was automatically estimated foroptimum ICA dimensionality by MELODIC using the Laplaceapproximation to the Bayesian evidence for the model order. Thefirst component had the same peak frequency as our experimentaldesign and thus was used as a task regressor. Estimates of roll,pitch, and yaw (acquired during motion correction) were used asmotion regressors. Estimates of motion were obtained from theoutput matrix of volume registration, which corresponded to theamount of adjustment to roll, pitch, and yaw (in mm) that wasneeded to register each volume (i.e., TR) to a base volume. Thebase volume was chosen by identifying the median volume of thelongest window of time points with the lowest number or outliervoxels. Using the coefficients yielded from the ICA-based GLManalysis, group level voxelwise one-sample t tests were conductedfor the good performers and poor performers to visualize antisac-cade task-related BOLD signal change. A voxelwise t test betweengood and poor performers was performed to test between-groupdifferences in BOLD signal change.
Behaviorally derived model. To test for specific trial perform-ance effects, a second analysis was conducted based on individualparticipant’s performance across the task. Eye movement data werescored to identify the response to each trial as either correct orerror. Using the time points at which correct or error responsesoccurred, estimated task-related regressors were created by con-volving the responses with the hemodynamic response function.
Thus, for each participant, we created a correct regressor and anerror regressor. Unscorable trials were not modeled in the regres-sors. Functional images were then transformed into Talaraich spaceand resampled to a resolution of 4 ¥ 4 ¥ 4 mm. For each partici-pant, a GLM analysis was conducted using the correct and error-related regressors and the motion regressors discussed in thedata-derived model section above. Using the coefficients yieldedfrom the GLM analysis, voxelwise t tests between correct and errortrials were performed to test for within-group differences in BOLDsignal change for good and poor performers. A 2 ¥ 2 analysis ofvariance (Group ¥ Trial Performance) was conducted to assessBOLD activation related to correct and error trials for good andpoor performers.
To protect against false positives, a clustering method derivedfrom Monte Carlo simulations (accounting for the 4-mm FWHMGaussian filter and with a connectivity radius of 5.7 mm) wasapplied to the statistical parametric maps (Ward, 2000). Based onthese simulations, the familywise alpha of .05 was preserved withan a priori voxelwise probability of .025 and three-dimensionalclusters with a minimum volume of 1,088 ml (17 or more voxels).Data were clustered using AFNI, and resulting statistical paramet-ric maps were used to identify regional BOLD signal changes.
Results
Behavioral Results
The percentage of correct antisaccade trials during Session 2 sig-nificantly differed between good (mean = 91.8%, SD = 4.5) andpoor (mean = 53.6%, SD = 7.0) (t = 13.6, p < .05) performers withusable data from 100% of participants The group difference per-sisted at Session 3: good (mean = 91.6%, SD = 4.0) significantlydiffered from poor (mean = 60.4%. SD = 10.3) (t = 9.8, p < .05)performers with usable eye movement data available for 92.3% ofparticipants. Both groups corrected antisaccade errors at a high rate(good = 100.0% and poor = 89.6%).
Independent samples t tests were conducted to compare reac-tion times during correct and error trials between good and poorperformers. Although reaction times of good performers(mean = 260.2 ms; SD = 30.4) were slower than poor performers(mean = 238.4 ms; SD = 35.4) during correct trials, differences didnot reach significance: t(22) = 1.6, p = .11. Similarly, during errortrials, reaction times of good performers (mean = 201.2 ms;SD = 31.4) were slower than poor performers (mean = 176.2 ms;SD = 37.9), but differences did not reach significance: t(22) = 1.6,p = .11. With a much larger sample size, we recently reported(Li et al., 2012) a pattern of good performers showing slowerresponse times in healthy subjects.
Imaging Results
Data-derived model. Clustered one-sample t maps comparingBOLD signal change for each group versus zero were calculated(Figure 3). Both groups showed increased BOLD signal change inregions known to be involved in antisaccade performance: SEF,FEF, PPC, frontal cortex, middle occipital gyrus (MOG), striatum,and thalamus. A whole brain, between-groups t map showed dif-ferences between BOLD signal change in good and poor perform-ers (Table 1). Good performers showed reduced BOLD signalchange in left cuneus. Poor performers showed reduced BOLDsignal change in right middle frontal gyrus (MFG), bilateral infe-rior parietal lobule (IPL), left MOG, and left cerebellum.
328 D.J. Schaeffer et al.

Behaviorally derived model. A whole brain, within-group t mapcomparing correct and error trials in good performers showedgreater BOLD signal change in left inferior frontal gyrus (IFG), leftMFG, and bilateral superior frontal gyrus (SFG) during error trials(Figure 4, left). Good performers also showed greater BOLD signalchange in bilateral cerebellum. A whole brain, within-group t mapcomparing correct and error trials in poor performers showed
greater BOLD signal change in left superior temporal gyrus andIFG during error trials (Figure 4, right).
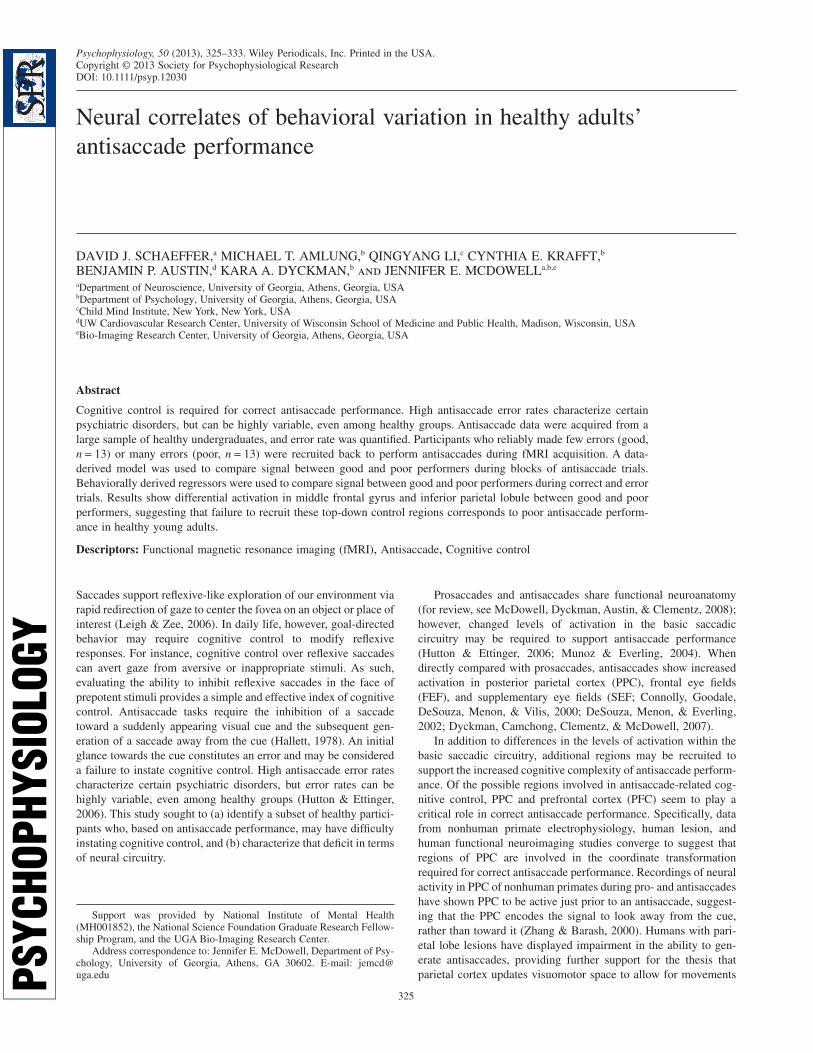
A whole brain Group ¥ Trial Performance interaction mapshowed no between-group differences on correct trials. Significantdifferences were observed, however, between good and poor per-formers on error trials F(1,22) = 4.35, p = .05 (Figure 5; seeTable 1 for Talaraich coordinates). Good performers showed
Figure 3. Hybrid independent component analysis. Axial slices (z = -35 through z = 62, functional slice thickness = 4 mm) displaying activation significantat a = .05 (corrected). The left image (good performers) and center image (poor performers) show one-sample t tests for activation related to the first ICAcomponent. In the right image, a t test between good and poor performers shows greater activation for good performers (warm colors) and poor performers(cool colors). The underlying anatomical image was averaged across groups. Image displayed in radiological convention.
Figure 4. Within-group t tests. Axial slices (z = -35 through z = 62, functional slice thickness = 4 mm). The left image (good performers) and right image(poor performers) display activation significant at a = .05 (corrected) for within-group t tests between correct and error trials. Cooler colors represent greateractivation during error trials. Warmer colors represent greater activation during correct trials. The underlying anatomical image was averaged across groups.Image displayed in radiological convention. 1 = left inferior frontal gyrus; 2 = left middle frontal gyrus; 3 = bilateral superior frontal gyrus; 4 = bilateralcerebellum; 5 = left superior temporal gyrus; 6 = left inferior frontal gyrus.
Neural correlates of antisaccade variation 329

reduced BOLD signal change in right precuneus and right cerebel-lum as compared to poor performers during errors. Poor performersshowed reduced BOLD signal change in two separate right MFGclusters, and in the right IPL compared to good performers duringerror trials.
Discussion
The main focus of this study was to elucidate the neural correlatesof poor antisaccade performance in a subset of healthy youngadults. The data-derived ICA analysis of overall antisaccade per-formance demonstrated that poor performers (� 65% correct)showed less BOLD signal change in regions involved in top-downcognitive control, compared to good performers (� 80% correct).This study also sought to dissociate activation patterns duringcorrect trials from those during error trials through the use oftrial-by-trial responses on a block design. This behaviorally derivedanalysis showed that good and poor performers showed similarpatterns of activation on correct trials, but on error trials differentialpatterns of activation in MFG, IPL, precuneus, and cerebellumwere observed.
Data-Derived Model
Across the blocks of antisaccade trials, both good and poor per-formers showed activation in SEF, FEF, PPC, PFC, MOG, striatum,and thalamus—regions which have been commonly associatedwith antisaccade performance (McDowell et al., 2008). Poor per-formers, however, showed a reduction in BOLD signal change inMFG and IPL as compared to good performers. Patterns of reducedfrontal activation have been associated with deficits in saccadicinhibition in clinical populations. Patients with schizophrenia, forexample, have shown decreased BOLD signal change in MFG andits associated subcortical circuitry during blocks of the antisaccadetask when compared to healthy controls (McDowell et al., 2002;Tu, Yang, Kuo, Hsieh, & Su, 2006). Reduction of IPL activationamong poor performers may represent a failure of sensorimotortransformation required to generate a saccade away from the cue.
This is consistent with nonhuman primate neural recordings, whichsuggest that PPC encodes the motor signal to look away from thecue (Zhang & Barash, 2000).
Behaviorally Derived Model
Event-related designs have provided evidence for dissociating theneural correlates of correct antisaccade trials from the neural cor-relates of antisaccade error trials (Curtis & D’Esposito, 2003;Ettinger et al., 2008; Ford et al., 2005). In the present study, goodand poor performers showed differential patterns of activation oncorrect and error trials. When compared within group, both goodand poor performers showed greater activation in IFG during errortrials. Good performers, unlike poor performers, also showedgreater activation in MFG and SFG. In a Group ¥ Trial Perform-ance interaction, poor performers showed reduced activation com-pared to good performers in MFG and IPL on error, but not correcttrials. These results are consistent with the Ford et al. (2005) event-related fMRI study, which provided data to suggest that a largefrontal and parietal network is involved in preventing errors duringthe antisaccade task. Here, greater activation in frontal regions andIPL in good performers likely represents an attempt to instatecognitive control during the trial containing the antisaccade error(Clementz, Brahmbhatt, McDowell, Brown, & Sweeney, 2007;Sharpe et al., 2011). Poor performers showed similar patterns togood performers on correct trials, but showed greater activation inprecuneus and cerebellum on error trials. In poor performers,greater activation in precuneus may represent an uninhibitedbottom-up response to the stimuli.
The distinct patterns between good and poor performers duringerror trials could represent the absence of top-down prefrontal andparietal control in poor performers. Microelectrode and EEG datasuggest that the PFC may send top-down inhibitory signals directlyto early visual areas, ostensibly preventing saccade errors towardthe stimulus (Clementz et al., 2010; Johnston & Everling, 2006;Munoz & Everling, 2004). In addition to the PFC, parietal regionshave been shown to play a role in top-down modulation of visualresponses. Patients with parietal lesions show an increased rate ofantisaccade errors (Sharpe et al., 2011). Thus, when top-down
Table 1. Talaraich Coordinates of Significant BOLD Signal Change
Region L/R
Center of mass
Cluster size (voxels)X Y Z
Good vs. poor performersGood > poorMFG R 40 22 36 45IPL R 50 -46 33 25
L -54 -48 27 34MOG L -34 -70 -14 81Cerebellum L -14 -24 -24 27Poor > goodCuneus L -10 -60 7 43
Error trialsGood > poorMFG R 39 22 23 61MFG R 32 54 3 18IPL R 48 -62 26 52Poor > goodPrecuneus R 13 -46 58 23Cerebellum R 12 -39 -37 42
Note. MFG = middle frontal gyrus; IPL = inferior parietal lobule; MOG = middle occipital gyrus.
330 D.J. Schaeffer et al.
Fig
ure
5.G
roup
¥T
rial
Perf
orm
ance
inte
ract
ion.
Axi
alsl
ices
(z=
-35
thro
ugh
z=
62,
func
tiona
lsl
ice
thic
knes
s=
4m
m)
disp
layi
ngac
tivat
ion
sign
ifica
ntat
a=
.05
(cor
rect
ed)
for
the
grou
p(g
ood
and
poor
perf
orm
ers)
bytr
ialp
erfo
rman
ce(c
orre
ctan
der
rort
rial
s)in
tera
ctio
n.Sc
atte
rplo
tssh
owpe
rcen
tBO
LD
sign
alch
ange
valu
esas
afu
nctio
nof
perc
entc
orre
cttr
ials
fori
ndiv
idua
lgoo
dan
dpo
orpe
rfor
mer
son
corr
ect
and
erro
rtr
ials
.Bar
grap
hsdi
spla
ym
eans
and
stan
dard
erro
rof
scat
ter
plot
s.R
egio
ns1,
2,an
d3
show
edgr
eate
rpe
rcen
tBO
LD
sign
alch
ange
elic
ited
bygo
odpe
rfor
mer
sth
anby
poor
perf
orm
ers
oner
ror
tria
ls.
Reg
ions
4an
d5
show
edgr
eate
rpe
rcen
tBO
LD
sign
alch
ange
elic
ited
bypo
orpe
rfor
mer
sth
anby
good
perf
orm
ers
oner
ror
tria
ls.T
heun
derl
ying
anat
omic
alim
age
was
aver
aged
acro
ssgr
oups
.Im
age
disp
laye
din
radi
olog
ical
conv
entio
n.
Neural correlates of antisaccade variation 331

control regions are not active in poor performers, bottom-up visualregions (e.g., precuneus) are uninhibited, and the likelihood ofmaking an antisaccade error is increased. Conversely, althoughgood performers made errors, their top-down control circuitry wasmore active during the errors and likely contributed to a reducedprobability of a future error.
These results should be interpreted within the context of thefollowing caveats. First, we could not assess the shape of thehemodynamic response associated with correct and error trials.Despite this, we were able to show differences in brain activationbetween correct and error trials. Because the hemodynamicresponse has been shown to be linearly additive, individualresponses, such as those corresponding to correct and error trials,can be demarcated out of a block of responses, provided that theyare more than 2 s apart (Dale & Buckner, 1997). Second, statisticalpower may have been an issue in the comparison of good and poorperformers based on their correct and error trials alone. Becausegood performers were characterized by more correct trials, thepower to predict activation due to correct trials was greater for goodperformers. Likewise, the power to predict activation due to errortrials was greater for poor performers. This, however, did not seemto be an issue in the error trial only comparison; good performersshowed greater activation in two regions, MFG and IPL, despitereduced power. Third, activation patterns in poor performers couldhave resulted from low task engagement, rather than deficits incognitive control. Poor performers did, however, make correctionsaccades during most (89.6%) error trials. Thus, it could be argued
that poor performers were engaged in the task, or else they wouldnot have corrected error saccades.
The present findings may have potential utility for studies com-paring healthy controls to patient groups. Here, we have identifieda poor-performing subset of a healthy sample and shown that thisgroup differs in terms of neural activation patterns from a groupwho performs well on the antisaccade task. Although samplinggood-performing healthy participants is convenient, these findingssuggest the importance of sampling from a full distribution ofperformance. Having a particularly well performing control groupcould bias differences in activation (Hill & Neiswanger, 1997).Thus, utilizing control groups that represent the full performancedistribution for comparison with patient samples might providefurther detail on circuitry specific to the illness, rather thanperformance.
The results from this study suggest that a failure to activatefrontal and parietal regions involved in top-down control corre-sponds to poor antisaccade performance in healthy young adults.Moreover, these data illustrate that levels of activation in top-down control regions during error trials can differentiatecognitive control ability. Here, poor-performing healthy adultswere able to activate the same top-down control regions as agood-performing subset during correct trials, but showed anabsence of the activation in these regions during error trials.Therefore, future work investigating patterns of activation duringerror trials might help further our understanding of why peoplevary in their ability to instate cognitive control.
References
Beckmann, C. F., & Smith, S. M. (2004). Probabilistic independent com-ponent analysis for functional magnetic resonance imaging. IEEETransactions on Medical Imaging, 23, 137–152. doi: 10.1109/tmi.2003.822821
Clementz, B. A., Brahmbhatt, S. B., McDowell, J. E., Brown, R., &Sweeney, J. A. (2007). When does the brain inform the eyes whetherand where to move? An EEG study in humans. Cerebral Cortex, 17,2634–2643. doi: 10.1093/cercor/bhl171
Clementz, B. A., Gao, Y., McDowell, J. E., Moratti, S., Keedy, S. K., &Sweeney, J. A. (2010). Top-down control of visual sensory processingduring an ocular motor response inhibition task. Psychophysiology, 47,1011–1018. doi: 10.1111/j.1469-8986.2010.01026.x
Connolly, J. D., Goodale, M. A., DeSouza, J. F., Menon, R. S., & Vilis, T.(2000). A comparison of frontoparietal fMRI activation during anti-saccades and anti-pointing. Journal of Neurophysiology, 84, 1645–55.Retrieved from http://jn.physiology.org/content/84/3/1645.full
Cox, R. W. (1996). AFNI: Software for analysis and visualization of func-tional magnetic resonance neuroimages. Computers and BiomedicalResearch, 29, 162–173.
Curtis, C. E., & D’Esposito, M. (2003). Success and failure suppressingreflexive behavior. Journal of Cognitive Neuroscience, 15, 409–418.doi: 10.1162/089892903321593126
Dale, A. M., & Buckner, R. L. (1997). Selective averaging of rapidlypresented individual trials using fMRI. Human Brain Mapping, 5, 329–340. doi: 10.1002/(SICI)1097-0193(1997)5:5<329::AID-HBM1>3.0.CO;2-5
DeSouza, J. F., Menon, R. S., & Everling, S. (2002). Preparatory setassociated with pro-saccades and anti-saccades in humans investigatedwith event-related fMRI. Journal of Neurophysiology, 89, 1016–1023.doi: 10.1152/jn.00562.2002
Dyckman, K. A., Camchong, J., Clementz, B. A., & McDowell, J. E.(2007). An effect of context on saccade-related behavior and brainactivity. NeuroImage, 36, 774–784. doi: 10.1016/j.neuroimage.2007.03.023
Ettinger, U., Ffytche, D. H., Kumari, V., Kathmann, N., Reuter, B., Zelaya,F., & Williams, S. C. R. (2008). Decomposing the neural correlates ofantisaccade eye movements using event-related fMRI. Cerebral Cortex,18, 1148–1159. doi: 10.1093/cercor/bhm147
Fischer, B., Gezeck, S., & Hartnegg, K. (2000). On the productionand correction of involuntary prosaccades in a gap antisaccadetask. Vision Research, 40, 2211–2217. doi: 10.1016%2FS0042-6989%2800%2900082-1
Ford, K. A., Goltz, H. C., Brown, M. R., & Everling, S. (2005). Neuralprocesses associated with antisaccade performance investigated withevent-related fMRI. Journal of Neurophysiology, 94, 429–440. doi:10.1152/jn.00471.2004
Hallett, P. E. (1978). Primary and secondary saccades to goals defined byinstructions. Vision Research, 18, 1279–1296. doi: 10.1016/0042-6989(78)90218-3
Hill, S. Y., & Neiswanger, K. (1997). The value of narrow psychiatricphenotypes and “super” normal controls. Handbook of psychiatricgenetics (Vol. 236). New York, NY: CRC Press.
Hutton, S. B., & Ettinger, U. (2006). The antisaccade task as a research toolin psychopathology: A critical review. Psychophysiology, 43, 302–313.doi: 10.1111/j.1469-8986.2006.00403.x
Johnston, K., & Everling, S. (2006). Neural activity in monkey prefrontalcortex is modulated by task context and behavioral instruction duringdelayed-match-to-sample and conditional prosaccade-antisaccade tasks.Journal of Cognitive Neuroscience, 18, 749–765. doi: 10.1162/jocn.2006.18.5.749
Klein, C., Rauh, R., & Biscaldi, M. (2010). Cognitive correlates of anti-saccade task performance. Experimental Brain Research, 203, 759–764.doi: 10.1007/s00221-010-2276-5
Krafft, C., Schwarz, N., Chi, L., Li, Q., Schaeffer, D., Rodrigue, A. L., . . .McDowell, J. (2012). The location and function of parietal cortex sup-porting of reflexive and volitional saccades, a meta-analysis of over adecade of functional MRI data. In A. Costa & E. Villalba (Eds.), Hori-zons of neuroscience research, volume 9 (pp. 131–153). Hauppauge,NY: Nova Science Publishers.
Leigh, R. J., & Zee, D. S. (2006). The neurology of eye movements (Vol. 4).Oxford, UK: Oxford University.
Li, Q., Amlung, M. T., Valtcheva, M., Camchong, J., Austin, B. P.,Dyckman, K. A., . . . McDowell, J. E. (2012). Evidence from clusteranalysis for differentiation of antisaccade performance groups based onspeed/accuracy trade-offs. International Journal of Psychophysiology,85, 274–277. doi: 10.1016/j.ipsycho.2012.03.008
332 D.J. Schaeffer et al.

McDowell, J. E., Brown, G. G., Paulus, M., Martinez, A., Stewart, S. E.,Dubowitz, D. J., & Braff, D. L. (2002). Neural correlates of refixationsaccades and antisaccades in normal and schizophrenia subjects. Bio-logical Psychiatry, 51, 216–223. doi: 10.1016/S0006-3223(01)01204-5
McDowell, J. E., Dyckman, K. A., Austin, B. P., & Clementz, B. A. (2008).Neurophysiology and neuroanatomy of reflexive and volitional sac-cades: Evidence from studies of humans. Brain and Cognition, 68,255–270. doi: 10.1016/j.bandc.2008.08.016
McDowell, J. E., Kissler J. M., Berg, P., Dyckman, K. A, Gao, Y., Rock-stroh, B., & Clementz, B. A. (2005). Electroencephalography/magnetoencephalography study of cortical activities precedingprosaccades and antisaccades. NeuroReport, 16, 663–668. doi: 10.1097/00001756-200505120-00002
McKeown, M. J. (2000). Detection of consistently task-related activationsin fMRI data with hybrid independent component analysis. Neuro-Image, 11, 24–35. doi: 10.1006/nimg.1999.0518
Munoz, D. P., & Everling, S. (2004). Look away: The anti-saccade task andthe voluntary control of eye movement. Nature Reviews Neuroscience,5, 218–228. doi: 10.1038/nrn1345
Sharpe, J. A., Cheng, P., & Eizenman, M. (2011). Antisaccade generation isimpaired after parietal lobe lesions. Annals of the New York Academy ofSciences, 1233, 194–199. doi: 10.1111/j.1749-6632.2011.06178.x
Talaraich, J., & Tournoux, P. (1998). Co-planar stereotaxic atlas of thehuman brain: A 3-dimensional proportional system, an approach tocerebral imaging. New York, NY: Thieme Medical Publishers.
Tu, P., Yang, T. H., Kuo, W. J., Hsieh, J. C., & Su, T. P. (2006). Neuralcorrelates of antisaccade deficits in schizophrenia, an fMRI study.Journal of Psychiatric Research, 40, 606–612. doi: 10.1016/j.jpsychires.2006.05.012
Ward, B. D. (2000). Simultaneous inference for fMRI data, AlphaSimprogram documentation for AFNI. Milwaukee, WI: Medical College ofWisconsin.
Zhang, M., & Barash, S. (2000). Neuronal switching of sensorimotor trans-formations for antisaccades. Nature, 408, 971–975. doi: 10.1038/35050097
(Received August 30, 2012; Accepted December 18, 2012)
Neural correlates of antisaccade variation 333