neural signal processing by mustafa rasheed & zeena saadon & walaa kahtan 2015
TRANSCRIPT

Ministry Of Higher Education & Scientific Research
University Of Diyala
College Of Engineering
Computer Engineering Dept.
Third stage
-Supervision By: -Preparation By:
Dr.Ali J. AboudMustafa R. Abass
Zeena S. Ali
Walaa K. Azeez
2015
List of contains
ـــــــــــــــــــــــــــــــــ
Chapter One:- Introduction 1.1 Neural signal
1.2 Neural Signal Processing
1.2.1 The goals of neural signal processing
1.2.2 Processing steps
1.2.3 Neural Encoding and Decoding
Chapter Two:- EEG signal processing technique 2.1 Introduction
2.2 Brain signal processing
2.3 Brain Waves and EEG
2.4 Brain computer interface
2.6 Recording electrodes
2.5 EEG recording techniques
2.7 Amplifiers and filters
2.8 Applications
Chapter Three:- Neural Signal processing by filtering 3.1 Introduction
3.2 Filter Analysis
3.2.1 Windowing
3.2.2 Hanning
3.2.3 Flattop
3.2.4 Blackman-Harris
3.2.5 Kaiser
Summery
References

List of Figure
ـــــــــــــــــــــــــــــــــ
Chapter One:- figure [1.1] are the dendrites that receive inputs from other neurons and the axon that carries the
neuronal output to other cells
figure [1.2] Processing step
Chapter Two:- figure [2.1] brain signal processing
figure [2.2] Brain wave samples with dominant frequencies belonging to beta, alpha, theta, and delta
band. figure [2.3] Brain computer interface processing steps
figure [2.4] set of the equipment (Electrodes, amplifiers, A/D converter, recording device)
figure [2.5] Amplifiers and filters
Chapter Three:- figure [3.1] Filter Analysis figure [3.2] Hanning Side Lobe figure [3.3] Hanning & None Hanning
figure [3.4] Flat Top Side Lobe figure [3.5] Blackman Side Lobe figure [3.6] Kaiser Side Lobe figure [3.7] rectangular ,flattop, hanning, Kaiser functions
.

CHAPTER ONE INTRODUCTION
1.1 Neural signal Neurons are remarkable among the cells of the body in their ability to propagate signals
rapidly over large distances. They do this by generating characteristic electrical pulses
called action potentials, or more simply spikes, that can travel down nerve fibers.
Neurons represent and transmit information by firing sequences of spikes in various
temporal patterns. The study of neural coding.
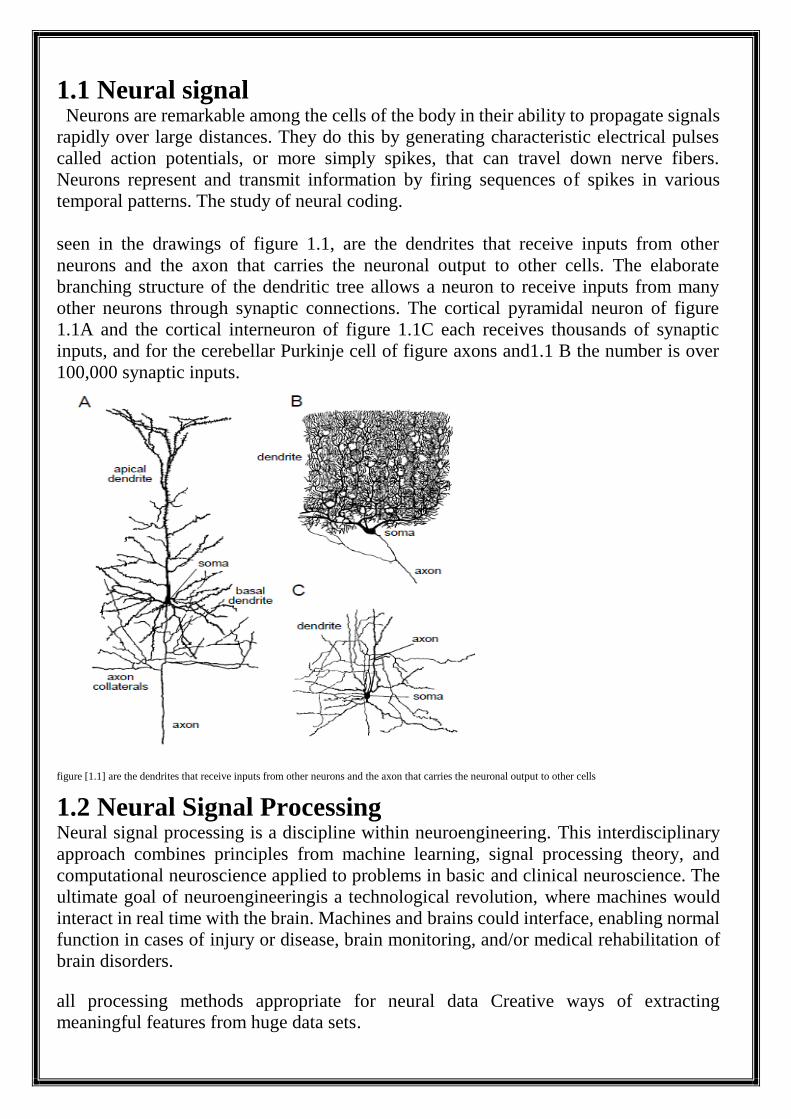
seen in the drawings of figure 1.1, are the dendrites that receive inputs from other
neurons and the axon that carries the neuronal output to other cells. The elaborate
branching structure of the dendritic tree allows a neuron to receive inputs from many
other neurons through synaptic connections. The cortical pyramidal neuron of figure
1.1A and the cortical interneuron of figure 1.1C each receives thousands of synaptic
inputs, and for the cerebellar Purkinje cell of figure axons and1.1 B the number is over
100,000 synaptic inputs.
figure [1.1] are the dendrites that receive inputs from other neurons and the axon that carries the neuronal output to other cells
1.2 Neural Signal Processing Neural signal processing is a discipline within neuroengineering. This interdisciplinary
approach combines principles from machine learning, signal processing theory, and
computational neuroscience applied to problems in basic and clinical neuroscience. The
ultimate goal of neuroengineeringis a technological revolution, where machines would
interact in real time with the brain. Machines and brains could interface, enabling normal
function in cases of injury or disease, brain monitoring, and/or medical rehabilitation of
brain disorders.
all processing methods appropriate for neural data Creative ways of extracting
meaningful features from huge data sets.

1.2.1 The goals of neural signal processing
We have
-Novel experimental paradigms.
-New neural recording technologies.
-Huge and rich potential data set.
Goals Further our basic understanding of brain function Develop biomedical devices that
interface with the brain.
-Signal processing methods appropriate for neural data Creative ways of extracting
meaningful features from huge data sets.
1.2.2 Processing steps
figure [1.2] Processing steps
1.2.3 Neural Encoding and Decoding Neurons transmit information by firing sequences of spikes.
Neural encoding – the map from stimulus to neural response.
–Can measure how neurons respond to a wide variety of stimuli .Then construct models;
attempt to predict responses to other stimuli.
– We will discuss encoding next few lectures.
Neural decoding – the map from response to stimulus.
– Attempt to reconstruct a stimulus, or certain aspects of that stimulus, from the spike
sequence it evokes.
– We will discuss decoding extensively in the rest of this course.

Neural encoding(From Stimulus to Response) Characterizing the stimulus → response relationship is hard because neural responses
are “complex” and variable:
1) Spike sequences reflect both intrinsic neural dynamics and temporal characteristics of
stimulus.
2) Identifying features of response that encode changes in stimulus is difficult, especially
if stimulus changes on times scale of inter-spike interval
3) Neural responses vary from trial-to-trial even when the same stimulus is presented
repeatedly.

CHAPTER TWO EEG signal processing technique

2.1 INTRODUCTION The human brain is one of the most complex systems in the universe. Nowadays
various technologies exist to record brain waves and electroencephalography (EEG) is
one of them. This is one of the brain signal processing technique that allows gaining the
understanding of the complex inner mechanisms of the brain and abnormal brain waves
have shown to be associated with particular brain disorders.
2.2 BRAIN SIGNAL PROCESSING Signal processing is the enabling technology for the generation, transformation, and
interpretation of information. At different stages of time our brain reacts differently.
These brain signals used for various purposes so that it is possible to study the
functionalities of brain properly by generating, transforming and interpreting the
collected signal. This process is known as brain signal processing.
figure [2.1] brain signal processing
2.3Brain waves classification For obtaining basic brain patterns of individuals, subjects are instructed to close their
eyes and relax. Brain patterns form wave shapes that are commonly sinusoidal. Usually,
they are measured from peak to peak and normally range from 0.5 to 100 μV in
amplitude, which is about 100 times lower than ECG signals. By means of Fourier
transform power spectrum from the raw EEG signal is derived. In power spectrum
contribution of sine waves with different frequencies are visible. Although the spectrum
is continuous, ranging from 0 Hz up to one half of sampling frequency, the brain state of
the individual may make certain frequencies more dominant. Brain waves have been
categorized into four basic groups:-
beta (>13 Hz)
alpha (8-13 Hz)
theta (4-8 Hz)
delta (0.5-4 Hz)
figure [2.2] Brain wave samples with dominant frequencies belonging to beta, alpha, theta, and delta band.

2.4 Brain Waves and EEG The analysis of brain waves plays an important role in diagnosis of different brain
disorders. Brain is made up of billions of brain cells called neurons, which use electricity
to communicate with each other. The combination of millions of neurons sending signals
at once produces an enormous amount of electrical activity in the brain, which can be
detected using sensitive medical equipment such as an EEG which measures electrical
levels over areas of the scalp. The electroencephalogram (EEG) recording is a useful
tool for studying the functional state of the brain and for diagnosing certain disorders.
The combination of electrical activity of the brain is commonly called Brainwave
pattern because of its wave-like nature.
EEG signals contain more relevant information about brain disorders and different
types of artifacts. Signals
in the form of dataset are already loaded to the tool so we will be using that signals to
plot the data and visualization of the time-frequency domain plots which can be
displayed all together. Basically we will be monitoring the EEG signals according to the
placement of electrodes which is call edmontages. After that we will observe the EEG
signals to recognize and eliminate different disease relate artifacts. Then unwanted
signal will be subtracted by differential amplifier. Finally we will proceed for the signal
filtering based on the different types of brainwave frequencies to diagnosis and simulate
variety of brain disorders by using MATLAB.
2.5 BRAIN COMPUTER INTERFACE Brain-computer interface is a method of communication based on neural activity
generated by the brain and is independent of its normal output pathways of peripheral
nerves and muscles. The goal of BCI is not to determine a person’s intent by
eavesdropping on brain activity, but rather to provide a new channel of output for the
brain that requires voluntary adaptive control by the user.Further, it is identified four
different application areas of BCI, some which have been mentioned in chapter 3
already:
Bioengineering applications: Devices with assisting purposes for disabled people.
Human subject monitoring: Research and detection of sleep disorders,
neurological
diseases, attention monitoring, and/or overall ”mental state”.
Neuroscience research: real-time methods for correlating observable behavior
with recorded neural signals.
Human-Machine Interaction: Interface devices between humans, computers
or machines.
figure [2.3] Brain computer interface processing steps
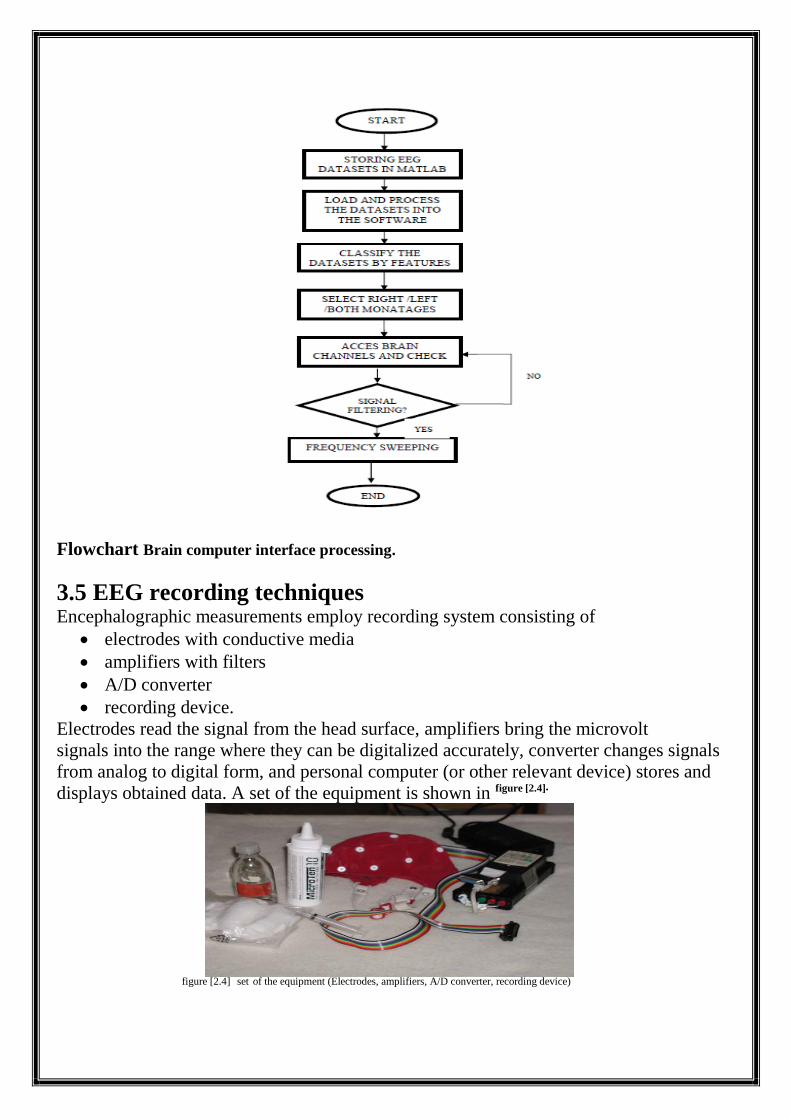
Flowchart Brain computer interface processing.
3.5 EEG recording techniques Encephalographic measurements employ recording system consisting of
electrodes with conductive media
amplifiers with filters
A/D converter
recording device.
Electrodes read the signal from the head surface, amplifiers bring the microvolt
signals into the range where they can be digitalized accurately, converter changes signals
from analog to digital form, and personal computer (or other relevant device) stores and
displays obtained data. A set of the equipment is shown in figure [2.4].
figure [2.4] set
of the equipment (Electrodes, amplifiers, A/D converter, recording device)

Scalp recordings of neuronal activity in the brain, identified as the EEG, allow
measurement of potential changes over time in basic electric circuit conducting between
signal (active) electrode and reference electrode . Extra third electrode, called ground
electrode, is needed for getting differential voltage by subtracting the same voltages
showing at active and reference points. Minimal configuration for mono-channel EEG
measurement consists of one active electrode, one (or two specially linked together)
reference and one ground electrode. The multi-channel configurations can comprise up
to 128 or 256 active electrodes.
2.6 Recording electrodes The EEG recording electrodes and their proper function are critical for acquiring
appropriately high quality data for interpretation. Many types of electrodes exist, often
with different characteristics. Basically there are following types of electrodes:
disposable (gel-less, and pre-gelled types)
reusable disc electrodes (gold, silver, stainless steel or tin)
headbands and electrode caps
saline-based electrodes
needle electrodes
2.7 Amplifiers and filters The signals need to be amplified to make them compatible with devices such as displays,
recorders, or A/D converters. Amplifiers adequate to measure these signals have to
satisfy very specific requirements. They have to provide amplification selective to the
physiological signal, reject superimposed noise and interference signals, and guarantee
protection from damages through voltage and current surges for both patients and
electronic equipment. The basic requirements that a bio potential amplifier has to satisfy
are :
- The physiological process to be monitored should not be influenced in any
way by the
Amplifier.
The measured signal should not be distorted.
The amplifier should provide the best possible separation of signal and
interferences.
The amplifier has to offer protection of the patient from any hazard of
electric shock.
The amplifier itself has to be protected against damages that might result
from high input voltages as
they occur during the application of defibrillators or electrosurgical instrumentation.
The input signal to the amplifier consists of five components:
The desired bio potential, undesired bio potentials, a power line interference signal of
50/60 Hz and its harmonics, interference signals generated by the tissue/electrode
interface, and noise. Proper design of the amplifier provides rejection of a large portion
of the signal interferences. The desired bio potential appears as the differential signal
between the two input terminals of the differential amplifier.

The out signal contain different type of noise it can be removed by using special type
of filter such as impulse filter, gusian filter, low and high band pass filter and band stop
filter.
A high-pass filter is needed for reducing low frequencies coming from bioelectric
flowing potentials (breathing, etc.), that remain in the signal after subtracting voltages
toward ground electrode. Its cut-off frequency usually lies in the range of 0.1-0.7 Hz. To
ensure that the signal is band limited, a low-pass filter with a cut-off frequency equal to
the highest frequency of our interest is used (in the range from 40 Hz up to less than one
half of the sampling rate). Analog low-pass filters prevent distortion of the signal by
interference effects with sampling rate, called aliasing.
figure [2.5] Amplifiers and filters
2.8 Applications The greatest advantage of EEG is speed. Complex patterns of neural activity can be
recorded occurring within fractions of a second after a stimulus has been administered.
EEG provides less spatial resolution compared to MRI and PET. Thus for better
allocation within the brain, EEG images are often combined with MRI scans. EEG can
determine the relative strengths and positions of electrical activity in different brain
regions.
According to R. Bickford [8] research and clinical applications of the EEG in humans
and animals are used to:
(1) monitor alertness, coma and brain death;
(2) locate areas of damage following head injury, stroke, tumour, etc.;
(3) test afferent pathways (by evoked potentials);
(4) monitor cognitive engagement (alpha rhythm);
(5) produce biofeedback situations, alpha, etc.;
(6) control anaesthesia depth (“servo anaesthesia”);
(7) investigate epilepsy and locate seizure origin;
(8) test epilepsy drug effects;
(9) assist in experimental cortical excision of epileptic focus;
(10) monitor human and animal brain development;
(11) test drugs for convulsive effects;
(12) investigate sleep disorder and physiology.

CHAPTER THREE Neural Signal processing by
filtering
3.1 Introduction Whenever frequency analysis is performed, it is desirable that a choice of filter type
should be available to suit the specific application. In acoustics there is a long tradition
for using octave and one third octave-band filters, with standardized filter
characteristics. For vibration analysis, narrow- band spectra based on constant-
bandwidth analysis are usually preferred.
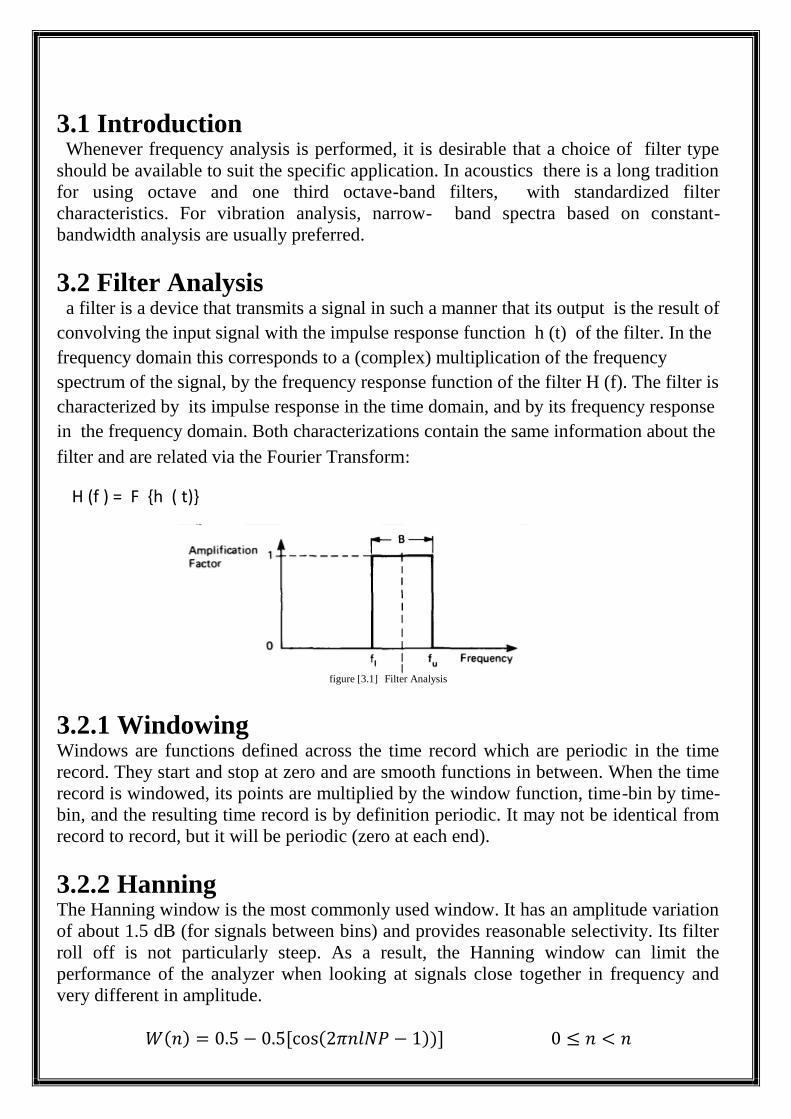
3.2 Filter Analysis a filter is a device that transmits a signal in such a manner that its output is the result of
convolving the input signal with the impulse response function h (t) of the filter. In the
frequency domain this corresponds to a (complex) multiplication of the frequency
spectrum of the signal, by the frequency response function of the filter H (f). The filter is
characterized by its impulse response in the time domain, and by its frequency response
in the frequency domain. Both characterizations contain the same information about the
filter and are related via the Fourier Transform:
H (f ) = F {h ( t)}
figure [3.1] Filter Analysis
3.2.1 Windowing Windows are functions defined across the time record which are periodic in the time
record. They start and stop at zero and are smooth functions in between. When the time
record is windowed, its points are multiplied by the window function, time-bin by time-
bin, and the resulting time record is by definition periodic. It may not be identical from
record to record, but it will be periodic (zero at each end).
3.2.2 Hanning The Hanning window is the most commonly used window. It has an amplitude variation
of about 1.5 dB (for signals between bins) and provides reasonable selectivity. Its filter
roll off is not particularly steep. As a result, the Hanning window can limit the
performance of the analyzer when looking at signals close together in frequency and
very different in amplitude.

figure [3.2] Hanning Side Lobe figure [3.3] Hanning & None Hanning
3.2.3 Flattop The Flattop window improves on the amplitude the Hanning window. Its amplitude
about 0.02 dB. However, the selectivity is Unlike the Hanning, the Flattop window has
very steep roll off on either side. Thus, sign but do not leak across the whole spectrum.
figure [3.4] Flat Top Side Lobe
3.2.4 Blackman-Harris The Blackman-Harris window is a very good with SRS FFT analyzers. It has better
amplitude (about 0.7 dB) than the Hanning, very good the fastest filter roll off. The
filter is steep a reaches a lower attenuation than the other allows signals close together
in frequency to be even when their amplitudes are very different.
figure [3.5] Blackman Side Lobe

3.2.5 Kaiser The Kaiser window has the lowest side-lobes and the least broadening for non-bin
frequencies. Because of these properties, it is the best window to use for measurements
requiring a large dynamic range.
figure [3.6] Kaiser Side Lobe
figure [3.7] rectangular ,flattop, hanning, Kaiser functions.

Summary Using MATLAB for Signal Analysis
-MATLAB is a powerful environment for design and simulation of signal processing
algorithms
-Signal analysis and visualization tools
-Signal processing operations and algorithms
-Digital filter design and implementation
-Interfaces with hardware and instruments
-Stream processing techniques with system objects
-Application specific tools for Communications, Image/Video Processing, RF, and
Phased Array systems

REFRENCESE
-Clare, M. H., and Bishop, G. H. (1955). Electroencephalog. and Clin. Neurophysiol. 7, 85.
-Wolpaw, J. R., Editor, G., Birbaumer, N., Heetderks, W. J., Mcfarland, D. J., Peckham,
P. H., et al. (2000). Brain – Computer Interface Technology : A Review
of the First International Meeting. IEEE Trans. Rehabil., 8(2), 164–173.
-Zhang, Y., Chen, Y., Bressler, S. L., & Ding, M. (2009). Response preparation and
inhibition: The role of the cortical sensorimotor beta rhythm. Neuroscience,
156:1, 238–246.
- D. Brunet, G. Young et al.. 2000. Electroencephalography, Guidelines for Clinical Practice and
Facility Standards, College of Physicians and Surgeons of Ontario, Canada.
– Theoretical Neuroscience by Dayan and Abbott.