neural tube defect investigation in benton, franklin and ... · neural tube defect investigation in...
TRANSCRIPT

Neural Tube Defect Investigation in Benton, Franklin and Yakima Counties, 2010-2016 September 2017
DOH Pub 210-092 September 2017

Neural Tube Defect Investigation in Benton, Franklin and Yakima Counties, 2010-2016 September 2017
For more information or additional copies of this report contact the Washington State Department of Health:
Cathy Wasserman Office of the State Health Officer, Non-Infectious Conditions Epidemiology (360) 236-4250 [email protected]
John Wiesman, DrPH, MPH Kathy Lofy, MD Secretary of Health State Health Officer
DOH Pub 210-092 September 2017


Neural Tube Defect Investigation in Benton, Franklin and Yakima Counties, 2010-2016
Washington State Department of Health

i
Table of Contents List of Tables ..................................................................................................................................... iii
List of Figures .................................................................................................................................... iv
Executive Summary ............................................................................................................................1
Background .......................................................................................................................................4
Methods ............................................................................................................................................6
Case Definition and Area of Concern ...............................................................................................6
Surveillance for Neural Tube Defects in the Three-County Area .......................................................6
Surveillance for Neural Tube Defects Statewide ..............................................................................8
Spatial Analysis...........................................................................................................................8
Medical Records-Based Case-Control Study .....................................................................................9
Community Concerns ................................................................................................................... 10
Radiation.................................................................................................................................. 10
Nitrates in Drinking Water ........................................................................................................ 10
Pesticides ................................................................................................................................. 11
Genetics ................................................................................................................................... 12
Fumonisins ............................................................................................................................... 12
Fortification of Corn Masa Flour ................................................................................................ 12
Interviews of Women with Neural Tube Defect-Affected Pregnancies ............................................ 13
Outreach and Prevention ............................................................................................................. 13
Results and Discussion ..................................................................................................................... 15
Surveillance for Neural Tube Defects in the Three-County Area ..................................................... 15
County-Specific Rates ............................................................................................................... 18
Rates by Race and Hispanic Ethnicity ......................................................................................... 18
Rates by Maternal Age .............................................................................................................. 19
Case Ascertainment Concerns ................................................................................................... 20
Surveillance for Neural Tube Defects Statewide ............................................................................ 23
Rates of Anencephaly by Accountable Communities of Health Regions ...................................... 23
Spatial Analysis......................................................................................................................... 25
Medical Records-Based Case-Control Study ................................................................................... 26
Community Concerns ................................................................................................................... 28
Radiation from Fukushima Daiichi Disaster ................................................................................ 28

ii
Radiation from Hanford Site ..................................................................................................... 29
Nitrates in Drinking Water ........................................................................................................ 29
Pesticides ................................................................................................................................. 32
Genetics ................................................................................................................................... 36
Fumonisins ............................................................................................................................... 36
Fortification of Corn Masa Flour ................................................................................................ 37
Interviews of Women with Neural Tube Defect-Affected Pregnancies ............................................ 37
Interview Response .................................................................................................................. 37
Characteristics of Interviewees ................................................................................................. 38
Vitamin Use and Dietary Factors ............................................................................................... 41
Medication Use ........................................................................................................................ 44
Drinking Water ......................................................................................................................... 45
Occupational Exposures and Household Pesticide Use ............................................................... 46
Any Risk Factor for Neural Tube Defects .................................................................................... 48
Outreach and Prevention ............................................................................................................. 49
Families and Women of Reproductive Age in Three-County Area and Statewide ........................ 49
Activities to Address Community Concerns in Three-County Area .............................................. 50
Hospitals and Healthcare Providers ........................................................................................... 50
Qualitative Interviews .............................................................................................................. 51
Conclusions ..................................................................................................................................... 56
Future Efforts................................................................................................................................... 56
Glossary........................................................................................................................................... 58
References ....................................................................................................................................... 59
Appendix A: Project Team ................................................................................................................ 65
Appendix B: Advisory Committee ..................................................................................................... 66
Appendix C: Timeline ....................................................................................................................... 67
Appendix D: Case Abstraction Form .................................................................................................. 72
Appendix E: Letter in Support of Fortification of Corn Masa Flour .......................................................... 74

iii
List of Tables Table 1: Hospital Facilities............................................................................................................................. 6 Table 2: Diagnostic Codes Used to Detect Neural Tube Defects in Medical Records .................................. 7 Table 3: Clinics Participating in Case-Control Study ..................................................................................... 9 Table 4: Neural Tube Defects in the Three-County Area by Year of Delivery, 2010-2017 ......................... 16 Table 5: Neural Tube Defects by County of Residence ............................................................................... 18 Table 6: Neural Tube Defects (NTD) by Maternal Race and Ethnicity, Three-County Area ........................ 19 Table 7: Neural Tube Defects (NTD) by Maternal Age at Delivery ............................................................. 20 Table 8: Gestational Age at Delivery of Neural Tube Defect-Affected Pregnancies Based on Source of
Information, Three County Area, 2010-2017................................................................................. 22 Table 9: Gestational Age at Delivery of Anencephaly-Affected Pregnancies Based on Source of
Information, Three-County Area and Texas .................................................................................. 22 Table 10: Gestational Age at Delivery of Anencephaly-Affected Pregnancies among Hispanic Women
Based on Source of Information, Three-County Area, and California and Texas Combined ..... 23 Table 11: Washington State Rates of Anencephaly1 per 10,000 Live Births by Accountable
Communities of Health Regions, 2005-2015 .............................................................................. 24 Table 12: Odds Ratios for Maternal Characteristics among Anencephaly-Affected Pregnancies
(Cases) and Healthy Pregnancies (Controls), January 2010- January 2013 ................................ 26 Table 13: Odds Ratios of Pregnancy Risk Factors Among Women with Anencephaly-Affected Pregnancies
(Cases) and Healthy Pregnancies (Controls), 2010-2013............................................................ 27 Table 14: Nitrate Levels (mg/L) in Public Water Systems Serving Residences of Women with Neural
Tube Defect-Affected Pregnancies, 2010-2017 .......................................................................... 30 Table 15: Nitrate Levels (mg/L) of Public Water Systems and Private Wells Serving Residences of Women
with NTD-Affected Pregnancies, 2010-2017 .............................................................................. 31 Table 16: Distance (Meters) from Agriculture to Residences of Women with and without Neural
Tube Defect (NTD)-Affected Pregnancies, Three-County Area, 2010-2014 ............................... 34 Table 17: Parental Occupation from Birth and Fetal Death Certificates, Three-County Area 2010-2015 . 35 Table 18: Women with Neural Tube Defect- (NTD) Affected Pregnancies Approached for Interview,
Three-County Area ..................................................................................................................... 37 Table 19: Phase 1 and 2 Contact Responses, Three-County Area .............................................................. 38 Table 20: Gestational Age Based on Source of Information of Interviewed Women with Neural Tube
Defect-Affected Pregnancies, Three-County Area ..................................................................... 38 Table 21: Characteristics of Interviewed Women with Neural Tube Defect-Affected Pregnancies and
Live Births, Three-County Area ................................................................................................... 39 Table 22: Characteristics of Interviewed Women with Neural Tube Defect-Affected Pregnancies,
Three County Area, 2012-2015 and Texas and California, 2004-2013 ....................................... 40 Table 23: Vitamin Use and Folic Acid Supplementation, Interviewed Women with a Neural Tube
Defect-Affected Pregnancy, Three County Area ........................................................................ 41 Table 24: Reported Folic Acid Supplementation of Interviewed Women with Neural Tube Defect-
Affected Pregnancies, Three County Area, 2012-2015 and Texas and California, 2004-2011 ... 42 Table 25: Dietary Folate Intake of Interviewed Women with Neural Tube Defect-Affected
Pregnancies, Three County Area, 2012-2015 and Texas and California, 2004-2011 ................. 43
iv
Table 26: Medication Use of Interviewed Women with Neural Tube Defect-Affected Pregnancies in the Three-County Area ............................................................................................................... 44
Table 27: Drinking Water of Interviewed Women with Neural Tube Defect-Affected Pregnancies, Three County Area, 2012-2015 and Texas and California, 2004-2011 ....................................... 45
Table 28: Drinking Water Consumption of Interviewed Women with Neural Tube Defect-Affected Pregnancies in the Three-County Area ....................................................................................... 46
Table 29: Peri-conceptional Employment and Associated Potential Occupational Exposures of Interviewed Women with Neural Tube Defect-Affected Pregnancies in the Three-County Area............................................................................................................................................. 47
Table 30: Potential Exposures from Household Pesticide Use among Interviewed Women with Neural Tube Defect-Affected Pregnancies in the Three-County Area ................................................... 48
Table 31: Locations Where Women of Childbearing Age Were Identified and Participated in Qualitative Interviews................................................................................................................. 51
Table 32: Interviewee Demographics ......................................................................................................... 52 Table 33: Summary of preferences for receiving health information ........................................................ 53
List of Figures Figure 1: Overview of Investigation into Reported Cluster of Anencephaly and Other Neural Tube
Defects............................................................................................................................................ 5 Figure 2: Folic Acid Outreach Plan .............................................................................................................. 14 Figure 3: Number of Neural Tube Defects by Month and Year of Delivery ................................................ 17 Figure 4: Neural Tube Defects in the Three-County Area by Month of Delivery, 2010-2017 .................... 17 Figure 5: Prevalence of Anencephaly in Three-County Area (2010-2015) and National Birth Defects
Prevention Network (2007-2011) ................................................................................................ 21 Figure 6: Washington State Rates of Anencephaly1 per 10,000 Live Births by Accountable
Communities of Health Regions, 2005-2015................................................................................ 24 Figure 7: Anencephaly 2005-2014: Most Likely Spatio-Temporal Cluster .................................................. 25 Figure 8: Distance (Meters) from Agricultural Fields to Residences of Women with Neural Tube
Defect-Affected Pregnancies and all Live Births in Three-County Area, 2010-2014 .................... 34 Figure 9: Who do you trust for health information? .................................................................................. 53 Figure 10: Who in your life impacts the health decisions you make for you and your child? .................... 54
1
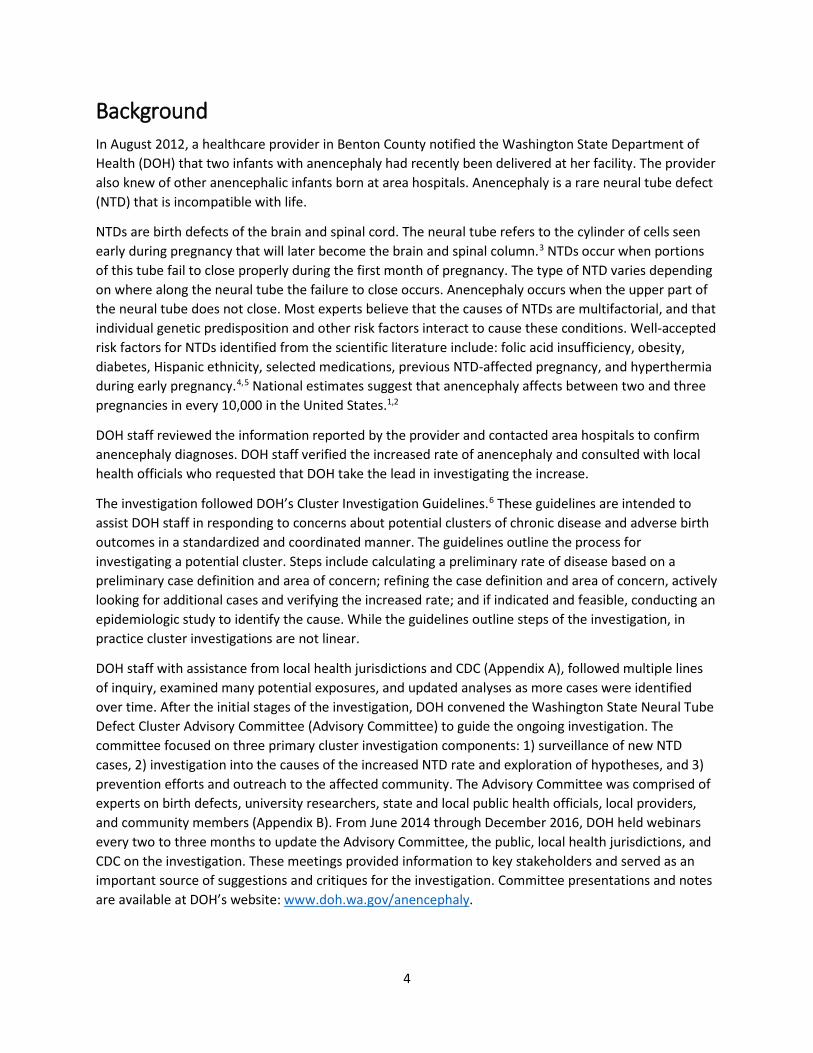
Executive Summary In August 2012, a healthcare provider in Benton County notified the Washington State Department of Health (DOH) that two infants with anencephaly had recently been delivered at her facility. The provider also knew of other anencephalic infants born at area hospitals. Anencephaly is a rare neural tube defect (NTD) that is always fatal. National estimates suggest between two and three pregnancies in every 10,000 are affected by anencephaly1,2 DOH staff reviewed the information reported by the provider and contacted area hospitals to confirm anencephaly diagnoses. DOH staff verified the increased rate of anencephaly and consulted with local health officials who requested that DOH take the lead in investigating the increase.
DOH initiated an investigation into NTDs in Benton, Yakima and Franklin counties. The investigation followed the DOH cluster investigation guidelines. These guidelines are intended to assist DOH staff in responding to concerns about potential clusters of chronic disease and adverse birth outcomes in a standardized and coordinated manner. While the guidelines outline steps in a cluster investigation, in practice, the process is rarely linear. DOH requested technical assistance from CDC and in November 2012 DOH began active disease surveillance to identify NTD-affected pregnancies after December 2009 among residents of the three-county area. This active surveillance involved working with a local perinatology clinic and six area hospitals to identify potential NTD-affected pregnancies, which were then confirmed by ultrasound, pathology or physical exam. Additionally, in conjunction with local health jurisdictions and CDC, DOH staff used medical records to compare NTD-affected pregnancies (cases) from January 2010 to January 2013 to pregnancies during the same time period that were not affected by a birth defect (controls).
This case-control study confirmed the increased rate of NTDs and the predominance of anencephaly. The study provided initial descriptive epidemiologic information on the NTD-affected pregnancies, but did not identify a specific cause of the increase. However, the study showed that both women with NTD-affected pregnancies and with pregnancies not affected by a birth defect had low folic acid use in early pregnancy. Folic acid supplementation before and during early pregnancy has been shown to prevent NTDs. The Pregnancy Risk Assessment Monitoring System (PRAMS), an ongoing survey of postpartum women in Washington, confirmed low folic acid supplementation in the three-county area compared to the rest of Washington.
Subsequently, DOH convened the Washington State Department of Health Neural Tube Defect Cluster Advisory Committee (Advisory Committee) to guide the ongoing investigation. The Advisory Committee included experts on birth defects, university researchers, state and local public health officials, local providers, and community members. From June 2014 through December 2016, DOH held webinars every two to three months to update the Advisory Committee, the public, local health jurisdictions, and CDC on the progress of the investigation. These meetings provided information to key stakeholders and served as an important source of suggestions and critiques for the investigation and prevention of NTDs in the three-county area. Committee presentations and notes are available at DOH’s website: www.doh.wa.gov/anencephaly. The committee reviewed findings to date and focused their inquiry on three primary investigation components:

2
• Surveillance of new NTDs. Surveillance in the three-county area included continuing to encourage providers and hospitals to report NTD-affected pregnancies and identifying potential NTD-affected pregnancies using administrative records. All potential NTD-affected pregnancies in the three-county area were then confirmed. Statewide surveillance relied on administrative records with no confirmation and compared rates in Accountable Communities of Health regions and using spatial analysis software. For 2010-2015, DOH staff identified 64 NTD-affected pregnancies in the three-county area, including 41 anencephaly-affected pregnancies. The rate of anencephaly was 8.2 per 10,000 live births. This rate is high compared with national estimates of two to three per 10,000.1,2 Anencephaly comprised about two-thirds of the NTDs, while nationally, spina bifida is more common. Statewide surveillance indicated that relatively high levels of anencephaly-affected pregnancies might affect areas in central and eastern Washington in addition to the three-county area. However, these differences might be due to differences in termination of pregnancy after diagnosis, lack of diagnostic confirmation, or other factors and might not indicate real differences in rates of NTD-affected pregnancies.
• Investigation into the causes of the increased NTD rate and exploration of hypotheses. This part of the investigation focused on potential exposures to pesticides, radiation and nitrates in drinking water, and interviews of women with affected pregnancies. This part of the investigation involved multiple approaches such as interviewing women with NTD-affected pregnancies using a modified National Birth Defects Prevention Study questionnaire; reviewing available information on nitrates in water systems serving women in the three-county area; and assessing potential exposure to pesticides by exploring regional use of pesticides associated with NTDs, residential proximity to agriculture and parental occupations. The questionnaire included questions on prenatal vitamins, dietary folic acid, medication history, occupation, drinking water, and residential pesticide use. None of these analyses identified a potential cause of the elevated rate of NTD and anencephaly in the three-county area.
• Outreach to the affected community for prevention of NTDs. The project team collaborated with local health partners and the March of Dimes on several prevention and outreach activities. Efforts focused on promoting folic acid use prior to pregnancy and targeted women of reproductive age, healthcare providers and the public in the three-county area as well as statewide. Activities included media outreach promoting preconception folic acid use, fact sheet and resource material development and distribution, publicity of Medicaid coverage of prenatal vitamins for women of reproductive age, and partnership with the non-profit agency Vitamin Angels to make free prenatal vitamins available in the three-county area. Additionally, we conducted qualitative interviews with women in area parks to learn the best ways to get information about folic acid to women of reproductive age in the three-county area. These interviews suggested three strategies including working with healthcare providers to incorporate folic acid education into appointments with all patients of childbearing age; running bilingual folic acid awareness ads on Facebook and Instagram; and using local media strategically to share updates about the anencephaly investigation and folic acid information.
Conclusions The investigation revealed that rates of anencephaly in the three-county area of Benton, Franklin and Yakima counties were high compared with published aggregated multi-state rates. However, state rates using a variety of methods to identify NTD-affected pregnancies show large variability. It is likely that the enhanced surveillance resulted in more complete identification of NTD-affected pregnancies early in

3
pregnancy in the three-county area compared to other locations, resulting in some exaggeration in the size of the observed increase. The investigation showed an unusual predominance of anencephaly among all NTDs.
Neither the descriptive epidemiology of the anencephaly-affected pregnancies, the medical records-based case-control study of pregnancies from January 2010-January 2013, interviews of mothers of NTD-affected pregnancies, nor investigation of community concerns identified a preventable cause for most of the NTD-affected pregnancies. However, the medical records-based case-control study and PRAMS showed low folic acid use in early pregnancy in the three-county area compared to the rest of Washington. As a result of this finding and the link between NTDs and folic acid supplementation, outreach for prevention focused on promoting folic acid use prior to pregnancy.
After discussion with health officials from Yakima Health District and Benton-Franklin Health District, and with the support of the Advisory Committee in late 2016, DOH suspended additional investigation into the cause of the elevated rate of anencephaly. We are focusing public health efforts related to NTDs on surveillance, outreach and prevention. Routine surveillance for NTDs in Washington State includes passive surveillance based on hospital discharge diagnoses. In addition to the routine surveillance of NTDs statewide, DOH will continue the enhanced surveillance of NTDs in the three-county area until January 2018. At that time, DOH will revisit whether to continue enhanced surveillance. DOH will incorporate the lessons learned from qualitative interviews, and continue to integrate NTD prevention into ongoing health education and system-wide efforts to promote the preconception and pregnancy health of all women and their children.
4
Background In August 2012, a healthcare provider in Benton County notified the Washington State Department of Health (DOH) that two infants with anencephaly had recently been delivered at her facility. The provider also knew of other anencephalic infants born at area hospitals. Anencephaly is a rare neural tube defect (NTD) that is incompatible with life.
NTDs are birth defects of the brain and spinal cord. The neural tube refers to the cylinder of cells seen early during pregnancy that will later become the brain and spinal column.3 NTDs occur when portions of this tube fail to close properly during the first month of pregnancy. The type of NTD varies depending on where along the neural tube the failure to close occurs. Anencephaly occurs when the upper part of the neural tube does not close. Most experts believe that the causes of NTDs are multifactorial, and that individual genetic predisposition and other risk factors interact to cause these conditions. Well-accepted risk factors for NTDs identified from the scientific literature include: folic acid insufficiency, obesity, diabetes, Hispanic ethnicity, selected medications, previous NTD-affected pregnancy, and hyperthermia during early pregnancy.4,5 National estimates suggest that anencephaly affects between two and three pregnancies in every 10,000 in the United States.1,2
DOH staff reviewed the information reported by the provider and contacted area hospitals to confirm anencephaly diagnoses. DOH staff verified the increased rate of anencephaly and consulted with local health officials who requested that DOH take the lead in investigating the increase.
The investigation followed DOH’s Cluster Investigation Guidelines.6 These guidelines are intended to assist DOH staff in responding to concerns about potential clusters of chronic disease and adverse birth outcomes in a standardized and coordinated manner. The guidelines outline the process for investigating a potential cluster. Steps include calculating a preliminary rate of disease based on a preliminary case definition and area of concern; refining the case definition and area of concern, actively looking for additional cases and verifying the increased rate; and if indicated and feasible, conducting an epidemiologic study to identify the cause. While the guidelines outline steps of the investigation, in practice cluster investigations are not linear.
DOH staff with assistance from local health jurisdictions and CDC (Appendix A), followed multiple lines of inquiry, examined many potential exposures, and updated analyses as more cases were identified over time. After the initial stages of the investigation, DOH convened the Washington State Neural Tube Defect Cluster Advisory Committee (Advisory Committee) to guide the ongoing investigation. The committee focused on three primary cluster investigation components: 1) surveillance of new NTD cases, 2) investigation into the causes of the increased NTD rate and exploration of hypotheses, and 3) prevention efforts and outreach to the affected community. The Advisory Committee was comprised of experts on birth defects, university researchers, state and local public health officials, local providers, and community members (Appendix B). From June 2014 through December 2016, DOH held webinars every two to three months to update the Advisory Committee, the public, local health jurisdictions, and CDC on the investigation. These meetings provided information to key stakeholders and served as an important source of suggestions and critiques for the investigation. Committee presentations and notes are available at DOH’s website: www.doh.wa.gov/anencephaly.

5
This report details the activities undertaken based on findings through September 23, 2016. Figure 1 provides an overview of the investigation with a detailed chronology listed in Appendix C.
Figure 1: Overview of Investigation into Reported Cluster of Anencephaly and Other Neural Tube Defects.
• August 2012: Benton County healthcare provider notified DOH of concern about anencephaly.
• DOH confirms high rate of anencephaly using preliminary case definition and preliminary geographic area of concern.
• Project team refines case definition and geographic area of concern and initiates active case finding.
• Team confirms high rate of anencephaly. Prevention activities
• December 2012 – July 2013, project team designs and conducts case-control study using information from medical records.
Prevention activities
• July 2013 – February 2014, project team continues monitoring NTDs.
• Rates of anencephaly continue to be high.
Prevention activities
May 2014 – Community listening sessions and other public comment identify concerns: • Nitrates in drinking water • Pesticides • Radiation • Fumonisins • Genetic factors • Folic acid fortification of corn
masa flour
June 2014 – Advisory Group convened. Over time, group recommends: • Interviewing women with pregnancies resulting in
anencephaly to compare to national data. o Include questions to address concerns about
pesticides and fumonisins. • Assessing nitrates in drinking water of women with
NTD-affected pregnancies. • Consulting experts to learn more about potential
exposures to radiation and genetic factors. • Continuing outreach for prevention of NTDs.
• Passive surveillance with active follow-up through December 2017.
Prevention activities

6
Methods
Case Definition and Area of Concern The project team defined a case of anencephaly as a fetus or live born infant with a diagnosis of anencephaly after December 31, 2009 that was confirmed by ultrasound, pathology report or physical exam at delivery and conceived by a woman who was a Washington state resident living in Benton, Franklin or Yakima counties at the time of conception. The decision to limit the investigation to the three counties was based on referral patterns of prenatal care providers in the area where cases were first identified by the healthcare provider who notified DOH to a possible cluster. The team further defined a NTD case as a fetus or infant with a diagnosis of anencephaly, open spina bifida or encephalocele after December 31, 2009 that was confirmed by ultrasound, pathology report or physical exam at delivery and conceived by a woman who was a state resident living in Benton, Franklin or Yakima counties at the time of conception. The broader definition of NTD was included to determine if there were increased rates of other types of NTDs in the three-county area.
Surveillance for Neural Tube Defects in the Three-County Area Case finding initially used a combination of passive and active surveillance methods. DOH contacted a local perinatology office in Benton County to obtain a list of women who were seen from 2010 to 2012 and had a diagnosis of an NTD-affected pregnancy. DOH also contacted seven area hospitals (Table 1) and provided International Classification of Diseases Ninth Revision Clinical Modifications (ICD-9-CM) codes (Table 2) to be run against their medical records to identify possible NTD cases who had been seen at the hospital. Finally, DOH searched birth certificates and fetal death certificates for ”anencephaly” or “spina bifida” coded as a malformation on the certificate. Encephalocele was not included, because it cannot be identified from birth certificates. These efforts identified potential cases which, when confirmed by ultrasound, pathology or physical exam, provided the baseline numbers to begin the investigation.
Table 1: Hospital Facilities
Birth Facility County Kadlec Regional Medical Center Benton Lourdes Health1
PMH Medical Center Franklin Benton
Sunnyside Memorial Hospital Yakima
Toppenish Community Hospital Yakima
Trios Health Care Center Benton
Yakima Valley Memorial Hospital Yakima 1 Lourdes Hospital discontinued obstetric services January 2013.

7
Table 2: Diagnostic Codes Used to Detect Neural Tube Defects in Medical Records1,2
Condition ICD-9-CM Code ICD-10-CM Code
Anencephaly 740.0-740.2 Q00.0-Q00.2
Spina bifida 741.0-741.93 Q05.0-Q05.9
Encephalocele 742.0 Q01.0-Q01.9
Known/suspected central nervous system malformation affecting management of mother 655.0 O35.0XX0 -O35.0XX9
Single/multiple gestation stillbirth V27.1-V27.7 .
D&C following termination of pregnancy, delivery, or abortion 69.01-69.02 .
Aspiration curettage of uterus for termination of pregnancy, delivery or abortion 69.51-69.52 .
Hysterectomy to terminate pregnancy 74.91 .
Intra-amniotic injection for abortion 75.0 . 1 ICD-9-CM codes were used prior to October 1, 2015, when ICD-10-CM became the diagnostic coding standard. We did not continue using codes in the bottom half of the chart after February 2013. These codes are not specific to neural tube defects (NTD) and most of the potential NTDs identified by these codes were not confirmed as NTDs. 2 The codes in the top half of the table were later used to identify potential NTDs from hospitalization records in the Comprehensive Hospital Abstract Reporting System and linked birth-hospitalization file.
To continue monitoring and capturing information on new NTD-affected pregnancies throughout the investigation, DOH encouraged providers in the three county-area to report women in their practices with NTD-affected pregnancies. Current state regulations only require hospital facilities, not individual providers, to report newly diagnosed NTDs. DOH staff also reviewed administrative records, including birth, fetal death, hospitalization and linked birth-hospitalization files. For records in the linked birth-hospitalization dataset that contained the ICD-9-CM or ICD-10-CM codes in the top section of Table 2, or if the malformation codes for anencephaly or spina bifida were listed on birth or fetal death files, we requested the associated birth, death or fetal death certificates from the Washington State Center for Health Statistics. These certificates provided additional demographic and facility information. Importantly, by law only pregnancies of 20 weeks’ gestation or longer are required to be recorded as fetal deaths or live births; no certificate of any type is required for pregnancies that end sooner. NTDs identified by these passive surveillance methods were considered to be potential cases until medical records from the associated healthcare facility confirmed the diagnosis by ultrasound, pathology report or physical exam. Medical records included face sheets, history and physical information, and any pregnancy-related diagnostic testing used to identify the NTD in question, including ultrasound reports, pathology reports and other records.
In addition, DOH staff contacted the seven local hospitals with obstetric facilities in the three-county area (Table 1) each quarter to gather information on newly diagnosed NTDs. Hospital staffs were asked to review discharge diagnoses (Table 2) and complete a case abstraction form (Appendix D), which they could fax to DOH if an NTD came to their attention between scheduled quarterly surveillance calls. In addition to the case abstraction form, hospital staff provided information from medical records as described above.

8
We calculated NTD and anencephaly prevalence rates per 10,000 live births. In addition to the overall rate for the three counties, we calculated rates by maternal age, race and Hispanic ethnicity, county of residence, and gestational age based on ascertainment source. When available, we used birth and fetal death certificates to determine maternal county of residence, race and Hispanic ethnicity; when not available, we used information from the medical record. We also collected maternal date of birth from the medical record.
We assessed the distribution of cases by month and season based on date of delivery when the delivery occurred at 37 or more weeks’ gestation, and the estimated due date when the pregnancy ended before 37 weeks, or the woman was pregnant at the end of the investigation. Ideally, DOH staff would have explored the distributions by the last menstrual period, because this date is closer to the first month of gestation when NTDs occur. However, the last menstrual period was not available for all NTD-affected pregnancies.
Surveillance for Neural Tube Defects Statewide To address whether the increase in anencephaly rates existed in Washington beyond the three-county area, NTDs noted at delivery were identified for 2005-2012 using the linked birth, fetal death and hospitalization file, and for 2013-2015 using birth and fetal death files as the linked file was not complete. Cases were included if a hospital discharge record had an ICD-9-CM or ICD-10-CM diagnosis code specific to NTDs (codes in top section of Table 2) or a certificate identified anencephaly or spina bifida. Neither the maternal diagnosis code nor the pregnancy codes (bottom section of Table 2) could be used because these codes are not specific to NTDs. We did not have resources to review and confirm NTDs identified by these methods. Thus, some NTDs may have been missed and some infants may not have had an NTD. Additionally, these records only include births and fetal deaths after 20 weeks’ gestation, so early miscarriages or pregnancy terminations are not included. We included only in-state residents and obtained geocoded addresses for these cases from the Center for Health Statistics. We grouped cases by Accountable Communities of Health (ACH) regions, because the number of cases in most counties would be too low for meaningful analysis by county. We calculated NTD and anencephaly prevalence rates per 10,000 live births.
Spatial Analysis DOH staff conducted spatio-temporal analyses to look for clusters of anencephaly and other NTDs statewide using SaTScan (v9.4.4)7. One of the challenges with cluster investigations is called preselection bias. When we receive a cluster report, we want to assess whether the cluster has arisen by chance or is truly elevated compared to the state rate. However, we define the cluster boundaries based on the report of cases, and are therefore more likely to find an elevated rate. One way to address this bias is to use cluster identification software which can scan spatial and spatio-temporal areas to detect clusters. SaTScan uses a moving window, with varying diameter, to detect rates of anencephaly and NTDs that are statistically significantly elevated in time and space. The Bernoulli model determines if there is significant clustering of the cases compared to controls8. A likelihood ratio test is used to determine the probability of a case versus control at each window location and size. For this analysis, statewide cases were identified as noted above for 2005-2014. Controls included all live births during the same period obtained from the birth files. We used geocoded addresses aggregated to the census block group level.

9
Medical Records-Based Case-Control Study After initial case ascertainment and the discovery of higher than expected anencephaly rates, DOH notified CDC and requested epidemiologic assistance known as an Epi-Aid to help with investigating potential causes of the increased rate of anencephaly, and potentially NTDs meeting the broader case definition, in the three-county area. The team designed a study that used information from medical records to compare characteristics of women with NTD-affected pregnancies diagnosed from January 1, 2010 through January 31, 2013 (cases) and women who were pregnant during the same time period and whose pregnancies had no indication of a birth defect, which we refer to hereafter as healthy pregnancies (controls).
The case-control study protocol included visiting prenatal clinics (Table 3) where women with NTD-affected pregnancies had sought care to identify healthy control pregnancies. DOH staff randomly selected four healthy pregnancies matched to each NTD-affected pregnancy by month and year of last menstrual period, using probability sampling proportionate to size of the clinic population. All women must have been residents of Benton, Franklin or Yakima counties at the time of their last menstrual periods prior to pregnancy, and the last menstrual period must have occurred between August 2009 and January 2013.
Table 3: Clinics Participating in Case-Control Study Clinic Name County
Arbor Healthcare for Women Benton Central Washington Family Medicine Yakima Generations OB/GYN Yakima Grandview Medical Center Yakima Kadlec Associated Physicians for Women Benton Mid-Columbia Women’s Health Center Benton Tri Cities Community Health (La Clinica) Franklin Yakima Valley Farmworkers Clinics Yakima Yakima Women’s Health Yakima
The project team reviewed and abstracted information from medical records of women with NTD-affected pregnancies and with healthy pregnancies. Abstracted information included:
• Sociodemographic characteristics: age, race and Hispanic ethnicity, highest educational level, occupation, country of birth.
• Residential address during pregnancy, prior addresses and dates of residence. • Smoking and alcohol use before and during pregnancy as noted in the medical record. • Health conditions during pregnancy: diabetes, anemia, infectious disease. • Pregnancy history: number of previous pregnancies and their outcomes, number of previous live
births, and other relevant pregnancy history information. • Medication use noted in the record: prescription drugs, over-the-counter medications, vitamin
use, folic acid supplementation. • Pre-pregnancy weight and height. In addition to medical records, staff used parental occupation from the birth or fetal death certificates when available.

10
We calculated odds ratios and 95% confidence intervals using logistic regression controlling for seasonality to explore differences between cases and controls on a variety of potential risk factors. We adjusted for seasonality as we had not retained the information necessary for a matched analysis. An odds ratio greater than one shows increased risk for disease associated with the factor, while an odds ratio less than one shows decreased risk for disease. Odds ratios are presented with 95% confidence intervals to show random variability. Confidence intervals that include one are not statistically significant. Analyses were completed for all NTD-affected pregnancies combined and separately for anencephaly-affected pregnancies.
Community Concerns DOH staff worked with Yakima Health District and Benton-Franklin Health District to hold listening sessions in May 2014 in Kennewick and Sunnyside to learn community members’ concerns and ideas about the cluster. Dates and times of listening sessions were communicated through newspaper, television and radio announcements. The results of these listening sessions helped to guide further investigation. The most frequently raised concerns included radiation exposure from the March 2011 Fukushima Daiichi nuclear disaster in Japan, radiation exposure from the Hanford Site, nitrates in drinking water and pesticide exposures. In addition to these concerns, community members, healthcare providers, Advisory Committee members and others raised concerns about potential exposure to fumonisins, genetics and lack of folic acid fortification of corn masa flour.
Radiation To explore concerns related to Fukushima, DOH staff consulted with the DOH radiation program on radiation detection off the Washington coast after the disaster. DOH staff also consulted with the DOH radiation program about radiation releases from Hanford and possible water contamination from 2010 to the time of the investigation.
Nitrates in Drinking Water To explore concerns related to nitrates in drinking water, DOH staff used county tax assessor parcel data to determine whether maternal residences were on public or private water systems. Using residential addresses from the medical records based case-control study, DOH initially compared the proportions of women with NTD-affected and healthy pregnancies on each type of system. We hypothesized that private water systems would be more likely than public systems to have high levels of nitrates. DOH subsequently updated this information for all women with NTD-affected pregnancies.
DOH also used public water system mapping and periodic water quality data to explore nitrate concentrations in water systems likely to serve residences of women with NTD-affected pregnancies whose residences were on public water supplies. We used the Source Water Assessment Program (SWAP) mapping tool to identify the specific public water system that most likely served women with NTD-affected pregnancies.9 We used SWAP to see the coverage area of public water systems, because most tax assessor records do not include comprehensive information on what specific water system services each home. If a woman’s address fell within the area served by a specific water system, DOH staff considered that system to be their most likely source of drinking water.
Once a residence’s most likely water system was identified, DOH staff used the DOH Office of Drinking Water’s Find Water Quality tool to look up results of nitrate testing for that system from three months before to one month after conception for each NTD-affected pregnancy.10 This time frame includes the

11
critical time period for neural tube development. If there was no information on nitrate testing during that time period, we used the measure closest to that period. Where multiple measurements were available within the four-month period, DOH staff selected the highest recorded nitrate concentration. DOH staff also estimated drinking water nitrate concentrations for residences of women with NTD-affected pregnancies on private wells. DOH staff used the highest nitrate concentration from the closest public water system during the four-month time period as an estimate of the nitrate concentration of the private well.
Nitrate concentrations are measured in milligrams per liter of drinking water (mg/L). Concentrations less than five mg/L are below the level for public health action. Concentrations between five and 10 mg/L are elevated and trigger more frequent monitoring, but are not above the U.S. Environmental Protection Agency’s (EPA) Maximum Contaminant Level (MCL) for nitrates.11 The MCL is the legal limit on the amount of a substance allowed in public drinking water under the Safe Drinking Water Act. It is generally set by the EPA at the level below which the contaminant does not affect health. Concentrations of 10 mg/L or greater are above EPA’s MCL.
Pesticides DOH staff used three approaches to look into potential pesticide exposures as a cause of increased rates of anencephaly in Benton, Franklin and Yakima counties. These included assessing:
• Potential regional exposure to pesticides associated with NTDs in epidemiologic investigations. • Residential proximity to agriculture. • Parental occupations.
Potential regional exposure to pesticides associated with NTDs. A review of the epidemiology literature revealed that while several studies reported an increased risk for NTDs associated with agriculture or pesticide use, very few studies pointed to specific pesticides of concern for NTDs.12,13,14,15,16,17 A 2014 study in California, however, examined the risk for NTDs associated with residential proximity to pesticide applications. The study explored exposure to 461 pesticides, representing 62 distinct chemical groups. Overall, this study found a lack of association between pesticides and NTDs. However, for seven pesticides, women with NTD-affected pregnancies were more likely to live within a 500-meter radius of the area in which a pesticide was used from one month before to two months after conception than were women with unaffected pregnancies.
DOH staff reviewed the seven pesticides found to have an association with increased risk of NTDs in the California paper. Unlike California, Washington State does not require pesticide use reporting and so we relied on the following sources to understand pesticide use and potential exposures in Washington:
• Information on pesticides that are registered by the Washington State Department of Agriculture (WSDA) for use in Washington State from the Pesticide Information Center Online Database at the Washington State Pest Management Resource Service.18 This database does not contain information on actual pesticide use.
• National survey of pesticide use with use estimates by county from the United States Geological Survey.19
• Discussion with experts from the WSDA. • Reports of pesticide drift exposures from the WSDA.

12
• Pesticide test results in drinking water testing from the DOH Office of Drinking Water Sentry Database.20
With this information DOH staff were able to look broadly at national and regional patterns of pesticide use and examine the potential for higher exposure in the three-county area compared to other parts of Washington and other states. DOH staff were also able to assess whether these pesticides were involved in reported drift events or drinking water contamination in the three-county area.
Residential proximity to agriculture. Our second approach looked at residential proximity to agriculture as a proxy for potential pesticide exposure. Staff used geocoded residential addresses for women with NTD-affected pregnancies during 2010-2014. For comparison, staff used maternal residential addresses from birth and fetal death certificates for all other live born infants and fetal deaths from Benton, Franklin and Yakima counties in 2010-2014. DOH staff could not include 2015 because addresses for 2015 births and fetal deaths had not been geocoded. DOH staff excluded three NTD-affected pregnancies and 35 other births and fetal deaths that did not have valid street addresses. These addresses were most commonly listed as post office boxes. DOH staff used the agricultural land use geodatabase from WSDA to determine boundaries of land used to cultivate any type of crop.21 Staff calculated the Euclidean distance from each woman’s residence to the nearest agricultural crop land as a measure of potential pesticide exposure. We assessed the distribution of distances for the NTD-affected pregnancies and the other pregnancies and tested for significant differences in the distance to crop cultivation between groups using 2-sample t-tests.
Parental occupations. We explored the occupation of mothers and fathers of NTD-affected births or fetal deaths for deliveries that occurred at 20 weeks’ gestation or later. DOH staff used the occupations reported on the birth or fetal death certificate and compared this to the occupations reported from all other births in the three-county area from 2010-2015 to see if parents with NTD-affected deliveries were more likely to report farm work or fruit and vegetable packing.
Genetics Community members raised concerns about the potential for genetic predisposition to NTDs during one of our Advisory Committee calls. DOH staff consulted with Susie Ball, a genetics counselor in Yakima and member of the Advisory Committee, to investigate this concern and summarize the medical literature.
Fumonisins Fumonisins are a group of toxins produced by the fungus Fusarium verticillioides that affect maize and corn. Community members and a researcher who has studied fumonisins and neural tube defects raised concerns about fumonisins. We explored this hypothesis by reviewing the literature and the researcher’s hypothesis. As part of the case interviews discussed below, we also added corn tortilla consumption to the food frequency questionnaire.
Fortification of Corn Masa Flour DOH also tracked national efforts around folic acid fortification of corn masa flour. Dr. John Wiesman, Secretary of Health, DOH, and Ms. Dorothy Teeter, Administrator, Washington State Health Care Authority, wrote a letter to the U.S. Food and Drug Administration (FDA) supporting the approval of folic acid fortification of corn masa flour (Appendix E).

13
Interviews of Women with Neural Tube Defect-Affected Pregnancies In consultation with the Advisory Committee, DOH planned to interview women in the three-county area with NTD-affected pregnancies. The study replicated the National Birth Defects Prevention Study (NBDPS) contact and interview methods with slight adaptations.22 The goal was to compare the experiences of these women with women with NTD-affected pregnancies and women with unaffected pregnancies interviewed as part of the NBDPS. The Washington State Institutional Review Board determined this study to be exempt research, and DOH staff began to enroll women in December 2014.
The NBDPS protocol called for waiting six weeks after estimated delivery date to contact women with NTD-affected pregnancies so that all women are reflecting on the same time period, and required interviews be conducted within two years of estimated delivery date to decrease recall inaccuracy. Initially, we followed this protocol beginning with women who had delivered or were due to deliver in December 2012 or later. Securing participation proved challenging and after April 2015, DOH staff began to initiate contact as soon as they learned of newly identified NTD-affected pregnancies.
To initiate the interview process, primary care providers contacted women and informed them of the study. If they agreed to participate, members of the DOH Pregnancy Risk Assessment Monitoring System (PRAMS) staff contacted them to secure informed consent and conduct a telephone interview. Interviews were scheduled to accommodate the interviewee’s availability, including splitting the interview into multiple sessions, if needed. Interviews took approximately an hour to complete.
Interviewers recorded information on paper printouts of the questionnaire. These were stored in a secure location for later key entry and analysis at CDC. Questions on maternal health and pregnancy history, medication use, nutrition and diet, substance use, demographics, occupation, residential history, water use, and family history of birth defects were adapted from the NBDPS Computer Assisted Telephone Interview (CATI v5.1). The diet and nutrition section of the NBDPS questionnaire includes a food frequency questionnaire in which women report their consumption of key foods. CDC provided estimates of dietary folic acid intake based on responses to the food frequency questionnaire. We added a question on corn tortilla consumption to the food frequency questionnaire. We also added a module for household pesticide use.
To assess occupational exposures, women were asked the name of the company or organization where they worked, their job title, what the company did or produced, how they made those products, any chemicals/substances used in their position, their start and stop dates, as well as the number of hours worked per day and day(s) worked per week. Industrial hygienists from the National Institute of Occupational Safety and Health reviewed each woman’s responses to the occupational questions and classified her potential occupational exposures based on a job exposure matrix that was developed for the NBDPS.23 Findings were compared with NBDPS participants, including women with NTD-affected pregnancies and women with unaffected pregnancies from California and Texas who delivered or were due to deliver from 2004-2011. We limited comparisons to NBDPS participants from California and Texas, because these participants came from agricultural regions of these states and so might make a better comparison group to women from the three-county area than other NBDPS women.
Outreach and Prevention In collaboration with the March of Dimes and local health jurisdictions, DOH undertook a wide variety of activities to raise awareness of the increase in NTDs in the three-county area, and to educate providers

14
and women of reproductive age in these communities and statewide about prevention. As supplementation with folic acid is the only intervention that has been demonstrated to reduce the risk of NTDs, DOH’s primary prevention efforts focused on folic acid supplementation messaging targeted toward women of reproductive age. Early in the response, the March of Dimes distributed public service radio spots in English and Spanish to radio stations in the three-county area, and sent pamphlets to hair and nail salons and community and technical colleges. DOH sponsored folic acid radio spots in English and Spanish, aired a preconception radio novella in Spanish with folic acid messages, and collaborated with the Commission on Hispanic Affairs to air a program in Spanish on the anencephaly investigation. In addition:
• DOH created web pages dedicated to the anencephaly investigation, which carry updated information and prevention messaging for the public and local health jurisdictions.
• Yakima and Benton-Franklin Health Districts alerted medical providers to the increased rate through blast faxes and articles in medical society newsletters emphasizing the importance of folic acid supplementation and testing of private well water for nitrates and bacteria.
• DOH alerted healthcare providers to CDC and March of Dimes educational resources and requested they report NTD-affected pregnancies.
• DOH staff and the Benton-Franklin Health Officer conducted grand rounds at Yakima Memorial Hospital, Kadlec Hospital and the University of Washington on the anencephaly investigation. Grand rounds are training presentations for medical providers and hospital staff to learn about medical problems, treatments and emerging issues.
Over time, DOH staff developed a more comprehensive Folic Acid Outreach Plan, which targeted messaging strategies at three levels – statewide, community-level, and individual healthcare providers/hospitals. (Figure 2)
Figure 2: Folic Acid Outreach Plan

15
In addition to activities specifically related to the investigation, outreach for folic acid supplementation has been an ongoing activity for many programs at DOH, including Women, Infants, and Children Nutrition Program (WIC); Healthy Eating and Active Living Program; and the Access, Systems and Coordination Section of the Division of Prevention and Community Health which works to address issues related to perinatal and women’s health.
To refine outreach methods after initial activities, DOH conducted qualitative interviews with women in convenient locations throughout the three-county region, including area parks, clinics, a La Leche League meeting, farmer’s market, community college, and public library. DOH identified women of reproductive age to interview, including women who were pregnant. Interviewers asked about how women receive health information and the best ways for public health to disseminate information about folic acid, prenatal vitamins and anencephaly. Women who had been pregnant were also asked about folic acid use during pregnancy. DOH staff and students from Central Washington University conducted the interviews in English and Spanish at a variety of locations.
Results and Discussion
Surveillance for Neural Tube Defects in the Three-County Area DOH staff identified 70 infants or fetuses with a confirmed NTD diagnosis whose mothers resided in the three-county area at last menstrual period from January 1, 2010 to September 23, 2016 (Table 4). This count includes 45 anencephaly diagnoses, approximately 64% of all NTDs identified. This proportion of anencephaly among all NTDs is unusual, because the prevalence of spina bifida is usually twice as high as anencephaly.24,25 There were 23 diagnoses of spina bifida and two of encephalocele. The prevalence of all NTDs in the three-county area for 2010-2015 was 12.7 per 10,000 live births (95% CI: 9.8, 16.3). This prevalence ratio is also commonly referred to as a prevalence rate. During this same period the anencephaly prevalence was 8.2 per 10,000 (95% CI: 5.9, 11.1) and the prevalence of spina bifida was 4.2 per 10,000 (95%CI: 2.6, 6.4). Prevalence rates for all NTDs and for anencephaly were elevated compared to multi-state prevalence rates reported in the scientific literature. Parker et al. report a race-adjusted NTD prevalence of 6.4 per 10,000 for 2004-2006, an anencephaly prevalence of 2.1 per 10,000, and a spina bifida prevalence of 3.5 per 10,000.24 More recently, Mai et al. report the mean anencephaly prevalence for 2008-2012 across 38 birth defect registries to be 1.7 per 10,000 live births with 10th and 90th percentiles of 0.3 and 3.0 per 10,000, respectively.25 Based on these data, the increase in overall NTD prevalence in the three-county area is due to the increased prevalence of anencephaly.
The small overall number of NTDs diagnosed each year contributes to year-to-year fluctuations in the annual rates displayed in Table 4. The rates are not statistically different across years. Anencephaly rates are higher than expected each year. Table 4 includes NTDs confirmed through September 23, 2016. Thus, ascertainment for 2016 and 2017 was incomplete. Nonetheless, the number of NTD-affected pregnancies with delivery or estimated delivery in 2016 may be somewhat lower than earlier years given the number of cases identified by September in prior years.

16
Table 4: Neural Tube Defects in the Three-County Area by Year of Delivery, 2010-20171 Number Total Births Rate per
10,000 births 95% Confidence
Interval All Neural Tube Defects 2010 9 8,565 10.5 4.8, 19.9 2011 8 8,528 9.4 4.0, 18.5 2012 10 8,352 12.0 5.7, 22.0 2013 14 8,084 17.3 9.5, 29.1 2014 14 8,432 16.6 9.1, 27.9 2015 9 8,332 10.8 4.9, 20.5 2016 4 N/A . . 2017 2 N/A . .
Total To-Date2 70 . . .
2010 to 2015 64 50,293 12.7 9.8, 16.3
Anencephaly
2010 6 8,565 7.0 2.6, 15.2 2011 4 8,528 4.7 1.3, 12.0 2012 9 8,352 10.8 4.9, 20.5 2013 9 8,084 11.1 5.1, 21.1 2014 8 8,432 9.5 4.1, 18.7 2015 5 8,332 6.0 2.0, 14.0 2016 2 N/A . . 2017 2 N/A . .
Total To-Date2 45 . . .
2010 to 2015 41 50,293 8.2 5.9, 11.1 1 Estimated year of delivery is used for pregnancies terminated or delivered before 37 weeks’ gestation and for those who were still pregnant at the time of the study. 2 Total To-Date includes neural tube defects confirmed by September 23, 2016 with delivery or estimated delivery in 2010-2017.
Figure 3 shows the prevalence of NTDs and NTD subtypes by month and year of delivery or estimated delivery. The highest number of NTDs in a single month was four (September 2010 and May 2014) and the lowest was zero. Deliveries and estimated deliveries occurred relatively evenly across the study time frame with no strongly identified peak. The same is true when looking at each county separately (data not shown).

17
Figure 3: Number of Neural Tube Defects by Month and Year of Delivery1,2
1Estimated month and year of delivery are used for pregnancies terminated or delivered before 37 weeks’ gestation and for those who were still pregnant at the time of the study. 2 Includes neural tube defects confirmed by September 23, 2016 with delivery or estimated delivery in 2010-2017. Figure 4 shows NTD-affected pregnancies by month or estimated month of delivery across the entire study period to explore seasonality. If there were a widespread seasonal exposure to an environmental teratogen (e.g., agricultural chemicals, acute contamination of drinking water sources, etc.) early in pregnancy, there would be a corresponding seasonal increase in the number of NTD-affected deliveries nine months later. This would appear as an elevated number of deliveries in a single month or a few months and correspondingly fewer deliveries in the other months. However, we do not see this pattern. Rather, the number of NTD-affected deliveries and estimated deliveries are spread fairly evenly throughout the year, and we conclude that there is no clear seasonal pattern.
Figure 4: Neural Tube Defects in the Three-County Area by Month of Delivery, 2010-20171,2
1Estimated month of delivery is used for pregnancies terminated or delivered before 37 weeks’ gestation and for those who were still pregnant at the time of the study. 2 Includes neural tube defects confirmed by September 23, 2016 with delivery or estimated delivery in 2010-2017.
0
1
2
3
4
5
Apr 1
0Ju
l 10
Oct
10
Jan
11Ap
r 11
Jul 1
1O
ct 1
1Ja
n 12
Apr 1
2Ju
l 12
Oct
12
Jan
13Ap
r 13
Jul 1
3O
ct 1
3Ja
n 14
April
14
July
14
Oct
14
Jan
15Ap
r 15
July
15
Oct
15
Jan
16Ap
r 16
July
16
Oct
16
Jan
17Ap
r 17
Num
ber
Anencephaly Spina Bifida Encephalocele
0
2
4
6
8
10
12
Jan Feb Mar Apr May Jun Jul Aug Sep Oct Nov Dec
Num
ber
Month
Anencephaly Spina Bifida Encephalocele
18
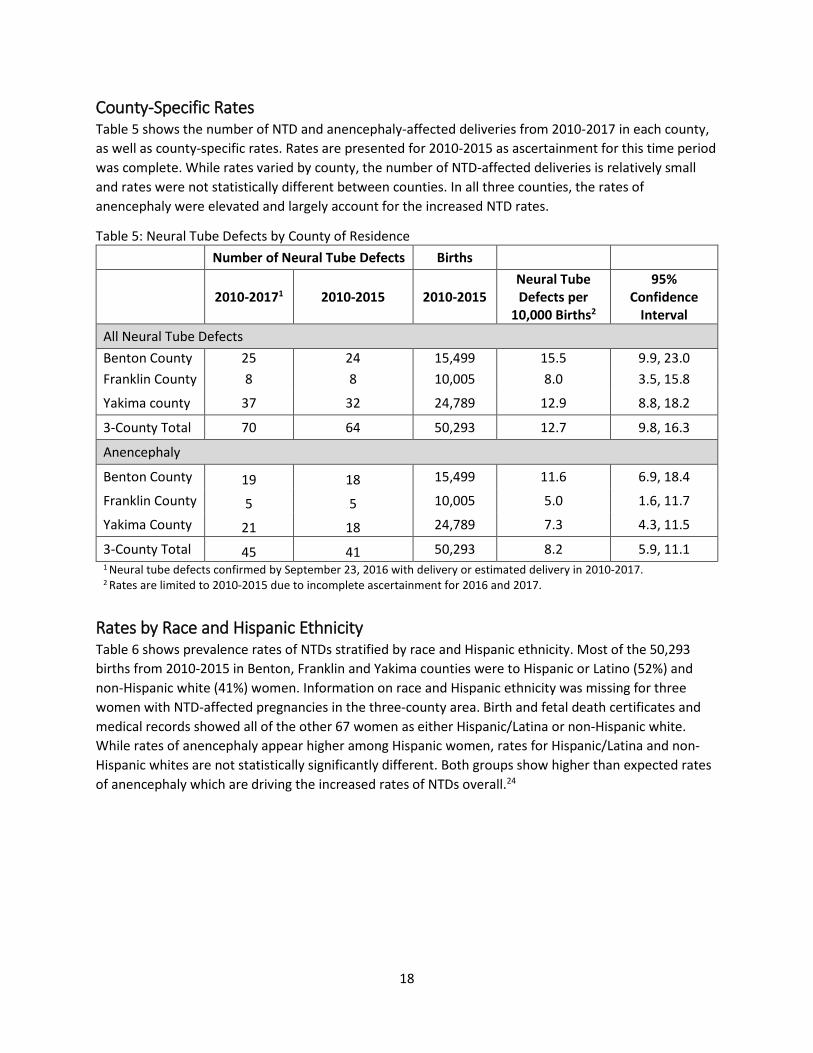
County-Specific Rates Table 5 shows the number of NTD and anencephaly-affected deliveries from 2010-2017 in each county, as well as county-specific rates. Rates are presented for 2010-2015 as ascertainment for this time period was complete. While rates varied by county, the number of NTD-affected deliveries is relatively small and rates were not statistically different between counties. In all three counties, the rates of anencephaly were elevated and largely account for the increased NTD rates.
Table 5: Neural Tube Defects by County of Residence Number of Neural Tube Defects Births
2010-20171 2010-2015 2010-2015 Neural Tube Defects per
10,000 Births2
95% Confidence
Interval All Neural Tube Defects Benton County 25 24 15,499 15.5 9.9, 23.0 Franklin County 8 8 10,005 8.0 3.5, 15.8
Yakima county 37 32 24,789 12.9 8.8, 18.2
3-County Total 70 64 50,293 12.7 9.8, 16.3
Anencephaly
Benton County 19 18 15,499 11.6 6.9, 18.4
Franklin County 5 5 10,005 5.0 1.6, 11.7
Yakima County 21 18 24,789 7.3 4.3, 11.5
3-County Total 45 41 50,293 8.2 5.9, 11.1 1 Neural tube defects confirmed by September 23, 2016 with delivery or estimated delivery in 2010-2017. 2 Rates are limited to 2010-2015 due to incomplete ascertainment for 2016 and 2017.
Rates by Race and Hispanic Ethnicity Table 6 shows prevalence rates of NTDs stratified by race and Hispanic ethnicity. Most of the 50,293 births from 2010-2015 in Benton, Franklin and Yakima counties were to Hispanic or Latino (52%) and non-Hispanic white (41%) women. Information on race and Hispanic ethnicity was missing for three women with NTD-affected pregnancies in the three-county area. Birth and fetal death certificates and medical records showed all of the other 67 women as either Hispanic/Latina or non-Hispanic white. While rates of anencephaly appear higher among Hispanic women, rates for Hispanic/Latina and non-Hispanic whites are not statistically significantly different. Both groups show higher than expected rates of anencephaly which are driving the increased rates of NTDs overall.24

19
In addition to the rates of anencephaly being high, the proportion of NTD-affected pregnancies that were anencephalic among Hispanics/Latinas (73%) and among non-Hispanic whites (50%) are both higher than expected based on the scientific literature.26 The proportions are also higher than among California and Texas women in the NBDPS from 2004-2011 in which 34% of Hispanic NTD-affected pregnancies and 32% of non-Hispanic white NTD-affected pregnancies were anencephalic. There is no clear reason why the proportion of NTD subtypes in the three-county area differs from that seen elsewhere.
Table 6: Neural Tube Defects (NTD) by Maternal Race and Ethnicity, Three-County Area
Number of NTDs 2010-
20171
Number of NTDs 2010-
20152
Births 2010-20153
NTDs per 10,000 births4
95% Confidence
Interval
All Neural Tube Defects Hispanic/Latino 37 33 26,056 12.7 8.7, 17.8 Non-Hispanic White 30 28 20,345 13.8 9.1, 19.9 Total5 67 61 46,401 13.1 10.6, 16.9 Anencephaly Hispanic/Latino 27 25 26,056 9.6 6.2, 14.2 Non-Hispanic White 15 13 20,345 6.4 3.4, 10.9 Total5 42 38 46,4015 8.2 5.8, 11.2 1 Neural tube defects confirmed by September 23, 2016 with delivery or estimated delivery in 2010-2017. 2 Three anencephaly cases had unknown race or ethnicity from 2010-2015. 3 There were 476 births with unknown race or ethnicity from 2010-2015. 4 Rates are limited to 2010-2015 due to incomplete ascertainment and birth data for 2016 and 2017 5 Totals include pregnancies and births among Hispanic/Latina and non-Hispanic white women only. Race and Hispanic ethnicity was missing for three women with NTD-affected pregnancies in the three-county area.
Rates by Maternal Age The maternal date of birth was missing for one woman, so we could not calculate the age at delivery. For the remaining 69 women with NTD-affected pregnancies, the median age at delivery or estimated date of delivery was 30.0 years and the mean age was 29.0. For women with anencephaly-affected pregnancies, the median age was 28.5 and the mean age was 28.0. Rates of NTDs by maternal age at delivery or estimated date of delivery are presented in Table 7. Both the NTD and anencephaly prevalence rates vary by age group, although several of the age-specific rates have large variability due to relatively small numbers. Rates are highest among women 30-39 years. NTD rates among these women are statistically significantly higher than among women 20-24 and 25-29, and anencephaly rates are higher than among women 25-29 years at delivery.

20
Table 7: Neural Tube Defects (NTD) by Maternal Age at Delivery
Number of NTDs 2010-
20171
Number of NTDs 2010-
20152
Births 2010-20153
NTDs per 10,000 births4
95% Confidence
Interval
All Neural Tube Defects Less than 20 years 5 5 5,037 9.9 3.2, 23.2 20-24 years 15 12 13,459 8.9 4.6, 15.6 25-29 years 13 12 14,895 8.1 4.2, 14.1 30-34 years 24 23 10,982 20.9 13.3, 31.4 35-39 years 10 10 4,830 20.7 9.9, 38.1 40-44 years 1 1 1,018 9.8 0.2, 5.5 45+ years 1 0 66 - - Total 69 63 50,293 12.5 9.6, 16.0 Anencephaly Less than 20 years 5 5 5,037 9.9 3.2, 23.2 20-24 years 11 9 13,459 6.7 3.1, 12.7 25-29 years 7 6 14,895 4.0 1.5, 8.8 30-34 years 13 13 10,982 11.8 6.3, 20.2 35-39 years 7 7 4,830 14.5 5.8, 29.9 40-44 years 0 0 1,018 - - 45+ years 1 0 66 - - Total 44 40 50,293 8.0 5.7, 10.8
1Neural tube defects confirmed by September 23, 2016 with delivery or estimated delivery in 2010-2017. 2 One anencephaly case did not have a date of birth so the maternal age could not be calculated. 3 There were 6 births with unknown maternal age from 2010-2015. 4 Rates are limited to 2010-2015 due to incomplete ascertainment and birth data for 2016 and 2017
Case Ascertainment Concerns CDC birth defects experts reported that rates of anencephaly were highly variable across states and varied with case ascertainment methodology. To assess how case ascertainment might affect rates in the three-county area, CDC suggested DOH look at the rate observed in the three-county area compared to state rates by ascertainment method. Figure 5 shows rates from the National Birth Defects Prevention Network (NBDPN) for 2007-2011 and rates for the three-county area from 2010-2015 by case ascertainment method.27 The shape of the marker indicates the ascertainment source. Square markers indicate registries that ascertain cases among live births, stillbirths (the fetus died in utero, but may or may not have a fetal death certificate depending on gestational age) and terminations. Some of these registries, including California and Texas, have active ascertainment in which trained registry staff go to hospitals and other healthcare facilities and systematically review records to identify and confirm cases. Other states, such as Maryland and West Virginia, passively identify cases using administrative records, such as birth and fetal death certificates, without confirmation.27 Still others use a combination of approaches. The triangle markers indicate registries that ascertain cases among live births and

21
stillbirths only, and the circular markers include live births only. The hollow markers indicate rates from the three-county area using the different criteria for including cases.
Figure 5 shows a wide variety in the prevalence of anencephaly by state. The variation from state to state is not well understood and could be due to true differences, differences in case ascertainment, or both. States vary in the data sources they use for ascertaining cases, the ascertainment methodology (active versus passive surveillance) and the gestational age of pregnancies included. The rates reported for the three-county area are higher than rates in other states, but depending on the criteria, they are closer to the ranges shown in Figure 5 than the four-fold increase compared with rates reported by Parker et al.24
The largest difference in rates between the three-county area and other states occurred when comparing the three-county total with live births, stillbirths and terminations. This is the only category that includes pregnancies ending before 20 weeks’ gestation. The drop in the rate for the three-county area when excluding pregnancies ending before 20 weeks’ gestation shows that a large proportion of anencephaly-affected pregnancies in the three-county area ended prior to 20 weeks.
Figure 5: Prevalence of Anencephaly in Three-County Area (2010-2015) and National Birth Defects Prevention Network (2007-2011)
To explore the possibility that rates in the three-county area might be elevated due to identifying NTD-affected pregnancies that are not identified in other areas, we estimated the approximate gestational age as less than 20 weeks and 20 weeks or later based on whether the infant had a live birth certificate
Three-County Area Total
Three-County Area Live Births, Fetal Deaths, Terminations ≥ 20 Weeks' Gestation
Three-County Area Live Births Only

22
(born alive at 20 weeks’ gestation or later), a fetal death certificate (died in utero at 20 weeks’ gestation or later) or no official certificate which meant pregnancy ended prior to 20 weeks’ gestation. Table 8 shows that 64% of the 70 NTD-affected pregnancies had certificates accompanying their delivery (40% birth certificate, 24% fetal death certificate). The remaining 36% of pregnancies ended at less than 20 weeks’ gestation, and as a result were not issued birth or fetal death certificates. We collected data on pregnancies that ended prior to 20 weeks’ gestation from hospital medical records or physician case abstraction.
Among the 45 anencephaly-affected pregnancies, 51% ended at less than 20 weeks’ gestation, 29% had fetal death certificates and 20% had birth certificates. Anencephaly-affected pregnancies, on average, ended earlier in gestation compared with all NTD-affected pregnancies.
Table 8: Gestational Age at Delivery of Neural Tube Defect-Affected Pregnancies Based on Source of Information, Three County Area, 2010-20171
Gestational Age by Ascertainment Source All Neural Tube Defects (%) Anencephaly (%)
≥20 Weeks’ Gestation Live Birth Certificate
28 (40%)
9 (20%)
Fetal Death Certificate 17 (24%) 13 (29%) <20 Weeks’ Gestation No Certificate
25 (36%)
23 (51%)
Total 70 (100.0%) 45 (100%) 1 Neural tube defects confirmed by September 23, 2016 with delivery or estimated delivery in 2010-2017. The project team contacted the CDC and NBDPS investigators from Texas and California to see whether a similar proportion of anencephaly-affected pregnancies were identified early and ended prior to 20 weeks’ gestation. The NBDPS investigators from Texas provided information on all reports of anencephaly in the NBDPS from 2004-2011; investigators from California provided information for Hispanic cases only. Table 9 shows data for all anencephaly cases in the three-county area compared with all anencephaly cases in Texas. The proportion of pregnancies ending before 20 weeks’ gestation in the three-county area was more than twice that in Texas.
Table 9: Gestational Age at Delivery of Anencephaly-Affected Pregnancies Based on Source of Information, Three-County Area and Texas
Gestational Age by Ascertainment Source Three-County Area,
2010-20171 Texas, 2004-20112
≥20 Weeks’ Gestation Live Birth Certificate
9 (20%)
35 (37%)
Fetal Death Certificate 13 (29%) 39 (41%) <20 Weeks’ Gestation No Certificate
23 (51%)
21 (22%)
Total 45 (100%) 95 (100%) 1 Anencephaly-affected pregnancies confirmed by September 23, 2016 with delivery or estimated delivery in 2010-2017. 2 Data are from the National Birth Defects Prevention Study; study participants from Texas came largely from agricultural areas.

23
Because pregnancy termination differs by race and ethnicity,28 we redid this analysis looking at Hispanic women with anencephaly-affected pregnancies.
Table 10 shows results for Hispanic women in the three-county area compared with California and Texas combined. It appears that there is a larger proportion of early diagnosis and termination in the three-county area (41%) compared with California and Texas combined (26%), but the numbers are small and the proportions are not statistically significantly different. Thus, the apparent differences could be due to random variation, a larger proportion of early terminations in Washington, or they could indicate that the project team is identifying cases in the three-county area that are not ascertained in other areas. When we consulted with NBDPS researchers from California and Texas, we learned that while both registries include terminations, they only include hospital terminations or women referred to prenatal diagnostic centers. Thus, they do not capture all terminations and miscarriages after diagnosis. In the three-county area, we attempted to identify all anencephaly-affected pregnancies regardless of outcome, gestational age, or diagnostic location. We enlisted the assistance of obstetric providers to report directly to the state health department and identified several anencephaly-affected pregnancies that were not referred to a perinatology practice or prenatal diagnostic center. So, we may be including cases that would be missed in California and Texas, as well as other locations.
Table 10: Gestational Age at Delivery of Anencephaly-Affected Pregnancies among Hispanic Women Based on Source of Information, Three-County Area, and California and Texas Combined
Gestational Age by Ascertainment Source 3-County Area,
2010-20171
California and Texas, 2004-20112
≥20 Weeks’ Gestation Live Birth Certificate
7 (26%)
68 (38%)
Fetal Death Certificate 9 (33%) 63 (35%) <20 Weeks’ Gestation No Certificate
11 (41%)
47 (26%)
Total 27 (100%) 178 (100%) 1 Anencephaly-affected pregnancies confirmed by September 23, 2016 with delivery or estimated delivery in 2010-2017. 2 Data are from the National Birth Defects Prevention Study; study participants from California and Texas came primarily from agricultural areas.
Surveillance for Neural Tube Defects Statewide We conducted regional and spatial analyses as described in Methods to determine whether the increase in anencephaly was occurring throughout Washington or in additional locations outside the three-county area. Rates of NTDs developed for statewide surveillance are not comparable to those developed for surveillance in the three-county area described above. Unlike the rates described in the previous section, statewide surveillance rates do not include NTD-affected pregnancies that ended before 20 weeks’ gestation and we did not verify diagnoses.
Rates of Anencephaly by Accountable Communities of Health Regions Figure 6 and Table 11 show results of the regional analysis for anencephaly only. The comparable rate in the three-county area was 5.8 per 10,000 live births. We found wide variability in rates, ranging from 1.7

24
Figure 6: Washington State Rates of Anencephaly1 per 10,000 Live Births by Accountable Communities of Health Regions, 2005-2015
1 Anencephaly was identified from birth certificates, fetal death certificates and hospital discharge data for 2005-2013 and birth and fetal death certificates for 2014-2015.
Table 11: Washington State Rates of Anencephaly1 per 10,000 Live Births by Accountable Communities of Health Regions, 2005-2015
Accountable Communities of Health Region
Cases of Anencephaly 2005-2015
Number of Births 2005-
2015
Anencephaly Rate per 10,000 Births
95% Confidence Interval
Washington State 260 962,856 2.7 2.4, 3.1 Better Health Together 29 78,113 3.7 2.5, 5.3
Cascade Pacific 16 75,445 2.1 1.2, 3.5
Greater Columbia 51 114,389 4.5 3.3, 5.9
King 45 272,023 1.7 1.2, 2.2
North Central 18 39,704 4.5 2.7, 7.2
Olympic 16 42,033 3.8 2.2, 6.2
Pierce 46 123,703 3.7 2.7, 5.0
North Sound 27 154,751 1.7 1.2, 2.5
SW Washington 12 62,695 1.9 1.0, 3.4 1 Anencephaly was identified from birth certificates, fetal death certificates, and hospital discharge data for 2005-2013 and birth and fetal death certificates for 2014-2015.
4.5
1.7
3.8 3.7
1.7
3.7
1.9
2.1 4.5

25
anencephaly cases per 10,000 births in the King and North Sound regions to 4.5 per 10,000 in the Greater Columbia (which includes the three-county area) and North Central regions. Anencephaly rates appear somewhat higher in the Better Health Together, North Central, Pierce, and Olympic regions compared to King and North Sound. However, we do not know if the variability in rates represents real differences, is due to demographic differences, or some other factor, such as differences in termination rates after a diagnosis of anencephaly.
Spatial Analysis Using the same data as in the regional analysis, but excluding 2015 because 2015 birth data were not geocoded at the time of analysis, we assessed the spatio-temporal distribution of anencephaly in Washington using SaTScan cluster detection software. Figure 7 shows a statistically significant cluster that includes most of Eastern Washington for 2008-2012. The risk of anencephaly in this area was 2.4 times the risk of anencephaly in Washington State outside this area. This comparison is similar to what we observed when comparing rates of anencephaly by ACH. Because the statewide data only include anencephaly identified from birth certificates, fetal death certificates, and hospitalization records, this cluster may be due to differences in pregnancy terminations after a diagnosis of anencephaly. We do not have a method to explore this further. A similar analysis for all NTDs over the same time period identified a significant spatio-temporal cluster for 2006-2010 with the geographic area limited to central Washington. Notably, the cluster did not include Benton and Franklin counties.
Figure 7: Anencephaly 2005-2014: Most Likely Spatio-Temporal Cluster1
1 The white area within the cluster is the Hanford Site. There were no records listing a maternal residential address in this area.
Time period: 2008-12 Relative Risk: 2.4 P: 0.05

26
Medical Records-Based Case-Control Study The medical records-based case-control study conducted in 2013 included 27 women with NTD-affected pregnancies (cases) and 108 women who were pregnant during the same time period and whose pregnancies had no indication of a birth defect (controls), referred to hereafter as healthy pregnancies. The women with NTD-affected pregnancies were identified through case ascertainment prior to the launch of the study or during the medical records reviews. The 27 NTD-affected pregnancies included 23 cases of anencephaly, three spina bifidas, and one encephalocele that were diagnosed from January 2010 through January 2013. The anencephaly rate for the 23 cases of anencephaly was 8.4 per 10,000 live births (95% CI: 5.3, 12.6), four times the estimated multi-state race-adjusted rate of 2.1 per 10,000, published by Parker and colleagues in 2010.24 The spina bifida rate was 1.3 per 10,000, compared with a race-adjusted rate of 3.5 per 10,000 in the Parker article. The overall rate for the 27 NTDs was 9.9 per 10,000 live births (95% CI: 6.5, 14.3) compared with a race-adjusted rate of 6.4 per 10,000 in the Parker article. As noted above, the higher rate of anencephaly compared with spina bifida is not typically seen.
We observed only minor differences in the findings for all NTDs and anencephaly. This report presents results for anencephaly-affected pregnancies only. Table 12 shows no differences in risk of anencephaly
Table 12: Odds Ratios for Maternal Characteristics among Anencephaly-Affected Pregnancies (Cases) and Healthy Pregnancies (Controls), January 2010- January 20131
Maternal Characteristic Cases (n=23)2 Controls (n=108)2
Adjusted Odds Ratio3 (95%
Confidence Interval) Benton 8 (35%) 31 (29%) 1.5 (0.5-4.1)
Franklin 2 (9%) 12 (11%) 0.9 (0.1-4.1) Yakima 13 (57%) 65 (60%) Reference
Hispanic/Latino 13 (62%) 55 (51%) 1.8 (0.7, 5.1) Non-Hispanic/Latino 8 (38%) 52 (49%) Reference
High School Graduate or Less 13 (76%) 66 (62%) 1.8 (0.7, 5.1) Some College or more 4 (24%) 41 (38%) Reference
Pre-Pregnancy Overweight or Obese 9 (41%) 66 (61%) 0.5 (0.2, 1.2) Pre-Pregnancy Underweight or Normal
Weight 13 (59%) 42 (39%) Reference
Public Health Insurance 15 (68%) 68 (65%) 1.1 (0.4, 3.2)
Private Health Insurance 7 (32%) 37 35%) Reference
Mexico-Born 5 (25%) 32 (30%) 0.8 (0.2, 2.4)
US-Born or Other 15 (75%) 76 (70%) Reference
Mean Age4 (SD) 26.0 (6.2) 28.2 (6.0) 0.9 (0.8, 1.0) 1 Cases were diagnosed from January 2010-January 2013; controls included women who were pregnant during the same time period and whose pregnancies had no indication of a birth defect. Controls were matched to cases by month and year of last menstrual period. 2 Numbers might not add to totals due to missing data. 3 Odds ratios adjusted for season of last menstrual period. 4 Age at end of pregnancy.

27
associated with maternal characteristics, including county of residence at last menstrual period, race and Hispanic ethnicity, educational attainment, pre-pregnancy body mass index indicating overweight or obesity, type of insurance, or place of birth. The mean age of women with anencephaly-affected pregnancies was slightly lower than controls. However, this difference may be due in part to NTD-affected pregnancies ending earlier than healthy pregnancies. On average, anencephaly-affected pregnancies ended at 24.7 weeks’ gestation compared with 38.5 weeks for healthy pregnancies.
In addition to maternal characteristics, the project team examined potential risk factors during pregnancy that may contribute to the increased prevalence of anencephaly (Table 13).
Table 13: Odds Ratios of Pregnancy Risk Factors Among Women with Anencephaly-Affected Pregnancies (Cases) and Healthy Pregnancies (Controls), 2010-20131
Risk Factors during Pregnancy Cases (N=23)2 Controls (N=108)2 Adjusted Odds Ratio3
(95% Confidence Interval)
Drank alcohol 3 (13%) 17 (16%) 0.8 (0.2, 2.8) Did Not Drink Alcohol 20 (87%) 90 (84%) Reference Smoker 2 (9%) 8 (7%) 1.3 (0.2, 5.8) Former/Never Smoker 21 (91%) 100 (93%) Reference
Anemic 2 (9%) 29 (28%) 0.3 (0.04, 1.1) Not Anemic 20 (91%) 73 (72%) Reference Any type of Diabetes 1 (4%) 12 (11%) 0.4 (0.02, 2.0) Non-Diabetic 22 (96%) 96 (89%) Reference
Any Infection during Pregnancy4 8 (35%) 30 (28%) 1.5 (0.4, 5.8)
No Infection 15 (65%) 78 (72%) Reference
No Previous Pregnancy 7 (30%) 24 (22%) 1.7 (0.6, 4.8)
> 1 Previous Pregnancy 16 (70%) 84 (78%) Reference
No Previous Birth 9 (39%) 29 (27%) 2.0 (0.7, 5.4)
>1 Previous Birth 14 (61%) 79 (73%) Reference No Early Folic Acid Supplementation5 17 (74%) 98 (91%) 0.3 (0.1, 1.2)
Early Folic Acid Supplementation 6 (26%) 10 (9%) Reference
No Prenatal Vitamin Use Prenatal Vitamin Use
19 (83%) 4 (17%)
93 (86%) 15 (14%)
0.7 (0.2, 2.7) Reference
1 Cases were diagnosed from January 2010-January 2013; controls included women who were pregnant during the same time period and whose pregnancies had no indication of a birth defect. Controls were matched to cases by month and year of last menstrual period.. 2 Numbers may not add to totals due to missing data. 3 Odds ratios adjusted for season of last menstrual period. 4 Infection included Group B strep colonization, urinary tract infection, yeast infection, upper respiratory infection, and sexually transmitted infection 5Early folic acid supplementation was defined as folic acid use from the last menstrual period to 6 weeks after the last menstrual period.

28
Medical records did not show statistically significant differences between women with anencephaly-affected pregnancies and women with healthy pregnancies with respect to any of the factors assessed. However, the odds ratio for anemia approached statistical significance with a lower proportion of women with anencephaly-affected than healthy pregnancies with anemia. This finding may be due to the anencephaly-affected pregnancies ending earlier than the healthy pregnancies, providing a longer period for women with healthy pregnancies to develop anemia and have it diagnosed by medical providers. The vast majority of women with diabetes had gestational diabetes with only 0.7% having pre-existing diabetes. No single infection affected more than a few women and so the project team combined them for analysis. The infections included Group B strep colonization, urinary tract infections, yeast infections, upper respiratory infections and sexually transmitted infections.
We looked at vitamin and medication use during early pregnancy as reported in the medical record, defining early pregnancy as the time from the mother’s last menstrual period through six weeks after the last menstrual period. Medical records showed very few women with anencephaly-affected pregnancies took folic acid (26%) or prenatal vitamins (17%) during early pregnancy. These percentages were not statistically significantly different from those of the women with healthy pregnancies. Medical records showed little use of medications during pregnancy and no medications were used by more than one woman with an anencephaly-affected pregnancy. Medications during early pregnancy in records of women with anencephaly-affected pregnancies included an antidepressant, an antibiotic, an opioid and an oral contraceptive. (Data not shown.) One woman’s record noted illicit drug use but it was not clear that providers routinely asked about illicit drug use.
Overall, the case-control study yielded no clear associations between maternal characteristics, pregnancy risk factors, or vitamin and medication use and anencephaly or NTDs. There were no statistically significant differences between women with anencephaly-affected pregnancies and women with healthy pregnancies on any factor examined, with the exception of women with anencephaly-affected pregnancies being slightly younger than women with healthy pregnancies.29 One limitation of this study was the small sample size which limited the ability to detect significant differences.
Low folic acid use was investigated further given the strong association between folic acid and NTDs in the scientific and medical literature.30,31,32,33,34,35 Data from PRAMS—which surveys women two-to-six months after delivery about their access to healthcare and a variety of behaviors just before, during and after pregnancy—was used to examine multivitamin use in the month before pregnancy.36 PRAMS data for 2009-2011 show 61% (95% CI: 55, 67) of survey respondents in the three-county area did not take a multivitamin, prenatal vitamin, or folic acid supplement in the month before they became pregnant. This percentage was statistically significantly higher than the 50% (95% CI 48, 52) of respondents living in the rest of Washington who reported no vitamin or supplement use in the month before conception. Information on daily use of vitamins showed a similar pattern: only 24% (95% CI: 19, 29) of survey respondents from the three-county area reported taking a daily vitamin compared with 33% (95% CI: 32, 35) among respondents in the rest of Washington.36
Community Concerns
Radiation from Fukushima Daiichi Disaster At the listening sessions in spring 2014, community members raised concerns about radiation releases from the Fukushima Daiichi plant being a possible cause of the NTD cluster. We consulted with DOH

29
radiation program staff and concluded that radiation exposures from the plant were very unlikely to be linked to the NTD cluster. If this radiation were a cause of the increase, two other scenarios would also have occurred: 1) there would have been a reported increase in anencephaly in other areas of the West Coast, because radiation from Fukushima was widely dispersed in the atmosphere and was not limited to Washington State and 2) there would have been a strong temporal association between these exposures in March and April and subsequent cases. In relation to the first scenario, California has a robust birth defects monitoring program and would have seen an increase in NTDs if radiation from Fukushima caused NTDs; however, California did not see an increase. In relation to the temporal association, the release occurred in March 2011 and we observed elevated rates prior to this time as well as afterwards. Additionally, DOH monitored air and rainwater levels of radiation during March and April 2011, but did not observe concerning levels of radiation.
Radiation from Hanford Site The community also raised concerns about whether radiation released from the Hanford Site might be contributing to the cluster. DOH is one of several organizations that work to ensure the safety of the public and the environment around the Hanford Site. Because of DOH’s monitoring role, staff have access to all of Hanford’s monitoring data and they also check its accuracy. DOH radiation program staff reported that accidental radiation releases have generally decreased over time. In considering a potential pathway of exposure, DOH staff did not see a way that radiation from Hanford could have exposed most or all of the women with anencephaly-affected pregnancies in the three-county area. Radiation leaks into soil or water at the Hanford site are mostly contained on the site. Leaks that do seep into the Columbia River are diluted and carried downstream. This water is carefully monitored to assure safety standards are met. It is unlikely that contamination from these leaks could get into the drinking water used by most of the women with affected pregnancies, because they lived throughout the three-county region. Furthermore, we did not identify any women with NTD-affected pregnancies who lived in residences served by public water systems that pull water directly from the Columbia River.
Nitrates in Drinking Water High levels of nitrates reported in ground water in the Lower Yakima Valley have been a source of environmental and health concerns for the past several years.37 This issue is especially concerning because about one-third of residents in the Lower Yakima Valley get their water from unregulated private wells. During 2010, the U.S. Environmental Protection Agency estimated that 10-20% of these private wells had had nitrate levels above the maximum contaminant level (MCL) of 10 mg/L.38,39
Nitrates in drinking water have also been reported to increase risk for NTDs, including anencephaly.40,4142,43 DOH staff initially examined whether the women in the case-control study received their drinking water from private wells or public water systems. Twenty of 26 women (77%) with neural tube defect-affected pregnancies and 88 of 107 (82%) women with healthy pregnancies were on public water systems. At the time of analysis, one case and one control did not have valid residential addresses that could be matched to water source.
Subsequently, DOH staff looked at nitrate levels in water systems serving residences of all women with NTD-affected pregnancies. A residential address was identified for the earlier case that did not have a valid address, however, three additional women did not have valid residential addresses resulting in 67 women with residential addresses. Fifty-three (79%) of these women received their drinking water from public water systems, which are tested for nitrates regularly to make sure that levels remain below the

30
MCL. When a source exceeds the nitrate trigger level of 5 mg/L, it is placed on quarterly monitoring. If it exceeds the MCL, the district must notify their customers and provide an alternative source of water to those customers who request it. If the system continues to exceed the MCL, the district is required to lower the nitrate levels. Approaches to lowering nitrate levels include blending the high-nitrate water with water from other sources, modifying the existing source to reduce the amount of nitrate getting into the water, drilling a new well, or installing centralized treatment to remove nitrates. Monitoring is increased to ensure drinking water levels remain below the MCL at the tap.
The community raised concerns about nitrate levels in drinking water below the MCL, because some research suggests that levels below 10 mg/L might be associated with NTDs.40,41,42,43 In response, DOH staff looked at public water supply nitrate levels closest to the critical time window for neural tube formation for each affected pregnancy. Table 14 displays the nitrate concentration results for the 53 women with NTD-affected pregnancies whose residences were on public water systems. Among women with anencephaly-affected pregnancies, nitrate levels ranged from 0.05 mg/L to 9.26 mg/L with an average of 1.76 mg/L; about half (18/35) had levels of 0 or 1 mg/L. Nitrate levels above 5 mg/L were reported for four of the 53 women. The table lists the number of women by nitrate level rounded to the nearest whole number.
Table 14: Nitrate Levels (mg/L) in Public Water Systems Serving Residences of Women with Neural Tube Defect-Affected Pregnancies, 2010-20171,2
Neural Tube Defect Minimum Nitrate Level
Maximum Nitrate Level
Average Nitrate Level
Anencephaly 0.05 9.3 1.8
Encephalocele 1.6 6.8 4.2
Spina bifida 0.05 5.5 1.5
Total (n=53) 0.05 9.3 1.8
Nitrate Level Anencephaly Encephalocele Spina bifida Total
0 7 8 15 1 11 1 12 2 7 1 3 11 3 5 2 7 4 4 4 6 2 2 7 1 1 9 1 1
Total 35 2 16 53 1 Neural tube defects confirmed by September 23, 2016 with a delivery date or estimated date of delivery in 2010-2017 2 Nitrate levels are the highest level measured from three months before through the end of the first month after conception when available; when not available, the level is that measured closest to the four-month period. Table 15 shows nitrate levels in public systems serving residences of women with NTD-affected pregnancies, as well as estimates of levels in private systems. Because private wells are unregulated, DOH staff did not have nitrate measurements for private wells. Instead, DOH staff used nearby public water systems as the nitrate concentrations in water for households with private wells. In addition to missing information for the three women described above, DOH was also missing information for six

31
women on private wells that did not have a nearby public water system. With the additional estimated information on private water systems, the average nitrate levels increased slightly, but continued to be well below 5 mg/L. In summary, based on nitrate levels measured in public water sources, drinking water nitrate levels were not elevated among women with anencephaly- or NTD-affected pregnancies in the three-county area.
Table 15: Nitrate Levels (mg/L) of Public Water Systems and Private Wells Serving Residences of Women with NTD-Affected Pregnancies, 2010-20171,2
Neural Tube Defect Minimum Nitrate Level
Maximum Nitrate Level
Average Nitrate Level
Anencephaly 0.05 10.0 2.1 Encephalocele 1.6 6.8 4.2 Spina bifida 0.05 5.5 1.8 Total 0.05 10 2.1
Nitrate Level Anencephaly Encephalocele Spina bifida Total
0 8 8 16 1 11 3 14 2 7 1 4 12 3 5 2 7 4 6 6 5 1 1 6 2 2 7 1 1 9 1 1
10 1 1 Missing 6 3 9
Total 45 2 23 70 1 Neural tube defects confirmed by September 23, 2016 with a delivery date or estimated date of delivery in 2010-2017 2 Nitrate levels for public water supplies are the highest level measured from three months before through the end of the first month after conception when available; when not available, the level is that measured closest to the four-month period Nitrate levels for private wells are levels from the closest public water supply. Six private wells did not have a nearby public water supply and are classified as missing, as are three cases without residential addresses. DOH staff also consulted with Dr. Jean Brender, who has studied nitrates and congenital malformations for over 20 years. She consulted by email and provided a book chapter that she had recently completed on nitrates, nitrite, nitrosatable drugs, and congenital malformations.43 The chapter includes a possible mechanism by which nitrates could induce NTDs and reviews the epidemiologic literature. The mechanism by which nitrates are hypothesized to cause NTDs is by formation of N-nitroso compounds within the body. These compounds caused NTDs in animal studies. N-nitroso exposures come from a variety of sources both within the body and from external sources like tobacco smoke and cured meats.
Nitrates by themselves do not create N-nitroso compounds; they need to be in the presence of nitrite or other compounds like amines or amides which cause nitrosation, the process of converting organic compounds into N-nitroso derivatives. Studies have shown an association between nitrosatable drugs and NTDs.40,42,43,44,45 They are hypothesized to work in the presence of nitrite, and in an acidic

32
environment such as the stomach.42,43 Many common drugs, including over-the-counter medications, are considered to be nitrosatable drugs.45
Given the variety of N-nitroso sources and the complexity of factors regulating their formation, there is most likely not a simple association between anencephaly or all NTDs and drinking water nitrates below the MCL. It is likely that a combination of factors contributed to the association of low concentrations of nitrates in drinking water and NTDs found in epidemiologic studies. Drinking water contributes only a small portion of dietary nitrate intake if the water nitrate level is below the MCL. Several vegetables have naturally high levels of nitrates. However, dietary nitrates have not been found to be associated with NTDs in the epidemiologic literature.42,43 This could be due in part to the presence of vitamin C in vegetables. Vitamin C inhibits the formation of N-nitroso compounds in the stomach.42,43 It may be that a combination of dietary nitrate, nitrosatable drugs, and drinking water nitrate intake together contribute to increased risk for NTDs, but the scientific evidence for this remains unclear. The association has proven difficult for researchers to tease apart, even after decades of research.
In conclusion, nitrates in drinking water do not appear to be a reason for the increase in NTDs in the three-county area. All but one of the 61 women for whom information was available appeared to have drinking water at their homes that was below the MCL of 10 mg/L and all but six had drinking water levels below 5 mg/L.
Pesticides At community listening sessions and during Advisory Committee meetings, residents of the three-county area raised concerns about potential exposure to pesticides given the area’s high level of agricultural production. Pesticides can be difficult to study because of the large number of compounds in use, and because many people may be unaware of potential pesticide exposures. Exposures can occur occupationally, primarily through applying or mixing pesticides or handling contaminated crops; or residentially primarily through household use and occasionally due to pesticides drifting from farm-related applications into residential areas. Generally, scientists consider residential exposures to be lower than farm-related occupational exposures.46 DOH staff pursued three avenues of investigation into pesticides: a literature review and examination of Washington’s agricultural crops, an examination of case and control mother’s residential distance to agricultural production, and exploration of the reported occupation of case mothers and fathers.
Potential Regional Exposure to Pesticides Associated with NTDs. Review of the epidemiologic literature identified few studies with specific pesticide classes or compounds associated with anencephaly or NTDs. A 2014 study from California was an exception. This study examined the risk for NTDs associated with residential proximity to reported agricultural pesticide application.16 The California study found statistically significant associations between NTDs and seven of the 461 pesticides studied: abamectin, 2,4-D, methomyl, imidacloprid, permethrin, bromoxynil octanoate, and petroleum distillates. These associations are only suggestive and not established as causal factors for NTDs. Five of the seven compounds are parts of larger classes of compounds and one would expect the other compounds in the same class to also cause NTDs were the associations causal. In addition, these could be chance findings due to the large number of compounds tested. Nevertheless, DOH staff explored the use of these seven compounds in Washington.

33
We found that five of the seven compounds have significant use in the home environment and throughout Washington for both agricultural and non-agricultural uses. Methomyl and bromoxynil were the only pesticides among the seven with no listed use in the home environment. We explored whether non-occupational exposures to these compounds might have occurred through drift. WSDA reported only one case of bromoxynil drift and no cases of methomyl drift in the three-county area from 2006-2014, so airborne drift did not appear to be a common pathway of exposure to local residents. Additionally, total reports of drift involving these seven pesticides were not higher in the three-county area than in the neighboring four counties (Kittitas, Chelan, Douglas and Grant), which are similarly rural counties with significant agricultural production.
Methomyl was the only compound of the seven with higher estimated use within the study area. According to 2012 data collected by the United States Geological Survey, Benton County had the highest use in Washington State (more than 20,000 kilograms), followed by Grant (5,000 kilograms), Franklin (2,500 kilograms), and trace use in Yakima.19 There was very little or no use in other counties in Washington. Methomyl is a carbamate with high acute toxicity and is a reversible acetyl-cholinesterase inhibitor. It is registered for use in fly baits for use around cattle, feedlots and dairies to control flies. Methomyl is also applied by air or tractor puller sprayers to berries, potatoes, onions, and wheat in Washington. The potential for airborne drift depends on the application equipment and weather conditions, with aerial and air pressure ground sprayers being more prone to drift than low-pressure ground boom sprayers. In Benton County, methomyl is applied on potatoes, onions and berries. It is used seasonally, from May through September. As noted above, there were no reports of pesticide drift of methomyl in Washington from 2006-2013. We also explored whether methomyl has been reported in drinking water samples. It is included in the standard insecticide testing panel, but has not been widely detected. Less than 0.1% of water tests conducted in the state from 1979-September 2015 detected methomyl (2/2305 samples). Both reports were from Western Washington and involved very low concentrations (1.4-2.4 parts per million).
According to the EPA’s Risk Mitigation on methomyl in 2010, use in California and Florida has exceeded use in all other states combined.47 Methomyl has been detected in water samples in these states, and manufacturers have since voluntarily cancelled some uses of methomyl due to EPA estimates of risks from drinking water contaminated with methomyl. Given the heightened use of methomyl in these other states, we would expect to see increased rates of anencephaly or NTDs in other areas if methomyl caused NTDs.
Residential Proximity to Agriculture DOH staff also explored maternal residential proximity to agriculture as a proxy for potential pesticide exposures. Table 16 shows the distance women with NTD-affected pregnancies (cases) and women with live births or fetal deaths not affected by NTDs (controls) lived from agricultural fields. In this table, the minimum distance is the distance to the closest agricultural field. The first quartile is the distance within which the closest quarter of case and control women lived. The median is the distance within which the closest half of case and control women lived. The third quartile is the distance within which three-fourths of the case and control women lived and the maximum is the greatest distance between a case or control and an agricultural field. Three-fourths of both women with NTD-affected pregnancies and women with live births or fetal deaths not affected by NTDs lived within about 1,000 meters of an agricultural field. Figure 8 shows this same data with box-and-whisker plots. The small variations in

34
distances among the three groups are not meaningful for exposure potential and were not statistically significantly different.
Table 16: Distance (Meters) from Agriculture to Residences of Women with and without Neural Tube Defect (NTD)-Affected Pregnancies, Three-County Area, 2010-20141
Condition Number Minimum 1st Quartile Median Mean 3rd Quartile Maximum
Anencephaly 34 0 190 592 737 971 2,110
Spina bifida or Encephalocele 18 32 203 405 548 850 1,787
Other Live Births or Fetal Deaths
42,200 0 100 446 672 1,079 18,870
1 Delivery or estimated delivery date for women with NTD-affected pregnancies as identified through active and stimulated passive surveillance; year of birth or fetal death for pregnancies not affected by NTDs as identified through birth and fetal death certificates.
Figure 8: Distance (Meters) from Agricultural Fields to Residences of Women with Neural Tube Defect-Affected Pregnancies and all Live Births in Three-County Area, 2010-20141,2
1 The dark line in the middle of each box is the median distance to agriculture. Each box represents the middle 50% of distances from residences to agricultural fields; the lower edge of the box is the 25th percentile, the upper edge is the 75th percentile. The lower and upper tails are the minimum and maximum distances with the maximum value for live births truncated at about 2,500 meters, excluding a small number of live births that were outliers to facilitate presentation. 2 Delivery or estimated delivery date for women with NTD-affected pregnancies as identified through active or stimulated passive surveillance; year of birth or fetal death for pregnancies not affected by NTDs (controls) as identified through birth and fetal death certificates. Spina bifida includes spina bifida and encephalocele.
Met
ers

35
DOH staff also mapped the residences of women in relation to specific crops. We observed a similar spatial distribution for women with and without NTD-affected pregnancies. This mapping is not presented to protect confidentiality. These findings suggest that women with NTD-affected pregnancies did not live closer to agricultural operations than the women without NTD-affected pregnancies.
Parental Occupation. DOH staff also examined parental occupation as listed on birth and fetal death certificates of infants in the three-county area with NTDs (cases) to determine if any types of jobs were listed more frequently than on other birth certificates in same area (controls). We examined certificates from 2010 through 2015. Table 17 shows all occupations reported for more than one case mother or father.
We did not have certificates and thus, were missing information on parental occupation, for 20 NTD-affected pregnancies that ended before 20 weeks’ gestation, and for one NTD affected pregnancy that was delivered out of state. Of the 43 cases (21 anencephaly, 20 spina bifida, and 2 encephalocele) with certificates, 37 had information on parental occupation. There was no occupation likely to involve pesticide exposure reported on the 37 case certificates more frequently than on the control certificates beyond what might be expected due to random variation.
Table 17: Parental Occupation1 from Birth and Fetal Death Certificates, Three-County Area 2010-2015 Occupation Case2 Mothers Control2 Mothers
Students 6% 2%
Clerks 8% 3% Farmer, Farm Laborer, Packer, Orchard worker 8% 3%
Housewife 28% 16%
Not Stated 33% 32%
Occupation Case Fathers Control Fathers
Laborer 5% 4%
Sports Instructor 5% 0.1%
Air Conditioning/Heating Repair 5% 0.5%
Construction Laborer 5% 3% Farmer, Farm Laborer, Packer, Orchard worker 8% 9%
Not Stated 38% 30% 1 Occupations include those reported on more than one certificate for the 37 of 43 NTD-affected pregnancies with parental occupation information. 2 Cases include pregnancies affected with a neural tube defect that have a birth or fetal death
certificate; controls include all other birth certificates. Summary of Potential for Pesticide Exposure. In summary, DOH staff explored pesticide exposure as a potential cause for the increase in NTD-affected pregnancies through three different approaches. None of these approaches indicated higher potential for pesticide exposure among parents with NTD-affected

36
pregnancies than for other pregnancies in the three-county area. There was not evidence for potentially higher exposure to methomyl among mothers with NTD-affected pregnancies, we did not find evidence that case mothers lived closer to agricultural fields than control mothers, and we did not observe case mothers or fathers to be more likely to have an occupation associated with pesticide use. We also did not observe any seasonality to the occurrence of NTDs in the area. (See Figure 3.) Nonetheless, we cannot rule out the possibility that pesticide use might be contributing to the increase in anencephaly-affected pregnancies in the three-county area, because we were not able to examine all possible types and sources of pesticide exposure.
Genetics Medical research suggests that NTDs are likely associated with certain genetic factors, but it is not entirely clear what those factors may be.48 While genetic factors are important for the clinical care of mothers and babies, the purpose of the DOH investigation was to explore possible causes for the increase in anencephaly in order to take preventive actions. Individual-level intervention based on genetic predisposition is beyond the scope of DOH’s public health role, and best approached individually with genetic and medical counseling.
Nonetheless, DOH staff consulted with a genetics counselor and reviewed relevant medical literature. NTDs have been associated with common polymorphisms in genes related to folate and homocysteine pathways.49,50,51 A polymorphism refers to any natural variation in a gene that usually has no adverse effects on the individual, and occurs with fairly high frequency in the general population. One such variant is in the gene that codes for methylenetetrahydrofolate reductase (MTHFR), an enzyme involved in folate metabolism. A common MTHFR polymorphism is the 677C to T variant, which replaces the nucleotide cytosine with thymine at position 677. It results in reduced activity of MTHFR at body temperature. Individuals with two copies of this polymorphism present with low tissue folate and increased plasma homocysteine levels, changes that can typically be overcome with folic acid supplementation.
This genetic variant is also associated with a slightly increased risk of having an NTD-affected pregnancy, with slightly greater odds of an NTD for individuals with two copies of the polymorphism.51 A meta-analysis of 34 studies examining the association between this polymorphism in women and NTDs showed an increased risk of NTDs among women with two copies of the polymorphism compared to no copies (TT vs. CC) (odds ratio 1.34; 95% CI: 1.17-1.54).49 This MTHFR polymorphism is relatively frequent in the population, with an estimated 5-14% of women having this trait.52 Still, most women with this particular polymorphism do not have infants with NTDs. There is no reason to think that the MTHFR polymorphism would be more common in the three-county area than elsewhere. However, even if it were more common, it alone would not account for the increase in NTDs in the three-county area and DOH staff would still want to identify other factors leading to the increased rate and especially high prevalence of anencephaly.
Fumonisins Fumonisins are a group of toxins produced by the fungus Fusarium verticillioides that primarily affect maize and corn, but have also been detected in other crops, such as rice, sorghum and some beans. Fumonisin B1 has been associated with NTDs in mice53 and was reported to be associated with NTDs among Mexican-American women in Texas in the early 1990s.54 The mold increases in hot dry weather and Dr. Gelineau-van Waes posited that the increase in NTDs in the three-county area could be related

37
to increased fungal contamination of corn produced in Texas and Nebraska under drought conditions in 2011 and 2012.55 Corn from these states serves as the primary source of corn for corn masa flour used to make corn tortillas in the United States. She suggested the corn would show up in products sold in 2012 and 2013. However, given the wide distribution of this masa flour, DOH staff would not expect to see such an effect limited to the three-county area. Furthermore, while many Hispanics consume corn masa products as a staple in their diets, the increased rate in the three-county area occurs among both Hispanics and non-Hispanic white women as noted above, and began prior to 2012 and persisted after 2013.
Fortification of Corn Masa Flour On April 14, 2016, the FDA approved voluntary fortification of corn masa with folic acid. This fortification is expected to help prevent NTDs among Hispanics who experience a higher rate of NTDs nationwide compared with non-Hispanic whites.56 DOH staff have observed anecdotally that at least some corn masa fortified with folic acid has been distributed in Washington.
Interviews of Women with Neural Tube Defect-Affected Pregnancies Interview Response We interviewed women with NTD-affected pregnancies in an attempt to identify unique preventable exposures that could be contributing to the increased rate of NTDs, especially anencephaly, in the three-county area. We approached women for interview in three phases. As of August 23, 2016, DOH staff had approached 38 women, including 24 women with anencephaly-affected pregnancies. (Table 18). Phase 1 included women who had a pregnancy diagnosed with a confirmed NTD prior to calendar year 2015 and were due to deliver in December 2012 or later. Phase 2 included all women with NTD-affected pregnancies confirmed in 2015, and Phase 3 included women with NTD-affected pregnancies confirmed in 2016. In Tables 19-30, we have only included women in Phase 1 and 2 because at the time of analysis Phase 3 was still underway. We discontinued interviewing women in August 2016.
Table 18: Women with Neural Tube Defect- (NTD) Affected Pregnancies Approached for Interview, Three-County Area
Phase All NTDs Anencephaly
Phase 11 26 18
Phase 22 8 4
Phase 33 4 2
Total-to-Date1 38 24 1 Confirmed NTD-affected pregnancy before 2015 and delivery or estimated delivery date of December 2012 or later. 2 Confirmed NTD-affected pregnancy in 2015. 3 NTD-affected pregnancy confirmed from January 2016 through August 23, 2016, with delivery in 2016 or 2017. As shown in Table 19, during Phase 1 and 2, DOH staff interviewed 50% of women with NTD-affected pregnancies and 55% of women with anencephaly-affected pregnancies who were approached. Approximately 12% of all women and 14% of women with anencephaly-affected pregnancies declined to participate; DOH was unable to contact the remaining women or re-contact them after they had agreed to participate.

38
Table 19: Phase 11 and 22 Contact Responses, Three-County Area
Maternal Response All Neural Tube Defects Anencephaly
Interviewed 17 (50%) 12 (55%)
Partial Interview 1 (3%) 0 (0%)
Initial Consent 3 (9%) 1 (5%)
No Follow-Up Due to Illness 2 (6%) 2 (8%)
No Response 7 (21%) 4 (18%)
Declined 4 (12%) 3 (14%)
Total Phase 1 and 2 34 (100%) 22 (100%) 1 Confirmed neural tube defect-affected pregnancy before 2015 with a delivery or estimated delivery date of December 2012 or later 2 Confirmed neural tube defect-affected pregnancy in 2015
Characteristics of Interviewees Table 20 shows percentages of pregnancies ending before 20 weeks’ gestation and at 20 weeks’ gestation or later. These percentages are similar to those for all women with NTD- and anencephaly-affected pregnancies shown in Table 8. In addition to comparing gestational ages, we compared maternal ages at conception and race and Hispanic ethnicity for interviewees with all women with NTD-affected pregnancies. The mean and median ages at conception of the interviewed women were one year older than those of all women with NTD-affected pregnancies. Looking only at anencephaly-affected pregnancies, the mean age at conception was one year older for interviewees, but the median ages at conception were similar. Interviewed women appeared to be less likely to be Hispanic compared with all women with affected pregnancies. Six of the 12 (50%) interviewed women with anencephaly-affected pregnancies reported being Hispanic compared to 27 of 42 (64%) all women with anencephaly-affected pregnancies. Combining all NTD, seven of 17 (41%) interviewed women reported being Hispanic compared to 37 of 67 (55%) of all women. Although the differences among the percentages are not statistically significant, small numbers make it difficult to detect what might be real differences and the findings suggest that Hispanic women might be underrepresented among those interviewed. We did not have additional information to compare interviewed women with all women with NTD-affected pregnancies in the three-county area.
Table 20: Gestational Age Based on Source of Information of Interviewed Women with Neural Tube Defect-Affected Pregnancies, Three-County Area1
Gestational Age and Source All Neural Tube Defects Anencephaly ≥20 Weeks’ Gestation Live Birth Certificate
6 (35%)
3 (25%)
Fetal Death Certificate 4 (24%) 3 (25%) <20 Weeks Gestation No Certificate
7 (41%)
6 (50%)
Total Interviewed 17 (100%) 12 (100%) 1 Includes women with confirmed neural tube defect-affected pregnancy before 2015 with a delivery or estimated delivery date of December 2012 or later and women with confirmed neural tube defect-affected pregnancy in 2015.
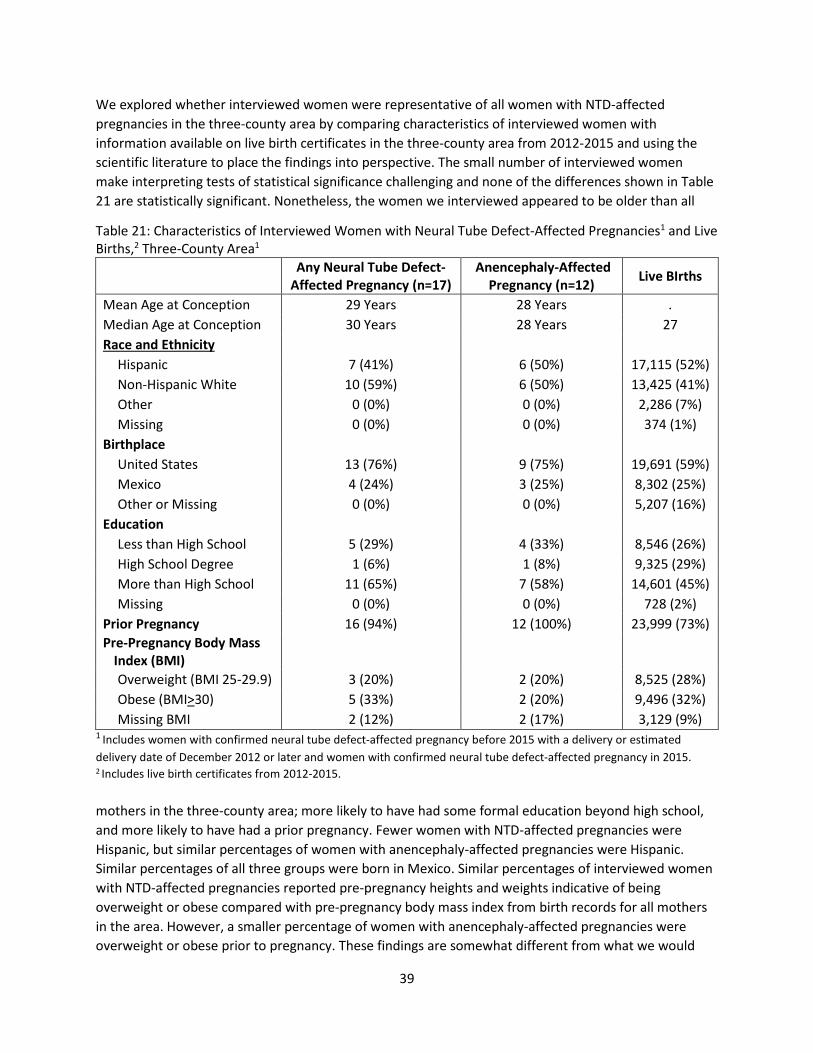
39
We explored whether interviewed women were representative of all women with NTD-affected pregnancies in the three-county area by comparing characteristics of interviewed women with information available on live birth certificates in the three-county area from 2012-2015 and using the scientific literature to place the findings into perspective. The small number of interviewed women make interpreting tests of statistical significance challenging and none of the differences shown in Table 21 are statistically significant. Nonetheless, the women we interviewed appeared to be older than all
Table 21: Characteristics of Interviewed Women with Neural Tube Defect-Affected Pregnancies1 and Live Births,2 Three-County Area1
Any Neural Tube Defect-Affected Pregnancy (n=17)
Anencephaly-Affected Pregnancy (n=12) Live BIrths
Mean Age at Conception 29 Years 28 Years . Median Age at Conception 30 Years 28 Years 27 Race and Ethnicity
Hispanic 7 (41%) 6 (50%) 17,115 (52%) Non-Hispanic White 10 (59%) 6 (50%) 13,425 (41%) Other 0 (0%) 0 (0%) 2,286 (7%) Missing 0 (0%) 0 (0%) 374 (1%)
Birthplace United States 13 (76%) 9 (75%) 19,691 (59%) Mexico 4 (24%) 3 (25%) 8,302 (25%) Other or Missing 0 (0%) 0 (0%) 5,207 (16%)
Education Less than High School 5 (29%) 4 (33%) 8,546 (26%) High School Degree 1 (6%) 1 (8%) 9,325 (29%) More than High School 11 (65%) 7 (58%) 14,601 (45%) Missing 0 (0%) 0 (0%) 728 (2%)
Prior Pregnancy 16 (94%) 12 (100%) 23,999 (73%) Pre-Pregnancy Body Mass
Index (BMI)
Overweight (BMI 25-29.9) 3 (20%) 2 (20%) 8,525 (28%) Obese (BMI>30) 5 (33%) 2 (20%) 9,496 (32%) Missing BMI 2 (12%) 2 (17%) 3,129 (9%)
1 Includes women with confirmed neural tube defect-affected pregnancy before 2015 with a delivery or estimated delivery date of December 2012 or later and women with confirmed neural tube defect-affected pregnancy in 2015. 2 Includes live birth certificates from 2012-2015. mothers in the three-county area; more likely to have had some formal education beyond high school, and more likely to have had a prior pregnancy. Fewer women with NTD-affected pregnancies were Hispanic, but similar percentages of women with anencephaly-affected pregnancies were Hispanic. Similar percentages of all three groups were born in Mexico. Similar percentages of interviewed women with NTD-affected pregnancies reported pre-pregnancy heights and weights indicative of being overweight or obese compared with pre-pregnancy body mass index from birth records for all mothers in the area. However, a smaller percentage of women with anencephaly-affected pregnancies were overweight or obese prior to pregnancy. These findings are somewhat different from what we would

40
expect based on the scientific literature that reports women with NTD-affected pregnancies to more frequently be Hispanic, less educated, more likely to be born in Mexico and more likely to report heights and weights indicating obesity.4,26,57,58 The differences between characteristics of the interviewed women and all women with live births and the differences with what we would expect from the scientific literature suggest that our sample of interviewed women was not representative of all women with NTDs in the three-county area.
We further explored whether the interviewed women were representative of all women with NTD-affected pregnancies in the three-county area by comparing characteristics of interviewees in the three-county area with women from California or Texas who were interviewed for the NBDPS. (Table 22)
Table 22: Characteristics of Interviewed Women with Neural Tube Defect-Affected Pregnancies, Three County Area, 2012-20151 and Texas and California,2 2004-2013
Three-County Area California and Texas
Any Neural Tube
Defect (n=17) Anencephaly
(n=12) Any Neural Tube Defect (n=1364)
Anencephaly (n=114)
Mean Age at Conception 29 Years 28 Years 25 Years 26 Years Median Age at Conception 30 Years 28 Years na na Race
Hispanic 7 (41%) 6 (50%) 1097 (81%) 92 (81%) Non-Hispanic White 10 (59%) 6 (50%) 184 (14%) 16 (14%) Other 0 (0%) 0 (0%) 81 (6%) 6 (5%) Missing 0 (0%) 0 (0%) 2 (0%) 0 (0%)
Language Spoken at Home English 12 (71%) 8 (67%) 592 (49%) 49 (47%) Spanish 5 (29%) 4 (33%) 625 (51%) 56 (53%) Missing 0 (0%) 0 (0%) 147 (11%) 9 (8%)
Birthplace US Born 13 (76%) 9 (75%) 709 (58%) 54 (53%) Mexico Born 4 (24%) 3 (25%) 503 (42%) 47 (47%) Missing 0 (0%) 0 (0%) 152 (11%) 13 (11%)
Education Less than HS 5 (29%) 4 (33%) 438 (45%) 37 (34%) HS degree 1 (6%) 1 (8%) 346 (28%) 35 (32%) More than HS 11 (65%) 7 (58%) 460 (37%) 36 (33%) Missing 0 (0%) 0 (0%) 120 (9%) 6 (5%)
Pregnancy History Prior Pregnancy 16 (94%) 12 (100%) 956 (70%) 81 (71%) Prior NTD Pregnancy 3 (18%) 2 (17%) 0 (0%) 2 (2%)
Pre-Pregnancy Body Mass Index (BMI)
Overweight (BMI 25-29.9) 3 (20%) 2 (20%) 301 (22%) 22 (19%) Obese (BMI>30) 5 (33%) 2 (20%) 320 (23%) 32 (28%) Missing BMI 2 (12%) 2 (17%) Not available Not available
1 Includes women with confirmed NTD-affected pregnancy before 2015 with a delivery or estimated delivery date of December 2012 or later and women with confirmed NTD-affected pregnancy in 2015. 2 Data are from the National Birth Defects Prevention Study; study participants from California and Texas came largely from agricultural areas.
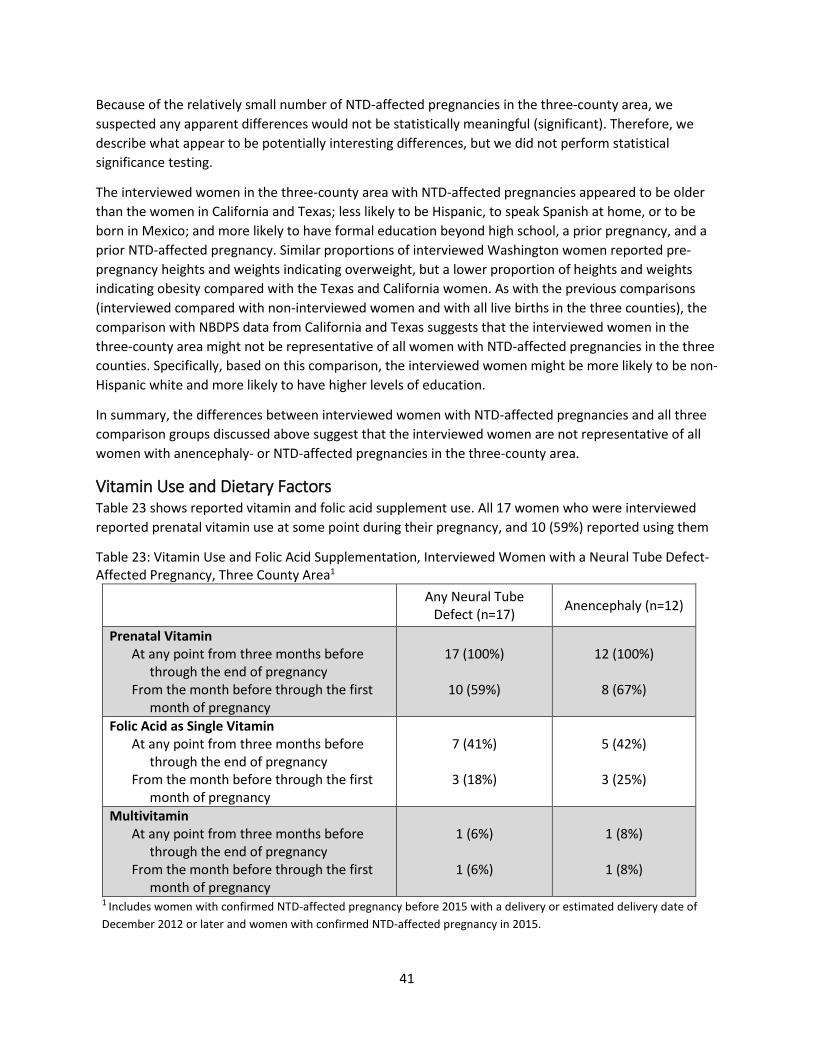
41
Because of the relatively small number of NTD-affected pregnancies in the three-county area, we suspected any apparent differences would not be statistically meaningful (significant). Therefore, we describe what appear to be potentially interesting differences, but we did not perform statistical significance testing.
The interviewed women in the three-county area with NTD-affected pregnancies appeared to be older than the women in California and Texas; less likely to be Hispanic, to speak Spanish at home, or to be born in Mexico; and more likely to have formal education beyond high school, a prior pregnancy, and a prior NTD-affected pregnancy. Similar proportions of interviewed Washington women reported pre-pregnancy heights and weights indicating overweight, but a lower proportion of heights and weights indicating obesity compared with the Texas and California women. As with the previous comparisons (interviewed compared with non-interviewed women and with all live births in the three counties), the comparison with NBDPS data from California and Texas suggests that the interviewed women in the three-county area might not be representative of all women with NTD-affected pregnancies in the three counties. Specifically, based on this comparison, the interviewed women might be more likely to be non-Hispanic white and more likely to have higher levels of education.
In summary, the differences between interviewed women with NTD-affected pregnancies and all three comparison groups discussed above suggest that the interviewed women are not representative of all women with anencephaly- or NTD-affected pregnancies in the three-county area.
Vitamin Use and Dietary Factors Table 23 shows reported vitamin and folic acid supplement use. All 17 women who were interviewed reported prenatal vitamin use at some point during their pregnancy, and 10 (59%) reported using them
Table 23: Vitamin Use and Folic Acid Supplementation, Interviewed Women with a Neural Tube Defect-Affected Pregnancy, Three County Area1
Any Neural Tube
Defect (n=17) Anencephaly (n=12)
Prenatal Vitamin At any point from three months before
through the end of pregnancy From the month before through the first
month of pregnancy
17 (100%)
10 (59%)
12 (100%)
8 (67%)
Folic Acid as Single Vitamin At any point from three months before
through the end of pregnancy From the month before through the first
month of pregnancy
7 (41%)
3 (18%)
5 (42%)
3 (25%)
Multivitamin At any point from three months before
through the end of pregnancy From the month before through the first
month of pregnancy
1 (6%)
1 (6%)
1 (8%)
1 (8%)
1 Includes women with confirmed NTD-affected pregnancy before 2015 with a delivery or estimated delivery date of December 2012 or later and women with confirmed NTD-affected pregnancy in 2015.
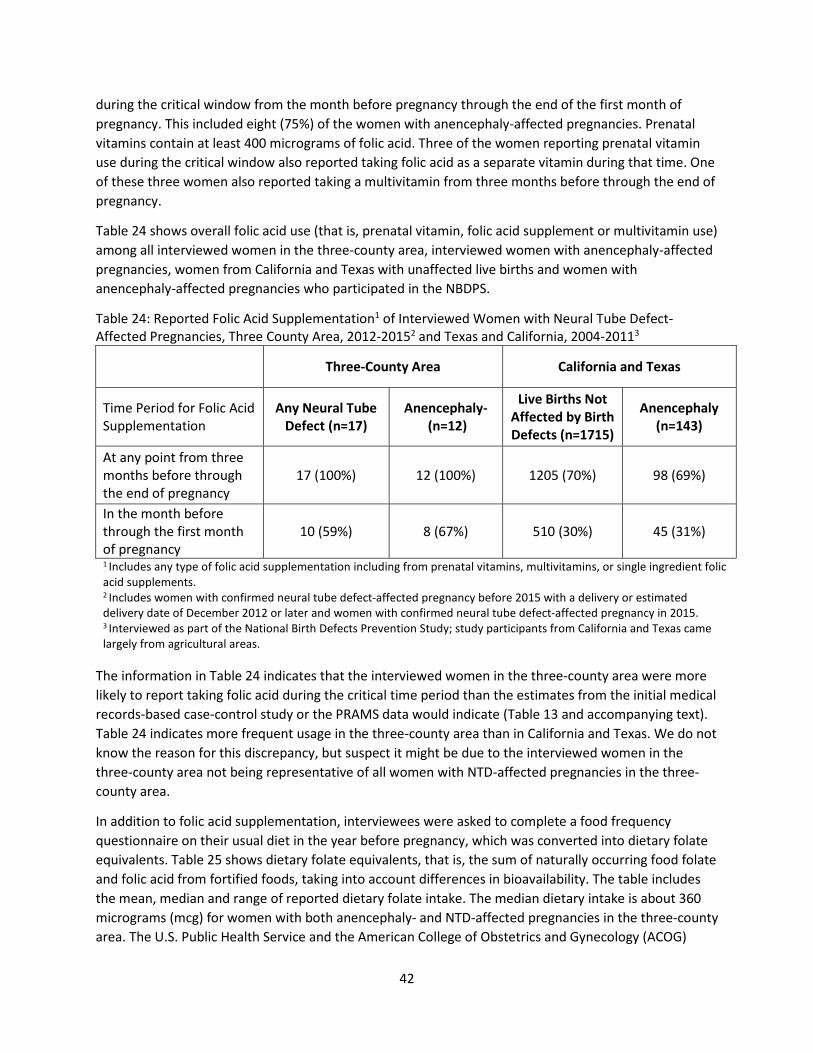
42
during the critical window from the month before pregnancy through the end of the first month of pregnancy. This included eight (75%) of the women with anencephaly-affected pregnancies. Prenatal vitamins contain at least 400 micrograms of folic acid. Three of the women reporting prenatal vitamin use during the critical window also reported taking folic acid as a separate vitamin during that time. One of these three women also reported taking a multivitamin from three months before through the end of pregnancy.
Table 24 shows overall folic acid use (that is, prenatal vitamin, folic acid supplement or multivitamin use) among all interviewed women in the three-county area, interviewed women with anencephaly-affected pregnancies, women from California and Texas with unaffected live births and women with anencephaly-affected pregnancies who participated in the NBDPS.
Table 24: Reported Folic Acid Supplementation1 of Interviewed Women with Neural Tube Defect-Affected Pregnancies, Three County Area, 2012-20152 and Texas and California, 2004-20113
Three-County Area California and Texas
Time Period for Folic Acid Supplementation
Any Neural Tube Defect (n=17)
Anencephaly- (n=12)
Live Births Not Affected by Birth Defects (n=1715)
Anencephaly (n=143)
At any point from three months before through the end of pregnancy
17 (100%) 12 (100%) 1205 (70%) 98 (69%)
In the month before through the first month of pregnancy
10 (59%) 8 (67%) 510 (30%) 45 (31%)
1 Includes any type of folic acid supplementation including from prenatal vitamins, multivitamins, or single ingredient folic acid supplements. 2 Includes women with confirmed neural tube defect-affected pregnancy before 2015 with a delivery or estimated delivery date of December 2012 or later and women with confirmed neural tube defect-affected pregnancy in 2015.
3 Interviewed as part of the National Birth Defects Prevention Study; study participants from California and Texas came largely from agricultural areas.
The information in Table 24 indicates that the interviewed women in the three-county area were more likely to report taking folic acid during the critical time period than the estimates from the initial medical records-based case-control study or the PRAMS data would indicate (Table 13 and accompanying text). Table 24 indicates more frequent usage in the three-county area than in California and Texas. We do not know the reason for this discrepancy, but suspect it might be due to the interviewed women in the three-county area not being representative of all women with NTD-affected pregnancies in the three-county area.
In addition to folic acid supplementation, interviewees were asked to complete a food frequency questionnaire on their usual diet in the year before pregnancy, which was converted into dietary folate equivalents. Table 25 shows dietary folate equivalents, that is, the sum of naturally occurring food folate and folic acid from fortified foods, taking into account differences in bioavailability. The table includes the mean, median and range of reported dietary folate intake. The median dietary intake is about 360 micrograms (mcg) for women with both anencephaly- and NTD-affected pregnancies in the three-county area. The U.S. Public Health Service and the American College of Obstetrics and Gynecology (ACOG)

43
recommend that all women of reproductive age consume at least 400 mcg of folic acid daily to prevent NTDs.59,60 Since it may be difficult to get this much folic acid through diet alone, ACOG’s current dietary guidelines recommend that pregnant women get at least 600 mcg of folic acid every day from all sources, including food and vitamins.61 The median dietary intake of interviewed women indicates that half of the interviewed women had dietary folate intakes close to the minimum recommended to prevent birth defects. The two women with anencephaly-affected pregnancies in the three-county area who had dietary folate intakes less than 200 mcg per day reported vitamin use during the critical window of the month before pregnancy through the end of the first month of pregnancy, as did one of the two women with 200-299 mcg, four of the five women with 300-399 mcg and one of the three women with ≥400 mcg dietary folate daily.
The mean dietary folate of interviewees in the three-county area appears lower than that of women with NTD-affected pregnancies in California and Texas interviewed through the NBDPS. The mean dietary folate of interviewees in the three-county area is also well below that of California and Texas women with pregnancies not affected by NTDs. This might be expected given the literature showing the protective effect of periconceptional folic acid intake for preventing neural tube defects.30,31,32,33,34,35
Nonetheless, interviewees with anencephaly- and NTD-affected pregnancies do not appear to be folate insufficient based on a combination of vitamin use and dietary intake. This could mean that the women who were interviewed do not represent the larger group of women with NTD-affected pregnancies in the three-county area, it could be that the interviewed women have a higher need for folate than other women, or it could suggest that a lack of folic acid is not the underlying explanation for the elevated rate of anencephaly in the region.
Table 25: Dietary Folate Intake of Interviewed Women with Neural Tube Defect-Affected Pregnancies, Three County Area, 2012-20151 and Texas and California, 2004-20112
Three-County Area California and Texas
Any Neural Tube Defect (n=17)
Anencephaly- (n=12)
Live Births Not Affected by Birth Defects (n=1364)
Anencephaly (n=114)
Mean Dietary Folate 347 mcg 317 mcg 573mcg 514mcg Median Dietary Folate 359 mcg 363 mcg na na Range Dietary Folate 50-775 mcg 50-496 mcg 0-3865mcg 0-1952 < 100 mcg 1 (6%) 1 (8%) 32 (2%) 3 (3%) 100-199 mcg 3 (18%) 1 (8%) 82 (6%) 11 (10%) 200-299 mcg 3 (18%) 2 (17%) 161 (12%) 21 (18%) 300-399 mcg 5 (29%) 5 (42%) 194 (14%) 14 (12%) ≥400 mcg 5 (29%) 3 (25%) 826 (61%) 60 (53%) Missing 0 (0%) 0 (0%) 69 (5%) 5 (4%)
1 Includes women with confirmed NTD-affected pregnancy before 2015 with a delivery or estimated delivery date of December 2012 or later and women with confirmed NTD-affected pregnancy in 2015.
2 Interviewed as part of the National Birth Defects Prevention Study; study participants from California and Texas came largely from agricultural areas. In response to concerns about possible fumonisin exposure, we also assessed reported corn consumption among interviewees in the three-county area. While all women reported at least some
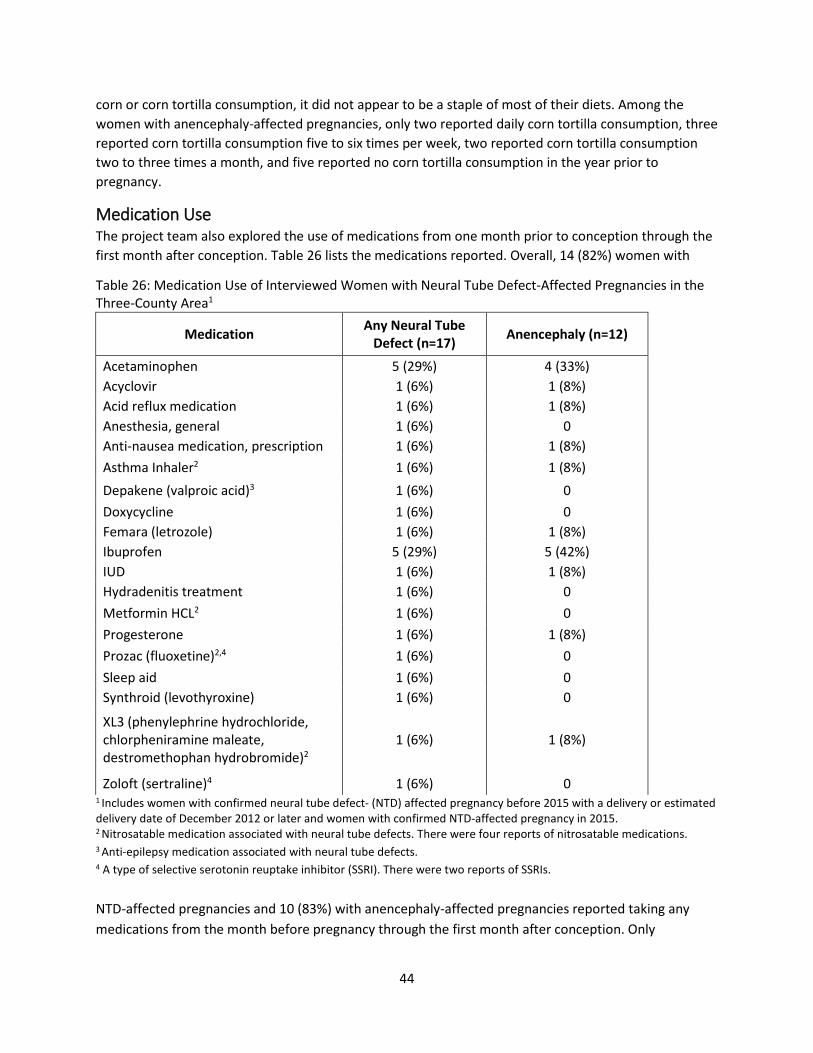
44
corn or corn tortilla consumption, it did not appear to be a staple of most of their diets. Among the women with anencephaly-affected pregnancies, only two reported daily corn tortilla consumption, three reported corn tortilla consumption five to six times per week, two reported corn tortilla consumption two to three times a month, and five reported no corn tortilla consumption in the year prior to pregnancy.
Medication Use The project team also explored the use of medications from one month prior to conception through the first month after conception. Table 26 lists the medications reported. Overall, 14 (82%) women with
Table 26: Medication Use of Interviewed Women with Neural Tube Defect-Affected Pregnancies in the Three-County Area1
Medication Any Neural Tube Defect (n=17) Anencephaly (n=12)
Acetaminophen 5 (29%) 4 (33%) Acyclovir 1 (6%) 1 (8%) Acid reflux medication 1 (6%) 1 (8%) Anesthesia, general 1 (6%) 0 Anti-nausea medication, prescription 1 (6%) 1 (8%) Asthma Inhaler2 1 (6%) 1 (8%) Depakene (valproic acid)3 1 (6%) 0 Doxycycline 1 (6%) 0 Femara (letrozole) 1 (6%) 1 (8%) Ibuprofen 5 (29%) 5 (42%) IUD 1 (6%) 1 (8%) Hydradenitis treatment 1 (6%) 0 Metformin HCL2 1 (6%) 0 Progesterone 1 (6%) 1 (8%) Prozac (fluoxetine)2,4 1 (6%) 0 Sleep aid 1 (6%) 0 Synthroid (levothyroxine) 1 (6%) 0
XL3 (phenylephrine hydrochloride, chlorpheniramine maleate, destromethophan hydrobromide)2
1 (6%) 1 (8%)
Zoloft (sertraline)4 1 (6%) 0 1 Includes women with confirmed neural tube defect- (NTD) affected pregnancy before 2015 with a delivery or estimated delivery date of December 2012 or later and women with confirmed NTD-affected pregnancy in 2015.
2 Nitrosatable medication associated with neural tube defects. There were four reports of nitrosatable medications. 3 Anti-epilepsy medication associated with neural tube defects. 4 A type of selective serotonin reuptake inhibitor (SSRI). There were two reports of SSRIs. NTD-affected pregnancies and 10 (83%) with anencephaly-affected pregnancies reported taking any medications from the month before pregnancy through the first month after conception. Only
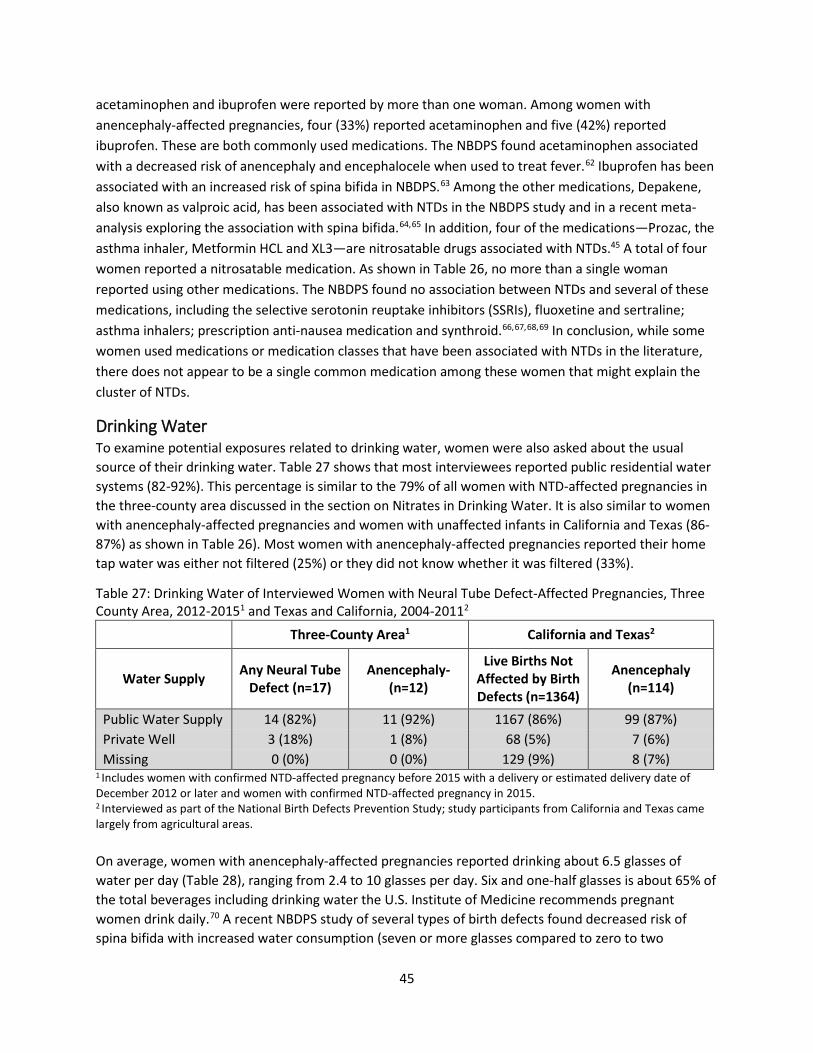
45
acetaminophen and ibuprofen were reported by more than one woman. Among women with anencephaly-affected pregnancies, four (33%) reported acetaminophen and five (42%) reported ibuprofen. These are both commonly used medications. The NBDPS found acetaminophen associated with a decreased risk of anencephaly and encephalocele when used to treat fever.62 Ibuprofen has been associated with an increased risk of spina bifida in NBDPS.63 Among the other medications, Depakene, also known as valproic acid, has been associated with NTDs in the NBDPS study and in a recent meta-analysis exploring the association with spina bifida.64,65 In addition, four of the medications—Prozac, the asthma inhaler, Metformin HCL and XL3—are nitrosatable drugs associated with NTDs.45 A total of four women reported a nitrosatable medication. As shown in Table 26, no more than a single woman reported using other medications. The NBDPS found no association between NTDs and several of these medications, including the selective serotonin reuptake inhibitors (SSRIs), fluoxetine and sertraline; asthma inhalers; prescription anti-nausea medication and synthroid.66,67,68,69 In conclusion, while some women used medications or medication classes that have been associated with NTDs in the literature, there does not appear to be a single common medication among these women that might explain the cluster of NTDs.
Drinking Water To examine potential exposures related to drinking water, women were also asked about the usual source of their drinking water. Table 27 shows that most interviewees reported public residential water systems (82-92%). This percentage is similar to the 79% of all women with NTD-affected pregnancies in the three-county area discussed in the section on Nitrates in Drinking Water. It is also similar to women with anencephaly-affected pregnancies and women with unaffected infants in California and Texas (86-87%) as shown in Table 26). Most women with anencephaly-affected pregnancies reported their home tap water was either not filtered (25%) or they did not know whether it was filtered (33%).
Table 27: Drinking Water of Interviewed Women with Neural Tube Defect-Affected Pregnancies, Three County Area, 2012-20151 and Texas and California, 2004-20112
Three-County Area1 California and Texas2
Water Supply Any Neural Tube Defect (n=17)
Anencephaly- (n=12)
Live Births Not Affected by Birth Defects (n=1364)
Anencephaly (n=114)
Public Water Supply 14 (82%) 11 (92%) 1167 (86%) 99 (87%) Private Well 3 (18%) 1 (8%) 68 (5%) 7 (6%) Missing 0 (0%) 0 (0%) 129 (9%) 8 (7%)
1 Includes women with confirmed NTD-affected pregnancy before 2015 with a delivery or estimated delivery date of December 2012 or later and women with confirmed NTD-affected pregnancy in 2015. 2 Interviewed as part of the National Birth Defects Prevention Study; study participants from California and Texas came largely from agricultural areas. On average, women with anencephaly-affected pregnancies reported drinking about 6.5 glasses of water per day (Table 28), ranging from 2.4 to 10 glasses per day. Six and one-half glasses is about 65% of the total beverages including drinking water the U.S. Institute of Medicine recommends pregnant women drink daily.70 A recent NBDPS study of several types of birth defects found decreased risk of spina bifida with increased water consumption (seven or more glasses compared to zero to two

46
glasses).71 None of the interviewees reported drinking fewer than two glasses of water daily, and only one women with an anencephaly-affected pregnancy reported drinking 2.4 glasses daily. The remaining women drank at least 3.4 glasses daily. Almost all women reported drinking some bottled water. On average, 42% of women’s drinking water was from bottled water. Women reported drinking an average about one glass of water per day away from home, about 15% of their reported consumption.
Table 28: Drinking Water Consumption of Interviewed Women with Neural Tube Defect-Affected Pregnancies in the Three-County Area1
Any Neural Tube Defect (n=17)
Anencephaly (n=12)
Tap Water Filtered Yes 5 (29%) 3 (25%) No 5 (29%) 5 (42%) Don’t Know 7 (41%) 4 (33%)
Drinking Water2 Unfiltered Tap 4 (24%) 4 (33%) Filtered Tap 5 (29%) 3 (25%) Bottled 16 (94%) 11 (92%)
Mean Glasses Daily3 Unfiltered (SD) 0.9 (1.8) 1.3 (2.1) Filtered (SD) 1.1 (2.0) 0.7 (1.2) Away from home (SD) 1.1 (1.8) 1.2 (2.1) Bottled (SD) 3.0 (3.2) 2.5 (2.7) Other (SD) 1.1 (2.7) 0.9 (2.6) Total (SD) 7.2 (3.5) 6.5 (3.7)
1 Includes women with confirmed neural tube defect-affected pregnancy before 2015 with a delivery or estimated delivery date of December 2012 or later and women with confirmed neural tube defect-affected pregnancy in 2015. 2 Categories are not mutually exclusive. 3.Number of eight ounce glasses per day.
In summary, most woman were on public water supplies which, as examined in the Nitrates and Drinking Water Section, did not indicate potential for high levels of exposure to nitrates. They drank minimal water away from home and it is likely most of the water away from home was also from public water systems. Although we were not able to analyze information on other liquids consumed, it is likely that the interviewed women drank sufficient amounts of liquid to meet the U.S. Institute of Medicine’s recommendation, given that their water intake accounted for 65% of the total amount recommended, and none of the women reported drinking water at the low levels found to be harmful in the NBDPS.
Occupational Exposures and Household Pesticide Use Interviewed women with NTD-affected pregnancies in the three-county area were also asked whether they worked at least one month from three months prior to pregnancy through the end of their NTD- affected pregnancy to assess the probability of occupational exposure. Many women reported working including 11 (65%) of women with NTD-affected pregnancies and nine (75%) with anencephaly-affected

47
pregnancies. These percentages appear higher than those of women with anencephaly-affected pregnancies (54%) and women with unaffected pregnancies (51%) from California and Texas participating in the NBDPS, but we did not conduct statistical tests due to the small numbers.
Industrial hygienists assessed the probability of exposure and type of exposure based on women’s responses to questions about their occupational history. For jobs associated with different probabilities of pesticide exposure, the industrial hygienists also estimated the intensity and frequency of exposure. Estimated exposures below are from one month prior through two months after conception which includes the critical window of neural tube formation. Table 29 shows that all of the women who reported working worked during this time period. Among women with anencephaly-affected pregnancies, none were likely to have had occupational exposure to solvents, including benzene, xylene, toluene, Stoddard solvent, chloroform, methylene chloride, carbon tetrachloride, perchloroethylene, trichloroethane, or trichloroethylene. One woman with an anencephaly-affected pregnancy had a low probability of occupational exposure to polycyclic aromatic hydrocarbon (PAH), and four women (44%) were likely to have had occupational exposures to pesticides, including three through farm jobs and one from a non-farm job with likely a low intensity of exposure. Three women also had jobs with high physical demands. We were not able to obtain comparative information for California and Texas women with anencephaly-affected pregnancies to put these findings in context. However, a paper from the NBDPS using the same method to estimate occupational exposures reported 30% of women with pregnancies not affected by NTDs from eight sites including California and Texas were likely to be occupationally exposed to pesticides.13
Table 29: Peri-conceptional Employment and Associated Potential Occupational Exposures of Interviewed Women with Neural Tube Defect-Affected Pregnancies in the Three-County Area1,2
Any Neural Tube Defect
(n=17) Anencephaly (n=12) Mother worked month before through 2 months of pregnancy 11 (100%) 9 (100%) Mother had multiple jobs 1 (9%) 1 (11%) Solvent exposure 1 (9%) 0 Polycyclic Aromatic Hydrocarbons 2 (18%) 1 (11%) Pesticides 5 (45%) 4 (44%) High Physical Demands 3 (27%) 3 (33%) Insecticide 4(36%) 4 (44%) Fungicide 4(36%) 4 (44%) Herbicide 5 (45%) 4 (44%) Exposed to insecticides, fungicides and herbicides through farm work 3 (27%) 3 (33%)
1 Includes women with confirmed neural tube defect- (NTD) affected pregnancy before 2015 with a delivery or estimated delivery date of December 2012 or later and women with confirmed NTD-affected pregnancy in 2015. 2Percentages in this table are based on women who reported working. This removes women who did not work from the calculation, rather than consider them unexposed.

48
Similar to occupational pesticide exposures, reported pesticides used in or around the home included a variety of situations that could result in a range of potential exposures depending on the product used, type of application, the number of times applied and who applied the product. Table 30 shows seven (35%) women with NTD-affected pregnancies, including five (33%) with anencephaly-affected pregnancies, reported pesticides used in or around their home from three months before pregnancy through the end of the first trimester. For women with anencephaly-affected pregnancies, this included two women who reported their homes were treated for ants by someone else. One of these women also reported using head lice products that could only be obtained with a physician’s prescription. Additionally, one woman reported a family pet that was treated for fleas or ticks and two women reported the father applied weed killer one time. Among these five women, two also had probable occupational pesticide exposures. These questions were added to the interview specifically for this investigation; thus, we do not have comparable information to put these potential exposures into context. However, there did not seem to be any home exposures common enough among all women with NTD-affected pregnancies to explain the cluster.
Table 30: Potential Exposures from Household Pesticide Use among Interviewed Women with Neural Tube Defect-Affected Pregnancies in the Three-County Area1
Any Neural Tube Defect (n=17) Anencephaly (n=12)
Household Pesticide Use 7 (41%) 5 (42%)
Treat insects 4 (24%) 2 (17%) Treat pets 1 (6%) 1 (8%) Treat houseplants/lawn/garden 3 (18%) 2 (17%) Treat head lice 1 (6%) 1 (8%)
1 Includes women with confirmed neural tube defect- (NTD) affected pregnancy before 2015 with a delivery or estimated delivery date of December 2012 or later and women with confirmed NTD-affected pregnancy in 2015
Any Risk Factor for Neural Tube Defects We also explored the extent to which interviewed women with anencephaly-affected pregnancies from the three-county area had any widely accepted risk factor for neural tube defects. We considered accepted risk factors to include pre-gestational diabetes, Hispanic ethnicity, family history of neural tube defects, use of anti-epileptic medication, and obesity. Seventy-five percent of women had at least one of these risk factors. When we considered risk factors excluding Hispanic ethnicity, five (42%) interviewed women had at least one risk factor. While these factors have been reported to confer increased risk for NTDs, they are common among the population, in general, and thus, we cannot know how they might have affected any specific pregnancy. In fact, 86% of California and Texas women with healthy babies participating in the NBDPS had one or more risk factors including Hispanic ethnicity.
In summary, the interviews did not identify a single unique exposure which might explain the increased rate of NTDs or anencephaly in the three-county area. Rather, similar to the research on NTDs conducted over the past 30 years, it is likely that multiple complex factors are contributing to the increase. However, the low proportion of women who were interviewed and the possibility that they did not represent all women with NTD-affected pregnancies makes the interpretation of results challenging.

49
Outreach and Prevention In collaboration with the March of Dimes, local health jurisdictions and other state and local partners, DOH has undertaken a variety of activities related to preventing NTDs since the summer of 2014. DOH’s focus has been on increasing use of prenatal supplementation with folic acid, because this is the only known way to effectively prevent NTDs. In August of 2014, DOH staff initiated monthly Anencephaly Prevention calls to coordinate prevention and outreach efforts across state and local health, the March of Dimes, and others working in the community to promote maternal and child health. DOH also partnered with the Washington State Hospital Association (WSHA) in their Safe Deliveries Roadmap Initiative to develop best-practice recommendations for pre-pregnancy, pregnancy, labor management, and postpartum care. These recommendations include the importance of folic acid use prior to pregnancy as well as the importance of women’s health before they become pregnant. The recommendations were launched in September of 2015. DOH also partnered with the Washington State Health Care Authority to make information available about Apple Health coverage of prenatal vitamins. In addition, the DOH WIC program continues to promote folic acid use through the foods available on the WIC food package, and through nutrition education. Additional activities are summarized below by the primary intended audience.
Families and Women of Reproductive Age in Three-County Area and Statewide DOH initiated a series of activities to promote folic acid messaging across the state, with a particular focus in the three-county area. DOH has maintained a webpage on the anencephaly investigation, which has been updated frequently. In 2016, DOH developed webpages in Spanish with up-to-date information about folic acid and anencephaly.
DOH staff have worked with local partners to reach out to families and women of reproductive age primarily in the three-county area to understand their concerns, provide information on the importance of preconception folic acid supplementation and provide folic acid supplements.
Other activities include:
• March of Dimes shared English and Spanish Public Service Announcements (PSAs) promoting supplemental folic acid use with 45 radio stations in Eastern Washington. Local public health supported this by writing letters to radio stations encouraging them to play the PSAs.
• DOH conducted a paid radio campaign predominantly in the three-county area which resulted in 2,759 English and Spanish radio ads about folic acid. We also developed a radio novella campaign, which aired 817 times in Spanish.
• DOH and local health jurisdiction staff have participated in on-air interviews about anencephaly targeted to the three-county area, as well as in King County to Spanish-speaking residents.
• DOH, March of Dimes, Yakima Public Health and Benton-Franklin Health District staff have distributed brochures and educational materials about folic acid in both English and Spanish throughout the three-county area. Staff focused on where women of reproductive age may congregate, and distributed these materials at community colleges, technical colleges, hair salons and nail salons.
• DOH, Yakima Public Health and Benton-Franklin Health District staff distributed materials at the Yakima County Fair and the TriCities Community Health Fair.

50
• Yakima Public Health and Benton-Franklin Health District have received free prenatal vitamins through Vitamin Angels. They are distributing these through healthcare clinics and their public health programs. These are intended for women who are not eligible for Apple Health but have financial need for free vitamins. Both departments report success in their distribution; Benton-Franklin Health District recently shared that by October 2016 they had distributed 3,359 bottles, and Yakima County Health District reported distribution of 54 bottles. Additionally, Benton-Franklin Health District was granted an additional year of support, and received another 3,024 bottles for distribution.
Activities to Address Community Concerns in Three-County Area DOH held two community listening sessions in Sunnyside (Yakima County) and Kennewick (Benton County) to learn about health issues and potential exposures in the three-county area that might affect pregnant women. Community members raised the following areas of potential concern:
• E. coli contamination • Nitrates in drinking water • Mold in corn masa flour • Health of the infant’s father • The effects of poor air quality • Exposure to radiation from Hanford • Cache Valley Virus • The presence of depleted uranium in local soil/water • Mothers/fathers related by blood • Pesticides in drinking water • Lead or arsenic in soil • Heavy metals exposure • Polyethylene Terephthalate (PET) • Glyphosate • Waste stream effluent • The use of unregulated waste as fertilizer • Recreational drug use
All of the concerns raised by community members were considered and several of them led to exposure investigations that DOH conducted over the course of the cluster investigation, including the analyses of drinking water nitrate concentrations, and potential exposures to radiation and pesticides.
Hospitals and Healthcare Providers • DOH worked with Yakima Public Health and Benton-Franklin Health District to issue two health
alerts to providers in their area through blast-faxes. • Yakima Public Health ran three articles in the Yakima Health Bulletin: one about the medical
records-based case-control study, one to advertise the listening sessions and share prevention messages, and one focused on birth defects prevention.
• DOH and Benton-Franklin Health District staff made presentations to the statewide Perinatal Advisory Committee, healthcare providers at Yakima Memorial Hospital and Kadlec Hospital, and the Yakima Health District Board of Directors.

51
• DOH developed a Folic Acid Provider resource sheet, and shared this with providers at four large conferences: The Community Health Worker Conference in Granger, Washington; the State Obstetric Annual Meeting; the Advanced Practice in Acute and Primary Care Annual Conference for Nurse Practitioners and Physician Assistants; and the Clinic Conferences for Midwives at the University of Washington.
o This resource sheet was downloaded from the DOH website over 130 times in the first four months of its posting. This resource sheet was also translated into Spanish for Spanish-speaking community health workers.
• DOH continues to partner with the Washington State Health Care Authority to get information to Medicaid providers about Apple Health coverage for prenatal vitamins for all women of reproductive age.
Qualitative Interviews Between May and June 2016, DOH staff conducted 42 interviews with women in the three-county area to learn about the best ways to get information about folic acid, prenatal vitamins, and anencephaly to the community. The interviews were conducted in English and Spanish by DOH staff and students from Central Washington University.
Table 31: Locations Where Women of Childbearing Age Were Identified and Participated in Qualitative Interviews
Location Health District Number of Interviews
La Leche League Meeting Yakima 5 Yakima Valley Farmworkers WIC Clinic Yakima 3 Yakima Public Parks Yakima 7 Yakima Valley Community College Yakima 2 Benton-Franklin Health District Benton-Franklin 16 Kennewick Farmer’s Market Benton-Franklin 5 Prosser Public Library Benton-Franklin 4 Total 42

52
The women interviewed varied in age, race and ethnicity, health insurance coverage, and pregnancy status (Table 32). The majority of the women were Latina or non-Hispanic white (90%), aged 35 or younger (88%), and half reported that their last pregnancy was reimbursed by Medicaid.
Table 32: Interviewee Demographics Interviewee Demographics Number Age 25 years or younger 26-35 years 36-45 years 46 years or older
15 22 4 1
Race and Ethnicity Asian, East-Indian Latina/Hispanic Native American White (Non-Hispanic) More than one race: Native American and Black Native American and White
1 16 1
22
1 1
Insurance Status Medicaid Private Insurance None
21 17 4
Pregnancy Status Has Children, Not Pregnant Pregnant Not Pregnant, No Children
26 9 7
All participants were asked the same questions about how they prefer to receive health information. Follow-up questions were asked depending on the participant’s pregnancy status and answers to previous questions. The interview results can be separated into four themes: 1) Health information and decision making, 2) Folic acid and prenatal vitamin knowledge and use, 3) Anencephaly awareness and concern, and 4) Recommendations for outreach.
Health information and decision making
Preferences for receiving health information Most participants—both Latina and non-Latina—prefer to get their information about health during pregnancy from a healthcare provider or clinic (Table 33). Specifically, women mentioned preferring to get information from their obstetrician or gynecologist, midwife or primary care provider. The Yakima Valley Farmworkers Clinic and Planned Parenthood were mentioned as healthcare centers where women prefer to get information. About half of the participants looked online for health information, most commonly through a Google search or directly visited a website like WebMD. However, Hispanic women were more likely to report going online for health information. Some participants also report getting health information from family and friends, but this was more common among women who were not Latina.
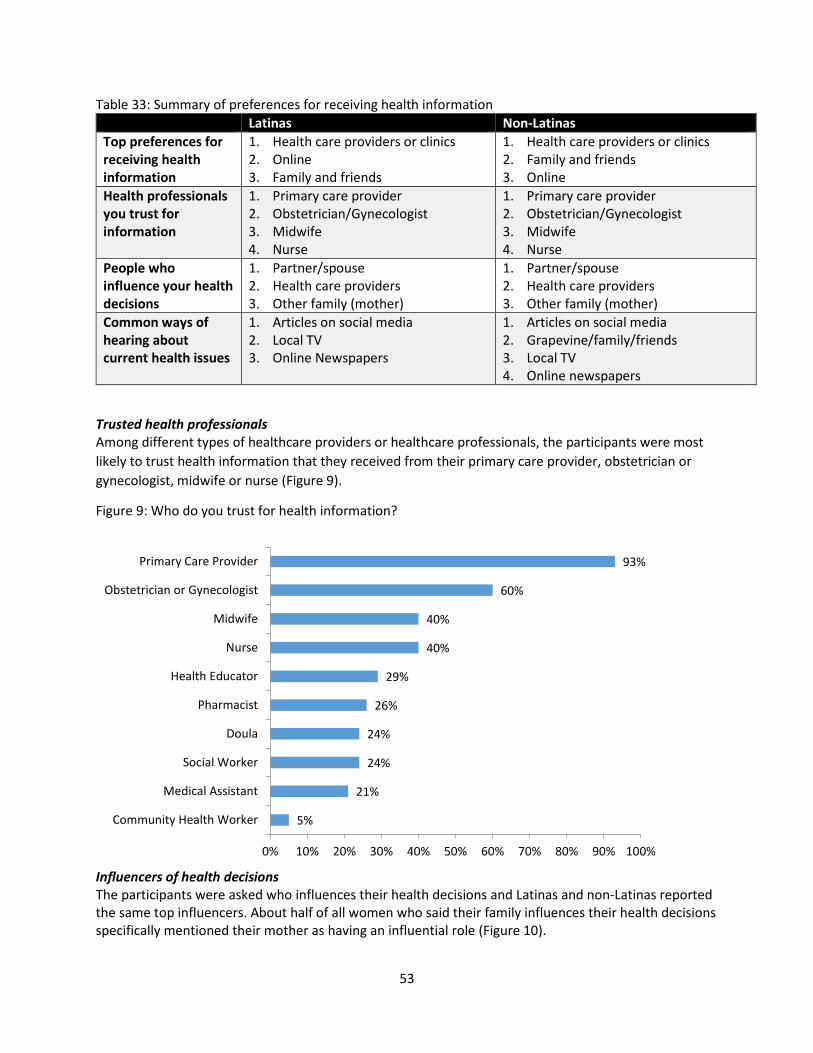
53
Table 33: Summary of preferences for receiving health information Latinas Non-Latinas Top preferences for receiving health information
1. Health care providers or clinics 2. Online 3. Family and friends
1. Health care providers or clinics 2. Family and friends 3. Online
Health professionals you trust for information
1. Primary care provider 2. Obstetrician/Gynecologist 3. Midwife 4. Nurse
1. Primary care provider 2. Obstetrician/Gynecologist 3. Midwife 4. Nurse
People who influence your health decisions
1. Partner/spouse 2. Health care providers 3. Other family (mother)
1. Partner/spouse 2. Health care providers 3. Other family (mother)
Common ways of hearing about current health issues
1. Articles on social media 2. Local TV 3. Online Newspapers
1. Articles on social media 2. Grapevine/family/friends 3. Local TV 4. Online newspapers
Trusted health professionals Among different types of healthcare providers or healthcare professionals, the participants were most likely to trust health information that they received from their primary care provider, obstetrician or gynecologist, midwife or nurse (Figure 9).
Figure 9: Who do you trust for health information?
Influencers of health decisions The participants were asked who influences their health decisions and Latinas and non-Latinas reported the same top influencers. About half of all women who said their family influences their health decisions specifically mentioned their mother as having an influential role (Figure 10).
5%
21%
24%
24%
26%
29%
40%
40%
60%
93%
0% 10% 20% 30% 40% 50% 60% 70% 80% 90% 100%
Community Health Worker
Medical Assistant
Social Worker
Doula
Pharmacist
Health Educator
Nurse
Midwife
Obstetrician or Gynecologist
Primary Care Provider

54
Figure 10: Who in your life impacts the health decisions you make for you and your child?
Preferences for hearing about health news Social media (specifically Facebook), local television, and online news are the best methods to get health-related information to the participants interviewed (Table 33). Although the same methods fall in the top reported ways of receiving health-related information, certain methods might be more effective in reaching Latinas compared with non-Latinas. Other methods of hearing about news that were reported by less than 10% of women overall include at the doctor’s office, at work, news app and radio.
Folic Acid and Prenatal Vitamin Knowledge and Use
Of the 35 women who had been or were currently pregnant, about half reported hearing about folic acid prior to pregnancy, and half wished they had received more information about folic acid before becoming pregnant. The majority of women started taking prenatal vitamins or folic acid once they found out they were pregnant, most commonly after their first prenatal appointment (Table 34).
Table 34: When did you start taking prenatal vitamins?
Once I found out I was pregnant 25 1 month before pregnancy 3 3 months before pregnancy 4 1-3 years before pregnancy 3 Currently taking vitamins and trying to conceive 1 Not sure (not pregnant, no previous pregnancy) 1 Not applicable (not pregnant, no previous pregnancy, not trying, not taking vitamins) 5 Total 42
2%
7%
12%
14%
36%
36%
52%
0% 10% 20% 30% 40% 50% 60%
Coworkers
Friends
My Children
Myself
Family
Healthcare Provider
Partner/Spouse

55
These 35 participants were asked what motivated or prevented them, or other women they know, from regularly taking their prenatal vitamins.
• The top three motivating factors for taking prenatal vitamins reported were: 1. Good for own health. 2. Good for baby’s health. 3. Told to by doctor or midwife.
• The top three barriers for taking prenatal vitamins reported were: 1. The vitamins make you sick. 2. Women don’t know why they’re important. 3. Women forget to take them.
Additionally, the majority of these participants said that they would definitely ask their provider for a prescription for prenatal vitamins.
Anencephaly Awareness and Concern
The 35 women who had been or currently were pregnant were asked about their knowledge of anencephaly, and the majority of participants had never heard of this neural tube defect. Participants were more likely to be concerned about birth defects in general than they were about anencephaly specifically. About half of the participants didn’t feel like they had enough information about anencephaly before pregnancy and wished they had known more.
Outreach Recommendations
The participants made recommendations about how DOH could get information on folic acid and anencephaly to women like them more effectively. Their recommendations include three strategies mentioned consistently, and evident from interview results.
1. Work with healthcare providers to incorporate folic acid education into appointments with all patients of childbearing age, especially for girls and women who are sexually active. Use these pre-pregnancy interactions to share information about the benefits and importance of folic acid before and during pregnancy, and the relationship between folic acid and birth defects. Include information about how women can access prenatal vitamins.
2. Run bilingual folic acid awareness ads on Facebook and Instagram to increase awareness about the benefits of folic acid, when women should start taking prenatal vitamins, the relationship between folic acid and birth defects, and access to free vitamins for women insured through Apple Health. Build messaging off of reported motivating factors and barriers. Target audiences should include:
• Women not trying to get pregnant • Women trying to get pregnant • Pregnant women • Future fathers • Family members of women of childbearing age
3. Use local media strategically to share updates about the anencephaly investigation and folic acid information. Local news organizations are trusted and followed sources for health information.
56
Conclusions We reviewed the descriptive epidemiology of the anencephaly-affected pregnancies and all NTDs in the three-county area from January 2010 to August 2016 and explored the NTD case mix, as well as distribution of cases over time, geography and seasonality. Anencephaly-affected pregnancies and all NTDs occurred across the entire time period, and we did not identify a strong peak in time, geography or seasonality. Both Hispanics/Latinas and non-Hispanic whites showed higher than expected rates. In addition, anencephaly comprised 64% of NTDs diagnosed over this time period, more than the approximate third of NTDs reported in the scientific literature.24,25
We observed that several women with anencephaly-affected pregnancies were diagnosed early in pregnancy. Because women with anencephaly-affected pregnancies may choose to terminate the pregnancy early, we explored whether including these early terminations resulted in including NTDs in the three-county area that might not have been identified and counted in other areas. We compared gestational age of anencephaly-affected pregnancies less than 20 and 20 or more weeks based on certificate status in the three-county area with gestational age in the NBDPS study from California and Texas. The comparison led us to conclude that the rates from the three-county area were indeed elevated. However, the magnitude of the increase (originally estimated at four times higher than the U.S. multi-state rate) had likely been exaggerated due to more complete ascertainment of cases in the three-county area compared with elsewhere in the country.
We explored a number of hypotheses, including several community concerns, as possible contributions to the increased rate of anencephaly in the three-county area, but were unable to identify a single preventable exposure likely to have caused most of the cases. We were able to rule out some community concerns as a cause for most cases. Based on our analyses, the increase is not likely due to radiation exposure from the Fukushima Daiichi disaster or Hanford. It is also not likely due to nitrates in drinking water or fumonisins in corn. We used three different approaches to assess potential for pesticide exposure and none of these indicated greater potential for exposure among parents of NTD-affected pregnancies compared to other pregnancies in the three-county area. Our medical records-based case-control study of the first 27 cases did not identify a preventable exposure on which we could intervene, nor did our in-depth case interviews of mothers using the modified NBDPS questionnaire. We believe the increased rate is likely due to multiple risk factors working together.
Folic acid supplementation in the three-county area is lower than elsewhere in Washington. We conducted a number of outreach activities to promote folic acid supplementation as well as to learn how best to reach women of reproductive age in the three-county area with information related to folic acid. Incorporating this education into ongoing state and local efforts to promote the health of women prior to pregnancy, as well as promoting early access to prenatal care to detect any issues or complications, will help to ensure the health of mothers and babies.
Future Efforts After discussion with the Yakima and the Benton-Franklin Health District and with the support of the Advisory Committee in summer 2016, DOH decided to suspend additional investigation into the cause of the elevated rate of anencephaly and disband the Advisory Committee. DOH will focus future public health efforts on surveillance, outreach and prevention of NTDs. DOH will continue enhanced

57
surveillance of anencephaly and NTDs in the three-county area, along with ongoing passive surveillance across Washington State, until January 2018. At that time, DOH will revisit whether to continue the enhanced surveillance. DOH will incorporate the lessons learned from qualitative interviews, and continue to integrate NTD prevention into ongoing health education and system-wide efforts to promote the preconception and pregnancy health of all women and their children.

58
Glossary 1. Neural Tube Defects – Birth defects of the brain, spine or spinal cord. They occur within the first
month of pregnancy, often before a woman is aware that she is pregnant. The most common neural tube defects are spina bifida and anencephaly.
2. Anencephaly - A serious birth defect in which an infant is born without parts of the brain and skull. Anencephaly occurs when the upper portion of the neural tube fails to fully close during the first month of gestation, often resulting in the baby being born without significant portions of the cerebrum and skull cap. The remaining parts of the brain are typically not covered by bone or skin. If carried to term, anencephalic infants rarely survive more than minutes or hours after birth.
3. Spina Bifida – A birth defect of variable severity in which an infant is born with an opening in the spinal column through which cerebro-spinal fluid and nerves may protrude. The primary forms of Spina Bifida (SB) listed in increasing order of severity are: SB occulta, meningocele, and meningomyelocele.
4. Encephalocele – A birth defect characterized by a sac-like protrusion of the brain and membranes through an opening in the skull. Unlike Anencephaly, infants with an encephalocele typically survive birth, and surgical repair of the encephalocele is possible when the infant is stable enough for surgical sedation. The encephalocele can be variably positioned on the skull, from naso-frontal to occipital protrusions.

59
References
1 Parker SE, Mai CT, Canfield MA, et al. (2010). Updated national birth prevalence estimates for selected birth defects in the United States, 2004-2006. Birth Defects Research (Part A), 88, 1008-1016.
2 Centers for Disease Control and Prevention. (2016). Facts about Anencephaly. Available at: http://www.cdc.gov/ncbddd/birthdefects/anencephaly.html. 3 Centers for Disease Control and Prevention. (2016). Birth Defects COUNT. Available at: https://www.cdc.gov/ncbddd/folicacid/global.html.
4 Agopian AJ, Tinker SC, Lupo PJ, Canfield MA, Mitchell LE. (2013). Proportion of neural tube defects attributable to known risk factors. Clinical and Molecular Teratology: Birth Defects Research Part A, 97, 42-46.
5 Mitchell LE (2005). Epidemiology of neural tube defects. American Journal of Medical Genetics Part C, 135C, 88-94.
6 Washington State Department of Health. (2007). Washington State Department of Health Guidelines for Investigating Clusters of Chronic Disease and Adverse Birth Outcomes.
7 Kulldorff MA and Information Management Services, Inc. (2016) SaTScan v9.4.4: Software for the spatial and space-time scan statistics. Available at http://www.satscan.org.
8 Kulldorf MA. (1997). A spatial scan statistic. Communications in Statistics: Theory and Methods, 26, 1481-1496. 9 Division of Environmental Health. (2016). Source Water Assessment Program (SWAP) Maps. Olympia: Washington State Department of Health. Available at: https://fortress.wa.gov/doh/eh/dw/swap/maps/ 10 Division of Environmental Health. (2016). Find Water Systems Tool [Online Software]. Olympia: Washington State Department of Health. Available at https://fortress.wa.gov/doh/eh/portal/odw/si/FindWaterQuality.aspx
11 United States Environmental Protection Agency (EPA). (2016). Estimated Nitrate Concentrations in Groundwater Used for Drinking. Available at https://www.epa.gov/nutrient-policy-data/estimated-nitrate-concentrations-groundwater-used-drinking
12 Shaw GM, Wasserman CR, O’Malley CD, Nelson V., Jackson RT. (1999). Maternal pesticide exposure from multiple sources and selected congenital anomalies. Epidemiology, 10(1), 60-66.

60
13 Makelarski JA, Romitte PA, Rocheleau CM, et al. (2014). Maternal periconceptional occupational pesticide exposure and neural tube defects. Clinical and Molecular Teratology: Birth Defects Research Part A, 100(11), 877-886.
14 Rull RP, Ritz B, Shaw GM. (2006). Neural tube defects and maternal residential proximity to agricultural pesticide applications. American Journal of Epidemiology, 163(8), 743-753.
15 Nordby KC, Andersen A, Irgens LM, Kristensen P. (2005). Indicators of mancozeb exposure in relation to thyroid cancer and neural tube defects in farmers’ families. Scandinavian Journal of Work, Environment & Health, 31(2), 89-96.
16 Yang W, Carmichael S, Roberts EM, et al. (2014) Residential agricultural pesticide exposures and risk of neural tube defects and orofacial clefts among offspring in the San Jaoquin Valley of California. American Journal of Epidemiology, 179, 740-748.
17 Lacasaña M, Vázquez-Gramiex H, Borja-Aburto VH, et al. (2006). Maternal and paternal occupational exposure to agricultural work and the risk of anencephaly. Journal of Occupational and Environmental Medicine, 63, 649-656.
18 Washington State Pest Management Resource Service (WSPRS) (2016). Pesticide Information Center Online (PICOL) Databases. Washington State University. Available at http://cru66.cahe.wsu.edu/LabelTolerance.html
19 National Water-Quality Assessment (NAWQA) Program. (2016). Pesticide National Synthesis Project: Estimated Annual Agricultural Pesticide Use. United States Geological Survey. Available at https://water.usgs.gov/nawqa/pnsp/usage/maps/ .
20 Division of Environmental Health. (2016). Sentry Internet [Online Software]. Olympia: Washington State Department of Health. Available at http://www.doh.wa.gov/DataandStatisticalReports/EnvironmentalHealth/DrinkingWaterSystemData/SentryInternet
21 Washington Natural Resources Assessment Section (2016). Agricultural Land Use. Washington State Department of Agriculture. Available at http://agr.wa.gov/pestfert/natresources/aglanduse.aspx
22 Reefhuis J, Gilboa SM, Anderka M, et al. (2015). The National Birth Defects Prevention Study: a review of the methods. Clinical and Molecular Teratology: Birth Defects Research Part A, 103(8), 656-669.
23 Rocheleau CM, Lawson CC, Waters MA, et al. (2011). Inter-rater reliability of assessed prenatal maternal occupational exposures to solvents, polycyclic aromatic hydrocarbons, and heavy metals. Journal of Occupational and Environmental Hygiene, 8, 718-728.

61
24 Parker SE, Mai CT, Canfield MA, et al. (2010). Updated national birth prevalence estimates for selected birth defects in the United States, 2004-2006. Birth Defects Research (Part A), 88, 1008-1016.
25 Mai CT, Isenburg J, Langlois PH, et al. (2015). Brief report: population-based birth defects data in the United States, 2008 to 2012: presentation of state-specific data and descriptive brief on variability of prevalence. Clinical and Molecular Teratology: Birth Defects Research Part A, 103, 972-994.
26 Canfield MA, Mai CT, Wang Y, et al. (2014). The association between race/ethnicity and major birth defects in the United States, 1999-2007. American Journal of Public Health, 104(9), e1-e10.
27 Browne ML, Kirby RS (Editors). (2014). Special Issue: 2014 Congenital Malformations Surveillance Report: A Report from the National Birth Defects Prevention Network. National Birth Defects Prevention Network, 100(11), 813-904. Available at http://www.nbdpn.org/annual_report_2014.php.
28 Jackson JM, Crider KS, Cragan JD, Rasmussen SA, Olney RS (2013). Frequency of prenatal cytogenetic diagnosis and pregnancy outcomes by maternal race-ethnicity, and the effect on the prevalence of trisomy 21, metropolitan Atlanta, 1996-2005. American Journal of Medical Genetics Part A, 164(A), 70-76. 29 Note: A previous publication of these data (Person A, Spitters C, Patrick G, et al. (2013). Notes from the Field: Investigation of a Cluster of Neural Tube Defects – Central Washington 2010-2013. Centers for Disease Control and Prevention Morbidity and Mortality Weekly Report, 62(35), 728) did not note statistically significant differences in age between cases and controls. The differences in the findings are due to different statistical methods. 30 Czeizel AE, Dudás I. (1992). Prevention of the first occurrence of neural-tube defects by periconceptional vitamin supplementation. The New England Journal of Medicine, 327, 1832-1835. 31 Berry RJ, Li Z, Erickson JD, et al. (1999). Prevention of neural-tube defects with folic acid in China. The New England Journal of Medicine, 341, 1485-1490. 32 Williams LJ, Rasmussen SA, Flores A, Kirby RS, Edmonds LD. (2005). Decline in the prevalence of spina bifida and anencephaly by race/ethnicity: 1995-2002. Pediatrics, 116(3), 580-586. 33 Sayed AR, Bourne D, Pattinson R, Nixon J, Henderson B. (2008). Decline in the prevalence of neural tube defects following folic acid fortification and its cost-benefit in South Africa. Clinical and Molecular Teratology: Birth Defects Research Part A, 82(4), 211-216. 34 Moore LL, Bradlee ML, Singer MR, Rothman KJ, Milunksy A. (2003). Folate intake and the risk of neural tube defects: an estimation of dose-response. Epidemiology, 14(2), 200-205.

62
35 MRC Vitamin Study Research Group. (1991). Prevention of neural tube defects: results of the medical research council vitamin study. The Lancet, 338, 131-137.
36 Washington State Department of Health. (2016). Washington State Pregnancy Risk Assessment Monitoring System (PRAMS) Data. Centers for Disease Control and Prevention.
37 Washington State Department of Ecology. (2010). Lower Yakima Valley Groundwater Quality – Preliminary Assessment and Recommendations Document. Publication No. 10-10-009, February 2010.
38 United States Environmental Protection Agency (EPA). (2013). Relation Between Nitrate in Water Wells and Potential Sources in the Lower Yakima Valley, Washington. Publication No. EPA-910-R-13-004. 39 United States Environmental Protection Agency (EPA). (2012). Lower Yakima Valley Nitrate Study Fact Sheet. Available at https://www.epa.gov/sites/production/files/2017-12/documents/lower-yakima-valley-groundwater-fact-sheet-october-2012.pdf. Accessed September 12, 2018. 40 Brender JD, Olive JM, Felkner M, Suarez L, Marckwardt W, Hendricks KA (2004) Dietary nitrites and nitrates, nitrosatable drugs, and neural tube defects. Epidemiology, 15:330-336.
41 Croen LA, Todoroff K, Shaw GM. (2001). Maternal exposure to nitrate from drinking water and diet and risk for neural tube defects. American Journal of Epidemiology, 153(4), 325-331.
42 Ward MH, deKok TM, Levallois P, et al. (2005). Workgroup report: drinking-water nitrate and health – recent findings and research needs. Environmental Health Perspectives, 113(11), 1607-1614 43 Brender JD. (2015). Nitrate, Nitrite, and Nitrosatable Drugs, and Congenital Malformations. Watson RR, Editor. Handbook of Fertility. London: Elsevier; 2015, p61-74. 44 Brender JD, Werler MM, Kelley KE, et al. (2011). Nitrosatable drug exposure during early pregnancy and neural tube defects in offspring. American Journal of Epidemiology, 174(11), 1286-1295. 45 Brender JD, Kelley KE, Werler MM, Langlois PH, Suarez L, Canfield MA. (2011). Prevalence and patterns of nitrosatable drug use among U.S. women during early pregnancy. Clinical and Molecular Teratology Birth Defects Part A, 91(4), 258-264.
46 Semple S. (2005) Assessing occupational and environmental exposure. Occupational Medicine, 55, 419-424. 47 United States Environmental Protection Agency (EPA). (2014). Methomyl (090301): Risk Mitigation Decision for Risks Due to Drinking Water Concerns. Available at: https://www.regulations.gov/document?D=EPA-HQ-OPP-2010-0751-0018

63
48 Imbarb A, Benoist J, Blom HJ. (2013) Neural tube defects, folic acid and methylation. International Journal of Environmental Research and Public Health, 10, 4352-4389.
49 Yang Y, Chen J, Wang B, Ding C, Liu H. (2015) Association between MTHFR C677T polymorphism and neural tube defect risks: A comprehensive evaluation in three groups of NTD patients, mothers and fathers. Birth Defects Research. Part A. Clinical and Molecular Teratology, 103(6), 488-500. 50 Zhang T, Lou J, Zhong R, et al. (2013). Genetic variants in the folate pathway and the risk of neural tube defects: a meta-analysis of the published literature. PLoS ONE, 8(4), e59570.
51 Yan L, Zhao L, Long Y, et al. (2012). Association of the maternal MTHFR C677T polymorphism with susceptibility to neural tube defects in offspring: evidence from 25 case-control studies. PLoS ONE 7(10), e41689. 52 Hickey SE, Curry CJ, Toriello HV. (2013) ACMG practice guideline: lack of evidence for MTHFR polymorphism testing. Genetis in Medicine,15(2), 153-156 53 Gelineau-van Waes J, Voss KA, Stevens VL, Speer MC, Riley RT. (2009). Maternal fumonisin exposure as a risk factor for neural tube defects. Advances in Food and Nutrition Research, 56, 145-181. 54 Missmer SA, Suarez L, Felkner M, et al. (2006). Exposure to fumonisins and the occurrence of neural tube defects along the Texas-Mexico border. Environmental Health Perspectives, 114(2), 237-241. 55 Gelineau-van Waes, J. (2015). Tortillas and Toxins: Fumonisin Exposure as a Risk Factor for Neural Tube Defects. Microsoft PowerPoint Presentation. Creighton University School of Medicine. 56 Tinker SC, Devine O, Mai C, et al. (2013). Estimate of the potential impact of folic acid fortification of corn masa flour on the prevention of neural tube defects. Clinical and Molecular Teratology Birth Defects Research Part A, 97, 649-657 57 Canfield MA, Ramadhani TA, Shaw GM, et al. (2009). Anencephaly and spina bifida among Hispanics: maternal, sociodemographic, and acculturation factors in the National Birth Defects Prevention Study. Birth Defects Research (Part A), 85, 637-646.
58 Suarez L, Felkner M, Brender JD, Canfield M, Zhu H, Hendricks. (2012) Neural tube defects on the Texas-Mexico border: what we’ve learned in the 20 years since the Brownsville cluster. Birth Defects Research (Part A), 85, 637-646.
59 U.S. Preventive Services Task Force. (2009). Folic acid for the prevention of neural tube defects: U.S. Preventive Services Task Force recommendation statement. Annals of Internal Medicine. 150, 626-31. 60 American College of Obstetricians and Gynecologists (ACOG). (2014). Preconception and interconception care. In: Guidelines for Women's Health Care, 4th edition, ACOG, p.389.

64
61 The American College of Obstetricians and Gynecologists. (2015). FAQ: Nutrition During Pregnancy. Available at: http://www.acog.org/Patients/FAQs/Nutrition-During-Pregnancy
62 Feldkamp, ML, Meyer RE, Krikov S, Botto LD. (2010). Acetaminophen use in pregnancy and risk of birth defects: findings from the National Birth Defects Prevention Study. Obstetrics & Gynecology, 115(1), 109-115. 63 Hernandez RK, Werler MM, Romitti P, et al. (2012). Nonsteroidal anti-inflammatory drug use among women and the risk of birth defects. American Journal of Obstetrics& Gynecology, 206, 228.e1-228.e8.
64 Werler MM, Ahrens KA, Bosco JLF, et al. (2011). Use of antiepileptic medications in pregnancy in relation to risk of birth defects. Annals of Epidemiology, 21(11), 842-850.
65 Gilboa SM, Broussard CS, Devine OJ, et al. (2011). Influencing clinical practice regarding the use of antiepileptic medications during pregnancy: modeling the potential impact on the prevalences of spina bifida and cleft palate in the United States. American Journal of Medical Genetics Part C, 157, 234-246.
66 Reefhuis J, Devine O, Friedman JM, Louik C, Honein M. (2015) Specific SSRIs and birth defects: Bayesian analysis to interpret new data in the context of the previous reports. British Medical Journal, 350, h3190. 67 Lin S, Munsie JPW, Herdt-Losavio ML, et al. (2012). Maternal asthma medication use and the risk of selected birth defects. Pediatrics, 129(2), e317-e324.
68 Anderka M, Mitchell AA, Louik C, Werler MM, Hernández-Diaz S, Rasmussen SA. (2012). Medications used to treat nausea and vomiting of pregnancy and the risk of selected birth defects. Clinical and Molecular Teratology: Birth Defects Research Part A, 94(1), 22-30.
69 Browne ML, Rasmussen SA, Hoyt AT, et al. (2009). Maternal thyroid disease, thyroid medication use, and selected birth defects in the National Birth Defects Prevention Study. Clinical and Molecular Teratology: Birth Defects Research Part A, 85(7), 621-628.
70 Institute of Medicine of the National Academies. (2005). Dietary References Intakes for Water, Potassium, Sodium, Chloride, and Sulfate. The National Academy of Sciences. Available at https://www.nap.edu/download/10925
71 Alman BL, Coffman E, Siega-Riz AM, Luben TJ. (2016). Associations between maternal water consumption and birth defects in the National Birth Defects Prevention Study. Clinical and Molecular Teratology: Birth Defects Research Part A, 00, 1-10.

65
Appendix A: Project Team Washington State Department of Health Office of the State Health Officer Lillian Bensley, PhD Eric Ossiander, PhD
Reed Sorenson, MPH Cathy Wasserman, PhD, MPH
Juliet VanEenwyk, PhD Office of Healthy Communities Zachary Holmquist, MPH
Dennis McDermot, PhD Silbia Moreno Melissa Rosscup
Office of Environmental Public Health Sciences Lillian Morris Manahan, PhD Barbara Morrissey, MS
Glen Patrick, MPH Patrick Vander Kelen, PhD
Office of Drinking Water Derrick Dennis
Center for Public Affairs Cristina Labra Katie Meehan Paj Nandi, MPH
Benton-Franklin Health District Amy Person, MD, Health Officer
Yakima Health District Christopher Spitters, MD, Health Officer
Centers for Disease Control and Prevention National Center on Birth Defects and Developmental Disabilities
Suzanne Gilboa, PhD Richard Olney, MD, MPH
Sarah Tinker, PhD Epidemic Intelligence Service (assigned to Washington State Department of Health) Elizabeth Ailes, PhD
Mandy Stahre, PhD, MPH Kristen Wendorf, MD
We also gratefully thank Annelise Arth, Adrienne Hoyt, Peter Langlois, Gina Legaz, Hannah Peterson, Carissa Rochelieu, Gary Shaw, Central Washington University students and the women who agreed to be interviewed.

66
Appendix B: Advisory Committee Susie Ball, MS, LCGC, Central Washington Genetics Program, Yakima Valley Memorial Hospital
Sara Barron, RN, Community Member
Jessica Black, PhD, Heritage University, resigned December 2015
Nora Coronado, PhD, MPH, MSW, Washington State Commission on Hispanic Affairs
Lisa Galbraith, DO, MPH, Obstetrics and Gynecology, Kadlec Clinic, Prosser
Philip Halvorsen, MD, Maternal-Fetal Medicine, The Perinatal Center, Richland
Marie Jennings, Unit Manager, Office of Water and Watersheds, Region 10, U.S. Environmental Protection Agency
Peter Langlois, PhD, Senior Epidemiologist, Birth Defects Epidemiology and Surveillance Branch, Texas Department of State Health Services
Gina Legaz, MPH, State Director of Programs and Government Affairs, Washington Chapter March of Dimes
Kathy Lofy, MD, Committee Chair, State Health Officer/Chief Science Officer, Washington State Department of Health
Jennie McLaurin, MD, MPH, Migrant Clinicians Network, resigned October 2015
Christina Nyirati, PhD, FNP-BC, Chair, Department of Nursing/Director of Nursing Program, Arts and Science, Heritage University, joined February 2016
Richard Olney, MD, MPH, National Center on Birth Defects and Developmental Disabilities, Centers for Disease Control and Prevention, resigned April 2015
Amy Person, MD, Health Officer, Benton-Franklin Health District
Kathleen Rogers, Community Member
Melissa A. Schiff, MD, MPH, Epidemiology and Obstetrics and Gynecology, University of Washington
Christopher Spitters, MD, Health Officer, Yakima Health District
Sarah Tinker, PhD, MPH, National Center on Birth Defects and Developmental Disabilities, Centers for Disease Control and Prevention, joined May 2015
Vickie Ybarra, PhD, MPH, BSN, Community Member
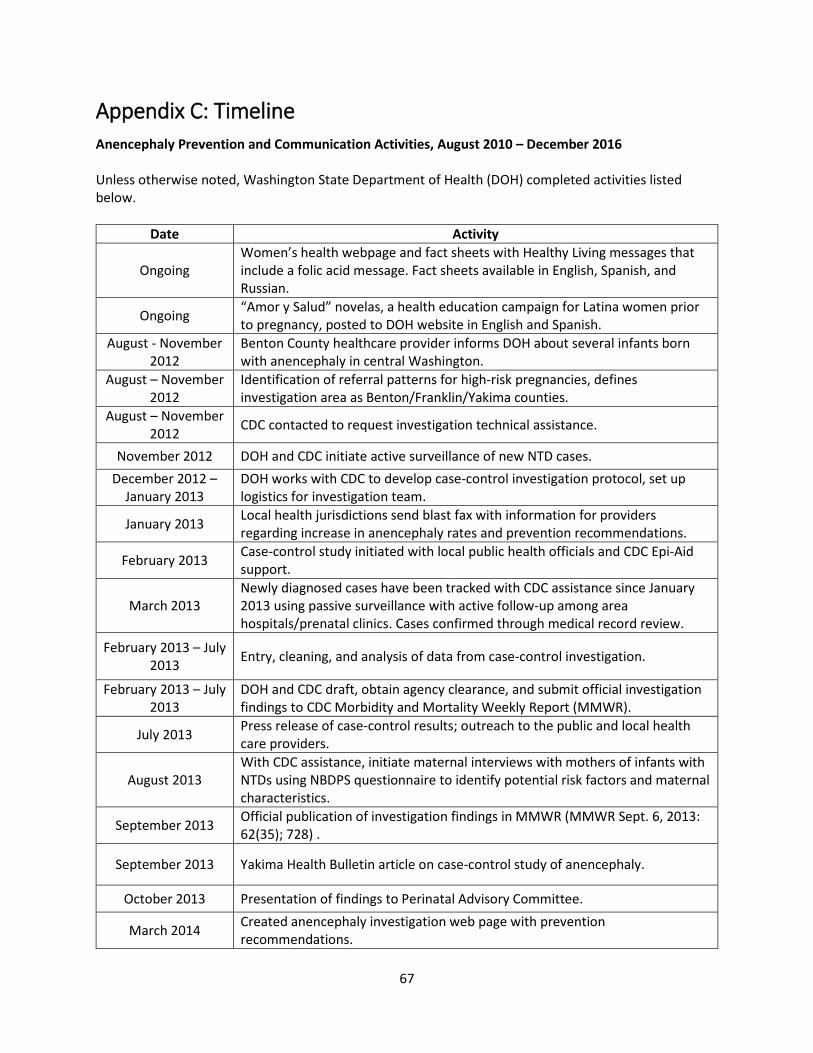
67
Appendix C: Timeline Anencephaly Prevention and Communication Activities, August 2010 – December 2016 Unless otherwise noted, Washington State Department of Health (DOH) completed activities listed below.
Date Activity
Ongoing Women’s health webpage and fact sheets with Healthy Living messages that include a folic acid message. Fact sheets available in English, Spanish, and Russian.
Ongoing “Amor y Salud” novelas, a health education campaign for Latina women prior to pregnancy, posted to DOH website in English and Spanish.
August - November 2012
Benton County healthcare provider informs DOH about several infants born with anencephaly in central Washington.
August – November 2012
Identification of referral patterns for high-risk pregnancies, defines investigation area as Benton/Franklin/Yakima counties.
August – November 2012 CDC contacted to request investigation technical assistance.
November 2012 DOH and CDC initiate active surveillance of new NTD cases. December 2012 –
January 2013 DOH works with CDC to develop case-control investigation protocol, set up logistics for investigation team.
January 2013 Local health jurisdictions send blast fax with information for providers regarding increase in anencephaly rates and prevention recommendations.
February 2013 Case-control study initiated with local public health officials and CDC Epi-Aid support.
March 2013 Newly diagnosed cases have been tracked with CDC assistance since January 2013 using passive surveillance with active follow-up among area hospitals/prenatal clinics. Cases confirmed through medical record review.
February 2013 – July 2013 Entry, cleaning, and analysis of data from case-control investigation.
February 2013 – July 2013
DOH and CDC draft, obtain agency clearance, and submit official investigation findings to CDC Morbidity and Mortality Weekly Report (MMWR).
July 2013 Press release of case-control results; outreach to the public and local health care providers.
August 2013 With CDC assistance, initiate maternal interviews with mothers of infants with NTDs using NBDPS questionnaire to identify potential risk factors and maternal characteristics.
September 2013 Official publication of investigation findings in MMWR (MMWR Sept. 6, 2013: 62(35); 728) .
September 2013 Yakima Health Bulletin article on case-control study of anencephaly.
October 2013 Presentation of findings to Perinatal Advisory Committee.
March 2014 Created anencephaly investigation web page with prevention recommendations.

68
May 2014 Yakima Health Bulletin update on anencephaly investigation, listening session in Sunnyside, and prevention messaging released.
May 2014 Listening sessions held in Sunnyside and Kennewick.
June 2014 Anencephaly Advisory Committee established with the goal of identifying actions to improve reporting of NTDs, identify actions to prevent or reduce the likelihood of NTDs, and determine additional areas of investigation.
June 2014 Public Service Announcements – Shared in English and Spanish with 45 radio stations in eastern Washington.
July 2014 Local public health sends letters to radio stations encouraging them to air PSAs.
July 2014 March of Dimes sends NTD and Folic Acid Brochures in English and Spanish to local community and technical colleges and hair and nail salons in three-county area.
August 2014-July 2014
March of Dimes and DOH distribute NTD and folic acid brochures in English and Spanish to local health jurisdictions and community partners in three-county area
August 2014 Local health communication to providers in Yakima, Benton and Franklin counties; blast fax regarding elevated rate of anencephaly and folic acid recommendations.
August 2014 Presentation to OB Grand Rounds at Yakima Memorial Hospital.
August 2014 Local public health staff present on cluster investigation to staff at Kadlec Hospital.
August 2014 Presentation to Yakima Health District Board of Directors.
August 2014 Letter from State Health Officer to Local Health Officers across Washington alerting them to anencephaly cluster in south-central Washington, and sharing of prevention messages to consider distributing.
August 2014-ongoing Initiation of Monthly Prevention Coordination calls.
September 2014 Local public health staff distribute educational NTD materials at the Yakima County Fair.
November 2014
DOH staff member interviewed on regional 30-minute Spanish language radio show hosted by WA State Commission on Hispanic Affairs in Puget Sound radio market. The content includes general information about anencephaly, details of investigation, and the importance of folic acid in NTD prevention.
December 2014 Yakima Health Bulletin focuses on birth defects prevention.
December 2014 Presentation of results at University of Washington Medical School Grand Rounds.
January 2015
DOH and local public health collaborate on social media messaging on Facebook and Twitter; announcements in Washington Healthcare Improvement Network, Health Education Resource Exchange newsletter and PTA, and distribution of CDC materials and links for Birth Defects Prevention Month.
January 2015 Presentation to Washington State Board of Health.
January 2015 Staff member interviewed on regional 30-minute Spanish language radio show hosted by Washington State Commission on Hispanic Affairs in Yakima Valley
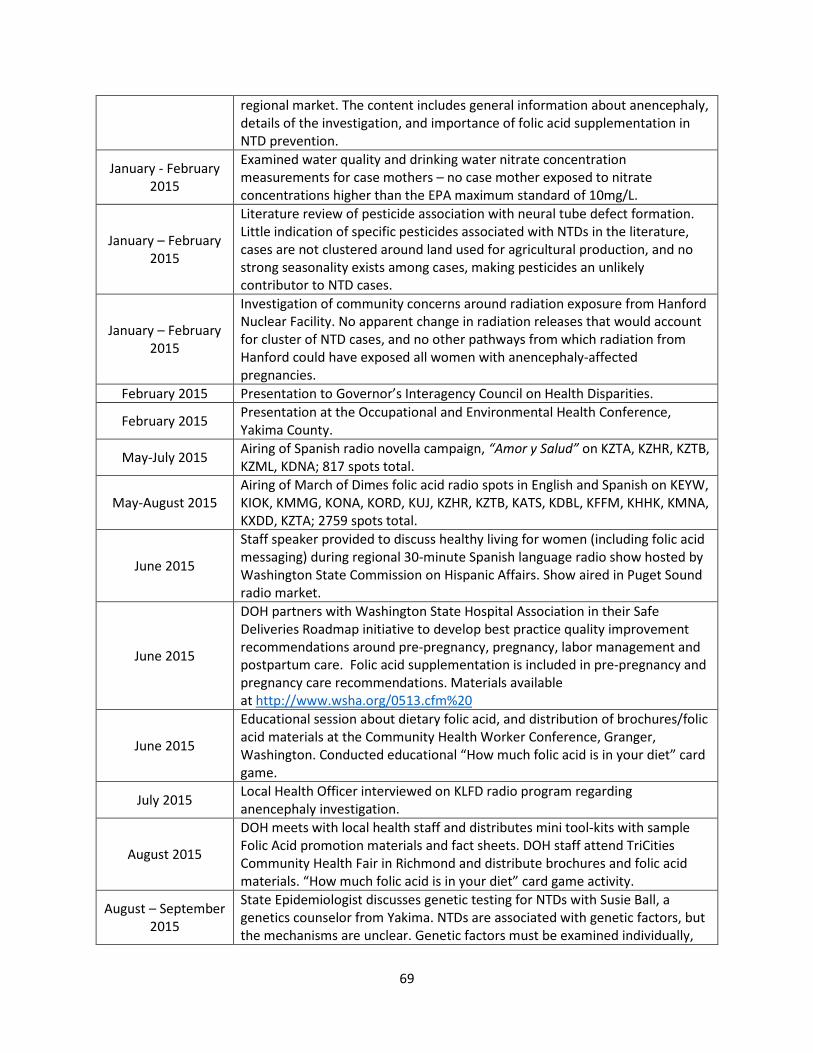
69
regional market. The content includes general information about anencephaly, details of the investigation, and importance of folic acid supplementation in NTD prevention.
January - February 2015
Examined water quality and drinking water nitrate concentration measurements for case mothers – no case mother exposed to nitrate concentrations higher than the EPA maximum standard of 10mg/L.
January – February 2015
Literature review of pesticide association with neural tube defect formation. Little indication of specific pesticides associated with NTDs in the literature, cases are not clustered around land used for agricultural production, and no strong seasonality exists among cases, making pesticides an unlikely contributor to NTD cases.
January – February 2015
Investigation of community concerns around radiation exposure from Hanford Nuclear Facility. No apparent change in radiation releases that would account for cluster of NTD cases, and no other pathways from which radiation from Hanford could have exposed all women with anencephaly-affected pregnancies.
February 2015 Presentation to Governor’s Interagency Council on Health Disparities.
February 2015 Presentation at the Occupational and Environmental Health Conference, Yakima County.
May-July 2015 Airing of Spanish radio novella campaign, “Amor y Salud” on KZTA, KZHR, KZTB, KZML, KDNA; 817 spots total.
May-August 2015 Airing of March of Dimes folic acid radio spots in English and Spanish on KEYW, KIOK, KMMG, KONA, KORD, KUJ, KZHR, KZTB, KATS, KDBL, KFFM, KHHK, KMNA, KXDD, KZTA; 2759 spots total.
June 2015
Staff speaker provided to discuss healthy living for women (including folic acid messaging) during regional 30-minute Spanish language radio show hosted by Washington State Commission on Hispanic Affairs. Show aired in Puget Sound radio market.
June 2015
DOH partners with Washington State Hospital Association in their Safe Deliveries Roadmap initiative to develop best practice quality improvement recommendations around pre-pregnancy, pregnancy, labor management and postpartum care. Folic acid supplementation is included in pre-pregnancy and pregnancy care recommendations. Materials available at http://www.wsha.org/0513.cfm%20
June 2015
Educational session about dietary folic acid, and distribution of brochures/folic acid materials at the Community Health Worker Conference, Granger, Washington. Conducted educational “How much folic acid is in your diet” card game.
July 2015 Local Health Officer interviewed on KLFD radio program regarding anencephaly investigation.
August 2015
DOH meets with local health staff and distributes mini tool-kits with sample Folic Acid promotion materials and fact sheets. DOH staff attend TriCities Community Health Fair in Richmond and distribute brochures and folic acid materials. “How much folic acid is in your diet” card game activity.
August – September 2015
State Epidemiologist discusses genetic testing for NTDs with Susie Ball, a genetics counselor from Yakima. NTDs are associated with genetic factors, but the mechanisms are unclear. Genetic factors must be examined individually,
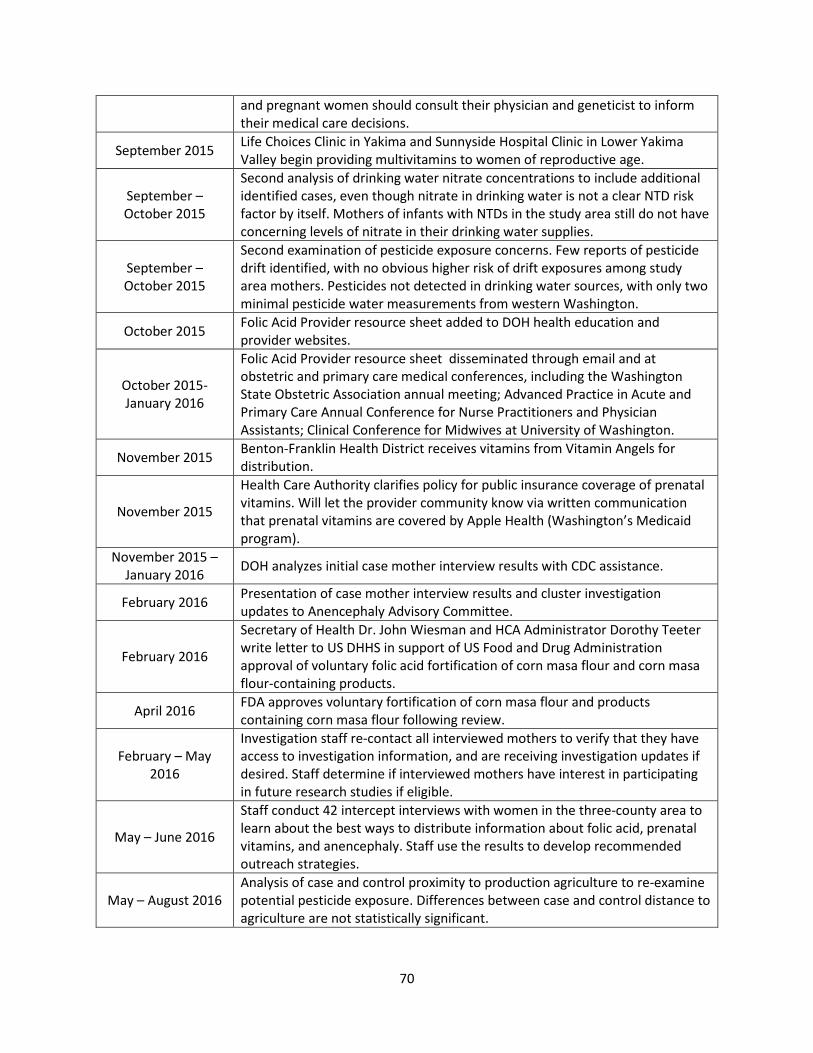
70
and pregnant women should consult their physician and geneticist to inform their medical care decisions.
September 2015 Life Choices Clinic in Yakima and Sunnyside Hospital Clinic in Lower Yakima Valley begin providing multivitamins to women of reproductive age.
September – October 2015
Second analysis of drinking water nitrate concentrations to include additional identified cases, even though nitrate in drinking water is not a clear NTD risk factor by itself. Mothers of infants with NTDs in the study area still do not have concerning levels of nitrate in their drinking water supplies.
September – October 2015
Second examination of pesticide exposure concerns. Few reports of pesticide drift identified, with no obvious higher risk of drift exposures among study area mothers. Pesticides not detected in drinking water sources, with only two minimal pesticide water measurements from western Washington.
October 2015 Folic Acid Provider resource sheet added to DOH health education and provider websites.
October 2015-January 2016
Folic Acid Provider resource sheet disseminated through email and at obstetric and primary care medical conferences, including the Washington State Obstetric Association annual meeting; Advanced Practice in Acute and Primary Care Annual Conference for Nurse Practitioners and Physician Assistants; Clinical Conference for Midwives at University of Washington.
November 2015 Benton-Franklin Health District receives vitamins from Vitamin Angels for distribution.
November 2015
Health Care Authority clarifies policy for public insurance coverage of prenatal vitamins. Will let the provider community know via written communication that prenatal vitamins are covered by Apple Health (Washington’s Medicaid program).
November 2015 – January 2016 DOH analyzes initial case mother interview results with CDC assistance.
February 2016 Presentation of case mother interview results and cluster investigation updates to Anencephaly Advisory Committee.
February 2016
Secretary of Health Dr. John Wiesman and HCA Administrator Dorothy Teeter write letter to US DHHS in support of US Food and Drug Administration approval of voluntary folic acid fortification of corn masa flour and corn masa flour-containing products.
April 2016 FDA approves voluntary fortification of corn masa flour and products containing corn masa flour following review.
February – May 2016
Investigation staff re-contact all interviewed mothers to verify that they have access to investigation information, and are receiving investigation updates if desired. Staff determine if interviewed mothers have interest in participating in future research studies if eligible.
May – June 2016
Staff conduct 42 intercept interviews with women in the three-county area to learn about the best ways to distribute information about folic acid, prenatal vitamins, and anencephaly. Staff use the results to develop recommended outreach strategies.
May – August 2016 Analysis of case and control proximity to production agriculture to re-examine potential pesticide exposure. Differences between case and control distance to agriculture are not statistically significant.

71
August 2016 Presentation of investigation updates, recommended outreach strategies developed from intercept interviews, and proximity to production agriculture results to Anencephaly Advisory Committee.
September – December 2016
DOH staff and stakeholders create draft summary report of the anencephaly cluster investigation, with preliminary presentation to the Anencephaly Advisory Committee in late November.

72
Appendix D: Case Abstraction Form Page 1 of 2 CASE ABSTRACTION FORM FOR NEURAL TUBE DEFECTS
Please fill in this form for all pregnancies affected by a neural tube defect diagnosed or reported after 9/1/2014. Contact for questions: Zachary Holmquist (360) 236-3559 or [email protected] Washington State Department of Health
Today’s Date: _ _/_ _/_ _ _ _ Medical Record Number: Hospital/Clinic Name:
NAME OF ABSTRACTOR AND TITLE: Phone: (_ _ _) _ _ _-_ _ _ _
MOTHER’S BACKGROUND INFORMATION Mother’s name: Last First Middle DOB (MM/DD/YYY): _ _/_ _/_ _ _ _
Country of birth: Occupation: Highest educational level:
Current address: Street City County Zip code
Date current address recorded in chart: _ _/ _ _ / _ _ _ _
Prior address (if applicable): Street City County Zip code
Date prior address recorded in chart: _ _/ _ _ / _ _ _ _
Phone number: (_ _ _) _ _ _ - _ _ _ _ Home Cell Work
Hispanic ethnicity: Yes No Race (check all that apply): White Black Native American Asian Pacific Islander
Insurance status: Private Medicaid/CHIP/other government program (do not include Tricare) Uninsured Other: _____________________ Father’s DOB (MM/DD/YYY): _ _/_ _/_ _ _ _
Father’s occupation: Father’s last name:
CURRENT PREGNANCY INFORMATION
Pre-pregnancy weight (lbs): Date recorded: _ _/_ _ /_ _ _ _ Pre-pregnancy height (in): Date recorded: _ _/_ _ /_ _ _ _
Date of 1st prenatal visit: _ _/_ _/_ _ _ _ Provider’s name and location:
Plurality: Single Twin Triplet or higher order
Gestational age (current or at time of delivery): _ _ weeks Source of gestational age estimate: LMP Ultrasound Other: _______________ Date of last menstrual period (LMP): _ _/_ _/_ _ _ _ Estimated date of confinement (EDC): _ _/_ _/_ _ _ _

73
Used folate/folic acid supplement (including prenatal vitamins containing folic acid) prior to pregnancy: No Yes date started: _ _/_ _/_ _ _ _ date unknown
Total number of previous pregnancies: _ _ Total number of live births: _ _
MOTHER’S HEALTH HISTORY Diabetes: Yes, gestational Yes, Type I Yes, Type II No Date diagnosed: _ _/_ _/_ _ _ _ Alcohol use during pregnancy: No Yes usual number of drinks:_______ frequency:_________
Smoking status: Current Former Never Birth control pill use 90 days prior to conception: No Yes Family history of NTD-affected pregnancies, include prior pregnancies of mother of baby (MOB): No Yes List NTD and specific family member (e.g., FOB – aunt; MOB - mom):
DIAGNOSTIC TESTS “ATTACH COPIES OF THE TEST RESULTS WITH THIS FORM”
DIAGNOSTIC TEST NO YES DATE OF TEST
Quad Screen _ _/_ _/_ _ _ _
Maternal serum alpha-fetoprotein (MSAFP) test (if separate from Quad screen) _ _/_ _/_ _ _ _
Level II Ultrasound _ _/_ _/_ _ _ _
2nd Level II Ultrasound _ _/_ _/_ _ _ _
Pathology report _ _/_ _/_ _ _ _
Genetic testing _ _/_ _/_ _ _ _ Other test or method of diagnosing neural tube defect Type of test or method: ________________________
_ _/_ _/_ _ _ _
DELIVERY INFORMATION (IF APPLICABLE)
Delivery date: _ _/_ _/_ _ _ _ Hospital: Provider:
Delivery outcome: Live birth Still birth Spontaneous abortion Induced abortion Unspecified abortion
Thank you for completing the above form.
Please fax form along with any diagnostic test results to:
(360)236-2323 Attn: Zachary Holmquist
Contact for questions: Zachary Holmquist (360) 236 - 3559 or [email protected] Washington State Department of Health Office of Healthy Communities P.O. Box 47835 Olympia, WA 98504-7835

74
Appendix E: Letter in Support of Fortification of Corn Masa Flour
STATE OF WASHINGTON
February 9, 2016
Stephen Ostroff, MD Acting Commissioner U.S. Food and Drug Administration 10903 New Hampshire Avenue Silver Spring, MD 20993
Dear Dr. Ostroff:
We are writing regarding the food additive petition submitted by the March of Dimes Foundation, Gruma Corporation, the Spina Bifida Association, the American Academy of Pediatrics, Royal DSM N.V., and the National Council of La Raza seeking approval for the addition of folic acid to corn masa flour.
Absent scientific based safety concerns, we strongly encourage the U.S. Food and Drug Administration (FDA) to act on the pending petition by allowing fortification of corn masa flour with folic acid. Fortification of corn masa flour with folic acid may reduce the rate of neural tube defects (NTDs) among infants in Washington State and across the nation.
The Washington State Department of Health has been investigating an elevated rate of anencephaly in South Central Washington since 2012. Anencephaly is a rare type of NTD in which the baby’s brain and skull do not fully form during the first month of pregnancy. Babies with this tragic birth defect die during pregnancy or soon after being born.
Among almost 42,000 births in a three county region in South Central Washington from January 2010 to December 2014, there were 36 cases of anencephaly. This is a rate of 8.6 cases per 10,000 live births. The national average is 2.1 cases per 10,000 live births.
This represents a four-fold increase in the number of infants in South Central Washington with this disorder. More than half the cases in Washington State have occurred in Hispanic women.
Several factors can increase the risk for NTDs. Among these factors are low folic acid intake, maternal diabetes, obesity, some medications, Hispanic ethnicity, and having a previous neural tube defect-affected pregnancy. The development of the neural tube is normally completed within 28 days of conception; thus NTDs can develop before a woman knows she is pregnant and often before the initiation of prenatal vitamins intended to prevent such disorders.
Fortification of food with folic acid is an effective public health tool for reducing the incidence of neural tube defects. The mandatory fortification of cereal grains (e.g., wheat and rice flour) with folic acid which began in the U.S. in 1998 significantly reduced the rate of neural tube
For more information: http://www.doh.wa.gov/YouandYourFamily/IllnessandDisease/BirthDefects/AnencephalyInvestigation http://www.ncbi.nlm.nih.gov/pmc/articles/PMC3134499/ http://www.marchofdimes.org/news/coalition-petitions-fda-to-fortify-corn-masa-flour-with-folic-acid.aspx

75
Stephen Ostroff, M.D. Acting Commissioner February 9, 2016 Page 2
defects in the U.S. The prevalence of NTDs decreased an estimated 19 percent to 26 percent after fortification.
Despite a significant reduction in NTD rates after fortification of grains with folic acid, Hispanic women continue to have higher rates of neural tube defects compared to non-Hispanic women. One potential approach to reduce this disparity is to fortify corn masa flour and increase the overall intake of folic acid in Hispanic women. A key ingredient in most Hispanic diets is corn masa flour made from specially treated corn use to make corn tortillas, tamales, and other dishes common in the Hispanic culture.
We respectfully request the FDA to act on this important public health issue. Please contact Dr. Cathy Wasserman, State Epidemiologist for Non-infectious Conditions, by telephone at 360-236-4259 or via email at [email protected] if we can provide you with any additional information about the investigation in Washington.
Sincerely,
Dorothy F. Teeter, MHA Director Health Care Authority
John Wiesman, DrPH, MPH Secretary of Health Department of Health
cc: Sam Ricketts, Director, Washington, DC Office, GOV Bob Crittenden, MD, MPH, Special Assistant for Health Reform, GOV