neuron article - home | stanford medicine · 2018-11-26 · neuron article neural dynamics of event...
TRANSCRIPT
Neuron
Article
Neural Dynamics of Event Segmentationin Music: Converging Evidence for DissociableVentral and Dorsal NetworksDevarajan Sridharan,1,2,* Daniel J. Levitin,4 Chris H. Chafe,5 Jonathan Berger,5 and Vinod Menon1,2,3,*1Department of Psychiatry and Behavioral Sciences2Program in Neuroscience3Neuroscience Institute at StanfordStanford University School of Medicine, Stanford, CA 94305, USA4Departments of Psychology and Music Theory, School of Computer Science, and Program in Behavioural Neuroscience,
McGill University, Montreal, QC, Canada5Department of Music and Center for Computer Research in Music and Acoustics, Stanford, CA 94305, USA*Correspondence: [email protected] (D.S.), [email protected] (V.M.)
DOI 10.1016/j.neuron.2007.07.003
SUMMARY
The real world presents our sensory systemswith a continuous stream of undifferentiated in-formation. Segmentation of this stream at eventboundaries is necessary for object identifica-tion and feature extraction. Here, we investigatethe neural dynamics of event segmentation inentire musical symphonies under natural listen-ing conditions. We isolated time-dependentsequences of brain responses in a 10 s windowsurrounding transitions between movementsof symphonic works. A strikingly right-lateral-ized network of brain regions showed peak re-sponse during the movement transitions when,paradoxically, there was no physical stimulus.Model-dependent and model-free analysistechniques provided converging evidence foractivity in two distinct functional networks atthe movement transition: a ventral fronto-tem-poral network associated with detecting salientevents, followed in time by a dorsal fronto-pari-etal network associated with maintaining atten-tion and updating working memory. Our studyprovides direct experimental evidence for dis-sociable and causally linked ventral and dorsalnetworks during event segmentation of ecolog-ically valid auditory stimuli.
INTRODUCTION
Event segmentation is fundamental to object identification
and feature extraction. The real world typically presents
our sensory systems with a continuous stream of undiffer-
entiated information. In order to make sense of this infor-
mation, the brain needs to segment or chunk the incoming
stimulus stream into meaningful units; it accomplishes this
by extracting information about beginnings, endings, and
event boundaries from the input. Studying event segmen-
tation in real-world or ‘‘ecologically valid’’ stimuli is of par-
ticular interest for two reasons: first, such an investigation
can reveal perceptual grouping processes that occur un-
der natural conditions; second, there is growing evidence
suggesting that neuronal populations behave differently
under natural conditions than they do under controlled ex-
perimental conditions (Hasson et al., 2004). For instance,
responses of neurons to simple, controlled stimuli are of-
ten not predictive of how they respond to more complex,
natural stimuli (Touryan et al., 2005). Currently, the brain
systems underlying the segmentation of ecologically valid
stimuli, particularly in the auditory domain, are poorly un-
derstood.
Music is innate to all human cultures, and there is evi-
dence suggesting that the ability to appreciate music
can develop even without explicit training (Trehub,
2003); hence, music is considered an ecologically valid
auditory stimulus. Like speech, music is hierarchically or-
ganized (Cooper and Meyer, 1960; Lehrdahl and Jackend-
off, 1983); perceptual event boundaries in music exist at
several well-defined hierarchical levels and time scales,
including discrete tones, rhythmic motifs, phrases, and
movements. In the Western classical tradition, the highest
hierarchical level within a musical work is the movement,
which is defined as ‘‘the primary self-contained section
of a large composition’’ (Apel, 1969). Adjacent movements
within a single work are generally delimited by a number of
different cues: changes in tempo (gradual slowing), tonal-
ity (changes in the tonic or key center), rhythm, pitch, tim-
bre, contour, and boundary silences (gradual drop in in-
tensity). While each movement may last from several to
ten or more minutes, transitions between movements
take place over the time scale of a few seconds. Move-
ment transitions are perceptually salient event boundaries
that demarcate such long time-scale structural changes,
partitioning a large-scale musical composition into
Neuron 55, 521–532, August 2, 2007 ª2007 Elsevier Inc. 521

Neuron
Neural Dynamics of Event Segmentation in Music
thematically coherent subsections. These coarse-grained
transitions are easily perceived by musically untrained
listeners (nonmusicians), unlike finer-grained transitions
(such as ‘‘phrase transitions’’) that occur over shorter
timescales of 1 s or less, which even musically trained lis-
teners can find difficult to perceive (Knosche et al., 2005).
Here, we examine how the brain accomplishes event seg-
mentation at coarse-grained boundaries in ecologically
relevant stimuli by isolating brain responses immediately
before, during, and after these musical movement transi-
tions. Studying such segmentation processes in music
may be a useful window into similar processes in other do-
mains, such as spoken and signed language, visual per-
ception, and tactile perception.
Literature on event segmentation of ecologically valid
stimuli is scarce; no previous study, to our knowledge,
has directly addressed the question of event segmenta-
tion in the auditory domain, and specifically in music. A
previous study by Zacks et al. (2001) examined event seg-
mentation using video clips of everyday activities. How-
ever, event boundaries in their stimuli were found to be
subjective, highly variable, and difficult to characterize
by normative criteria. On the other hand, musical event
boundaries are perceptually salient and theoretically
well-defined. This characteristic, taken together with its
ecological validity and inherently temporal nature, makes
music uniquely suited to the study of the dynamics of
event segmentation of ecologically valid stimuli that unfold
over time. On the one hand, we have learned a great deal
from related studies that used electroencephalography
(EEG) and magnetoencephalography (MEG) to investigate
the perception of fine-grained temporal structure in music
(Knosche et al., 2005; Maess et al., 2001; Popescu et al.,
2004). These studies have suggested the involvement of
a wide range of brain structures, including Broca’s area
(Maess et al., 2001), motor structures (Popescu et al.,
2004), and the anterior and posterior cingulate cortex
(Knosche et al., 2005), in the dynamical aspects of music
structure processing. However, these experiments gener-
ally use laboratory-manipulated, short musical segments
as stimuli that offer the experimenters control over the
stimulus parameters; the trade-off is that such stimuli
tend to be musically unnatural, lack ecological validity,
and are not part of the normal musical experience. For in-
stance, Knosche et al. (2005) studied the perception of
phrase structure using EEG/MEG by examining differen-
tial brain responses of musicians to phrased versus un-
phrased musical stimuli. The latter were created by re-
moving the phrase boundaries and filling in pauses
between phrases with notes. An MEG study by Maess
et al. (2001) employed harmonically inappropriate chords
inserted into a major-minor tonal context. Similarly, Po-
pescu et al. (2004) used MEG to study the perception of
rhythmic structure during music listening; they presented
a single motif component lasting about 10 s. This ap-
proach allowed them to focus on the processing of a spe-
cific local musical structure, but precludes generalizability
to the wide variety of musical structures typically encoun-
522 Neuron 55, 521–532, August 2, 2007 ª2007 Elsevier Inc.
tered in ‘‘real’’ music. Finally, whereas temporal resolution
with EEG/MEG is excellent, brain regions identified with
EEG/MEG source localization procedures are approxi-
mate at best, and inaccurate at worst (Menon and Crot-
taz-Herbette, 2005). Thus, the functional neuroanatomy
and dynamics of brain processes underlying the parsing
and segmentation of ecologically valid musical stimuli re-
main largely unknown.
Here, we examine event segmentation using an experi-
mental design employing ‘‘authentic’’ musical stimuli and
a passive listening task that simulates real-world music lis-
tening. We used fMRI to scan 18 musically untrained par-
ticipants while they listened to two 8–10 min long seg-
ments of symphonies by the English baroque composer
William Boyce (1711–1779). We then attempted to un-
cover the neural dynamics of event segmentation of the
musical stream by isolating time-dependent sequences
of brain responses in a 10 s window surrounding move-
ment transitions. Since the structural changes accompa-
nying such transitions occur over a timescale of a few sec-
onds, we could elucidate these dynamics with a temporal
precision that was well within the resolving power of fMRI
and with a spatial resolution that is generally impossible to
obtain with scalp-recorded EEG or MEG. We then used la-
tency analyses, independent component analysis (ICA),
and Granger causality analysis (GCA) of the fMRI data to
confirm and further explore our findings regarding the
neural dynamics underlying event segmentation at move-
ment transitions.
RESULTS
Movement Transitions Are Perceptually
and Physiologically Salient Event Boundaries
Because we used a passive listening task during brain im-
aging, we conducted a follow-up behavioral study outside
the scanner to ensure that participants could accurately
perceive the movement transitions. We used the same
stimuli that were used in the scanner, with the only differ-
ence being that the subjects now had to respond by
pressing a button whenever they heard a transition (see
Supplemental Experimental Procedures in the Supple-
mental Data available with this article online). They re-
sponded with different buttons for what they perceived
to be large and small transitions. The behavioral data sum-
marized in Figure 1A show that participants successfully
identified over 90% of the movement transitions as points
of marked structural change in the music (see Supplemen-
tal Experimental Procedures and Table S1). To examine
whether the movement transitions were perceived as sa-
lient stimuli during the passive listening task inside the
scanner, we examined changes in autonomic nervous
system reactivity using cardiovascular signals that were
acquired simultaneously with the brain imaging data. We
found a significant increase in the variability of the interval
between consecutive R waves (RR variability) during the
movement transition compared to the baseline
(Figure S4). These results indicate that movement
Neuron
Neural Dynamics of Event Segmentation in Music
transitions were perceived as salient event boundaries
even by musically untrained listeners.
Time Course of Brain Responses
during the Movement Transition
A movement transition in music is not a sudden ‘‘point’’
event; it is characterized by a gradual slowing down of
the previous movement followed by a brief silence and
the onset of the next movement. Figure 1B shows the
spectrogram of the stimulus plotted in a 10 s window sur-
rounding a representative movement transition; this spec-
trogram corresponds to the transition heard in the audio
track of Movie S1. We operationally defined the ‘‘point of
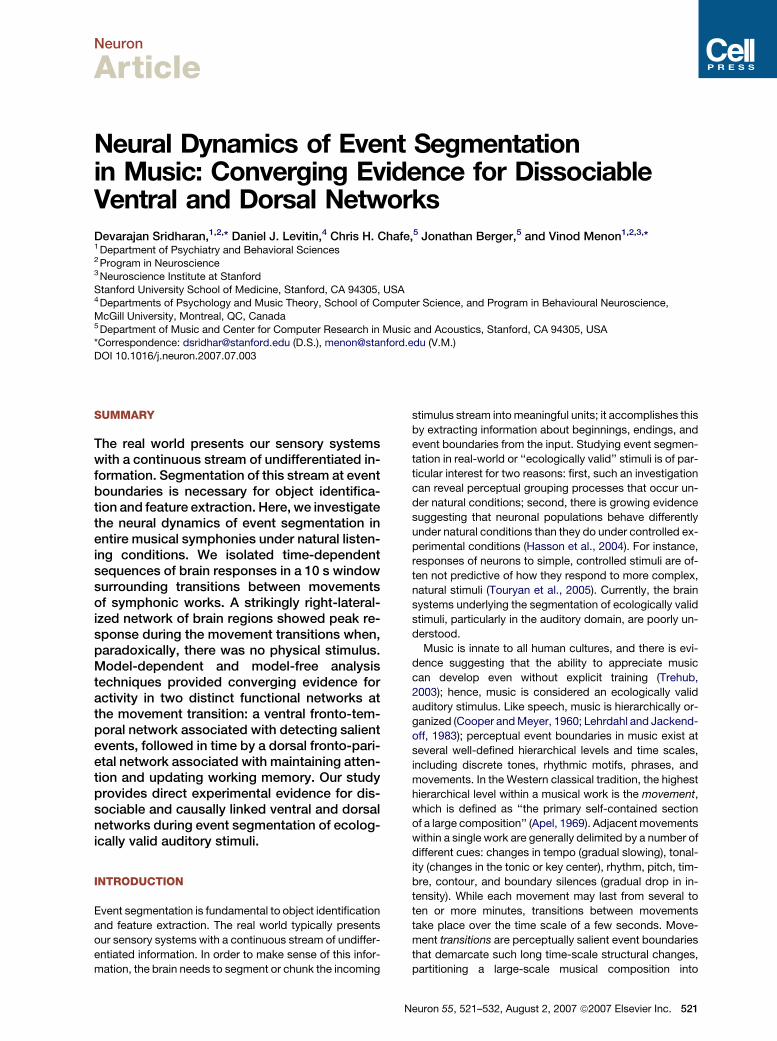
Figure 1. Behavioral Responses and Spectrogram of Stimu-
lus during the Transition
(A) Behavioral data revealed that study participants demonstrated
a high level of accuracy and uniformity in identifying movement transi-
tions when these occurred in the stimulus. Hence, movement transi-
tions are easily and unambiguously perceived even by musically un-
trained listeners. Tl is the fraction of movement transitions correctly
identified as large transitions; Ta is the fraction of movement transitions
correctly identified as large or small transitions; and Tw is the number of
movement transitions within the observation window expressed as
a fraction of the total number of large transitions indicated by the par-
ticipants. Error bars denote standard error of the mean (SEM) across
subjects.
(B) Spectrogram of the stimulus plotted in a 10 s window surrounding
a representative movement transition (corresponding to the transition
heard in the audio track of Movie S1). The dark vertical line in the spec-
trogram, representing the minimum of the stimulus amplitude enve-
lope, corresponds to the ‘‘point of transition.’’ The x axis represents
time relative to the point of transition (in seconds), with negative time
denoting time before the point of transition. The ‘‘transition’’ itself is
an extended (approximately 10 s wide) time window surrounding the
‘‘point of transition.’’ A transition is not a sudden point event; it is char-
acterized by a gradual slowing down of the previous movement, fol-
lowed by a brief silence, and the onset of the next movement.
transition’’ (t = 0 s) as the point at which the amplitude en-
velope shows a marked minimum (with full knowledge that
other cues not visible in the amplitude envelope could
contribute to the perception of a transition). In Figure 1B
this is represented by a dark vertical line in the spectro-
gram. We analyzed data with respect to this reference
transition point (see also Experimental Procedures).
We examined the time course of activation in a 10 s win-
dow surrounding the point of transition, averaged over all
movement transitions. Analysis of the data was performed
with a time-shifted regressor over all transitions (to aver-
age out transition-specific effects) using the general linear
model (see Experimental Procedures). The analysis re-
vealed a strikingly right-lateralized pattern of brain re-
sponses that peaked at the point of the movement transi-
tion and diminished progressively afterward (activations
contrasted against the baseline response to the rest of
the music, Figures 2A and 2B). Interestingly, the brief pe-
riod of silence between movements meant that the activa-
tions peaked at a time when there was, in fact, little or no
physical stimulus (see Movie S1).
Evidence for Right-Lateralized, Dissociable Ventral
and Dorsal Networks
We detected activity in two distinct networks of brain re-
gions at the transitions (Figure 2 and Table S2): (1) a ventral
fronto-temporal network, including the ventrolateral pre-
frontal cortex (VLPFC, BA 47, 44/45) and posterior tempo-
ral cortex (PTC, BA 21/22), which was active during the
early part of each transition; and (2) a dorsal fronto-parietal
network, including the dorsolateral prefrontal cortex
(DLPFC, BA 9) and posterior parietal cortex (PPC, BA
40), which was active during the later part of the transition.
A region-of-interest (ROI) analysis on these four regions
(VLPFC, PTC, DLPFC, and PPC) confirmed that the pat-
tern of activation during the transition was predominantly
right-lateralized—all four ROIs demonstrated a signifi-
cantly higher percentage of active voxels in the right com-
pared to the left hemisphere (Wilcoxon signed-rank test;
Figure 4A).
Latency and ROI Analyses Reveal that Ventral
Network Activity Precedes Dorsal Network Activity
In order to validate and extend our findings of temporal
changes, we conducted additional ROI and latency analy-
ses of the BOLD responses in these regions. First, we ex-
amined latency differences in the peak of the BOLD re-
sponse across brain regions using the analysis method
developed by Henson et al. (2002). Briefly, this method
provides a way to estimate the peak latency of the
BOLD response at each voxel using the ratio of the deriv-
ative to canonical parameter estimates (see Experimental
Procedures for details). The results of the latency analysis
are shown in Figure 3. The right VLPFC and PTC showed
a negative latency relative to the canonical response, indi-
cating activity in these regions during the early part of the
transition, whereas the right DLPFC and PPC exhibited
a positive latency relative to the canonical response,
Neuron 55, 521–532, August 2, 2007 ª2007 Elsevier Inc. 523
Neuron
Neural Dynamics of Event Segmentation in Music
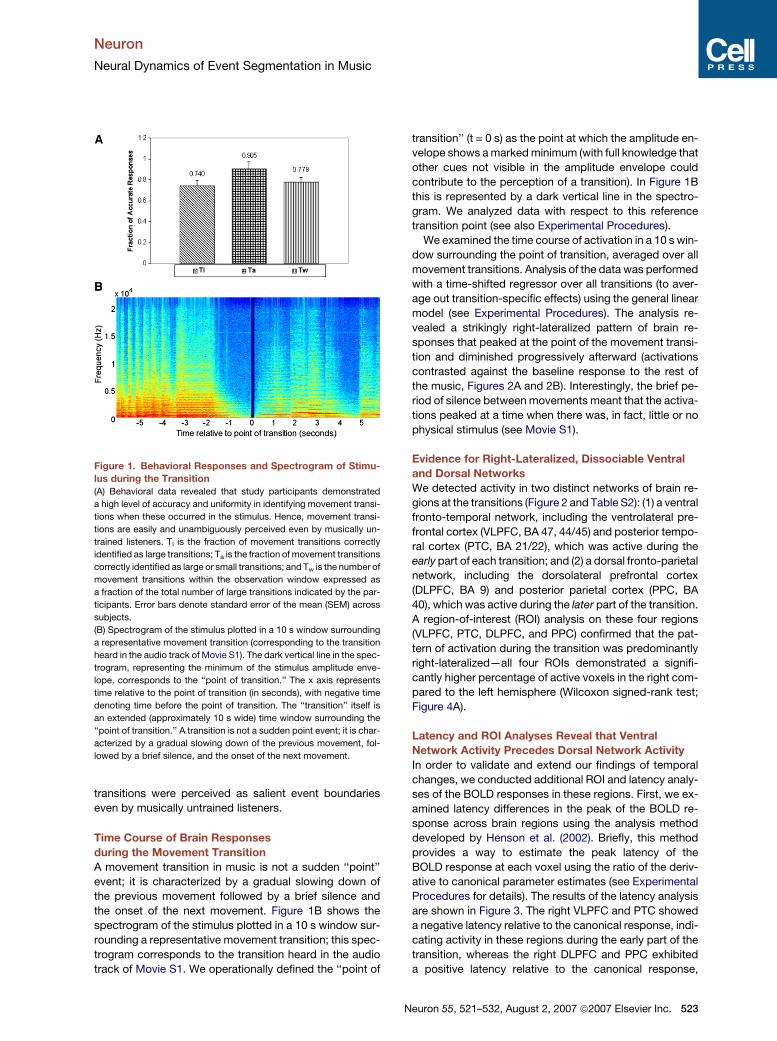
Figure 2. Temporal Dynamics of Brain Activity in a 12 s Window Surrounding the Point of the Movement Transition(A) Surface rendering showing right (top row) and left (bottom row) hemispheric responses as a function of time (from 6 s before the point of transition
to 6 s after the point of transition). Brain responses throughout the movement transition were predominantly right-lateralized. With time, activity shifted
along a ventral-dorsal axis, with the ventral network—ventrolateral prefrontal cortex (VLPFC, cyan arrow) and posterior temporal cortex (PTC, yellow
arrow)—active during the early part of the transition and the dorsal network—dorsolateral prefrontal cortex (DLPFC, magenta arrow) and posterior
parietal cortex (PPC, blue arrow)—active during the later part of the transition.
(B) Coronal sections showing anterior (y = +27 mm, top row) and posterior (y = +16 mm, bottom row) slices through the frontal lobes. The right VLPFC,
marked with a cyan arrow at t = �2 s (s), was significantly active earlier in the transition, whereas the right DLPFC, marked with a magenta arrow at
t = +2 s, showed sustained activation later in the transition.
indicating significant activity later in the transition. Thus,
this analysis provided confirmatory evidence for a pattern
of brain dynamics identical to the one noted above, indi-
cating initial activation of the ventral network followed by
activation of the dorsal network (see Figure 2).
Next, the right hemispheric ROIs were analyzed to test
for differential peak activity, as gauged by the maximum
percentage signal change (MPSC), before, during, and af-
ter the point of transition. Figure 4B quantifies the MPSC in
these ROIs one frame before (t =�2 s), during (t = 0 s), and
after (t = +2 s) the point of transition. While the right VLPFC
showed significantly higher MPSC before and during ver-
sus after the point of transition (Wilcoxon signed-rank test,
T17 = 14, p = 0.0031), right DLPFC and right PPC exhibited
higher MPSCs during and after versus before the point of
transition (Wilcoxon signed-rank test; DLPFC: T17 = 28,
p = 0.0217; PPC: T17 = 35, p = 0.0495). The MPSC in the
PTC did not show a significant difference in activity pre-
versus posttransition. Thus, ROI analysis provided further
524 Neuron 55, 521–532, August 2, 2007 ª2007 Elsevier Inc.
evidence for early activation of the ventral network relative
to the dorsal network during the transition.
Finally, we computed the normalized event-related
BOLD response from these ROIs averaged across events
and subjects (Figure 5A), raw event-related BOLD re-
sponses averaged across subjects were normalized on
a 0–1 scale to facilitate comparison of the peak latency
across BOLD responses with differing peak magnitudes.
Time t = 0 s on the x axis corresponds to the point of tran-
sition. As is apparent from the event-averaged response,
the peak of the BOLD response in the VLPFC and PTC
occurred earlier than that of the PPC and DLPFC, and
the latter had comparable peak latencies. These observa-
tions demonstrate that the peak response of the ventral
network areas precedes that of the dorsal network areas
during the segmentation of movement transitions.
While these analyses provided clear evidence for la-
tency differences in the peaks of the BOLD responses
between the ventral and dorsal networks, a precise

Neuron
Neural Dynamics of Event Segmentation in Music
quantification of the latencies using the Henson et al.
(2002) approach is not possible due to high estimation
errors in the derivative to canonical ratio. In order to pro-
vide a means of quantifying the differences in latencies
of activation between these ROIs, we attempted to com-
pute the onset latency of the BOLD response. Briefly,
the onset latency of the BOLD response is defined as the
point of inflection of the response from its baseline value;
it may be used as a measure of the onset latencies of the
underlying neural activity (Formisano and Goebel, 2003;
Menon et al., 1998). In order to compute the onset laten-
cies, we followed the method of Sterzer and Kleinschmidt
(2007), using a Fourier model to fit the event-related BOLD
response; this method avoids a priori assumptions about
the shape of the response (for details on the calculation
of onset latencies, see Supplemental Data). The results
of this analysis (indicated in Figure 5B and Figure S1) re-
vealed that the onset of the BOLD response in the VLPFC,
in the ventral network, preceded the DLPFC, in the dorsal
network, by 2.10 ± 0.75 s (mean ± SE, p = 0.0179, T17 =
26.5, Wilcoxon signed-rank test) and the PPC, in the dor-
sal network by 1.42 ± 0.45 s (mean ± SE, p = 0.0032, T17 =
11, Wilcoxon signed-rank test). Mean onset latency of the
PTC was greater than that of the VLPFC, but less than that
Figure 3. Latency Analysis Reveals Earlier Activity in the Ven-
tral Compared to the Dorsal Network during the Transition
Latency analysis (Henson et al., 2002) of the fMRI signal revealed neg-
ative latency in the ventral network (VLPFC and PTC) relative to the ca-
nonical response, and a positive latency in the dorsal network (DLPFC
and PPC). Thus, peak activity in the ventral network occurred earlier in
the transition and that of the dorsal network occurred later in the tran-
sition. Surface rendering of left and right hemisphere responses (top
and bottom rows); coronal sections at y = +27 mm (VLPFC), �30
mm (PTC), +16 mm (DLPFC), and +49 mm (PPC) are shown in the mid-
dle row.
of the dorsal network regions (DLPFC and PPC) (Fig-
ure 5B); however, these other latency differences did not
reach significance (at the p < 0.05 level). Information flow
between networks of neurons occurs over the timescale of
several tens to hundreds of milliseconds; hence, the exact
values of the latency differences reported here may not di-
rectly represent neural latency differences between these
ROIs. However, onset latency differences provide a faithful
measure of the relative differences in latency of onset of
the underlying neural activity (Formisano and Goebel,
2003; Henson et al., 2002; Menon et al., 1998; Sterzer
and Kleinschmidt, 2007; see also control analyses in Sup-
plemental Data). In our case, these point to a clear order in
the activation of prefrontal cortical (PFC) regions during
the movement transition—the ventral network (VLPFC)
activation followed by the dorsal network (DLPFC).
Figure 4. Hemispheric and Regional Differences in Brain Ac-
tivity during the Movement Transition
(A) Right- (unshaded bars) and left- (shaded bars) hemisphere re-
sponses in the VLPFC, PTC, DLPFC, and PPC during event segmen-
tation. All four regions showed significantly greater activation in the
right hemisphere (either at the p < 0.01 level [**] or the p < 0.05 level
[*]; Wilcoxon signed-rank test; error bars denote SEM across subjects).
(B) Maximum percentage signal change in the ROIs before (pre, diag-
onally hatched bars), during (bars with no hatching), and after (post,
vertically hatched bars) the point of transition. Plotting the maximum
percentage signal change (MPSC) in the ROIs across the transition
revealed that the VLPFC had significantly higher BOLD signal before
and during versus after the point of transition. The DLPFC and PPC re-
vealed the opposite trend, with greater signal during and after versus
before the point of transition (either at the p < 0.01 level [**] or the
p < 0.05 level [*]; error bars denote SEM across subjects).
Neuron 55, 521–532, August 2, 2007 ª2007 Elsevier Inc. 525

Neuron
Neural Dynamics of Event Segmentation in Music
Granger Causality Analysis of Ventral and Dorsal
Brain Regions
Finally, we hypothesized that if the observed pattern of la-
tency differences truly reflects the underlying dynamics of
activation, ventral regions, notably the VLPFC, may exert
causal, or directed, influences on the regions in the dorsal
network. To test this hypothesis, we used Granger causal-
ity analysis (GCA), a technique that has been successfully
used to measure directionality of signaling in cortical net-
works based on the temporal history of BOLD signal
changes (Miller and D’Esposito, 2005; Roebroeck et al.,
2005). Briefly, activity in brain region A is said to ‘‘Granger
Figure 5. Peak and Onset Latency Differences in the Ventral
and Dorsal Networks
(A) Normalized event-related BOLD responses from the VLPFC, PTC,
DLPFC, and PPC. Raw BOLD responses were normalized to their
peak value. The peak of the BOLD response in the ventral network
(VLPFC, cyan; PTC, yellow) occurred earlier than the dorsal network
(DLPFC, magenta; PPC, blue). The BOLD response is spline interpo-
lated (thick curve) for demonstration purposes. Thin lines of the
same color connecting successive points in the BOLD response are
also shown for reference. Error bars correspond to SEM across
subjects.
(B) Onset latencies of event-related responses in the VLPFC, PTC,
DLPFC, and PPC. The VLPFC showed the earliest onset, followed by
the PTC, PPC, and the DLPFC. VLPFC onset was significantly earlier
than the DLPFC (2.10 ± 0.75 s, p < 0.05) and the PPC (1.42 ± 0.45 s,
p < 0.01). Other onsets did not show significant differences. Error
bars denote SEM across subjects.
526 Neuron 55, 521–532, August 2, 2007 ª2007 Elsevier Inc.
cause’’ activity in brain region B if A’s time series proves
useful in predicting B’s future time series (Roebroeck
et al., 2005). GCA was performed on the BOLD time series
extracted from the VLPFC, PTC, PPC, and DLPFC sepa-
rately for each subject (see Experimental Procedures).
Confirming our hypothesis, GCA (across subjects) re-
vealed a predominance of connections from the ventral
to the dorsal network (Figure 6, all connections significant
at the p < 0.05 level, Wilcoxon signed-rank test). Specifi-
cally, the right VLPFC activation was causal to the activa-
tion in the PTC, DLPFC, and PPC, and the right PTC acti-
vation was causal to activation in the DLPFC, indicating
consistent causal influences from the ventral to the dorsal
network.
Converging Evidence for Distinct Ventral and Dorsal
Networks Using ICA
Converging evidence for distinct functional networks sub-
serving event segmentation in music was also obtained
from an independent component analysis (ICA) of the
data. ICA is a model-free analysis technique that incorpo-
rates no a priori hypothesis on the temporal course of the
brain response. It yields spatially independent compo-
nents, each with an associated time course (Beckmann
and Smith, 2004). Random-effects analysis of ICA compo-
nents clustered by spatio-temporal similarity across
subjects (see Supplemental Experimental Procedures) re-
vealed activation of two distinct right-lateralized functional
networks—the ventral fronto-temporal network and the
Figure 6. Granger Causality Analysis Reveals Predominance
of Causal Connections from Ventral to Dorsal Network
Granger causality analysis (GCA) of time series from individual regions
in the right ventral fronto-temporal network (red regions) and dorsal-
frontoparietal network (green regions). Arrows indicate significant
causal connections from the ventral network regions to dorsal network
regions (p < 0.05). GCA showed a predominance of causal influences
from the VLPFC and PTC to the DLPFC and PPC, indicating a causal,
directional influence from the ventral to the dorsal network. Particu-
larly, activity in the right VLPFC ‘‘Granger caused’’ all of the other
ROIs, implicating the VLPFC as the key modulator of brain dynamics
induced by the movement transition.
Neuron
Neural Dynamics of Event Segmentation in Music
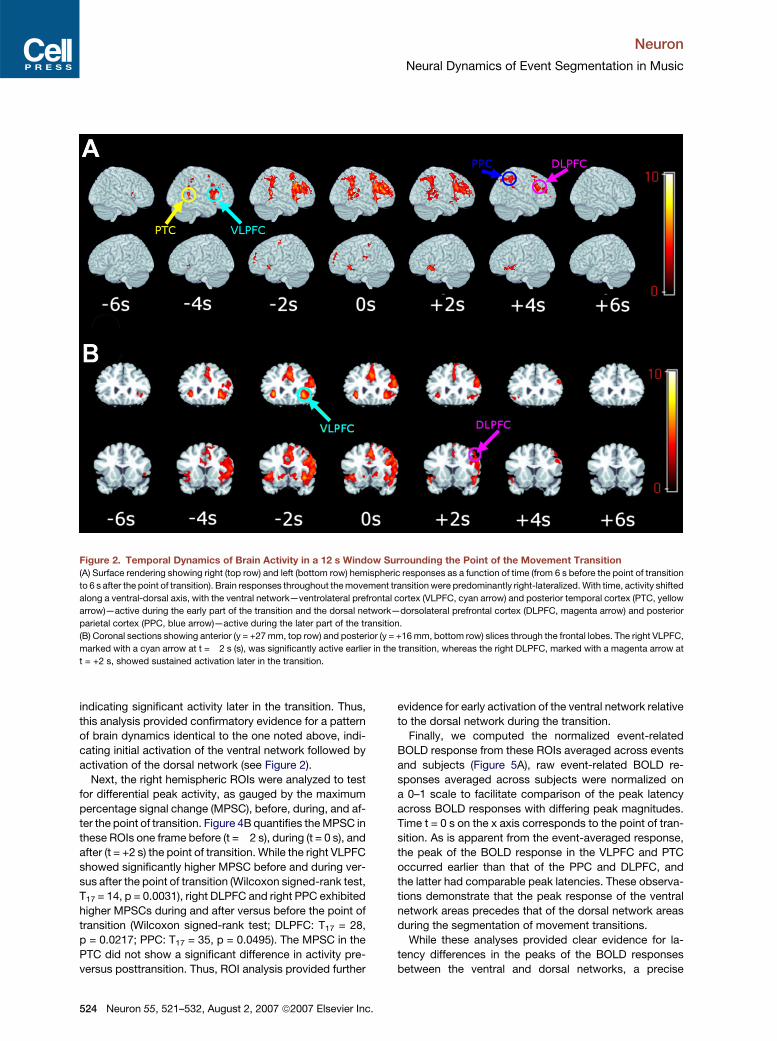
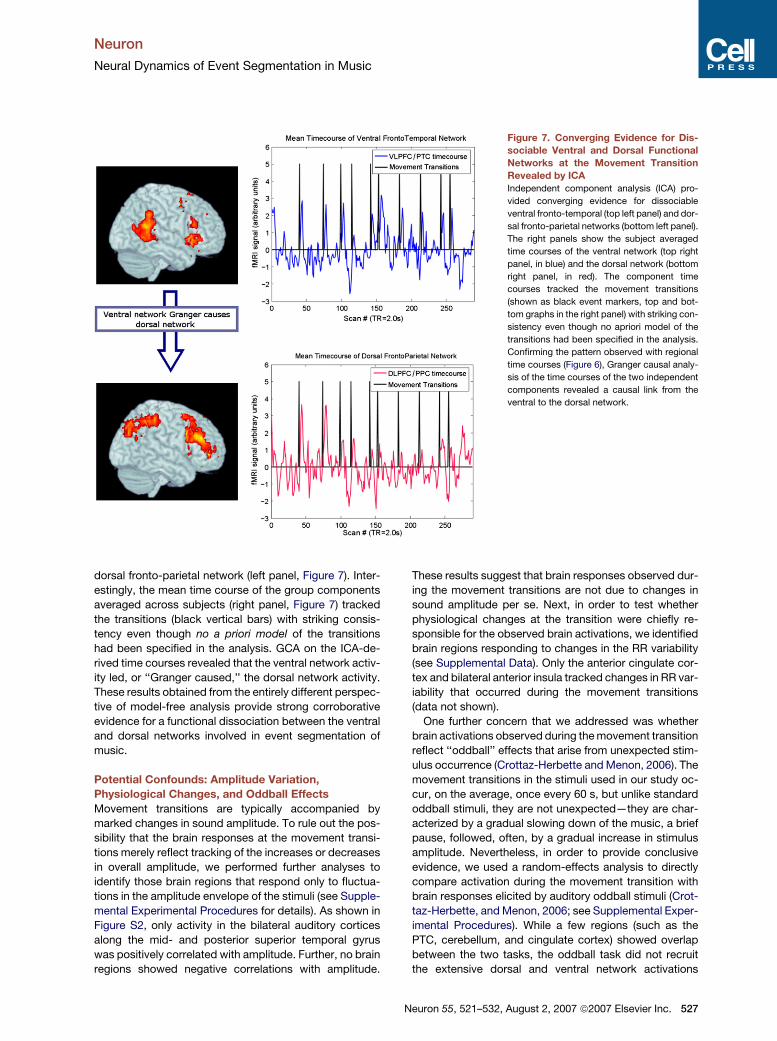
Figure 7. Converging Evidence for Dis-
sociable Ventral and Dorsal Functional
Networks at the Movement Transition
Revealed by ICA
Independent component analysis (ICA) pro-
vided converging evidence for dissociable
ventral fronto-temporal (top left panel) and dor-
sal fronto-parietal networks (bottom left panel).
The right panels show the subject averaged
time courses of the ventral network (top right
panel, in blue) and the dorsal network (bottom
right panel, in red). The component time
courses tracked the movement transitions
(shown as black event markers, top and bot-
tom graphs in the right panel) with striking con-
sistency even though no apriori model of the
transitions had been specified in the analysis.
Confirming the pattern observed with regional
time courses (Figure 6), Granger causal analy-
sis of the time courses of the two independent
components revealed a causal link from the
ventral to the dorsal network.
dorsal fronto-parietal network (left panel, Figure 7). Inter-
estingly, the mean time course of the group components
averaged across subjects (right panel, Figure 7) tracked
the transitions (black vertical bars) with striking consis-
tency even though no a priori model of the transitions
had been specified in the analysis. GCA on the ICA-de-
rived time courses revealed that the ventral network activ-
ity led, or ‘‘Granger caused,’’ the dorsal network activity.
These results obtained from the entirely different perspec-
tive of model-free analysis provide strong corroborative
evidence for a functional dissociation between the ventral
and dorsal networks involved in event segmentation of
music.
Potential Confounds: Amplitude Variation,
Physiological Changes, and Oddball Effects
Movement transitions are typically accompanied by
marked changes in sound amplitude. To rule out the pos-
sibility that the brain responses at the movement transi-
tions merely reflect tracking of the increases or decreases
in overall amplitude, we performed further analyses to
identify those brain regions that respond only to fluctua-
tions in the amplitude envelope of the stimuli (see Supple-
mental Experimental Procedures for details). As shown in
Figure S2, only activity in the bilateral auditory cortices
along the mid- and posterior superior temporal gyrus
was positively correlated with amplitude. Further, no brain
regions showed negative correlations with amplitude.
These results suggest that brain responses observed dur-
ing the movement transitions are not due to changes in
sound amplitude per se. Next, in order to test whether
physiological changes at the transition were chiefly re-
sponsible for the observed brain activations, we identified
brain regions responding to changes in the RR variability
(see Supplemental Data). Only the anterior cingulate cor-
tex and bilateral anterior insula tracked changes in RR var-
iability that occurred during the movement transitions
(data not shown).
One further concern that we addressed was whether
brain activations observed during the movement transition
reflect ‘‘oddball’’ effects that arise from unexpected stim-
ulus occurrence (Crottaz-Herbette and Menon, 2006). The
movement transitions in the stimuli used in our study oc-
cur, on the average, once every 60 s, but unlike standard
oddball stimuli, they are not unexpected—they are char-
acterized by a gradual slowing down of the music, a brief
pause, followed, often, by a gradual increase in stimulus
amplitude. Nevertheless, in order to provide conclusive
evidence, we used a random-effects analysis to directly
compare activation during the movement transition with
brain responses elicited by auditory oddball stimuli (Crot-
taz-Herbette, and Menon, 2006; see Supplemental Exper-
imental Procedures). While a few regions (such as the
PTC, cerebellum, and cingulate cortex) showed overlap
between the two tasks, the oddball task did not recruit
the extensive dorsal and ventral network activations
Neuron 55, 521–532, August 2, 2007 ª2007 Elsevier Inc. 527

Neuron
Neural Dynamics of Event Segmentation in Music
observed during passive segmentation in the present
study (Figure S3). Furthermore, brain responses to move-
ment transitions, contrasted with oddball responses, re-
vealed significant responses in all the regions identified
originally (Figure S3, bottom panel, and Table S4). These
findings indicate that brain processes engaged during
the perception of the movement transitions are distinct
from those elicited by the oddball task.
One potential confound while performing chronometric
analysis on the BOLD response is the possibility that the
observed effects reflect vascular rather than neural dy-
namics. As seen in Figure 3, only the right hemispheric re-
gions showed significant differences in the patterns of
early versus late latency of responses when the data
were analyzed using the voxel-based approach of Henson
et al. (2002); no such effects were detected in the corre-
sponding left hemispheric regions. This suggests that
the latency effects that we observed were neural, rather
than vascular, in origin. In order to further validate the rel-
atively novel onset latency and Granger causal analyses
used in our study, we carried out the following additional
control studies: (1) we used an entirely different approach
for the estimation of onset latencies (Menon et al., 1998);
we expected to observe a pattern of results similar to
ones shown in Figure 5B; (2) we used a different fMRI da-
taset (Steinberg working memory paradigm, Chang et al.,
2007) wherein the visual encoding phase precedes the
motor response phase; we predicted that our methods
of onset latency should discover earlier onset in the visual
areas compared to the motor areas; and (3) we performed
GCA on the Steinberg data set where we expected to see
a causal influence from the visual cortex to the motor cor-
tex. Our findings exactly matched our predictions in
each case (Figures S5 and S6), thereby improving confi-
dence in our findings and providing support for the view
that the effects reported reflect underlying neural, rather
than vascular, processes (for details see Supplemental
Data).
DISCUSSION
In this study, we attempted to characterize the neural dy-
namics of event segmentation in music. We analyzed
brain responses during the parsing of movement transi-
tions, event boundaries at one of the highest levels of
structural hierarchy in music. We used a passive listening
task that maintained the ecological validity of the listening
experience. Moreover, despite the passive nature of the
task, several lines of evidence from our study suggest
that movement transitions, rather than being merely
perceived as pauses, are an important component of the
natural music listening experience (see Supplemental Dis-
cussion for a more detailed perspective on these issues).
Importantly, our study provides converging evidence,
from both model-dependent and model-free analyses of
event-related responses, for dynamic brain changes
underlying musical event segmentation during natural lis-
tening conditions.
528 Neuron 55, 521–532, August 2, 2007 ª2007 Elsevier Inc.
Auditory Scene Analysis under Natural Listening
Conditions
Our finding of distinct dorsal and ventral networks in event
segmentation represents an important step toward under-
standing auditory scene analysis under natural listening
conditions and significantly expands on our current
knowledge of event segmentation processes in the brain.
Event boundaries in our study are well defined from a mu-
sic-theoretical perspective and were consistently identi-
fied at both the behavioral and psychophysiological levels.
We found a pattern of brain responses that were maximal
at the event boundaries when, paradoxically, no stimulus
was present. Our analysis of the temporal dynamics
across the movement transition uncovered two distinct
functional networks that are triggered at different times
during the transition: a ventral fronto-temporal network
(VLPFC and PTC) that onsets earlier in the transition, fol-
lowed in time by a dorsal fronto-parietal network (DLPFC
and PPC). Both of these networks are significantly right-
lateralized, as shown in Figure 2A. Although the right hemi-
sphere has been implicated in music processing (Brown
et al., 2004; Zatorre et al., 1993), its precise role in music
perception remains poorly understood, and lateralization
of activation for music processing has never been
adequately tested. Our findings suggest that the right hemi-
sphere plays a dominant role in the perceptual segmenta-
tion of salient, coarse-grained event boundaries in music.
Our findings of segregated ventral and dorsal functional
networks are consistent with recent anatomical studies of
brain connectivity in both monkeys and humans. Anatom-
ical tracer studies in nonhuman primates have identified
a ‘‘what’’ pathway connecting the rostral auditory belt
areas (anterolateral or AL region) to the ventral prefrontal
frontal cortex (areas 12 and 45) and a ‘‘where’’ pathway
that connects the caudal belt areas (caudolateral or CL re-
gion) to the dorsolateral prefrontal cortex (areas 46 and 8a)
(Romanski et al., 1999; Kaas and Hackett, 2000). Similarly,
diffusion tensor tractography in humans has revealed
white matter connections between the PTC (BA 21/22
and 37) and the VLPFC (BA 47 and 45) (Barrick et al.,
2007). These observations suggest that direct anatomical
connections may mediate the tight functional coupling
observed in the ventral and dorsal networks and further
suggest that such tight coupling may impose hierarchical
constraints on information processing in these networks
(Mesulam, 1990). However, the dorsal-ventral networks
identified in our study differ from the ‘‘classic’’ auditory
what-where pathways in two important respects, one
structural and the other functional. While there is some
overlap between the what-where pathways and our dor-
sal-ventral networks, the two are not identical: whereas
the prefrontal cortex nodes in the dorsal-ventral networks
correspond to the ventral and dorsal prefrontal cortex no-
des of the what-where pathway, there is little correspon-
dence between the two in PTC and the PPC. Functionally,
both the dorsal and ventral networks become active
during event segmentation, and, therefore, they cannot
be conflated with the putative what-where pathways.
Neuron
Neural Dynamics of Event Segmentation in Music
Rather, the dorsal-ventral networks show striking overlap
with the brain regions identified during visuo-spatial atten-
tion tasks (Corbetta and Shulman, 2002).
The Role of the Ventral and Dorsal Networks
in Event Segmentation
Prediction and anticipation are truly at the heart of the mu-
sical experience. Even nonmusicians are actively en-
gaged, at least subconsciously, in tracking the ongoing
development of a musical piece and forming predictions
about what will come next. Typically in music, when some-
thing will come next is known, due to music’s underlying
pulse or rhythm (what musicians call the ‘‘tactus’’), but
what is less known is what will occur next. There is an im-
portant link between such predictive processes and the
formation of event boundaries: in music, the VLPFC has
been consistently implicated in the detection of violations
in musical expectancies or predictions (such as violations
in chord and harmonic expectancies) even in musically
untrained listeners (Koelsch et al., 2002; Maess et al.,
2001; Tillmann et al., 2006). Extant literature supports
the idea that the ventral network detects a mismatch be-
tween ongoing expectation and sensory events (Macaluso
et al., 2002; Astafiev et al., 2006). The mismatch between
ongoing expectation and sensory input may be one factor
that induces event segmentation: event boundaries are
typically perceived when transient errors in predictions
arise (Zacks et al., 2007). For instance, when a harmonic
context is followed by an unrelated/unexpected chord
(Maess et al., 2001), the deviant chord needs to be
grouped into a separate entity from the preceding context,
thereby requiring the formation of a segmentation bound-
ary at the point of violation of harmonic expectation. Thus,
predictive processes and violations in expectancies rep-
resent two important ways in which segmentation bound-
aries are constructed in music. Our findings suggest that
the ventral network plays an important role in this segmen-
tation process.
On the other hand, a wide range of neuroimaging and
neurophysiological studies have demonstrated coactiva-
tion of the DLPFC and PPC in the dorsal network during
top-down signaling for feature or object attention (for a re-
view, see Corbetta and Shulman, 2002) and during manip-
ulation/monitoring of information in working memory
(Fletcher and Henson, 2001; Petrides, 2005). Our results
suggest that these regions form a tightly coupled network
that plays an important role in directing and maintaining
attention during the movement transitions and in the per-
ceptual updating that ensues. The DLPFC (BA 9) has been
specifically implicated in such perceptual updating of
events in working memory even in the absence of behav-
ioral responses and explicit cognitive control (Wager and
Smith, 2003).
Converging Evidence for Dissociable Ventral
and Dorsal Networks
Although several other studies have reported dissociable
activations in dorsal and ventral brain regions (Macaluso
et al., 2002; Shulman et al., 2003; Burgund et al., 2005; As-
tafiev et al., 2006; Dosenbach et al., 2006), our finding
indicate that these regions are tightly coupled and that
they form distinct, statistically independent networks.
Evidence for the presence of two independent networks
comes from ICA analysis of the four-dimensional fMRI
data. This analysis does not make any assumptions about
the time course of event-related responses and instead
attempts to derive statistically independent spatial pat-
terns of brain responses (Beckmann and Smith, 2004).
Our analysis clearly showed that the ventral and dorsal
regions identified in the event-related analysis above seg-
regate into two independent components whose time
courses accurately track the transitions. One component
includes the VLPFC and the PTC, and the other includes
the DLPFC and the PPC. GCA on the ICA components
also revealed a statistically significant causal link directed
from the ventral network to the dorsal network across sub-
jects, indicating that these networks are tightly coupled
during event segmentation.
Based on a synthesis of findings from a wide range of an-
imal electrophysiology and human imaging experiments,
Corbetta and Shulman (2002) have hypothesized segrega-
tion of similar ventral fronto-temporo-parietal and dorsal
fronto-parietal regions in visuo-spatial attention. They pro-
pose that right-lateralized ventral fronto-temporo-parietal
regions are involved in the detection of salient stimuli,
and bilateral dorsal fronto-parietal regions are involved in
attentional signaling for feature or object detection in visual
stimuli. A comparison of their dorsal and ventral regions
(Figure 7a in Corbetta and Shulman, 2002) with those
discovered by our analysis (Figure 7 of the present article)
reveals a remarkable overlap in the foci of activation. Direct
experimental evidence for the recruitment of these distinct
regions as functionally coupled and causally linked
networks in perceptual tasks has, however, thus far been
lacking. Our findings not only provide fresh support for
this hypothesis but also characterize the dynamical
relations between ventral and dorsal networks in the
processing of ecologically relevant stimuli. Further, our
findings indicate that the ventral network is right-lateralized
not only for orienting attention to visual stimuli but also dur-
ing segmentation of salient auditory events. These results
suggest that neither of these networks is specific to visual
processing and may, in fact, correspond to polymodal
association areas involved the processing of salient,
temporally structured sensory stimuli.
In order to further examine the interactions of these net-
works, we used Granger causality analysis on fMRI time
series extracted from four dorsal and ventral regions (Fig-
ure 6). Unlike models of effective connectivity that de-
scribe the strength of interaction between cortical regions
(Friston, 1994), GCA provides a robust way to assess the
directionality of causal interactions (Seth, 2005; Roe-
broeck et al., 2005; Lungarella et al., 2007). ROI-based
GCA revealed that ventral network activity ‘‘Granger
caused’’ activity in the dorsal network regions; specifi-
cally, the VLPFC Granger-caused responses in all of the
Neuron 55, 521–532, August 2, 2007 ª2007 Elsevier Inc. 529
Neuron
Neural Dynamics of Event Segmentation in Music
other ROIs, thereby implicating the VLPFC as a key mod-
ulator of the brain dynamics that occur during the move-
ment transition. These findings provide evidence for
a critical and causal role of the VLPFC in detecting and up-
dating brain responses to event boundaries.
A Putative Model for Event Segmentation
of Ecologically Valid Stimuli
Synthesizing our results with previous observations from
the literature (Corbetta and Shulman, 2002; Levitin and
Menon, 2003), it is possible to construct a tentative, yet in-
formative picture of information processing involving tem-
porally structured, ecologically valid stimuli in the brain:
the ventral fronto-temporal network appears to be in-
volved in the detection of salient events based on the sen-
sory features of the stimulus stream—this network essen-
tially signals the occurrence of a salient event boundary in
the stimulus. The dorsal fronto-parietal network then turns
the spotlight of attention to the event boundary and, upon
commencement of the next event, presumably performs
a perceptual update of the transition in working memory.
Causal connections from the ventral fronto-temporal net-
work to the dorsal fronto-parietal network indicate that the
saliency detection network could indeed act as a ‘‘circuit
breaker’’ for the dorsal network, as hypothesized by Cor-
betta and Shulman (2002). Thus, the ventral network di-
rects attention to salient event boundaries during segmen-
tation of the sensory stream, thereby aiding the detection
of objects or features in the sensory stream. In our study,
these dynamic changes reflect the brain’s evolving re-
sponses to different phases of event segmentation during
the movement transition characterized by the termination
of one movement, a brief pause, followed by the initiation
of a new movement and the perceptual updating that
ensues.
Future Directions
Future work should further explore auditory event segmen-
tation using stimuli that are carefully manipulated to retain
ecological relevance, while at the same time dissociating
component processes such as saliency detection, direc-
tion of attention, and perceptual updating in working mem-
ory. Further studies are also needed to understand how the
ventral and dorsal networks identified here are placed rel-
ative to the putative ‘‘what’’ versus ‘‘where’’ pathways that
are thought to play an important role in auditory processing
(Arnott et al., 2004; Zatorre et al., 2002). Our study has
addressed the question of event segmentation at one im-
portant level of the hierarchy of event boundaries: at the
level of the movement transition. Further studies are also
needed to examine the dynamics of event segmentation
at finer-grained event boundaries in the musical hierarchy,
such as phrase boundaries. However, unlike the move-
ment transitions studied here, such boundaries are likely
to be less salient, more subjective, and not uniformly
detected by musically naive listeners, as even musically
trained listeners have difficulty in clearly perceiving these
finer-grained transitions (Knosche et al., 2005). Moreover,
530 Neuron 55, 521–532, August 2, 2007 ª2007 Elsevier Inc.
the dynamics of phrase segmentation, for example, occurs
much more rapidly and are unlikely to be resolved with the
temporal resolution of fMRI alone. A goal for the near future
is to combine the EEG and fMRI methods to elucidate the
fast spatio-temporal dynamics underlying event segmen-
tation of fine-scale event boundaries. Investigation of the
hierarchical temporal and spatial organization of auditory
information processing in terms of phase resetting of intrin-
sic brain rhythms across the frequency spectrum from
slow to fast oscillations (Lakatos et al., 2007, 2005; Canolty
et al., 2006) remains a significant challenge.
EXPERIMENTAL PROCEDURES
Participants and Stimuli
Eighteen right-handed participants (eight females), ages ranging from
19 to 27 years, with little or no musical training (as in Maess et al., 2001)
participated in the experiment. The stimuli consisted of digitized sound
files (22,050 Hz sampling rate, 16 bit mono) comprising the eight sym-
phonies of English late-baroque period composer William Boyce.
These symphonies were chosen because they are relatively short
and comprise several well-defined movements. The eight symphonies
were divided up into two runs of four symphonies each, each run last-
ing about 9 min. The symphonies contain 20 movement transitions
(events of interest here), which provided a sufficient number of events
for an event-related fMRI analysis. Participants were instructed to
passively listen to the musical stimuli. The task was programmed
with E-Prime (PSTNET, Pittsburgh, PA; www.pstnet.com), and stimuli
were presented binaurally over noise-reducing headphones using
a custom-built magnet-compatible system at a sound level comfort-
able to the participants.
Event Structure of the Movement Transitions
We find it relevant to mention here a subtle distinction in terminology
used in the analyses. We use the term ‘‘point of transition’’ to refer to
the scan frame immediately following the offset of the preceding move-
ment (a point in time); typically, this point corresponds to a brief period
of silence between the movements. In Figure 1B, the point of transition
is represented by the dark vertical line in the spectrogram at t = 0 s. All
of the figures (Figure 1B, Figure 2, Figure 4B, and Figure 5A) are plotted
with the point of transition corresponding to zero time (t = 0). On the
other hand, unqualified use of the word ‘‘transition’’ refers to an ex-
tended (approximately 10 s wide) time window surrounding the point
of transition. For instance, Figure 1B shows the spectrogram of the
stimulus plotted in a 10 s window surrounding a representative point
of transition (movement transition); this spectrogram corresponds to
the transition heard in the audio track of Movie S1.
fMRI Data Acquisition
fMRI acquisition followed a procedure similar to that described in Lev-
itin and Menon (2003), and details are provided in the Supplemental
Data.
fMRI Data Analysis
fMRI data were preprocessed using SPM2 (http://www.fil.ion.ucl.ac.
uk/spm). Functional volumes were corrected for movement-related ef-
fects (Friston et al., 1996), spatially normalized to stereotaxic Talairach
coordinates, resampled every 2 mm using sinc interpolation, and
smoothed with a 4 mm Gaussian kernel to reduce spatial noise. One
subject was excluded from the fMRI analysis due to considerable arti-
facts in the data. Statistical analysis was performed using the general
linear model (GLM) and the theory of Gaussian random fields as imple-
mented in SPM2. A within-subjects procedure was used to model all
the effects of interest for each subject. A regressor for modeling the ef-
fects of interest was created by convolving the hemodynamic
Neuron
Neural Dynamics of Event Segmentation in Music
response function with an impulse function that peaked at each move-
ment transition. Confounding effects of fluctuations in global mean
were removed by proportional scaling where, for each time point,
each voxel was scaled by the global mean at that time point. Although
global scaling is not necessary for most fMRI studies, in the present
case it is important to incorporate this additional step because we
are interested in event-related brain responses over and beyond global
brain responses to the constant auditory stream (Macey et al., 2004).
Low-frequency noise was removed with a high-pass filter (0.5 cy-
cles/min) applied to the fMRI time series at each voxel. Effects of inter-
est for each subject were then defined with the relevant contrasts of
the parameter estimates. Group analysis was performed using a ran-
dom-effects model that incorporated a two-stage hierarchical proce-
dure. In the first stage, contrast images for each subject and each ef-
fect of interest were generated as described above. In the second
stage, these contrast images were analyzed using a general linear
model to determine voxel-wise t statistics. Finally, the t statistics
were normalized to Z scores, and significant clusters of activation
were determined using the joint expected probability distribution of
height and extent of Z scores (Poline et al., 1997), with height (Z >
2.33; p < 0.01) and extent thresholds (p < 0.05). Maxima and all coor-
dinates are reported in MNI coordinates. Activations were overlaid on
a structural Talairach template image using MRIcro (http://www.sph.
sc.edu/comd/rorden/mricro.html).
ROI Analysis
ROI analysis was performed using the Marsbar software package
(http://marsbar.sourceforge.net). Percentage of active voxels was cal-
culated from predefined anatomical ROIs (from the AAL atlas) as the
percentage of voxels that crossed the Z = 2.33 score threshold (corre-
sponding to p < 0.01). Spherical ROIs were then defined as the set of
voxels contained in 6–10 mm spheres centered on the peaks of activa-
tion clusters obtained from the GLM analysis. ROI centers and radii
were defined as follows: VLPFC, 10 mm radius sphere centered at
[36 28 �6] mm; PTC, 10 mm sphere centered at [57 �45 9] mm;
DLPFC, 8 mm sphere centered at [45 16 45] mm; and PPC, 6 mm
sphere centered at [54 �50 50] mm. The mean time course in each
ROI was extracted by averaging the time courses of all of the voxels
(in the preprocessed data) contained in the ROI. The maximum per-
centage signal change was then calculated one frame before, during,
and one frame after the movement transition and averaged over ses-
sions for each subject (Figure 4B).
Latency Analysis
The latency of the BOLD response relative to the canonical response at
each voxel was estimated by the ratio of the derivative to canonical pa-
rameter estimates (according to Henson et al., 2002) obtained from the
original SPM analysis. The response latency map was created by
transforming the derivative to canonical ratio for each voxel with a sig-
moidal logistic function parameterized by two constants, C and D. As
this was a first-pass analysis to estimate latency responses, we chose
the values of C and D to be 1.78 and 3.10, respectively (Henson et al.,
2002). A statistical parametric map (SPM) of BOLD latency was then
created by entering the individual subject latency images (smoothed
with an 8 mm FWHM isotropic Gaussian kernel) into a second-level
random-effects analysis. Group-level latency SPMs were masked
with voxels that survived the p < 0.05 (corrected) level in the F tests
in the original SPMs. Group maps were height thresholded at p <
0.025 uncorrected (as in Henson et al., 2002), and only regions com-
prising at least ten contiguous voxels are reported.
Granger Causal Analysis
GCA was performed using the Causal Connectivity Analysis Toolbox
(Seth, 2005), with modifications based on the methods proposed by
Roebroeck et al. (2005). First, the mean time course from each ROI
was extracted for all subjects. This time course was then high-pass fil-
tered at 0.5 cycles per minute. GCA was performed to test for causal
influences between ROIs taken pairwise. A difference of influence
term (Fx/y � Fy/x) was used to prevent spurious causal influences
due to the low temporal resolution and hemodynamic blurring in the
fMRI signal and to eliminate redundant bidirectional connections in
the network. The order of the autoregressive model used for computa-
tion of the influence measure was set to 1, based on exploratory anal-
yses using the Bayesian information criterion (Seth, 2005). We per-
formed statistical inference on the causal connections using
bootstrap analysis: block-randomized time courses were used to gen-
erate an empirical null distribution of causal links (as in Roebroeck
et al., 2005). Finally, causal influences across subjects were entered
into a nonparametric analysis (Wilcoxon signed-rank test at the p <
0.05 level) to determine significant directions of influence between
ROIs across subjects.
Supplemental Data
The Supplemental Data for this article can be found online at http://
www.neuron.org/cgi/content/full/55/3/521/DC1/.
ACKNOWLEDGMENTS
We thank Catherine Chang for assistance with ICA analysis of the fMRI
data; Tony Lien for assistance with analysis of the physiological data;
and Jason Hom and Anjali Bhatara for helping with data collection. This
research was supported by a Stanford Graduate Fellowship to D.S., by
grants from the Natural Sciences and Engineering Research Council of
Canada to D.J.L., the National Science Foundation (BCS-0449927) to
V.M. and D.J.L., the Ben and A. Jess Shenson Fund to J.B., and the
National Institutes of Health (NIH-HD047520) to V.M.
Received: December 21, 2006
Revised: May 18, 2007
Accepted: July 2, 2007
Published: August 1, 2007
REFERENCES
Apel, W. (1969). Harvard Dictionary of Music, Second Edition (Cam-
bridge, MA: Belknap Press).
Arnott, S.R., Binns, M.A., Grady, C.L., and Alain, C. (2004). Assessing
the auditory dual-pathway model in humans. Neuroimage 1, 401–408.
Astafiev, S.V., Shulman, G.L., and Corbetta, M. (2006). Visuospatial re-
orienting signals in the human temporo-parietal junction are indepen-
dent of response selection. Eur. J. Neurosci. 2, 591–596.
Barrick, T.R., Lawes, I.N., Mackay, C.E., and Clark, C.A. (2007). White
matter pathway asymmetry underlies functional lateralization. Cereb.
Cortex 3, 591–598.
Beckmann, C.F., and Smith, S.M. (2004). Probabilistic independent
component analysis for functional magnetic resonance imaging.
IEEE Trans. Med. Imaging 2, 137–152.
Brown, S., Martinez, M.J., and Parsons, L.M. (2004). Passive music lis-
tening spontaneously engages limbic and paralimbic systems. Neuro-
report 13, 2033–2037.
Burgund, E.D., Lugar, H.M., Schlaggar, B.L., and Petersen, S.E.
(2005). Task demands modulate sustained and transient neural activity
during visual-matching tasks. Neuroimage 2, 511–519.
Canolty, R.T., Edwards, E., Dalal, S.S., Soltani, M., Nagarajan, S.S.,
Kirsch, H.E., Berger, M.S., Barbaro, N.M., and Knight, R.T. (2006).
High gamma power is phase-locked to theta oscillations in human
neocortex. Science 5793, 1626–1628.
Chang, C., Crottaz-Herbette, S., and Menon, V. (2007). Temporal dy-
namics of basal ganglia response and connectivity during verbal work-
ing memory. Neuroimage 3, 1253–1269.
Cooper, G.W., and Meyer, L.B. (1960). The Rhythmic Structure of Mu-
sic (Chicago: University of Chicago Press).
Neuron 55, 521–532, August 2, 2007 ª2007 Elsevier Inc. 531

Neuron
Neural Dynamics of Event Segmentation in Music
Corbetta, M., and Shulman, G.L. (2002). Control of goal-directed and
stimulus-driven attention in the brain. Nat. Rev. Neurosci. 3, 201–215.
Crottaz-Herbette, S., and Menon, V. (2006). Where and when the ante-
rior cingulate cortex modulates attentional response: combined fMRI
and ERP evidence. J. Cogn. Neurosci. 5, 766–780.
Dosenbach, N.U., Visscher, K.M., Palmer, E.D., Miezin, F.M., Wenger,
K.K., Kang, H.C., Burgund, E.D., Grimes, A.L., Schlaggar, B.L., and
Petersen, S.E. (2006). A core system for the implementation of task
sets. Neuron 50, 799–812.
Fletcher, P.C., and Henson, R.N. (2001). Frontal lobes and human
memory: insights from functional neuroimaging. Brain 5, 849–881.
Formisano, E., and Goebel, R. (2003). Tracking cognitive processes
with functional MRI mental chronometry. Curr. Opin. Neurobiol. 2,
174–181.
Friston, K.J. (1994). Functional and effective connectivity in neuroi-
maging: A synthesis. Hum. Brain Mapp. 2, 56–78.
Friston, K.J., Williams, S., Howard, R., Frackowiak, R.S., and Turner,
R. (1996). Movement-related effects in fMRI time-series. Magn. Reson.
Med. 3, 346–355.
Hasson, U., Nir, Y., Levy, I., Fuhrmann, G., and Malach, R. (2004). In-
tersubject synchronization of cortical activity during natural vision. Sci-
ence 5664, 1634–1640.
Henson, R.N., Price, C.J., Rugg, M.D., Turner, R., and Friston, K.J.
(2002). Detecting latency differences in event-related BOLD re-
sponses: Application to words versus nonwords and initial versus re-
peated face presentations. Neuroimage 1, 83–97.
Kaas, J.H., and Hackett, T.A. (2000). Subdivisions of auditory cortex
and processing streams in primates. Proc. Natl. Acad. Sci. USA 22,
11793–11799.
Knosche, T.R., Neuhaus, C., Haueisen, J., Alter, K., Maess, B., Witte,
O.W., and Friederici, A.D. (2005). Perception of phrase structure in mu-
sic. Hum. Brain Mapp. 4, 259–273.
Koelsch, S., Gunter, T.C., v Cramon, D.Y., Zysset, S., Lohmann, G.,
and Friederici, A.D. (2002). Bach speaks: a cortical ‘‘language-net-
work’’ serves the processing of music. Neuroimage 2, 956–966.
Lakatos, P., Shah, A.S., Knuth, K.H., Ulbert, I., Karmos, G., and
Schroeder, C.E. (2005). An oscillatory hierarchy controlling neuronal
excitability and stimulus processing in the auditory cortex. J. Neuro-
physiol. 3, 1904–1911.
Lakatos, P., Chen, C.M., O’Connell, M.N., Mills, A., and Schroeder,
C.E. (2007). Neuronal oscillations and multisensory interaction in pri-
mary auditory cortex. Neuron 2, 279–292.
Lehrdahl, F., and Jackendoff, R. (1983). A Generative Theory of Tonal
Music (Cambridge, MA: MIT Press).
Levitin, D.J., and Menon, V. (2003). Musical structure is processed in
‘‘language’’ areas of the brain: a possible role for Brodmann Area 47
in temporal coherence. Neuroimage 4, 2142–2152.
Lungarella, M., Ishiguro, K., Kuniyoshi, Y., and Otsu, N. (2007).
Methods for quantifying the causal structure of bivariate time series.
Int. J. Bifurcat. Chaos 17, 903–921.
Macaluso, E., Frith, C.D., and Driver, J. (2002). Supramodal effects of
covert spatial orienting triggered by visual or tactile events. J. Cogn.
Neurosci. 3, 389–401.
Macey, P.M., Macey, K.E., Kumar, R., and Harper, R.M. (2004). A
method for removal of global effects from fMRI time series. Neuro-
image 1, 360–366.
Maess, B., Koelsch, S., Gunter, T.C., and Friederici, A.D. (2001). Musi-
cal syntax is processed in Broca’s area: an MEG study. Nat. Neurosci.
5, 540–545.
532 Neuron 55, 521–532, August 2, 2007 ª2007 Elsevier Inc.
Menon, V., and Crottaz-Herbette, S. (2005). Combined EEG and fMRI
studies of human brain function. Int. Rev. Neurobiol. 66, 291–321.
Menon, R.S., Luknowsky, D.C., and Gati, J.S. (1998). Mental chronom-
etry using latency-resolved functional MRI. Proc. Natl. Acad. Sci. USA
18, 10902–10907.
Mesulam, M.M. (1990). Large-scale neurocognitive networks and dis-
tributed processing for attention, language, and memory. Ann. Neurol.
5, 597–613.
Miller, B.T., and D’Esposito, M. (2005). Searching for ‘‘the top’’ in top-
down control. Neuron 4, 535–538.
Petrides, M. (2005). Lateral prefrontal cortex: architectonic and func-
tional organization. Philos. Trans. R. Soc. Lond. B Biol. Sci. 1456,
781–795.
Poline, J.B., Worsley, K.J., Evans, A.C., and Friston, K.J. (1997). Com-
bining spatial extent and peak intensity to test for activations in func-
tional imaging. Neuroimage 2, 83–96.
Popescu, M., Otsuka, A., and Ioannides, A.A. (2004). Dynamics of
brain activity in motor and frontal cortical areas during music listening:
a magnetoencephalographic study. Neuroimage 4, 1622–1638.
Roebroeck, A., Formisano, E., and Goebel, R. (2005). Mapping di-
rected influence over the brain using Granger causality and fMRI. Neu-
roimage 1, 230–242.
Romanski, L.M., Tian, B., Fritz, J., Mishkin, M., Goldman-Rakic, P.S.,
and Rauschecker, J.P. (1999). Dual streams of auditory afferents target
multiple domains in the primate prefrontal cortex. Nat. Neurosci. 2,
1131–1136.
Seth, A.K. (2005). Causal connectivity of evolved neural networks dur-
ing behavior. Network 1, 35–54.
Shulman, G.L., McAvoy, M.P., Cowan, M.C., Astafiev, S.V., Tansy,
A.P., d’Avossa, G., and Corbetta, M. (2003). Quantitative analysis of at-
tention and detection signals during visual search. J. Neurophysiol. 5,
3384–3397.
Sterzer, P., and Kleinschmidt, A. (2007). A neural basis for inference in
perceptual ambiguity. Proc. Natl. Acad. Sci. USA 1, 323–328.
Tillmann, B., Koelsch, S., Escoffier, N., Bigand, E., Lalitte, P., Frieder-
ici, A.D., and von Cramon, D.Y. (2006). Cognitive priming in sung and
instrumental music: Activation of inferior frontal cortex. Neuroimage 4,
1771–1782.
Touryan, J., Felsen, G., and Dan, Y. (2005). Spatial structure of complex
cell receptive fields measured with natural images. Neuron 5, 781–791.
Trehub, S.E. (2003). The developmental origins of musicality. Nat. Neu-
rosci. 7, 669–673.
Wager, T.D., and Smith, E.E. (2003). Neuroimaging studies of working
memory: A meta-analysis. Cogn. Affect. Behav. Neurosci. 4, 255–274.
Zacks, J.M., Braver, T.S., Sheridan, M.A., Donaldson, D.I., Snyder,
A.Z., Ollinger, J.M., Buckner, R.L., and Raichle, M.E. (2001). Human
brain activity time-locked to perceptual event boundaries. Nat. Neuro-
sci. 6, 651–655.
Zacks, J.M., Speer, N.K., Swallow, K.M., Braver, T.S., and Reynolds,
J.R. (2007). Event perception: A mind-brain perspective. Psychol.
Bull. 2, 273–293.
Zatorre, R.J., Evans, A.C., and Meyer, E. (1993). Functional activation
of right temporal and occipital cortex in processing tonal melodies. J.
Acoust. Soc. Am. 93, 2364.
Zatorre, R.J., Bouffard, M., Ahad, P., and Belin, P. (2002). Where is
‘where’ in the human auditory cortex? Nat. Neurosci. 9, 905–909.