neutral process industry” martijn de graaff utrecht, 22
TRANSCRIPT
Powered by:
Electrification of the Chemical Industry
“Towards a CO2 neutral process industry”
Martijn de Graaff
Utrecht, 22 november 2016
Electrification of chemistry
22-11-2016 1

Powered by: TNO & ECN
• Accelerate innovation and
implementation of electrification
& decarbonization in chemicals.
• Initiate and facilitate collaborative
development of technology and
associated business models.
• Addresses both the indirect and
direct use of electricity within the
chemical industry, involving
stakeholders from chemicals,
energy & equipment supply.
22-11-2016 2
Powered by: TNO & ECN
22-11-2016 3
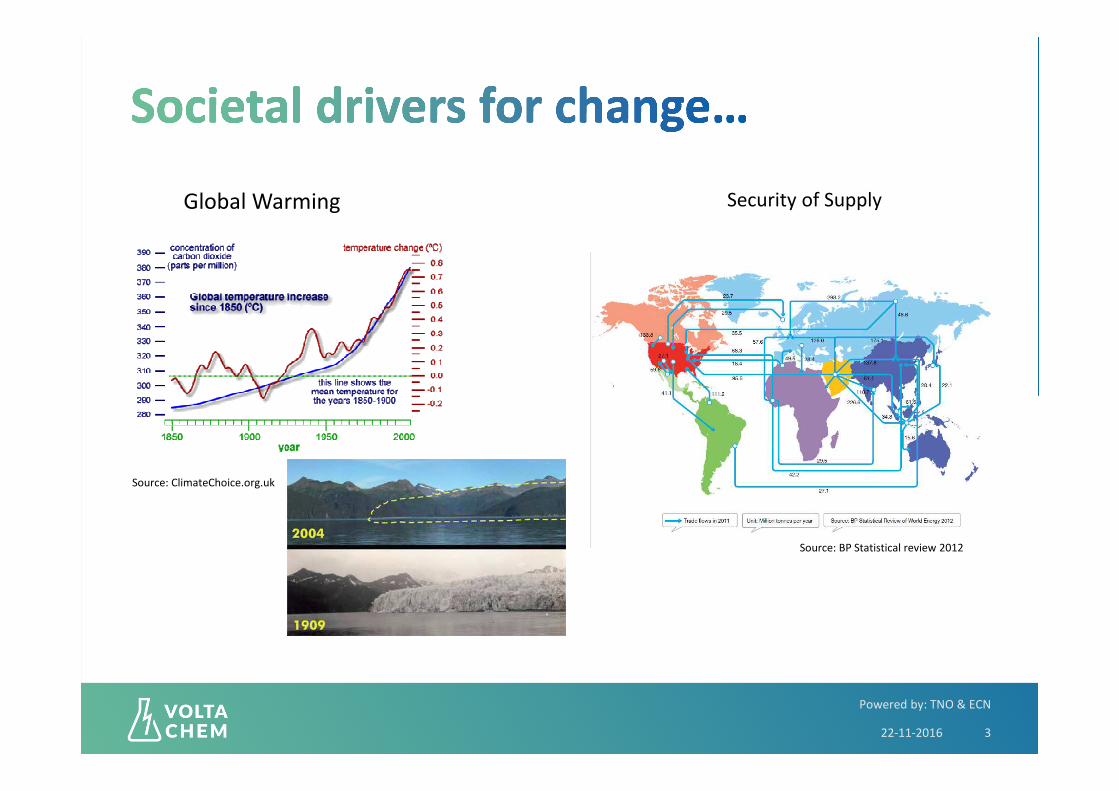
Global Warming Security of Supply
Source: BP Statistical review 2012
Source: ClimateChoice.org.uk

Powered by: TNO & ECN
• Increased global competition.
• Weak position on feedstock and energy.
• Operational costs are high.
• Geographical shifts in demand.
22-11-2016 4
From: “De Chemie in Nederland, Een voorwaardelijke toekomst”, Rabobank, 2014

Powered by: TNO & ECN
22-11-2016 5
Last year (MWh)
Powered by: TNO & ECN
22-11-2016 6
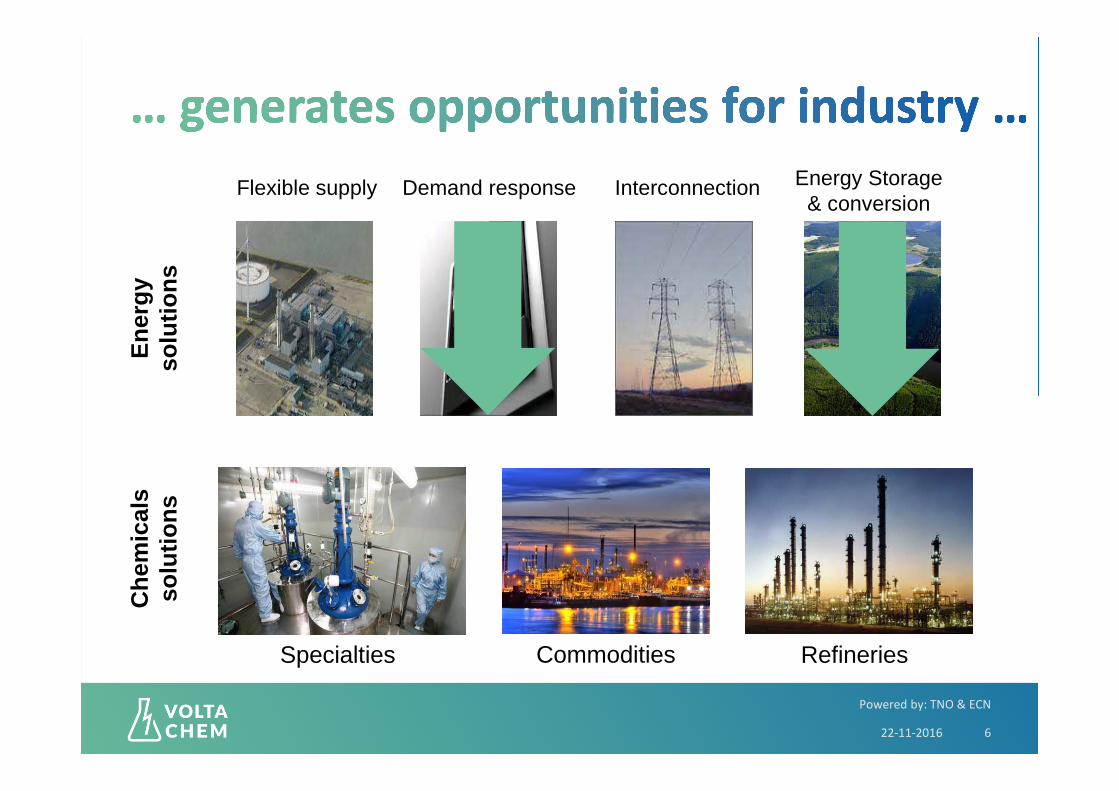
Flexible supply Demand response Interconnection Energy Storage& conversion
En
erg
yso
luti
on
sC
hem
ical
sso
luti
on
s
Specialties Commodities Refineries

Powered by: TNO & ECN
22-11-2016 7
Powered by:
Electrification of the Chemical Industry
22-11-2016 8

Powered by: TNO & ECN
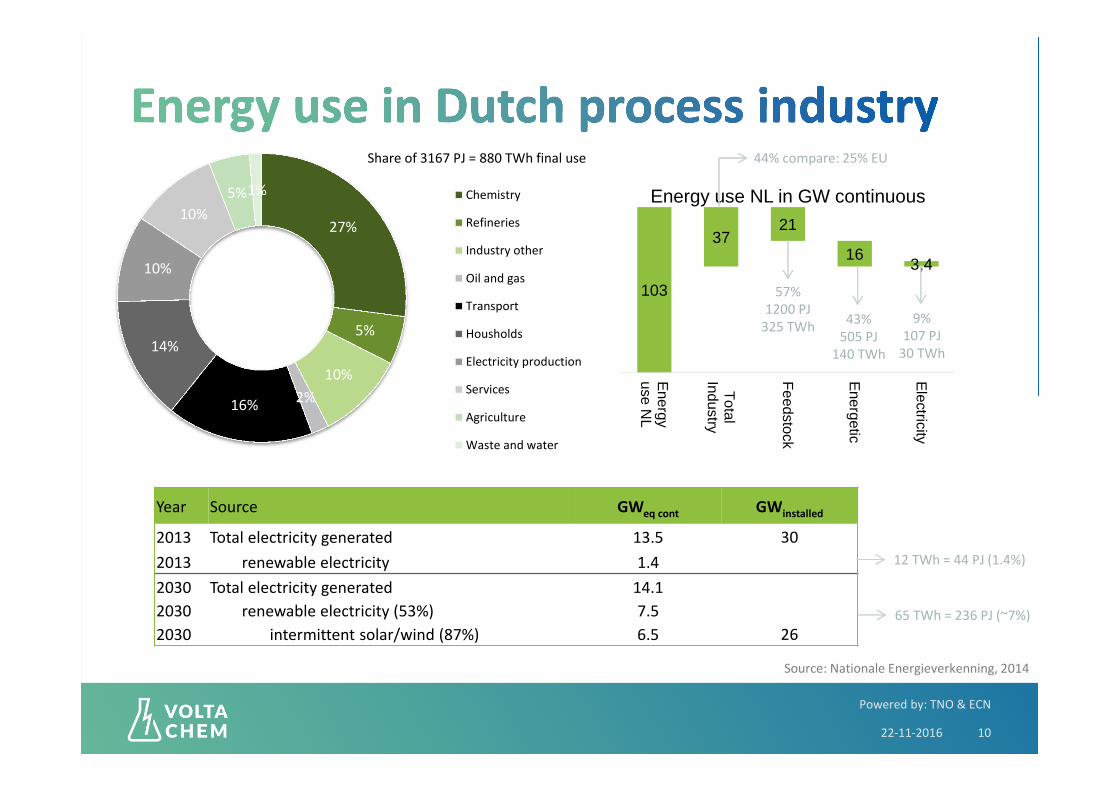
• What is the share of energy use of industry in the
Netherlands?
� 0-10% / 10-25% / 25-50%
• How does this compare to Europe?
� Lower / Equal / Higher
22-11-2016 9
Powered by: TNO & ECN
22-11-2016 10
Source: Nationale Energieverkenning, 2014
Year Source GWeq cont GWinstalled
2013 Total electricity generated 13.5 30
2013 renewable electricity 1.4
2030 Total electricity generated 14.1
2030 renewable electricity (53%) 7.5
2030 intermittent solar/wind (87%) 6.5 26
27%
5%
10%
2%16%
14%
10%
10%
5%1% Chemistry
Refineries
Industry other
Oil and gas
Transport
Housholds
Electricity production
Services
Agriculture
Waste and water
Share of 3167 PJ = 880 TWh final use
12 TWh = 44 PJ (1.4%)
65 TWh = 236 PJ (~7%)
103
3721
163,4
Energy
use NL
Total
Industry
Feedstock
Energetic
Electricity
Energy use NL in GW continuous
57%
1200 PJ
325 TWh43%
505 PJ
140 TWh
44% compare: 25% EU
9%
107 PJ
30 TWh
Powered by: TNO & ECN
• How much is the difference between prices in
electricity and natural gas for industrial use?
� Equal / 3x / 5x
22-11-2016 11

Powered by: TNO & ECN
22-11-2016 12
Average transaction prices Natural Gas (blue) & Electricity (red), industry ex BTW incl Tax
Source CBS
3x
Powered by: TNO & ECN
22-11-2016 13
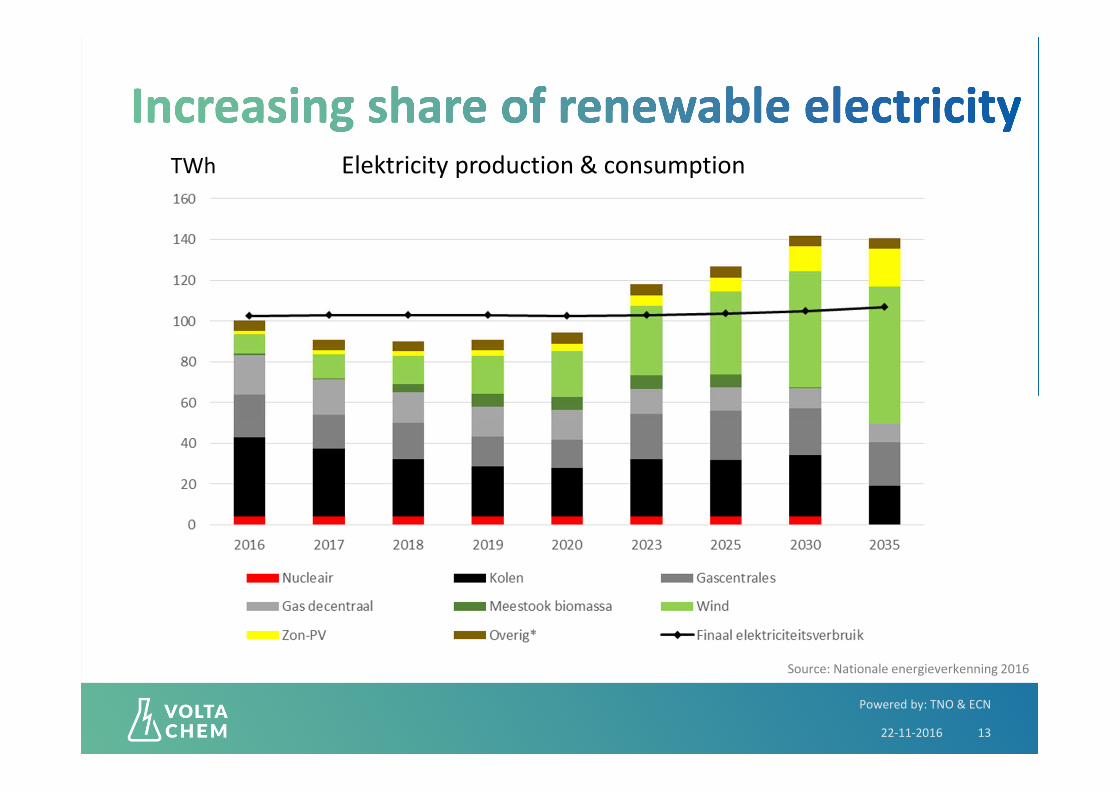
Source: Nationale energieverkenning 2016
Solar and Wind
TWh Elektricity production & consumption

Powered by: TNO & ECN
22-11-2016 14
E-price � [€/MWh]
0
50
100
150
200
250
300
350
400
450
500
-20
0
-18
0
-16
0
-14
0
-12
0
-10
0
-80
-60
-40
-20 0
20
40
60
80
10
0
12
0
14
0
16
0
18
0
20
0
# q
ua
rte
rs o
f a
n h
ou
r �
E-price unbalance in quarters of an hour per €/MWh in 2015
Example from Germany
Price duration curve 2030
Powered by: TNO & ECN
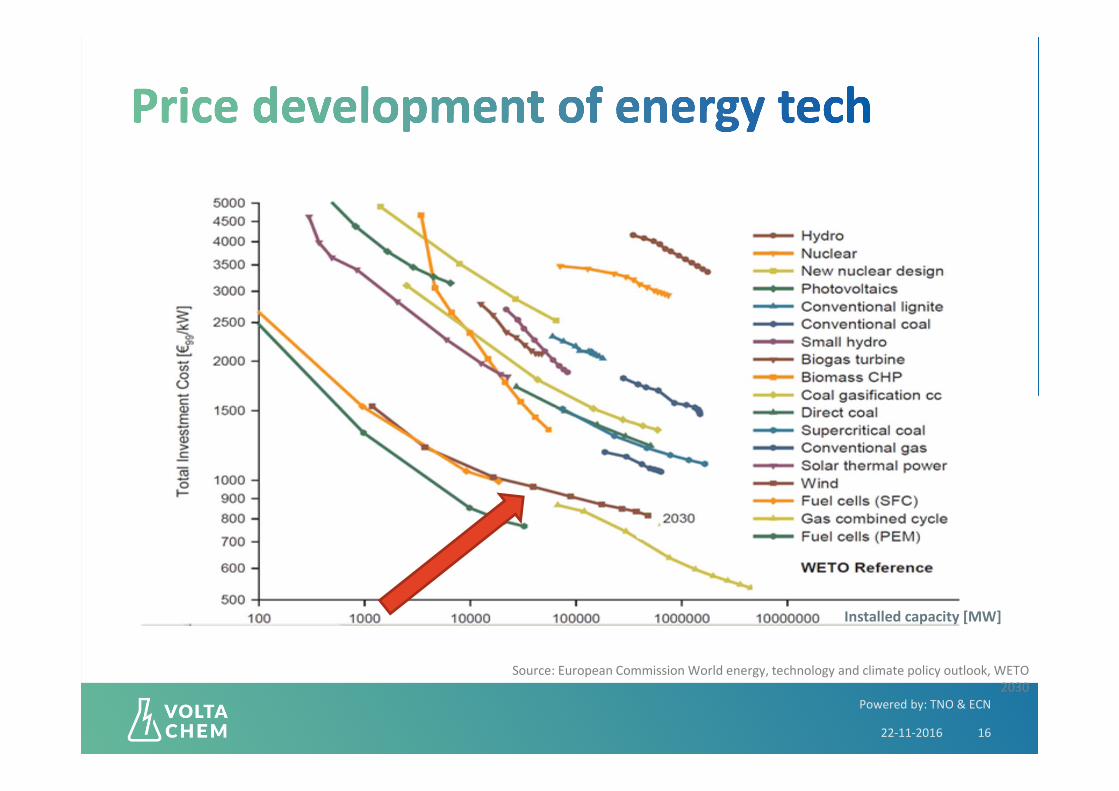
• The investment costs of solar and wind technology
decrease much more quickly than for conventional
energy.
� True / False
22-11-2016 15
Powered by: TNO & ECN
22-11-2016 16
Source: European Commission World energy, technology and climate policy outlook, WETO
2030
Installed capacity [MW]

Powered by:
Electrification of the Chemical Industry
22-11-2016 17

Powered by: TNO & ECN
22-11-2016 18
- Variability in supply ++
Su
sta
ina
bil
ity
- Fossil coal
Fossil oil
Fossil gas
Nuclear
Biomass Geothermal
Wind
Solar
Hydroelectric
TidalFuture

Powered by: TNO & ECN
Price duration curve 2030
22-11-2016 19
• Value as heat (short-term)
– Electricity replaces
conventional heating using
mostly natural gas.
• Value as intermediates (mid-term)
– Electricity is used to make
intermediates (e.g. Hydrogen,
Methanol, NH3).
• Product value (long-term)
– Electricity used directly to make
end products (chemicals and
fuels).
Value of
electricity
Value of
electricity
Value of
flexibility

Powered by: TNO & ECN
22-11-2016 20
Powered by: TNO & ECN
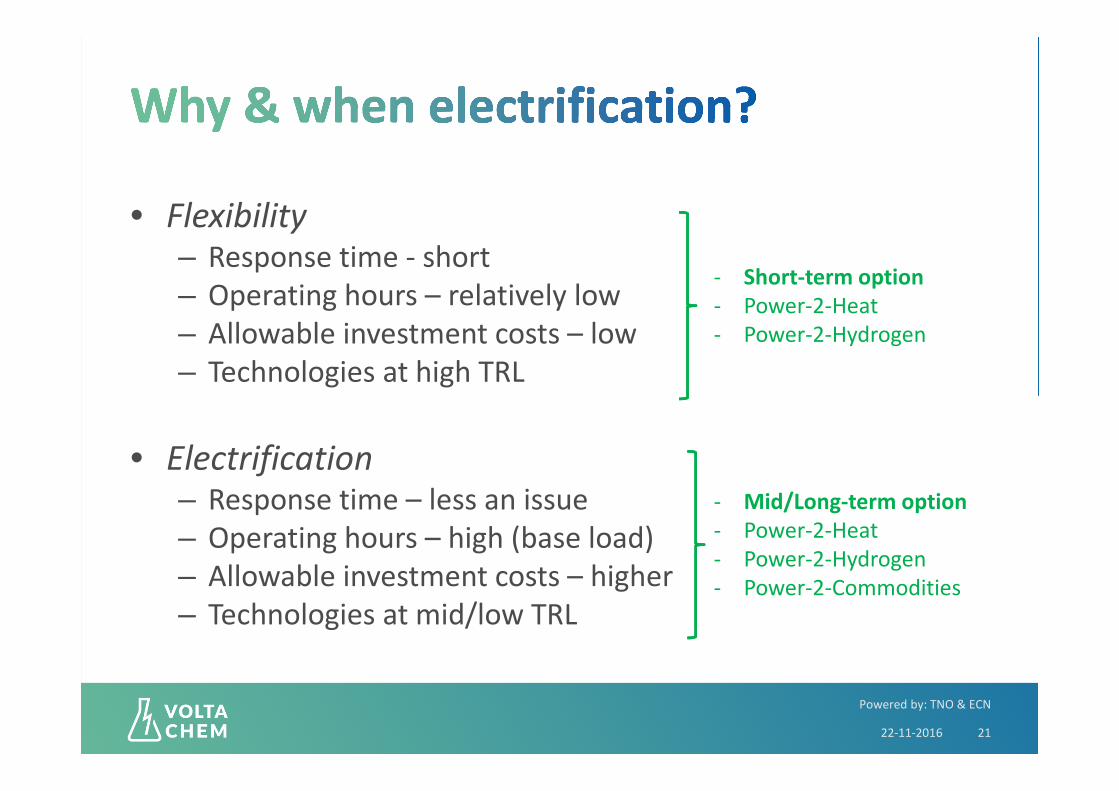
• Flexibility– Response time - short
– Operating hours – relatively low
– Allowable investment costs – low
– Technologies at high TRL
• Electrification– Response time – less an issue
– Operating hours – high (base load)
– Allowable investment costs – higher
– Technologies at mid/low TRL
22-11-2016 21
- Short-term option
- Power-2-Heat
- Power-2-Hydrogen
- Mid/Long-term option
- Power-2-Heat
- Power-2-Hydrogen
- Power-2-Commodities

Powered by: TNO & ECN
22-11-2016 22
Powered by:
Electrification of the Chemical Industry
22-11-2016 23

Powered by: TNO & ECN
22-11-2016 24
Demo plant, CRI, Reykjanes (Iceland)
Powered by: TNO & ECN
22-11-2016 25
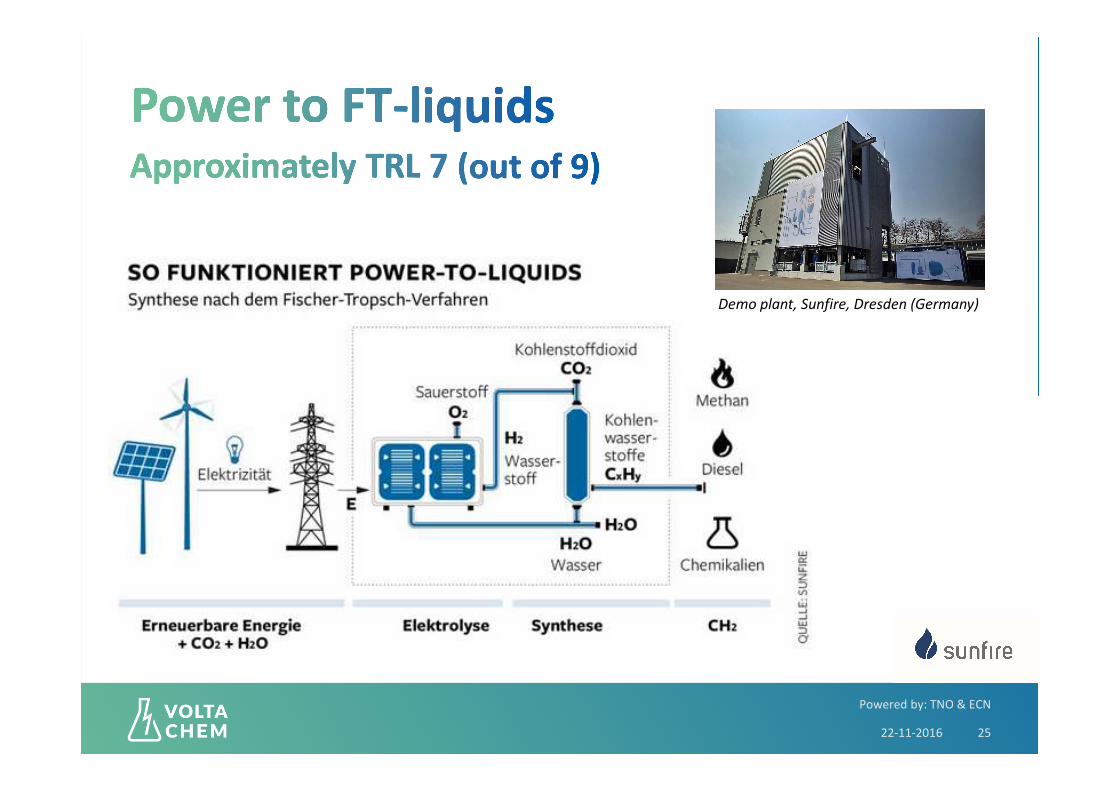
Demo plant, Sunfire, Dresden (Germany)

Powered by: TNO & ECN
22-11-2016 26
Pilot plant [2017], Siemens, Oxford (UK)
Powered by: TNO & ECN
22-11-2016 27

Powered by: TNO & ECN
22-11-2016 28

Powered by:
Electrification of the Chemical Industry
22-11-2016 29

Powered by: TNO & ECN
• Assumptions:– Current heat consumption in chemical industry 243 PJ (43% > 200◦C).
– Full implementation of Heat Pumps & residual steam upgrading by
Mechanical Vapour recompression in industry.
– Giving 50% savings for high temperature steam.
• Result:– 15-20% energy savings.
– 2 TWh / year electricity consumption.
– 6 Mt / year CO2 reduction.
– 1 GW peak electricity use.
– 4% of renewable capacity in 2030.
22-11-2016 30
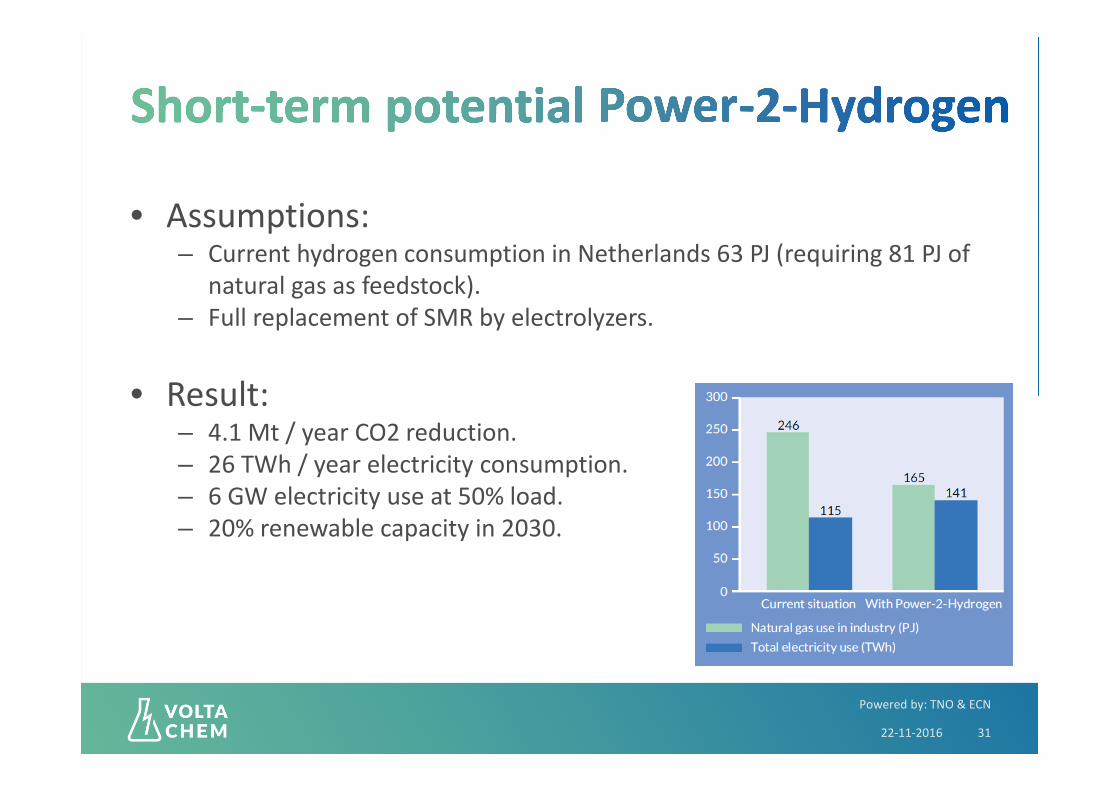
Powered by: TNO & ECN
• Assumptions:– Current hydrogen consumption in Netherlands 63 PJ (requiring 81 PJ of
natural gas as feedstock).
– Full replacement of SMR by electrolyzers.
• Result:– 4.1 Mt / year CO2 reduction.
– 26 TWh / year electricity consumption.
– 6 GW electricity use at 50% load.
– 20% renewable capacity in 2030.
22-11-2016 31

Powered by:
Electrification of the Chemical Industry
22-11-2016 32

Powered by: TNO & ECN
• Scenario “Decarbonizing the energy intensive basic materials
industry through electrification” (Lechtenbohmer, 2015)
• Looking at top-8 most energy intensive basic materials in EU:– Primary & secondary steel, cement, glass, lime, olefins (plastics),
chlorine, ammonia (fertilizers).
– Current EU emissions: 415 Mt / year CO2 (8% of total)
– Current EU energy use: 1.6 PWh/year (~8% of total)
• Assumptions:– Complete conversion to energy from sustainable electricity.
– Production levels constant.
22-11-2016 33
Powered by: TNO & ECN
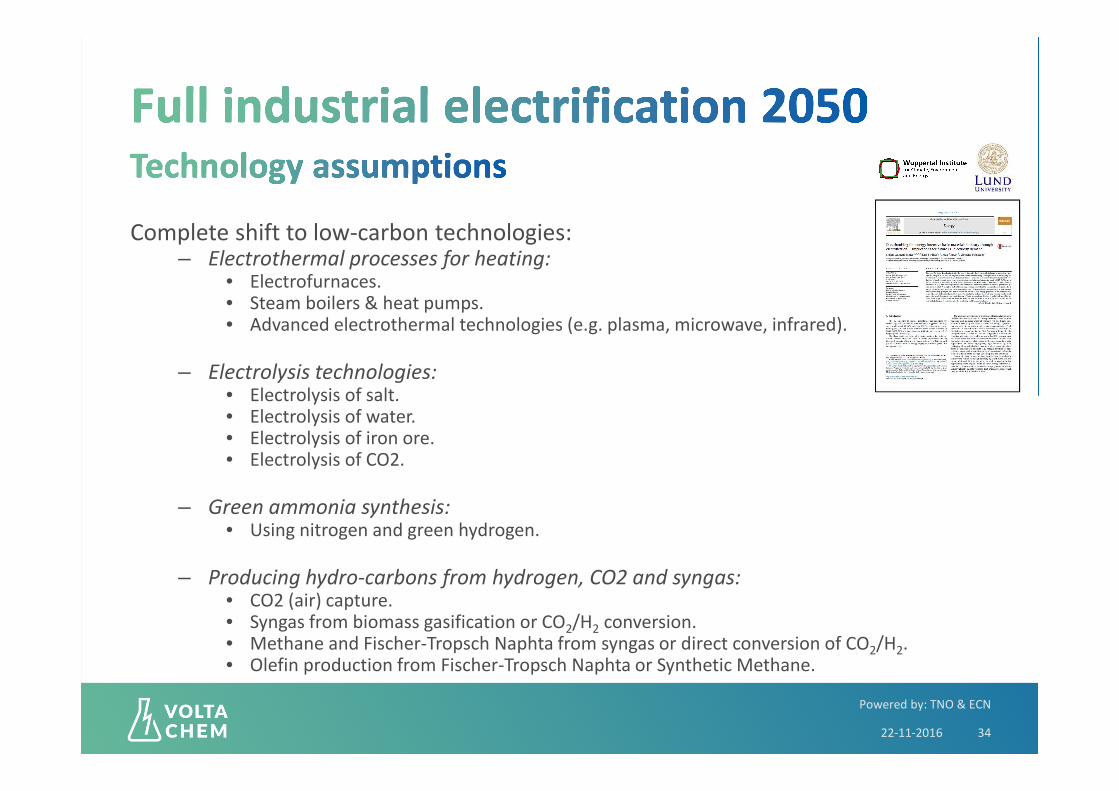
Complete shift to low-carbon technologies:– Electrothermal processes for heating:
• Electrofurnaces.• Steam boilers & heat pumps.• Advanced electrothermal technologies (e.g. plasma, microwave, infrared).
– Electrolysis technologies:• Electrolysis of salt.• Electrolysis of water.• Electrolysis of iron ore.• Electrolysis of CO2.
– Green ammonia synthesis:• Using nitrogen and green hydrogen.
– Producing hydro-carbons from hydrogen, CO2 and syngas:• CO2 (air) capture.• Syngas from biomass gasification or CO2/H2 conversion.• Methane and Fischer-Tropsch Naphta from syngas or direct conversion of CO2/H2.• Olefin production from Fischer-Tropsch Naphta or Synthetic Methane.
22-11-2016 34

Powered by: TNO & ECN
• Assumptions for The Netherlands:– Steel:
• Steel production approximately constant at 6.5 Mt/year (6% of EU).
– Minerals:• Cement and lime (ENCI) production disappear from NL.
• Glass production stays constant at 1.3 Mt/year (4% of EU).
– Chemicals• Olefin stays at 7.8 Mt/year (19% of EU).
• Chlorine stays at 0.7 Mt/year (7% of EU).
• Ammonia stays at 2.3 Mt/year (18 % of EU).
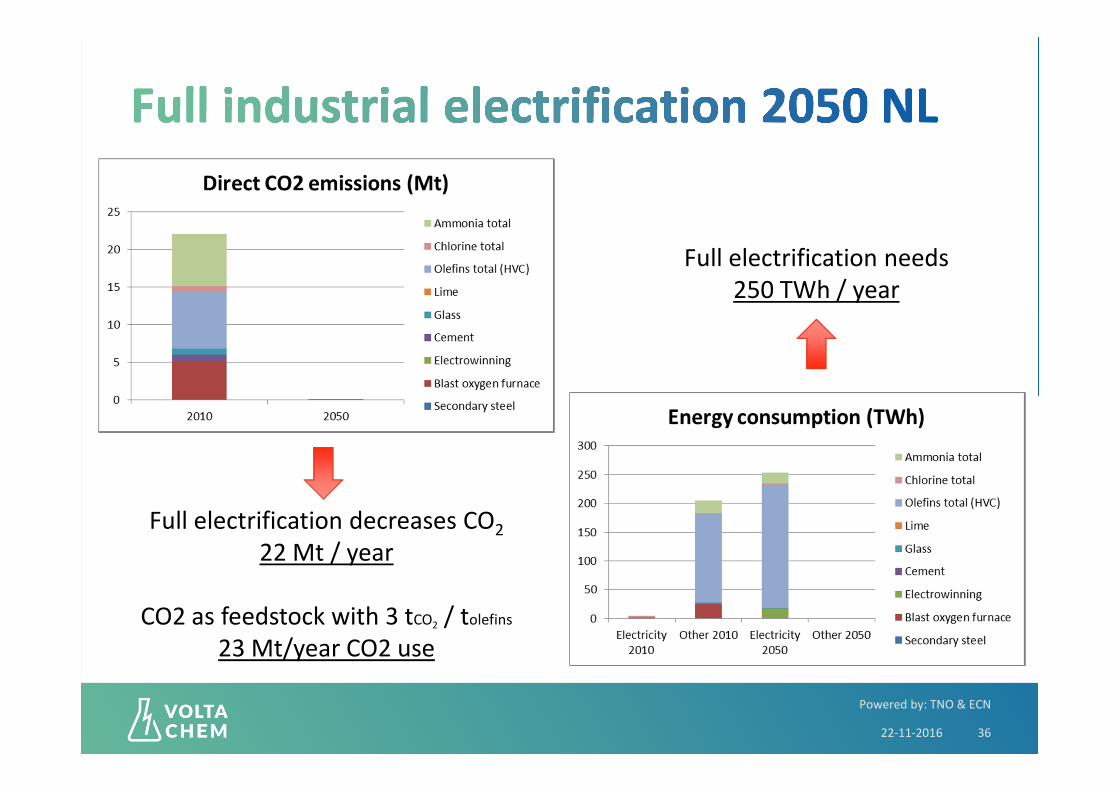
• Observations of top-8 basic materials production in NL:– CO2 emission is 22 Mt/year in 2010 = 10% of total (compare EU 8%)
– Energy use in 210 TWh/year in 2010 = 21% of total (compare EU 8%)
22-11-2016 35
Powered by: TNO & ECN
22-11-2016 36
Full electrification needs
250 TWh / year
Full electrification decreases CO2
22 Mt / year
CO2 as feedstock with 3 tCO2 / tolefins
23 Mt/year CO2 use

Powered by: TNO & ECN
22-11-2016 37
Source: FD, 22-3-2016 Source: FD, 15-4-2016
2023: 4.5 GW = 18 TWh2016: 0.9 GW = 4 TWh 2050: 250 GW = 1000 TWh

Powered by:
Electrification of the Chemical Industry
22-11-2016 38
Powered by: TNO & ECN
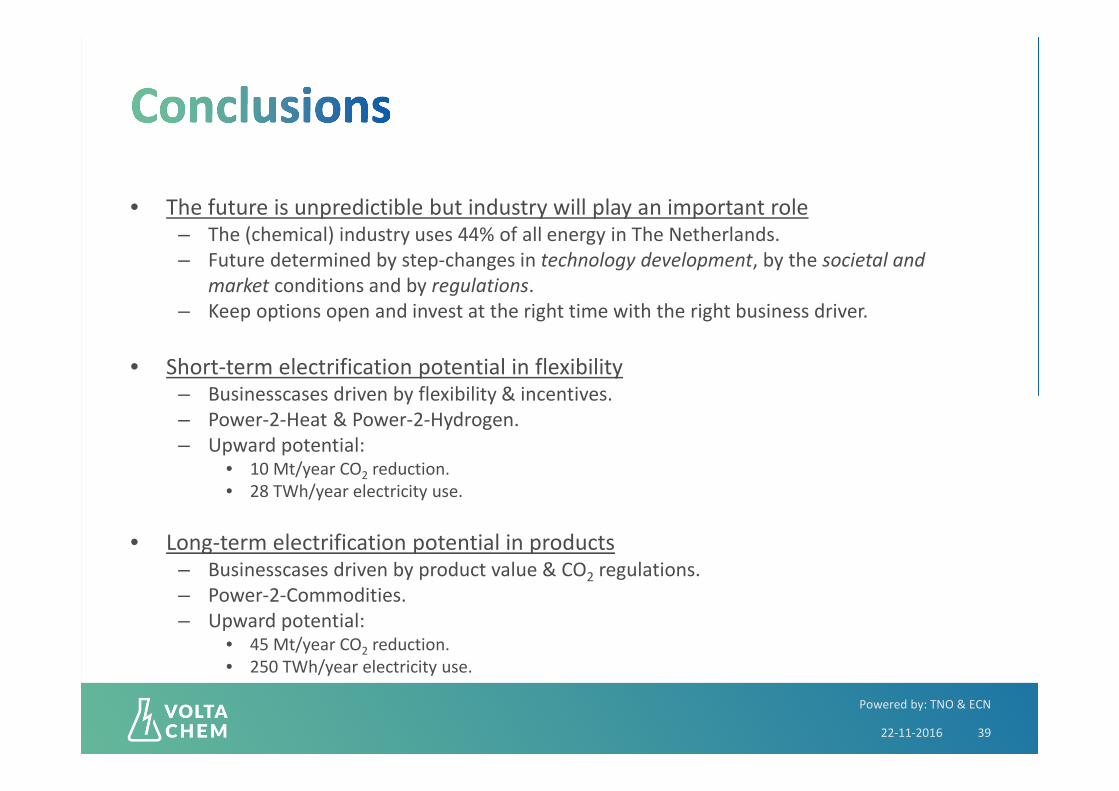
• The future is unpredictible but industry will play an important role– The (chemical) industry uses 44% of all energy in The Netherlands.
– Future determined by step-changes in technology development, by the societal and
market conditions and by regulations.
– Keep options open and invest at the right time with the right business driver.
• Short-term electrification potential in flexibility– Businesscases driven by flexibility & incentives.
– Power-2-Heat & Power-2-Hydrogen.
– Upward potential:• 10 Mt/year CO2 reduction.
• 28 TWh/year electricity use.
• Long-term electrification potential in products– Businesscases driven by product value & CO2 regulations.
– Power-2-Commodities.
– Upward potential:• 45 Mt/year CO2 reduction.
• 250 TWh/year electricity use.
22-11-2016 39

Powered by: TNO & ECN
22-11-2016 40
www.voltachem.com
Yvonne van Delft
Innovation Manager
Robert de Kler
Community Manager
Martijn de Graaff
Business development